1. Introduction
The evident success of Science Park policy in promoting clusters of high-technology industries has motivated countries from around the World to apply it in an attempt to promote regional development [
1]. The science park concept originated in the late 1950s. The idea was to provide a technical, logistical, administrative, and financial infrastructure to help young enterprises gain a toehold for their products in an increasingly competitive market [
2]. Since the 1970s, many countries have established science parks and technology districts as part of a strategy to develop new engines of growth [
3]. Previous studies have shown that the success of science parks in the USA such as Silicon Valley in California, Route 128 in Massachusetts, the Research Park Triangle in Northern Carolina, and Cambridge Science Park in the UK have been the global benchmarks that influenced other countries such as Kuwait, Brazil, Russia, Israel, India, Taiwan, and China to acknowledge the benefits derived from a science park policy [
4]. The global trend of science park policy is not only in evidence in the Western countries but a significant growth has occurred in the Asian countries, including Japan and Korea. The science parks such as Zhongguancun in Beijing, Daedeok Innopolis in Korea, and Hsinchu Science Park in Taiwan are characteristic benchmarks with a high linkage to public policy and governmental support.
Asia’s economy and China’s very rapid economic growth in recent years, has become a significant market force in the global economy. The process of industrialization in the developing countries like China is still far from complete. In order to promote technological and industrial upgrades, the development of domestic high-technology industries is necessary and the governmental policies such as science parks or industrial clusters to incubate high-technology industries have been one of the focuses [
5,
6,
7]. Beginning in the early 1990s, the Chinese government has established science parks in 53 major Chinese metropoli under its Torch (Huoju) Program, a science and technology initiative to promote technology transfer and diffusion [
8]. Although the science parks have a great potential, the energy consumption of high-technology industries and CO
2 emissions can lead to governmental concerns. A proactive strategy of industrial development is to make more effective use of resources and implement clean production, as well as to expedite upgrades of the labor-intensive section in the high-technology industrial chain. A developing country’s economic development is necessary in order to face the trend of deep internationalization, and an important way to enhance its competitiveness by enhancing the rate of economic growth-while (ideally) reducing energy consumption and CO
2 emissions. The phenomenon is very similar to the past industrial economies of Taiwan. Therefore, in recent years, many investigations have been conducted on the development of industrial clusters between Taiwan and China [
9,
10,
11,
12,
13]. As Taiwan is recognized as one of the World’s largest manufacturers of high-technology components and products, the successful practices of science parks in Taiwan are worthy of study.
In international economies and global supply chains, fragmentation is used to describe cross-border component specialization and production-sharing as a distinguishing feature of modern economic globalization. Basically, international trade data indicates that offshore sourcing of parts and components and offshore assembly are playing a crucial role in the world economy as well as in the economies of any involved countries. Taiwan science parks are founded against this background of international fragmentation. By taking advantage of robust small and medium-sized enterprise networking, of high quality of human resources, of government support and government-industry-university-institute collaboration, the Taiwan science parks have become globally well-known examples of science parks set up for national prosperity within the framework of international fragmentation. The policy of science parks has been making a tremendously contribution to the development of the national economy in Taiwan. The science park policy set off the prosperity of high-technology industry clusters, the creation of innovation clusters, and the balanced development across the northern, central, and southern regional economies. Also, the trajectory of science park development in Taiwan has been successfully put the manufacturing industry on the trajectory from labor-intensive production toward a capital-intensive one. It filled in a niche in global division of labor of technology industry, facilitating the prosperity of regional economic development and the country as a whole. The frontier Taiwan experience can be a valuable reference for the economic and energy policies for high-technology industries.
2. Research Objectives
This paper evaluates the effectiveness of high-technology industry development as well as policy implications for national economic development and energy consumptions, from both the economic and energy perspective, based on the real data from national science parks in Taiwan. First, this paper presents an nation-wide industrial Input-Output (I/O) analysis to demonstrate that, under the umbrella of international fragmentation, the extent to which Taiwan science parks take a lead in fostering the development of other related industries in terms of their global competitiveness in international trade while considering other factor prices and costs. The impacts of science parks on domestic industrial ecology and the economic implications are also evaluated. Second, the energy consumption of high-technology industries, such as the consumption of electricity and water are evaluated, and well as the CO2 emissions. With this research, the less favorable relationship between economic growth and energy consumption can be evaluated and the research results will provide complementary energy policy-guiding principles for the development of high-technology industries, once the economic considerations are integrated.
3. The Science Parks and Performance in Taiwan
It is widely believed that the promotion and development of high-technology industries by the Taiwanese government in the past two decades has been one of the most important factors that have helped Taiwan maintain an above-average rate of economic growth. Science parks in Taiwan have incubated six major industrial clusters, including integrated circuits (IC) industry, computer & peripherals industry, telecommunication industry, optoelectronics industry, precision machinery industry, and biotechnology industry. The science parks occupy merely 0.1% of Taiwan’s total land area, but contribute around 16% to Taiwan’s overall manufacturing revenue, 40% to domestic IT industry, 14% to foreign trade, and 15% to domestic invention patent output. As key high-technology industry actuators, science parks act as productivity sources in Taiwan and produce economic prosperity for Taiwan. To provide a sound environment for tenants, the parks are divided into three different areas, namely, industrial, residential and recreational areas. The government also provides high quality water and stable electricity. Highly effective telecommunication facilities are also available.
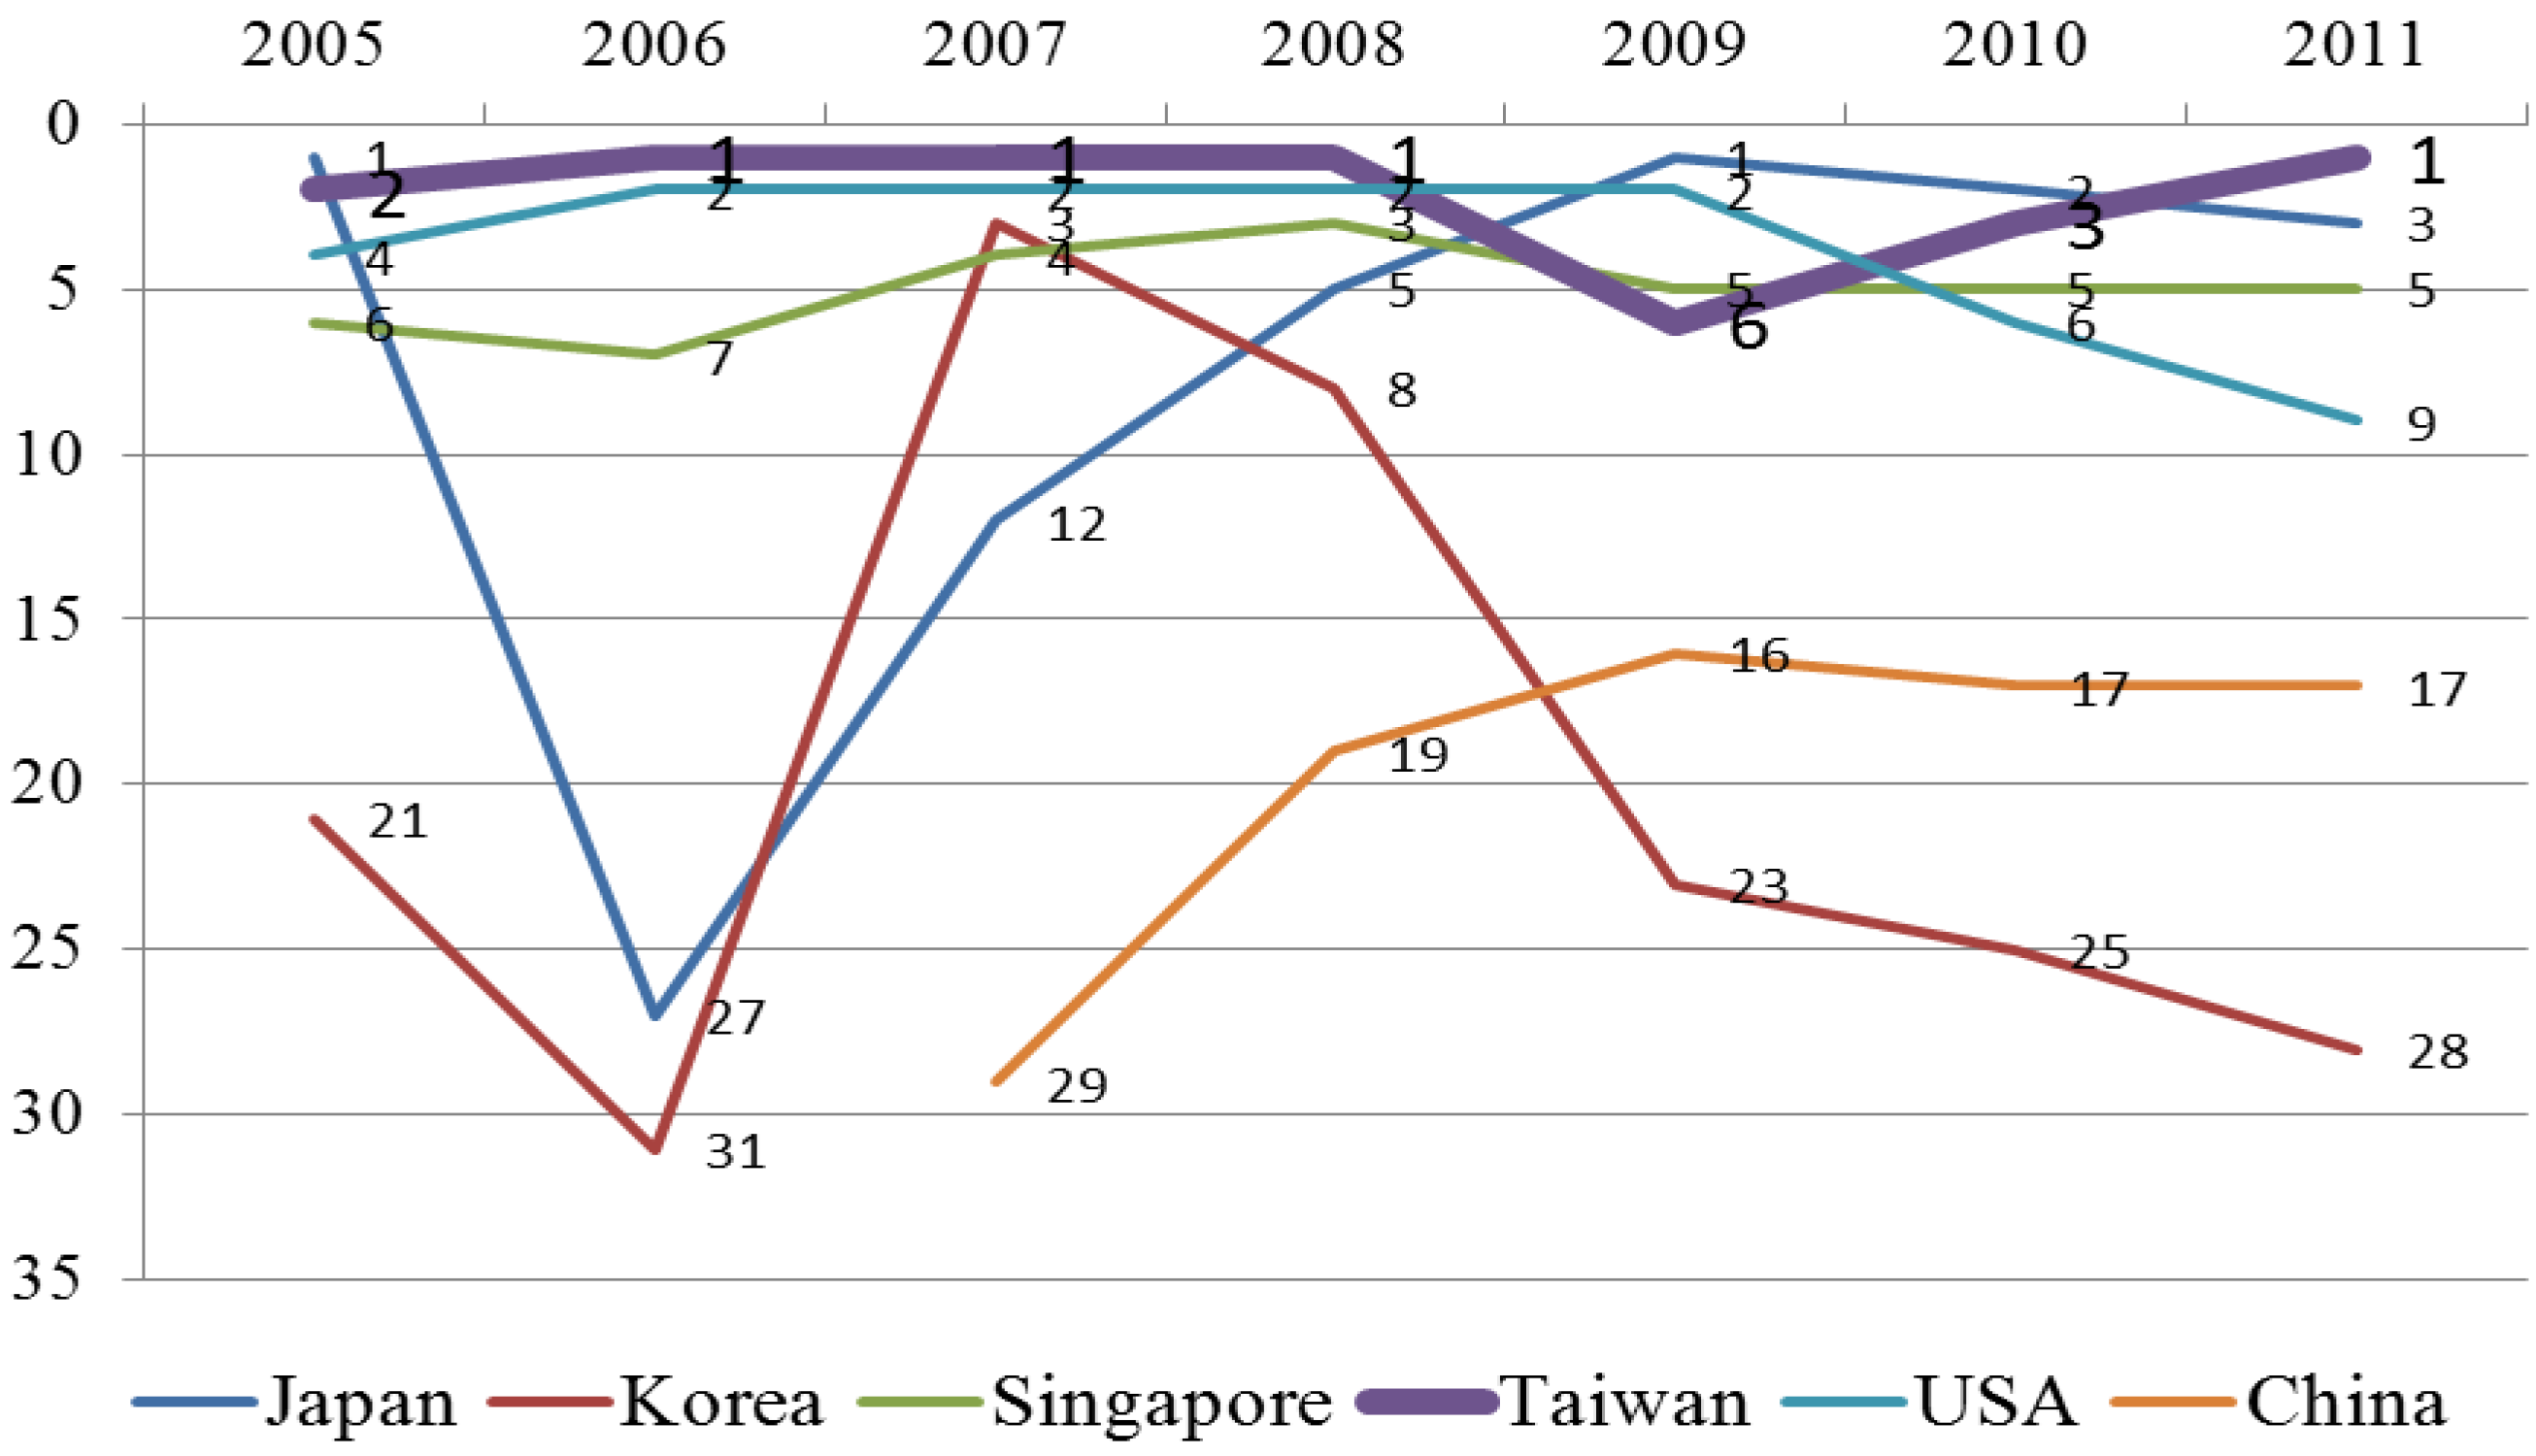
With an integrated support system, the cluster effect of Taiwan’s high-technology industry is outstanding. The World Economic Forum’s Global Competitiveness Index ranked Taiwan No. 1 in industry cluster index from 2006 to 2008 and 2011 (as shown in
Figure 1). Among the industrial clusters, several of Taiwan’s IT products and related industry capacities rank in the leading positions worldwide. For example, in areas such as IC foundry, MASK ROM, IC Packaging, motherboard, DRAM, TFT-LCD, Wireless LAN card,
etc. they rank in first place, whereas in IC Design, small size TFT-LCD,
etc. they rank in second place.
Figure 1.
WEF global ranking of industry clustering.
Figure 1.
WEF global ranking of industry clustering.
Currently Taiwan has three major science and industrial parks placed from north to south on the land. Hsinchu Science Park (HSP), the northern one, was established on December 15, 1980 and located on the Hsinchu area, surrounded by prominent universities, institutes, and laboratories to support the development of important industry clusters and university-industry-institute collaboration. The major high-technology industries located in this park include an integrated circuit (IC) industry, computers and peripheral equipment, optical communication industry, optoelectronics industry, high precision industry, biotechnology industry, and so on. By the end of 2010, there were over 400 enterprises operating in the park with 139,416 employees. The total revenue in 2010 was as high as $1.187 trillion TWD, of which 68% is contributed by the IC industry, followed by the photonics industry (21%) and the high precision industry (7%). These top three industries contributed 96% of total revenue of the Hsinchu Science Park in 2010. Undoubtedly, IC, photonics, and high precision industries acted as a core driving force launching other related industries and economic development.
Central Taiwan Science Park (CTSP), located in the central Taiwan area, was established on September 23, 2002 with a total area of 1,646 hectares. The core industries established and supported here are a photonics industry, high precision industry, a semiconductor industry, a biotechnology industry, a clean energy industry, and so forth. In terms of its substantial performance, by the end of 2010, there were 108 enterprises based in the park with a total of 23,329 total employees. Of a total revenue in 2010 of about $362.5 billion TWD 70% was contributed by the optoelectronics industry, followed by IC industry (27%) and high precision industry (3%). Now CTSP also recruits social, cultural and environmental-oriented institutes to foster the development of sustainability research, cultural and historical research and other related human sciences. CTSP identifies itself as a comprehensive science park with the combination of economic, cultural, and human development.
Southern Taiwan Science Park (STSP) was established in the 1990s. It consists of the Tainan Science Park and the Kaohsiung Science Park, covering 1,043 hectares and 570 hectares, respectively. By the end of 2010, there were 171 enterprises with 56,388 employees with total revenue of $605.9 billion TWD in the park. Prominent industries in STSP include optoelectronics, IC industry, high precision industry, and biotechnology, contributing to 57%, 35%, 5%, and 1% of the total revenues in 2010, respectively.
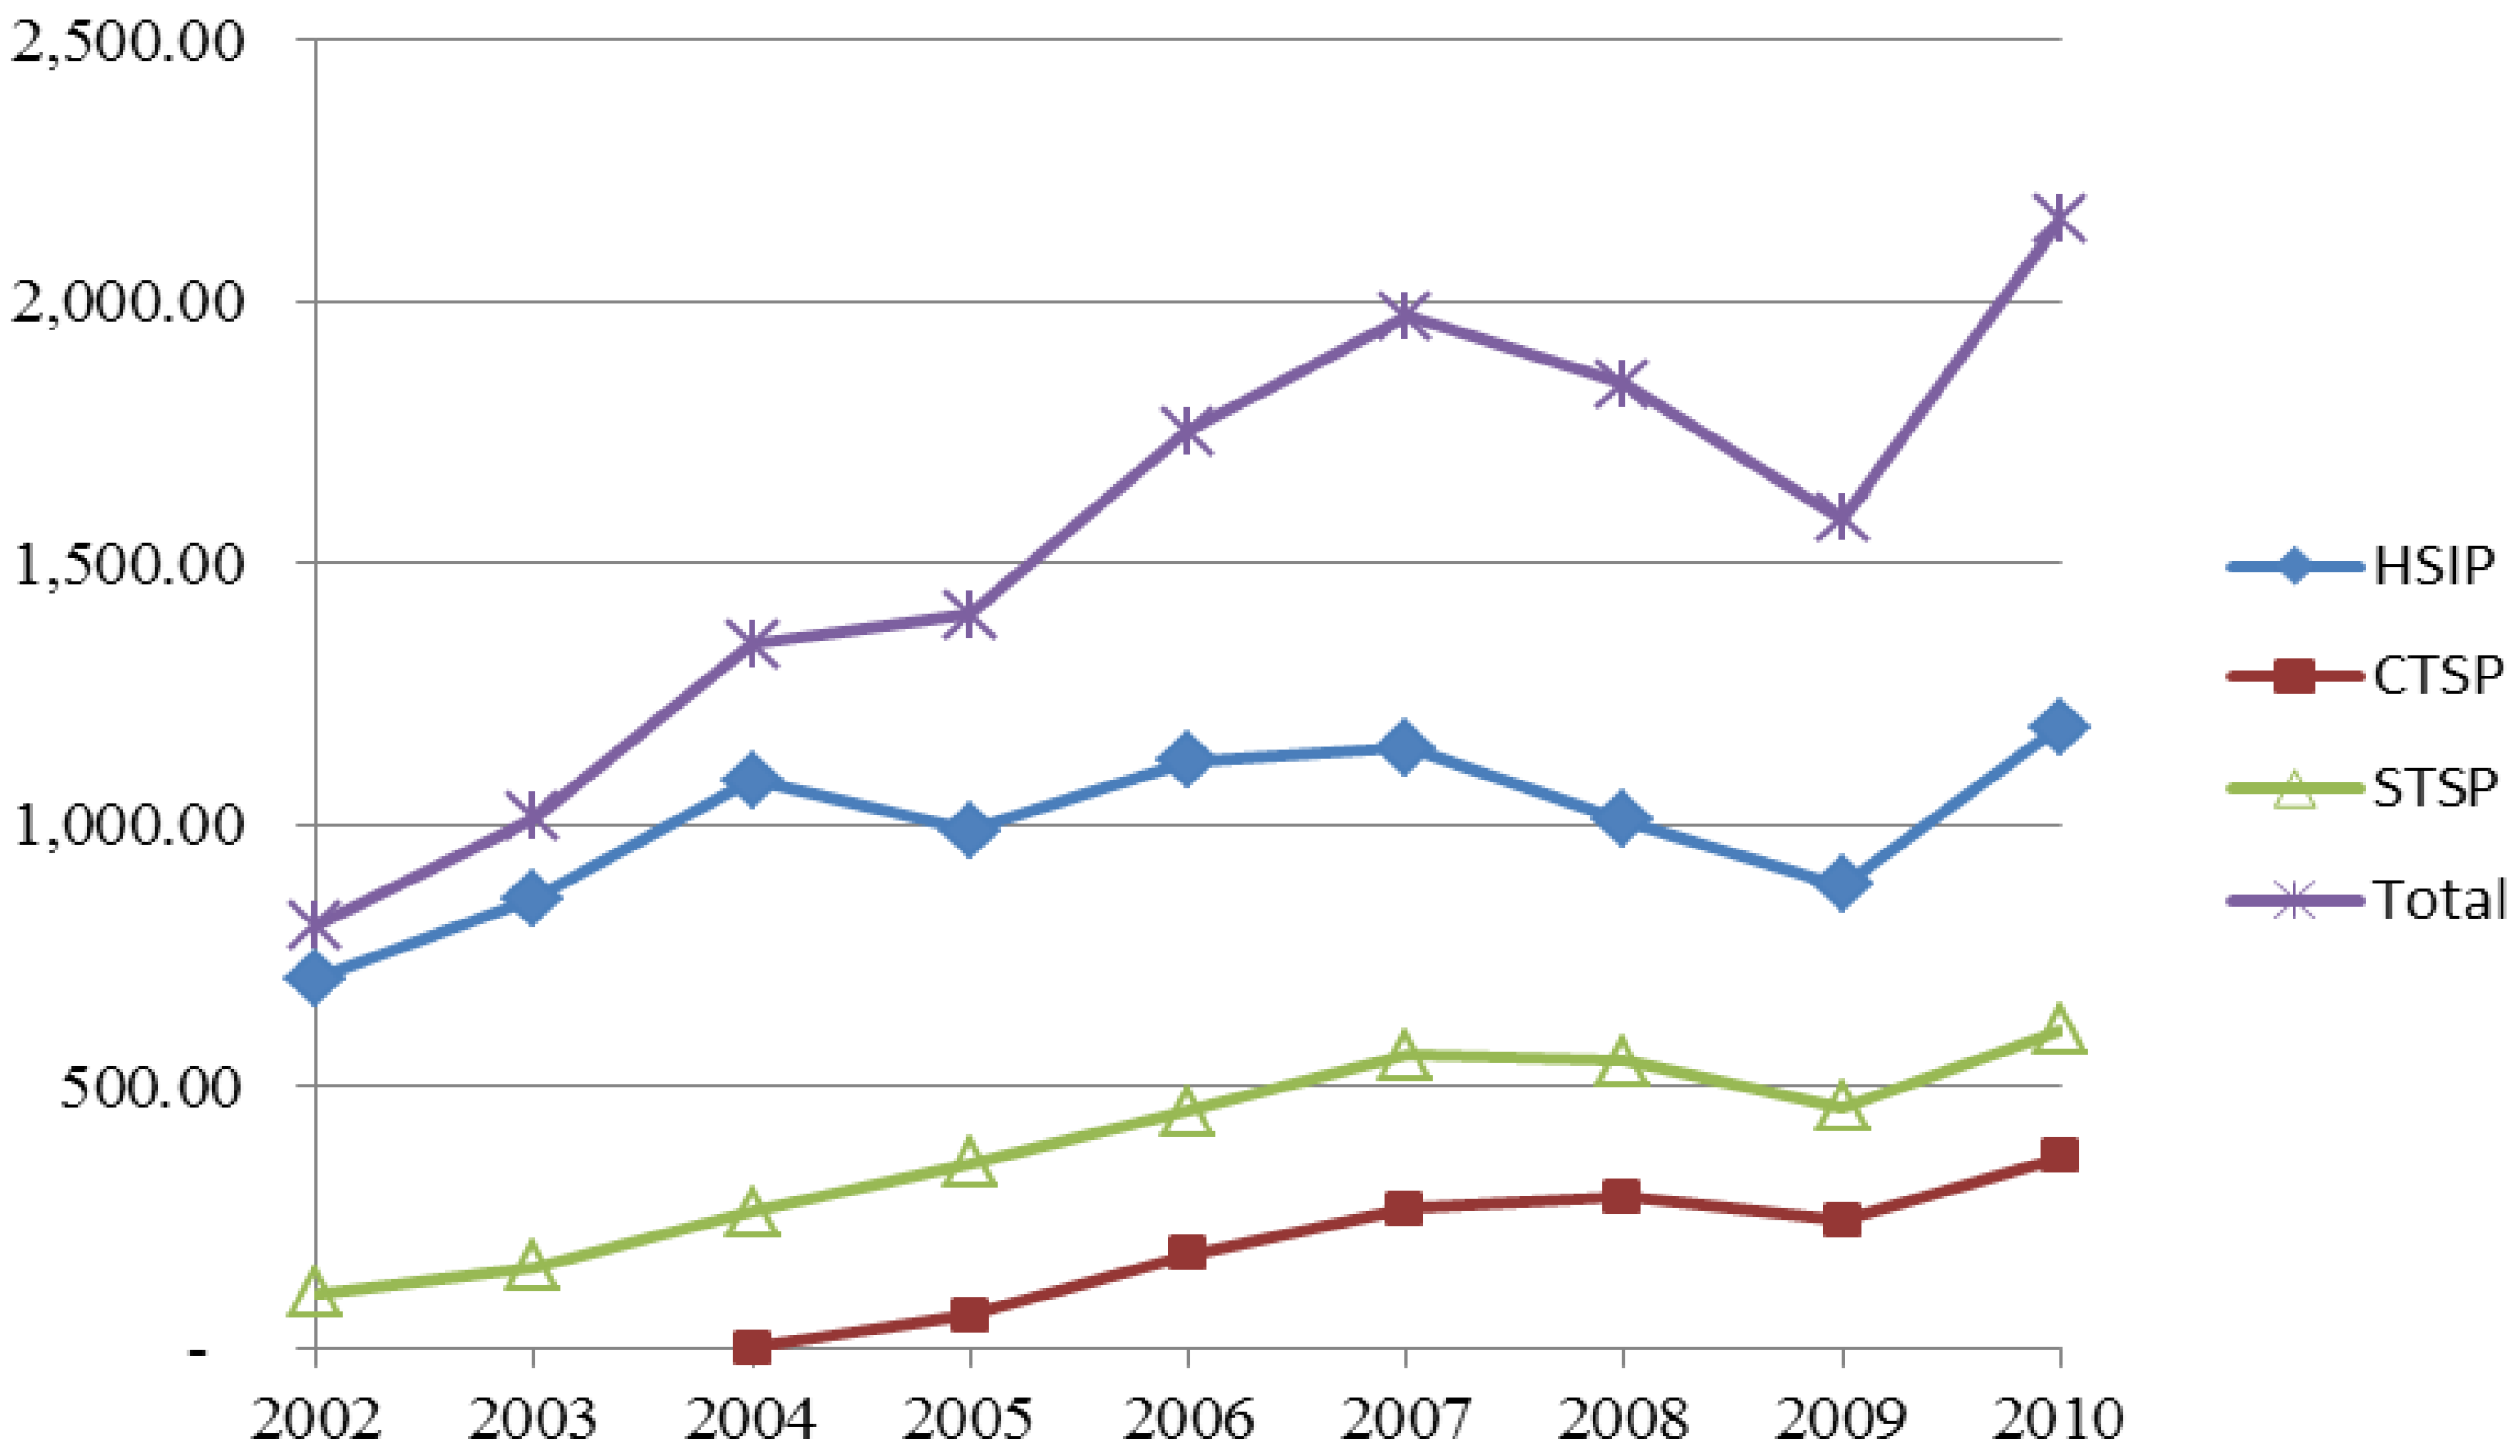
It is easier to see how these three science parks are contributing to the Taiwan national economy from
Figure 2, which shows how the annual total revenues from the three science parks have been increasing—except during the global financial and economic crisis in 2008 and the following year. Their total revenues have been contributing at an increasing rate to Taiwan’s total industrial revenues increasingly from 5 per cent in 1997 to 13 per cent in 2008.
Figure 2.
Annual Revenues from Three Taiwan Science Parks (2002-2010), Unit: billion TWD. (Notes: HSIP: Hsinchu Science Park; CTSP: Central Taiwan Science Park; STSP: Central Taiwan Science Park. Data available for CTSP since its establishment in 2004).
Figure 2.
Annual Revenues from Three Taiwan Science Parks (2002-2010), Unit: billion TWD. (Notes: HSIP: Hsinchu Science Park; CTSP: Central Taiwan Science Park; STSP: Central Taiwan Science Park. Data available for CTSP since its establishment in 2004).
4. Input-Output Analysis for the Industrial Effects of Science Parks
All production activities are certainly linked to each other so that the boom-and-bust of an individual industry’s production activities will influence economic fluctuations of its front-end suppliers and back-end demanders. Therefore, in order to assess the economic performance of a certain industry, we should review not only its individual contribution as so many per cent of total GDP, but also analyze its input-output coefficients—one of economic methods used to evaluate how the parts of an economic system are affected by a change in a part of that system. The Input-Output (I/O) Analysis, developed by the Nobel Prize laureate Wassily Leontief, is widely used in economics to study the effects of different sectors on the economy as a whole in a particular nation or region. It can identify the various relationships of individual components within an economic system. In this study, we tend to capture the level of inter-industry linkages for those industries located at Taiwan science parks and their direct and indirect influences.
By using the I/O model, we capture both the industries’ direct and indirect influences on the national economy. In algebraic terms, the direct effects of industries are the diagonal elements of a matrix while the indirect ones are the off-diagonal elements. Basically, I/O analysis provides useful information of inter-industry linkages through industrial expenditure patterns by analyzing the transactions among intermediate input and intermediate demand as shown in
Table 1.
Table 1.
Matrix chart of input-output table.
Table 1.
Matrix chart of input-output table.
| | Intermediate Demand |
|---|
| Intermediate Input | Industry | 1, 2, 3, …, n |
1
⋮
N | |
In this study, we adopt I/O coefficients in a matrix chart to estimate the interdependent relationships among all prominent industries in science parks. Here two indices are used: sensibility and dispersion. Sensibility, as the effect of forward linkages, indicates when every sectoral final demands changes to one unit, the change in its demand for specific sectoral output is the sensibility of specific departments. Standardized forward linkage effect is called Sensitivity. Sensibility (
) is calculated as Equation (1):
where
is (
i,
j)
th element in the invertible matrix,
i,
j = 1, 2, …,
n.
When
> 1, it indicates/ signifies the sensitivity of a sector
i is higher than the average sensitivity of all sectors of the economy, and sector
i is identified as high sensitivity industry; when
< 1, then sector
i as low sensitivity industry. On the other hand, dispersion, as the effect of backward linkages, indicates when every department’s ultimate specific sectoral final demands changes to one unit, the change of the total outputs of all sectors increase/decrease is the dispersion of specific departments. Dispersion is also called backward linkage effects. Standardized backward linkage effect is called Dispersion. Dispersion (
) is calculated as Equation (2):
where
is (
i,
j)
th element in the invertible matrix,
i,
j = 1, 2, …,
n.
When
> 1, it represents the dispersion of a sector
j is higher than the average dispersion of all sectors of the economy, and sector
j is identified as a high dispersion industry; when
< 1, then sector
j as low dispersion industry. By using these indices of sensitivity and dispersion, we create a 2 × 2 table, identifying four idea types of industries according to the I/O model (
Table 2). Type I represents an industry having both high sensibility and dispersion to drive and support other economic activities. It is a key industry and includes the features of both front and back-end industry. Industries belonging to Type II have high forward linkage to other industries. As the demands of other economic activities increase, the back-end industries play an important role to support their development. Type III represents a group of isolated industries which are less influenced by the boom-and-bust of other industries. The fourth is categorized as front-end industry which is a key driving force to widely lead economic activities.
Table 2.
Four types of I/O model by sensibility and dispersion.
Table 2.
Four types of I/O model by sensibility and dispersion.
| | Dispersion () < 1 | Dispersion () ≥ 1 |
|---|
| Sensibility () ≥ 1 | II: Back-end Industry
High forward linkage; it is sensitive to the change of/in front industry and necessary for developing other industries. | I: Front and Back-end Industry
High forward and backward linkage; it plays both driving and supporting roles to foster industrial development and national prosperity. |
| Sensibility () < 1 | III: Isolated Industry
Lack direct industry linkage; it is relatively stable and less influenced by the boom-and-bust of industries. | IV: Front-end Industry
High backward linkage; it is a necessary driving force to advance economic activities widely. |
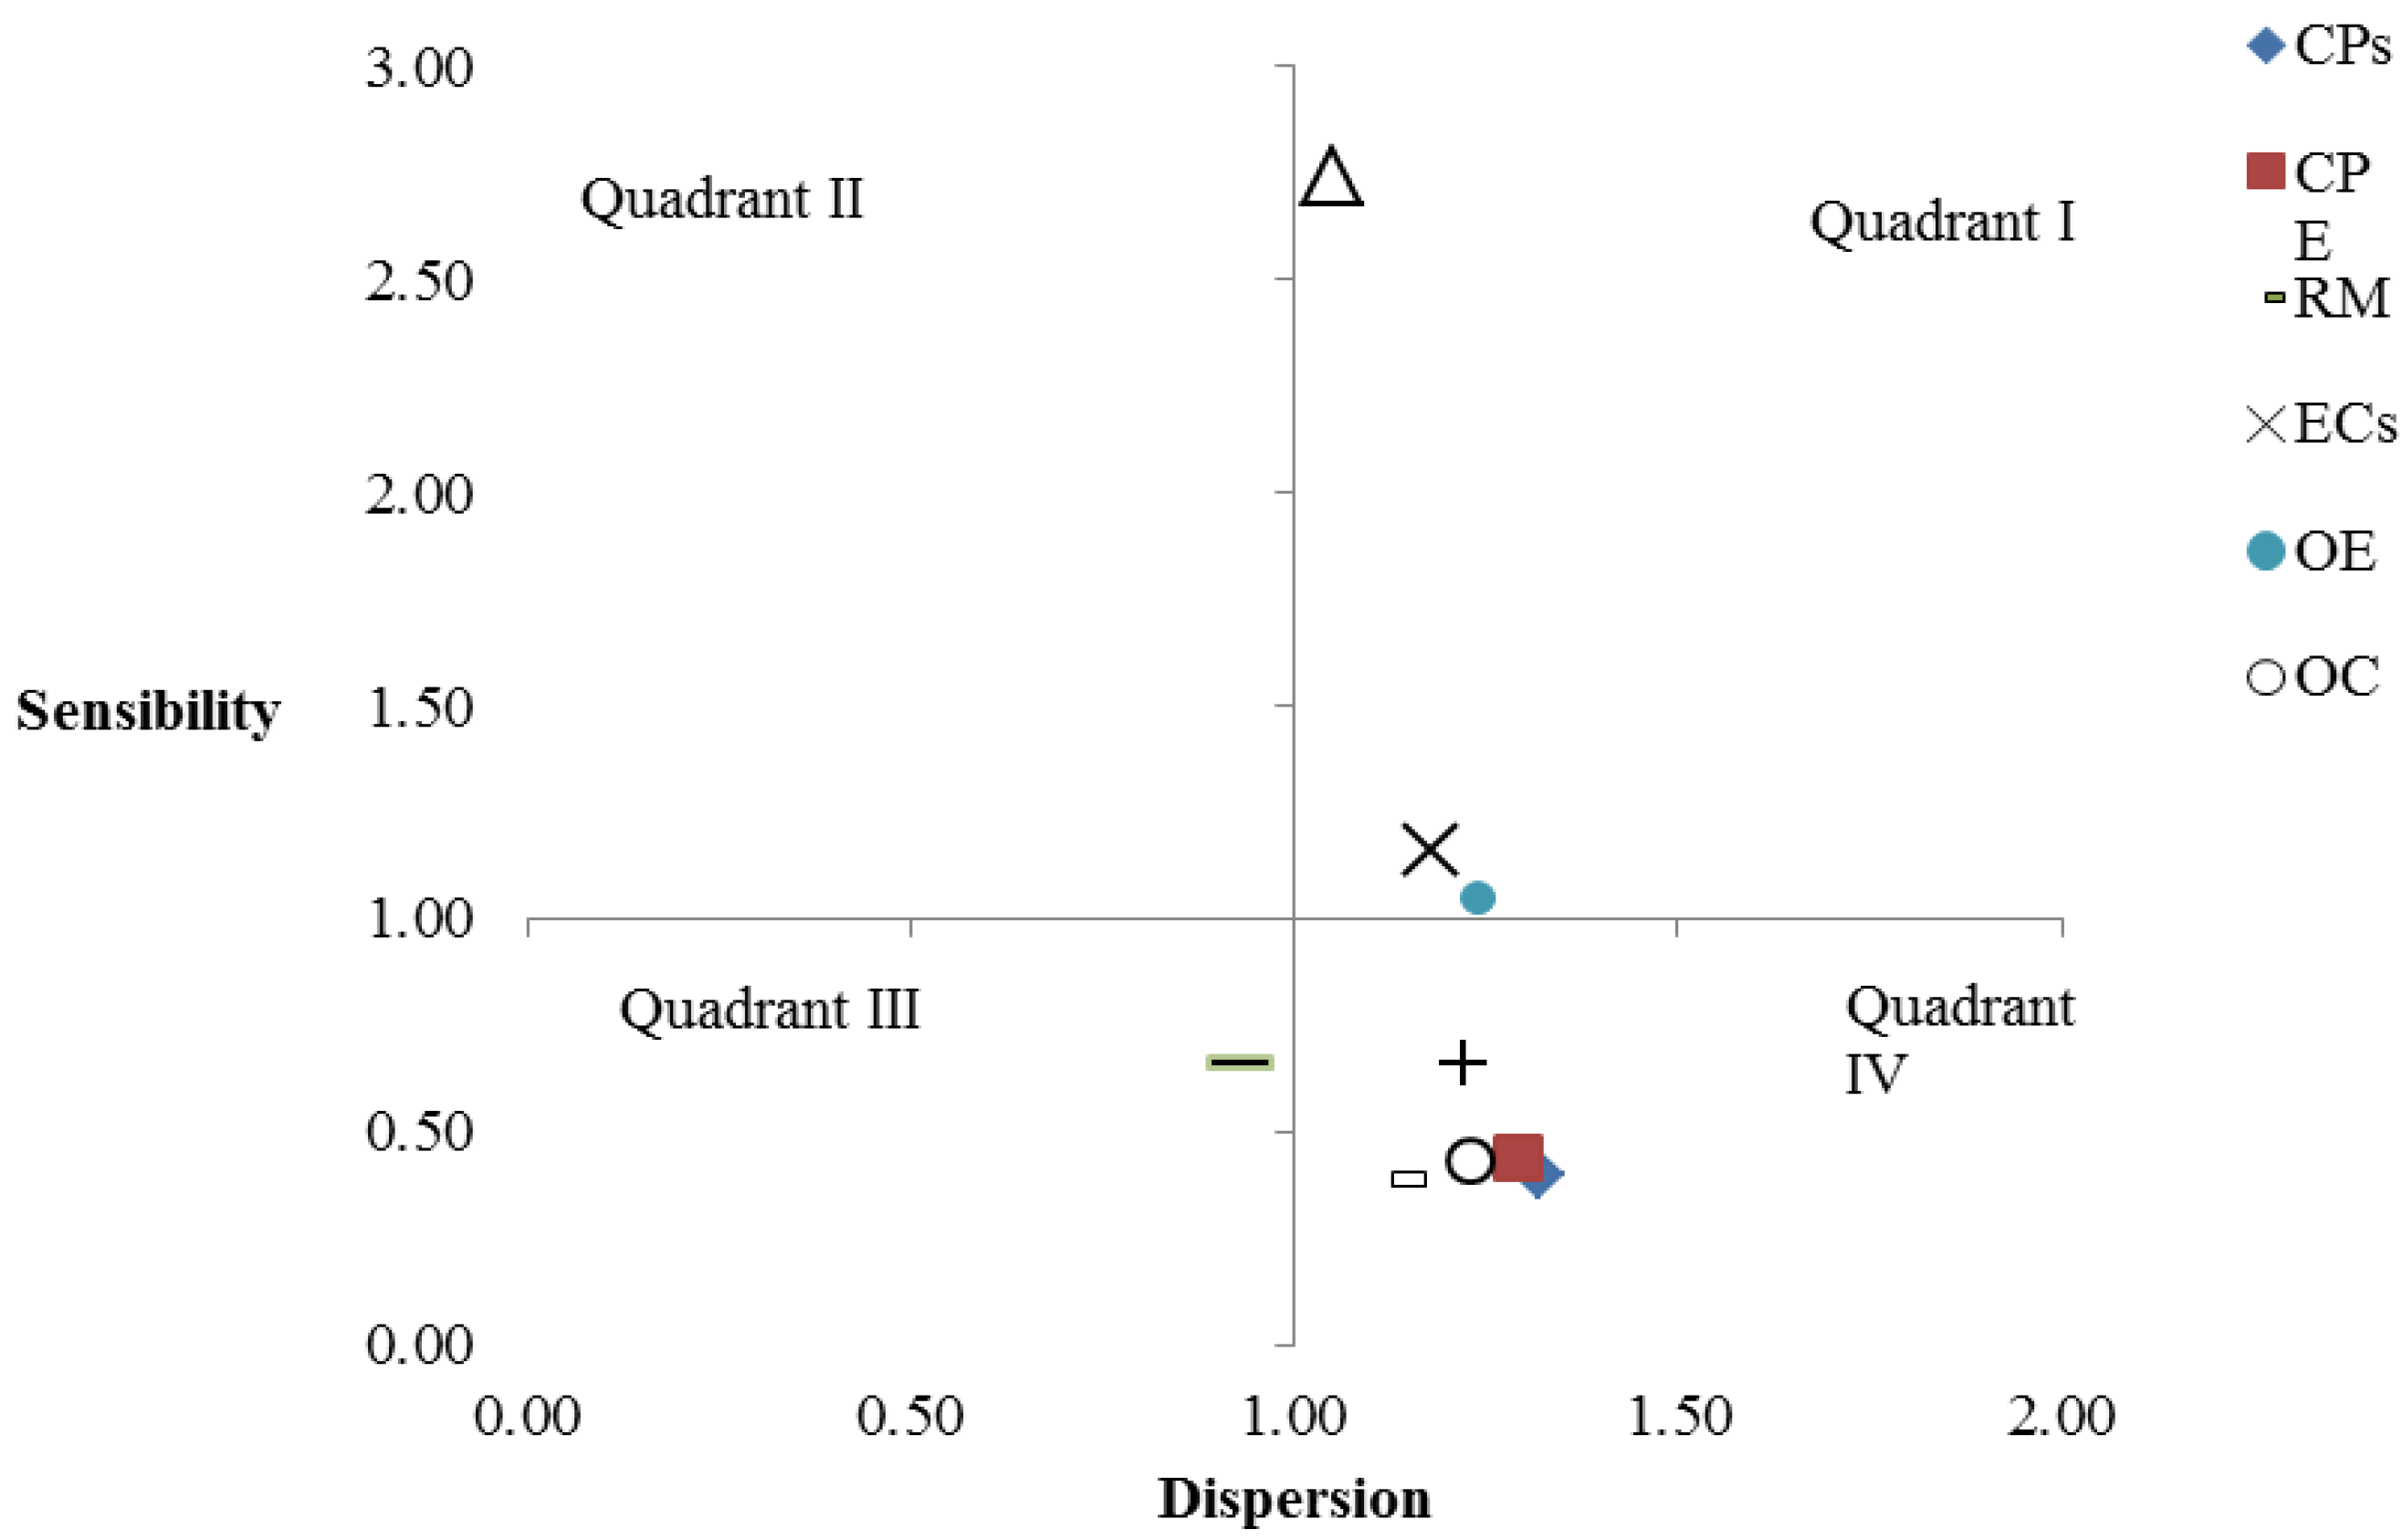
Figure 3.
2006 I/O analysis: how Taiwan science parks affect prominent industries. (Notes: CPs: Computer products; CPE: Computer peripheral equipment; RM: Recordable media; ECs: Electronic components; OE: Optoelectronics; OC: Optical communication; PI: Precision industry; SCI: Semiconductor Industry; BT: Biotechnology. Data source: 2006 Input-Output Tables Report, Directorate-General of Budget Accounting and Statistics, Executive Yuan).
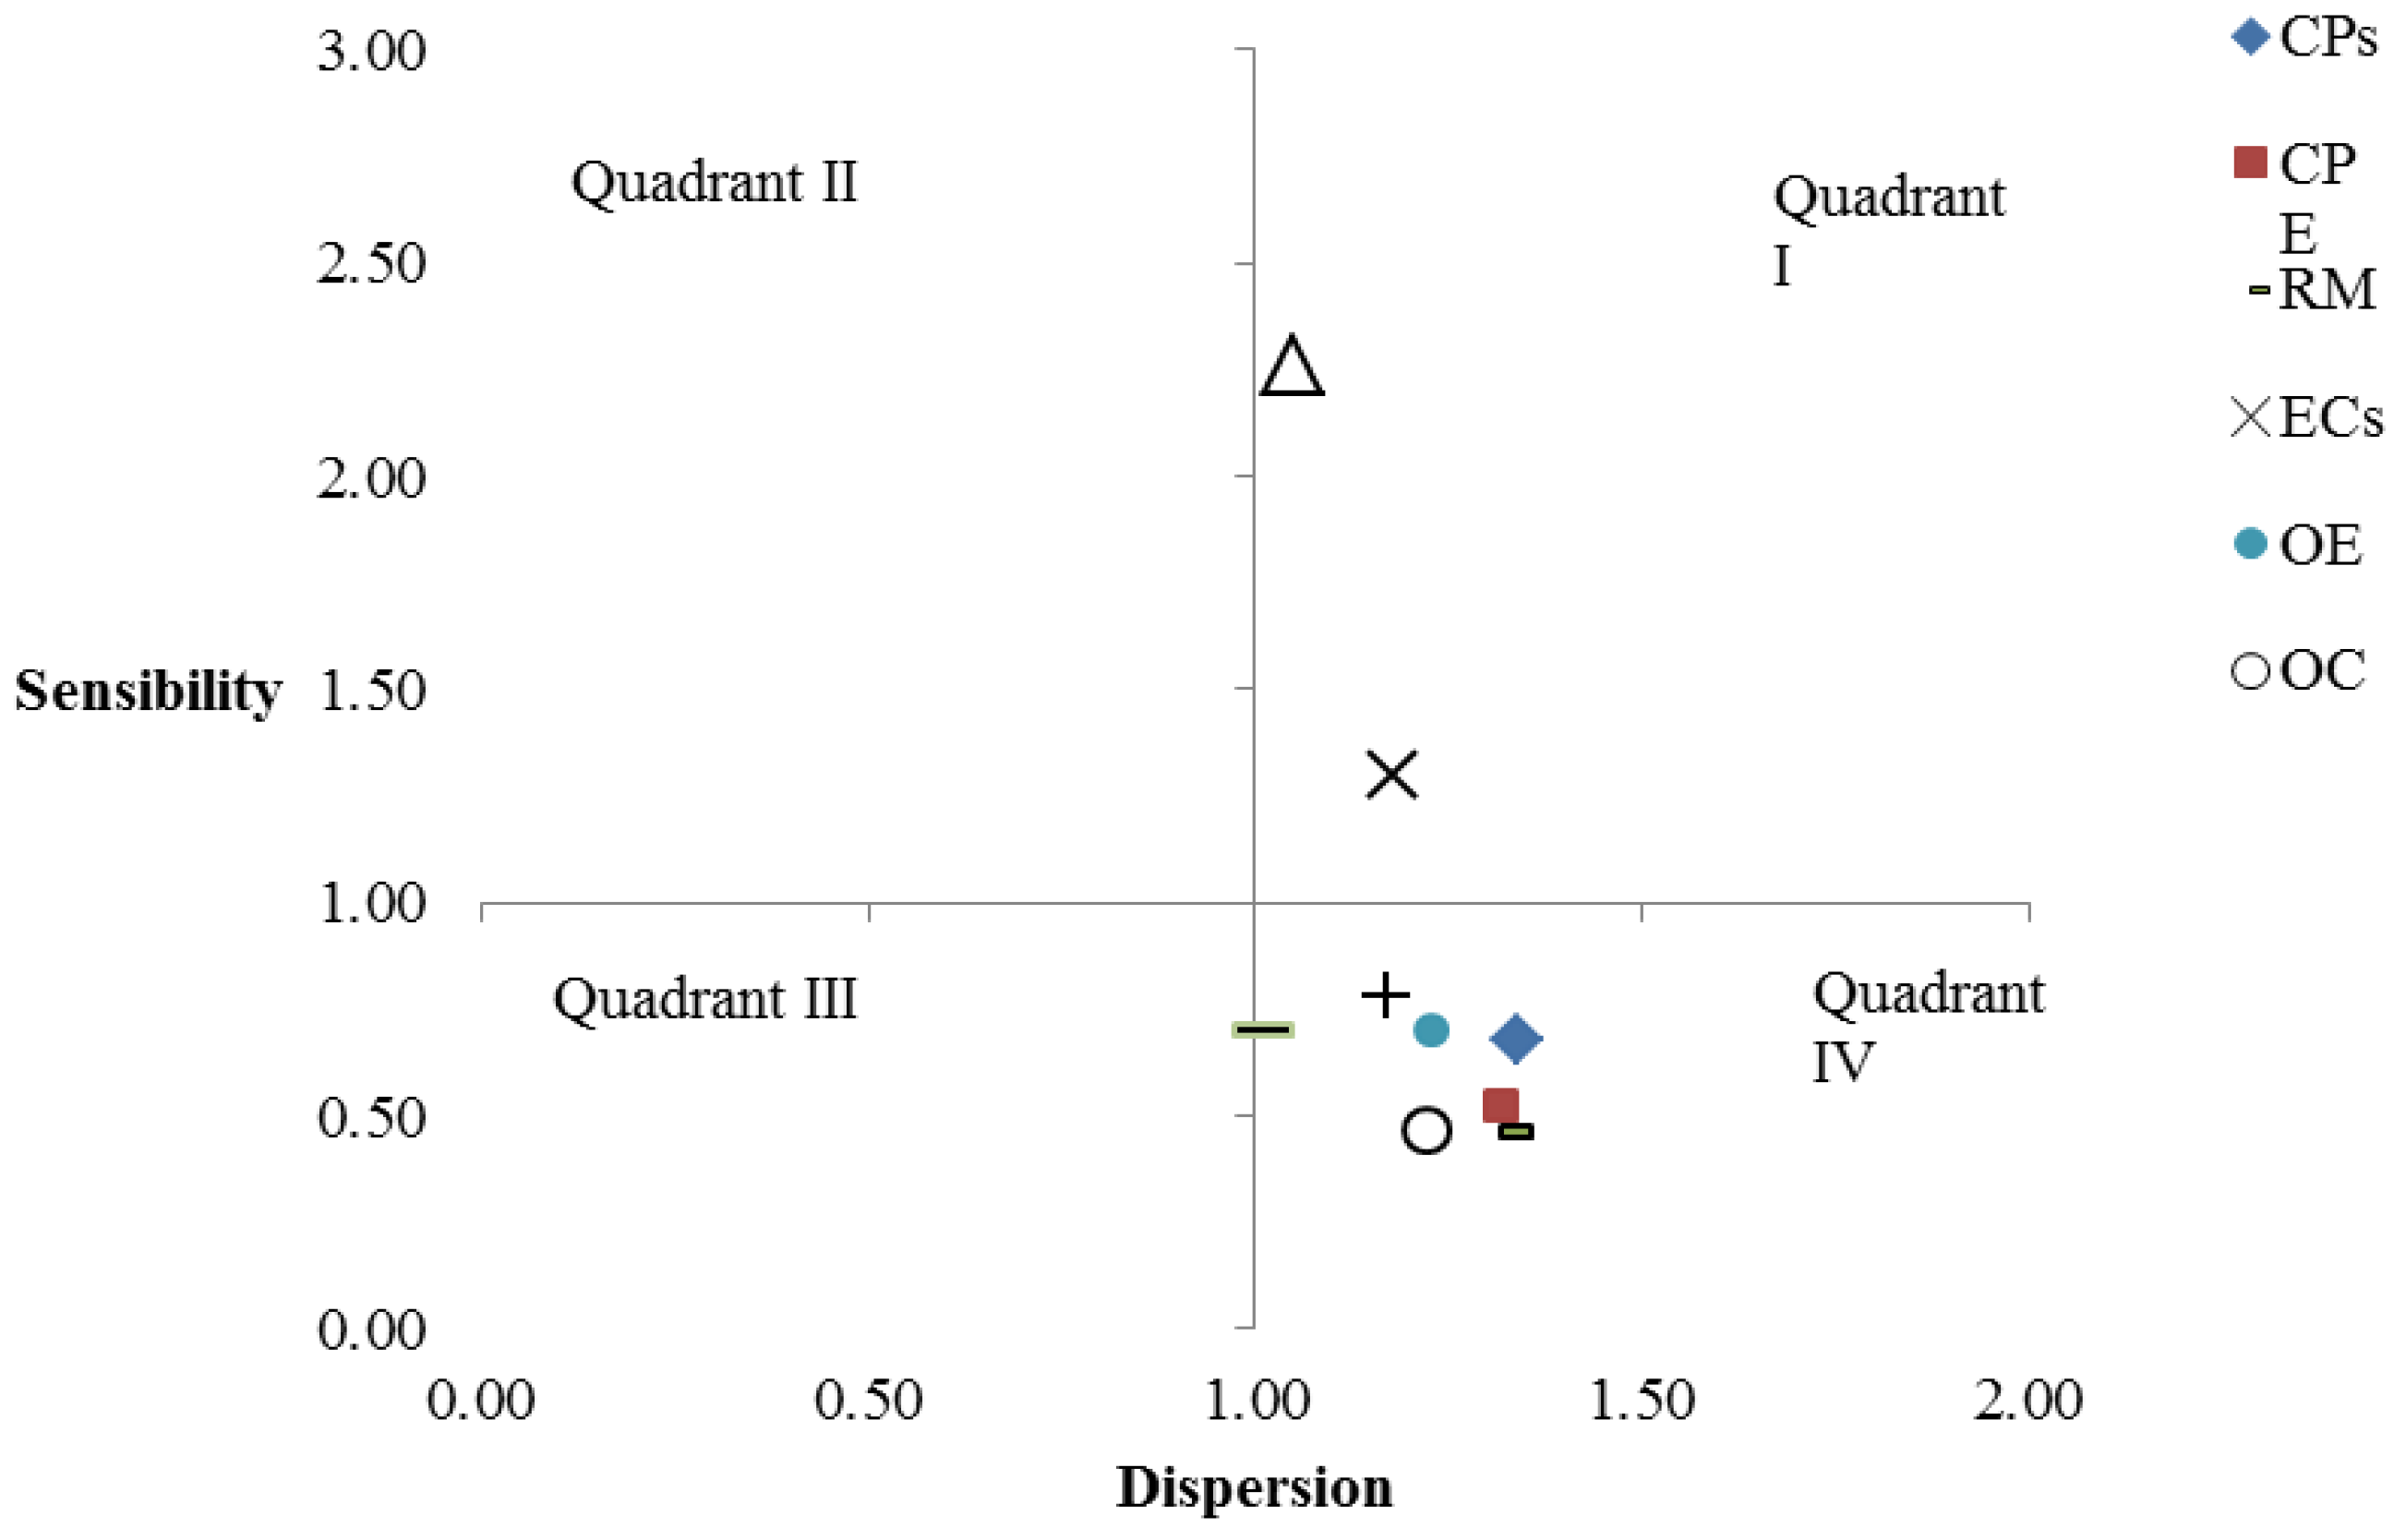
Figure 4.
1996 I/O analysis: how Taiwan science parks affect prominent industries in Taiwan. (Notes: CPs: Computer products; CPE: Computer peripheral equipment; RM: Recordable media; ECs: Electronic components; OE: Optoelectronics; OC: Optical communication; PI: Precision industry; SCI: Semiconductor Industry; BT: Biotechnology. Data source: 1996 Input-Output Tables Report, Directorate-General of Budget Accounting and Statistics, Executive Yuan).
In this study, we use I/O tables of industries in Taiwan science parks in 1996 and 2006, the latest data available from Taiwan Directorate-General of Budget Accounting and Statistics as our main data source to analyze the contribution of science parks to the national economy as a whole (the Taiwan Directorate-General of Budget Accounting and Statistics regularly maintains essential economic and industrial statistics in Taiwan. The original data of the I/O tables can be freely accessed by the linkage (
http://www.stat.gov.tw/ct.asp?xItem=28535&ctNode=671&mp=4). The results are plotted in
Figure 3 and
Figure 3, show most of the industries in the science parks had significant effects on other industries.
5. Contributions to the National Economic Development and Industrial Chains
In this section, the contributions of science parks to the national economic development and industrial chains were analyzed based on the statistics provided by Directorate-General of Budget, Accounting and Statistics, Executive Yuan, Taiwan. According to the latest data available from 1996 to 2006, we also analyze two major industrial clusters that together yielded 91% of the total revenue from science parks in 2010, IC industry (51.7% share) and optoelectronics industry (39.3% share), This is shown in
Table 3.
Based on the data collected, the added value of the high-technology industries in the science parks is continuously increased with increasing backward linkage effects to other industries. The effect of the high-technology industries in the science parks on national economic development was determined as follows: the total added values shared by GDP and domestic added value shared by GPD were determined by multiplying the backward linkage effects of the high-technology industries in the science parks.
Table 3.
The economic performance of IC and Optoelectronic industry.
Table 3.
The economic performance of IC and Optoelectronic industry.
| Industry | Year | AV a | (I-A)−1, b | (I-D)−1, c | GDP d | TAV e | DAV f | TAV/GDP | DAV/GDP |
|---|
| IC industry | 1996 | 58.5 × 10⁹ | 2.51 | 1.35 | 7906.1 × 109 | 146.7 × 10⁹ | 78.8 × 10⁹ | 1.86% | 1.00% |
| 1999 | 124.2 × 10⁹ | 2.65 | 1.40 | 9649.1 × 109 | 328.6 × 10⁹ | 174.2 × 10⁹ | 3.41% | 1.81% |
| 2001 | 127.0 × 10⁹ | 2.81 | 1.55 | 9930.4 × 109 | 356.7 × 10⁹ | 197.0 × 10⁹ | 3.59% | 1.98% |
| 2004 | 243.6 × 10⁹ | 3.13 | 1.50 | 11365.3 × 109 | 761.6 × 10⁹ | 366.4 × 10⁹ | 6.70% | 3.22% |
| 2006 | 283.5 × 10⁹ | 3.08 | 1.43 | 12243.5 × 109 | 872.0 × 10⁹ | 404.3 × 10⁹ | 7.12% | 3.30% |
| Optoelectronic industry | 1996 | 4.1 × 10⁹ | 2.93 | 1.66 | 7906.1 × 109 | 12.0 × 10⁹ | 6.8 × 10⁹ | 0.15% | 0.09% |
| 1999 | 12.1 × 10⁹ | 3.00 | 1.43 | 9649.1 × 109 | 36.4 × 10⁹ | 17.3 × 10⁹ | 0.38% | 0.18% |
| 2001 | 11.2 × 10⁹ | 3.43 | 1.60 | 9930.4 × 109 | 38.5 × 10⁹ | 18.0 × 10⁹ | 0.39% | 0.18% |
| 2004 | 69.9 × 10⁹ | 3.32 | 1.70 | 11365.3 × 109 | 232.5 × 10⁹ | 118.9 × 10⁹ | 2.05% | 1.05% |
| 2006 | 130.9 × 10⁹ | 3.64 | 1.66 | 12243.5 × 109 | 475.8 × 10⁹ | 217.8 × 10⁹ | 3.89% | 1.78% |
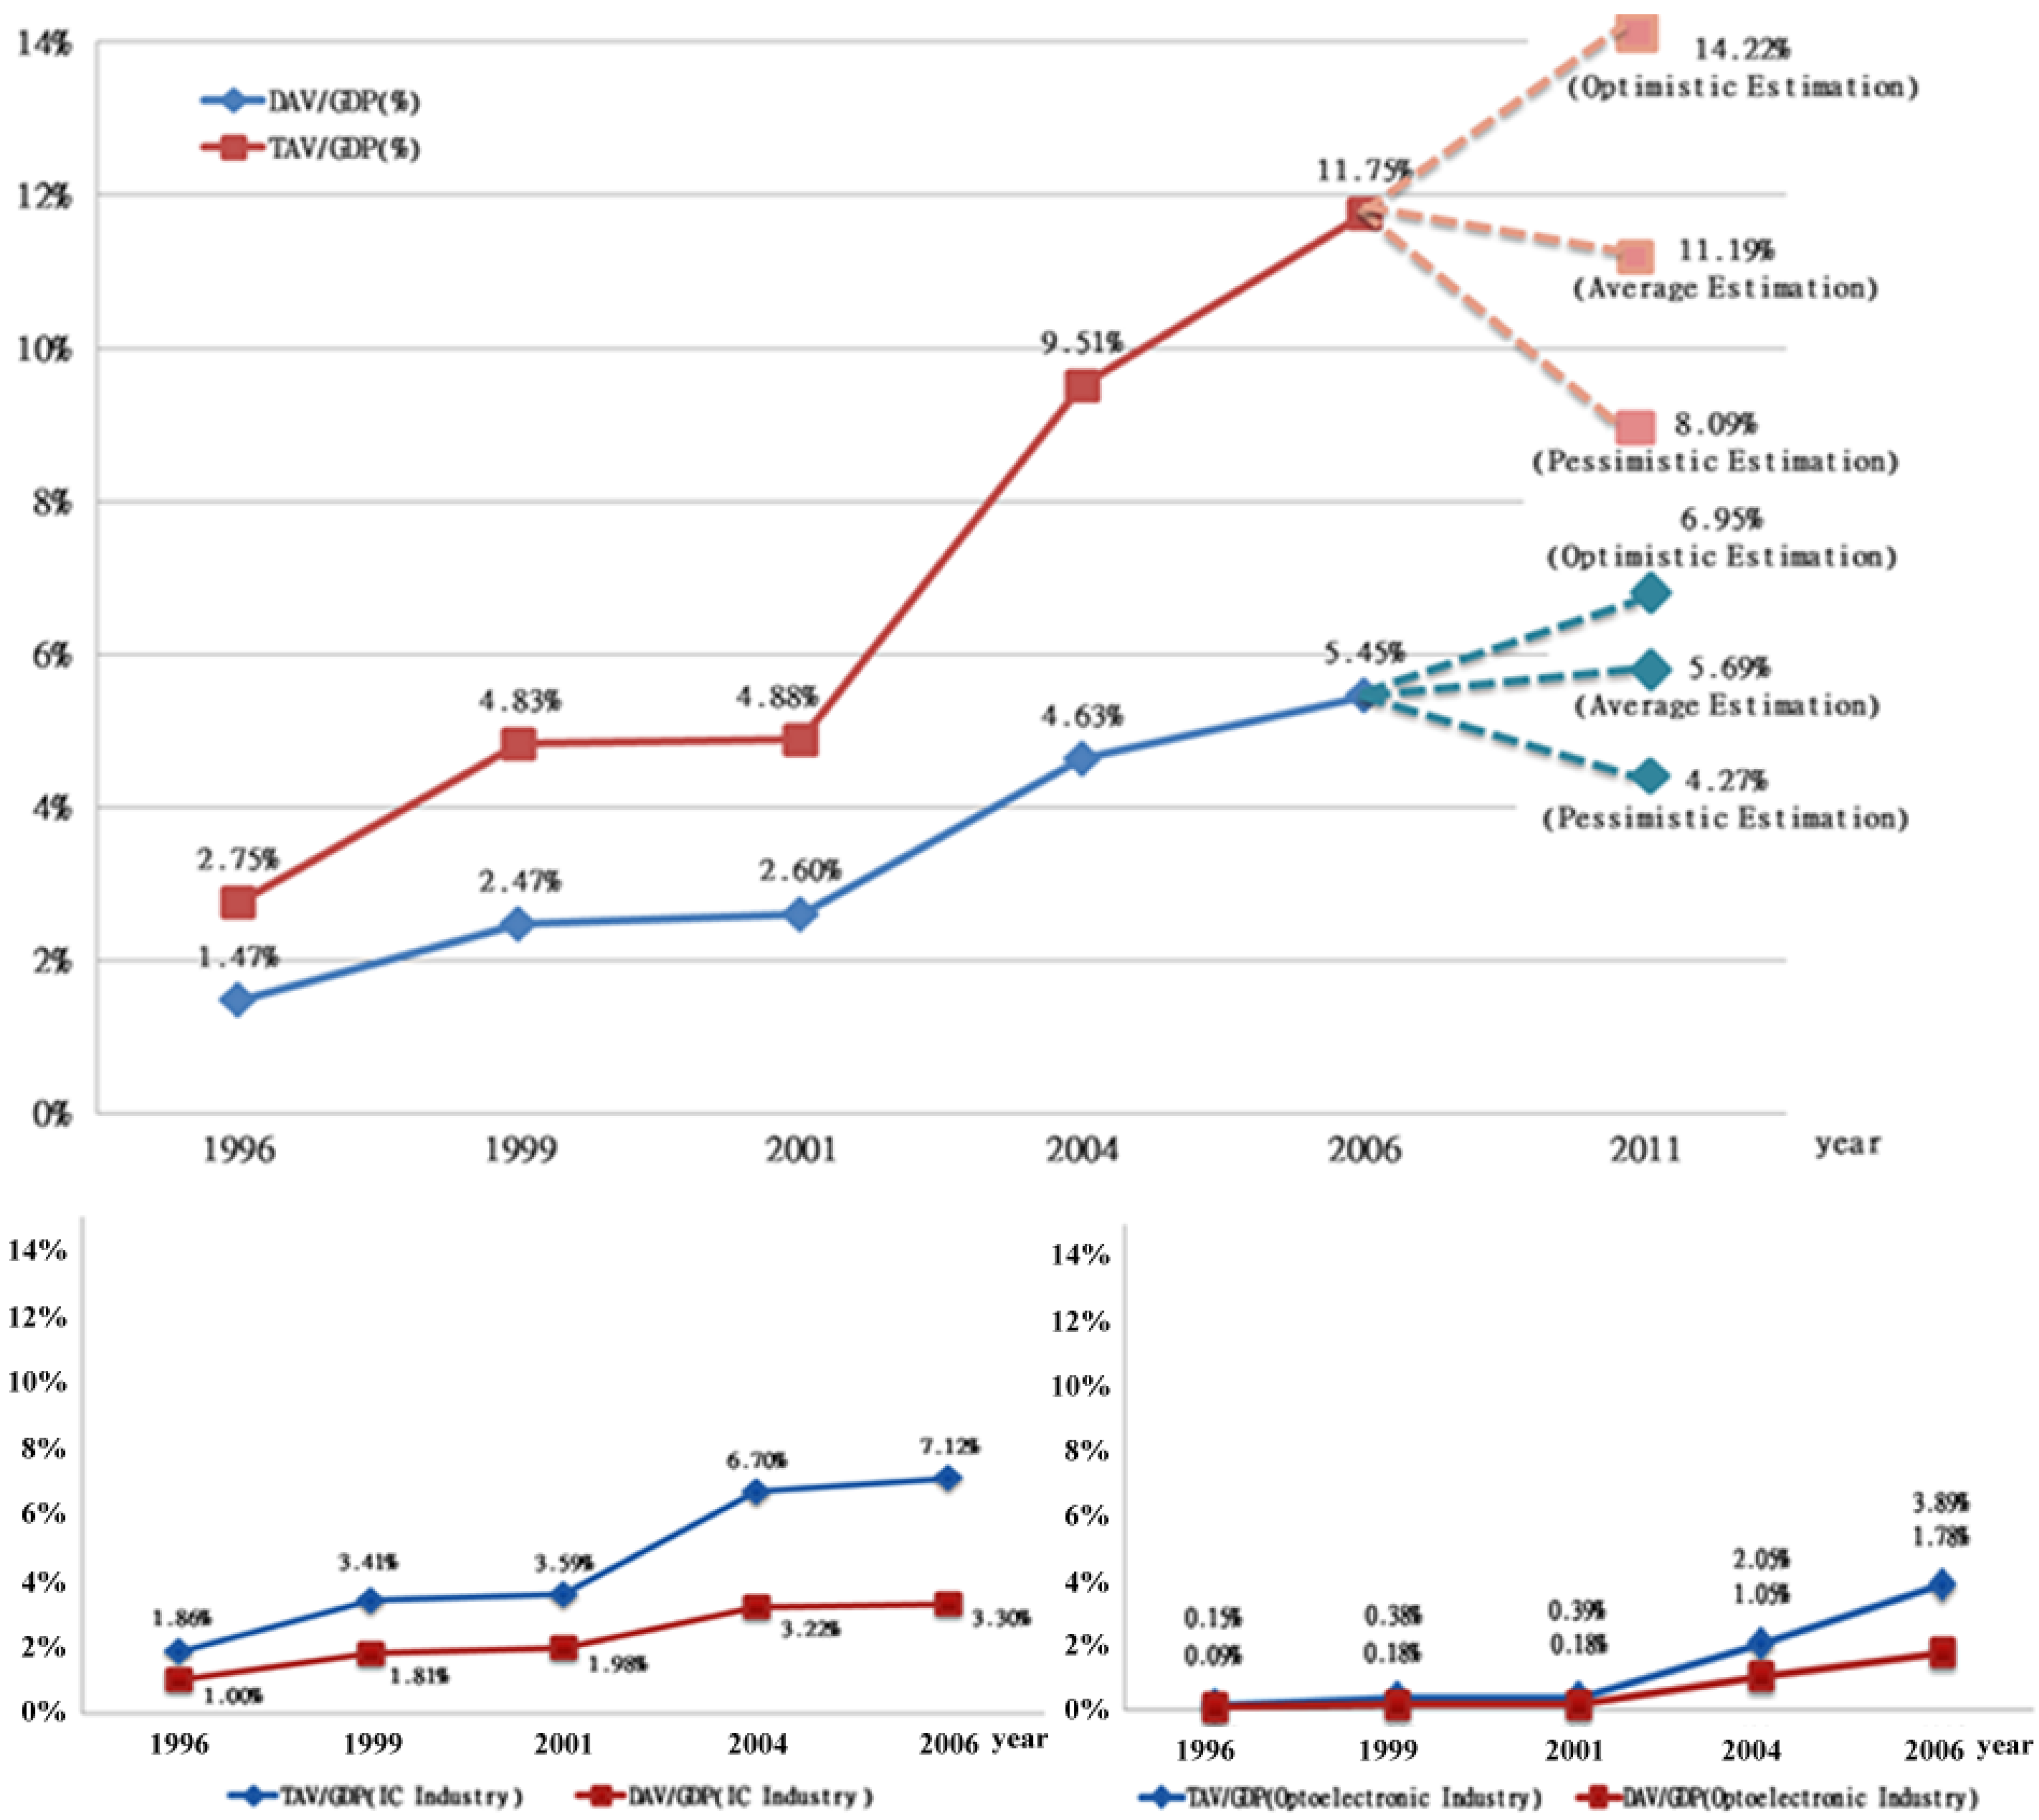
Figure 5.
National economic and industrial impacts driven by the illustrated science parks.
Figure 5.
National economic and industrial impacts driven by the illustrated science parks.
As shown in
Figure 5, the ten years total added -value shared by GDP from 1996 to 2006 were experienced a 427% booming growth (from 2.75% share in 1996 to 11.75% share in 2006), while domestic added values shared by GDP, in the same years, enjoyed a 371% expansion (from 1.47% share in 1996 to 5.45% share in 2006). In 2006, almost half of total economic effects (3.82% of 7.12%) were contributed to the global economy. Based on the aforementioned data, three-point estimation technique is applied to assess the economic contributions of the science parks in 2011. The results consistently suggest that the effects of high-technology industries in the science parks not only contribute significant economic values to Taiwan as a country but also promote industrial and technological upgrades to better fit in the global economic system.
6. Integrated Analysis of Energy Consumption and Economic Contributions
Energy consumption and CO
2 reduction have been one of the most important emergent issues considered by governmental policies. The goal of reducing CO
2 emissions without limiting economic growth has been widely accepted in the previous studies [
14,
15]. In this section, we provide an integrated analysis on energy consumption and economic contributions. Energy intensity of high-technology industries was evaluated by using the integrated energy-efficient economy index. Previous studies have proposed that electricity consumption, water consumption, and CO
2 emissions are considered major element of energy consumption [
16,
17,
18,
19,
20]. Thus, electricity, water, and CO
2 are used as indicators of energy consumption and the real data were collected from the following sources:
Electricity consumption
We collected the data of electricity consumption for identifying two standards: (1) the general level of industrial electricity consumption in Taiwan, (2) the level of electricity consumption in science parks. Data of three years data (2008–2010) were analyzed to identify the general level of industrial electricity consumption and the result was used as a comparative reference to the electricity consumption by science parks in 2009 and 2010.
Water consumption
We collected the data of water consumption for identifying two standards: (1) the general level of industrial water consumption in Taiwan, (2) the level of water consumption in science parks. Due to the data accessibility, the latest six years data (2001–2006) were analyzed to identify the general level of industrial water consumption and the result was used as a comparative reference for water consumption by science parks in 2009 and 2010.
CO2 emissions
The estimation of CO2 emissions is a professional discipline with the supports from many international organizations including the United Nations. There are abundant international experience and scientific methods for the estimation of various CO2 emission conversion factors. However, in order to specifically fit in the domestic environment in Taiwan, the aforementioned data of electricity and water consumption were converted to corresponding levels of CO2 emission, based on the estimated electricity-CO2 and water-CO2 conversion coefficients proposed by Environmental Protection Administration, Executive Yuan, Taiwan. The CO2 emission per added value was also calculated for the analysis of an energy-efficient economy. Although there can be a variance of the conversion coefficient and the converted data due to different estimation methods, this study applied the same conversion coefficient for comparison and focused on the relative results instead of absolute quantity so as to avoid concerns about the accuracy of the conversion coefficients.
According to the aforementioned indicators, the benchmarked general levels of energy consumptions are shown in
Table 4 and
Table 5.
Table 4.
The benchmarked general level of industrial electricity consumption and CO2 emission.
Table 4.
The benchmarked general level of industrial electricity consumption and CO2 emission.
| Year | AV | EC a | EC/MAV b | CCEC c | CCEC/MAV |
|---|
| 2008 | 12620.2 × 109 | 128.6 × 10⁹ | 10193.53 | 80.4 × 10⁹ | 6371.0 |
| 2009 | 12477.2 × 109 | 121.3 × 10⁹ | 9725.62 | 75.8 × 10⁹ | 6078.5 |
| 2010 | 13603.5 × 109 | 134.1 × 10⁹ | 9860.33 | 83.8 × 10⁹ | 6162.7 |
Table 5.
The benchmarked general level of industrial water consumption and CO2 emission.
Table 5.
The benchmarked general level of industrial water consumption and CO2 emission.
| Year | AV | WC a | WC/ MAV | CCWC b | CCWC/MAV |
|---|
| 2001 | 9930.4 × 109 | 18.5 × 10⁹ | 1860.62 | 3.6 × 10⁹ | 362.8 |
| 2002 | 10411.6 × 109 | 18.7 × 10⁹ | 1795.55 | 3.6 × 10⁹ | 350.1 |
| 2003 | 10696.3 × 109 | 17.6 × 10⁹ | 1645.04 | 3.4 × 10⁹ | 320.8 |
| 2004 | 11365.3 × 109 | 17.8 × 10⁹ | 1564.80 | 3.5 × 10⁹ | 305.1 |
| 2005 | 11740.3 × 109 | 17.9 × 10⁹ | 1520.43 | 3.5 × 10⁹ | 296.5 |
| 2006 | 12243.5 × 109 | 17.4 × 10⁹ | 1421.497 | 3.4 × 10⁹ | 277.2 |
Energy intensity is a measure of the energy efficiency of a nation's economy. It is calculated as units of energy per unit of GDP. The measure of energy intensity has the following policy implications:
Increasing energy efficiency also reduces both energy and carbon intensity of the economy [
21]. The improvements of energy efficiency represent the largest and least-cost opportunities to meet the growing energy needs and the need for reducing CO
2 emissions [
22,
23]. In order to perform an integrated assessment, the electricity and water consumptions are converted to the measurement of CO
2 emission. Therefore, the efficiency of electricity and water use can be compared with the same measurement.
While conventional energy intensity is generally used for a macro evaluation of national economies, we proposed an alternative for the evaluation of industry-wide energy intensity. The energy consumption of a science park operation has here been evaluated with economic considerations by using an integrated energy-efficient economy index (
3E index) as shown in Equations (3) and (4):
where 3
Ee represents the degree (or level) of energy-efficiency of the economy based on the electricity consumption, CCEC represents converted carbon from electricity consumed,
AV represents the estimated added value.
i represents the estimated unit of science parks,
j represents the benchmarked standard of national energy consumption:
where 3
Ew represents the degree of energy-efficiency of the economy based on the water consumption, CCWC represents converted carbon from water consumption,
AV represents the estimated added value.
i represents the estimated unit of science parks,
j represents the benchmarked standard of national energy consumption.
The results suggest that the high-technology industries in the national science parks in Taiwan were relatively energy efficient compared with other industries. For the electricity and water consumption, both 3
Ee and 3
Ew are lower than 100% which shows the high-technology industries in the national science parks consumed less energy than other industries making the same economic contributions, measured by added value. The detailed information is shown in
Table 6.
Table 6.
The level of energy utilized by industrial operations in the science parks.
Table 6.
The level of energy utilized by industrial operations in the science parks.
| Indices | Base Year |
|---|
| 2009 | 2010 |
|---|
| AV | 404.8 × 10⁹ | 552.0 × 10⁹ |
| EC | 29.1 × 10⁶ | 32.0 × 10⁶ |
| EC/MAV | 71.78 | 58.05 |
| WC | 98.7 × 10⁶ | 113.5 × 10⁶ |
| WC/MAV | 243.88 | 205.59 |
| CCWC | 19.2 × 10⁶ | 22.1 × 10⁶ |
| CCWC/MAV | 47.56 | 40.09 |
| CCEC | 18.2 × 10⁶ | 20.0 × 10⁶ |
| CCEC/MAV | 44.86 | 36.28 |
| Estimated level of energy-efficient economy based on Equation (4) | 14.92% | 12.58% |
| Estimated level of energy-efficient economy based on Equation (3) | 0.72% | 0.58% |
If we consider the utilization of water resources, then we find 3E
w is 14.92% and 12.58% in 2009 and 2010, respectively. The results reveal that the high-technology industries in the national science parks produce only 14.92% or 12.58% of the general level of industrial CO
2 emissions, while they can contribute the same economic added values. Thus, from both economic and energy perspectives, the integrated 3E index reflects the success of the national science parks policy in Taiwan. The energy-efficiency can be shown as even more significant by considering electricity consumption, where the 3E
e is merely 0.72% and 0.58% in 2009 and 2010, respectively. The results reveal that the high-technology industries in the national science parks were able to contribute the same economic added values by producing less than 1% of the general level of industrial CO
2 emissions. In conclusion, if we can combined the economic and energy perspectives into an integrated energy-efficient economy index, the development of science parks in Taiwan has bought about significant gains in the national economic and industrial impacts. Since more than 99% of Taiwan’s energy consumption relies on imports and most of the consumptions were from industrial activities [
24], the integrated analysis is relevant in order to support industrial and energy policies.
7. Conclusions
Science and technology polices and high-technology industrial developments can bring about significant national economic development. At the same time, the energy demanding nature of high-technology industries is one of the major concerns of public policy makers and relevant stakeholders. Hence, how to conduct integrated evaluation of energy use and economic development to accept the philosophy of a low-carbon economy rather than impede the industrial developments is one of the most pragmatic low-carbon energy-saving implementation approaches. In this paper, the concept of energy intensity and an energy-efficient economy index are applied to an integrated assessment of the relationship between economic growth and energy consumption, which is an addition to the theoretical and practical contributions on the development of high-technology industries. Especially for the governmental supported science parks, the proposed integrated analysis and performance evaluation provides a more comprehensive perspective in supporting the performance evaluation of industrial incubation policies. From a more macro standpoint, the integrated economic/energy perspective is worth to be incorporated into the list of those factors used for the construction of nation-wide policies on the industry choices, segmentations, and structural developments. The research results of the present case study suggest that the national science parks policy can facilitate successful development of high-technology industries, which bring about both significant economic benefits and energy efficient performance. Thus, high-technology industries need not necessarily be considered as high energy-consuming based simply on absolute environmental standards as the sole perspective. An integrated evaluation of the impacts of high-technology industries should be conducted to obtain more comprehensive policy directions. While the operations of the science parks in Taiwan have long enjoyed governmental support, the proposed case study provides three energy policy implications. First, a nation-wide macro viewpoint is needed for the planning of high-technology industrial developments. When high-technology industries are considered as one of the national/regional economies by governmental agencies, the integrated energy-efficient economy index can better represent the contributions of the high-technology industries. Second, a proper industrial clustering mechanism can further help high-technology industries to reach the status of an energy-efficient economy. The shared environmental facilities supported by the government, such as planned land and road usage, electricity and water supply, telecommunications system, sewerage system and wastewater treatments, can improve energy efficiency of high-technology industries. Third, the governmental policies on the taxing and management system in science parks would also have a direct impact on the degree of energy-efficiency in an economy of high-technology industries. The proposed policy implications should lead to improved future research for better developments of science parks and high-technology industries. Technically, for other future research, more innovative and practical indices that accommodate the integrated concept between the economic and energy considerations for specific industrial requirements should be discovered and applied in the future.


