Article

The Effects of Particle Size, Different Corn Stover Components, and Gas Residence Time on Torrefaction of Corn Stover

Department of Agricultural and Biosystems Engineering, Iowa State University, 100 Davidson Hall, Ames, IA 50011, USA
*
Author to whom correspondence should be addressed.
Energies 2012, 5(4), 1199-1214; https://doi.org/10.3390/en5041199
Submission received: 20 February 2012 / Revised: 31 March 2012 / Accepted: 17 April 2012 / Published: 23 April 2012
(This article belongs to the Special Issue Biomass and Biofuels 2012)

Abstract

:
Large scale biofuel production will be possible only if significant quantities of biomass feedstock can be stored, transported, and processed in an economic and sustainable manner. Torrefaction has the potential to significantly reduce the cost of transportation, storage, and downstream processing through the improvement of physical and chemical characteristics of biomass. The main objective of this study was to investigate the effects of particle size, plant components, and gas residence time on the production of torrefied corn (Zea mays) stover. Different particle sizes included 0.85 mm and 20 mm. Different stover components included ground corn stover, whole corn stalk, stalk shell and pith, and corn cob shell. Three different purge gas residence times were employed to assess the effects of interaction of volatiles and torrefied biomass. Elemental analyses were performed on all of the samples, and the data obtained was used to estimate the energy contents and energy yields of different torrefied biomass samples. Particle density, elemental composition, and fiber composition of raw biomass fractions were also determined. Stalk pith torrefied at 280 °C and stalk shell torrefied at 250 °C had highest and lowest dry matter loss, of about 44% and 13%, respectively. Stalk pith torrefied at 250 °C had lowest energy density of about 18–18.5 MJ/kg, while cob shell torrefied at 280 °C had the highest energy density of about 21.5 MJ/kg. The lowest energy yield, at 59%, was recorded for stalk pith torrefied at 280 °C, whereas cob and stalk shell torrefied at 250 °C had highest energy yield at 85%. These differences were a consequence of the differences in particle densities, hemicellulose quantities, and chemical properties of the original biomass samples. Gas residence time did not have a significant effect on the aforementioned parameters.

1. Introduction

Transportation fuels produced from lignocellulosic biomass have recently gained attention due to their positive effects on fossil fuel displacement, greenhouse gas emission reduction, rural development, and national security enhancement. The Energy Independence and Security Act (EISA) of 2007 mandates an increase in the minimum annual quantity of renewable fuels used in the United States transportation sector, from 58 billion liters in 2012 to 136 billion liters in 2022. As per the EISA mandate, out of the total renewable fuels produced in 2022, 79 billion liters should be advanced biofuels derived mainly from cellulosic feedstock, which does not compete with food production [1]. Large amounts of lignocellulosic biomass have to be collected, stored, and processed to support biofuels production at levels demanded by EISA. There is a variety of conversion technologies available for the production of biofuels, such as fermentation, pyrolysis, gasification, and hydrothermal processing. Although thermochemical pathways employ higher temperatures and/or pressures than biochemical pathways, they have numerous advantages, such as higher reaction rates, fewer feedstock pretreatment requirements, and an easier integration with the existing fossil fuel production infrastructure.
All conversion technologies are constrained by a narrow tolerance range for the physical characteristics of the converted biomass, such as particle size, shape, and moisture content. For example, a particle size larger than the accepted range will increase the amount of gas produced in the gasification process but, due to a slower gas diffusion speed, will decrease the quality of the gas produced, by reducing the amount of hydrogen and carbon monoxide present [2,3,4]. A large particle size also gives rise to the inter-particle vapor-char interaction and increases the yield of undesirable, light bio-oil fractions [5,6,7]. The shape of particle can influence proper fluidization, interfere with reactor feeding, induce material bridging, and affect product distribution in thermochemical systems [8,9,10]. The gasification of biomass with high moisture content results in more tar formation, unreliable operation, and low process efficiency [11]. An increase in the moisture content could enhance char yield during pyrolysis [12,13].
Size reduction and drying are energy intensive processes that significantly deteriorate the economy of biofuel production. A high heterogeneity of a lignocellulosic biomass, even among the same plant species, may degrade the quality of the final product produced by pyrolysis or gasification [14,15,16,17]. In addition, long distance feedstock transportation increases the cost of biorenewable production due to the feedstock’s low bulk and energy densities. Large scale production requires large quantities of biomass to be stored in order to support the operation of biorefineries over the whole year. Biomass feedstock’s susceptibility to microbial degradation during storage further compromises its economical utilization for fuel production [18,19]. Torrefaction can be employed to significantly reduce the cost of transportation, storage, and downstream processing by improving biomass brittleness, hydrophobicity, resistance to microbial degradation, energy density, homogeneity, and chemical characteristics [20,21,22].
Torrefaction is a thermochemical process conducted in a temperature regime between 200 and 300 °C under an inert atmosphere, with a low heating rate. It induces depolymerization and devolatilization of hemicellulose, the most reactive polymer under torrefaction reaction conditions [23]. As a consequence, various volatile species with high oxygen contents are formed, along with a solid product composed of mainly cellulose and lignin [17,20,24]. The product distribution from the torrefaction process, as well as the characterization of different product streams has been conducted by several researchers [25,26]. The suitability of many biomass feedstocks, including woody crops, agricultural residues, and dedicated energy crops, have been investigated. Most of the studies only assessed the torrefaction temperature and residence time as the variables influencing the quality and quantity of the solid product, permanent gases, and condensables produced [15,16,17,19,20,24,27,28,29]. Feedstock particle size and purge gas residence time are two other important parameters that has not yet been addressed. The positive effect of torrefaction on energy consumption during biomass size reduction can be captured only if the large particle size of biomass is utilized in the torrefaction process. A large particle size induces higher char production and lower liquid yield in the pyrolysis process [5,6,7]. However, how this affects the torrefaction process, or product yield and quality is not known. Purge gas residence times or volatile residence times have a strong impact on bio-oil and char yield in the pyrolysis process. Secondary reactions between char and volatiles in pyrolysis process enhance the yield of solids and decrease bio-oil yield. Prins et al. [24] concluded that formation of carbon monoxide during torrefaction can be explained by the reaction of carbon dioxide and steam with solid char. This confirms that there is indeed potential for solid-volatiles interaction in the torrefaction process. Torrefaction, as a process that has some similarities to pyrolysis, also might be affected by the purge gas flow rate. The reduction of purge gas use may be important for reducing capital and operating costs. In addition, both factors are important for proper reactor design, scale up, and operation.
The objective of this study was to investigate the torrefaction behavior of two particle sizes, (<0.85 mm and 20 mm) and three corn stover components (stalk shell, stalk pith, and cob shell. Three purge gas flow rates, i.e., gas residence times, (List the three rates here) were employed to assess potential interaction between volatiles and torrefied biomass that can influence biomass yield and quality, in the same manner as in the pyrolysis process. Torrefaction of the corn stover was conducted in a thermogravimetric analyzer (TGA) and a bench scale reactor. The dry matter loss (DML) during torrefaction experiments was recorded. All samples were analyzed for carbon, hydrogen, nitrogen, and sulfur contents, and the obtained data were used to calculate the energy content of torrefied samples and their energy yields. Results of the proximate analysis of raw biomass were used to determine ash content of the torrefied biomass. Particle density and the composition of raw biomass were determined as well.

2. Materials and Methods

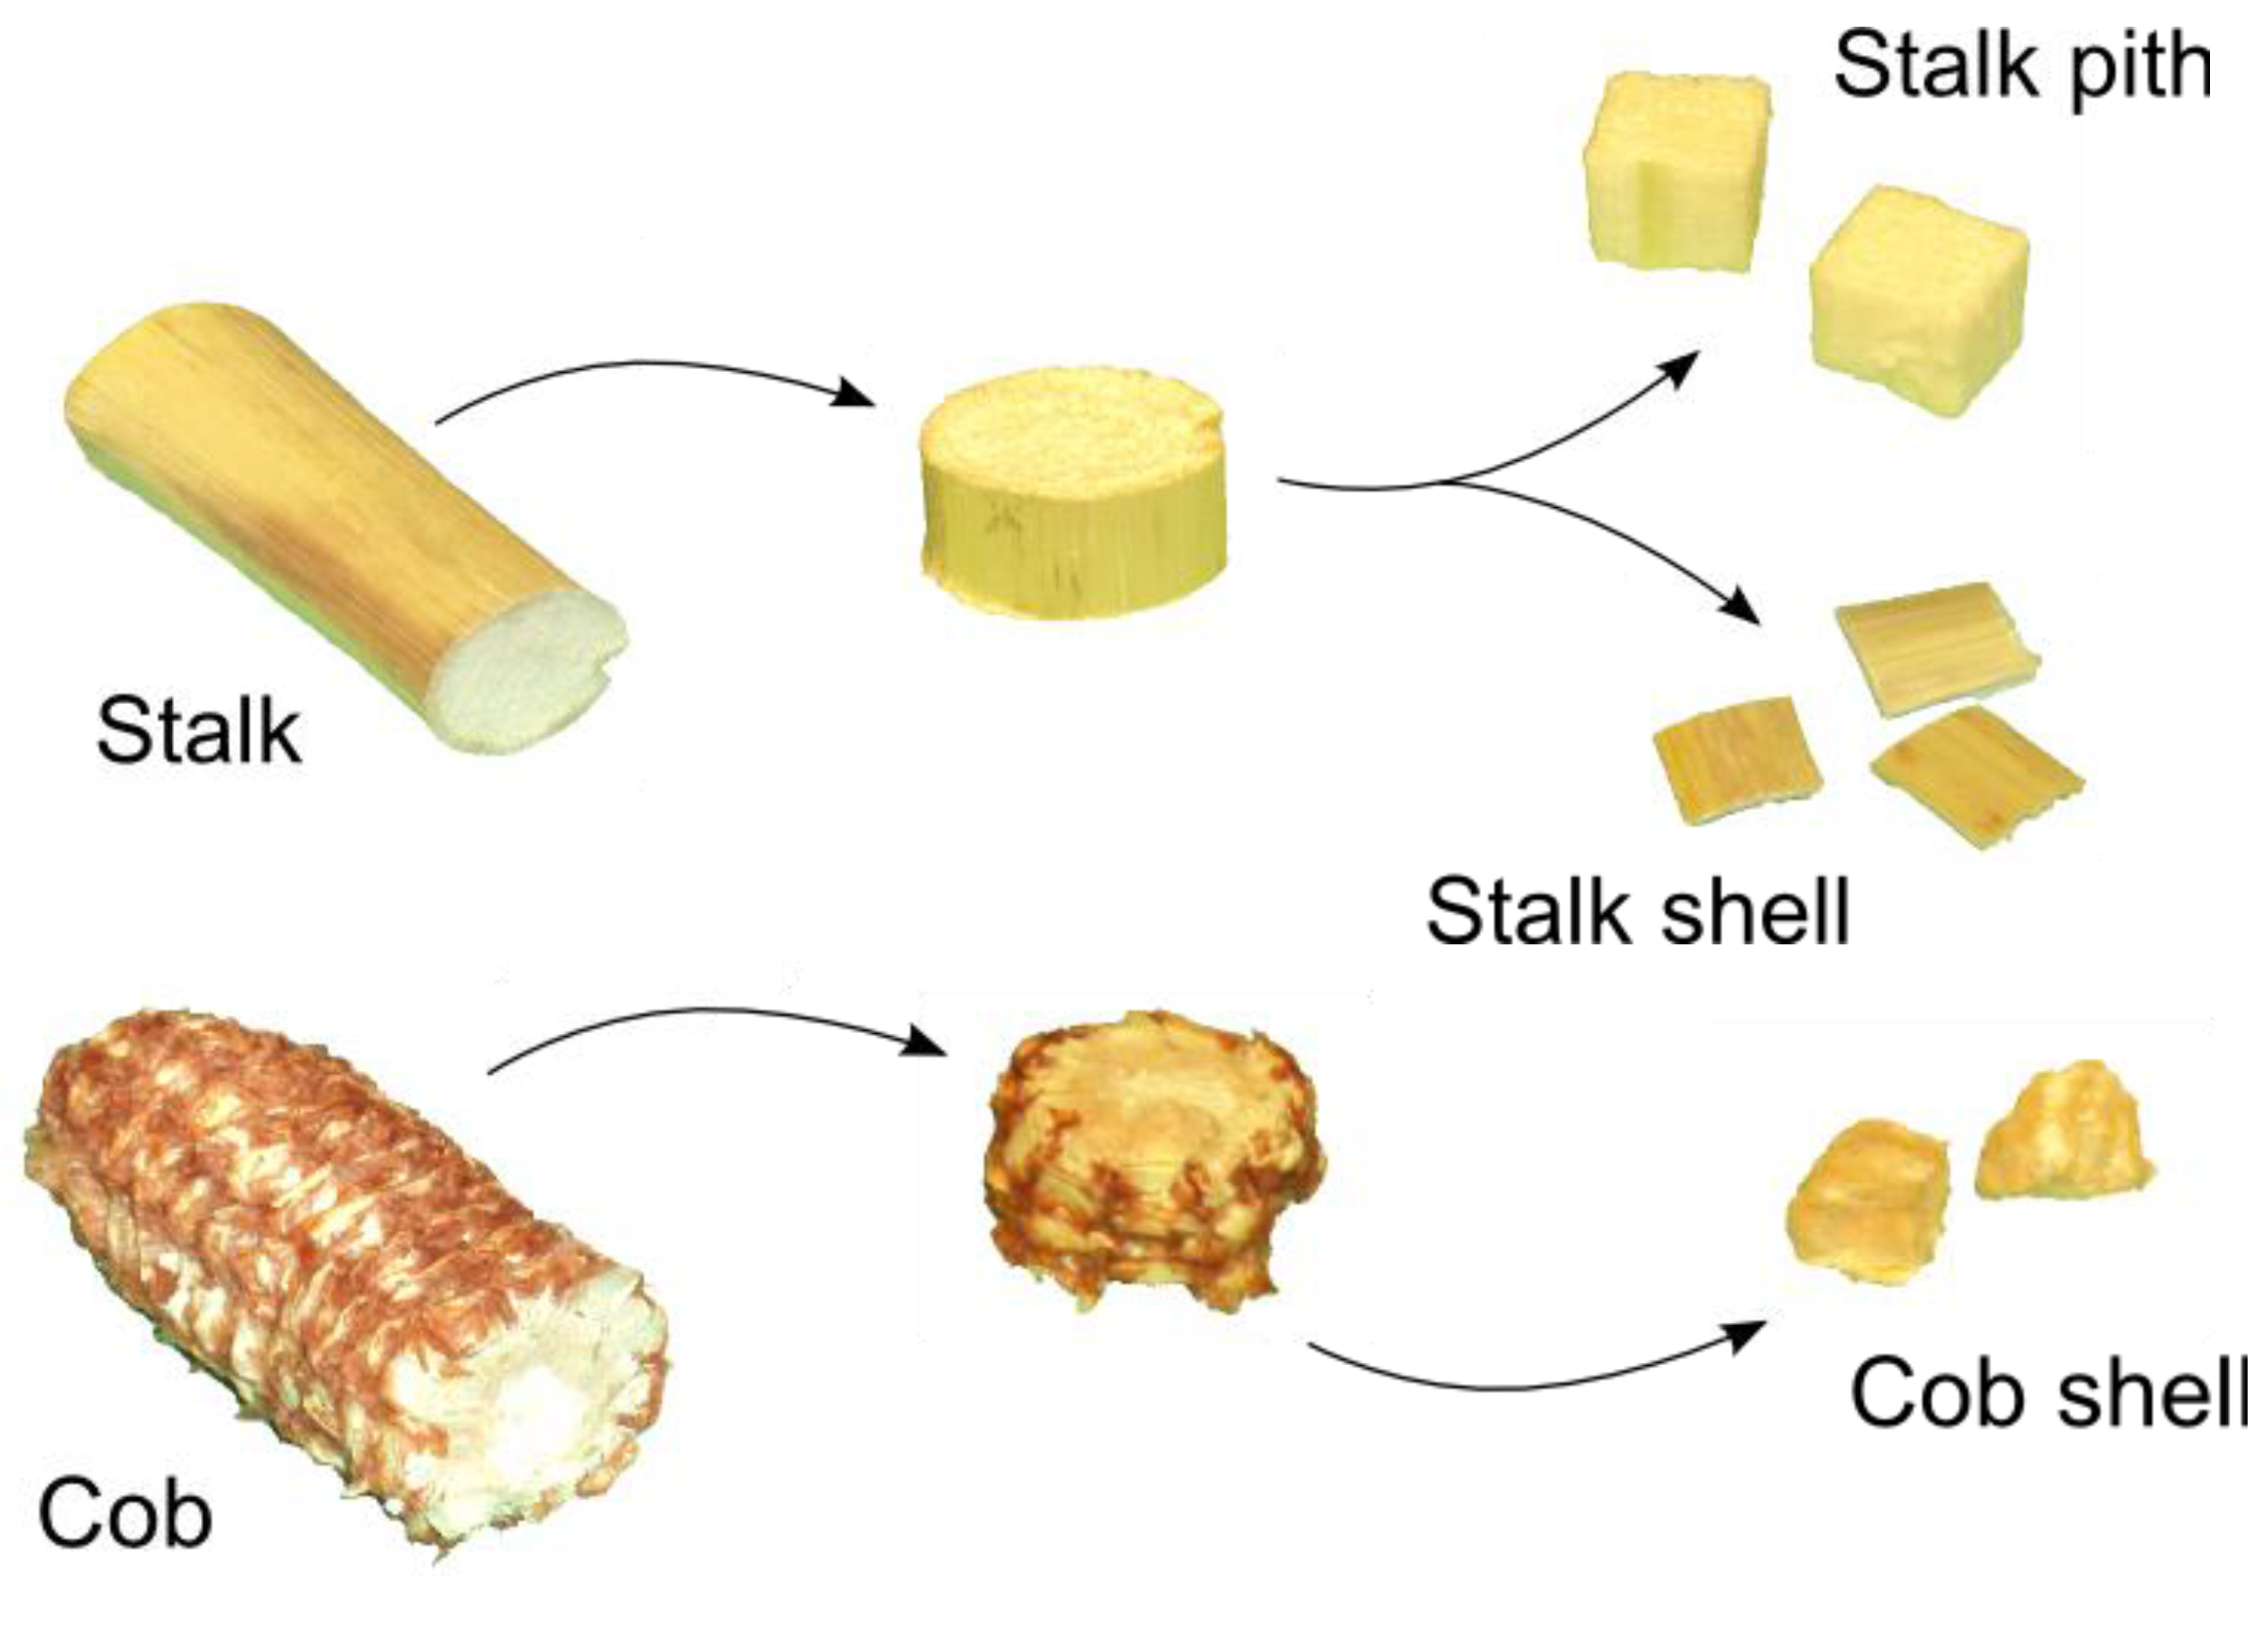
2.1. Corn Stover Samples

Corn stover biomass was harvested Fall 2010 from Iowa State University research fields located in Story County, IA, USA. The bulk wet samples were dried at 60 °C for 72 h immediately after the harvest. Dry samples were stored in a cooling chamber at a temperature below 5 °C to preserve their original quality and prevent microbial degradation.
A subsample of the bulk material was ground by hammer mill and sifted through an 850 µm sieve to obtain ground stover sample. Subsamples of corn stalk and cobs were handpicked from bulk corn stover samples. Stalks were cut into discs to enable separation of shell and pith. Cobs were also cut into discs and separated from the pith. Discs were cut further into 5 × 5 × 5 mm cubes by hand (Figure 1). Stalk shell samples were cut into 5 × 5 × 2 mm cuboid (Figure 1). The shape of cube was chosen for stalk pith and cob shell, because it is closest to a spherical shape. A spherical shape is preferable because it does not favor any dimension in the heat transfer process; however, since this shape is difficult to cut reliably, the cube was used. In addition, the natural geometry of stalk shell dictated its shape to be in a form of a cuboid prism. Finally, the largest sample size was obtained by handpicking stalks of about 20 mm diameter and cutting them into rods 100 mm long (Table 1).
Figure 1. Different corn stover components.
Energies 05 01199 g001
Table 1. Sample designation and basic properties.
FactorLevelDimensions (mm)Shape
Particle sizeGround stover<0.85Spherical
Whole stalk19 × 16 × 100Elliptic cylinder
Corn stover componentStalk shell5 × 5 × 2Prism
Stalk pith5 × 5 × 5Cube
Cob shell5 × 5 × 5Cube
Gas residence time1.2 s
12 s
60 s
All samples were dried at 60 °C for 72 h and stored in a desiccator until the torrefaction experiments were conducted. The moisture contents of samples before and after the experiments were determined according to the ASAE standard D358.2 for forage moisture measurement [30].

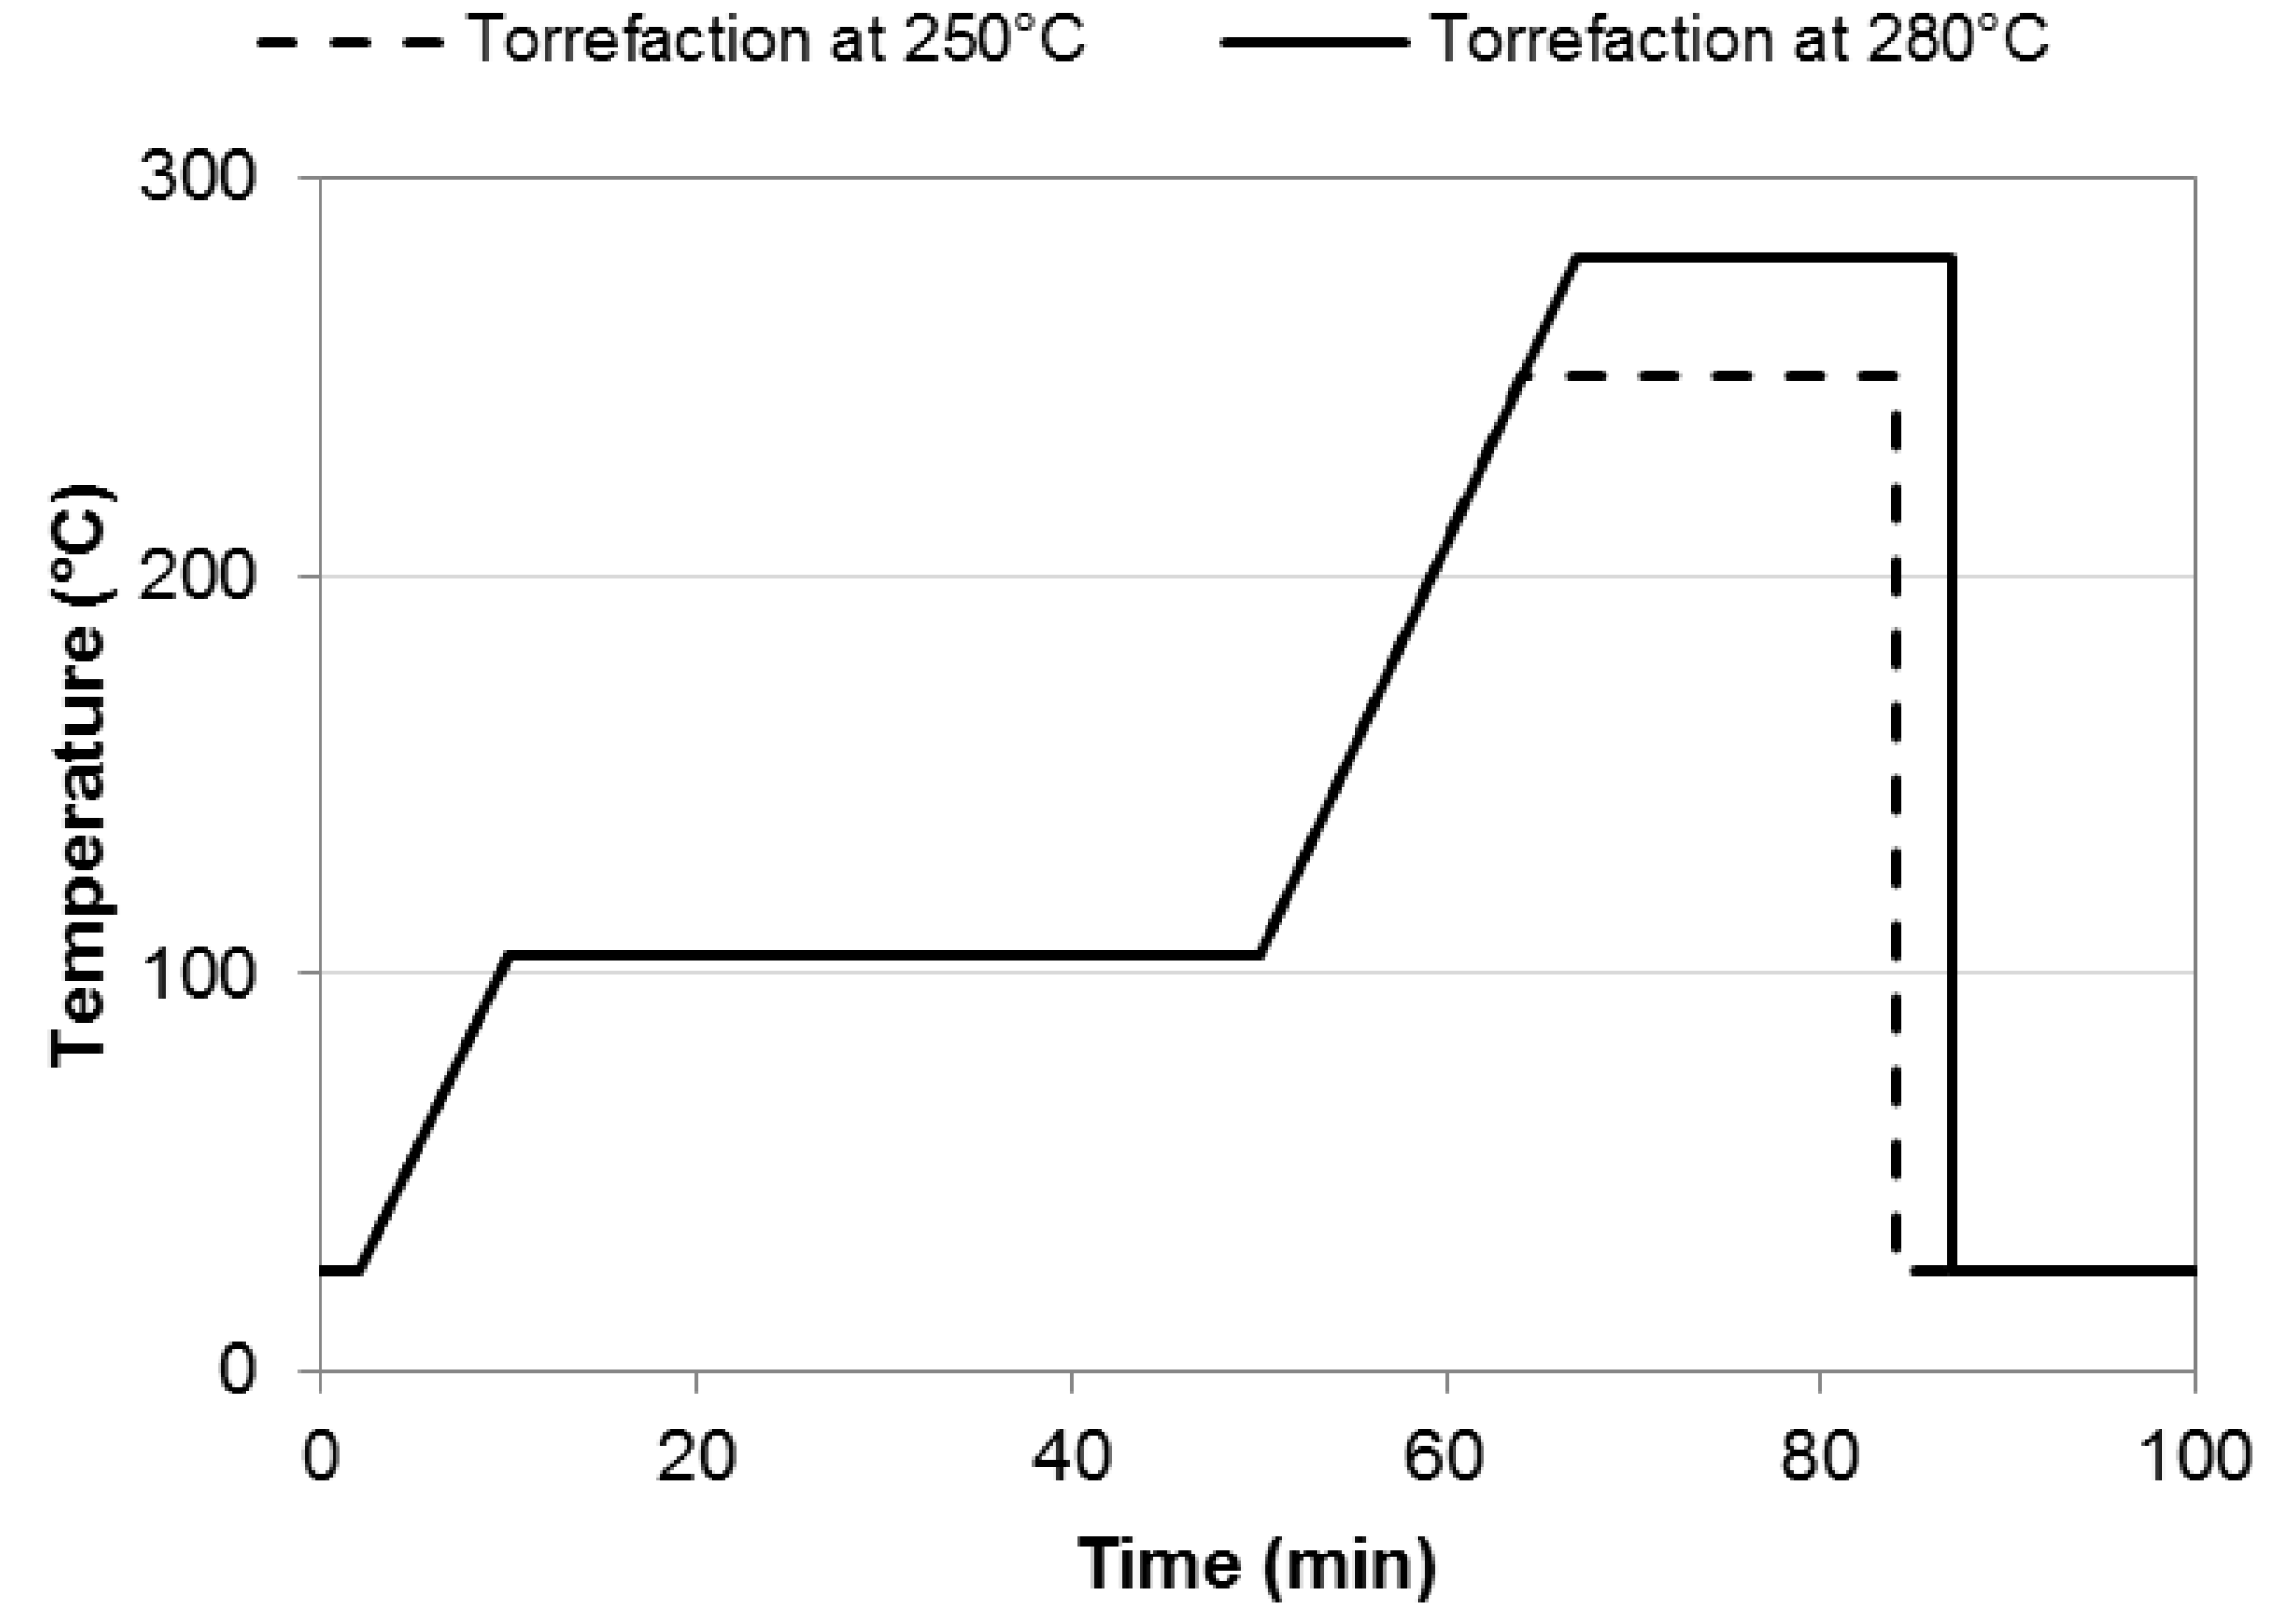
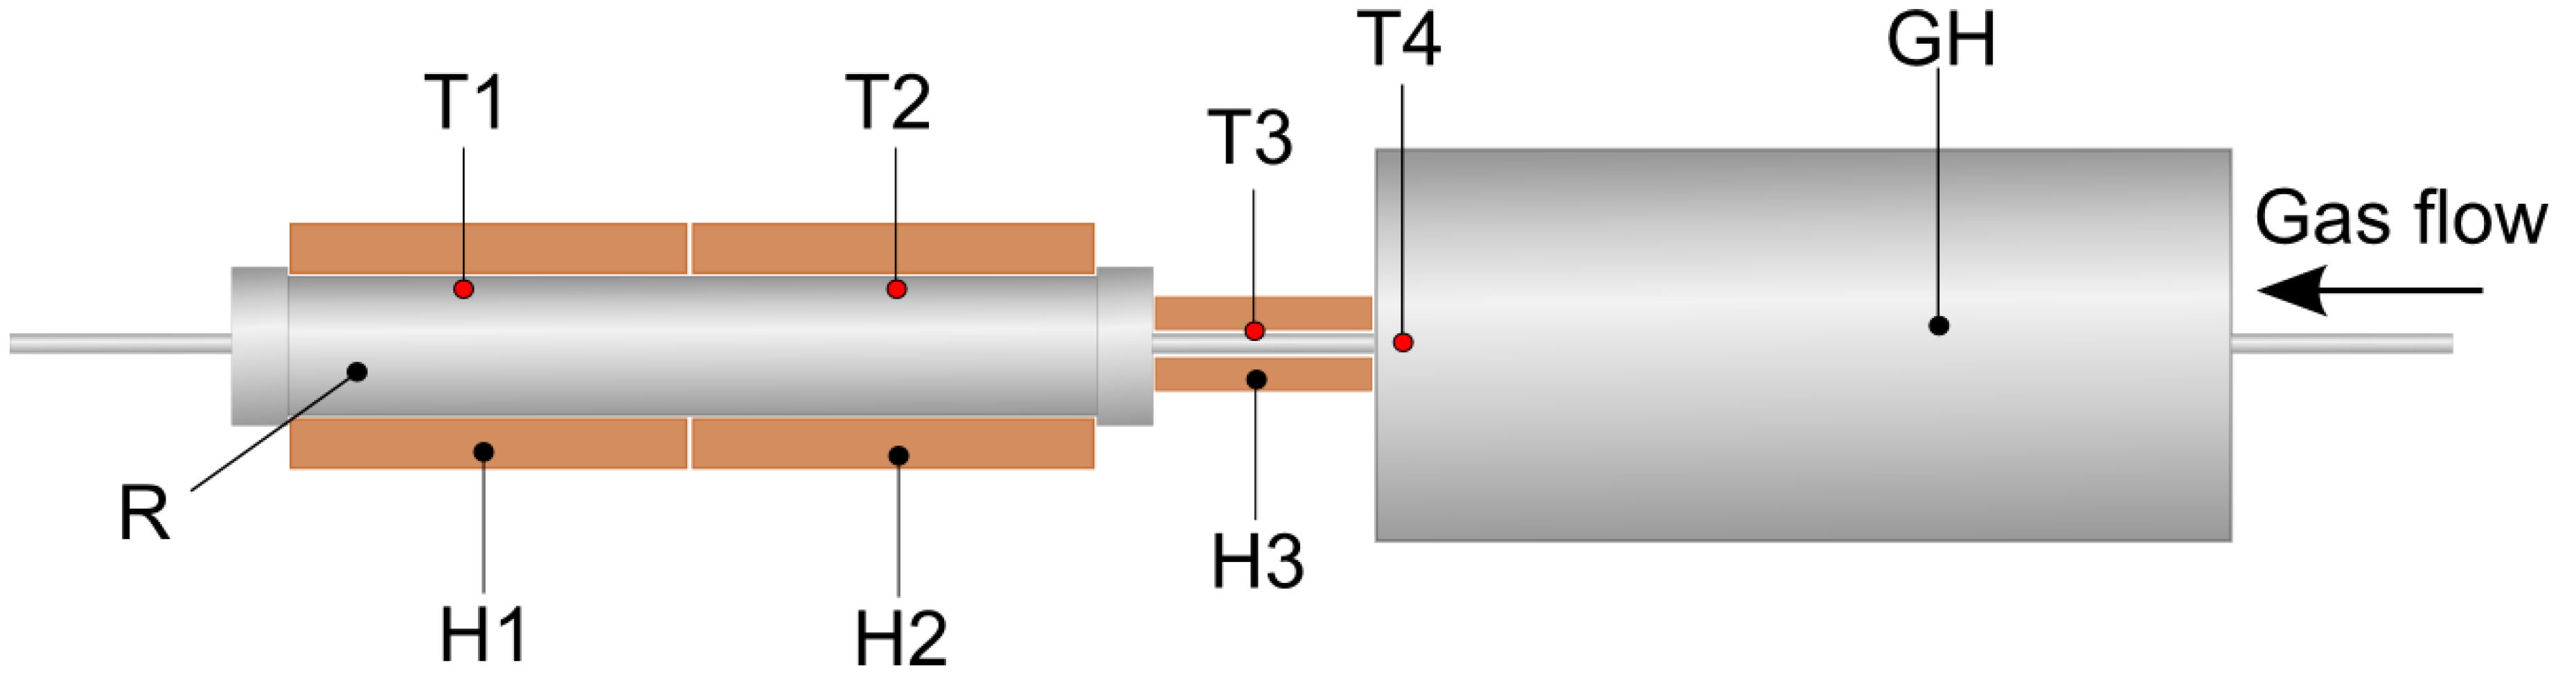
2.2. Torrefaction Experiments

Torrefaction of ground stover, stalk shell, stalk pith, and cob shell was conducted in a TGA (TGA/DSC Star System, Mettler-Toledo, Columbus, OH, USA) equipped with an autosampler. Experiments were done at 250 and 280 °C using two temperature time programs and 900 µL pans (Figure 2).
Figure 2. Temperature programs used to conduct torrefaction experiments in the TGA.
Energies 05 01199 g002
The drying phase at 105 °C was employed before torrefaction to eliminate the influence of water evaporation on DML during torrefaction. Both ramping phases employed a 10 °C/min heating rate. Torrefaction was conducted for 20 min, regardless of the torrefaction temperature. In order to register the correct sample weight after torrefaction, a final isothermal step at 25 °C was utilized. An inert atmosphere was maintained by means of nitrogen purge gas.
A stainless steel bench scale reactor was constructed to accommodate the largest particle size samples. The reactor was 20 mm in diameter and 120 mm in length. It was heated indirectly by two heaters controlled independently by PID controllers (Figure 3). This setup enabled the formation of two distinct heating zones for stable temperature control. Two thermocouples were used to sense the reactor temperature. Furthermore, preheated nitrogen purge gas was used to supply additional heat to the system and prevent temperature fluctuations. Samples were loaded into the reactor through the end farther from the gas heater. The reactor was purged with nitrogen for 5 min at flow rate of 1 L/min before every run. The samples were unloaded once the temperature in the reactor was below 100 °C, in the same manner as the loading procedure. The cooling phase from the torrefaction temperature to 200 °C took 7–9 min, depending on the torrefaction temperature. The torrefaction reaction is considered to start above 200 °C [23]. The reactor was purged with nitrogen at 1 L/min during the cooling phase to maintain a constant pressure, evenly cool the biomass, and terminate the torrefaction process. The weight of each whole stalk sample was about 1.5–1.6 g.
Figure 3. Bench scale reactor setup used in torrefaction experiments (R–reactor; GH–gas heater; H1, H2, H3–heaters; T1, T2, T3, T4–thermocouples; all thermocouples were positioned inside the respective unit of the system, except T3, which was positioned between the metal gas line and the heater).
Energies 05 01199 g003
The temperature profiles recorded during torrefaction experiments in the bench scale reactor at 250 and 280 °C are shown in Figure 4.
Figure 4. Temperature time profile of the bench scale reactor.
Energies 05 01199 g004
Each experiment was conducted in triplicate. The final solid products were recovered and further analyzed while volatile gases were not collected.

2.3. Chemical Analysis of Raw and Torrefied Biomass

Moisture, volatiles, ash, and fixed carbon contents of the raw biomass samples were determined using the same TGA that was used for torrefaction experiments, according to the modified ASTM D 5142-04 method [31]. The analysis was done under a nitrogen atmosphere (100 mL/min). Initially samples were heated to 105 °C at the heating rate of 5 °C/min and retained at 105 °C for 40 min to determine the moisture content. They were further heated at the rate of 5 °C/min to 900 °C and maintained at this temperature for 20 min to determine the quantity of the volatiles. Subsequently the environment was changed to oxidative by purging 100 mL/min of air for 30 min to determine the fixed carbon content. The remainder, after heating the sample under an oxidative atmosphere at 900 °C, was considered ash.
Elemental analyses of different raw and torrefied biomass samples were done using a CHNS/O analyzer (PerkinElmer 2400 Series II CHNS/O Analyzer, PerkinElmer, Waltham, MA, USA), according to the ASTM D 5373–08 method [32]. Biomass samples were dried in an oven at 103 °C for 24 h before the elemental analysis. Combustion and reduction were conducted at 925 and 650 °C under a helium atmosphere, respectively.
The HHV of raw and torrefied biomass samples were computed using Equation (1) developed by Sheng and Azevedo [33]. In Equation (1), C and H are the percentages of carbon and hydrogen in the biomass as determined by the ultimate analysis, and O is the percentage of oxygen determined by the difference, on both a dry and ash free basis (i.e., O (daf) = 100 − C − H − N − S):
HHV ( MJ/kg ) = 1.3675 + 0.3137 C + 0.7009 H + 0.0318 O
Compositional analyses of raw corn stover fractions were conducted to obtain the content of neutral detergent fiber (NDF), acid detergent fiber (ADF), and acid detergent lignin (ADL).The analyses were done according to AOAC Standards 973.18 and 2002.04 [34,35]. The hemicellulose and cellulose contents were calculated from the obtained NDF, ADF, ADL, and ash contents. The hemicellulose and cellulose contents were calculated as the difference between NDF and ADF, and ADF and ADL, respectively. Lignin was determined gravimetrically from ADL. The ash content was determined gravimetrically from the reminder after calcination of dry ADL in the muffle furnace.

2.4. Statistical Analysis

The experimental design used to accomplish the objectives of this work consisted of three factors. The torrefaction temperature factor consisted of two levels: 250 and 280 °C. The feedstock factor consisted of three levels: stalk shell and pith, and cob shell (Table 1). The gas residence time factor consisted of three levels: 1.2, 12, and 60 s. A statistical analysis was done to determine the significant difference between average DML, O/C (oxygen to carbon ratio), H/C (hydrogen to carbon ratio) HHV, and energy yields of torrefied biomass at a 95% confidence interval. Ground stover and whole stalk samples were analyzed separately from stalk shell, pith, and cob shell samples. A Tukey-Kramer Honestly Significant Difference (Tukey-Kramer HSD) test was conducted after performing a One-Way Analysis of Variance (ANOVA). The JMP statistical package from SAS (SAS Institute, Cary, NC, USA) was used for the statistical analysis of the experimental data.

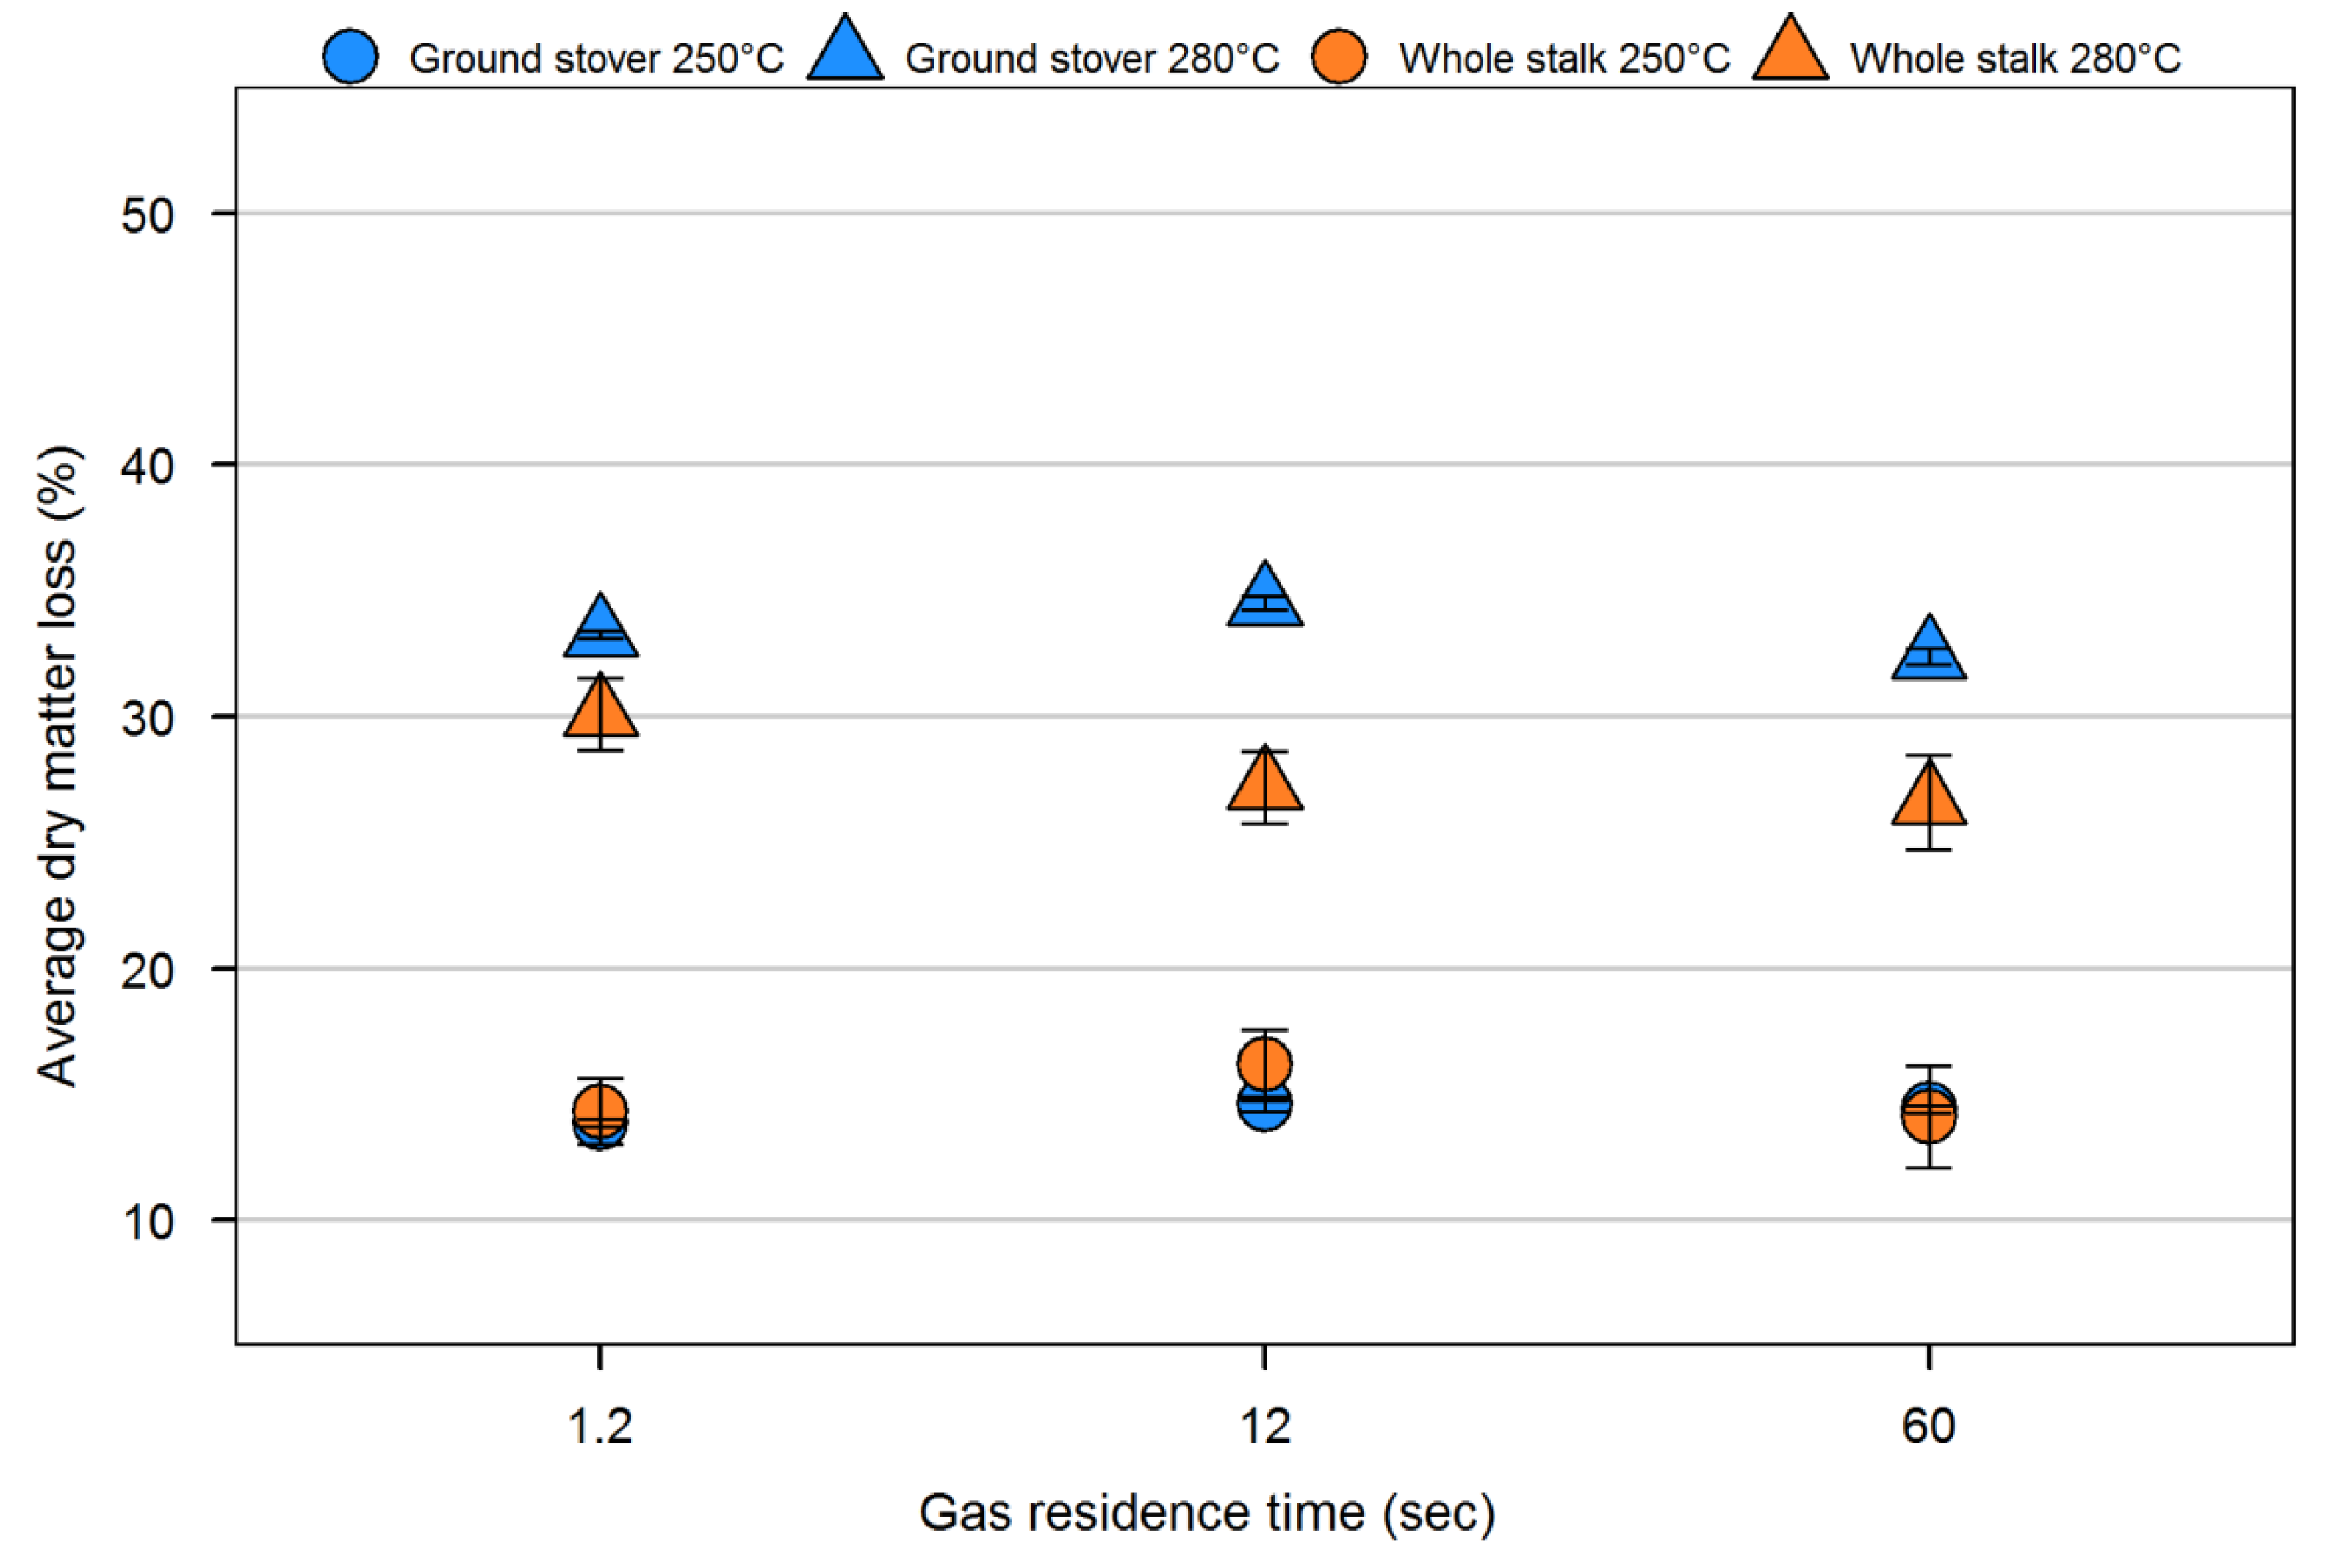
3. Results and Discussion

The average DML of ground stover and whole stover samples torrefied at 250 and 280 °C are shown in Figure 5. DML of the samples torrefied at 250 °C did not differ significantly, according to a Tukey-Kramer HSD test (not shown). This was probably due to a limited devolatilization of hemicellulose at this process temperature. Under these conditions the torrefaction reaction might be localized in the stalk shell of whole stover, but it is sufficient to cause DML similar to the smallest particle size. Products of the reaction in the pith of whole stover might condense and retain in the particle due to higher mass transfer resistance of the less porous stalk shell. At 280 °C there was a significant difference (p < 0.0001) between the ground stover and whole stover components’ DML of 2–5 percentage points, regardless of residence time. Under these conditions, the differences in the physical characteristics of two sample types significantly influence the torrefaction reaction. Devolatilization of hemicellulose in the shell of the whole stalk sample may not be sufficient to offset the limited devolatilization of the pith. Volatile gases, developed during the process and condensed in the particle, further deteriorate both the heat and mass transfer properties of whole stover samples. These aforementioned constraints in the transfer phenomena were less expressed in ground stover samples, which is why they had higher DML. As per the Tukey-Kramer HSD test, there was no significant difference in DML of ground stover and whole stover induced by gas residence time, regardless of the torrefaction temperature.
Figure 5. Average dry matter loss of torrefied ground stover and whole stalk samples (error bar = standard deviation).
Energies 05 01199 g005
The two anatomical fractions of corn stalk and corn cob showed different behavior under torrefaction reaction conditions (Figure 6). At 250 °C there was no significant difference in DML between cob shell and stalk pith samples. However, these two samples differed significantly from the stalk shell sample. Corn cob and stalk shell have the highest and the lowest hemicellulose content, respectively, among all corn stover fractions (Table 2). The same findings have been reported by Krull et al. [36] and Garlock et al. [37]. Cob shell particle density, approximately 350 kg/m3, is comparable to stalk shell density, and much higher than stalk pith density, approximately 40 kg/m3, (Table 2). Therefore, the torrefaction reaction at 250 °C might not be intensive enough to cause significant devolatilization of stalk shell samples due to their lower hemicellulose content and high particle density. The high content of reactive hemicellulose in cob shell makes it prone to higher DML during torrefaction. Nonetheless, the high particle density of cob shell increases the resistance to heat and mass transfer, thus preventing excessive DML by limiting hemicellulose’s exposure to high temperatures. Stalk pith, on the other hand, has a lower hemicellulose content and lower particle density. Therefore, even though the hemicellulose present in stalk pith is more exposed to high temperatures, its low content limits DML. The opposite effect of hemicellulose content and particle density might be the reason for the same DML of cob shell and stalk pith at 250 °C.
Figure 6. Average dry matter loss of torrefied stalk shell, stalk pith, and cob shell (error bar = standard deviation).
Energies 05 01199 g006
At 280 °C there was no significant difference between cob shell and stalk shell, but these two samples differed significantly from stalk pith. Heat and mass transfer might be more significant factors once most of the hemicellulose was degraded at 280 °C and devolatilization of cellulose and lignin had started. As can be seen in Figure 6, stalk pith, which offers less resistance to heat/mass transfer, has a DML approximately 15 percentage points higher than the other two corn stover fractions. Furthermore, there were no significant differences in DML of stalk shell, stalk pith, and cob shell due to different gas residence times, regardless of torrefaction process temperatures.
Differences between the carbon, nitrogen, sulfur, hydrogen, and oxygen contents of biomass samples were not statistically analyzed. Instead the O/C ratio and HHV were analyzed using the Tukey-Kramer HSD test to determine their significant differences (not shown in Table 3). According to statistical analysis, the O/C ratio of ground stover and whole stalk were significantly different, (p ≤ 0.002), regardless of the temperature. The difference was about 9 and 5 percentage points at 250 and 280 °C, respectively. Stalk pith had the highest O/C, 1.06 and 0.88 at 250 and 280 °C, respectively. Cob shell had the lowest O/C, 0.77 and 0.66 at 250 and at 280 °C, respectively.
Table 2. Proximate analysis of raw corn stover biomass.
SampleVolatiles (%)Fixed carbon (%)Ash (%)Particle density (kg/m3)Fiber composition (%)
CelluloseHemicelluloseLigninOther
Ground stover77.05 ± 0.2217.56 ± 0.015.45 ± 0.33-43.3 ± 0.532.3 ± 0.16.3 ± 0.418.03 ± 0.0
Stalk shell75.43 ± 0.2021.31 ± 0.003.18 ± 0.06444.61 ± 48.3956.6 ± 0.215.2 ± 1.013.5 ± 0.115.62 ± 1.3
Stalk pith80.57 ± 1.2713.89 ± 1.135.49 ± 0.1234.93 ± 6.6657.6 ± 0.421.3 ± 1.86.1 ± 0.614.40 ± 0.8
Cob shell76.88 ± 2.4318.96 ± 2.244.13 ± 0.27357.40 ± 47.8445.2 ± 0.338.3 ± 1.110.3 ±0.07.17 ± 1.4
Whole stover76.74 ± 0.8717.20 ± 0.733.86 ± 0.17116.48 ± 18.0256.2 ± 1.817.6 ± 1.011.6 ± 0.814.60 ± 0.0
All values are expressed on dry basis as a mean of two measurements ± standard deviation.
Table 3. Elemental analysis and HHV of biomass samples.
SampleTorrefaction temperature (°C)Gas residence time (s)C (wt %)H (wt %)N (wt %)S (wt %)O (wt %)O/CH/CHHV (MJ/kg)
Ground stover2501.245.76 ± 0.375.99 ± 0.130.62 ± 0.060.36 ± 0.1047.28 ± 0.431.03 ± 0.020.13 ± 0.0118.68 ± 0.14
1245.78 ± 1.085.27 ± 1.200.46 ± 0.080.32 ± 0.0848.17 ± 2.421.05 ± 0.080.11 ± 0.0018.85 ± 1.10
6046.27 ± 0.225.81 ± 0.240.63 ± 0.060.56 ± 0.0346.73 ± 0.131.01 ± 0.010.12 ± 0.0218.70 ± 0.11
2801.249.59 ± 0.255.56 ± 0.080.65 ± 0.100.33 ± 0.0843.86 ± 0.310.88 ± 0.020.11 ± 0.0019.48 ± 0.07
1250.21 ± 0.105.57 ± 0.070.70 ± 0.070.39 ± 0.0543.13 ± 0.090.86 ± 0.000.13 ± 0.0019.66 ± 0.02
6050.35 ± 0.315.45 ± 0.080.71 ± 0.050.36 ± 0.0343.14 ± 0.290.85 ± 0.010.11 ± 0.0019.61 ± 0.10
Raw-44.84 ± 0.706.32 ± 0.070.46 ± 0.150.12 ± 0.0348.26 ± 0.671.08 ± 0.030.14 ± 0.0018.66 ± 0.24
Stalk shell2501.248.76 ± 0.185.75 ± 0.210.19 ± 0.020.23 ± 0.1645.06 ± 0.300.92 ± 0.010.12 ± 0.0019.39 ± 0.18
1248.35 ± 0.685.77 ± 0.200.19 ± 0.010.31 ± 0.1745.38 ± 1.000.94 ± 0.030.10 ± 0.0019.45 ± 0.30
6048.60 ± 0.375.67 ± 0.060.14 ± 0.020.36 ± 0.4445.22 ± 0.830.93 ± 0.020.12 ± 0.0019.29 ± 0.12
2801.253.97 ± 1.305.54 ± 0.190.16 ± 0.050.66 ± 0.7139.67 ± 1.130.74 ± 0.040.09 ± 0.0120.70 ± 0.25
1255.83 ± 0.385.29 ± 0.140.32 ± 0.060.24 ± 0.1438.32 ± 0.320.69 ± 0.010.12 ± 0.0121.07 ± 0.20
6053.78 ± 0.625.37 ± 0.040.15 ± 0.040.40 ± 0.4340.30 ± 1.010.75 ± 0.030.11 ± 0.0120.54 ± 0.14
Raw-47.87 ± 0.066.28 ± 0.070.04 ± 0.030.10 ± 0.0445.72 ± 0.150.95 ± 0.010.13 ± 0.0019.50 ± 0.05
Stalk pith2501.246.40 ± 0.065.48 ± 0.050.33 ± 0.120.15 ± 0.0247.64 ± 0.041.03 ± 0.000.12 ± 0.0018.54 ± 0.06
1245.61 ± 0.545.58 ± 0.140.31 ± 0.040.18 ± 0.0248.32 ± 0.451.06 ± 0.020.10 ± 0.0118.46 ± 0.14
6045.18 ± 0.085.34 ± 0.090.26 ± 0.050.08 ± 0.0549.14 ± 0.081.09 ± 0.000.12 ± 0.0118.10 ± 0.08
2801.249.99 ± 0.674.77 ± 0.180.46 ± 0.070.11 ± 0.0744.67 ± 0.570.90 ± 0.020.10 ± 0.0119.07 ± 0.12
1251.27 ± 1.315.02 ± 0.290.47 ± 0.230.12 ± 0.0343.13 ± 1.410.84 ± 0.050.12 ± 0.0019.60 ± 0.53
6049.89 ± 0.404.75 ± 0.120.54 ± 0.300.02 ± 0.0144.79 ± 0.570.90 ± 0.020.10 ± 0.0119.04 ± 0.03
Raw-44.69 ± 0.775.93 ± 0.120.12 ± 0.010.16 ± 0.0749.10 ± 0.831.10 ± 0.040.13 ± 0.0018.36 ± 0.30
Cob shell2501.252.74 ± 0.135.80 ± 0.010.51 ± 0.250.18 ± 0.0340.77 ± 0.260.77 ± 0.010.11 ± 0.0020.54 ± 0.04
1253.23 ± 0.836.07 ± 0.140.29 ± 0.010.19 ± 0.0240.22 ± 0.940.76 ± 0.030.10 ± 0.0020.67 ± 0.33
6052.42 ± 0.405.68 ± 0.050.31 ± 0.060.10 ± 0.0241.49 ± 0.410.79 ± 0.010.11 ± 0.0120.37 ± 0.10
2801.256.52 ± 0.305.48 ± 0.090.40 ± 0.040.05 ± 0.0337.56 ± 0.200.66 ± 0.010.10 ± 0.0121.39 ± 0.03
1256.44 ± 0.695.86 ± 0.100.41 ± 0.030.18 ± 0.0437.11 ± 0.620.66 ± 0.020.11 ± 0.0021.62 ± 0.15
6056.12 ± 0.485.41 ± 0.050.37 ± 0.070.05 ± 0.0438.05 ± 0.540.68 ± 0.020.10 ± 0.0121.23 ± 0.14
Raw-47.15 ± 0.146.25 ± 0.020.10 ± 0.040.08 ± 0.0446.41 ± 0.210.98 ± 0.010.13 ± 0.0019.28 ± 0.04
Whole stover2501.247.96 ± 0.415.83 ± 0.350.30 ± 0.080.26 ± 0.0445.65 ± 0.670.95 ± 0.020.12 ± 0.0119.21 ± 0.33
1248.36 ± 1.275.73 ± 0.110.41 ± 0.030.25 ± 0.0245.25 ± 1.330.94 ± 0.060.11 ± 0.0019.25 ± 0.39
6047.78 ± 1.005.98 ± 0.120.30 ± 0.040.29 ± 0.1245.65 ± 0.930.95 ± 0.040.12 ± 0.0019.26 ± 0.34
2801.252.57 ± 0.955.42 ± 0.230.40 ± 0.110.32 ± 0.1041.30 ± 0.950.79 ± 0.030.11 ± 0.0020.23 ± 0.22
1251.83 ± 0.825.68 ± 0.140.35 ± 0.010.23 ± 0.0341.90 ± 0.940.81 ± 0.030.12 ± 0.0120.20 ± 0.31
6050.94 ± 0.315.72 ± 0.130.29 ± 0.040.27 ± 0.0442.77 ± 0.350.84 ± 0.010.11 ± 0.0119.98 ± 0.17
Raw-47.95 ± 0.236.18 ± 0.020.14 ± 0.060.16 ± 0.0245.63 ± 0.250.95 ± 0.010.13 ± 0.0019.45 ± 0.08
All values are expressed on dry basis as a mean of two measurements ± standard deviation.
The reason for the decrease in the O/C ratio during torrefaction is the generation of volatiles rich in oxygen such as CO2 and H2O [20,24]. Apart from the higher initial value of the O/C ratio, the highest O/C value of corn pith after torrefaction might be due to devolatilization of cellulose and lignin, in addition to hemicellulose. Therefore, the O/C ratio did not change significantly since both C and O were lost in comparable quantities through devolatilization.
The differences between the O/C ratios due to gas residence time were not significant, regardless of temperature. According to statistical analysis, there was no significant difference (p ≥ 0.2766) between the H/C ratios of ground stover and whole stalk, regardless of temperature. This is a consequence of the limited change in hydrogen content when compared to the change in carbon content. The former was less than 1 percentage point, while the latter was up to 6 percentage points. Cob shell had a significantly lower H/C ratio (p < 0.0001) than stalk pith and shell at 250 °C, which correlates to a higher loss of hydrogen than carbon, probably through the elimination of organics, such as acetic acid and methanol [20]. However, the absolute difference between the average C/H ratio of cob shell, and stalk shell and pith was only 0.008 percentage points. There was not any significant difference (p > 0.3105) between these samples at 280 °C, where the absolute difference was 0.003 percentage points. The gas residence time did not have any significant effect on H/C ratio, regardless of torrefaction temperature, particle size or corn stover component. The contents of nitrogen and sulfur remained almost constant and did not show any trend regardless of particle size, corn stover component, or gas residence time. Moreover, these two elements are present in very limited amounts and do not significantly contribute to the energy density of the biomass.
Ash content of the raw biomass samples (Table 2) was used to compute the ash content of torrefied biomass using Equation (2). Furthermore, the ash content of torrefied biomass was used to compute HHV on an ash free basis (Table 3):
Ash Torrefied biomass ( % db ) = Ash Raw biomass ( % db ) 100 DML ( % db ) 100
where db = dry basis.
HHV followed a trend opposite to the O/C ratio (Table 3). All samples were significantly different (p ≤ 0.0065) regardless of torrefaction temperature. Whole stalk samples had a higher HHV than ground stover by approximately 0.7 and 0.5 MJ/kg at 250 and 280 °C, respectively. Cob shell had the lowest O/C ratio and consequently had the highest HHV of 20.6 and 21.5 MJ/kg at 250 and 280 °C, respectively. Stalk pith had the lowest values of 18.3 and 19.23 MJ/kg at 250 and 280 °C, respectively. The HHV of the samples at distinct gas residence time levels was not significantly different (p ≥ 0.5520), regardless of the torrefaction temperature. The average energy yields of the torrefied samples are shown in Figure 7 and Figure 8. Yields were computed using Equation (3):
Energy yield ( % ) = ( m torrefied m raw ) db ( HHV torrefied HHV raw ) db 100
The Tukey-Kramer HSD test was conducted to determine the significant differences between torrefied samples. According to the statistical analysis, the ground stover and whole stover samples torrefied at 250 °C were not significantly different; however, the samples did show a significant difference of approximately 6 percentage points at 280 °C (Figure 7). Energy yields followed a trend opposite to DML. This is probably due to a large change in DML that could not be offset by the change in HHV of torrefied samples. Gas residence times did not show any significant effect on the energy yield as revealed by statistical analysis. This is in accordance with the effect of gas residence time on DML and HHV.
Figure 7. Average energy yield of torrefied ground stover and whole stalk samples (error bar = standard deviation).
Energies 05 01199 g007
Figure 8. Average energy yield of torrefied stalk shell, stalk pith, and cob shell samples (error bar = standard deviation).
Energies 05 01199 g008
Average energy yields of stalk shell and cob shell were not significantly different at both 250 and 280 °C (Figure 8). The absence of any difference between these two samples at 250 °C was caused by a larger HHV of cob shell than stalk shell, which offset the difference in DML. However, these two samples had energy yields different from stalk pith samples, regardless of temperature. The energy yield of stalk pith was approximately 6 and 15 percentage points lower than the energy yields of stalk shell and cob shell at 250 and 280 °C, respectively. There was no difference between average energy yields due to gas residence time, regardless of sample type.

4. Conclusions

The effects of corn stover particle size and fraction type, as well as gas residence times on torrefaction were investigated through the analysis of DML, energy yield, and chemical properties of torrefied biomass. Torrefaction of ground corn stover at 280 °C induced higher DML than torrefaction of the whole stalk. The whole corn stalk had higher HHV and energy yield values, probably due to its different fiber composition and less energy lost through devolatilization. In general, stalk pith and stalk shell had respectively the highest and the lowest DML, regardless of the torrefaction temperature. Stalk pith and cob shell had the lowest and the highest HHV, respectively. The energy yield of stalk pith was the lowest at both 250 and 280 °C. Furthermore, the energy yield of stalk shell was the highest but not significantly different than cob shell, regardless of temperature. The difference in the behavior of corn stover fractions was the consequence of different physical characteristics and fiber composition. Gas residence time did not have any significant effect on DML, HHV, and energy yield.

Acknowledgments

This research project was supported by funding provided by the ConocoPhillips Company. Additional technical support was provided by the Center for Sustainable Energy (CSET) and Biocentury Research Farm (BCRF) of Iowa State University, Ames, IA. We would also like to thank Patrick Johnston for his contribution to this work.

References

  1. The Energy Independence and Security Act of 2007. Available online: http://www.energy.wsu.edu/documents/EnergyIndependenceAndSecurityActOf2007.pdf (accessed on 22 April 2012).
  2. Feng, Y.; Xiao, B.; Goerner, K.; Cheng, G.; Wang, J. Influence of particle size and temperature on gasification performance in externally heated gasifier. Smart Grid Renew. Energy 2011, 2, 158–164. [Google Scholar] [CrossRef]
  3. Luo, S.; Xiao, B.; Guo, X.; Hu, Z.; Liu, S.; He, M. Hydrogen-rich gas from catalytic steam gasification of biomass in a fixed bed reactor: Influence of particle size on gasification performance. Int. J. Hydrog. Energy 2009, 34, 1260–1264. [Google Scholar] [CrossRef]
  4. Moghiman, M.; Hashemi, T.; Zahmatkesh, I.; Daghighi, Y. Effects of particle size and equivalence ratio on cyclone gasification of wood powder. J. Energy Inst. 2007, 80, 29–34. [Google Scholar] [CrossRef]
  5. Shen, J.; Wang, X.-S.; Garcia-Perez, M.; Mourant, D.; Rhodes, M.J.; Li, C.-Z. Effects of particle size on the fast pyrolysis of oil mallee woody biomass. Fuel 2009, 88, 1810–1817. [Google Scholar] [CrossRef]
  6. Gaston, K.R.; Jarvis, M.W.; Pepiot, P.; Smith, K.M.; Frederick, W.J.; Nimlos, M.R. Biomass pyrolysis and gasification of varying particle sizes in a fluidized-bed reactor. Energy Fuel 2011, 25, 3747–3757. [Google Scholar] [CrossRef]
  7. Zhu, W.; Song, W.; Lin, W. Effect of the coal particle size on pyrolysis and char reactivity for two types of coal and demineralized coal. Energy Fuel 2008, 22, 2482–2487. [Google Scholar] [CrossRef]
  8. Bergman, P.C.A.; Boersma, A.R.; Kiel, J.H.A.; Prins, M.J.; Ptasinski, K.J.; Janssen, F.J.J.G. Torrefaction for entrained-flow gasification of biomass. ECN-C-05-067; ECN: Petten, The Netherlands, 2005. [Google Scholar]
  9. Paulrud, S.; Mattson, J.E.; Nilsson, C. Particle and handling characteristics of wood fuel powder: Effects of different mills. Fuel Process. Technol. 2002, 76, 23–39. [Google Scholar] [CrossRef]
  10. Lu, H.; Ip, E.; Scott, J.; Foster, P.; Vickers, M.; Baxter, L.L. Effects of particle shape and size on devolatilization of biomass particle. Fuel 2010, 89, 1156–1168. [Google Scholar] [CrossRef]
  11. Neathery, J.K. Biomass Gasification. In Thermochemical Conversion of Biomass to Liquid Fuels and Chemicals; Crocker, M., Ed.; Blackwell Publishing Professional: Ames, IA, USA, 2007; pp. 67–94. [Google Scholar]
  12. Antal, M.J.; Gronli, M. The art, science, and technology of charcoal production. Ind. Eng. Chem. Res. 2003, 42, 1619–1640. [Google Scholar] [CrossRef]
  13. Antal, M.J.; Croiset, E.; Dai, X.; DeAlmeida, C.; Shu-lai Mok, W.; Norberg, N. High-yield biomass charcoal. Energy Fuels 1996, 10, 652–658. [Google Scholar] [CrossRef]
  14. Klass, D.L. Biomass for Renewable Energy, Fuels and Chemicals; Academic Press: San Diego, CA, USA, 1998. [Google Scholar]
  15. Arias, B.; Pevida, C.; Fermoso, J.; Plaza, M.G.; Rubeira, F.; Pis, J.J. Influence of torrefaction on the grindability and reactivity of woody biomass. Fuel Process. Technol. 2008, 89, 169–175. [Google Scholar] [CrossRef]
  16. Yan, W.; Acharjee, T.C.; Coronella, C.J.; Vaquez, R.V. Thermal pretreatment of lignocellulosic biomass. Environ. Prog. Sustain. Energy 2009, 28, 435–440. [Google Scholar] [CrossRef]
  17. Bergman, P.C.A.; Boersma, A.R.; Zwart, R.W.R.; Kiel, J.H.A. Torrefaction for biomass co-firing in existing coal-fired power stations. ECN-C-05-013; ECN: Petten, The Netherlands, 2005. [Google Scholar]
  18. Biomass Research and Development Initiative (BRDI). Roadmap for Bioenergy and Biobased Products in the United States. Available online: http://www1.eere.energy.gov/biomass/pdfs/obp_roadmapv2_web.pdf (accessed on 22 April 2012).
  19. Bridgeman, T.G.; Jones, J.M.; Shield, I.; Williams, P.T. Torrefaction of reed canary grass, wheat straw and willow to enhance solid fuel qualities and combustion properties. Fuel 2008, 87, 844–856. [Google Scholar] [CrossRef]
  20. Medic, D.; Darr, M.; Shah, A.; Potter, B.; Zimmerrnan, J. Effects of torrefaction process parameters on biomass feedstock upgrading. Fuel 2011, 91, 147–154. [Google Scholar] [CrossRef]
  21. Shah, A.; Darr, M.; Medic, D.; Anex, R.; Khanal, S.; Maski, D. Techno-economic analysis of a production-scale torrefaction system for cellulosic biomass upgrading. Biofuels Bioprod. Biorefin. 2012, 6, 45–57. [Google Scholar] [CrossRef]
  22. Medic, D.; Darr, M.; Shah, A.; Rahn, S. Effect of torrefaction on water vapor adsorption properties and resistance to microbial degradation of corn stover. Energy Fuels 2012. [Google Scholar] [CrossRef]
  23. Chen, W.-H.; Kuo, P.-C. Torrefaction and co-torrefaction characterization of hemicellulose, cellulose and lignin as well as of some basic constituents in biomass. Energy 2011, 36, 803–811. [Google Scholar] [CrossRef]
  24. Prins, M.J.; Ptasinski, K.J.; Janssen, F.J.J.G. Torrefaction of wood. Part 2. Analysis of products. J. Anal. Appl. Pyrol. 2006, 77, 35–40. [Google Scholar] [CrossRef]
  25. Ciolkosz, D.; Wallace, R. A review of torrefaction for bioenergy feedstock production. Biofuels, Bioprod. Biorefin. 2011, 5, 317–329. [Google Scholar] [CrossRef]
  26. van der Stelt, M.J.C.; Gerhauser, H.; Kiel, J.H.A.; Ptasinski, K.J. Biomass upgrading by torrefaction for the production of biofuels: A review. Biomass. Bioenergy 2011, 35, 3748–3762. [Google Scholar]
  27. Bergman, P.C.A. Combined Torrefaction and Pelletization: ECN-C-05-073; ECN: Petten, The Netherlands, 2005. [Google Scholar]
  28. Couhert, C.; Salvador, S.; Commandre, J.-M. Impact of torrefaction on sygas production from wood. Fuel 2009, 88, 2286–2290. [Google Scholar] [CrossRef]
  29. Prins, M.J.; Ptasinski, K.J.; Janssen, F.J.J.G. Torrefaction of wood. Part 1. Weight Loss Kinetics. J. Anal. Appl. Pyrol. 2006, 77, 28–34. [Google Scholar] [CrossRef]
  30. ASAE standard D358.2 (R2008). In Moisture Measurement—Forages; American Society of Agricultural Engineers: St. Joseph, MI, USA, 1998.
  31. ASTM D 5142-04. In Standard Test Method for Proximate Analysis of the Analysis Sample of Coal and Coke by Instrumental Procedures; ASTM International: West Conshohocken, PA, USA, 2008.
  32. ASTM D 5373-08. In Standard Test Method for Instrumental Determination of Carbon, Hydrogen and Nitrogen in Laboratory Samples of Coal; ASTM International: West Conshohocken, PA, USA, 2008.
  33. Sheng, C.; Azevedo, J.L.T. Estimating the higher heating value of biomass fuels from basic analysis data. Biomass Bioenergy 2005, 28, 499–507. [Google Scholar] [CrossRef]
  34. AOAC Standard 973.18. In Fiber (Acid Detergent) and Lignin in Animal Feeds; Association of Official Analytical Chemists: Gaithersburg, MD, USA, 1990.
  35. AOAC Standard 2002.04. In Gravimetric Determination of Amylase-Treated Neutral Detergent Fiber in Feeds Using Refluxing in Beaker or Crucibles; Association of Official Analytical Chamists: Gaithersburg, MD, USA, 2002.
  36. Krull, L.H.; Inglett, G.E. Analysis of neutral carbohydrate in agricultural residues by gas-liquid chromatography. J. Agric. Food Chem. 1980, 28, 917–919. [Google Scholar] [CrossRef] [PubMed]
  37. Garlock, R.J.; Chundawat, S.P.; Balan, V.; Dale, B.E. Optimizing harvest of cont stover fractions based on overall sugar yields following ammonia fiber expansion pretreatment and enzymatic hydrolysis. Biotechnol. Biofuels 2009, 2, 29. [Google Scholar] [CrossRef] [PubMed]

