Article

Electrical Circuit Flashover Model of Polluted Insulators under AC Voltage Based on the Arc Root Voltage Gradient Criterion

1
State Key Laboratory of Power Transmission Equipment & System Security and New Technology, Chongqing University, Chongqing 400030, China
2
Department of Electrical Engineering and Computer Science, Research Laboratory of Electronics, Laboratory for Electromagnetic and Electronic Systems, High Voltage Research Laboratory, Massachusetts Institute of Technology, Cambridge, MA 02139, USA
*
Author to whom correspondence should be addressed.
Energies 2012, 5(3), 752-769; https://doi.org/10.3390/en5030752
Submission received: 21 January 2012 / Revised: 6 March 2012 / Accepted: 10 March 2012 / Published: 15 March 2012

Abstract

:
In order to study the flashover mechanism of polluted insulators under AC voltage, a new arc propagation criterion which is based on an arc root voltage gradient is proposed. This criterion can explain the variation of the arc root voltage gradient in the arc propagation process. Based on this criterion, a new distributed parameter electrical circuit flashover model of polluted insulators is presented. The arc channel is considered as an equivalent distributed parameter circuit model instead of using the arc voltage-gradient equation. The parameters of the arc model are obtained from the electromagnetic field distribution of the arc and the gas discharge theories. The arc root is considered as parallel paths including the polluted layer. The variation of the voltage on the arc root is related to the capability of arc propagation. This model takes the microscopic mechanism of arc root ionization into consideration, which can improve the accuracy of the flashover model. The results obtained from the presented model are in good agreement with other mathematical and experimental results.

1. Introduction

The pollution flashover of insulators is one of the main factors threatening the safe operation of the power grid, which can lead to great economic losses to the whole power system, therefore it is of great value to study the pollution flashover characteristics and mechanisms from both the academic and engineering viewpoints. The existing studies on the topic can be basically classified into two areas: one is experimental pollution flashover tests, and the other is the physical and mathematical analysis of the pollution flashover process. Pollution flashover tests require a vast investment of manpower and material resources. In addition, the test data from different laboratories often disagree, perhaps because of ambient environment influences. These differences motivate more research using mathematical analyses of the pollution flashover process. The physical and mathematical models are built upon comprehensive analysis of the flashover process. With the implementation of these models, the flashover voltage can be calculated, thus providing a theoretical basis for insulation coordination.
The modeling of polluted insulator flashover started from a mathematical pollution flashover model put forward by Obneuas [1], which has served as the foundation for a quantified simulation of pollution flashover. Afterwards other researchers improved and developed the pollution flashover model under various conditions, and built up both static and dynamic AC/DC models [2,3,4,5,6,7]. Dynamic models mainly consider the arc channel as an equivalent electrical circuit and simulate arc propagation step by step. The parameters of the equivalent circuit are calculated in real time at every step. The excellent feature of dynamic models is the time-dependent characteristic while the calculation of velocity is the critical point. Beroual solves this problem successfully base on an energetic balance [8] and applies in other media [8,9,10,11]. The arc channel is equivalent to the circuit of a resistance series with an inductance in literature [7]. Combining with the impedance criterion of d|Zeq|/dx < 0 proposed by Beroual et al., the arc circuit parameters are calculated step by step, until flashover occurs. The arc nonlinear resistance is calculated by the Mayr equation. The arc inductance is calculated by the equations proposed by Beroual et al., which are obtained from electromagnetic field and gas discharge theories. The results indicate that the arc channel inductance and capacitance are negligible compared to the arc channel resistance. That is to say, arc resistance has a critical effect on the propagation of an arc, which has been verified by the criterion in the literature [7].
Compared with DC pollution flashover, AC flashover is more complicated because there is arc extinction and reignition during the AC flashover process, which is accompanied with pulses and distortions of the leakage current. Based on the empirical formula of arc reignition from the arc tests, static and dynamic pollution flashover models were developed and applied for insulation coordination. From the existing research, it is found that the key point of the flashover model is based on the criteria for arc propagation and arc extinction and reignition. Earlier criteria for arc propagation depended on the power (P) variation with the arc length propagation (x) that is dP/dx > 0, which is a necessary condition instead of a sufficient condition [3]. Another well-known criterion is the impedance criterion proposed by Beroual and Dhahbi-Megriche et al. [12]. This criterion is based on an equivalent impedance of a whole electrical circuit and can explain why the Hampton criterion is not a sufficient condition for initiation of the arc. It is also applied to the analysis of flashover mechanism comprehensively [7,11,13].
In this paper, an AC electrical circuit flashover model of polluted insulators is built on the basis of the former research work on polluted insulators put forward by Chongqing University [14,15] and the flashover model literature mentioned above. This model is based on physical analysis during the arc propagation process. Based on the gas discharge theorem, the variation of arc root voltage gradient is analyzed and introduced into the flashover process of the polluted insulator.

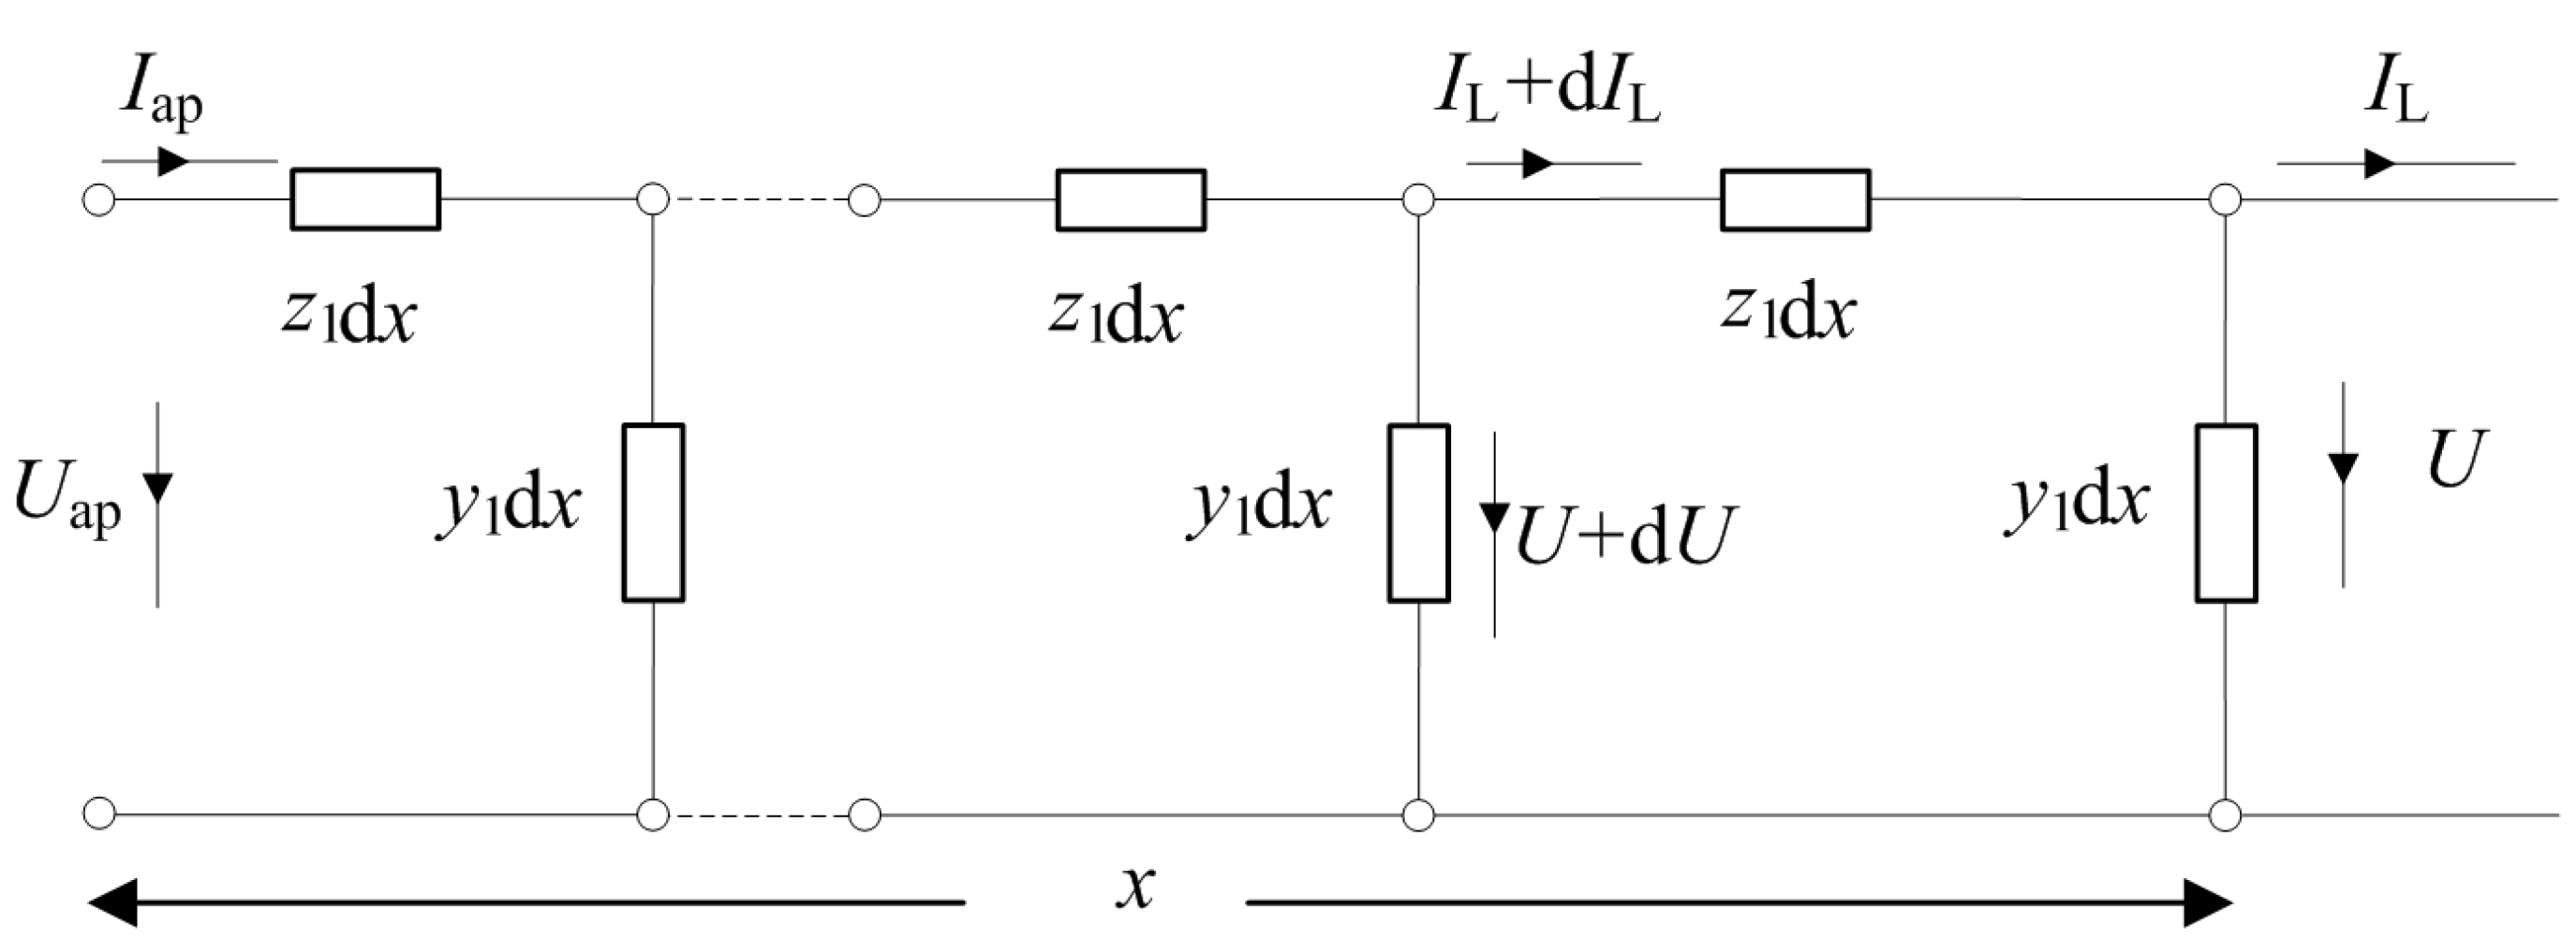
2. Basic AC Mathematical Flashover Model of Polluted Insulators

Most mathematical models used to predict the flashover voltage of polluted insulators are deduced from the Obenaus pollution flashover model, which is shown in Figure 1. Figure 1 expresses an ideal mathematical model aiming at predicting the propagation process of the arc on polluted insulators. With this model, the critical voltage to maintain the arc can be deduced from:
U = A x I n + R p I
where U (V) is the peak value of the applied voltage, x (cm) is the arc length, I (A) is the peak value of the arc current, Rp (Ω) is the resistance of the remaining contamination layer, and A, n are the arc characteristic constants.
Figure 1. Circuit flashover model.
Energies 05 00752 g001
The Obenaus model is limited in explaining the AC arc extinction and reignition. Claverie and Porcheron proposed that AC pollution flashover should meet the arc reignition condition [16,17], which can be expressed as:
U m = 800 x / i m
where x (cm) is the arc length, im (A) is the peak value of the leakage current, and Um (V) is the peak value of the applied voltage.
Rizk put forward that the arc conductivity is a representation of the arc energy [2,18,19]. By supposing the voltage of the arc gap remains sinusoidal when the current is zero, the arc reignition condition can be deduced as:
U m = 2080 x / i m
where x (cm) is the arc length, im (A) is the peak value of the leakage current, and Um (V) is the peak value of the applied voltage.
With the implementation of the arc maintaining and reignition conditions, the applied voltage which can maintain the AC arc with a certain length can be calculated. Thus the arc propagation criterion is the key to the flashover process. Existing criteria based on the Obenaus model can be classified into a gradient criterion, a power criterion and an impedance criterion.
The Hampton criterion [20], which is Ep > Earc, meaning that the voltage gradient of the arc is less than that of the residual pollution layer, is the gradient criterion. In most electrical circuit models, the Ayrton Equation, Earc = Ain, is employed to analyse the low-current nonstatic arcs, which is strictly valid only for high-current static arcs [5].
The power criterion, which is dP/dx > 0, means that along with the arc propagation, the power from the supply increases. Assuming all the power from the supply is transferred into the circuit and the applied voltage is unchanged, the criterion can be simplified to di/dx > 0, which means that the leakage current increases with arc propagation. Nacke considers the change of total voltage for a displacement of the discharge root at constant current [21], namely:
d V = V arc x arc d x arc + I arc R x res d x res
When dV < 0 occurs, the discharge will be unstable and flashover will occur. But it is not clear why a constraint of constant current is imposed, rather than the actual constraint of constant voltage [22]. However, during the arc propagation, there are multiple dissipative sources like light and radiation besides the arc and pollution layer. Thus, even when the power from the supply increases, the arc is not necessarily propagating.

3. Arc Root Voltage Gradient Variation during Arc Propagation

3.1. The Arc Root Voltage Gradient Variation during Arc Propagation

The surface arc propagation on an insulator between the high voltage and ground electrodes is a kind of air-gap surface discharge under an extremely uneven electric field. The gas molecules on the surface of insulator absorb energy from the electric field and are ionized as positive ions and electrons which blend into the arc channel causing the arc propagation owing to the high temperature and high voltage gradient in front of the discharge root [23]. Especially, the energy variation at the arc root can determine the arc propagation, namely the mechanism of “elongation by ionization and successive root formation” [23]. With arc propagation, the newly formed arc length displaces the corresponding length of contamination layer. The applied voltage which is a constant is centralized on arc root continuously in process of arc propagation. The field at the arc root concentrates and brings about the flashover later [22]. Therefore, during the propagation of the arc, the arc root voltage gradient variation is significant for both arc propagation and the final flashover.

3.2. The Arc Root Voltage Gradient Criterion

The arc propagation is characterized by new ionization at the arc root which forms the plasma channel [23], as shown in Figure 2. The voltage gradient of arc root has a decisive effect on the formation of new ionization. Jolly considered that pollution flashover is essentially an electrical breakdown process caused by the field concentration at the discharge tip [22], so the arc root voltage gradient criterion is proposed as follows:
d E ion d x > 0
where Eion is the voltage gradient of the arc root and x (cm) is the arc length.
Figure 2. Arc root equivalent electrical circuit model. (a) Arc root physical analysis; (b) Arc root equivalent electrical circuit.
Energies 05 00752 g002
According to the relationship between voltage drop and voltage gradient, due to the fact the size of arc root remains almost unchanged [24], the following equation is deduced:
d U ion d x = δ d E ion d x
where Uion (V) is the arc root voltage drop and δ is the length of arc root which can be treated as a constant [24]. When dEion/dx > 0, dUion/dx > 0 is obtained. This means the voltage drop at the arc root increases with arc propagation.
In Figure 2, zion (Ω/cm) is the per unit length impedance of the new ionization area of arc root; Iion is the current which flows into the new ionization branch. Uion (V) is the arc root voltage drop and δ is the length of arc root which can be treated as a constant [24]. rrest (Ω/cm) is the per unit length resistance of the remaining contamination layer; Irest is the corresponding current of remaining contamination layer branch. IL (A) is the surface leakage current.
From Figure 2, the voltage drop of the arc root can be expressed as:
U ion = z equ δ I L
where IL (A) is the surface leakage current and zequ (Ω/cm) is the equivalent impedance per unit length at the arc root and can be deduced as:
z equ = r rest z ion r rest + z ion
where rrest (Ω/cm) is the per unit length resistance of the remaining contamination layer and zion (Ω/cm) is the per unit length impedance of the new ionization area of arc root.
When the arc propagates an iota of length dx, differentiating Equation (7) and combining with Equation (8), the derivative of Uion is:
d U ion d x = z equ δ d I L d x + δ I L d z equ d I L d I L d x = ( z equ δ + δ I L d z equ d I L ) d I L d x
The steepness of the arc front at the arc root increases with the leakage current [24], which is equal to the total impedance of the new ionization increasing, namely dzequ/dIL > 0. Thus from Equation (9), when dUion/dx = 0, dIL/dx = 0 is obtained.

4. Pollution Flashover Model based on Arc Root Voltage Gradient Criterion

4.1. Basic Concept

The electrical circuit model of the arc propagation along the insulator is represented by electrical circuit network components, which is an efficient method for modeling the flashover process. In the Obenaus model, the arc voltage-gradient equation is adopted to depict the relationship between the arc voltage and arc current. Because the pollution flashover is a kind of gas breakdown, the equivalent electrical circuit network model in the long air gap discharge can be used for modeling of the pollution surface flashover [25]. That is to say, the arc channel of pollution flashover can also be modeled as a distributed parameter circuit, whose parameters are decided by the electromagnetic field distribution of the arc and the gas discharge theories. Furthermore, according to former researchers, the electric field distribution near the arc root is centralized, but quickly attenuates [24]. The high electric potential gradient near the arc root is responsible for the arc propagation and final flashover [22]. The ionization and recombination of the gas molecules mainly take place near the arc root. Wilkins proposed that the arc propagation is a result of the elongation by ionization and successive arc root formation [23]. The arc root can be treated as a parallel circuit with the ionized gas and polluted layer, as shown in Figure 2(a).
Based on the above analysis, a new electrical distributed parameter circuit model of pollution flashover is presented in this paper, which is shown in Figure 3. Due to the arc propagation along the surface of an insulator, some part of the currents will also transfer from the arc channel to the surface pollution layer on beneath the arc channel. Therefore, the arc channel and the surface pollution branch beneath the arc should have some connection points. That is to say, a distributed parameter circuit of the arc channel can describe this phenomenon better than a concentration parameter circuit of the arc voltage-gradient equation. In the distributed parameter model, the arc channel is represented by the impedance matrix, and the surface pollution branch beneath the arc is represented by the admittance matrix. Because the arc inductance and the arc capacitance are both far smaller than the arc resistance, the inductance and the capacitance in the impedance and admittance matrixes are omitted. Thus, the per unit length impedance of the arc channel z1 and the per unit length admittance of the arc channel y1 are determined by the resistance of the arc channel and the surface pollution layer resistance respectively. The arc root is divided into two parts, as shown in Figure 2(b). The upper channel is where the new ionization happens. The lower channel is through the contamination layer, representing the residual pollution resistance in parallel with the arc root. δ is the length of the arc root, which can be treated as a constant [24], and fulfills the condition that δ << x and δ << Lx [5,23].
Figure 3. Advanced electrical circuit flashover model.
Energies 05 00752 g003

4.2. The Calculation Flowchart of Modeling

In this paper, based on the mechanism of “elongation by ionizations and successive root formation” proposed by Wilkins [23], arc root is considered independent of arc channel and residual resistance. It is simulated by two parallel current paths, shown in Figure 2. The parameters and critical values of this new circuit model in Figure 3 will be calculated later in this paper. The calculation flowchart of critical flashover values is shown in Figure 4.
Figure 4. The calculation flowchart of critical flashover values.
Energies 05 00752 g004

4.3. The Calculation of Arc Root Voltage Drop

Figure 5 is an equivalent distributed parameter circuit model of arc channel, which is a part of Figure 3. When the arc initiates from the high voltage end of the insulator, IL in Figure 5 is the leakage current on the insulator surface. According to the equivalent distributed parameter circuit of the arc channel in Figure 5, the relationship between the applied voltage and current can be obtained as:
{ U ˙ = U ˙ ap cosh γ x +( z C sinh γ x ) I ˙ ap I ˙ L = sinh γ x z C U ˙ ap + ( cosh γ x ) I ˙ ap
The equations set above is a vector form where z C = z 1 / y 1 , γ = z 1 y 1 . z1 (Ω/cm) is the per unit length impedance of arc channel and y1 (S/cm) is the per unit length admittance between the arc channel and the earth. U ˙ ap (V) and I ˙ ap (A) are the applied voltage vector and the applied current vector on an insulator, respectively.
Figure 5. Equivalent distributed parameter electrical circuit of the arc channel.
Energies 05 00752 g005
The admittance between the arc channel and the earth is determined by the surface pollution resistance. Then the average admittance per unit length between the arc channel and the earth can be calculated by the following equation as:
y 1 = y surface L = λ 1 r rest L L = λ 1 r rest L 2
where ysurface is the admittance of polluted insulator surface, L is the leakage distance, ë is the correction factor which is determined by the pollution resistance. Due to the admittance of surface pollution branch beneath the arc very small, the surface resistance can reach about one hundred million ohms [26]. According to literature [26], the value of ë is about 20 when the surface resistance is one hundred million ohms under the polluted severities encountered in practice.
Therefore in Figure 3, y1 and rrest discussed above are considered as resistances. The per unit length impedance of arc channel z1 and the per unit length impedance of new ionization zion are also considered as resistances [7,23,25]. Therefore, Figure 3 is a pure resistance circuit, the current vectors I ˙ ap and I ˙ L are in phase with the voltage vectors U ˙ ap and U ˙ . Then the equations set of vector form Equation (10) can be simplified as a scalar form:
{ U = U ap cosh γ x +( z C sinh γ x ) I ap I L = sinh γ x z C U ap + ( cosh γ x ) I ap
From the second equation in (12), it can be obtained that:
I ap = 1 cosh γ x ( I L sinh γ x z C U ap )
Replacing Iap in the first equation of (12) by (13), the electric potential which is a distance x away from the applied voltage shown in Figure 5, U, can be calculated as:
U = 1 cosh γ x U ap + z C sinh γ x cosh γ x I L
The voltage on the residual pollution layer, shown in Figure 3, is:
U = ( L x δ ) r rest I L
where rrest (Ω/cm) is the per unit length resistance of the remaining contamination layer, L (cm) is the creeping distance.
Therefore, the arc root voltage drop Uion is:
U ion = U U
U ion = 1 cosh γ x U ap + sinh γ x cosh γ x z C I L ( L x δ ) r rest I L

4.4. Critical Flashover Voltage

4.4.1. The Derivation of Critical Flashover Voltage

According to the arc propagation criterion proposed above, when dEion/dx > 0 is satisfied for any x ( 0 , L ] , flashover will occur. Differentiating Equation (17) with respect to x, the following formula is obtained:
d U ion d x = ( γ + x γ ) sinh γ x ( cosh γ x ) 2 U ap + z C I L ( γ + x γ ) ( cosh γ x ) 2 + sinh γ x cosh γ x z C I L + r rest I L + d I L d x [ sinh γ x cosh γ x z C ( L x δ ) r rest ]
where γ = d γ d x = d γ d I L d I L d x and z C = d z C d x = d z C d I L d I L d x .
When dEion/dx = 0, namely dUion/dx = 0 is satisfied from Equation (6). When dUion/dx = 0, dIL/dx = 0 is satisfied from Equation (9). Combining Equation (18) with Equation (9), the following formula is obtained:
U ap = z C I L sinh γ x + ( cosh γ x ) 2 γ sinh γ x r rest I L
Differentiating the applied voltage Uap in Equation (19) with respect to x and setting it equal to zero, then:
d U ap d x = z C I L γ cosh γ x ( sinh γ x ) 2 + I L ( cosh γ x ) r rest ( sinh γ x ) 2 1 ( sinh γ x ) 2 = 0
The result of Equation (20) is as follows:
sinh γ x = z 1 r rest + 1
Substituting Equation (21) into Equation (19), the following formula is obtained:
U ap = 2 I L γ z C γ r rest + 1 ( z C γ + r rest ) = 2 I L γ r rest ( r rest + z 1 )
where z 1 = z C γ and can be obtained from equations z C = z 1 / y 1 , γ = z 1 y 1 . The applied voltage Uap in Equation (22) which satisfies dUion/dx = 0 and dUap/dx = 0 simultaneously is the critical voltage Uc and the corresponding arc length is the critical arc length xc.
That is to say:
U c = 2 I c γ r rest ( r rest + z 1 )
sinh γ x c = z 1 r rest + 1
During the AC flashover process, the critical flashover voltage should also meet the arc reignition condition, as given in Section 2. When treating the extinction and reignition process, the Claverie condition is used in this paper.

4.4.2. The Calculation of Critical Flashover Voltage

According to the research on the air-gap arc discharge in [25], the arc channel resistance per unit length can be deduced as:
r 1 = 1 σ π a 2
where σ (S/cm) and a (cm) are respectively the conductivity per unit length and the radius of the arc channel and can be expressed as [25]:
σ = f ( I ) = I L 1.006 24.34
a = I L 1.45 π
where IL is the leakage current.
Combining Equations (25), (26) and (27), the following equation is obtained:
r 1 = 35.3 I L 2.006
The parameter z1 in Equations (23) and (24) is the per unit length impedance of arc channel which can be considered as a resistance [7,23,25], thus
z 1 = r 1 = 35.3 I L 2.006
Similarly, the new ionization is considered as a shunting of arc in Figure 2 [23], whose per unit length impedance can be calculated as follows:
z ion = 35.3 I ion 2.006
In Figure 2, the following equations set can be obtained as:
{ z ion I ion δ = r rest I rest δ I L = I ion + I rest
the leakage current can be expressed as:
I L = I ion + 35.3 r rest I ion 1.006
Differentiating Equation (32) with respect to Iion and setting it equal to zero:
d I L d I ion = 1 + 35.3 × ( 1.006 ) r rest I ion 2.006 = 0
Due to the fact d I L d I ion = d I L d x / d I ion d x , the critical current which satisfies the condition of dUion/dx = 0, namely dIL/dx = 0, also satisfies the Equations (32) and (33). So the critical current can be expressed as follows:
I c = 2 × ( 35.3 r rest ) 1 2.006
Under critical condition, dIc/dx = 0 is satisfied, so combining with Equation (29), the per unit length resistance of arc channel in the Figure 5 can be calculated:
z 1 = 35.3 I c 2.006
Combining Equation (23) with Equation (35), the critical voltage Uc can be expressed as:
U c = 2 I c 35.3 I c 2.006 y 1 r rest ( r rest + 35.3 I c 2.006 )
Combining Equations (11), (34) and (36) and Equations (11), (24), (34) and (35), the calculation formulas of critical voltage and critical arc length can be obtained as:
U c = 11.83 L r rest 0.5015
x c = 0.43 L
The critical arc length in the critical zone is between 0.4 L ~ 0.63 L [27], which agrees well with our model calculation results in Equation (38).

5. Model Validation and Discussion

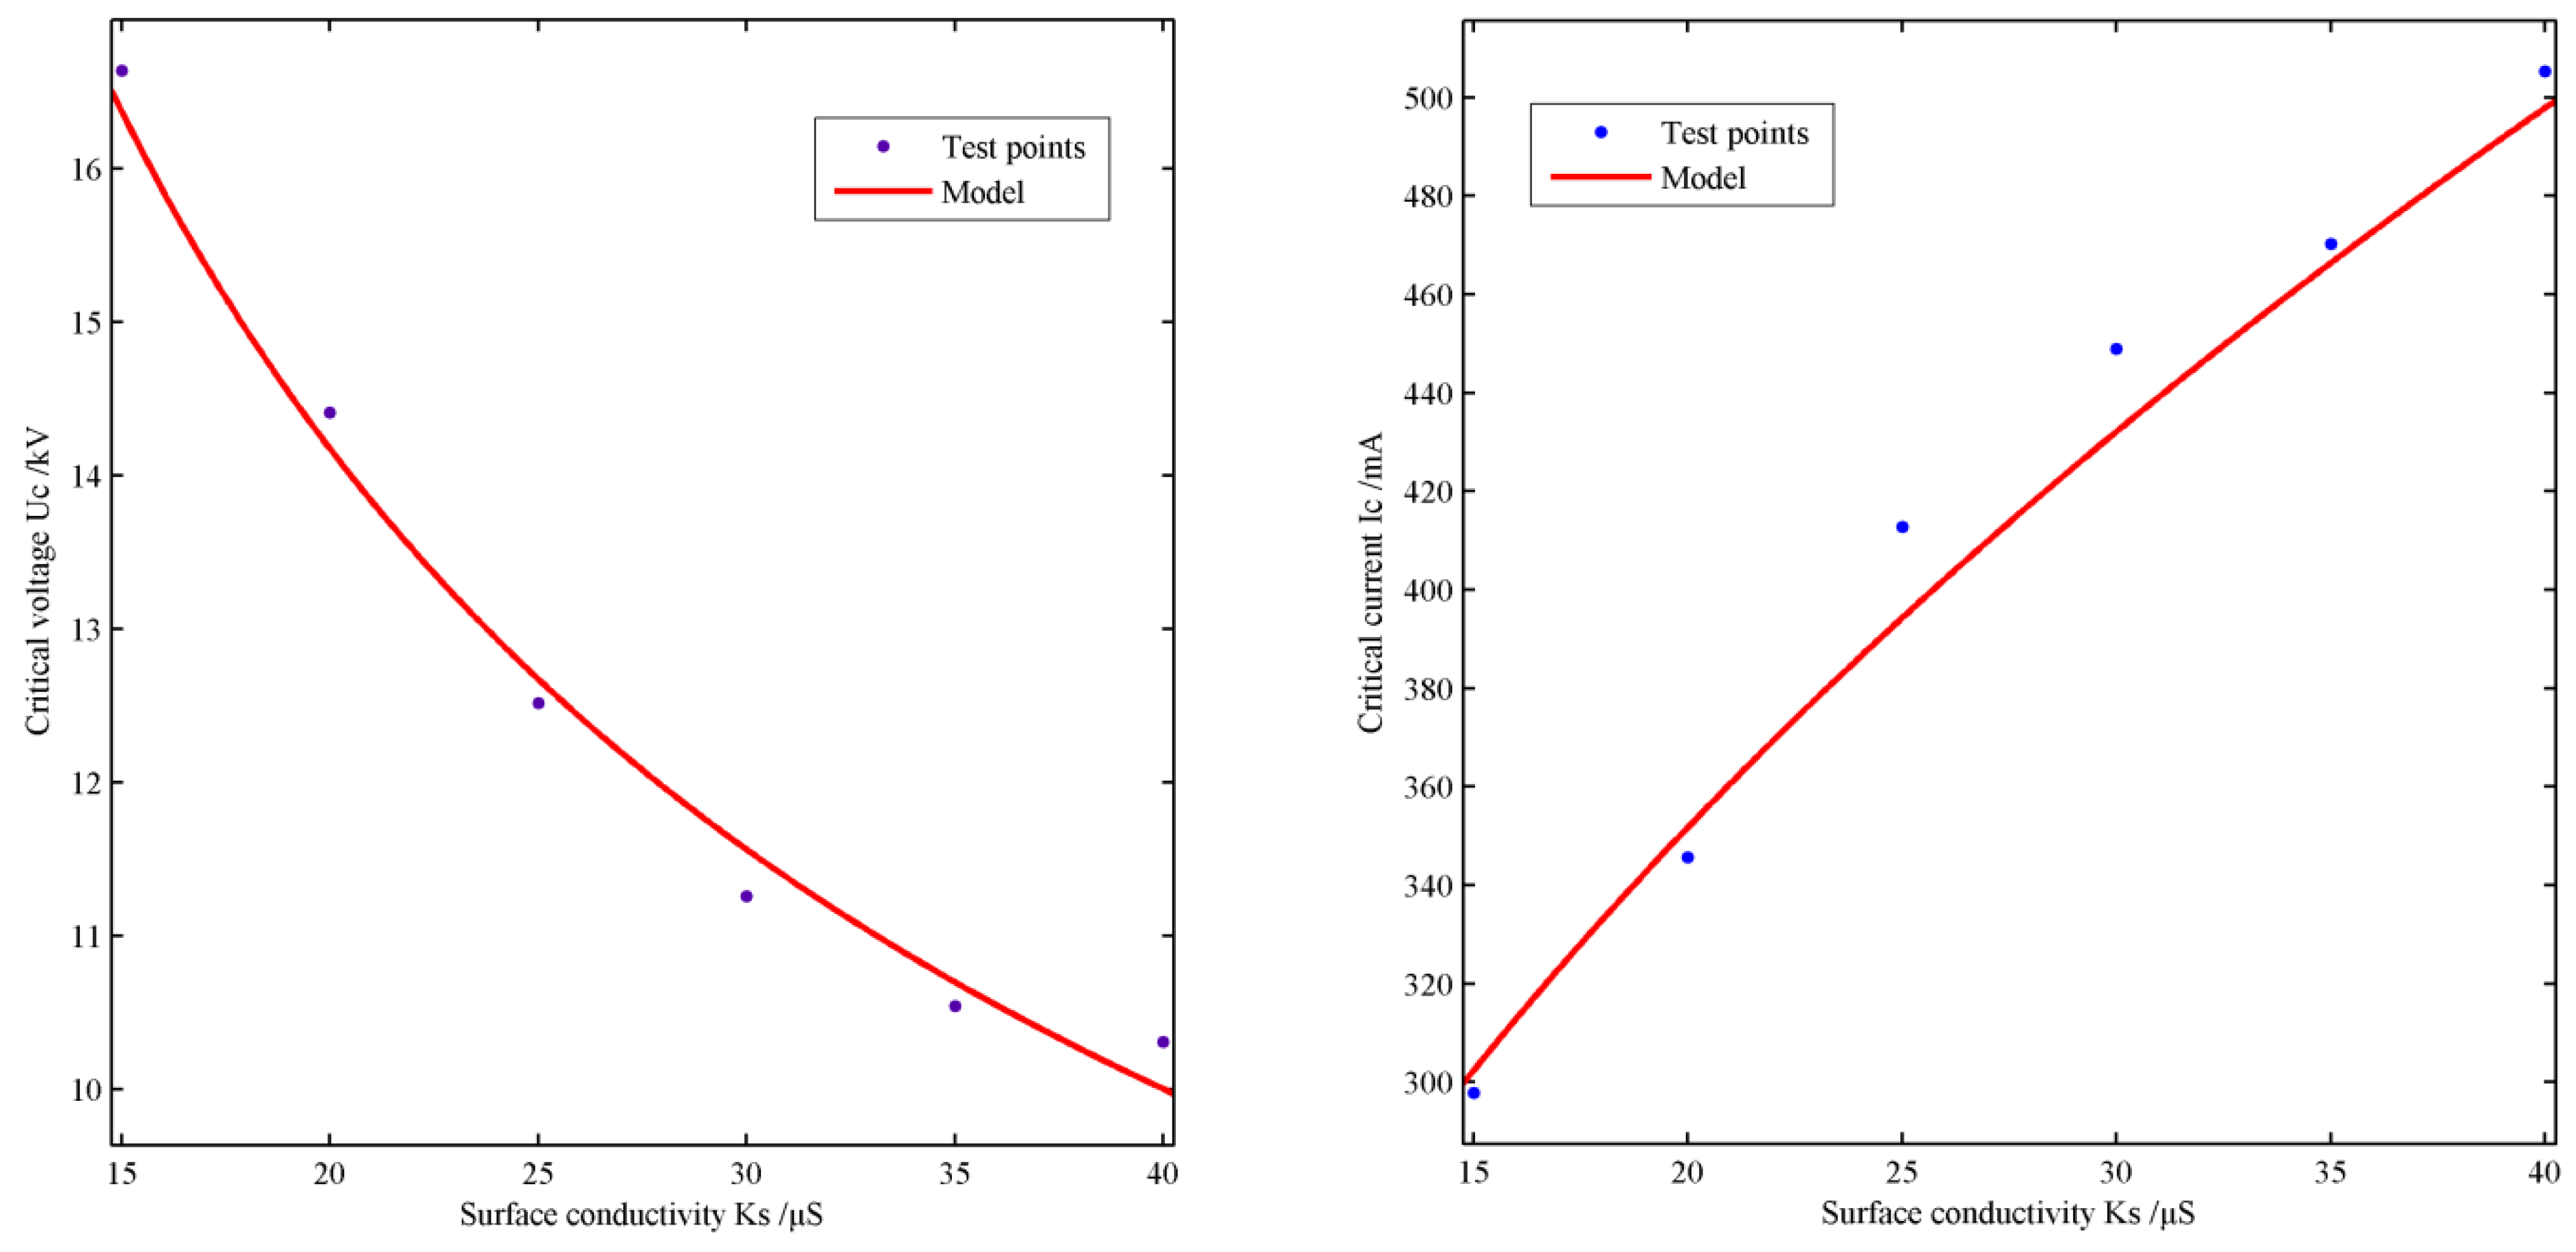
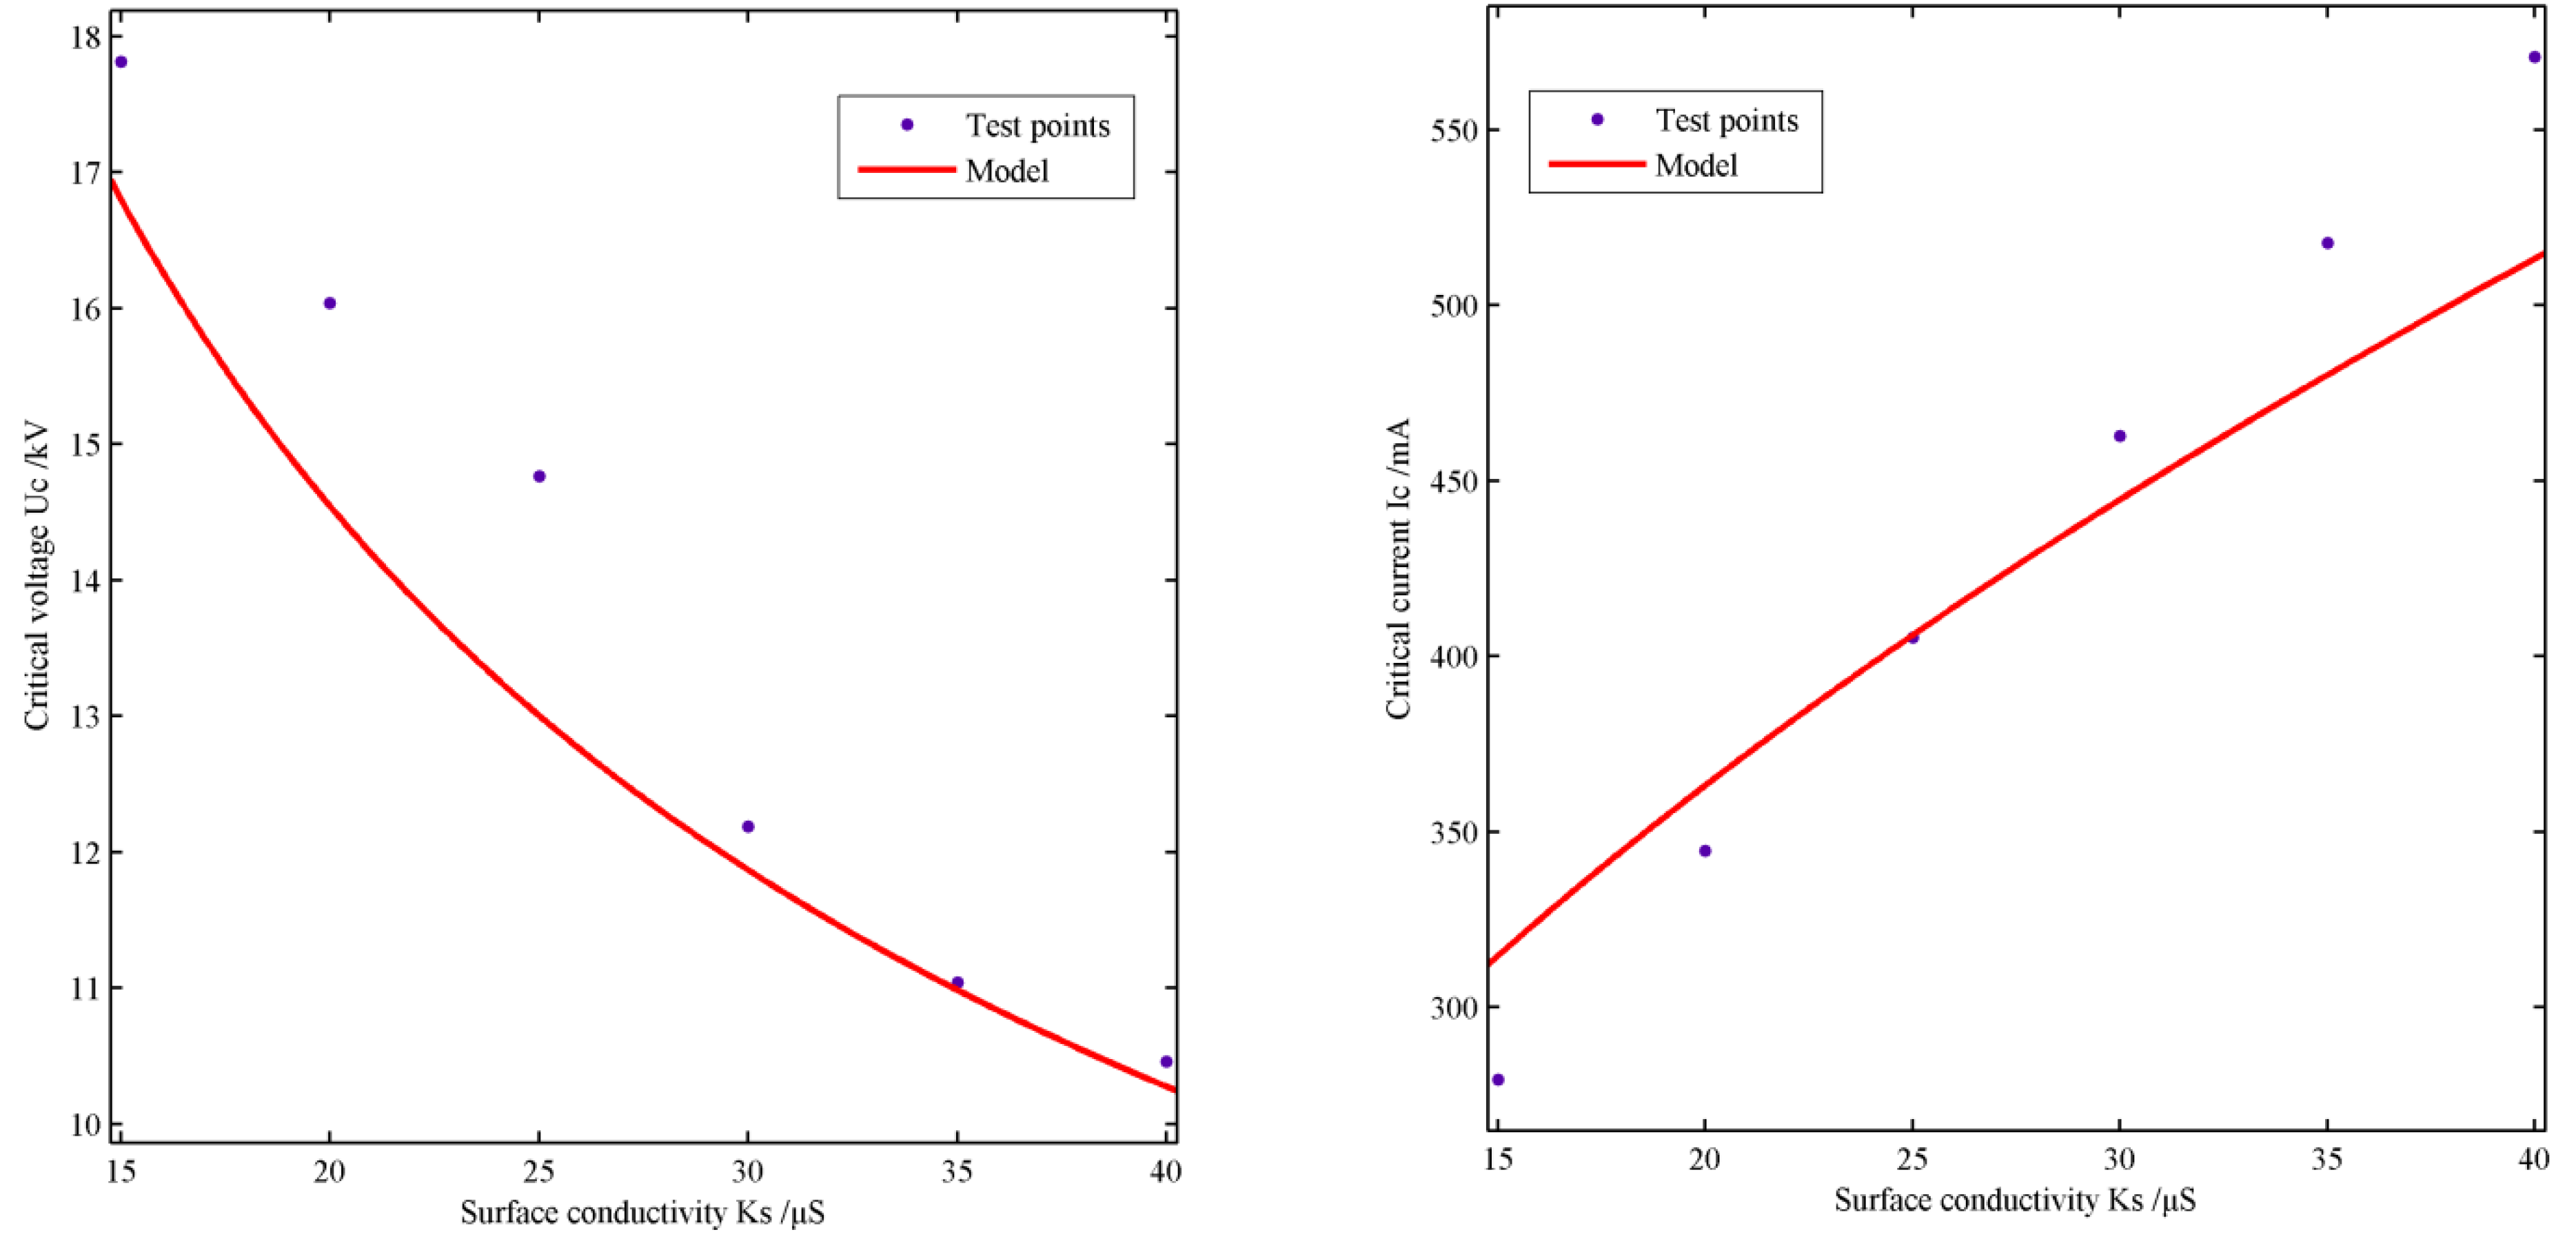
5.1. The Comparison of the Flashover Voltage

As for standard insulators (creeping distance L = 33 cm, coefficient of form f = 0.79), when the surface conductivity changes between 15 ~ 40 μS, the corresponding pollution layer resistance is about 1.98 × 10⁴~5.27 × 10⁴ Ω. According to Equation (37), the calculation formula of critical flashover voltage is obtained as follows:
U c = 390.39 r rest 0.5015
Equation (39) satisfies Claverie’s reignition condition.
The comparison between the proposed model and former models is illustrated in Figure 6.
Figure 6. The relationship between surface conductivity and critical flashover voltage for various models.
Energies 05 00752 g006
It can be judged from Figure 6 that the critical flashover voltage is decreasing with the increase of the surface conductivity. From bottom to top the curves represent the Wilkins model [3], Rizk AC model, Claverie model, the proposed model and experiment results [28] in this paper, respectively. The proposed model in this paper is closest to the Claverie model, and with the increase of the surface conductivity, the difference between the two models is decreasing. As the Claverie model is based on an empirical formula from artificial pollution experiments [5], it has the advantage of reflecting a real situation. It can be found that the proposed model locates between the Claverie model and the experiment results from literature [28], which indicates the proposed model is in good agreement with the practical results to a certain extent. The difference between the proposed model and the Claverie model and the experiment results may result from the calculations of the resistance of arc channel and the surface resistance of pollution insulator.

5.2. The Comparison of the Flashover Current

The corresponding critical flashover current comparison between the proposed model and other mathematical models is illustrated in Figure 7. It can be seen from Figure 7 that the critical flashover current is increasing with the increase of the surface conductivity. The curves of the Al-Baghdadi model, experiment results [28] and the proposed model are adjacent. Al-Baghdadi model [23] and the proposed model take into account parallel current paths established through the pollution layer other than the current through the arc, which accounts for the slightly better correspondence observed between the calculated and measured values [5].
Figure 7. The relationship between surface conductivity and critical flashover current for various models.
Energies 05 00752 g007

5.3. The Comparison with the Artificial AC Pollution Flashover Tests

To verify the validity of the model proposed above, artificial AC pollution flashover tests were conducted in the high voltage laboratory of Chongqing University with glass flat plate of 600 × 600 × 6 mm3 and the standard disc insulators XP-160 and XP1-160 respectively. The soluble pollution is simulated by NaCl while the non-soluble pollution is Kaolin. A high voltage test transformer (200 kV/200 kVA, 50 Hz) is applied to supply the power. In the testing, the applied voltage and the leakage current are recorded simultaneously. The leakage current is measured through a 1 Ω non-inductive resistance inserted between the steel cap of the insulator and the earth.
Due to the simplicity of geometrical shape, glass flat plate has an advantage on reflecting the mechanism of pollution flashover. Thus, artificial AC pollution flashover tests are carried out on the glass flat plate firstly to verify the model proposed. Figure 8(a) is the illustraton of model and 8(b) is a photo. In the testing, the non-soluble deposit density (NSDD) is set as 2.0 mg/cm2 and the equivalent salt deposit density (ESDD) are chosen as 0.1, 0.14, 0.2, 0.28 (mg/cm2) respectively. The width of pollution layer is set as 20 cm and the leakage distances are chosen as 8, 10, 12 cm respectively.
The testing results of different pollution severities and leakage distances are shown in the following Tables. Table 1 is the comparison of the critical voltage between calculation values and experimental results. Table 2 is the corresponding comparison of the critical current. The experiment result is almost identical with the calculation values with the error less than 10%, which indicates the validity of the proposed model for flat plate testing.
In order to verify the validity of the proposed model for practical insulators, standard disc insulators XP-160 and XP1-160 are tested using the solid-layer steam-fog method in the chamber. The structural diagrams and their parameters are shown in the following, Figure 9, Table 3 and Table 4. The surface pollution severity is varied between 15 and 40 μS.
Figure 8. The flat plate pollution testing.
Energies 05 00752 g008
Figure 9. Configuration of sample insulators.
Energies 05 00752 g009
Table 1. The comparison of the critical voltage between proposed model and experiment.
L = 8 cm0.1 mg/cm20.14 mg/cm20.2 mg/cm20.28 mg/cm2
Experiment3.5 kV3.0 kV2.6 kV2.4 kV
Calculation3.6 kV3.2 kV2.7 kV2.3 kV
Error2.8%6.2%3.7%4.3%
L = 10 cm0.1 mg/cm20.14 mg/cm20.2 mg/cm20.28 mg/cm2
Experiment4.7 kV4.1 kV3.6 kV2.7 kV
Calculation4.5 kV4.0 kV3.4 kV2.9 kV
Error4.4%2.5%5.9%6.9%
L = 12 cm0.1 mg/cm20.14 mg/cm20.2 mg/cm20.28 mg/cm2
Experiment5.7 kV4.4 kV4.2 kV3.7 kV
Calculation5.5 kV4.7 kV4.0 kV3.5 kV
Error3.6%6.4%5.0%5.7%
Table 2. The comparison of the critical current between proposed model and experiment.
L = 8 cm0.1 mg/cm20.14 mg/cm20.2 mg/cm20.28 mg/cm2
Experiment0.3081 A0.3477 A0.4095 A0.4794 A
Calculation0.3138 A0.3602 A0.4228 A0.4910 A
Error1.8%3.5%3.1%2.4%
L = 10 cm0.1 mg/cm20.14 mg/cm20.2 mg/cm20.28 mg/cm2
Experiment0.3216 A0.3781 A0.4111 A0.503 A
Calculation0.3138 A0.3602 A0.4228 A0.4910 A
Error2.5%5.0%2.8%2.4%
L = 12 cm0.1 mg/cm20.14 mg/cm20.2 mg/cm20.28 mg/cm2
Experiment0.3247 A0.3616 A0.4105 A0.4986 A
Calculation0.3138 A0.3602 A0.4228 A0.4910 A
Error3.5%0.4%2.9%1.5%
Table 3. Parameters of test samples (mm).
Product modelDiameterStructure heightCreepage distanceCoefficient of form
XP-160255 mm146 mm305 mm0.7
Table 4. Parameters of test samples (mm).
Product modelDiameterStructure height Creepage distanceCoefficient of form
XP1-160280 mm170 mm370 mm0.8
Figure 10 is the comparison of critical voltage and critical current between the proposed model and experiments. Test points are shown in the figures. It can be found that the calculation curves of proposed model are identical with the test points, which indicates the correctness and validity of the proposed model for standard disc insulators.
Figure 10. The comparison between the proposed model and experiments on XP-160. (a) Critical flashover voltage varies with the surface conductivity; (b) Critical flashover current varies with the surface conductivity.
Energies 05 00752 g010
Artificial AC pollution flashover tests are carried out on XP1-160 standard disc insulators in the same way. Its structural diagram is similar with that of XP-160 in Figure 9. Table 4 shows the parameters of XP1-160. The test results indicate a good agreement with the theoretical values in Figure 11.
Figure 11. The comparison between the proposed model and experiments on XP1-160. (a) Critical flashover voltage varies with the surface conductivity; (b) Critical flashover current varies with the surface conductivity.
Energies 05 00752 g011

6. Conclusions

From the electrical field variation near the arc root, the voltage gradient criterion dEion/dx > 0 is proposed by connecting the arc propagation with the concentration of field at the arc root. Based on the proposed criterion, a new electrical circuit model of polluted insulators under AC voltage is presented by considering the arc channel as an equivalent distributed parameter circuit model. The calculation results are in good agreement with existing models and artificial AC pollution flashover tests, which verifies the electrical field concentration at the arc root in the process of arc propagation. In other words, the voltage gradient near the arc root increases.
Further research can be carried out in the field of flashover dynamic models of polluted insulators under AC voltage based on the arc root voltage gradient criterion which can describe the real-time results of arc propagation in steps. Based on the proposed criterion, the electrical circuit flashover model of multi-arcs is also extended by combination with the residual resistance.

Acknowledgments

This work was supported by the National Basic Research Program of China (973 Program) (2009CB724507) and the 111 project of China (B08036).

References

  1. Obenaus, F. Contamination flashover and creepage path length. Dtsch. Elektrotechnik 1958, 12, 135–136. [Google Scholar]
  2. Rizk, F.A.M. Mathematical models for pollution flashover. Electra 1981, 78, 71–103. [Google Scholar]
  3. Wilkins, R. Flashover of high voltage insulators with uniform surface pollution films. IEE Proc. Gener. Transm. Distrib. 1969, 116, 457–465. [Google Scholar]
  4. Alston, L.L.; Zoeledziowski, S. Growth of discharge on pollution insulation. IEE Proc. Gener. Transm. Distrib. 1963, 110, 1206–1266. [Google Scholar]
  5. Gopal, S.; M.E.; Rao, Y.N. Flashover phenomena of polluted insulators. IEE Proc. 1984, 131, 140–143. [Google Scholar]
  6. Sundararajan, R.; Gorur, R.S. Dynamic arc modeling of pollution flashover if insulators under DC voltage. IEEE Trans. Electr. Insul. 1993, 26, 209–218. [Google Scholar] [CrossRef]
  7. Dhahbi-Megriche, N.; Beroual, A. Flashover Dynamic model of polluted insulators under AC voltage. IEEE Trans. Dielectr. Electr. Insul. 2000, 7, 283–289. [Google Scholar] [CrossRef]
  8. Beroual, A. Electronic and gaseous processes in the prebreakdown phenomena of dielectric liquids. J. Appl. Phys. 1993, 73, 4528–4533. [Google Scholar] [CrossRef]
  9. Beroual, A.; Fofana, I. Modelling of the leader and the return stroke currents with an equivalent electrical network. In Proceedings of the 9th International Symposium on High Voltage Engineering, Graz, Austria, 28 August–1 September 1995. Paper 2141.
  10. Beroual, A. Universal dynamic model of discharge propagating in air, liquids, solid/liquid interfaces and polluted. In Proceedings of the 13th International Symposium on High Voltage Engineering, Delft, The Netherlands, 25–29 August 2003.
  11. Beroual, A.; Dhahbi-Megriche, N. Dynamic model of discharge propagation on polluted surfaces under impulse voltages. IEE Proc. Gener. Transm. Distrib. 2000, 147, 279–284. [Google Scholar] [CrossRef]
  12. Beroual, A.; Dhahbi-Megriche, N.; Krahenbuhl, L. A new proposal model for flashover of polluted insulators. J. Phys. D 1997, 30, 889–894. [Google Scholar] [CrossRef]
  13. Slama, M.E.; Beroual, A.; Hadi, H. Analytical computation of discharge characteristic constants and critical parameters of flashover of polluted insulators. IEEE Trans. Dielectr. Electr. Insul. 2010, 17, 1764–1771. [Google Scholar] [CrossRef]
  14. Li, J.Y.; Sun, C.X.; Sima, W.X.; Yang, Q.; Hu, J.L. Contamination level prediction of insulators based on the characteristics of leakage current. IEEE Trans. Power Deliv. 2010, 25, 417–424. [Google Scholar]
  15. Li, J.Y.; Sima, W.X.; Sun, C.X.; Sebo, S.A. Use of leakage currents of insulators to determine the stage characteristics of the flashover process and contamination level prediction. IEEE Trans. Dielectr. Electr. Insul. 2010, 17, 490–501. [Google Scholar] [CrossRef]
  16. Claverie, P. Predetermination of the behavior of polluted insulators. IEEE Trans. Power Appar. Syst. 1971, 90, 1902–1908. [Google Scholar] [CrossRef]
  17. Claverie, P.; Porcheron, Y. How to choose insulators for polluted areas. IEEE Trans. Power Appar. Syst. 1973, 92, 1121–1131. [Google Scholar] [CrossRef]
  18. Rizk, F.A.M. Analysis of dielectric recovery with reference to dry-zone arcs on polluted insulators. In Proceedings of the IEEE Power Engineering Society Winter Power Meeting, New York, NY, USA, 28 January–2 February 1971; Volume 90, p. 134.
  19. Rizk, F.A.M. A criterion for AC flashover of polluted insulators. In Proceedings of the IEEE Power Engineering Society Winter Power Meeting, New York, NY, USA, 28 January–2 February 1971; Volume 90, p. 135.
  20. Hampton, B.F. Flashover mechanism of polluted insulation. IEE Proc. Gener. Transm. Distrib. 1964, 111, 985–990. [Google Scholar]
  21. Nacke, H. Stability of foreign layer discharges and theory of contamination flashover. ETZ-A 1966, 87, 577–585. [Google Scholar]
  22. Jolly, D.C. Contamination flashover, part1: Theoretical aspects. IEEE Trans. Power Appar. Syst. 1972, 91, 2437–2442. [Google Scholar] [CrossRef]
  23. Wilkin, R.; Al-Baghdadi, A.A.J. Arc propagation along an electrolyte surface. Proc. Instit. Electr. Eng. 1971, 1, 1886–1891. [Google Scholar] [CrossRef]
  24. Mercure, H.P.; Drouet, M.G. Dynamic measurements of the current distribution in the foot of an arc propagation along the surface of an electrolyte. IEEE Trans. Power Appar. Syst. 1982, 101, 725–732. [Google Scholar] [CrossRef]
  25. Fofana, I.; Beroual, A. A model for long air gap discharge using an equivalent electrical network. IEEE Trans. Dielectr. Electr. Insul. 1996, 3, 273–282. [Google Scholar] [CrossRef]
  26. Mekhaldi, A.; Namane, D.; Bouazabia, S.; Beroual, A. Flashover of discontinuous pollution layer on HV insulators. IEEE Trans. Dielectr. Electr. Insul. 1999, 6, 900–906. [Google Scholar] [CrossRef]
  27. Ghosh, P.S.; Chatterjee, N. Arc propagation over electrolytic surfaces under power frequency voltage. IEEE Trans. Dielectr. Electr. Insul. 1996, 3, 529–536. [Google Scholar] [CrossRef]
  28. Topalis, F.V.; Gonos, I.F.; Stathopulos, I.A. Dielectric behavior of polluted porcelain insulators. IEE Proc. Gener. Transm. Distrib. 2001, 148, 269–274. [Google Scholar] [CrossRef]

