Communication

Effects of Light and Temperature on Fatty Acid Production in Nannochloropsis Salina

Pacific Northwest National Laboratory, 1529 W Sequim Bay Rd., Sequim, WA 98382, USA
*
Author to whom correspondence should be addressed.
Energies 2012, 5(3), 731-740; https://doi.org/10.3390/en5030731
Submission received: 21 January 2012 / Revised: 24 February 2012 / Accepted: 1 March 2012 / Published: 12 March 2012
(This article belongs to the Special Issue Algae Fuel)

Abstract

:
Accurate prediction of algal biofuel yield will require empirical determination of physiological responses to the environment, particularly light and temperature. One strain of interest, Nannochloropsis salina, was subjected to ranges of light intensity (5–850 μmol m−2 s−1) and temperature (13–40 °C) and its exponential growth rate, total fatty acids (TFA) and fatty acid composition were measured. The maximum acclimated growth rate was 1.3 day−1 at 23 °C and 250 μmol m−2 s−1. Fatty acids were detected by gas chromatography with flame ionization detection (GC-FID) after transesterification to corresponding fatty acid methyl esters (FAMEs). A sharp increase in TFA containing elevated palmitic acid (C16:0) and palmitoleic acid (C16:1) during exponential growth at high light was observed, indicating likely triacylglycerol accumulation due to photo-oxidative stress. Lower light resulted in increases in the relative abundance of unsaturated fatty acids; in thin cultures, increases were observed in palmitoleic and eicosapentaenoic acids (C20:5ω3). As cultures aged and the effective light intensity per cell converged to very low levels, fatty acid profiles became more similar and there was a notable increase of oleic acid (C18:1ω9). The amount of unsaturated fatty acids was inversely proportional to temperature, demonstrating physiological adaptations to increase membrane fluidity. These data will improve prediction of fatty acid characteristics and yields relevant to biofuel production.

1. Introduction

Interest in using microalgae biofuels as drop-in replacements for fossil fuels has inspired efforts to increase the rate of lipid production in microalgal cultures [1,2,3] . Each strain of microalgae has unique properties, therefore new species are continuously being isolated and characterized, while known strains are being genetically modified in an attempt to obtain the best commercial strains [4]. There are two ways to increase areal lipid productivity (mass of lipids per unit of area per unit of time): either increase the rate of biomass accumulation, or increase the proportion of the biomass that contains a useful lipid. To achieve this objective, numerous strategies including nutrient starvation, bioprocess optimization and genetic modification can be used [5]. However, whatever strategy is used, the maximum achievable yield will be determined by the response of the alga to its environment.
Water temperature and light are two environmental parameters that are most impractical to manipulate in outdoor pond culture systems. Temperature can be regulated somewhat by designing variable-depth cultivation systems [6], but adding any heating or cooling processes to the system will severely compromise energy efficiency. Furthermore, for open raceway cultivation, algae will experience sunlight that varies both diurnally and seasonally. Therefore, the potential lipid productivity of a commercial algae cultivation facility will depend on light and temperature, which are obviously determined by location. Current state of the art predictions of maximum algal biofuel production potential depend on assumptions of how algal cultures will respond to variations in incident light and water temperature [7]. However, lipid productivity is a strain-specific function of physiological responses to many factors, including incident light intensity and cultivation temperature [8]. Therefore, strains of commercial interest should be characterized in terms of their responses to light intensity and temperature. Screening many species of algae based on this principle will enable rational decision making about which strain of algae to cultivate in a given location during a given season. Presented here is a characterization of one particular strain of interest, Nannochloropsis salina CCMP 1776 under constant illumination and nutrient replete conditions.

2. Results and Discussion
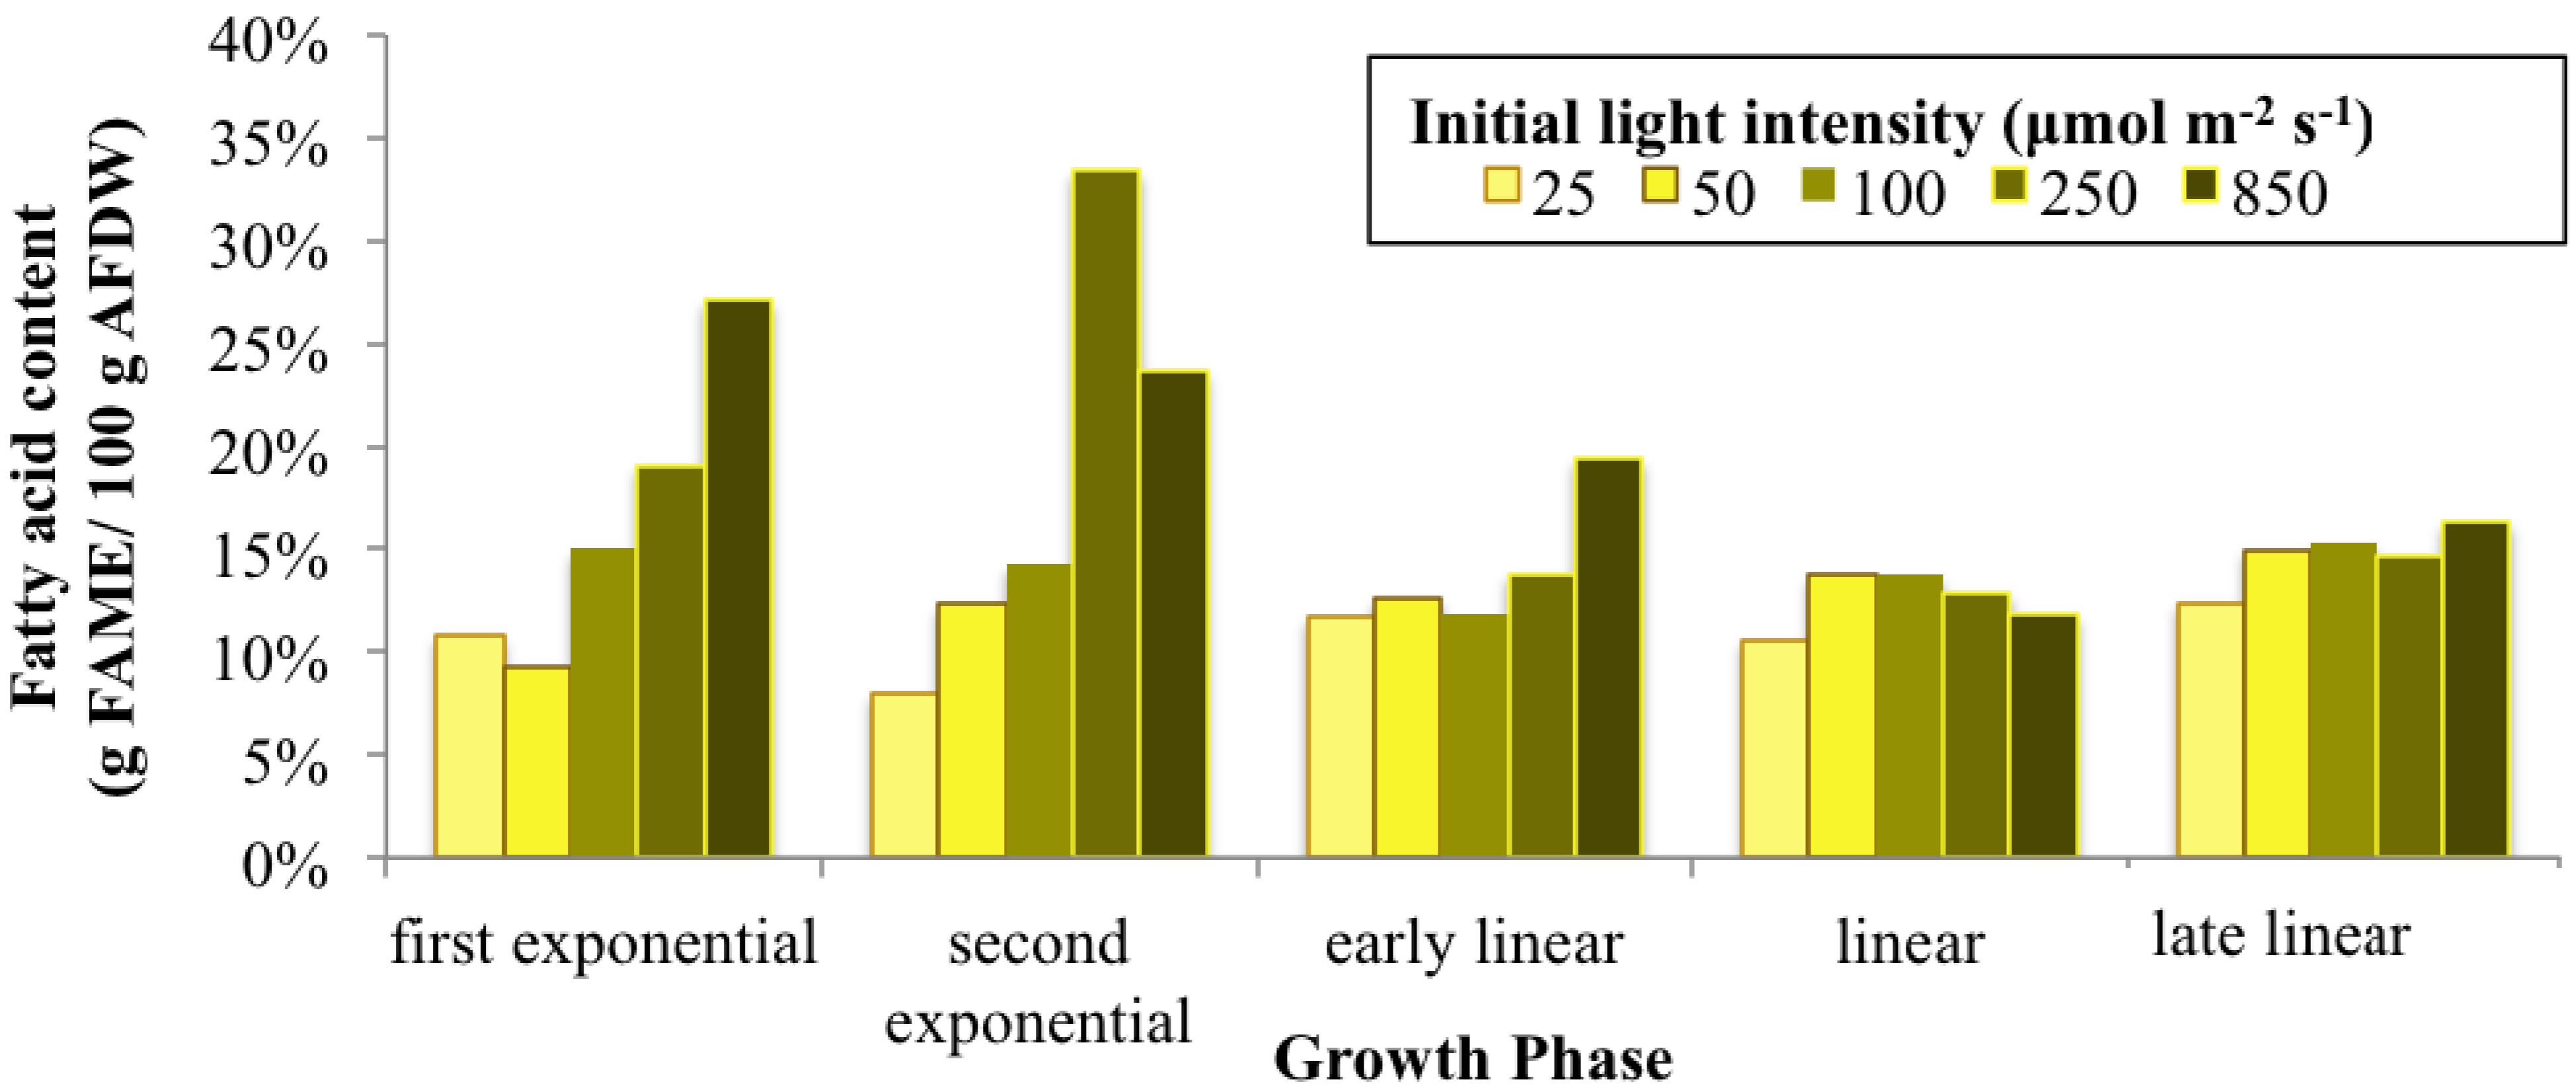
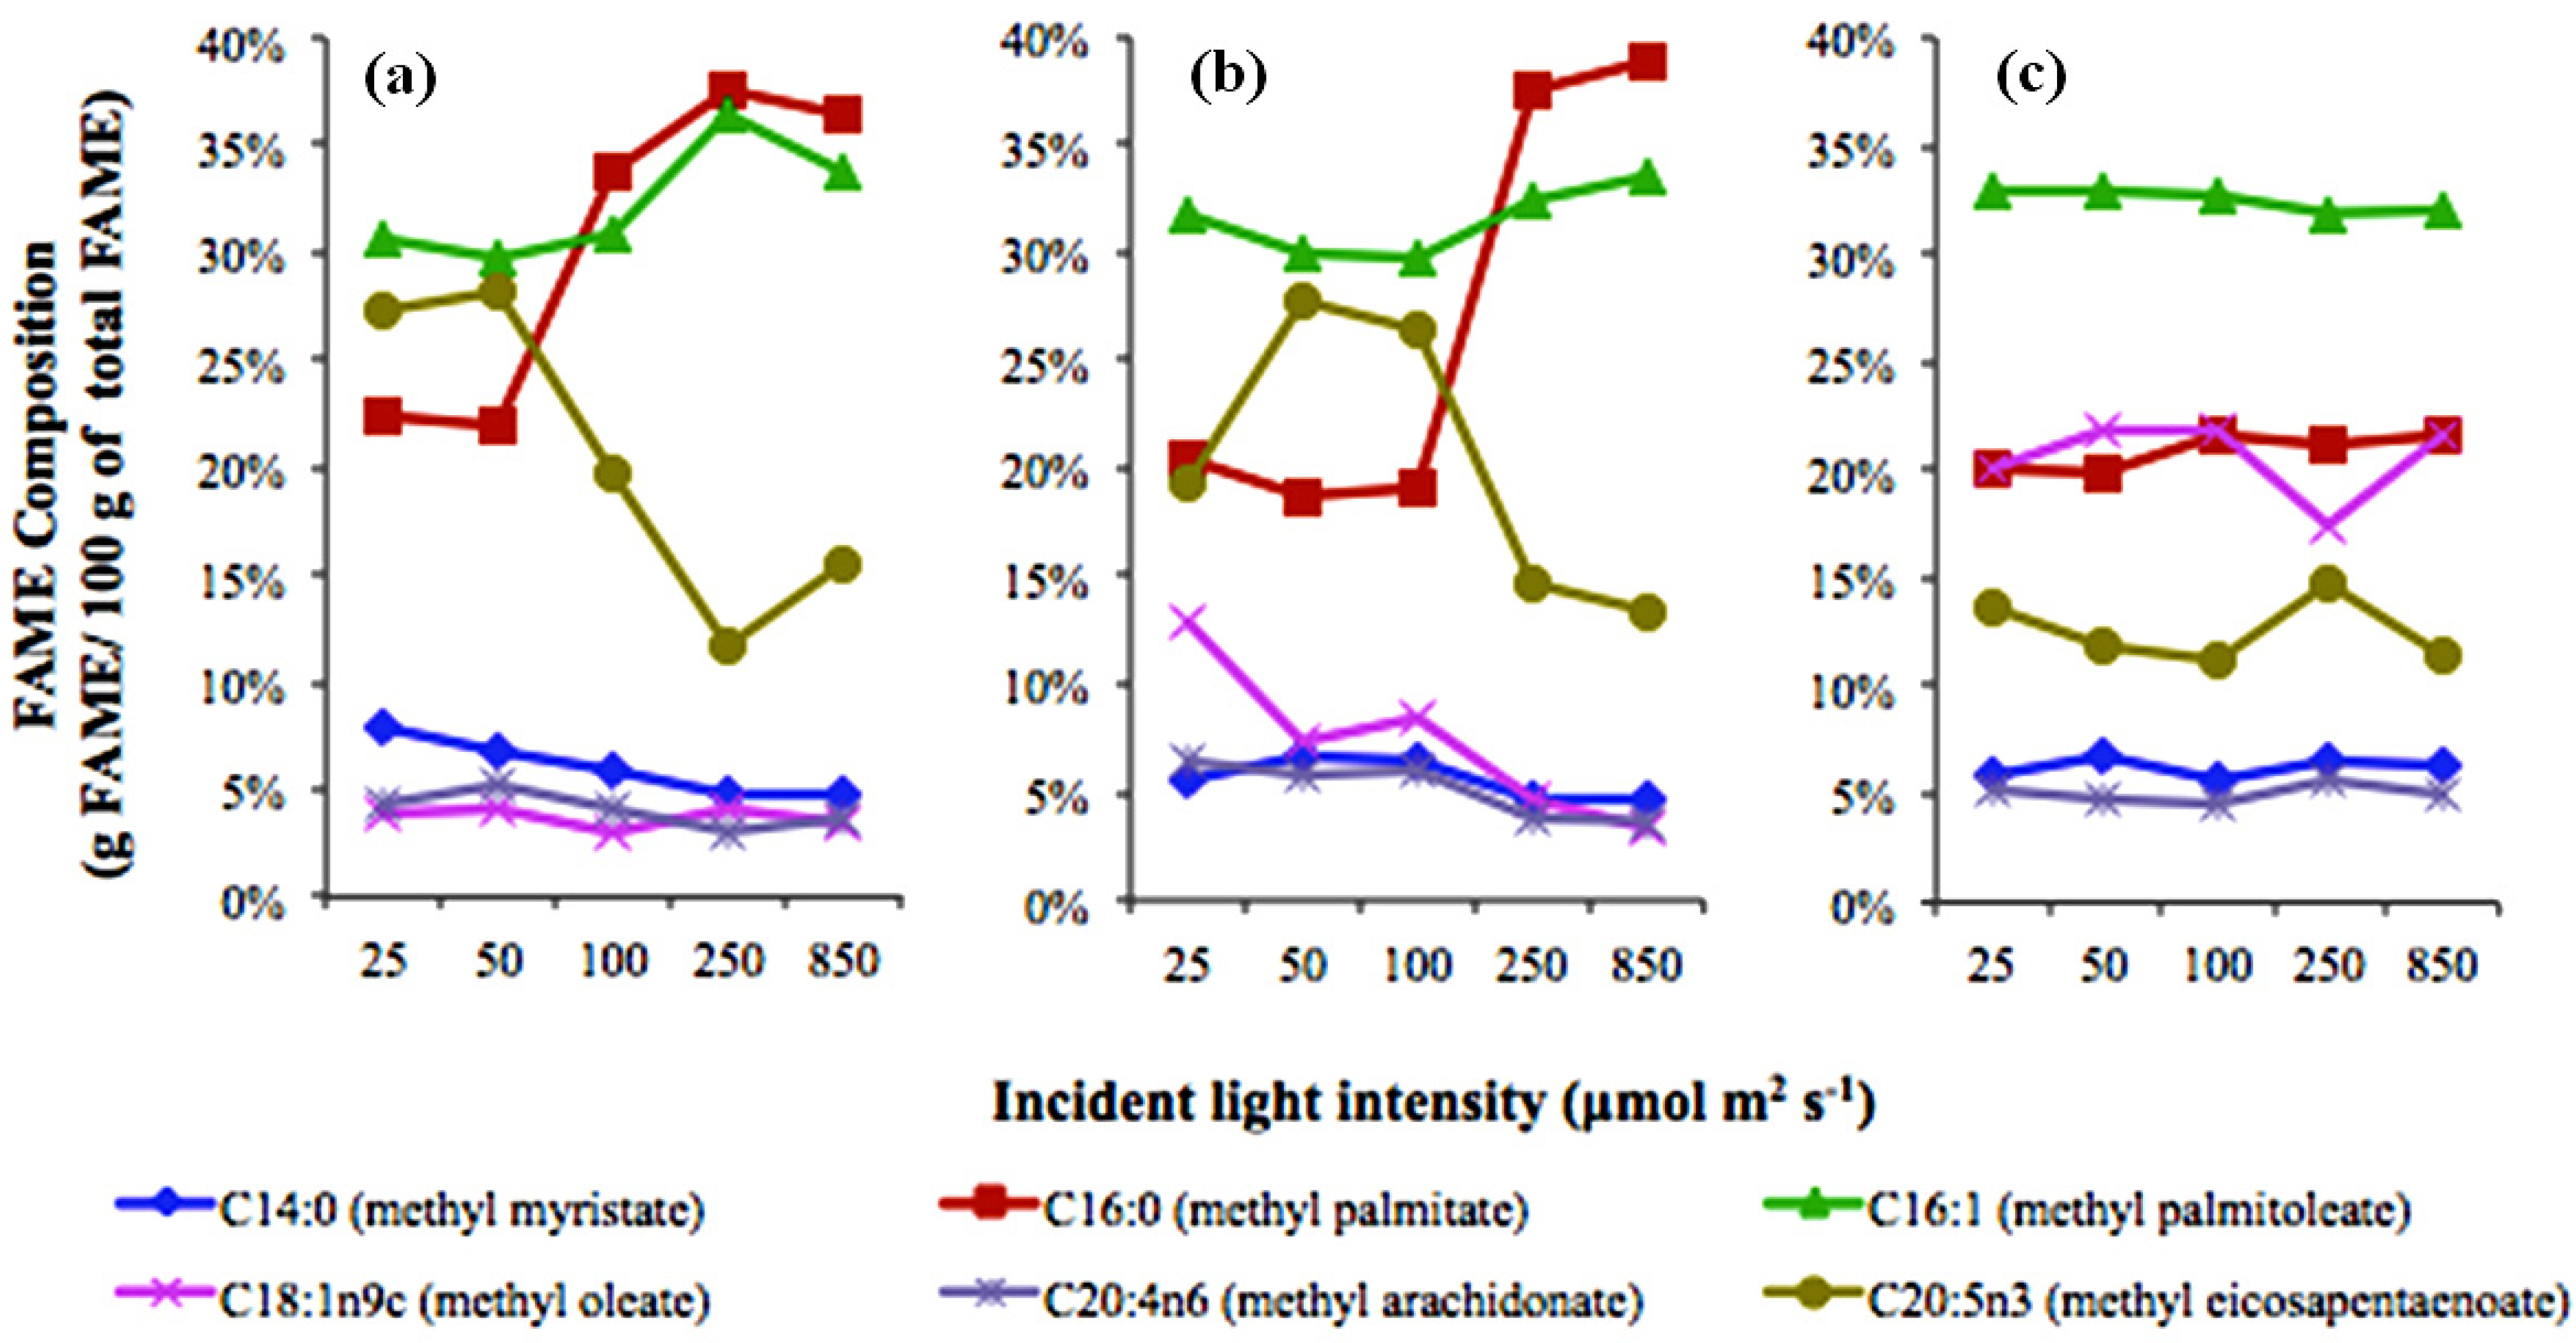
2.1. Light Effects

As light can be a limiting factor, the exponential growth rate (μ) of algae cultures in response to increasing irradiance (I) fits a typical “P-I” (photosynthesis vs. irradiance) curve, a linear increase followed by an asymptote as light becomes saturating. By making repeated measurements of acclimated, non-self-shading cultures [9] in Roux bottle photobioreactors, at various light intensities, the relationship between μ and I was found to be best approximated by a Monod-type function [10], with μmax = 1.3 day−1 and KI = 37 μmol m−2 s−1 photon flux density (PFD). No photoinhibition was observed at 850 μmol m−2 s−1, the maximum light intensity tested, and light saturation occurred above 250 μmol m−2 s−1.
After determining the exponential growth rate, the cultures were allowed to continue growing under nutrient-replete, pH and temperature controlled conditions. Cultures grew exponentially for five to ten days (Figure 1), followed by linear growth at sustained rates (r2 > 0.99 for biomass vs. time plots) for at least three weeks (Table 1). Although maximum biomass productivity was obtained at the highest light intensity, the most efficient light to biomass conversion (i.e., unit biomass formed per unit light supplied) [11] was obtained when incident light intensities were between 26 and 55 μmol m−2 s−1. Note that less than 5% of the incident light was transmitted through the bottle during linear growth, so that light supplied is a good approximation of light absorbed. Although algal cultures are able to absorb all the photons, the enzymes of the dark reactions limit photosynthetic efficiency at higher light intensities and excess energy must by dissipated as fluorescence or heat [10]. For this reason a photobioreactor design that increases surface area and decreases the intensity of light incident to the surface could increase areal productivity [12]. As the data in Table 1 indicate, the most effective photon utilization occurs in low-light cultures, which also have a lower culture density. Therefore, the tradeoff between biomass yield per photon and the cost of harvesting biomass must also be considered in any techno-economic assessment [12].
Figure 1. Biomass concentration (OD750) as a function of time in photobioreactor cultures operated at six different light intensity set points. (Note logarithmic scale, dry weight correlation was: AFDW (g/L) = 0.185 × OD750, r2 > 0.98).
Energies 05 00731 g001
In addition to affecting the growth rate, light intensity is expected to alter the fatty acid content and composition. In batch cultures with different incident light, fatty acid content and composition were a function of both incident light and the density of the culture (Figure 2 and Figure 3). The highest fatty acid content occurred in low-density (exponentially growing) cultures, which received light above the saturating light intensity. The increased fatty acid content corresponded to increases in the proportion of palmitic and palmitoleic acids [Figure 3(a)]. This is consistent with known models of photo-oxidative stress [5]. As Sukenik [13] demonstrated, the C16 fatty acids are the main components of triacylglycerols (TAGs) of Nannochloropsis sp. and TAGs are known to increase and become richer in C16 fatty acids with high light. Since biomass harvest is most efficient in high-density cultures, where the average light received by a cell will be low, a single-stage culture system could not be used to increase TAG content by photo-oxidative stress, however, this could potentially be achieved by transferring the dense culture to a very shallow pond just before harvest.
Table 1. Batch growth of N. salina in Roux bottle photobioreactors. PFD values are the mean and standard deviation of weekly measurements at five points on the bioreactor surface, volumetric productivity was measured during the linear growth period, defined as the time interval in which the plot of biomass concentration vs. time could be fit with a linear equation (r2 > 0.99), biomass yield on light calculated as in [11].
PFD ± SD (μmol m−2 s−1)Volumetric Productivity (g L−1 day−1)Linear Growth Period a (days)Maximum Concentration (g L−1)Biomass Yield vs. Light (g mol−1 Photon Supplied)
5 ± 0.50.0017>350.0790.18
26 ± 0.70.0472>562.50.96
55 ± 1.60.1077>596.21.03
96 ± 20.137487.00.75
234 ± 250.3613214.20.81
236 ± 230.3192210.40.71
833 ± 480.6452319.40.41
827 ± 580.5752817.20.37
a Linear growth continued to the end of the experiment in cases where the > symbol is used.
Figure 2. Fatty acid content of N. salina biomass in different growth phases as a function of light intensity when grown at 23 °C. Cultures were sampled during exponential growth (semi-continuous culture) and at the following time points in batch culture (days after dilution), “early linear” (9–12), “linear” (20–28), “late linear” (>40).
Energies 05 00731 g002
As the various cultures reached later growth stages, severe light-limitation resulted in very low average light intensities per cell in all cases, and the fatty acid content and composition converged to similar levels. The percentage of eicosapentaenoic acid (EPA) increased at the expense of palmitic acid as incident light decreased [Figure 3(a)] or culture density increased [as in the 100 μmol m−2 s−1 condition changes from Figure 3(a) to 3(b)]. As the fraction of EPA among lipid classes changes little with illumination according to Sukenik [13], the relative increase in EPA was likely a result of the decrease in TAG, which contains little EPA. As cultures reached high densities and all cells were exposed to similar low average light intensities, the fatty acid composition converged in all bioreactors, as oleic acid became more prevalent than EPA [Figure 3(c)]. The latter is a precursor for the former [14] indicating potential down-regulation of the fatty acid saturation and elongation pathway as a response to energy limitation. An increase in oleic acid is indicative of an increasing proportion of phospholipids (e.g., phosatidylcholine) at the expense of galactolipids (e.g., monogalactosyldiacylglycerol) according to previous reports of fatty acid distribution in lipid classes [15,16,17]. The proportion of oleic acid detected here (~20%) exceeds all previously reported values (Khozin-Goldberg [18] found 13% in some cases). This is likely due to the extended duration of culture, which was longer than in any known reports on cultivation of Nannochloropsis.
Figure 3. Fatty acid composition as a function of incident light intensity in Roux bottle photobioreactors in (a) exponential (b) early linear (c) late linear growth phases.
Energies 05 00731 g003

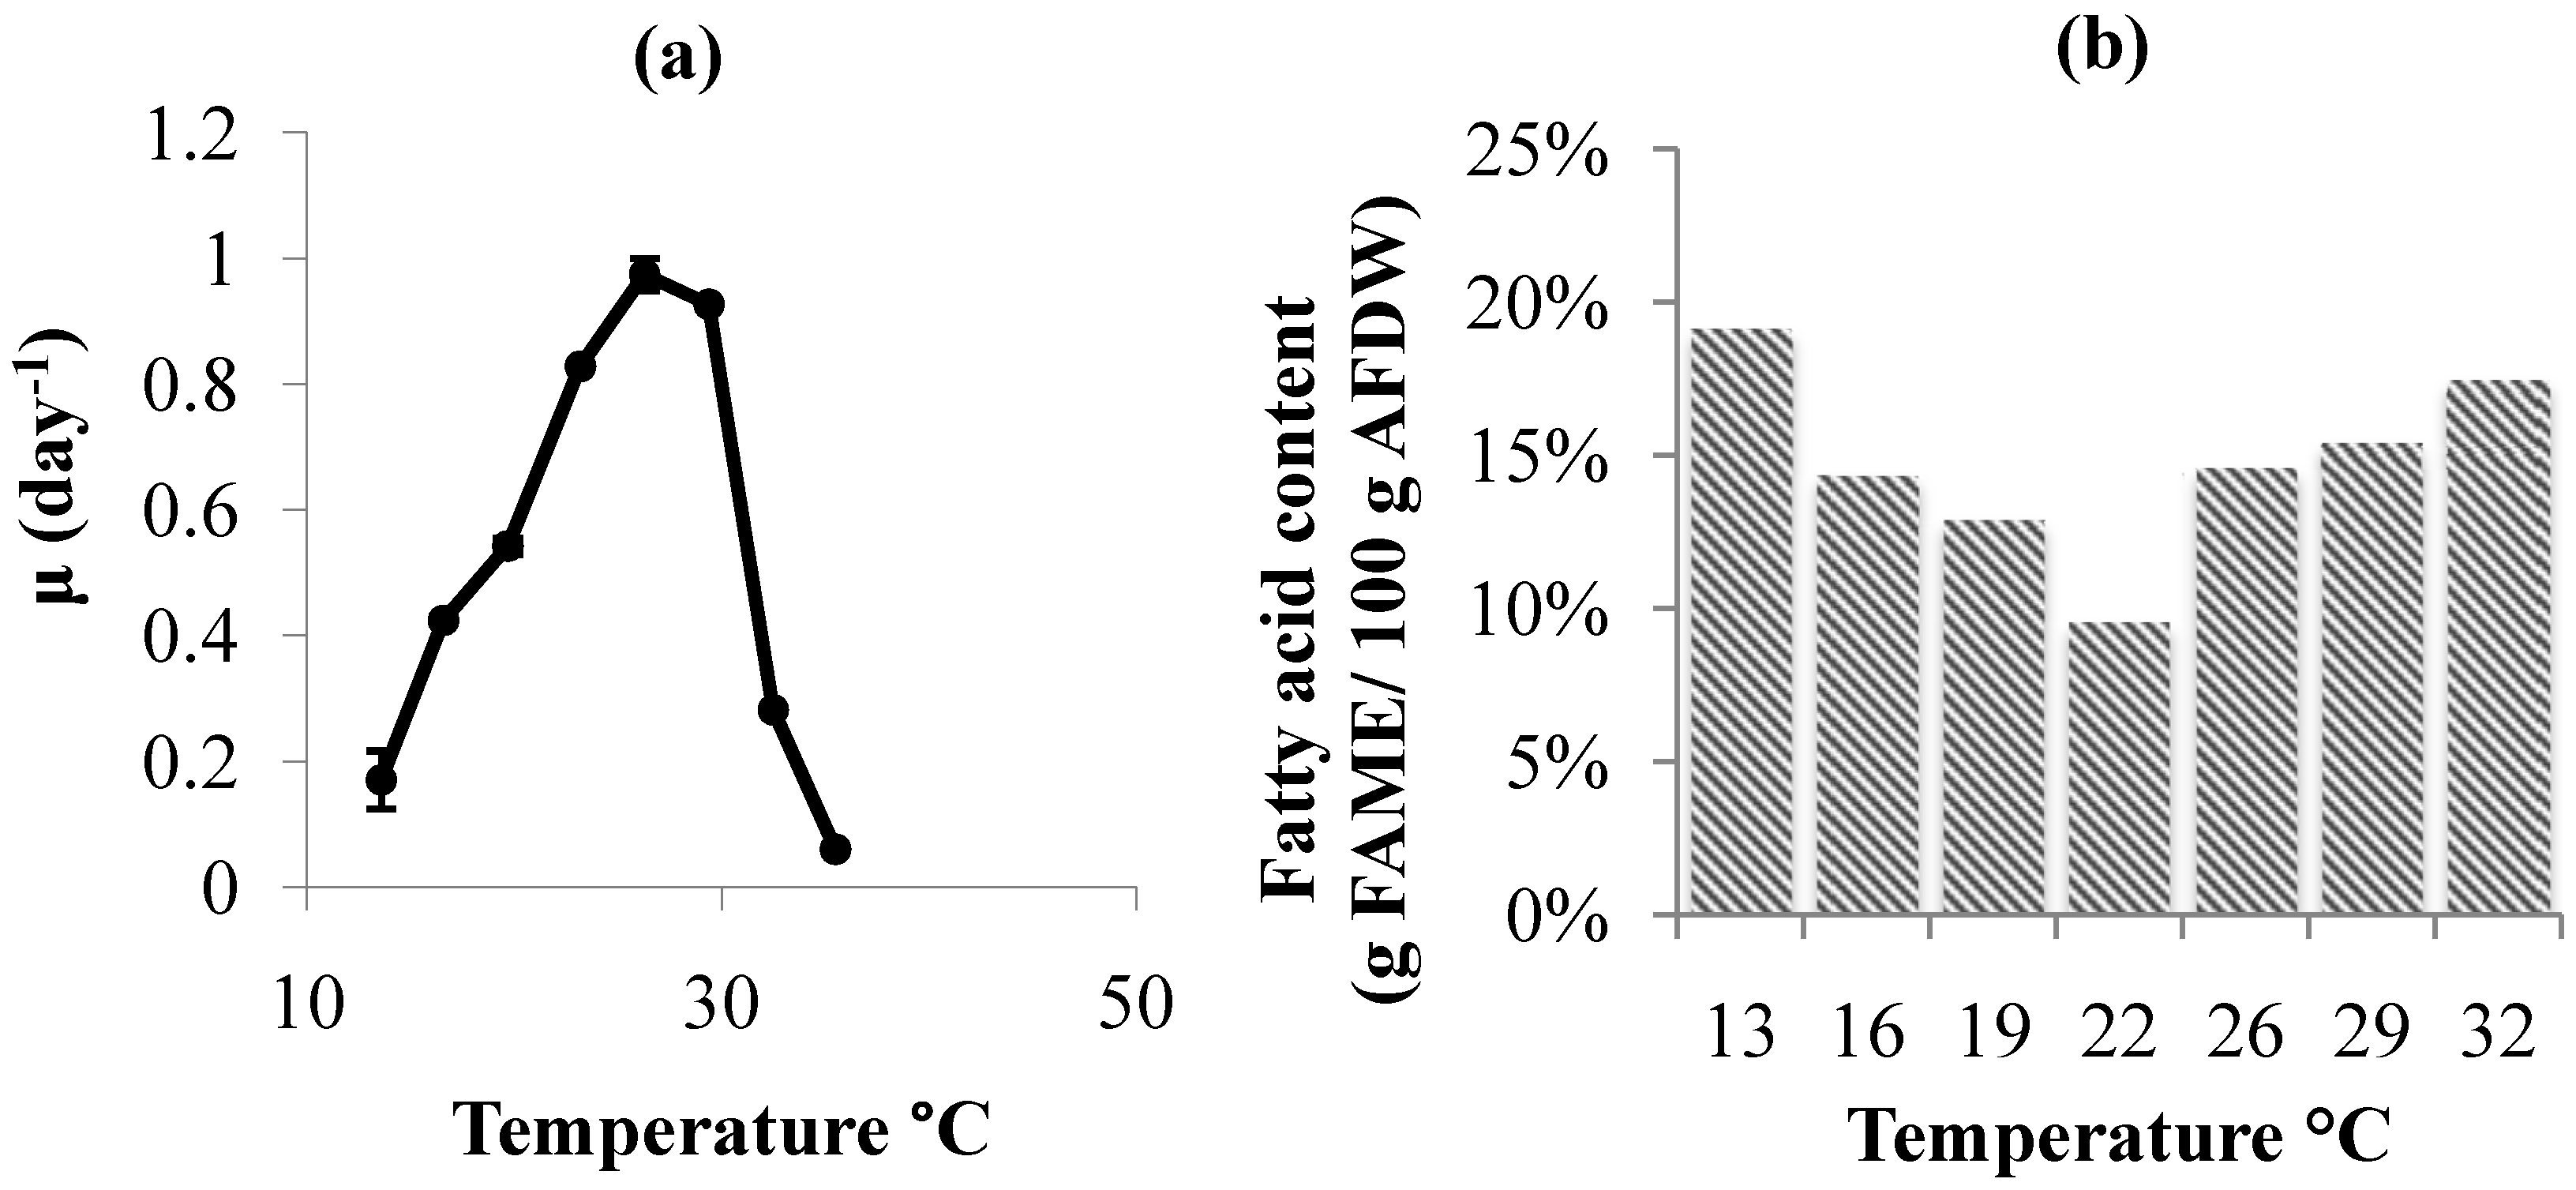
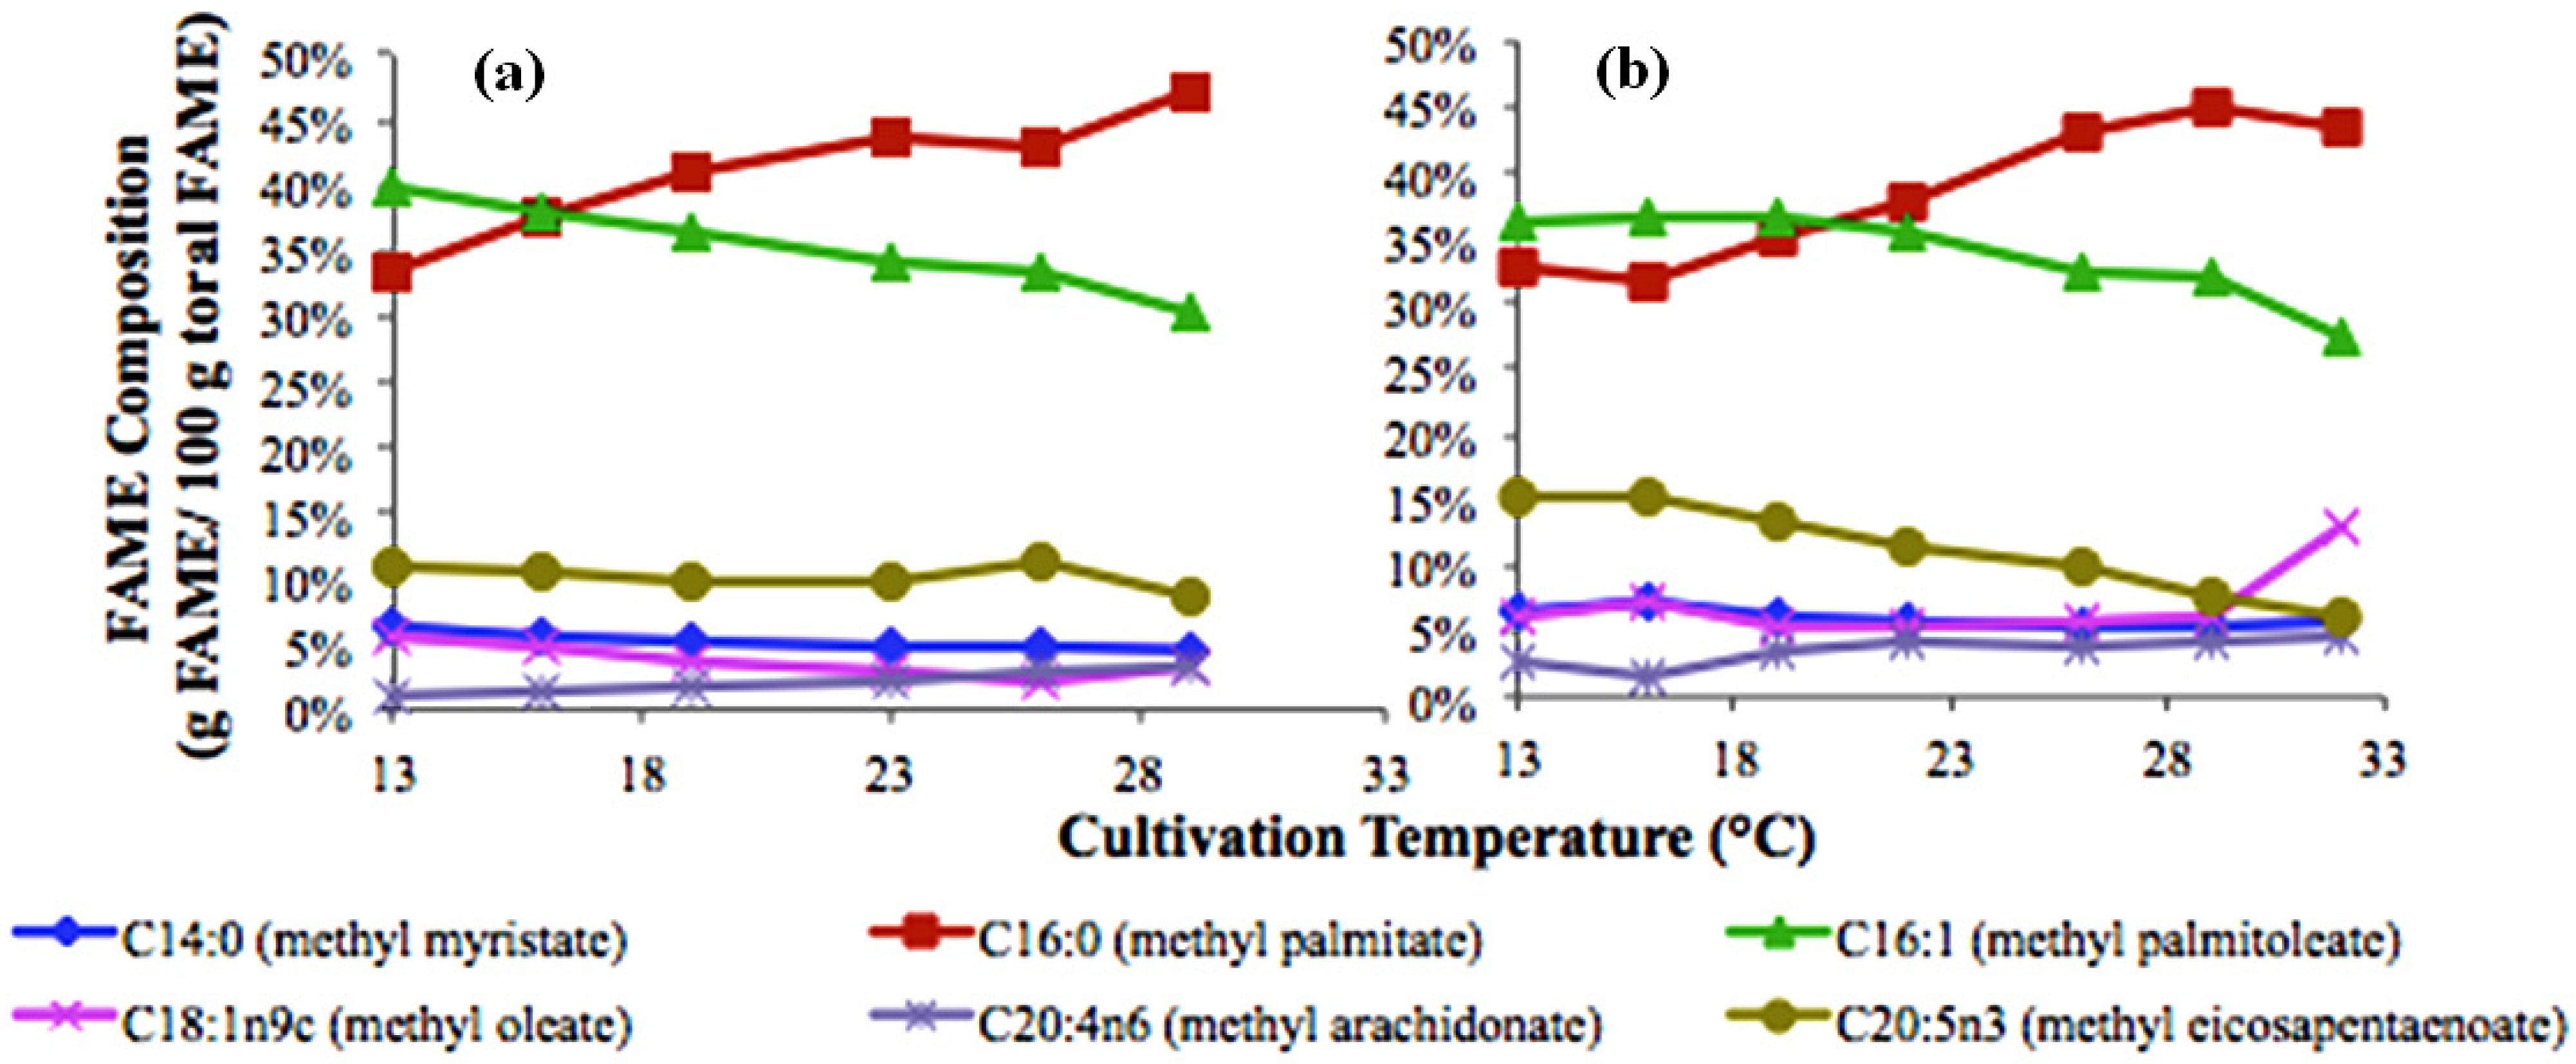
2.2. Temperature Effects

Temperature impacts physiology by changing the rate of chemical reactions and the stability of cellular components [19] . Most microbes respond to increases in temperature with increased exponential growth rates until reaching their optimum temperature, after which point loss of structural integrity tends to lead to sharp declines in growth rates [20]. Dilute N. salina cultures grown in sparged Erlenmeyer flasks reached their maximum specific growth rates at 26 °C, with no growth seen above 35 °C [Figure 4(a)].
To maintain structural integrity, many organisms self regulate lipid composition to maintain membrane fluidity at different temperatures [21]. N. salina maintains membrane stability by increasing the ratio of palmitic acid to palmitoleic acid at higher temperatures (Figure 5). As cultures became self-shading at the higher densities during the linear growth phase, EPA content decreased with increasing temperature (Figure 5b). Overall fatty acid content [Figure 4(b)] in linear stage cultures was roughly inversely proportional to growth rate [Figure 4(a)]. This could indicate that the faster growing cultures devote more material to structural components and do not accumulate lipids as quickly, which implies that growth rate, as well as temperature, may determine fatty acid content, as described in [5,22].
Figure 4. Specific growth rate (a) and fatty acid content (b) of N. salina as a function of temperature.
Energies 05 00731 g004
Figure 5. Fatty acid composition as a function of temperature in exponential (a) and linear (b) cultures of N. salina.
Energies 05 00731 g005

3. Experimental Section

3.1. Maintenance and Analytical Methods

Nannochloropsis salina CCMP 1776 was obtained from the Bigelow culture collection and maintained in f/2-Si medium [9] supplemented with 10 mM sodium nitrate and 0.4 mM sodium phosphate monobasic on a shaker table with a light intensity of approximately 50 μmol photons m−2 s−1. Cells were cryopreserved in medium supplemented with 10% dimethyl sulfoxide and stored in liquid nitrogen until being thawed prior to each experiment [9,23]. Growth was monitored via optical density at 750 nm (OD750). Ash free dry weight (AFDW) was measured by filtering onto Whatman GF/F filters, drying at 100 °C overnight and combusting at 520 °C for 4 h [24]. Dry weight was measured by dividing the weight of freeze-dried algal pellets by the culture volume used to generate the pellet.

3.2. Thermal Gradient Culture

A thermal gradient incubator (TGI) was constructed from two slabs of aluminum with a heating element and machined channels for the circulation of coolant on opposite ends [25]. The TGI was designed to contain eight separate water temperature zones in triplicate 100 mL cultures in 125 mL Erlenmeyer flasks. Thermal stability was maintained by using a feedback loop controlled by a Stanford Instruments PCT10 temperature controller. Fluorescent tubes provided light with an intensity (photon flux) of at least 150 μmol m−2 s−1. A gaseous mixture of 0.5% carbon dioxide in air was bubbled through the system and pH of 7.5 was maintained by increasing the flow rate to ensure that mass transfer of CO2 was not limiting. A shaker table was used for mixing.

3.3. Light Effect Determination

Light intensities of 5, 25, 50, 100, 250 and 850 μmol m−2 s−1 were achieved by using high intensity fluorescent bulbs modulated by neutral density filters. Roux bottles (1 L) were mixed with magnetic stir bars and sparged with CO2-enriched air as described above. The bottles were placed in a temperature controlled glass water bath to maintain temperature at 23 °C. Nitrate concentration was monitored using test paper (EMD Chemicals 10020-1) and nitrate and phosphate stocks were added at their original ratio to ensure these chemicals were never limiting.

3.4. Growth Rate Calculation

The exponential growth rate (μ) was measured during semi-continuous batch culture, maintained until an acclimated μ could be determined from the slope of a semi-log plot [9]. After establishing a linear correlation between OD750 and AFDW (g/L) (AFDW = 0.185 × OD750, r2 > 0.98) the following formula was used to determine growth rate:
μ = ln(Bf/B0)/t
where Bf and B0 are the biomass concentration (as converted from OD) at two time points and t is the intervening time. The growth rate could also be determined from the slope of a semi-log plot of biomass vs. time.

3.5. Fatty Acid Quantification

Transesterification was performed by adding 2.5% sulfuric acid in methanol to freeze dried biomass and after one hour anaerobic incubation at 90 °C, fatty acid methyl esters (FAMEs) were extracted in hexane [26]. FAMEs were separated by gas chromatography in a capillary column (60 m, 0.25 mm) with flame ionization detection (GC-FID). Helium was used as the carrier gas with an injector and FID temperature of 250 °C, with the oven ramping from 50 °C to 250 °C at a rate of 5 °C min−1. Quantification was performed relative to a marine oil FAME mix (Restek) standard and yield was calculated from the ratio of surrogate (C21) to internal standard (C17). All measurements are results of individual biological replicates. Recovery rate for surrogate C21 fatty acids was greater than 80% for all data used.

4. Conclusions

This study determined the effects of temperature and light on the growth and fatty acid profile of Nannochloropsis salina. The optimal tested growth temperature was 26.3 °C, with the specific growth rate declining to less than 30% of this maximum rate at 32.5 and 13.6 °C, respectively. The linear growth rate increased with light, although photon conversion efficiency decreased for light intensities above 55 μmol m−2 s−1. Total fatty acid content can be increased by exposing the species to photo-oxidative stress, or by slowing the growth rate by exposing the culture to extreme (i.e., high or low) temperatures. As Griffiths [8] points out, previous research on algae lipid productivity is fragmentary, with different measurements carried out for different purposes, so comparison among studies is difficult. However, once a species has been identified as promising, the methods described here may be applied to better predict its biofuel production potential at various combinations of time of year and location.

Acknowledgments

Li-Jung Kuo helped greatly by developing the FAME analysis method. The authors would like to acknowledge funding of this work by the US Department of Energy under contract DE-EE0003046 awarded to the National Alliance for Advanced Biofuels and Bioproducts and support to Sam Hobbs, Paul Hook and Tyler Miller via the U.S. DOE SULI program.

References

  1. Sheehan, J. A Look Back at the U.S. Department of Energy’s Aquatic Species Program—Biodiesel from Algae Office of Fuels Development; National Renewable Energy Laboratory Denver: Denver, CO, USA, 1998; Volume 328. [Google Scholar]
  2. Chisti, Y. Biodiesel from microalgae. Biotechnol. Adv. 2007, 25, 294–306. [Google Scholar] [CrossRef] [PubMed]
  3. Lundquist, T.; Woertz, I.; Quinn, N.; Benemann, J. A Realistic Technology and Engineering Assessment of Algae Biofuel Production. Energy Biosciences Institute: Berkeley, CA, USA, 2010. Available online: http://works.bepress.com/tlundqui/5 (accessed on 7 March 2012).
  4. Pienkos, P.T.; Darzins, A. The promise and challenges of microalgal-derived biofuels. Renew. Energy 2009, 3, 431–440. [Google Scholar]
  5. Hu, Q.; Sommerfeld, M.; Jarvis, E.; Ghirardi, M.; Posewitz, M.; Seibert, M.; Darzins, A. Microalgal triacylglycerols as feedstocks for biofuel production: perspectives and advances. Plant J. Cell Mol. Biol. 2008, 54, 621–639. [Google Scholar] [CrossRef]
  6. Ryan, R.D.; Waller, P.M.; Kacira, M.; Li, P. Aquaculture Raceway Integrated Design. U.S. Patent. 3 February 2011. Available online: http://www.google.com/patents/US20110023360?dq=raceway+integrated+ design + waller (accessed on 9 January 2012).
  7. Wigmosta, M.S.; Coleman, A.M.; Skaggs, R.J.; Huesemann, M.H.; Lane, L.J. National microalgae biofuel production potential and resource demand. Water Resour. Res. 2011, 47, 1–13. [Google Scholar] [CrossRef]
  8. Griffiths, M.J.; Harrison, S.T.L. Lipid productivity as a key characteristic for choosing algal species for biodiesel production. J. Appl. Phycol. 2009, 21, 493–507. [Google Scholar] [CrossRef]
  9. Andersen, R. Algal Culturing Techniques; Elsevier/Academic Press: Burlington, MA, USA, 2005. [Google Scholar]
  10. Richmond, A. Handbook of Microalgal Culture; Blackwell Science: Oxford, UK, 2003. [Google Scholar]
  11. Cuaresma, M.; Janssen, M.; Jan, E.; End, V.D.; Vílchez, C.; Wijffels, R.H. Bioresource Technology Luminostat operation: A tool to maximize microalgae photosynthetic efficiency in photobioreactors during the daily light cycle? Bioresour. Technol. 2011, 102, 7871–7878. [Google Scholar] [CrossRef] [PubMed]
  12. Posten, C. Design principles of photo-bioreactors for cultivation of microalgae. Eng. Life Sci. 2009, 9, 165–177. [Google Scholar] [CrossRef]
  13. Sukenik, A.; Zmora, O.; Carmeli, Y. Biochemical quality of marine unicellular algae with special emphasis on lipid composition II. Nannochloropsis sp. Aquaculture 1993, 117, 313–326. [Google Scholar]
  14. Guschina, I.A.; Harwood, J.L. Lipids and lipid metabolism in eukaryotic algae. Prog. Lipid Res. 2006, 45, 160–186. [Google Scholar] [CrossRef] [PubMed]
  15. Sukenik, A.; Carmeli, Y.; Berner, T. Regulation of fatty acid composon by irradiance level in the eustigmatophyte Nan-nochloropsis sp. J. Appl. Phycol. 1989, 25, 686–692. [Google Scholar] [CrossRef]
  16. Dunstan, G.A.; Volkman, J.K.; Barrett, S.M.; Garland, C.D. Changes in the lipid composition and maximisation of the polyunsaturated fatty acid content of three microalgae grown in mass culture. Cultures 1993, 5, 71–83. [Google Scholar]
  17. Hodgson, P.A.; Henderson, R.J.; Sargent, J.R.; Leftley, J.W.; Down, C. Patterns of variation in the lipid class and fatty acid composition of Nannochloropsis oculata (Eustigmatophyceae) during batch culture I. The growth cycle. Culture 1991, 2, 169–181. [Google Scholar]
  18. Pal, D.; Khozin-Goldberg, I.; Cohen, Z.; Boussiba, S. The effect of light, salinity, and nitrogen availability on lipid production by Nannochloropsis sp. Appl. Microbiol. Biotechnol. 2011, 90, 1429–1441. [Google Scholar] [CrossRef] [PubMed]
  19. Sandnes, J.M.; Källqvist, T.; Wenner, D.; Gislerød, H.R. Combined influence of light and temperature on growth rates of Nannochloropsis oceanica: linking cellular responses to large-scale biomass production. J. Appl. Phycol. 2005, 17, 515–525. [Google Scholar] [CrossRef]
  20. Brock, T. Brock’s Biology of Microorganisms, 12th ed.; Pearson Benjamin Cummings Press: San Francisco, CA, USA, 2009. [Google Scholar]
  21. Voet, D. Biochemistry, 3rd ed.; Wiley Press: New York, NY, USA and Chichester, UK, 2003. [Google Scholar]
  22. Williams, P.J.L.B.; Laurens, L.M.L. Microalgae as biodiesel & biomass feedstocks: Review & analysis of the biochemistry, energetics & economics. Energy Environ. Sci. 2010, 3, 554. [Google Scholar] [CrossRef]
  23. Gwo, J.-C.; Chiu, J.-Y.; Chou, C.-C.; Cheng, H.-Y. Cryopreservation of a marine microalga, Nannochloropsis oculata (Eustigmatophyceae). Cryobiology 2005, 50, 338–343. [Google Scholar] [CrossRef] [PubMed]
  24. Huesemann, M.H.; Hausmann, T.S.; Bartha, R.; Aksoy, M.; Weissman, J.C.; Benemann, J.R. Biomass productivities in wild type and pigment mutant of Cyclotella sp. (Diatom). Appl. Biochem. Biotechnol. 2009, 157, 507–526. [Google Scholar] [CrossRef] [PubMed]
  25. Thomas, W.H.; Scotten, H.L.; Bradshaw, J.S. Thermal Gradient Incubators for Small Aquatic Organisms. Limnol. Oceanogr. 1963, 8, 357–360. [Google Scholar] [CrossRef]
  26. Christie, W. Lipid Analysis: Isolation, Separation, Identification and Lipidomic Analysis, 4th ed.; Oily Press: Bridgwater, UK, 2010. [Google Scholar]

