Review

Experimental Simulation of the Exploitation of Natural Gas Hydrate

State Key Laboratory of Heavy Oil Processing, China University of Petroleum, Beijing 102249, China
*
Author to whom correspondence should be addressed.
Energies 2012, 5(2), 466-493; https://doi.org/10.3390/en5020466
Submission received: 20 January 2012 / Revised: 7 February 2012 / Accepted: 8 February 2012 / Published: 22 February 2012
(This article belongs to the Special Issue Natural Gas Hydrate 2011)

Abstract

:
Natural gas hydrates are cage-like crystalline compounds in which a large amount of methane is trapped within a crystal structure of water, forming solids at low temperature and high pressure. Natural gas hydrates are widely distributed in permafrost regions and offshore. It is estimated that the worldwide amounts of methane bound in gas hydrates are total twice the amount of carbon to be found in all known fossil fuels on earth. A proper understanding of the relevant exploitation technologies is then important for natural gas production applications. In this paper, the recent advances on the experimental simulation of natural gas hydrate exploitation using the major hydrate production technologies are summarized. In addition, the current situation of the industrial exploitation of natural gas hydrate is introduced, which are expected to be useful for establishing more safe and efficient gas production technologies.

1. Introduction

Gas hydrates are ice-like crystalline compounds comprised of small guest molecules, such as methane or other light hydrocarbons, which are trapped in cages of a hydrogen-bonded water framework. The early study on gas hydrates, carried out by Priestly, can be traced back to 1778 [1]. Later Davy discovered the first chlorine hydrate in the laboratory in 1810 [2]. In the 1930s, gas hydrates have drawn attention in the gas and oil industry as people realized that the formation of gas hydrates may block oil/gas pipelines [3], so some research institutions began to study how to inhibit hydrate formation. People did not realize that gas hydrates were a potential clean energy until natural gas hydrates were found in the Siberian permafrost in 1964. Later in the 1970s, people also found natural gas hydrate in marine sediments. With the implementation of the Deep Sea Drilling Project (DSDP), the Ocean Drilling Program (ODP), and the Integrative Ocean Drilling Program (IODP), huge global reserves of natural gas hydrates were discovered in the past twenty years. According to Kevenvolden [4], it is estimated that the global hydrate-bound methane is 1.8–2.1 × 10¹⁶ m3 which is total twice the amount of carbon to be found in all known fossil fuels (coal, oil, and natural gas) on earth. With respect to the situation in China, the preliminary evaluation shows that the amount of methane bound in gas hydrates in the northern part of South China Sea is around 84.5 billion tons of equivalent oil, which is about half of the known oil and gas resources in China [5].
To realize the effective production of natural gas hydrates, it is important to establish a safe and efficient gas exploitation technology. However, there are many difficulties that hinder the development of the related technologies. First, the basic physical properties data of natural gas hydrate are not sufficiently known. It is hard to get natural gas hydrate samples, which brings about difficulties for obtaining the relevant physical properties. The proper investigations of physical properties are important for understanding the in-situ hydrate formation mechanism and the related production technologies. Second, the limitation of hydrate exploration technologies impedes the development of the related exploitation technologies. At present, the main adopted exploration technologies are geophysical and geochemical exploration. Geophysical detection technology includes seismic surveys and the borehole logging method. Geochemical exploration is performed by analyzing actual core samples and serves as an important role in gas hydrate exploration when combined with geophysical exploration. To some extent, these technologies are expensive, complicated to implement and have many uncertainties. Third, the risk is still very high for exploitation of natural gas hydrate resources. It is known that 90% of natural gas hydrate is methane hydrate and the greenhouse effect of methane is 20 times that of CO2. If methane hydrate decomposition cannot be effectively controlled, the concentration of methane in seawater will increase. Once methane is saturated, the excess methane will escape into the atmosphere, leading to an increase in atmospheric methane concentrations. In addition, some researchers warned that the decomposition of gas hydrate in submarine environments could lead to geological disasters as recent studies have shown that the decomposition of gas hydrates in submarine sediments can lead to a decrease of the sediment consolidation strength and the slope stability, which is considered to be one of the important reasons for submarine landslides.
Despite the difficulties mentioned above, more and more studies have focused on how to exploit natural gas hydrates in recent years. The research is carried out not only with one-dimensional devices in the laboratory, but also with two-dimensional or three-dimensional devices to obtain more comprehensive information. For example, a 9 L reactor was designed and used on hydrate formation and dissociation by Bonnefoy and Herri [6]. With respect to the exploitation technologies, in addition to the traditional depressurization, thermal stimulation, and chemical inhibitor stimulation methods, a number of new exploitation technologies, such as the CO2 replacement method, microwave technology [7,8], the hydraulic fracturing method, and the ground decomposition method [9] were proposed in recent years. Since studies on these new technologies are relatively scarce, in this paper, the discussions are mainly focused on the traditional exploitation technologies. The recent progresses in experimental simulation as well as the current situation of the industrial exploitation of natural gas hydrates are summarized, including our work relevant to this topic.

2. Distribution of Global Natural Gas Hydrate Resource

In order to realize the effective exploitation of natural gas hydrates, first of all it is necessary to have information about the distribution of the natural gas hydrate resource.

2.1. Amount and Distribution Area of Global Natural Gas Hydrate Resource

Natural gas hydrates are widely distributed in permafrost regions and offshore. With the growing knowledge of the distribution and saturation of gas hydrates in sediments and ongoing efforts to better constrain the volume of hydrate-bearing sediments and their gas yield, the global estimates of hydrate-bound gas have decreased by at least one order of magnitude. From the 1970s to the early 1980s, the estimated amount was 1017–1018 m3 of methane; in late 1980s to early 1990s it was 1016 m3 of methane; from the late 1990s to present it was 1014–1015 m3 of methane. According to Milkov [10], it is estimated that the global hydrate-bound gas is 21 × 1015 m3 of methane. In the case of China, hydrates also exist abundantly in the seafloor and permafrost. Gas hydrate resources in the north of the South China Sea is estimated to be 6.435 × 10¹³–7.722 × 10¹³ m3 gases [11] and 2.71–2.99 × 10¹¹ m3 gases in Qilian Mountain permafrost [12], which illustrates the tremendous energy resource potential.
In the past 50 years, natural gas hydrates have been discovered in 79 countries. To date over 230 natural gas hydrate deposits (NGHD) have been found [13] and currently the deposits of natural gas hydrates are found all over the world in deepwater or/and in the Arctic [14]. Among them, there are 11 huge natural gas hydrate mining areas around North America and gas hydrate resources are estimated to be 58×1012 m3 of methane [15]. Natural gas hydrates is very abundant in Russia too, mainly distributed in the Black Sea, Barents Sea, and Okhotsk Sea regions. The hydrate-bound gas is about 3057 × 1012 m3 of methane [15]. The resources in Japan and India are also impressive. In China, the confirmed natural gas hydrate resource is mainly distributed in the South China Sea and Qilian Mountain permafrost. In 2007, several wells were drilled in the Shenhu area in the north of the South China Sea and gas hydrate samples were obtained. The Scientific Drilling Project of Gas Hydrate in Qilian Mountain, Qinghai-Tibet Plateau permafrost was implemented during 2008–2009. Gas hydrate samples collected in this area were the first discovery in China’s permafrost and in the low-middle latitude permafrost of the world. After Canada, the United States, and Russia, China is the fourth country that has obtained hydrate samples in permafrost so far. To give readers a general idea of the distribution area of global natural gas hydrate resources, the hydrate distribution zones in the world are listed in Table 1.
Table 1. Hydrate distribution zones in the world.
ClassificationGeographic locationDistribution characteristicsReference
Terrestrial hydrate zoneMessoyakha River basin to the north and northeast of RussiaThe distribution area is 1700 × 104 km2 and the depth of hydrate layer is underground 300–1000 m[16,17]
Prudhoe Bay to the north slope of AlaskaThe depth of hydrate layer is underground 210–950 m and the amount of natural gas hydrate in the north slope of Alaska is about 1.0–1.2 × 10¹² m3[18,19]
Mackenzie Delta to North PoleThe depth of the hydrate layer is 200 m underground[20]
Qinghai-Tibet Plateau permafrost regionBelow the permafrost layer 133–396 m[21]
Marine hydrate zoneGas hydrate formation zone in the Arctic OceanIt is estimated that the region from 90 m water depth to mainland in the Arctic continental shelf is the permafrost zone. The hydrate distribution in this region is similar to that in terrestrial permafrost zone.[22,23]
Gas hydrate formation zone in the AtlanticBlack Ridge (natural gas hydrate present between 190–450 m in sediment column, and the amount is at least 67 × 1015 g), Gulf of Mexico (approximately 500–1000 m below the mudline), Gulf of Guinea, Spitzbergen Margin[24,25,26,27]
Gas hydrate formation zone in the PacificHydrate Ridge (the volume of methane gas in hydrate reservoirs is 6.4 × 10¹⁰ m3); in the Nankai Trough off Japan (the natural gas hydrate resource is 4–20 trillion cubic meters); in the Okhotsk Sea [the methane preserved in hydrate is (15 ± 12) × 1013 m3]; in the South China Sea (the top of the hydrate layers are located 155–229 m below the seafloor, and the thickness varies from 10 to 43 m); Middle America Trench; Hikurangi Trough off New Zealand; the Bering Sea[28,29,30,31,32,33,34,35,36]
Gas hydrate formation zone in the Indian OceanThe Arabian Sea gas hydrate deposits area is about 80,000 km2, The Gulf of Oman gas hydrate layer is stable within the uppermost 350–700 m of sediment[18,37,38,39]
Gas hydrate formation zone in inland seasThe Black Sea (the thickness of natural gas hydrate is between 160–500 m based on the depth of seawater, the distribution area is 3.0 × 10⁴ km2, and the amount of natural gas hydrate is about 42 × 1012 m3), The Caspian Sea (the top of the hydrate layers are located 390–480 m below the seafloor, and the thickness of hydrate layer is 134–152 m), The Azov Sea Basin[15,40]

2.2. Discovered Natural Gas Hydrate Deposits in the World

By analyzing gas hydrate samples obtained from the ODP, DSDP as well as other marine survey programs, and the Bottom-Simulating Reflector (BSR) seismic data, it is found that gas hydrates are mainly distributed in the continental slope and continental rise areas of marginal seas, and its distribution is closely related to the specific marine geology characteristics. In the active continental margin (mainly in the Pacific Ocean), gas hydrates exist in the accretionary wedge of the subduction zone edge. In the passive continental margins, however, gas hydrates exist mainly in the offshore areas where sediment supply and the organic content in water are rich. In addition, traces of natural gas hydrate are often found in the regions where submarine mud volcano appears.
Through exploration, people come to realize that the regions where natural gas hydrates exist are closely related to geochemical anomalies. Table 2 lists the discovered natural gas hydrate deposits in the world.
Table 2. The discovered natural gas hydrate deposits in the world (taken in part from Reference [15]).
No.Natural gas hydrate depositsEvidence of hydrate samples
1Pacific Ocean off PanamaBSR
2Middle America Trench (MAT)BSR
core sampling
3MAT off NicaraguaBSR
4MAT off GuatemalaBSR
core sampling
core sampling
chlorine abnormal
chlorine abnormal
5MAT off Mexicocore sampling
6Mexico(Gulf of California, Guaymas Basin)BSR
7Eel River basin off CaliforniaBSR
core sampling
8Oregon USA (Cascadia Basin)BSR
core sampling
9Vancouver Island(Cascadia Basin)BSR
10E. Aleutian Trench off AlaskaBSR
11Mid Aleutian TrenchBSR
chlorine abnormal
12Bering Sea Alaskavertical velocity abnormal
13Beringian margin off AlaskaBSR
14Shirshov Ridge (Russia)BSR
15Paramushir Island (Okhotsk Sea)core sampling
16Japan (Japan Sea)core sampling
17Japan (Japan Trench)chlorine abnormal
18Nankai Trough off JapanBSR
19Hikurangi Trough off New ZealandBSR
20Peru-Chile Trench off ChileBSR
21Peru-Chile Trench off PeruBSR
core sampling
22Sahkalin Island (Russia) (Okhotsk Sea)core sampling
23Argentina (Central Argentine Basin)BSR
24Brazil(Amazon Fan)BSR
25Barbados Ridge Complex off BarbadosBSR
26S. Caribbean SeaBSR
27Colombia Basin off Panama & ColombiaBSR
28Gulf of Mexico off MexicoBSR
29Gulf of Mexico off S. USAcore sampling
30Blake Outer Ridge off SE USABSR
core sampling
chlorine abnormal
core sampling
31Carolina RiseBSR
32Continental Rise off E. USABSR
33Labrador Shelf off NewfoundlandBSR
34Norway (Cont. Slope)BSR
chlorine abnormal
35Crimea, Ukraine Black Sea (Russia)core sampling
36Caucasus, Russia Black SeaBSR
37Makran Margin, Gulf of OmanBSR
38Beaufort Sea off AlaskaBSR
39Beaufort Sea off Canadawell logging
40Svedrup Basin off Canadawell logging
41Norway (Barents Sea)BSR
42Svalbard(Fram Strait)BSR
43Wilkes Land Margin off AntarcticaBSR
44W. Ross Sea off Antarcticagas
chlorine abnormal
45Weddell Sea off AntarcticaBSR
46Caspian Sea, Azerbaijancore sampling
47Lake Baikal, RussiaBSR
BSR
48North slope, Alaskawell logging
core sampling
49Mackenzie Delta, Canadawell logging
core sampling
50Arctic Island, Canadawell logging
51Timan-Pechora Province, USSRgas
52Messokayha Field, USSRcore sampling
53E. Siberian Craton, USSRgas
54NE Siberia, USSRgas
55Kamchatka, USSRgas
56the volcanoes in the eastern Mediterranean Seagas and isotope of oxygen
57Isla Mocha across the southern Chile marginBSR
58The northwestern Sea of OkhotskBSR
59Santa Barbara Basingas
60Manon site at the outer edge of the Barbadoschlorine abnormal
61Congo-Angolacore sampling
62Hakon Mosby mud volcano in the Norwegiian Seacore sampling
63The Ormen Lange area of the Storegga Slideseismic data
64The northern part of South China Sea (Xisha region), Dongsha region, and the edge of ManilaBSR, core sampling
65Costa Rica forearccore sampling
66Barkley Canyoncarbon and deuterium isotope abnormal
67Congo Basin, offshore southwestern Africacore sampling
68The Makassar Strait, between the islands of Borneo and Sulawesi, offshore Indonesiacore sampling
69Sado Island in the eastern Japan Seacore sampling
70The Storegga Slide and at the southern edge of the Vǿring PlateauBSR
71The Makran continental marginBSR
72Qilian Mountains, Qinghai-Tibet Plateau permafrost regioncore sampling

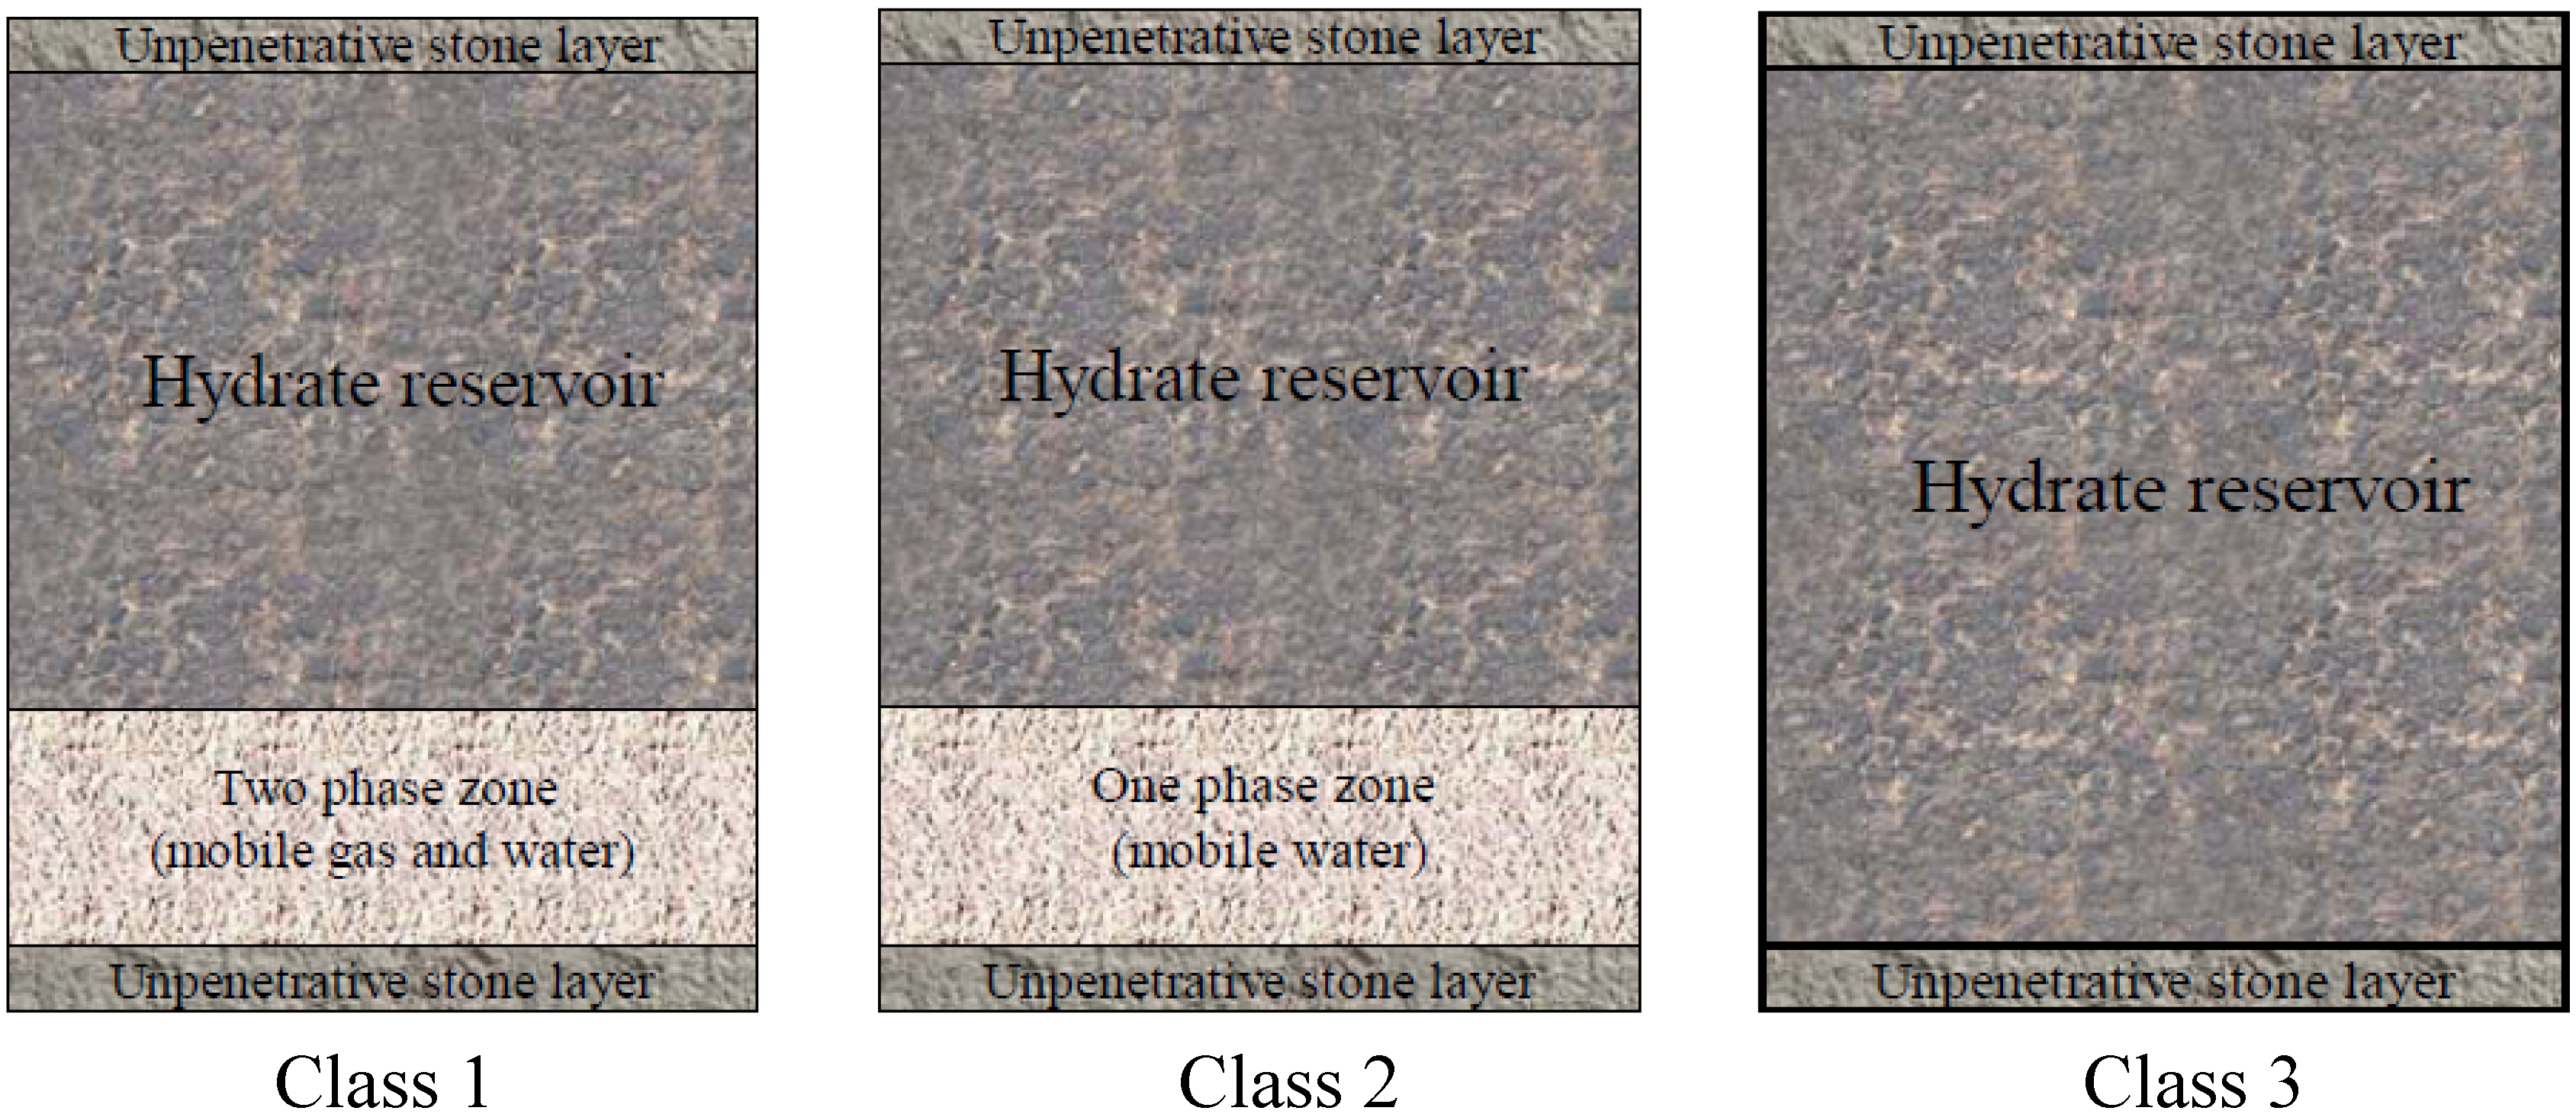
3. Classification of Gas Hydrate Reservoirs

For the purpose of developing optimal production strategies, besides the information about the distribution of natural gas hydrate reservoirs, we need to know their classification as different classes correspond to different geologic settings of the reservoir. According to Moridis et al. [41], gas hydrate reservoirs can be classified into three categories, as shown in Figure 1.
Figure 1. Sketch diagram of Classes 1, 2, and 3 hydrate reservoirs.
Energies 05 00466 g001
From Figure 1, we can see that Class 1 reservoirs consist of a hydrate-bearing layer and an underlying two-phase layer of mobile gas and water. These two layers form a stable system together. Currently this type of hydrate is considered as the most promising reserve since the temperature and pressure conditions are close to the hydrate equilibrium conditions. Only a small change of temperature or pressure will lead to the decomposition of hydrate. In addition, the underlying two-phase layer of mobile gas and water guarantees gas production even if hydrate decomposition is low. The characteristics of this type of hydrate reservoir is that at the interface of the hydrate layer and the two-phase layer, gas phase, liquid phase, and hydrate phase are in equilibrium. According to the different components of the hydrate layer, this type of hydrate reservoir can also be divided into two types, i.e., hydrate and water type (Class 1W) and hydrate and gas type (Class 1G).
Class 2 reservoirs are composed of two layers too. The upper layer is the hydrate-bearing layer with underlying free water. Since all the hydrate layer is in temperature - pressure balance stability region, the amount of gas production will be very small and the gas production rate will be very slow for this type of hydrate.
Class 3 consists of single hydrate-bearing layer. Similar to Class 2, for this kind of hydrate, the whole hydrate-bearing layer is in temperature—pressure balance stability region. Therefore, the gas production rate is slow during the exploitation process. As the amount of gas produced increases, the permeability will increase, leading to a faster gas production rate.

4. Techniques for Exploitation of Natural Gas Hydrate

To produce natural gas from hydrates, it is necessary to dissociate the hydrate. According to the dissociation techniques involved, the exploitation methods are divided into three major potential gas production methods [42,43], i.e., depressurization, thermal stimulation, and chemical injection, which have attracted much attention and laboratory experiments on hydrate dissociation processes based on these three methods have been carried out by many researchers. These three techniques are all based on the principle of shifting the hydrate condition from the hydrate stable region to the hydrate unstable region. In this part, many findings based on these three methods are summarized and analyzed. In addition, some other exploitation techniques and the current status of the industrial exploitation of natural gas hydrates are briefly introduced.

4.1. Depressurization Method

The depressurization technique [44] is the method of discharging part of the gas from the gas hydrate reservoir to reduce pressure below the hydrate equilibrium value, making hydrate become unstable and decompose. The schematic diagram is shown in Figure 2.
Figure 2. Gas production from hydrates by the depressurization method.
Energies 05 00466 g002
In this method, first, the hydrate contacting the free gas layer becomes unstable and decomposes by lowering pressure of the free gas layer. Then, the produced gas is collected by wellbores and water remains in the stratum. The depressurization method is currently regarded as the most promising method. This technique is especially suitable for gas hydrate reservoirs with depths of more than 700 meters and high permeability. By controlling the gas production rate, people can control the reservoir pressure correspondingly, and then control the decomposition of hydrate. This technique has been adopted for the exploitation of the Messokayha Field in the former Soviet Union, for example. From the economic point of view, this method has advantages as we do not need to input energy into the hydrate reservoir. However, several problems, such as ground subsidence and submarine landslides during the depressurization and hydrate reformation due to endothermic depressurization events, must be solved. We must be very cautious about exploitation of gas hydrates under the sea using this technique.
Laboratory experiments on hydrate dissociation process based on this technique have been carried out by many researchers. A few small reactors (usually the reactor volumes are within 1 L [15,45,46,47,48,49,50,51,52,53,54,55]) have been used. Yousif et al. [45,46] measured the gas production from hydrates in Berea sandstone cores using the depressurization method. Gas production and position of the hydrate decomposition front were measured as a function of time. Kono et al. [47] measured methane hydrate dissociation in porous sediments using a 188 cm3 batch reactor and found that the dissociation rate could be adjusted by the control of sediment properties. Kneafsey et al. [48] performed a series of experiments to provide data for validating numerical models of gas hydrate behavior in porous media. Methane hydrate was formed and dissociated under various conditions in a large X-ray transparent pressure vessel with 76.2 mm inner diameter and 89 mm outer diameter. Lee et al. [49] designed and built an experimental apparatus to analyze the dissociating phenomena of hydrates in porous rocks. The main part of the whole system in their work is a one-dimensional core holder, which allows the fluid flow only in an axial direction. To account for the naturally occurring deep sea sedimentary formation, in their experiments, overburden pressure and axial pressure have been applied in addition to the already existing inner pressure of the sample core. Tang et al. [53] studied the gas production from the hydrate-bearing cores by depressurization to 0.1, 0.93, and 1.93 MPa. Li et al. [54] experimentally studied the dissociation kinetic behaviors of methane hydrates in the porous media with different pore sizes, different temperatures and different initial formation pressures. The rate of methane released and the temperature change in the hydrate dissociation process were investigated. They suggested that the rate of methane released from the hydrate dissociation increases as the initial formation pressure increases, the environmental temperature decreases, and the mean pore size increases. The temperature in the system shows an obvious decrease during the dissociation process and then rises gradually to the environmental temperature after it reaches the lowest temperature point. Haligva et al. [55] also found that the initial rate of recovery was strongly dependent on the silica sand bed size during the recovery of methane from a variable-volume bed of silica sand/hydrate by depressurization.
To simulate and understand more realistically the behavior of gas hydrate dissociation and production, the reactor scale is an important point that should be considered in laboratory experiments. Some massive hydrate simulation reactors, such as the Seafloor Process Simulator (SPS) experimental platform at Oak Ridge National Laboratory, USA, whose reactor volume is 72 L [56] has been designed and adopted for studying the gas hydrate dissociation behavior with the depressurization method. In addition, Zhou et al. [57] carried out an experiment with a 59.2 L reactor. Li et al. [58] developed a three-dimensional cubic hydrate simulator (CHS) with the effective volume of 5.8 L, with the 25 × 3 distributed temperature measuring points and 12 × 3 resistance measuring points. The evolution of the spatial distribution of the temperature and resistance can be described in this system. The gas production behavior of methane hydrate in the porous sediment under depressurization conditions was then investigated using CHS to simulate the conditions of the hydrate reservoir in the Shenhu Area, South China Sea. They found that in the gas production process, the resistances in the hydrate reservoir change with the hydrate dissociation and the flow of the gas and water. The gas production rate and the cumulative gas production increase with the decrease of the pressure. The gas hydrate dissociation in the gas production process is mainly controlled by the rate of the pressure reduction in the system and the heat supplied from the ambient. It should be pointed out that it is ideal if a large volume reactor is adopted for conducting the laboratory experiments as the scale-up effects can be eliminated to a large extent and more comprehensive information could be obtained. However, because of the big size, it is difficult to operate in practice. For studying the dissociation behaviors of gas hydrates with the depressurization method in laboratory experiments, the quality of the synthetic hydrate sample is another point that needs to be considered. It is well known that it is very hard to ensure the synthetic samples distribute homogeneously in a large volume reactor.
Regarding the points mentioned above, our group made some efforts and performed a systematic study on hydrate formation/dissociation processes using the depressurization method. For example, we studied methane hydrate dissociation by depressurizing the system above 273.15 K and below 273.15 K in a sapphire cell [59]. The formation/dissociation of the hydrate crystals in the solution can be observed directly through the transparent cell wall. The same experimental apparatus was also used to study the effect of surfactants on the formation and kinetic dissociation behavior of methane hydrates [60]. To investigate the exploitation of actual natural gas hydrate reservoirs, we built a three-dimension experimental device to simulate the behavior of gas hydrate formation and decomposition [61,62], as illustrated in Figure 3.
The high-pressure reactor has an inner diameter of 300 mm and an effective height of 100 mm. The highest operation pressure is 16 MPa. It is separated into two parts by a porous stainless steel board with a thickness of 3 mm. The porous sample can be placed above the porous stainless steel board and below it is full of free gas during the experiments. Sixteen thermal resistances are inserted into the porous media with different depth and radius for measuring the temperature distribution during hydrate formation/dissociation.
Using this three-dimensional device, uniform hydrate samples were synthesized for simulating Class 1 reservoirs. Our experimental results [61,62] showed that by using the depressurization method for exploitation of natural gas hydrates, the gas production rate changes greatly during different gas production stages. In the initial stage of gas production, gas production rate is the fastest. The evolution of temperature distributions at different depths and specified radii are shown in Figure 4.
Figure 3. Experimental apparatus for gas production from hydrates by depressurization [61,62]: (1) air bath; (2) reactor; (3) gas discharge valve; (4) thermocouples; (5) pressure transducers; (6) vent valve; (7) gas injection valve; (8) gas cylinder; (9) gas-water separator; (10) drain valve; (11) filter; (12) back-pressure regulator; (13) computer; (14,15) valves; (16,17) mass flow transducers.
Energies 05 00466 g003
Figure 4. Temperature distributions and their evolution with elapsed time [62]: (a) profiles with the same radius of 132 mm; (b) profiles with the same radius of 99 mm; (c) profiles with the same radius of 66 mm; (d) profiles with the same radius of 33 mm.
Energies 05 00466 g004
Generally, the initial temperature decreases with the decrease of radius, i.e., the temperature near the reactor wall is higher than that far from the wall. When the radius is specified, the initial temperature is higher at the locations nearer to the top of the reactor. All this information indicates the existence of a temperature field between the air bath reactor and the hydrate samples. In the beginning stage, the temperatures decrease drastically in all locations, although they are a little larger at locations near the top of reactor. This implies that there exists no obvious decomposition front in the hydrate bearing sediment of this work. During the decomposition, the temperatures at locations nearer the wall and the top of the reactor increase more rapidly. This implies that although there is no an obvious dissociation front, the decomposition rates of hydrate at different locations are not uniform. Gas hydrate dissociation occurs throughout the hydrate zone, controlled by both mass transfer and heat transfer throughout the stages. The ice arising from hydrate dissociation slows the hydrate dissociation rate below the ice point, which will affect gas production rates. Based on our results, it can be concluded that the depressurization method has advantages for exploitation of natural gas hydrate reservoir with large porosity, low hydrate saturation, and has the lower free gas hydrate reservoir.

4.2. Thermal Stimulation Methods

The thermal stimulation method involves dissociating hydrates by increasing the in situ temperature above the gas hydrate equilibrium point [63,64]. As illustrated in Figure 5, hydrate reservoirs are heated by injecting hot water, steam, or hot salt water.
Figure 5. Gas production from hydrates by the thermal stimulation method.
Energies 05 00466 g005
The advantage of this method is that the hydrate decomposition process and the gas production rate could be controlled by regulating the amount and the rate of the heat injected. As the energy needed for the hydrate decomposition is governed by the thermal characteristics of the hydrate-bearing region, from the economic point of view, this method is not suitable for exploitation of hydrates in the permafrost region where the ambient temperature is very low and the permafrost layer is thick.
As an effective exploitation technology, the thermal stimulation method has been widely investigated. Holder et al. [65] evaluated the feasibility of the thermal stimulation method and considered that it is an effective technique for exploitation of natural gas hydrate reservoirs. McGuire [66] pointed out that, if the hydrate reservoir has very high permeability and is a Class 2 reservoir, i.e., there is a free water layer below the hydrate-bearing layer, the most suitable technique for exploitation of hydrate reservoirs is the thermal stimulation method. Many experimental simulations using this method have been carried out [67,68,69]. Selim and Sloan [70] found that in porous media, the decomposition rate of hydrate is related to the thermal characteristics of the system and the porosity of the media. In their work Kamata et al. [71] found that temperature and pressure fluctuate in the decomposition zone and the stable region of hydrate. Tang et al. [72] investigated the temperature distribution and flowing characteristics of the dissociated gas and water from hydrates in porous sediments by utilizing a one-dimensional experimental setup with an internal diameter of 38 mm and a length of 500 mm. They found that a higher hydrate content and lower injection temperature and rate give a higher energy ratio for this method. Kwon et al. [73] investigated the influence of sediment particle size on the dissociation behavior of CO2 hydrate during isochoric heating. Linga et al. [74] pointed out that gas production rate is also related to the size of the reaction apparatus. In our group, we studied the kinetic dissociation behavior of methane hydrate at 268.15 K using thermal stimulation method in a closed quiescent middle-sized reactor [69]. A diagram of the experimental apparatus used is shown in Figure 6. The reactor is 200 mm in diameter, 320 mm in height and has a volume of 10 L. It is sealed with a blank flange bolted to its top. The internal of the reactor is a multi-deck cell-type vessel and the inner structure consists of a series of uniform boxes stacked up vertically. Each box is divided into a series of uniform cells by metal plates. There are interspaces between two neighboring boxes such that the hydrate forming gas can flow into each deck of the vessel easily. A cooling/heating jacket is welded to the outside of the reactor and coiled copper tubes are uniformly placed inside the multi-deck cell-type vessel. Coolant or hot water is circulated through them to cool or heat the reactant system. The multi-deck cell-type vessel is placed in the high pressure reactor so that hydrates form and dissociate in each cell of the vessel uniformly and simultaneously. Thus the scale-up effects can be eliminated to a large extent. The flow rate of the coolant or hot water in our study is measured using a spinner flow meter.
The experimental studies mentioned above are all limited to one-dimensional and two-dimensional simulations. Recently, we performed a three-dimensional experimental simulation on gas production from methane hydrate-bearing sand by hot-water cyclic injection [75]. The experimental device used for the depressurization exploitation [61,62] was modified for thermal stimulation simulation. The hot water, prepared through the water heater with thermostatic control, is injected into the reactor from a well with a diameter of 3 mm by a metering pump to control the injecting rate of hot water. The pressure-time curves and gas production rate during first cycle and second cycle are shown in Figure 7.
Figure 6. Flow diagram of the experimental apparatus of gas production from hydrates by the thermal stimulation method [69].
Energies 05 00466 g006
Figure 7. Variation of pressure and gas production rate with time at hydrate saturation of 0.293, hydrate sample temperature, hot-water temperature of 333.2 K, and well pressure of 3 MPa: (a) the first cycle; (b) the second cycle [75].
Energies 05 00466 g007
In every cycle, the gas production process can be divided into three steps: injecting hot-water, closing the well, and producing gas. The experimental results indicate that the overall temperature trend increases with hot-water injection and decreases with gas production. The temperature distribution and fluctuation in the reactor depend on the location of the injecting/producing well as well as the porosity and permeability of hydrate samples. Heat transfer is controlled by hot-water seepage flow during the injection of hot-water. When other conditions are similar, the energy efficiency ratio increases with the increase of hydrate bearing sand saturation and hydrate sample temperature, but decreases with the increase of hot-water temperature and well pressure. Besides our work, Li et al. [76] carried out thermal huff and puff experiments with a single vertical well. The change characteristics of the injection temperature, pressure, resistance ratio and other related parameters during the injection were investigated. It was concluded that the injected heat spreads out from the injection point, forming a heat flux surface, which enlarges as the number of huff and puff cycles increases, and eventually reaches the surface with the largest impact. After that, the area of the heat flux surface is no longer increasing with continuous heat injection. The result also verifies that the hydrate decomposition process is a moving boundary ablation process on a three-dimensional level. Li et al. [77] also investigated the sensitivities of the hydrate dissociation to the initial hydrate saturation, the hot water injection time during the injection stage of the huff and puff cycle and the temperature of the hot water injected into the CHS. In addition, Li et al. [78] developed a pilot-scale hydrate simulator of 117.8 L for gas production from methane hydrate in porous media by a huff and puff method, which was a pioneering study in the field of the natural gas hydrate scientific research. In this device, a 9-spot distribution of vertical wells, a single horizontal well, and 49-spot distributions of the thermometers and resistance ports are respectively placed in three horizontal layers. The experimental results indicate that with a constant hot water injection rate, the range of the thermal diffusion is restricted around the well, and the depressurization rather than thermal stimulation is dominant for gas production. The decline of the cumulative gas produced during each cycle and the diminishing uptrend of the percentage of the hydrate dissociated indicate that the hydrate dissociation rate decreases over time. The gas production efficiency can be improved by prolonging the hot water injection time, while this enhancement is limited by the stronger pressurization effect.

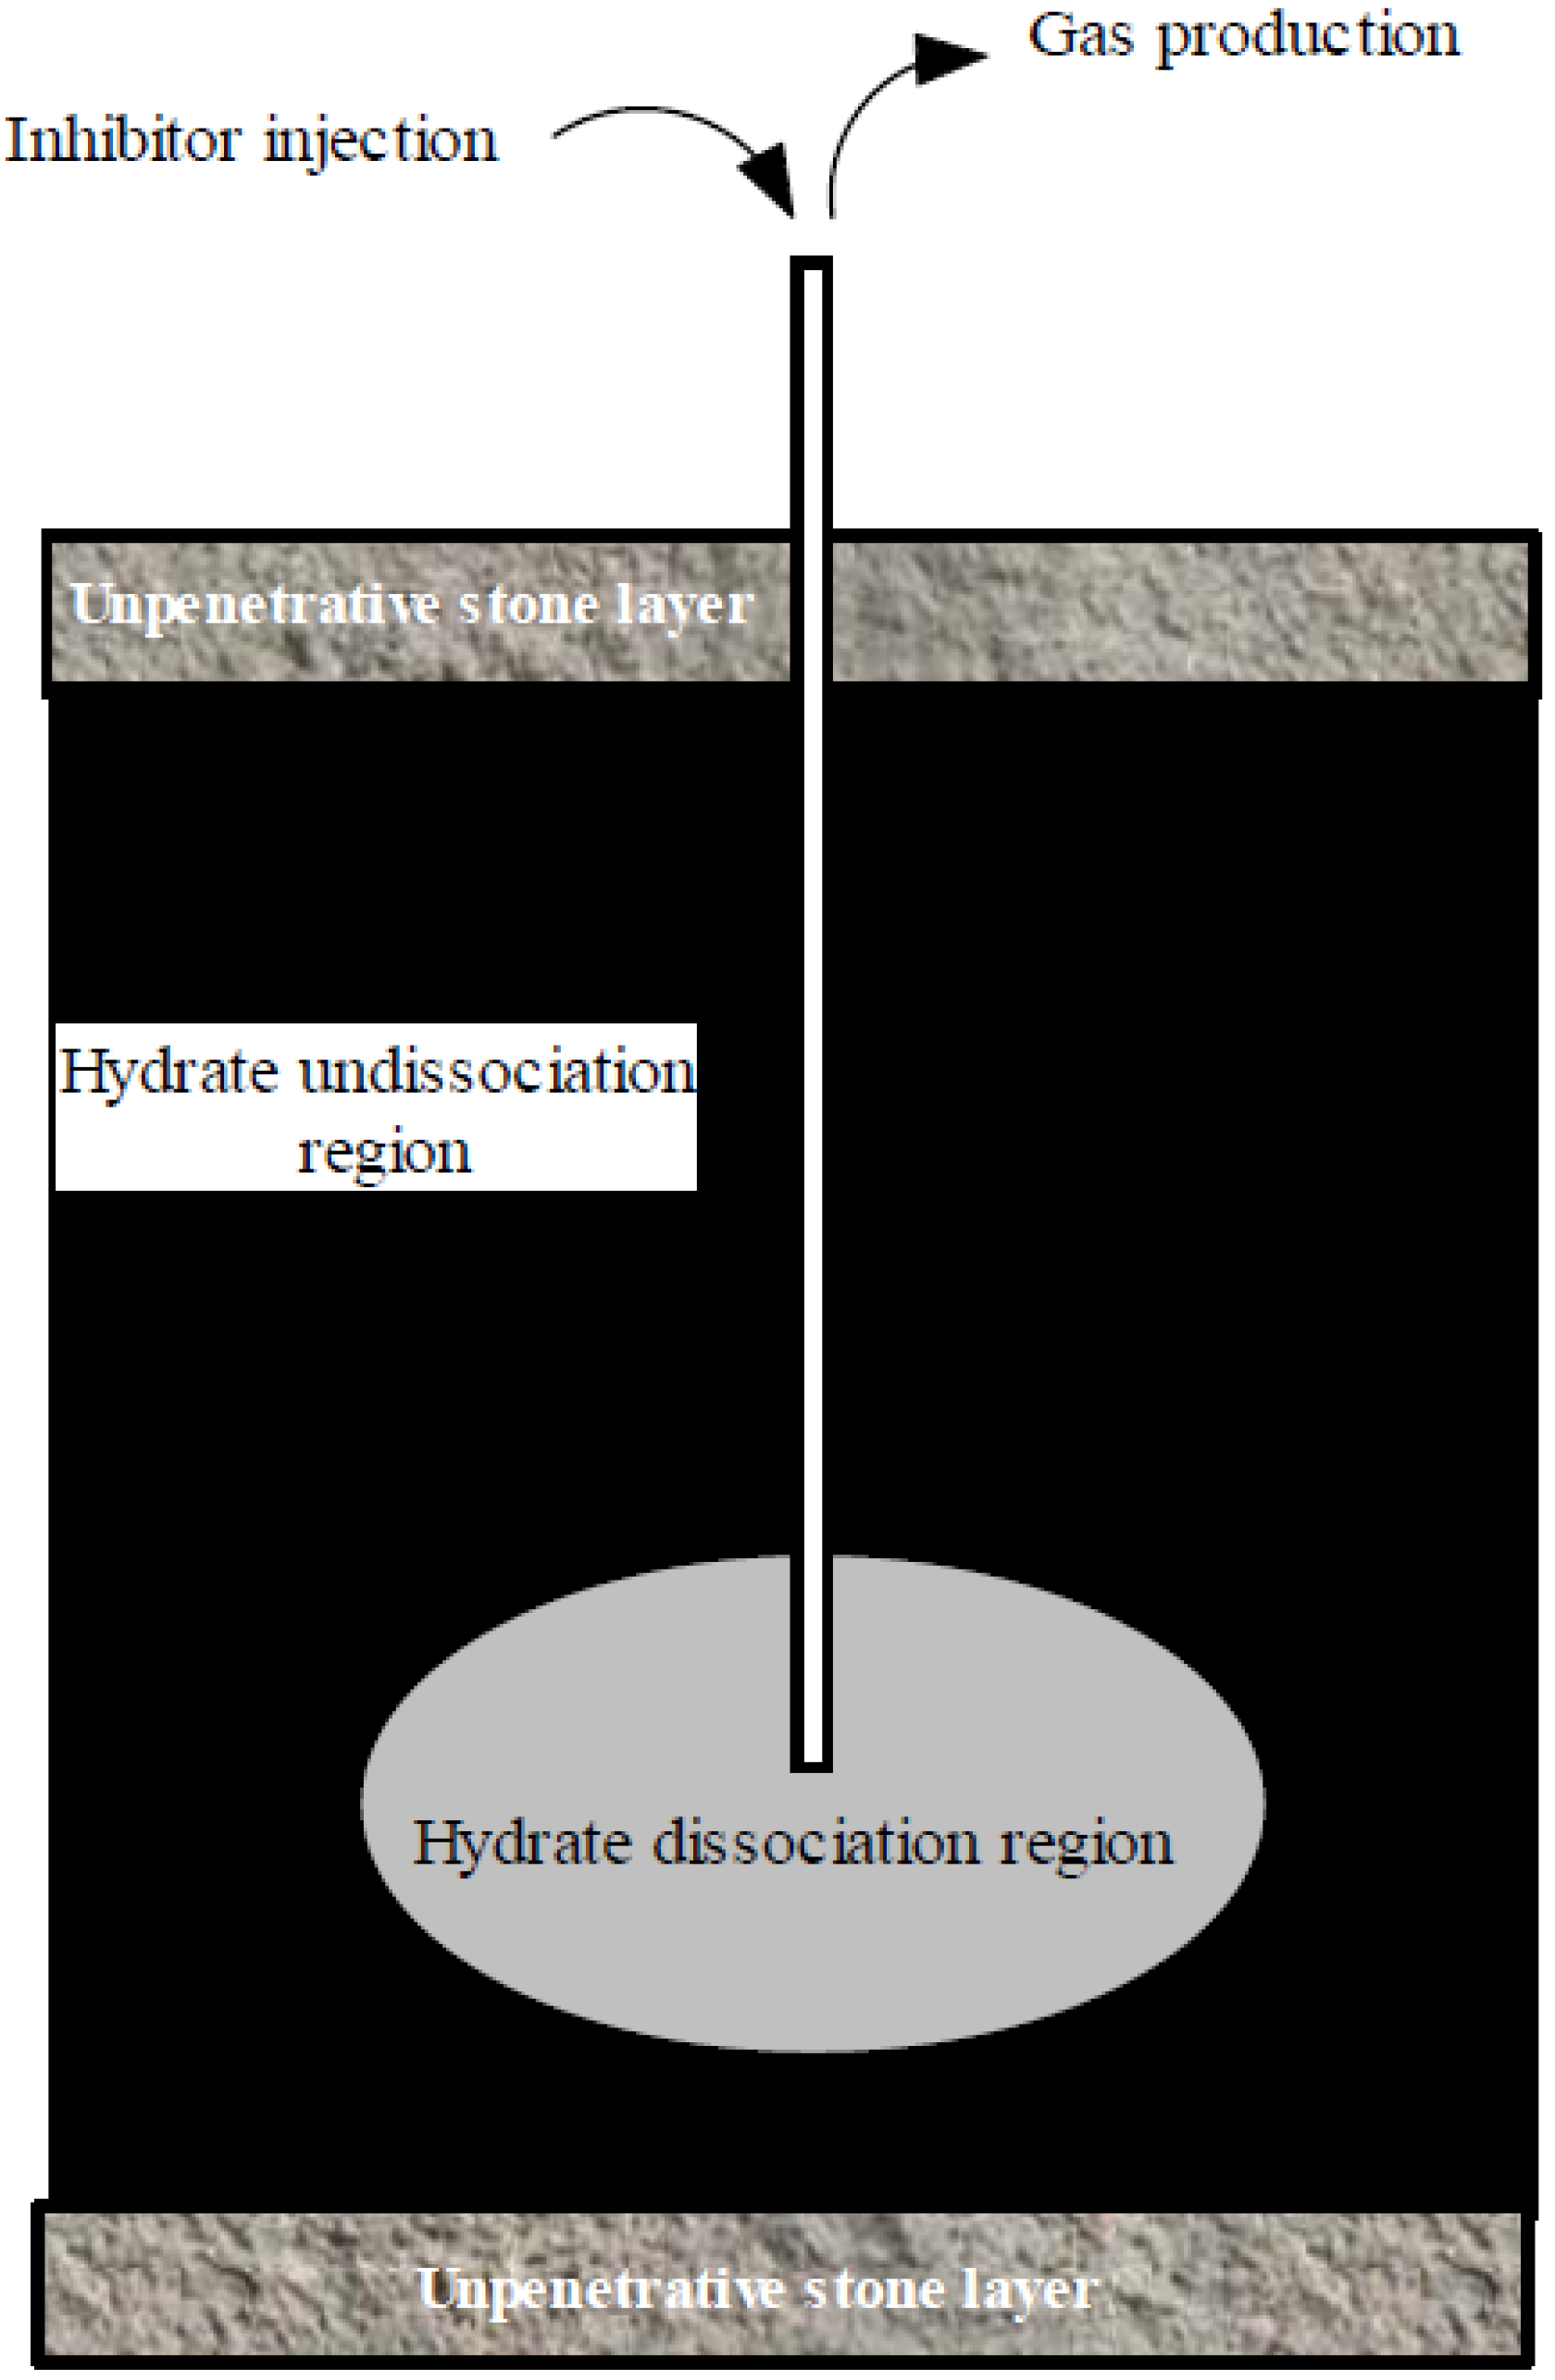
4.3. Chemical Injection Method

For the chemical injection method, some kind of thermodynamic inhibitor, such as methanol, ethanol, or brine, are injected to dissociate hydrates in the reservoir. Because of the injected inhibitors, the formation condition of hydrate phase equilibrium will be changed, i.e., the hydrate stability temperature will be reduced or stable pressure will be increased, making the hydrate system unstable and the hydrate decomposes accordingly [79]. An illustration of this method is given in Figure 8. The main advantage of this technique is that gas production rate can be improved in a very short time; however, from the economic point of view, this method is not promising as inhibitors are expensive. In addition, this method is likely to cause environmental pollution. The main obstacle of adopting this method is the low permeability of hydrate-bearing regions, which hinders the diffusion of injected chemicals.
By lowering the activity of water for hydrate formation, the thermodynamic inhibitors make the hydrate formation conditions more demanding. In the process of exploitation of natural gas hydrate reservoir, the thermodynamic inhibitors are used to promote the hydrate decomposition, improve the dissociation rate of gas hydrate, and increase the gas yield. Many studies have been carried out for investigating the equilibrium conditions of gas hydrate in the presence of inhibitors [80,81,82,83,84,85,86,87,88,89,90,91,92,93,94,95,96,97,98]. Thereof, Ross and Toczylkin [80] investigated the behaviors of hydrate dissociation pressures for methane or ethane containing aqueous triethylene glycol with an isothermal apparatus. Englezos and Bishnoi [82], Englezos [83], Hutz and Englezos [84] studied gas hydrate formation/decomposition behaviors in electrolyte solutions. Mohammadi and Richon’s group [86,87,88,89,90,91,92,93,94,95,96,97,98] carried out a systematic study to predict the hydrate stability boundary conditions for system with salt and organic inhibitors.
Figure 8. Gas production from hydrate by the chemical injection method.
Energies 05 00466 g008
Besides the equilibrium conditions, the effects of type and concentration of inhibitors on hydrate dissociation were studied by many groups. Katz et al. [99] found that with the increase of the volatility of inhibitors, the inhibiting effect reduces, which is attributed to the fact that highly volatile inhibitors are usually in the gas phase. Apparently, the volatility of methanol is higher than that of ethanol and ethylene glycol. When the concentration of methanol and ethanol is below 5 wt%, their injection could promote the formation of hydrate. Elgibaly and Elkamel [100] pointed out that, compared to ethanol, ethylene glycol has lower volatility and stronger hydrogen bonding with water, therefore, ethylene glycol is more beneficial for recycling than ethanol. They also believed that, to some extent, the inhibiting effect of electrolyte on hydrate is different with ethanol and ethylene glycol. Makogon [101] found that pressure greatly influences the inhibitor effect. When methanol was used as the inhibitor, hydrate formation temperature increases with the decrease of pressure. When electrolyte solution (CaCl2) was used as the inhibitor, with the increase of pressure, the inhibiting effect reduces first and reaches a minimum, then increases slightly. Sira et al. [102] investigated the hydrate decomposition process by injecting methanol and ethylene glycol into the hydrate. Their experimental results show that the hydrate dissociation rate is a function of the concentration of inhibitor, injection rate, pressure, temperature, and the contacting surface area of hydrate and inhibitor. Kawamura et al. [103] studied the decomposition behavior of spherical methane gas hydrate with the presence of ethylene glycol and silicone oil above the freezing point. They concluded that silicone oil could be used for transportation and storage of hydrate. Fan et al. [104] used a cell of 3.5 L to perform methane hydrate dissociation experiments by 10–30 wt% ethylene glycol injection and concluded that the dissociation rate depends on the concentration and the flow rate of ethylene glycol. Dong et al. [105] also used this device to investigate the dissociation behaviors of propane hydrate by injection of high concentrations of alcohols. The results showed that the acceleration effects of ethylene glycol on the dissociation behaviors of propane hydrate are better than those of methanol with the same injecting flux and mass concentration. Li et al. [79] investigated the gas production behavior from methane hydrate in porous sediments by injecting ethylene glycol in a one-dimensional experimental apparatus. It was found that the production efficiency is affected by the ethylene glycol concentration and the ethylene glycol injection rate, and it reaches a maximum with the ethylene glycol concentration of 60 wt%. Li et al. [63] also investigated the gas production behavior by injecting brine using the same device. In their experiment, the gas production process is divided into three stages, i.e., free gas production stage, gas hydrate decomposition stage, and residual gas production stage. Lee [106] examined gas hydrate dissociation and gas productivity in porous rocks by brine injection in a one-dimensional experimental apparatus. It was found that the gas production rate tends to reduce significantly if the brine concentration is excessively high. Our group investigated the gas production from methane hydrate-bearing sands by ethylene glycol injection using a three-dimensional apparatus [107]. As shown in Figure 9, there exists an optimal value of mass ratio of injected ethylene glycol solution to initial water, where a maximum gas production ratio appears. When all other conditions are similar, the amount of gas produced by hydrate dissociation increases with the increase of inhibitor concentration. The gas production efficiency increases with the decrease of ethylene glycol quantity and the increase of ethylene glycol concentration.
Figure 9. Variation of the gas production ratio with REG-w (the ratio of injected ethylene glycol solution mass to the initial water mass) [107].
Energies 05 00466 g009

4.4. Other Exploitation Methods

In addition to the traditional methods, some new exploitation methods have been proposed, such as CO2 replacement, electromagnetic heating, and microwave heating. Furthermore, some combined exploitation methods have also been reported in the literature.
The CO2 replacement method is the technique that according to the hydrate phase equilibrium condition difference between CO2 and methane (at same temperature/pressure, it is easier for CO2 to form hydrates than methane), people inject CO2 (gas, liquid, or emulsion) into hydrate reservoirs to replace methane [108]. In this process, injected CO2 replaces methane in natural gas hydrate and liberate methane to the pore fluid. This technique has its advantages as it can produce natural gas from hydrates, meanwhile, the greenhouse gas CO2 can be sequestered in the form of hydrate. Nowadays, this technology has drawn much attention. For a detailed review readers can refer to Jadhawar et al. [109].
The coal-fired combustion method, as proposed by Castaldi et al. [110], is another technique that deserves to be mentioned. By adopting this method, first people needs to find a point in the hydrate zone. At this point we let the liquid fuel and oxidizer combust. A mixture of O2 and CO2 was used as oxidizer in Castaldi et al.’s work. The system temperature needs to be maintained 10 K above the hydrate zone temperature. From a systematic calculation they found that the energy required only accounts for 10% of the energy that one can get from the produced gas. In addition, they pointed out that if the heat source position is further optimized, people can realize the exploitation by only raising the temperature 5 K above the hydrate zone temperature.
Ning et al. [111] proposed a method to exploit marine gas hydrates by using dry rock geothermal heat. In their work, artificial circulation channels were created in dry hot rock, so that the fluid can contact the dry hot rock and reach high temperatures. The hot fluid then dissociates the hydrates. Considering that the single well circulation efficiency and the seafloor hydrate saturation are low, a combination of multi-hole wells was adopted in their work.
The concept of decomposition of hydrates by an electromagnetic heating method follows from the application of this technique in heavy oil exploitation. Via a downhole device, an electrode plate is put in the hydrate zone. Both horizontal and vertical wells can be adopted in this method. As shown by Islam [112], the production efficiency with a horizontal well is higher than that with a vertical well. Microwave heating is one of the effective heating methods in the electromagnetic heating method. Microwaves are electromagnetic waves with a frequency of 300–300,000 MHz and in industry the frequencies adopted are usually 2,450 MHz and 915 MHz. Natural gas hydrates are polar compounds and they can absorb a portion of the microwave energy under the microwave irradiation, leading to the their decomposition. The formation conditions of natural gas hydrate reservoirs are complex and the different chemical compositions have quite different microwave absorption capability. Therefore, the elevation of temperature of different components differs greatly under the microwave irradiation, leading to great thermal stress and producing many tiny cracks in the rock. Due to the formation of these tiny cracks in natural gas hydrate reservoirs, the permeability of the stratum is then increased, leading to an effective exploitation of the gas hydrate. The microwave heating method has been investigated by many groups, for example, Rachit et al. [113] adopted this method for exploitation of natural gas hydrate. In their work, fluorine gas was also used. Under the microwave irradiation first the hydrate dissociates. With the injection of fluorine gas, methane-based material and fluoride undergo a halogenation reaction that releases a lot of heat, thus promoting the halogenation reaction further. As the solubility of methyl fluoride (the reaction product) in water is very high, concentrated liquid was formed in their work. This concentrated liquid was conveyed to the ground, and through a series of steps, such as Wurtz reaction, electrolysis, and cracking, methane gas was produced finally.
In addition, some other exploitation methods like hydraulic fracturing method, and the ground decomposition method were also proposed and investigated by researchers [15]. Although the concept of these new methods sounds very attractive, it is difficult to carry out in real exploitation. At present, the main direction of development of gas hydrate exploitation technology is still based on using the traditional exploitation methods, including their combinations [114].

4.5. The Current Status of the Industrial Exploitation of Natural Gas Hydrates

According to Sloan and Koh [3], experimental industrial exploitation has been carried out in two areas, including the Messoyakha gas field in Siberia and Mallik 2002 in Canada. In addition, experimental exploitation research has been carried out in the offshore Nankai Trough in Japan.
Exploitation in Messoyakha gas field is the first industrial trial in the world to get natural gas from hydrate in a permafrost region. Information about this gas reservoir was collected by Makogon [115], as shown in Table 3.
Table 3. Physical parameters of Messoyakha gas hydrate reservoir [115].
Thickness of hydrate reservoir84 m
porosity16–38% (average value 25%)
residual water saturation29–50% (average value 40%)
initial pressure of hydrate reservoir7.8 MPa
temperature range of hydrate reservoir281–285 K
water salinity of hydrate reservoir<1.5 wt%
composition of free gas98.6% CH4, 0.1% C2H6, 0.1% C3H8, 0.5% CO2, 0.7% N2
The depressurization method, the chemical injection method, and a combination of these two methods were adopted for exploitation. Test results show that by injecting inhibitors, the gas production rate could be improved in the short term. Inhibitors used in the exploitation process are methanol and a mixture of methanol and CaCl2. The corresponding results are shown in Table 4. For the long time exploitation, the depressurization method was used.
Table 4. Experimental results of gas production from the Messoyakha gas hydrate reservoir [42].
Well No.Type of inhibitorVolume of inhibitor, m3Gas flow before treatment, 1000 m3/dayGas flow after treatment,
1000 m3/day
296 wt% methanol3.5did not reach the expected resultsdid not reach the expected results
12996 wt% methanol3.530150
13196 wt% methanol3.0175275
133methanol2550
5050
100150
150200
13810% methanol + 90% CaCl2 (30 wt%)4.8200300
139same as well 1382.8
141same as well 1384.8150200
142methanol550
10100
25150
50200
Gas hydrate exploitation in Mallik 2002 is another trial which is important from both the academic and realistic points of view. Mallik 2002 is in the northwestern Canada permafrost region. Studies show that there is 5.39 × 10⁷ m3 hydrate gas in a 10,000 m2 gas hydrate area. The physical parameters of the Mallik 2002 hydrate reservoir are listed in Table 5. The exploitation in Mallik 2002 provides important and factual scientific basis for the possibility of industrial exploitation of natural gas hydrate reservoirs. Moreover, some important results obtained from the Messoyakha hydrate exploitation test were fully confirmed by the tests in Mallik 2002. The depressurization method and the heat stimulation method were adopted for gas hydrate exploitation in Mallik 2002.
Table 5. Physical parameters of the Mallik 2002 hydrate reservoir [115].
AreaDepth of Stratum, mAverage porosity, %Gas hydrate saturationPermeability (excluding hydrate), mDPermeability (including hydrate), mD
A892–93032–38~0.8100–10000.1
B942–99330–400.4–0.810.01–0.1
C1070–110730–400.8–0.910.01–0.1
Experimental exploit research has also been carried out in the offshore Nankai Trough in Japan. Japan plans to exploit hydrates under the Pacific Ocean and verify if natural gas hydrate is a feasible fuel. The corresponding essential technology needed by the commercial exploitation will be completed before 2016.

5. Conclusions and Prospects

In this article, the state of the art of the studies of the experimental simulation of natural gas hydrate exploitation using the major hydrate production technologies is summarized. In addition, the current situation of the industrial exploitation of natural gas hydrate is introduced. From the results of experimental simulation of the traditional methods, it is concluded that the depressurization is the most promising technique. It is especially suitable for gas hydrate reservoirs with deep depth and high permeability. The main advantage of this method is that we do not need to input any energy to the hydrate reservoir; however, several issues, such as ground subsidence, submarine landslides, and hydrate reformation due to endothermic depressurization events should be considered. In the thermal stimulation method, the good thing is the hydrate decomposition process and gas production rate could be controlled by regulating the amount and the rate of the heat injected; however, from an economic point of view, this method is not suitable for exploitation of hydrates in the permafrost region where the ambient temperature is very low and the permafrost layer is thick. With respect to the chemical injection method, the main advantage is that gas production rate can be improved in a very short time, but this technique is limited from the economic and environmental protection points of view, and also limited for hydrate-bearing regions with low permeability. Besides the traditional methods, the concepts of some new exploitation techniques sound very attractive, but it is too early to adopt them in the real exploitation of natural gas hydrate reservoirs. At present, we think the combination of the traditional methods is more applicable for real exploitation.
To establish efficient and safe gas production technology for specific hydrate reservoirs, corresponding preliminary experimental studies should be carried out in three-dimensional devices. Besides temperature, pressure, resistance, and wave velocity signals, some advanced detection techniques, such as nuclear magnetic resonance, neutron diffraction, scanning electron microscope, magnetic resonance imaging, and Raman spectrum, should be introduced to the three-dimensional hydrate simulation devices to obtain more comprehensive information about hydrate exploitation. In addition, to mimic and understand more realistically the behavior of gas hydrate dissociation and production, it is important to synthesize representative hydrate samples in accordance with the actual stratum environment before the experimental simulation. Except for experimental simulation, further development of numerical simulations and molecular simulations are also helpful for understanding the inherent mechanisms of exploitation of hydrates in the laboratory and in industry.

Acknowledgments

The financial support received from the National Natural Science Foundation of China (No. 20925623, 21006126), the National 973 Project of China (No. 2009CB219504), the Research Funds of China University of Petroleum, Beijing (BJBJRC-2010-01), and Beijing Nova Program (2010B069) are gratefully acknowledged.

References

  1. Demirbas, A. Methane hydrates as potential energy resource: Part 1—Importance, resource and recovery facilities. Energy Convers. Manag. 2010, 51, 1547–1561. [Google Scholar] [CrossRef]
  2. Davy, H. The bakerian lecture: On some of the combinations of oxymuriatic gas and oxygene, and on the chemical relations of these principles to inflammable bodies. Phil. Trans. R. Soc. Lond. 1811, 101, 1–35. [Google Scholar] [CrossRef]
  3. Sloan, E.D.; Koh, C.A. Clathrate Hydrate of Natural Gases, 3rd ed.; CRC Press: Boca Raton, FL, USA, 2008. [Google Scholar]
  4. Kvenvolden, K.A. Methane hydrate—A major reservoir of carbon in the shallow geosphere. Chem. Geol. 1998, 71, 41–51. [Google Scholar] [CrossRef]
  5. Zhang, G.X.; Huang, Y.X.; Chen, B.Y. Seismology of Marine Natural Gas Hydrate; Ocean Press: Beijing, China, 2003. (in Chinese) [Google Scholar]
  6. Bonnefoy, O.; Herri, J.M. Formation & dissociation of methane hydrates in sediments Part I: A new experimental set-up for measurements. In Proceedings of the 4th International Conference on Gas Hydrates, Yokohama, Japan, 19–23 May 2002; pp. 797–801.
  7. Fatykhov, M.A.; Bagautdinov, N.Y. Experimental investigations of decomposition of gas hydrate in a pipe under the impact of a microwave electromagnetic field. High Temp. 2005, 43, 614–619. [Google Scholar] [CrossRef]
  8. Li, D.L.; Liang, D.Q.; Fan, S.S.; Li, X.S.; Tang, L.G.; Huang, N.S. In situ hydrate dissociation using microwave heating: Preliminary study. Energy Convers. Manag. 2008, 49, 2207–2213. [Google Scholar] [CrossRef]
  9. Dou, B.; Jiang, G.S.; Wu, X.; Zhang, L.; Ning, F.L. Exploitation of natural gas hydrate by ground decomposition method. Nat. Gas. Ind. 2008, 28, 123–125. (in Chinese). [Google Scholar]
  10. Milkov, A.V. Global estimates of hydrate-bound gas in marine sediments: How much is really out there? Earth Sci. Rev. 2004, 66, 183–197. [Google Scholar] [CrossRef]
  11. Yao, B.C. The gas hydrate in the south China sea. J. Trop. Oceanogr. 2001, 20, 20–28. (in Chinese). [Google Scholar]
  12. Xu, S.S.; Wang, T.; Liu, T.J.; Wang, D.; Cao, D.Y. Resource quantity estimation of gas hydrate in Muli coalfield, Qinghai Province. Coal. Geol. China 2009, 21, 1–3. (in Chinese). [Google Scholar]
  13. Makogon, Y.F. Natural gas hydrates—A promising source of energy. J. Nat. Gas Sci. Eng. 2010, 2, 49–59. [Google Scholar] [CrossRef]
  14. Makogon, Y.F.; Holditch, S.A.; Makogon, T.Y. Natural gas-hydrates—A potential energy source for the 21st Century. J. Petrol. Sci. Eng. 2007, 56, 14–31. [Google Scholar] [CrossRef]
  15. Sloan, E.D. Clathrate Hydrates of Nature Gas; Marcel Dekker: New York, NY, USA, 1998. [Google Scholar]
  16. Nikitin, S.P. Introduction of natural gas hydrate distribution zone in USSR. Oil Gas Geol. 1987, 2, 7–10. (in Russian). [Google Scholar]
  17. Chersky, N.V.; Tsarev, V.P.; Nikitin, S.P. Natural gas hydrate—The prospect natural gas resource in north east USSR. Magadan 1984, 1, 105–108. (in Russian). [Google Scholar]
  18. Shi, D.; Zheng, J.W. The status and prospects of research and exploitation of natural gas hydrate in the world. Adv. Earth Sci. 1999, 14, 330–339. (in Chinese). [Google Scholar]
  19. Collett, T.S. Natural-gas hydrates of the Prudhoe Bay and Kuparuk River area, North Slope, Alaska. AAPG Bull. 1993, 77, 793–812. [Google Scholar]
  20. Dallimore, S.R.; Collett, T.S. Intrapermafrost gas hydrates from a deep core hole in the Mackenzie Delta, Northwest Teritories, Canada. Geology 1995, 23, 527–530. [Google Scholar] [CrossRef]
  21. Zhu, Y.H.; Zhang, Y.Q.; Wen, H.J.; Lu, Z.Q.; Wang, P.K. Gas hydrate in the Qilian Mountain permafrost and their basic characteristics. Acta Geol. Sin. 2010, 31, 7–16. (in Chinese). [Google Scholar]
  22. Ginsburg, G.D.; Soloviev, V.A.; Telepnev, E.V. Evaluation of subsea natural gas hydrate in Arctic zone. Abstr. All Union Conf. 1986, Part 1, 17–18. (in Russian). [Google Scholar]
  23. Andreessen, K.; HART, P.E.; GRANTZ, A. Seismic studies of a BSR related to gas hydrate beneath the continental margin of the Beaufort Sea. J. Geophys. Res. 1995, 100, 12659–12673. [Google Scholar] [CrossRef]
  24. Borowiski, W.S. A review of methane and gas hydrates in the dynamic stratified system of the Blake Ridge region, offshore southeastern North America. Chem. Geol. 2004, 205, 311–346. [Google Scholar] [CrossRef]
  25. Sassen, R.; Sweet, S.T.; Milkov, A.V.; DeFreitas, D.A.; Salata, G.G.; McDade, E.C. Geology and geochemistry of gas hydrates, central Gulf of Mexico continental slope. Trans. Gulf Coast Assoc. Geol. 1999, 49, 462–468. [Google Scholar]
  26. Panaev, V.A. Natural gas hydrate in the ocean [Russia]. Dep. Geol. Mosc. 1987, 62, 66–72. [Google Scholar]
  27. Ginsburg, G.D.; Gramberg, I.S.; Ivanov, V.L.; Soloviev, V.A. Achievement and mission for research on subsea natural gas hydrate. Geology of the oceans and seas. Abstr. Rep. Ocean Geol. Coll. USSR 1986, 3, 183–184. (in Russian). [Google Scholar]
  28. Kvenvolden, K.A.; Mc. Donald, T.J. Gas hydrates of the middle American trench—DSDP/IPOD, Leg 84. Initial Rep. DSDP 1985, 84, 517–520. [Google Scholar]
  29. Satoh, M. Distribution and resources of marine natural gas hydrates around Japan. Nat. Gas. Geosci. 2003, 14, 512–513. [Google Scholar]
  30. Antje, B.; Erwin, S. Hydrate Ridge: A natural laboratory for the study of microbial life fueled by methane from near-surface gas hydrates. Chem. Geol. 2004, 205, 291–310. [Google Scholar] [CrossRef]
  31. Ludmann, T.; Wong, H.K. Characteristics of gas hydrate occurrences associated with mud diapirism and gas escape structures in the northwestern Sea of Okhotsk. Mar. Geol. 2003, 201, 269–289. [Google Scholar] [CrossRef]
  32. Li, G.; Moridis, G.J.; Zhang, K.; Li, X.S. Evaluation of gas production potential from marine gas hydrate deposits in Shenhu Area of South China Sea. Energy Fuels 2010, 24, 6018–6033. [Google Scholar] [CrossRef]
  33. Chertkov, L.; Bilichenko, A.A.; Stunzhas, P.A. The detection of methane hydrate in Okhotsk Sea. In Proceedings of the 3rd Conference of Ocean Scientist in USSR, Part in Ocean Geology, Geophysics, Geochemistry, 14–19 December 1987; Lenin Spengler: Bayreuth, Germany; pp. 172–173. (in Russian).
  34. Zonenshain, L.P.; Murdmaa, I.O.; Baranov, B.V.; Kuznetsov, A.P.; Kuzin, B.S.; Kuzmin, M.I.; Avdeiko, G.P.; Stunzhas, P.A.; Lukashin, V.N.; Barash, M.S.; et al. The gas source in Okhotsk Sea of west Paramushir. Oceanology 1987, 27, 795–800. (in Russian). [Google Scholar]
  35. Hammond, R.D.; Gaither, J.R. Anomalous seismic character-bearing sea shelf. Geophysics 1983, 48, 590–605. [Google Scholar] [CrossRef]
  36. Carlson, P.R.; Golan, B.M.; Karl, H. Seismic and geochemical evidence for shallow gas in sediment on Navarin continental margin, Bering Sea. AAPG Bull. 1985, 69, 422–436. [Google Scholar]
  37. White, R.S. Gas hydrate layers trapping free gas in the Gulf of Oman. Earth. Planet. Sci. Lett. 1979, 42, 114–120. [Google Scholar] [CrossRef]
  38. Michael, D.M. Gas hydrate potential of the Indian Sector of the NE Arabian Sea and Northern Indian Ocean. In Natural Gas Hydrate in Oceanic and Permafrost Environments; Springer: Berlin, Germany, 2000; pp. 213–224. [Google Scholar]
  39. Jeffery, B.K.; Stanley, I.S. Global distribution of methane hydrate in ocean sediment. Energy Fuels 2005, 19, 459–470. [Google Scholar] [CrossRef]
  40. Shi, D. Evaluating the resources of hydrate gas in the Black Sea. Nat. Gas Geosci. 2003, 14, 519–524. [Google Scholar]
  41. Moridis, G.J.; Kowalsky, M.B.; Pruess, K. Depressurization-induced gas production from Class 1 hydrate deposits. SPE Reserv. Eval. Eng. 2007, 10, 458–481. [Google Scholar] [CrossRef]
  42. Makogon, Y.F. Hydrates of Natural Gas; PennWell: Tulsa, OK, USA, 1974. [Google Scholar]
  43. Krason, J.; Ciesnik, M. Geological Evolution and Analysis of Confirmed or Suspected Gas Hydrate Localities: Gas Hydrates in the Russian Literature; U.S. Department of Energy: Washington, DC, USA, 1985; Volume 5, DOE/MC/21181-1950. [Google Scholar]
  44. Ahmadi, G.; Ji, C.A.; Smith, D.H. Production of natural gas from methane hydrate by a constant downhole pressure well. Energy Convers. Manag. 2007, 48, 2053–2068. [Google Scholar] [CrossRef]
  45. Yousif, M.H.; Li, P.M.; Selim, M.S.; Sloan, E.D. Depressurization of natural-gas hydrates in Berea sandstone cores. J. Incl. Phenom. Mol. Recognit. Chem. 1990, 8, 71–88. [Google Scholar] [CrossRef]
  46. Yousif, M.H.; Abass, H.H.; Selim, M.S.; Sloan, E.D. Experimental and theoretical investigation of methane-gas-hydrate dissociation in porous media. SPE Reserv. Eng. 1991, 6, 69–76. [Google Scholar] [CrossRef]
  47. Kono, H.O.; Narasimhan, S.; Song, F.; Smith, D.H. Synthesis of methane gas hydrate in porous sediments and its dissociation by depressurizing. Powder Technol. 2002, 122, 239–246. [Google Scholar] [CrossRef]
  48. Kneafsey, T.J.; Tomutsa, L.; Moridis, G.J.; Seol, Y.; Freifeld, B.M.; Taylor, C.E.; Gupta, A. Methane hydrate formation and dissociation in a partially saturated core-scale sand sample. J. Petrol. Sci. Eng. 2007, 56, 108–126. [Google Scholar] [CrossRef]
  49. Lee, J.; Park, S.; Sung, W. An experimental study on the productivity of dissociated gas from gas hydrate by depressurization scheme. Energy Convers. Manag. 2010, 51, 2510–2515. [Google Scholar] [CrossRef]
  50. Davidson, D.W.; Garg, S.K.; Guogh, S.R.; Handa, Y.P.; Ratcliffe, C.I.; Tse, J.S.; Ripmeester, J.A. Some structural and thermodynamic studies of clathrate hydrates. J. Incl. Phenom. 1984, 2, 231–238. [Google Scholar] [CrossRef]
  51. John, V.T.; Holder, C.D. Hydrate of methane + n-butane below the ice point. J. Chem. Eng. Data 1982, 27, 18–27. [Google Scholar] [CrossRef]
  52. Dharma-wardana, M.W.C. Thermal conductivity of the ice polymorphs and the ice clathrates. J. Phys. Chem. 1983, 87, 4185–4190. [Google Scholar] [CrossRef]
  53. Tang, L.G.; Li, X.S.; Huang, C.; Feng, Z.P.; Li, G.; Fan, S.S. Control mechanisms for gas hydrate production by depressurization in different scale hydrate reservoirs. Energy Fuels 2007, 21, 227–233. [Google Scholar] [CrossRef]
  54. Li, X.S.; Zhang, Y. Study on dissociation behaviors of methane hydrate in porous media based on experiments and fractional dimension shrinking-core model. Ind. Eng. Chem. Res. 2011, 50, 8263–8271. [Google Scholar] [CrossRef]
  55. Haligva, C.; Linga, P.; Ripmeester, J.A.; Englezos, P. Recovery of methane from a variable-volume bed of silica sand/hydrate by depressurization. Energy Fuels 2010, 24, 2947–2955. [Google Scholar] [CrossRef]
  56. Phelps, T.J.; Peters, D.J.; Marshall, S.L.; West, O.R.; Liang, L.; Blencoe, J.G.; Alexiades, V.; Jacobs, G.K.; Naney, M.T.; Heck, J.L., Jr. A new experimental facility for investigating the formation and properties of gas hydrates under simulated seafloor conditions. Rev. Sci. Instrum. 2001, 72, 1514–1521. [Google Scholar] [CrossRef]
  57. Zhou, Y.; Castaldi, M.J.; Yegulalp, T.M. Experimental investigation of methane gas production from methane hydrate. Ind. Eng. Chem. Res. 2009, 48, 3142–3149. [Google Scholar] [CrossRef]
  58. Li, X.S.; Zhang, Y.; Li, G.; Chen, Z.Y.; Wu, H.J. Experimental investigation into the production behavior of methane hydrate in porous sediment by depressurization with a novel three-dimensional cubic hydrate simulator. Energy Fuels 2011, 25, 4497–4505. [Google Scholar] [CrossRef]
  59. Sun, C.Y.; Chen, G.J. Methane hydrate dissociation above 0 °C and below 0 °C. Fluid Phase Equilib. 2006, 242, 123–128. [Google Scholar] [CrossRef]
  60. Lin, W.; Chen, G.J.; Sun, C.Y.; Guo, X.Q.; Wu, Z.K.; Liang, M.Y.; Chen, L.T.; Yang, L.Y. Effect of surfactant on the formation and dissociation kinetic behavior of methane hydrate. Chem. Eng. Sci. 2004, 59, 4449–4455. [Google Scholar] [CrossRef]
  61. Su, K.H.; Sun, C.Y.; Yang, X.; Chen, G.J.; Fan, S.S. Experimental investigation of methane hydrate decomposition by depressurizing in porous media with 3-Dimension device. J. Nat. Gas Chem. 2010, 19, 210–216. [Google Scholar] [CrossRef]
  62. Yang, X.; Sun, C.Y.; Su, K.H.; Yuan, Q.; Li, Q.P.; Chen, G.J. A three-dimensional study on the formation and dissociation of methane hydrate in porous sediment by depressurization. Energy Convers. Manag. 2012, 56, 1–7. [Google Scholar] [CrossRef]
  63. Li, X.S.; Wan, L.H.; Li, G.; Li, Q.P.; Chen, Z.Y.; Yan, K.F. Experimental investigation into the production behavior of methane hydrate in porous sediment with hot brine stimulation. Ind. Eng. Chem. Res. 2008, 47, 9696–9702. [Google Scholar] [CrossRef]
  64. Makogon, T.Y.; Larsen, R.; Knight, C.A.; Sloan, E.D. Melt growth of tetrahydrofuran clathrate hydrate and its inhibition: Method and first results. J. Cryst. Growth 1997, 179, 258–262. [Google Scholar] [CrossRef]
  65. Holder, G.D.; Angert, P.F.; Godbole, S.P. Simulation of gas production from a reservoir containing both gas hydrates and free natural gas. In Proceedings of the SPE Annual Technical Conference and Exhibition, New Orleans, LA, USA, 26–29 September 1982. [CrossRef]
  66. McGuire, P.L. Methane hydrate gas production by thermal stimulation. In Proceedings of the 4th National Research Council of Canada Permafrost Conference, Calgary, Canada, 2–6 March 1981; pp. 356–362.
  67. Kamath, V.A.; Holder, G.D. Dissociation heat transfer characteristics of methane hydrates. AIChE J. 1987, 33, 347–350. [Google Scholar] [CrossRef]
  68. Ullerich, J.W.; Selim, M.S.; Sloan, E.D. Theory and measurement of hydrate dissociation. AIChE J. 1987, 33, 747–752. [Google Scholar] [CrossRef]
  69. Pang, W.X.; Xu, W.Y.; Sun, C.Y.; Zhang, C.L.; Chen, G.J. Methane hydrate dissociation experiment in a middle-sized quiescent reactor using thermal method. Fuel 2009, 88, 497–503. [Google Scholar] [CrossRef]
  70. Selim, M.S.; Sloan, E.D. Hydrate decomposition in sediment. SPE Reserv. Eng. 1990, 5, 245–251. [Google Scholar] [CrossRef]
  71. Kamata, Y.; Ebinuma, T.; Omura, R.; Minagawa, H.; Narita, H.; Masuda, Y.; Konno, Y. Decomposition experiment of methane hydrate sediment by thermal recovery method. In Proceedings of the 5th International Conference on Gas Hydrates, Trondheim, Norway, 13–16 June 2005; pp. 81–85.
  72. Tang, L.G.; Xiao, R.; Huang, C.; Feng, Z.P.; Fan, S.S. Experimental investigation of production behavior of gas hydrate under thermal stimulation in unconsolidated sediment. Energy Fuels 2005, 19, 2402–2407. [Google Scholar] [CrossRef]
  73. Kwon, T.H.; Kim, H.S.; Cho, G.C. Dissociation behavior of CO2 hydrate in sediments during isochoric heating. Environ. Sci. Technol. 2008, 42, 8571–8577. [Google Scholar] [CrossRef] [PubMed]
  74. Linga, P.; Haligva, C.; Nam, S.C.; Ripmeester, J.A.; Englezos, P. Recovery of methane from hydrate formed in a variable volume bed of silica sand particles. Energy Fuels 2009, 23, 5508–5516. [Google Scholar] [CrossRef]
  75. Yang, X.; Sun, C.Y.; Yuan, Q.; Ma, P.C.; Chen, G.J. Experimental study on gas production from methane hydrate-bearing sand by hot-water cyclic injection. Energy Fuels 2010, 24, 5912–5920. [Google Scholar] [CrossRef]
  76. Li, X.S.; Wang, Y.; Li, G.; Zhang, Y.; Chen, Z.Y. Experimental investigation into methane hydrate decomposition during three-dimensional thermal huff and puff. Energy Fuels 2011, 25, 1650–1658. [Google Scholar] [CrossRef]
  77. Li, G.; Li, X.S.; Wang, Y.; Zhang, Y. Production behavior of methane hydrate in porous media using huff and puff method in a novel three-dimensional simulator. Energy 2011, 25, 3170–3178. [Google Scholar] [CrossRef]
  78. Li, X.S.; Yang, B.; Li, G.; Li, B.; Zhang, Y.; Chen, Z.Y. Experimental study on gas production from methane hydrate in porous media by huff and puff method in pilot-scale hydrate simulator. Fuel 2011. [Google Scholar] [CrossRef]
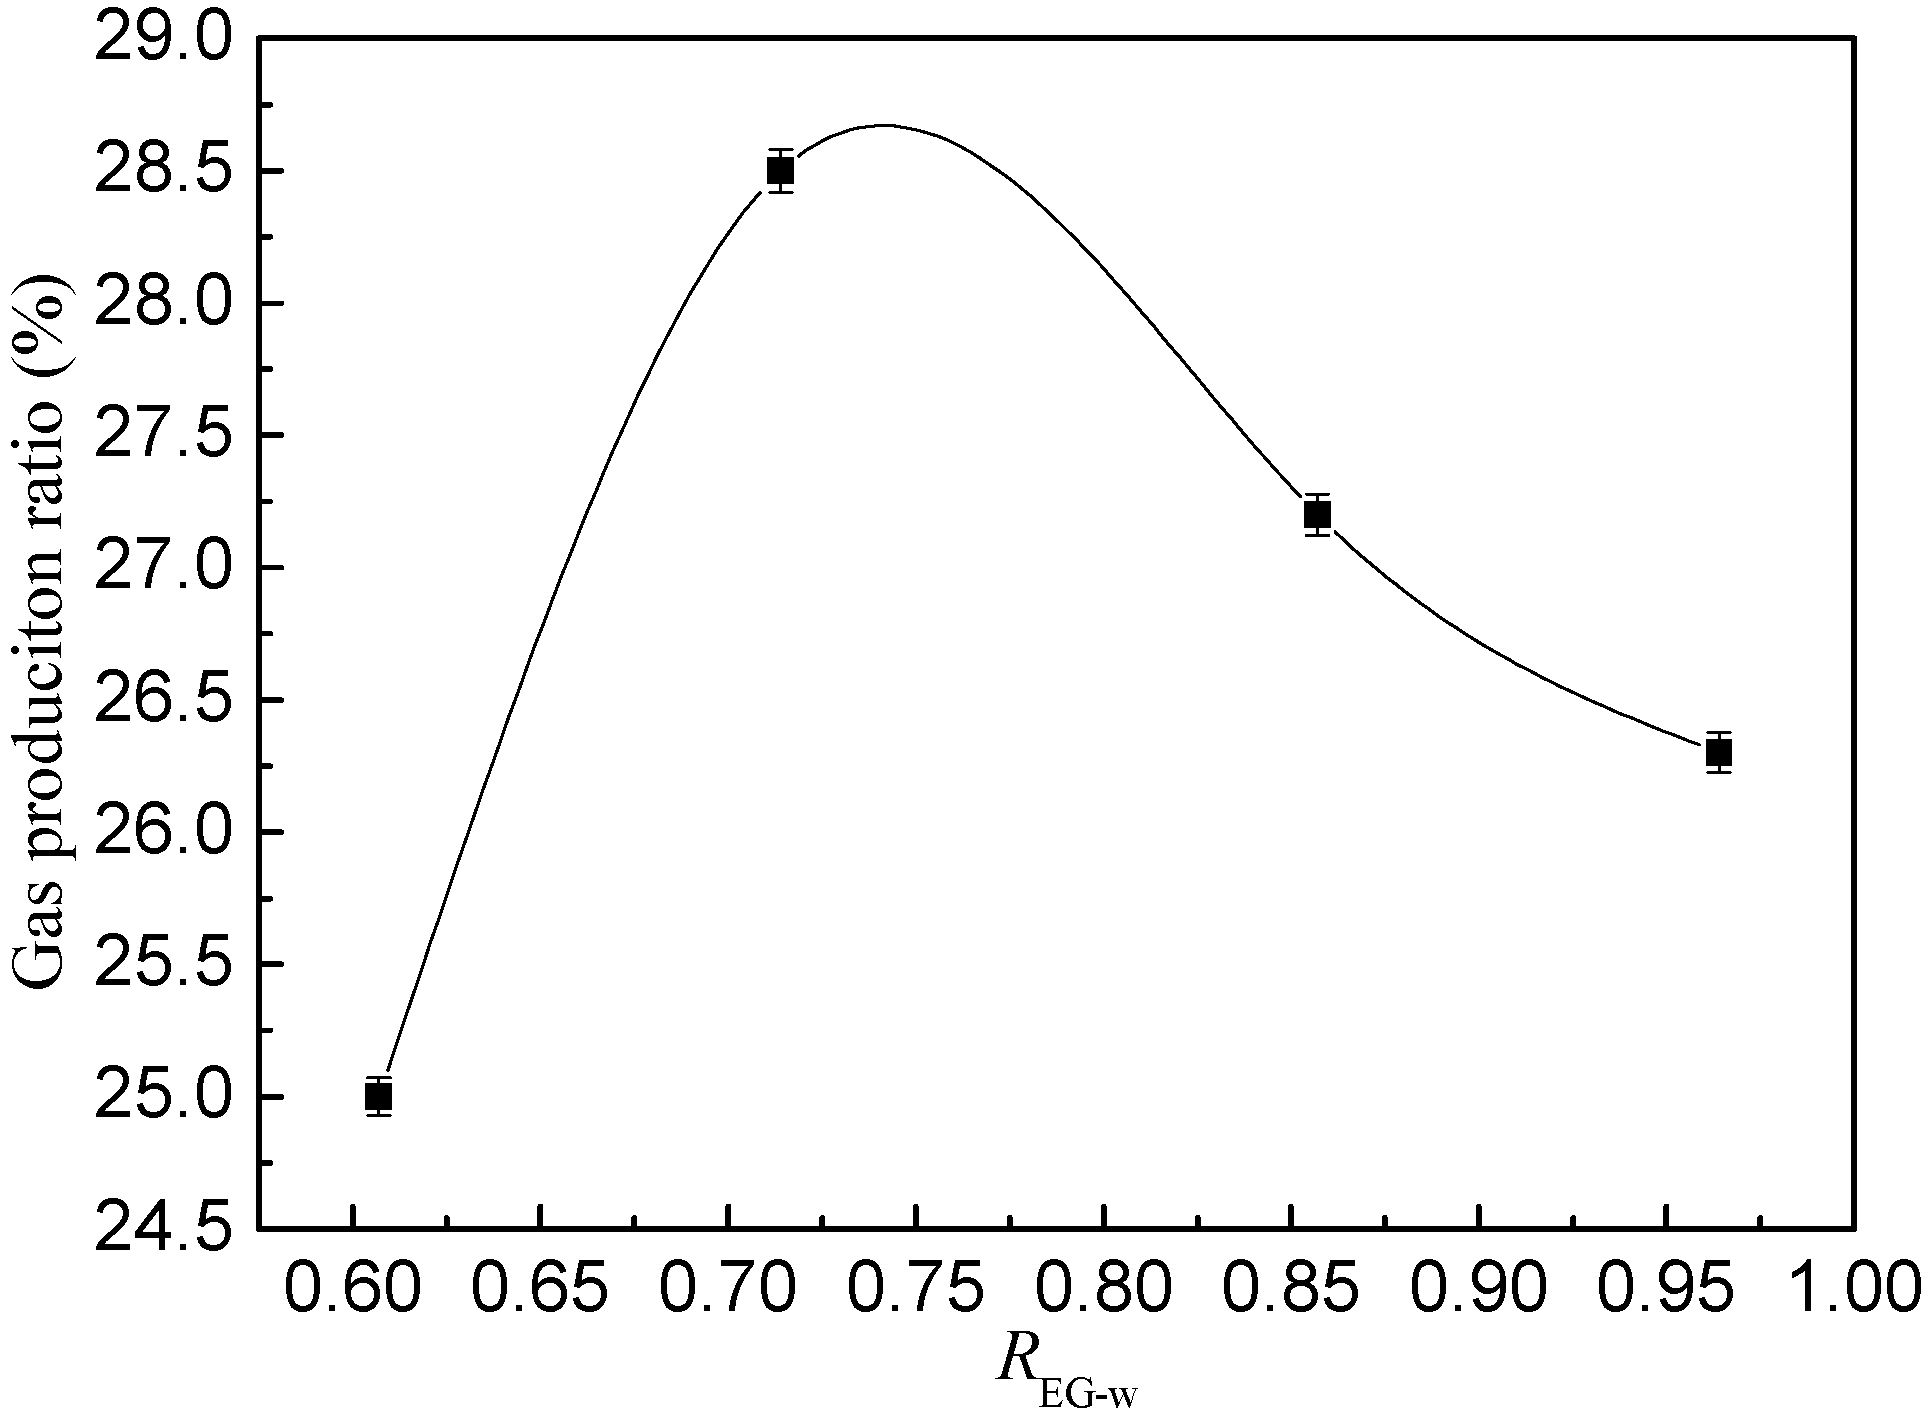
  79. Li, G.; Li, X.S.; Tang, L.G.; Zhang, Y. Experimental investigation of production behavior of methane hydrate under ethylene glycol injection in unconsolidated sediment. Energy Fuels 2007, 21, 3388–3393. [Google Scholar] [CrossRef]
  80. Ross, M.J.; Toczylkin, L.S. Hydrate dissociation pressures for methane or ethane in the presence of aqueous solutions of triethylene glycol. J. Chem. Eng. Data 1992, 37, 488–491. [Google Scholar] [CrossRef]
  81. Servio, P.; Englezos, P. Incipient equilibrium propane hydrate formation conditions in aqueous triethylene glycol solutions. J. Chem. Eng. Data 1997, 42, 800–801. [Google Scholar] [CrossRef]
  82. Englezos, P.; Bishnoi, P.R. Prediction of gas hydrate formation conditions in aqueous electrolyte solutions. AIChE J. 1988, 34, 1718–1721. [Google Scholar] [CrossRef]
  83. Englezos, P. Computation of the incipient equilibrium carbon dioxide hydrate formation conditions in aqueous electrolyte solutions. Ind. Eng. Chem. Res. 1992, 31, 2232–2237. [Google Scholar] [CrossRef]
  84. Hutz, U.; Englezos, P. Measurement of structure H hydrate phase equilibrium and the effect of electrolytes. Fluid Phase Equilib. 1996, 117, 178–185. [Google Scholar] [CrossRef]
  85. Atik, Z.; Windmeier, C.; Oellrich, L.R. Experimental gas hydrate dissociation pressures for pure methane in aqueous solutions of MgCl2 and CaCl2 and for a (methane + ethane) gas mixture in an aqueous solution of (NaCl + MgCl2). J. Chem. Eng. Data 2006, 51, 1862–1867. [Google Scholar] [CrossRef]
  86. Mohammadi, A.H.; Richon, D. Estimating the hydrate safety margin in the presence of salt or organic inhibitor using refractive index data of aqueous solution. Ind. Eng. Chem. Res. 2006, 45, 8207–8212. [Google Scholar] [CrossRef]
  87. Mohammadi, A.H.; Richon, D. Estimating the hydrate safety margin using surface tension data of salt aqueous solution. Ind. Eng. Chem. Res. 2006, 45, 8154–8157. [Google Scholar] [CrossRef]
  88. Mohammadi, A.H.; Richon, D. Determination of gas hydrate safety margin using specific gravity data of salt or organic inhibitor aqueous solution. Ind. Eng. Chem. Res. 2007, 46, 3852–3857. [Google Scholar] [CrossRef]
  89. Mohammadi, A.H.; Richon, D. Use of boiling point elevation data of aqueous solutions for estimating hydrate stability zone. Ind. Eng. Chem. Res. 2007, 46, 987–989. [Google Scholar] [CrossRef]
  90. Mohammadi, A.H.; Richon, D. Methane hydrate phase equilibrium in the presence of salt (NaCl, KCl, or CaCl2) + ethylene glycol or salt (NaCl, KCl, or CaCl2) + methanol aqueous solution: Experimental determination of dissociation condition. J. Chem. Thermodyn. 2009, 41, 1374–1377. [Google Scholar] [CrossRef]
  91. Mohammadi, A.H.; Richon, D. Gas hydrate phase equilibrium in the presence of ethylene glycol or methanol aqueous solution. Ind. Eng. Chem. Res. 2010, 49, 8865–8869. [Google Scholar] [CrossRef]
  92. Mohammadi, A.H.; Richon, D. Phase equilibria of methane hydrates in the presence of methanol and/or ethylene glycol aqueous solutions. Ind. Eng. Chem. Res. 2010, 49, 925–928. [Google Scholar] [CrossRef]
  93. Afzal, W.; Mohammadi, A.H.; Richon, D. Experimental measurements and predictions of dissociation conditions for carbon dioxide and methane hydrates in the presence of triethylene glycol aqueous solutions. J. Chem. Eng. Data 2007, 52, 2053–2055. [Google Scholar] [CrossRef]
  94. Mohammadi, A.H.; Afzal, W.; Richon, D. Experimental data and predictions of dissociation conditions for ethane and propane simple hydrates in the presence of distilled water and methane, ethane, propane, and carbon dioxide simple hydrates in the presence of ethanol aqueous solutions. J. Chem. Eng. Data 2008, 53, 73–76. [Google Scholar] [CrossRef]
  95. Afzal, W.; Mohammadi, A.H.; Richon, D. Experimental measurements and predictions of dissociation conditions for methane, ethane, propane, and carbon dioxide simple hydrates in the presence of diethylene glycol aqueous solutions. J. Chem. Eng. Data 2008, 53, 663–666. [Google Scholar] [CrossRef]
  96. Mohammadi, A.H.; Afzal, W.; Richon, D. Experimental data and predictions of dissociation conditions for ethane and propane simple hydrates in the presence of methanol, ethylene glycol, and triethylene glycol aqueous solutions. J. Chem. Eng. Data 2008, 53, 683–686. [Google Scholar] [CrossRef]
  97. Mohammadi, A.H.; Afzal, W.; Richon, D. Gas hydrates of methane, ethane, propane, and carbon dioxide in the presence of single NaCl, KCl, and CaCl2 aqueous solutions: Experimental measurements and predictions of dissociation conditions. J. Chem. Thermodyn. 2008, 40, 1693–1697. [Google Scholar] [CrossRef]
  98. Mohammadi, A.H.; Laurens, S.; Richon, D. Experimental study of methane hydrate phase equilibrium in the presence of polyethylene glycol-400 aqueous solution. J. Chem. Eng. Data 2009, 54, 3118–3120. [Google Scholar] [CrossRef]
  99. Katz, D.L.; Cornell, D.; Poettmann, F.H.; Vary, J.A.; Elenbaas, J.R.; Weinaug, C.F. Handbook of Natural Gas Engineering; McGraw-Hill Book Co.,Inc.: New York, NY, USA, 1959; p. 802. [Google Scholar]
  100. Elgibaly, A.; Elkamel, A. Optimal hydrate inhibition policies with the aid of neural networks. Energy Fuels 1999, 13, 105–113. [Google Scholar] [CrossRef]
  101. Makogon, Y.F. Hydrates of Natural Gas; PennWell: Tulsa, OK, USA, 1981; pp. 131–132. [Google Scholar]
  102. Sira, J.H.; Patil, S.L.; Kamath, V.A. Study of hydrate dissociation by methanol and glycol injection. In Proceedings of the SPE Annual Technical Conference and Exhibition, New Orleans, LA, USA, 23–26 September 1990. [CrossRef]
  103. Kawamura, T.; Sakamoto, Y.; Ohtake, M.; Yamamoto, T.; Komai, T.; Haneda, H. Dissociation behavior of pellet-shaped methane hydrate in ethylene glycol and silicone oil. Part 1: Dissociation above ice point. Ind. Eng. Chem. Res. 2006, 45, 360–364. [Google Scholar] [CrossRef]
  104. Fan, S.S.; Zhang, Y.Z.; Tian, G.L.; Liang, D.Q.; Li, D.L. Natural gas hydrate dissociation by presence of ethylene glycol. Energy Fuels 2006, 20, 324–326. [Google Scholar] [CrossRef]
  105. Dong, F.H.; Zang, X.Y.; Li, D.L.; Fan, S.S.; Liang, D.Q. Experimental investigation on propane hydrate dissociation by high concentration methanol and ethylene glycol solution injection. Energy Fuels 2009, 23, 1563–1567. [Google Scholar] [CrossRef]
  106. Lee, J. Experimental study on the dissociation behavior and productivity of gas hydrate by brine injection scheme in porous rock. Energy Fuels 2010, 24, 456–463. [Google Scholar] [CrossRef]
  107. Yuan, Q.; Sun, C.Y.; Yang, X.; Ma, P.C.; Ma, Z.W.; Li, Q.P.; Chen, G.J. Gas production from methane-hydrate-bearing sands by ethylene glycol injection using a three-dimensional reactor. Energy Fuels 2011, 25, 3108–3115. [Google Scholar] [CrossRef]
  108. Hirohama, S.; Shimoyama, Y.; Wakabayashi, A.; Tatsuta, S.; Nishida, N. Conversion of CH4-hydrate to CO2-hydrate in liquid CO2. J. Chem. Eng. Jpn. 1996, 29, 1014–1020. [Google Scholar] [CrossRef]
  109. Jadhawar, P.; Mohammadi, A.H.; Yang, J.; Tohidi, B. Subsurface carbon dioxide storage through clathrate hydrate formation. In Advances in the Geological Storage of Carbon Dioxide; Lombardi, S., Altunina, L.K., Beaubien, S.E., Eds.; Springer: Dordrecht, the Netherlands, 2006; pp. 111–126. [Google Scholar]
  110. Castaldi, M.J.; Zhou, Y.; Yegulalp, T.M. Down-hole combustion method for gas production from methane hydrates. J. Pet. Sci. Eng. 2007, 56, 176–185. [Google Scholar] [CrossRef]
  111. Ning, F.L.; Jiang, G.S.; Tang, F.L.; Xiang, W.; Pan, X.Y. Utilizing geothermal energy to exploit marine gas hydrate. Nat. Gas Ind. 2006, 26, 136–138. (in Chinese). [Google Scholar]
  112. Islam, M.R. A new recovery technique for gas production from Alaskan gas hydrates. J. Pet. Sci. Eng. 1994, 11, 267–281. [Google Scholar] [CrossRef]
  113. Rachit, G.; Konark, O.; Arpit, C. New horizons in gas hydrate recovery using fluorine and microwave technology. In Proceedings of the Europec/EAGE Conference and Exhibition, Rome, Italy, 9–12 June 2008. [CrossRef]
  114. Li, X.S.; Wang, Yi.; Li, G.; Zhang, Y. Experimental investigations into gas production behaviors from methane hydrate with different methods in a cubic hydrate simulator. Energy Fuels 2011. [CrossRef]
  115. Makogon, Y.F. Natural Gas Hydrates: The state of study in the USSR and perspectives for its use. In Proceedings of the Third Chemical Congress of North America, Toronto, Canada, 5–10 June 1988.

