Integrated Simulation Model for Energy Security Evaluation

Graduate School of System Design and Management, Keio University, Collaboration Complex, 4-1-1 Hiyoshi, Kohoku-ku, Yokohama, Kanagawa 223-8526, Japan
*
Author to whom correspondence should be addressed.
Energies 2012, 5(12), 5086-5110; https://doi.org/10.3390/en5125086
Submission received: 8 October 2012
/
Revised: 12 November 2012
/
Accepted: 29 November 2012
/
Published: 4 December 2012
Abstract
:Energy security is a difficult issue to evaluate due to its polysemic and multifaceted nature. Recent studies have evaluated energy security by considering a multitude of dimensions (i.e., availability, affordability, etc.). However, these works lack coherence, as performance in one dimension is not necessarily relevant to performance in others. Due to this consideration, an ex-ante evaluation (i.e., policy analysis) of energy security cannot be reliably performed. This paper proposes an integrated simulation approach to address this apparent shortcoming. We consider energy security performance as a feature that emerges from interactions between the components of energy security dimensions. Integration is completed by identifying and establishing relationships between these components. A model is developed for the simulation that uses system dynamics as a modeling tool. The evaluation of Indonesia’s energy security is presented as an example. It is found that the policies intended to improve Indonesia’s energy security may conflict with each other. Increasing energy production will maintain the performance of the availability dimension at a high level in the short term, but this benefit is outweighed by the resulting degradation to the performance of the acceptability dimension. Subsidy elimination will increase the availability of energy due to lower energy consumption at the expense of maintaining energy affordability for the public. This study shows that the interrelationships between the dimensions of energy security is an important aspect to consider in energy security evaluations, as they can reveal tradeoffs between policies and improve the reliability of analyses.
1. Introduction
In recent years, energy security has become a major concern for many countries. The continuation of the energy supply is of high importance to ensure that social and economic activities operate properly. However, the increasing demand for energy is unavoidable due to economic and population growth. Threats to the energy supply are also increasing due to emerging challenges. Therefore, governments are attempting to produce policies that will improve their countries’ levels of energy security.
The concept of energy security has traditionally been characterized by a strong focus on the oil supply [1]. Furthermore, oil price hikes have been identified as a risk that may jeopardize economic performance [2]. For this reason, energy security evaluations have primarily been conducted from an economic perspective. However, with the emerging global challenges, such as energy resource depletion, climate change, and geopolitical tension, energy security has become a complex, multifaceted problem; it is difficult to identify a clear solution [3]. Therefore, although the traditional perspective on energy security remains an important perspective, it is insufficient.
Some studies [4,5,6] have expanded the picture of energy security by considering the emerging challenges. Although new perspectives have been introduced, these studies view energy security from a solitary perspective that can provide only a partial assessment and may even result in misleading conclusions. Recent studies [7,8,9] suggest that the evaluation of energy security is ideally conducted within a comprehensive framework that encompasses the challenges associated with various dimensions. The applications of such a framework include studies from [10] and [11]. However, although these researchers acknowledge that the interrelationship between dimensions is an important factor, this factor has yet to be implemented in the application of the framework. Hence, energy security dimensions are assembled rather than integrated. As a result, the performance of one dimension is not necessarily relevant to the others. For this reason, any energy security evaluation that considers ex-ante analysis (e.g., policy analysis) may be severely deficient in reliability because it does not capture convergence and the conflicts between implemented policies. Other studies [6,12] corroborate the importance of the interrelationships between dimensions of energy security.
Accordingly, we propose an integrated simulation model that takes the interrelationships between energy security dimensions into account. Our simulation model is developed based on system dynamics modeling method. We aim to perform a more reliable policy analysis by establishing coherent interrelationships between the dimension’s components and by capturing the converging and conflicting impacts of policy implementations on energy security performance. The paper is structured as follows: the next section explains the approach of the study. In Section 3, the approach is implemented, and a policy analysis of a country is performed. Section 4 presents discussion of the analysis, and Section 5 presents the conclusions.
2. Integrated Simulation Approach
An integrated approach using a simulation model has been used to support energy policy formulations and evaluations [13]. The simulation model has features that are distinct from those of other models, such as optimization and econometric models. Because optimization is inherently prescriptive, models adopting the optimization approach provide the best actions to achieve the optimal goals. Some limitations of models using the optimization approach include their difficulty addressing conflicting values and preferences in determining the objective function, their inclination towards linearity, and their lack of feedback and dynamics [14]. The econometric model is a robust but rigid approach. The limitations of models using the econometric approach stem from the underlying assumptions of fully rational human behavior, perfect information and a state of equilibrium [14]. Another limitation of econometric models is that they are heavily reliant on historical data. As a result, an econometric model may not be able to address situations that have not yet been experienced, which may deviate the future state from the historical data projection [14]. Contrary to optimization, simulation is descriptive. Simulation focuses on causal relationships that construct the dynamics of the issue at hand [14]. These features enable a what-if analysis, allowing us to study the consequences of implementing a set of proposed solutions (i.e., policies) to the problem being investigated; such features are invaluable to the policy analysis conducted in this study. However, there are limitations to the simulation approach when it is applied to policy analysis. In policy analysis, simulation generally addresses high levels of abstraction and essentially complex interlinkages. For this reason, an aggregated description of the decision rules, the use and quantification of soft variables and the choice of the model boundary [14] are potential limitations to a simulation model.
This study is carried out primarily by developing and running a simulation model. However, because we value some features of the econometric approach, we make use of the available historical data to determine the behavior of certain variables. Therefore, to some extent, our model can be seen as a hybrid simulation-econometric model.
2.1. Simulation Model Development
The study relies on a simulation model to perform an energy security evaluation. To develop the model, we identify five stages: energy security problem formulation; energy security conceptualization and measurement; model definition; model construction; and model verification tests. The following sections will elaborate on the development of the model.
2.1.1. Energy Security Problem Formulation
With regards to the shortcoming explained in the introduction, the problem can be addressed by formulating the following question: what can be done to improve energy security? This question is relevant to this study because it addresses two important points related to the need for ex-ante energy security evaluation. First, the term “what” refers to an action or situation (i.e., policy implementation) that may cause changes to energy security performance. Second, the word “improve” refers to the future impact resulting from these changes.
2.1.2. Energy Security Conceptualization and Measurement
Conceptualization
Due to its subjective and contextual nature [15], the definition of energy security should first be conceptualized according to the context in which the evaluation will be performed. The concept must be based on the stakeholder’s view of energy security. This is a critical step that will determine whether the model that will later be developed is valid and whether the evaluation will be useful.
We do this by determining the level of analysis (e.g., local, national, regional or global) and by identifying the relevant key stakeholders. The next step is to select the dimensions and indicators. The outcome of this step is a boundary to the model that will be developed later. The output of this stage is a set of dimensions and their indicators, which the model must be able to calculate at a certain level of analysis.
Measurement
The metrics of the indicator may be composed of different measurement units and different orders of magnitude. Some indicators may be expressed in opposing measurement directions. Therefore, a uniform measurement tool is required to facilitate an understanding of the evaluation. Accordingly, we make the metrics unidirectional and transform them into a composite index:
where P is the performance score of indicator i, M is the calculated value of metric i in year t and T is the base year.
To reflect energy security performance in the individual dimension, the performance score of indicators belonging in the same dimension of year t are summed up and then normalized by dividing the sum by sum of the scores of indicators that belong in the same dimension of the base year T. This can be expressed as follows:
where d is the dimension in which the indicator belongs.
To reflect the overall performance, the scores of all the indicators are summed up and normalized by the sum of all the indicator scores of the base year. This can be expressed as follows:
2.1.3. Model Definition
Two steps are necessary to define the model. First, the energy security concept must be broken down into further details by decomposing the indicators into their definitive components. Second, the relationships between the dimensions must be clarified. Two types of relationships can be identified: constitutive and influential. A constitutive relationship is identified when a component is a constituent or building block of another component, while an influential relationship is identified when a component is not part of another component, but its state influences another component’s state. For example, domestic consumption, government spending, investments, exports and imports are usually considered to be the components that constitute the GDP (gross domestic product). Therefore, these components have constitutive relationships with the GDP. On the other hand, there are factors that are not part of the GDP but influence it. For instance, population level is not part of the GDP, but conventionally, it influences household consumption; therefore, population has an influential relationship with the GDP through household consumption. It is important to identify these influential relationships, as they will allow us to locate which parts of the model require further attention for verification, and verification will eventually increase the reliability of the model.
This stage is performed iteratively until the relationships between the dimensions can be identified. It should be noted that the iteration can continue to any desired level of detail, as long as the purpose of analysis allows and the availability of data permits. From the modeling perspective, this stage further refines the boundary of the model.
2.1.4. Model Construction
Once the components and their relationships have been identified, the model can be constructed. The system dynamics (SD) modeling tool is widely established for use in policy analysis [16]. Various SD applications to energy issues can be found in the literature: for example [17,18,19,20,21]. Two main features of SD are important to this study. The first is its ability to capture the complexity of an issue, and the second is its use of feedback to represent the mechanism that governs the dynamics of an issue. The former feature is important to explicitly express the intertwined relationships between energy security dimensions. The latter is important because it can demonstrate the convergences and conflicts between policy implementations to improve energy security. For these reasons, SD was selected as the main tool to develop the simulation model.
As the modeling process is mainly performed using SD, the subsequent processes are based on SD modeling steps that are composed of developing a causal-loop diagram (CLD) and a stock-and-flow diagram (SFD), along with the underlying mathematical equations. A CLD is a map of the model components and their interactions. The interactions are characterized by having either a positive or a negative causal link. A positive causal link means that changes in the related components are in the same direction, while a negative link indicates the opposite. Constructing a CLD allows a complex system structure to be described by its feedback loops. To perform a quantitative analysis of the system, a CLD is then transformed into an SFD using the variables of stock, flow and converter. Thus, it becomes possible to simulate a system’s behavior overtime.
2.1.5. Verification Test
To verify the model, two tests are conducted: a structural test and a behavior test. A structural test is performed to verify that all the required components and the relationships between the components are represented by the model. This test is conducted by making sure that every component exists as a variable of the model. The influential relationships are checked by employing statistics, except for any clear conceptions and logically apparent relationships.
The behavior test is required to verify whether the model—from each component as an individual part to the system as an integrated whole—can simulate known behavior. This test increases the confidence in the model’s ability to perform ex-ante analyses and is conducted by employing an error analysis of the model simulation results against historical data.
2.2. Experimentation
The effect of integrative treatment on energy security dimensions can be observed in the indicators’ resulting behaviors when various scenarios are simulated. It is expected that the performance of an indicator can be reflected in other relevant indicators. In this stage, scenarios are developed by manipulating the relevant parameters to reflect certain situations’ impact on energy security performance. The selection of parameters and their value settings are entirely dependent on the policy associated with the established context.
2.3. Result Analysis
The next step is to analyze the results of the simulated scenarios. An analysis can be performed in several ways, such as comparing the impact of different policies on energy security improvement. This analysis is useful toward identifying leverage points, such as strategy or policy options. Another possibility is to identify the converging or conflicting policy impacts that are either beneficial or detrimental to the energy security level.
3. Implementation
3.1. Developing a Simulation Model for Indonesia
To demonstrate its applicability, the approach is implemented by developing a simulation model for the evaluation of Indonesia’s energy security. Indonesia faces a number of dilemmatic issues. Its favorable economic growth is followed by a rapid increase in its energy demand. This occurs amid the country’s transformation into a net oil importer due to its dwindling oil production, while it still relies heavily on oil as its primary source of energy. Alternative fossil energies are abundant; however, their use to increase the energy supply is complicated by environmental and commercial issues. Importing is a difficult option, as it may pose various risks related to supply dependence, while energy subsidies have always been controversial. By evaluating Indonesia’s energy security, this study will demonstrate the usefulness of the integrated simulation model to capture the converging and conflicting impacts of policy implementation on energy security performance. The following sections will further explain Indonesia’s situation and the details behind the development of the simulation model.
3.1.1. Formulating Indonesia’s Energy Security Problem
Since the Asian economic crisis of 1998–1999, Indonesia’s economy has grown steadily. It was reported that the GDP growth reached 6.1% in 2009–2010 [22], and the government is confident that the country’s economic development can be maintained at a favorable rate for the foreseeable future. This growth is partially the result of Indonesia’s strong domestic market due to its large population. Indonesia has experienced a steady population growth in the last decade [23]. However, a considerable increase in population growth is expected, as the latest census in 2010 shows a 1.49% annual growth. This is 14% higher than the government predicted [22]. It is believed that in the coming decade, Indonesia’s population growth will become even higher.
Indonesia’s energy demand is also increasing, following its population and economic growth. The average energy consumption growth increased from 9.2% in 2000 to 2005 to 12.1% in 2005 to 2008 [24]. Subsidies, a longtime dilemma for Indonesia, are considered a major obstacle to improving energy consumption efficiency. However, despite pressures to eliminate subsidies, they remain in place due to significant resistance from the public, which often leads to socio-political instability. Oil has long been the dominant primary source of energy, and it is expected to continue to play an important part in Indonesia’s future energy mix. However, oil production has declined over the past decade [24] due to the maturity of the reservoirs and fewer new oil discoveries. This decline eventually resulted in Indonesia’s resignation from OPEC in 2008, when it became a net oil importing country. As an alternative to oil, the government has turned to coal and gas. Although coal is abundant in Indonesia, its GHG emissions have worsened over the last decade. In particular, CO2 emissions increased by more than 200% from 1999 to 2009. The average annual energy-related CO2 emission from 1999 to 2004 was 11.2 Mton-CO2/year, while from 2005 to 2009, it was 21.1 Mton-CO2/year [25]. As a result, coal use is becoming noticeably riskier. Gas production has been in an increasing trend over the years, although it has experienced some declines and increases, such as a 5% decline in 2007 and an increase as high as 11% in 2010 [26]. With 408.7 trillions of standard cubic feet (TSCF) of gas resources and an average of 3.0 billions of standard cubic feet (BSCF) of annual production [26], gas does not pose an immediate risk to energy security. In fact, the major threat to energy security comes from long-term export contracts that restrain the gas supply in the domestic market [24]. Nevertheless, gas is still subject to depletion. Therefore, the increased importation of fossil energy is inevitable if this situation does not change.
Advancements in technology may provide an alternative solution to Indonesia’s problem; however, this is not considered highly likely at this time. As a developing country, Indonesia’s technology achievement is at the lower end of the technology adopter category, currently ranking 60th [27,28]. In addition, the penetration of advanced energy efficiency and renewable energy technologies (i.e., hybrid vehicles and solar PV) is very low. In summary, it is likely that Indonesia’s energy demand will continue to increase amid the energy supply problems related to its declining oil production: dilemmatic subsidy implementation, hindrances to coal and gas utilization, and increasing environmental concerns. Accordingly, it is clear that the current situation will lead to deterioration in energy security, forcing Indonesia to assess its policy options in an effort to improve its energy security.
3.1.2. Conceptualizing and Measuring Energy Security in Indonesia
Conceptualization
The stakeholders whose roles are related to Indonesia’s energy security issue have been explored and categorized. For this paper, it was previously determined that the analysis would take place at the national level and that the role of the stakeholder is that of policy makers. Table 1 provides the list of identified stakeholders and their roles as related to the energy security issue at the national level.

| Stakeholder | Policy Maker | R&D | Operator | Market Regulator | Consumer |
|---|---|---|---|---|---|
| President | x | ||||
| Ministry of Energy and Mineral Resources | x | ||||
| Ministry of Environment | x | ||||
| Ministry of Transport | x | ||||
| Ministry of Finance | x | ||||
| Ministry of Industry | x | ||||
| Ministry of Research and Technology | x | ||||
| Ministry of Trade | x | ||||
| BAPPENAS | x | ||||
| DEN | x | x | x | ||
| DPR 7th Commission | x | x | x | ||
| BPPT | x | ||||
| Universities and Research Institutes | x | x | |||
| WALHI | x | x | |||
| PT Pertamina | x | ||||
| PT PGN | x | ||||
| PT PLN | x | x | |||
| PT Bukit Asam | x | ||||
| BPMigas | x | ||||
| BPHMigas | x | ||||
| ORGANDA | x | ||||
| YLKI | x | ||||
| KADIN | x |
BAPPENAS: National Development Agency; DEN: National Energy Council; DPR: Parliament; BPPT: Agency for Assessment and Application Technology; WALHI: Key environmental NGO; Pertamina: National oil company; PGN: National gas company; PLN: National electricity company; Bukit Asam: National coal company; BPMigas: Agency for Upstream Oil and Gas Activity; BPHMigas: Agency for Downstream Oil and Gas Activity; ORGANDA: Association of Land Transportation Entrepreneurs; YLKI: National Consumer Organization; KADIN: Indonesia’s Chamber of Commerce.
In conceptualizing energy security, other researchers [10,11] have relied on interviews as their main tool when determining the dimensions and indicators. However, we believe that decisions at the national level are not made personally but institutionally. Therefore, the interview is less appropriate in this case. Accordingly, we place greater emphasis on the literature review of official documents, research reports and academic papers, and we employ personal interviews as a means to confirm or clarify the findings from those documents. For example, the term “energy efficiency” is mentioned many times in Indonesia’s National Energy Management Blueprint document that was published by the National Council of Energy. Obviously it is an important factor for energy security, however, we could not find specific definition of the term. Therefore, to clarify this, we consulted the council and discuss on its definition and how it should be measured.
From the review, we collected concepts, statements and measurements that signify concerns over Indonesia’s energy security. We then synthesized them coherently into a set of energy security dimensions and indicators guided by previously known classifications [7,8,9,10]. The concept of energy security in Indonesia can be described by its dimensions and the relevant indicators of these dimensions, as shown in Table 2.
| Dimension | Indicator | Metric and Unit | Equation | |
|---|---|---|---|---|
| A. Availability | A1 | Self-sufficiency | Share of energy demand (Di) met by domestic production (Pi), % | |
| A2 | Diversification (Non-fossil) | Share of non-fossil energy supply (Si) in total primary energy supply (S), % | ||
| A3 | Diversification (Total) | Diversity of energy source in total primary energy supply (SWI *) | ||
| A4 | Remaining production | Average fossil energy reserve (Ri) to production (Pi) ratio | ||
| A5 | Import dependence | Share of fossil energy import (Mi) in total primary energy supply (S), % | ||
| A6 | Oil import cost | Share of oil import value (MVoil) in GDP, % | ||
| A7 | Stockpile | Ratio of emergency stockpiles for oil (Loil) to oil consumption (Coil) | ||
| B. Affordability | B1 | Cost of subsidy | Expenditure on subsidy (SUB) as part of government spending (G), % | |
| B2 | Subsidy | Ratio of energy subsidy per capita (SUBC) and Income (N) | ||
| C. Efficiency | C1 | Energy intensity | Energy consumption (Ci) per GDP, Mtoe/Bil-USD | |
| D. Acceptability | D1 | Emission intensity (energy) | Energy-related CO2 emissions (EMi) per energy consumption (Ci), kg-CO2/Mtoe | |
| D2 | Emission intensity (economy) | Energy-related CO2 emissions(EMi) per GDP, kg-CO2/Bil-GDP | ||
* Shannon-Wiener diversity index.
In this study, four dimensions are considered: availability, affordability, efficiency and acceptability. Each of these is measured by 12 indicators. The first dimension is availability. This dimension reflects certain major issues, such as the need for the continuous actual existence of energy to sustain Indonesia’s socio-economic activities, the country’s dependency on fossil fuel and imported energy, and the country’s ability to buy oil from abroad and provide reasonable energy prices. The performance of this dimension is described by seven indicators: self-sufficiency, diversification (non-fossil), diversification (total), remaining production, import dependence, oil import cost, and oil stockpile.
The affordability dimension reflects the country’s ability to provide comparatively affordable energy to the domestic market. This dimension’s performance is indicated by the share of the subsidy within the government spending and the ratio between the amount of subsidy per capita and income.
The efficiency dimension is indicated by the energy intensity. This indicator is often used to represent specific factors that change the energy consumption performance, such as the adoption of more advanced technology and products that result in higher efficiency, fuel switching to more efficient energy carriers and changes in the manner of consuming energy.
The acceptability dimension is mainly related to the climate change issue and is indicated by the ratio of energy-related CO2 emissions (e.g., from fossil fuel combustion) to energy consumption and energy-related CO2 emissions for every billion dollars in the GDP.
Composite Index Measurement
As presented in Table 2, some indicators are expressed in different measurement units and reflect opposing directions (e.g., for import dependence, lower is better, while for self-sufficiency, higher is better). For the calculation of the composite index, the following metrics have been transformed to their reverse forms: import dependence, oil import cost, cost of subsidy, energy intensity and emission intensity (energy and economy). The composite index is based on 2010 data, the base year.
3.1.3. Defining Indonesia’s Model
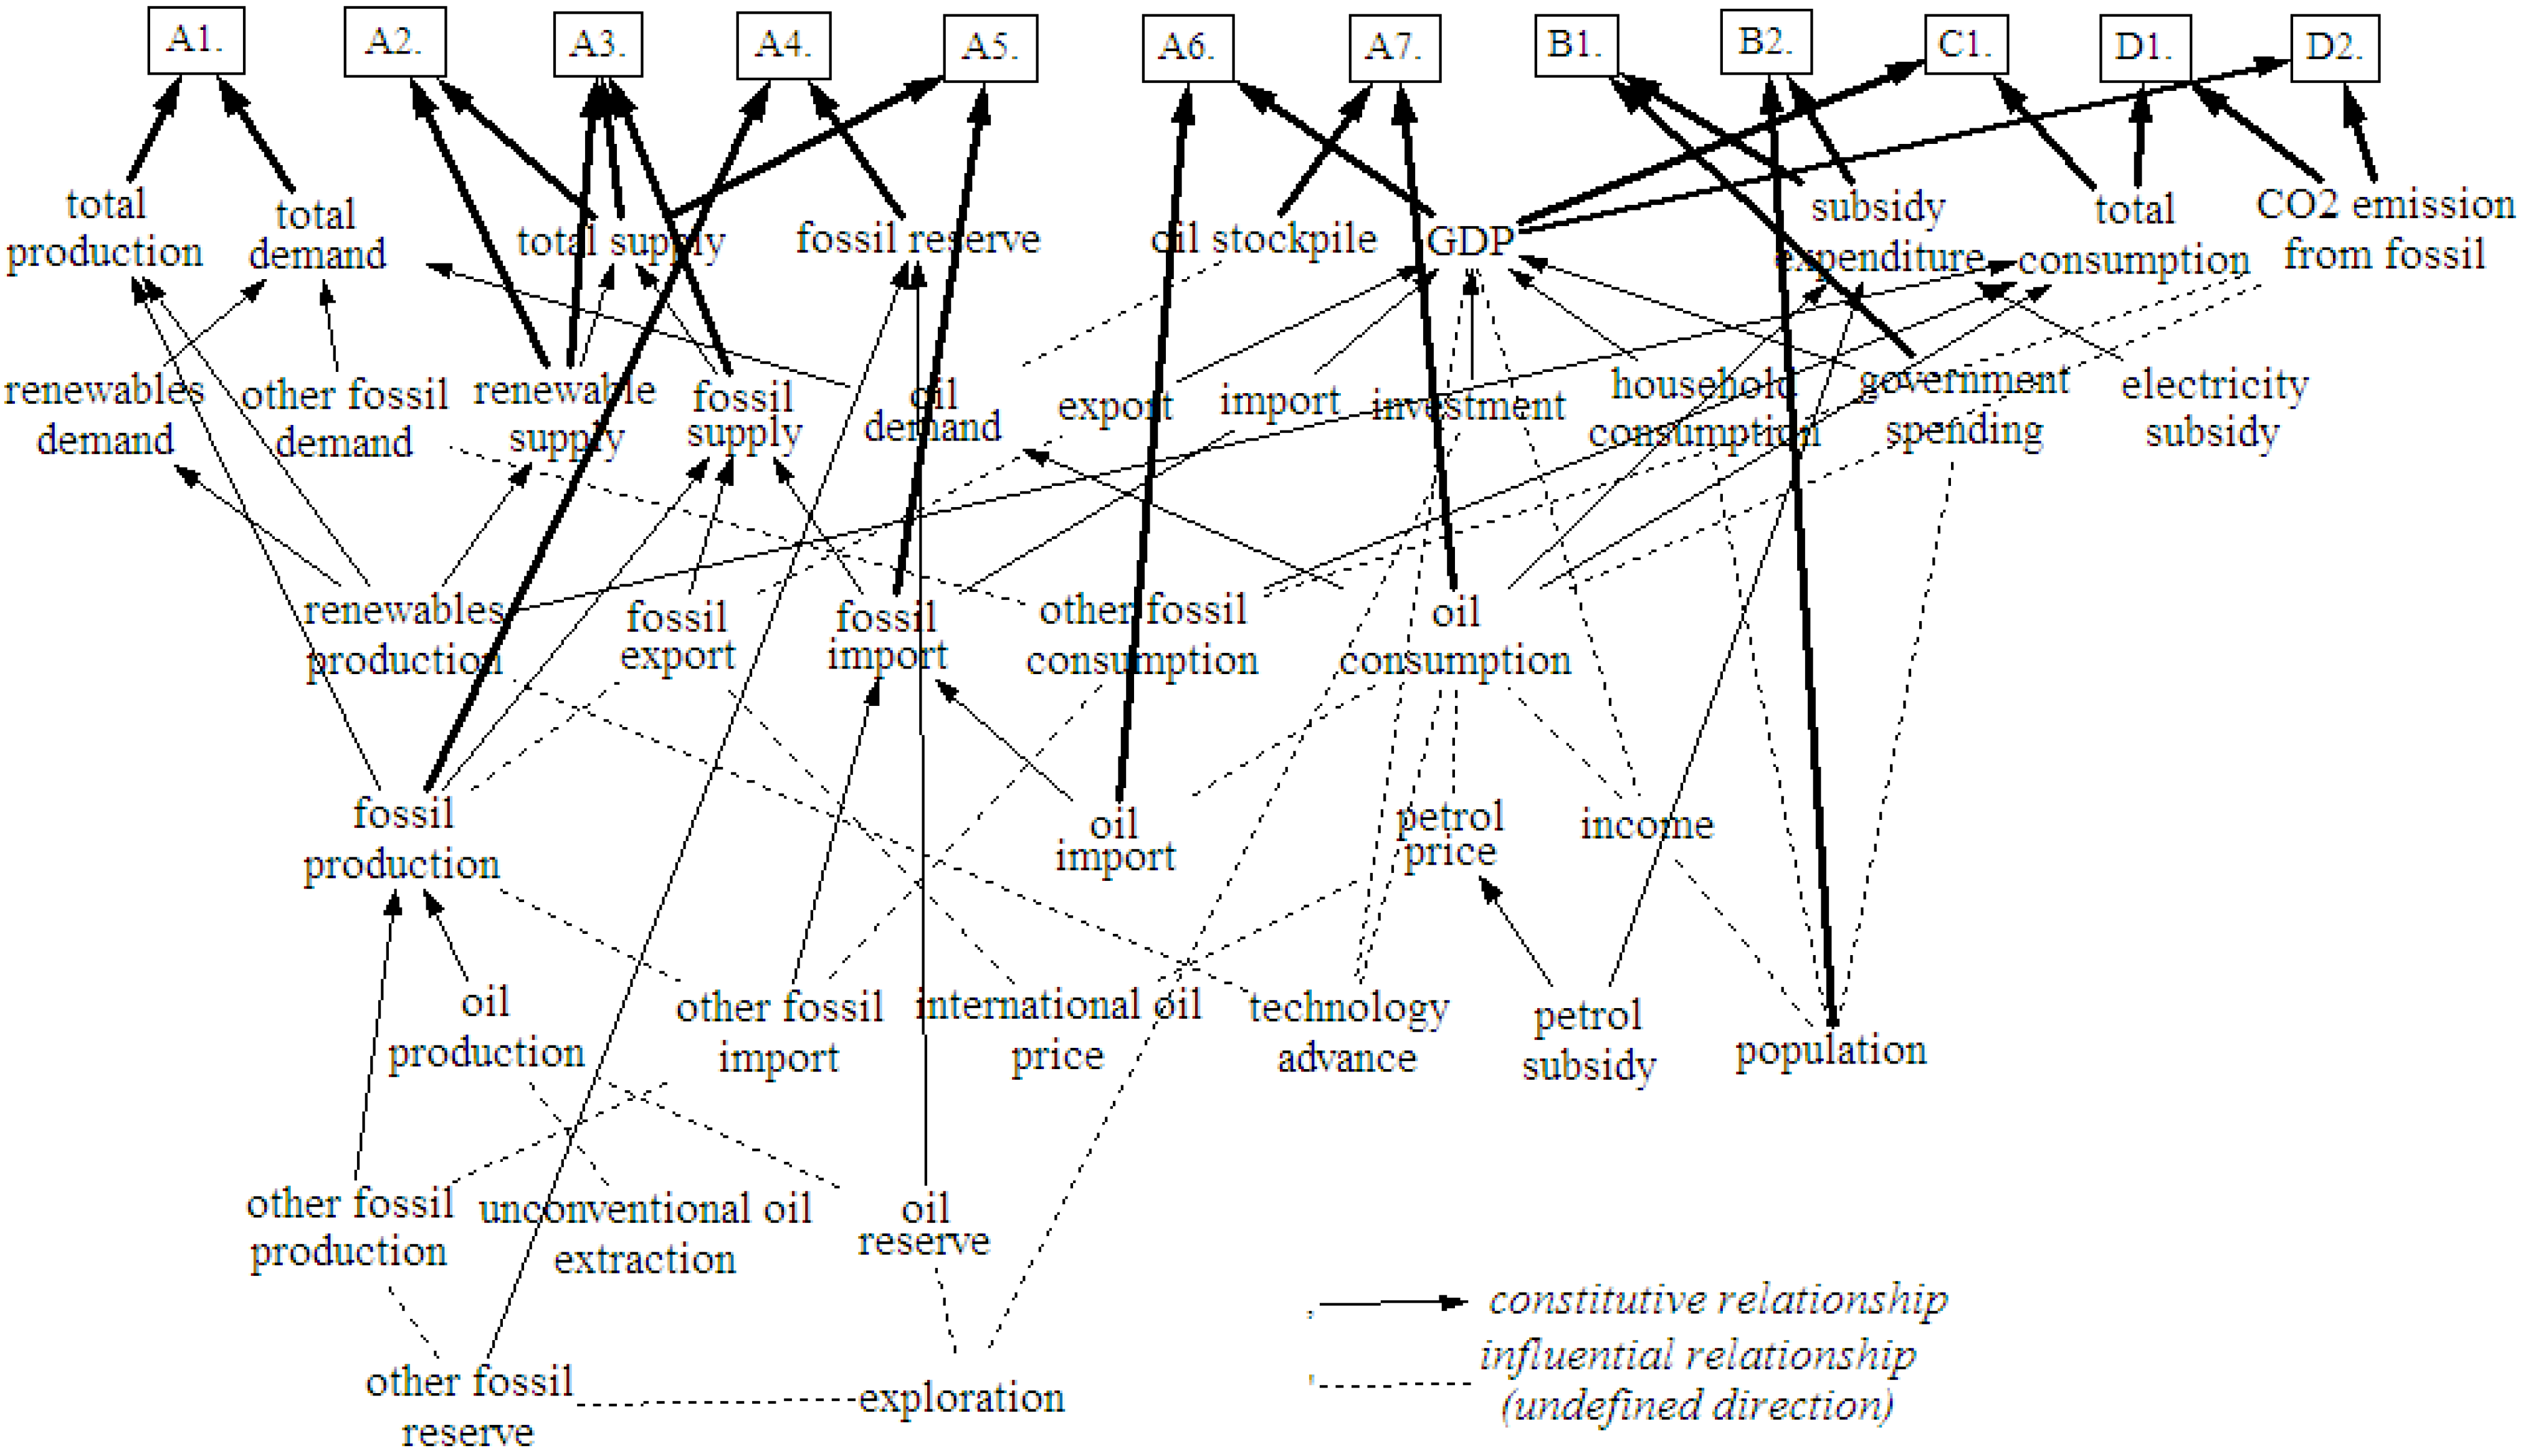
In this stage, the indicators are decomposed into the immediate components derived from their metrics, and the two types of relationships described above are identified. The influential type relationships are subject to further investigation in the later stages of the simulation’s development, as the directions of their relationships have not yet been determined. A snapshot of the process of defining Indonesia’s model up to its seventh tier is depicted in Figure 1.
Figure 1.
Defining Indonesia’s model (thick arrows represent relationships between indicators and metrics).
Figure 1.
Defining Indonesia’s model (thick arrows represent relationships between indicators and metrics).
3.1.4. Constructing the Model
Based on the model definition above, an SD model is constructed. In an SD, a problem can be viewed as an emergent property of a system. Thus, the model definition in Figure 1 is viewed as a system and translated to a CLD.
To develop the model, we use the available historical data from 1985 to 2010 that was gathered from data sources as follows: energy related data are from [24,26,29] and [30]; economic and demographic data are from [22,23]; international energy prices data are from [31]; environmental data are from [24]; and technological advances data are from [32].
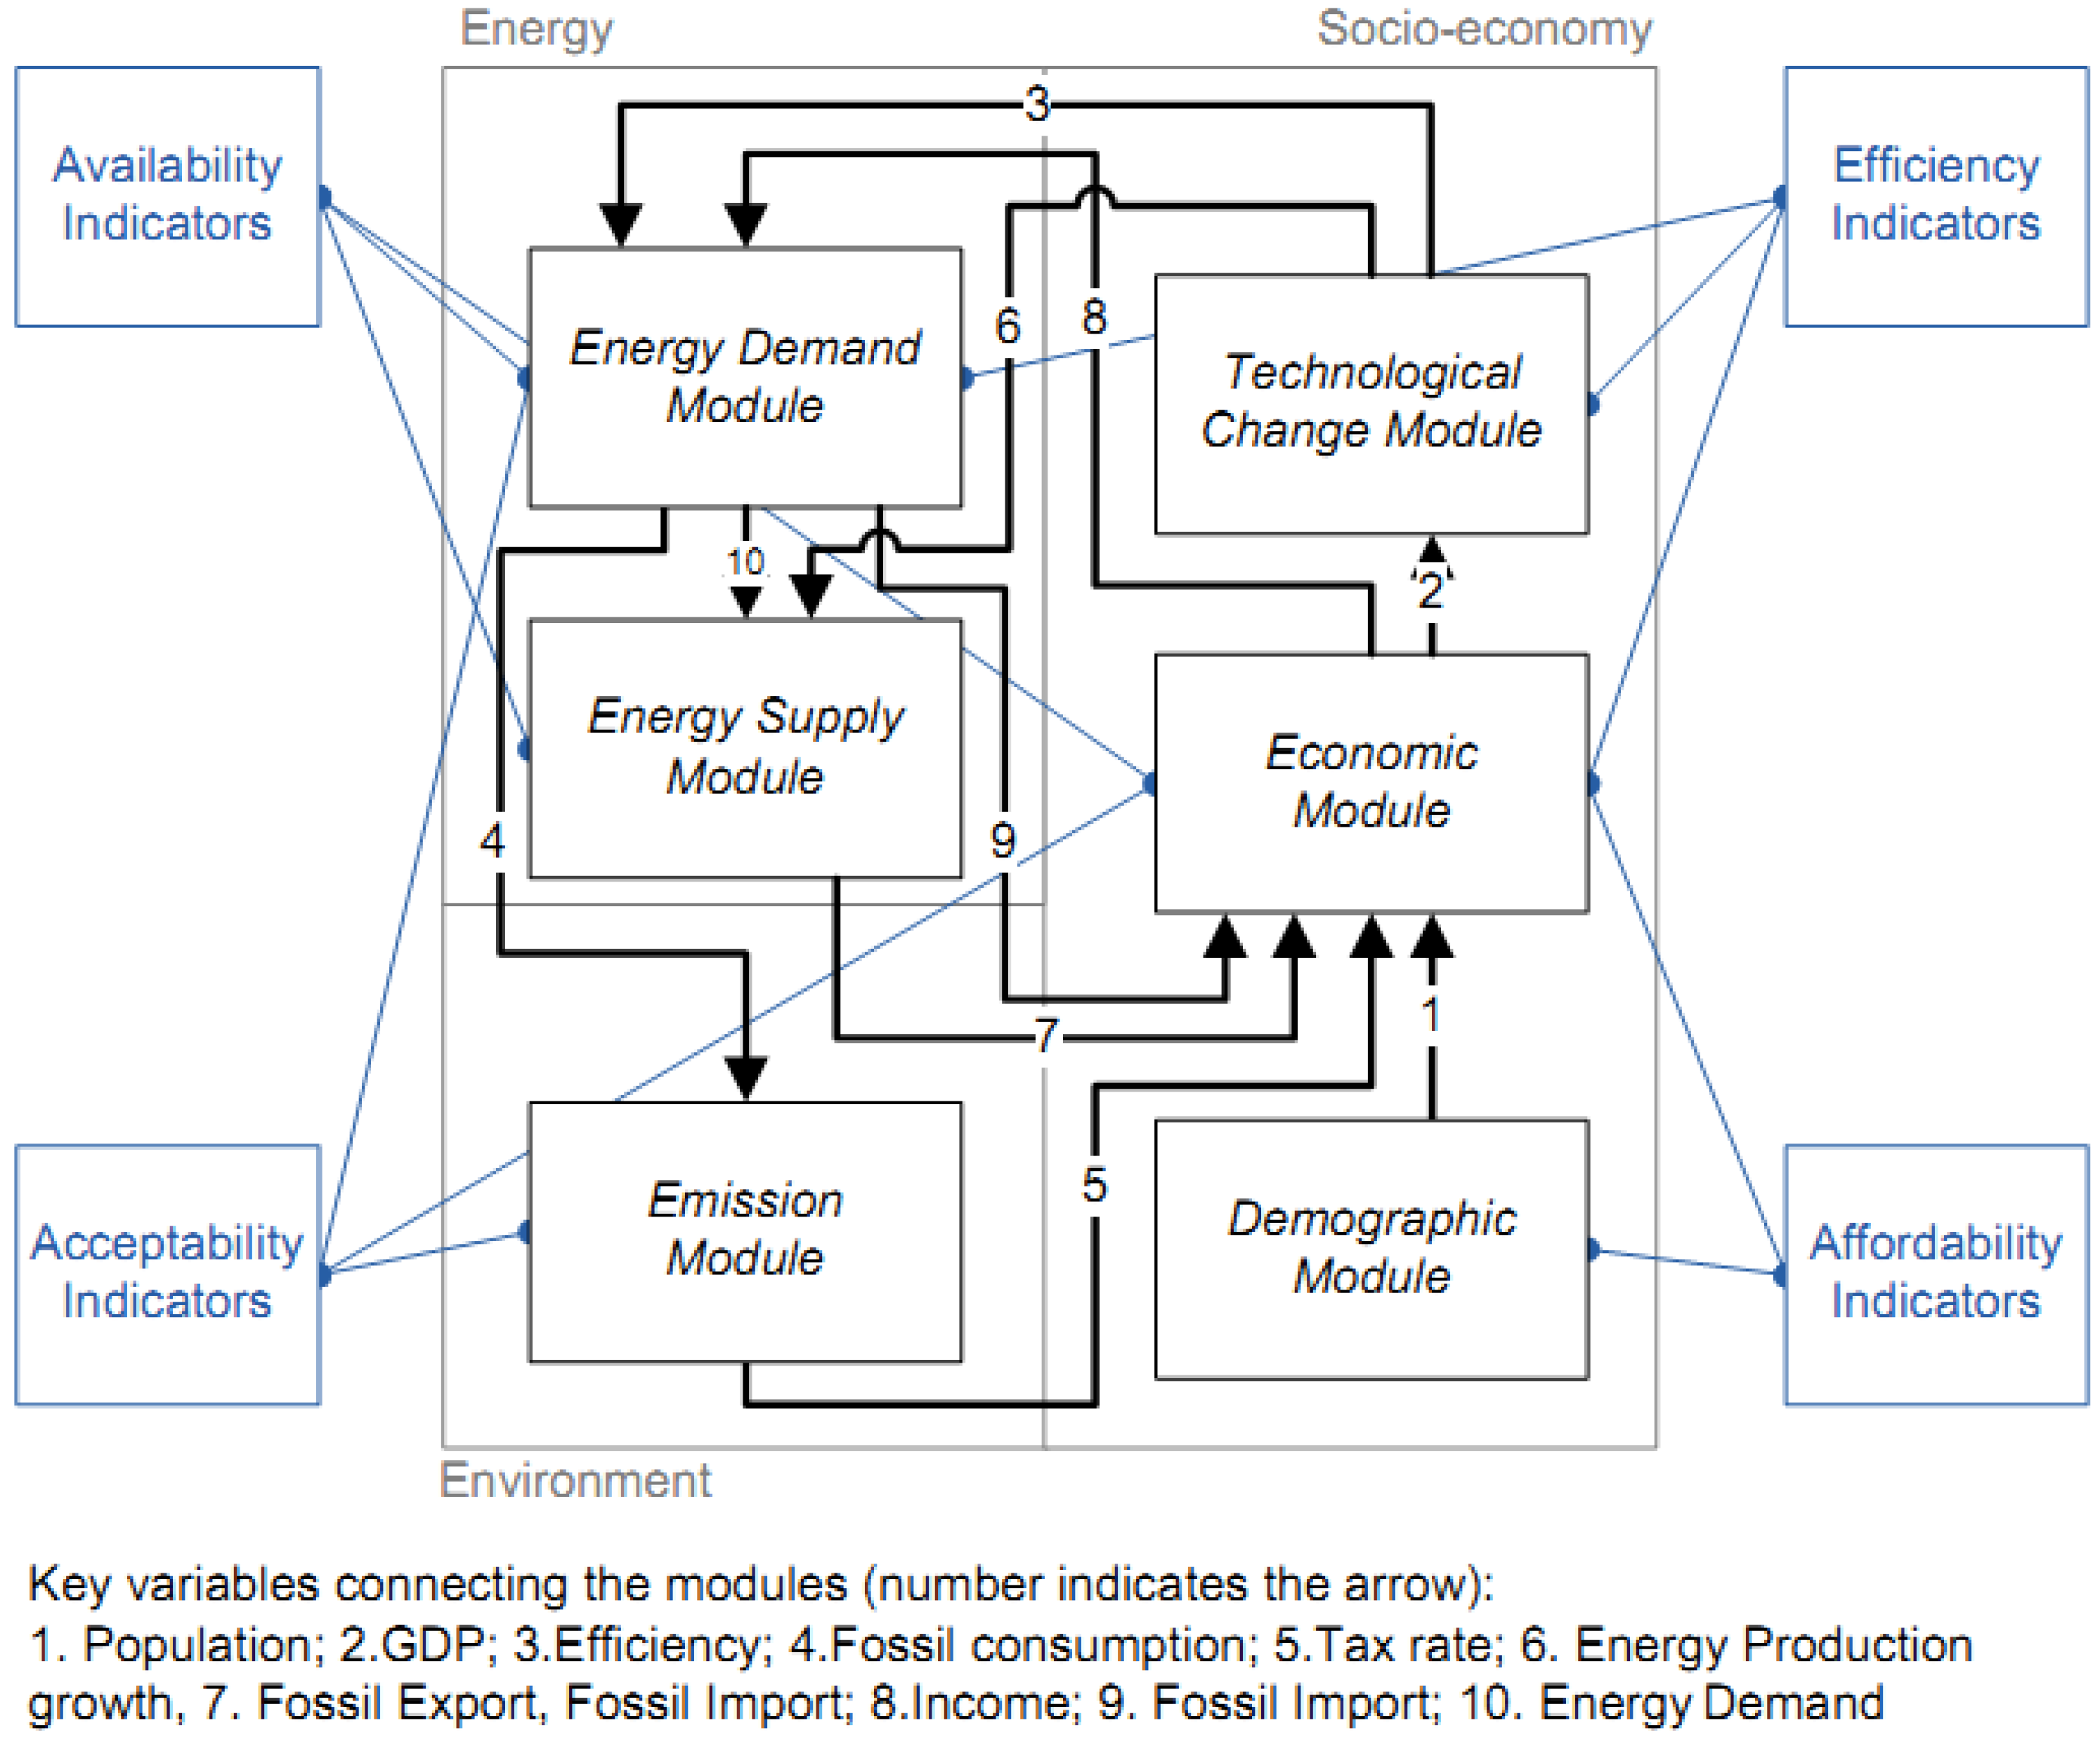
The constructed model is composed of three sectors—namely, energy, environment and socio-economy—and six modules: namely, energy supply, energy demand, emission, demography, economy, and technological change. Six categories of energy sources are considered in the energy sector. These include oil, gas, coal, hydro, renewable (geothermal, solar, wind, etc.) and biomass (waste, bio-fuel, etc.). An overview of the model structure, including the energy security dimensions, indicators and their key relationships, is presented in Figure 2.
Due to the significantly large size of the model, in the following sections, we will only present a sub-set of the model as an example of the detailed modeling process. However, it should be noted that the method presented in the example is consistently performed in other parts of the model. Using this example, we demonstrate how the model is integrated and how the components are calculated.
Figure 2.
Overview of the model structure: Sectors, Modules, Indicators and Relationships. The blue lines indicate information retrieved when simulating the model. The arrows indicate the key causal relationships between the modules.
Figure 2.
Overview of the model structure: Sectors, Modules, Indicators and Relationships. The blue lines indicate information retrieved when simulating the model. The arrows indicate the key causal relationships between the modules.
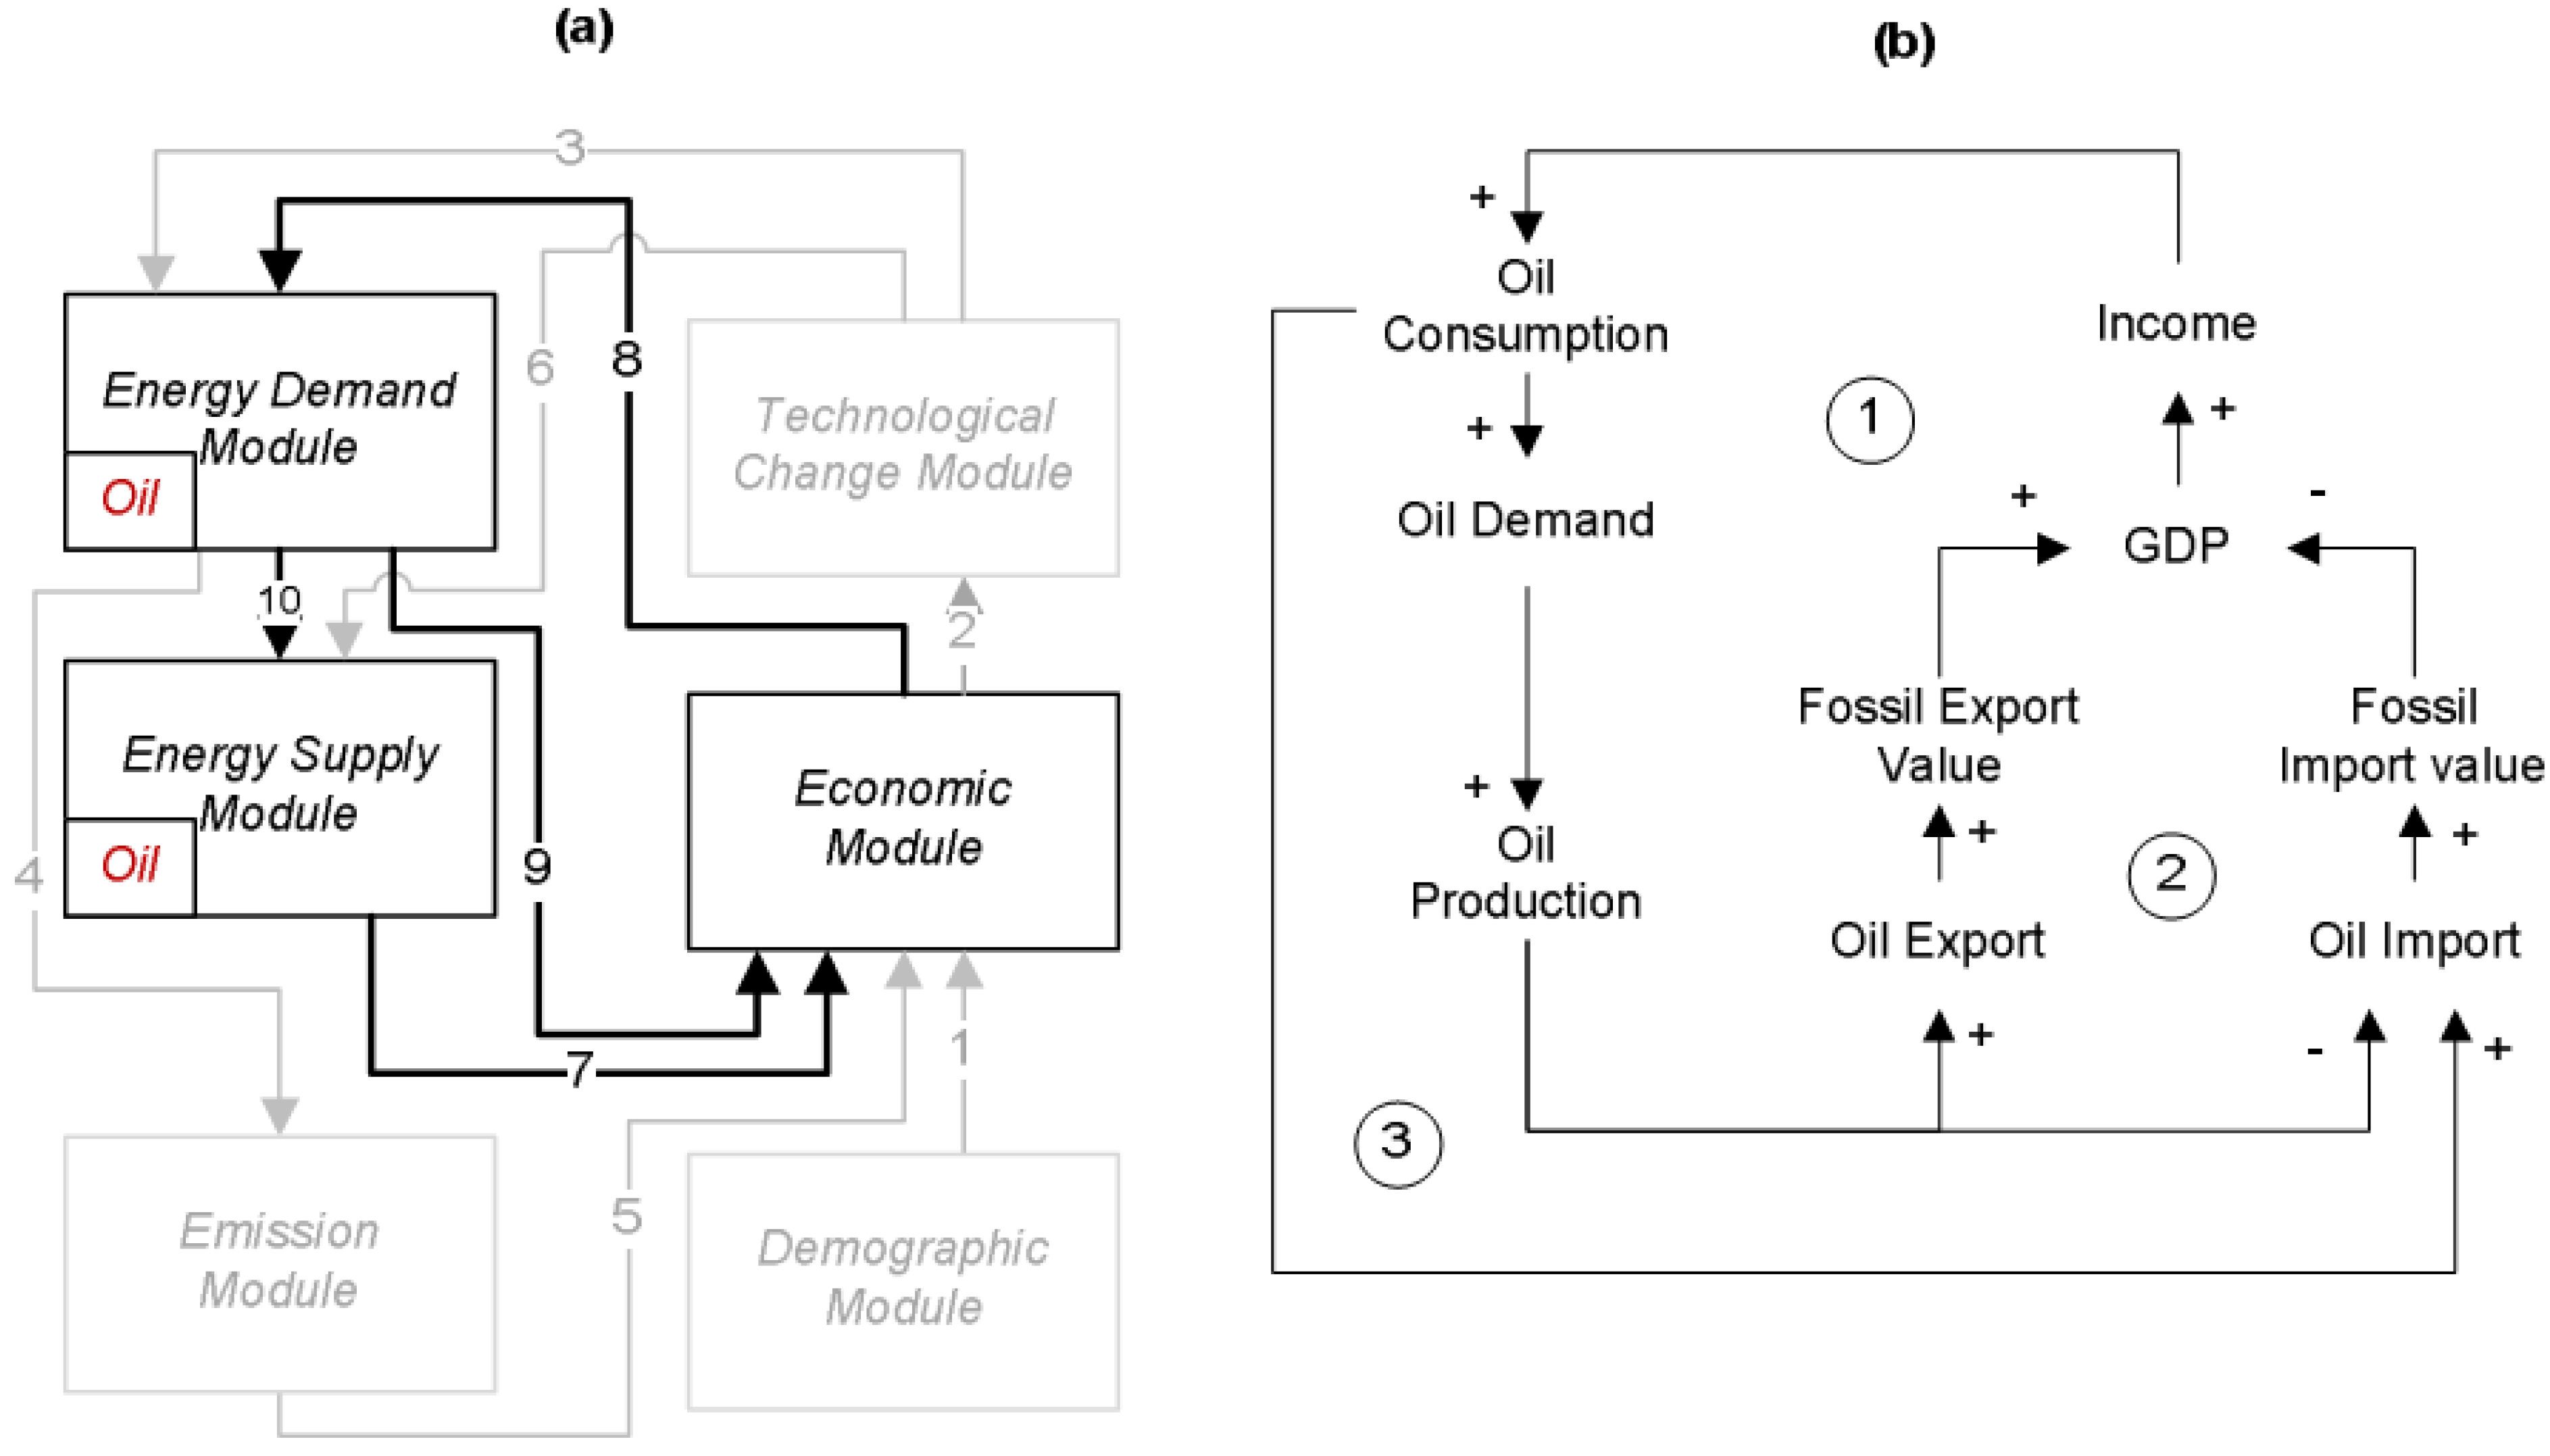
For this example, we select major feedback loops describing the interactions between the most fundamental parts of the model: the energy supply, energy demand and economic modules. In particular, we select the oil sector, as it remains Indonesia’s dominant energy source. First, a simplified CLD describing the loops formed by relationships between the modules is presented. In this simplified version, only the critical variables are shown. Variables that form no loops with regards to the modules above are not shown. These variables can be independent variables or variables that belong to other loops, as explained in other loop details. A detailed sub-model structure is then presented.
Major Loops between Oil Supply, Economic and Oil Demand Modules
The CLD in Figure 3, below, presents three feedback loops. The first loop describes oil production’s influence on the GDP through oil exports. Particularly for energy exporters such as Indonesia, energy export has a significant effect on the country’s exports, promoting its economic performance (GDP). A higher economic performance translates to increased income for the energy consumer. Higher incomes increase consumers’ ability to purchase petrol, encouraging higher oil consumption, which, in turn, increases the demand for oil. Eventually, pressure from the increasing oil demand forces oil production to rise.
The second loop has a construct similar to that of the first, except that the path of influence from oil production is through oil imports, fossil imports and then the GDP. In this loop, oil production is considered to have an influence on oil imports. This relationship is reasonable in a case in which energy production is directed toward the domestic market (e.g., domestic market obligation policy), a situation that is relevant to Indonesia. This type of policy has a negative influence on imports.
Figure 3.
(a) Parts of the model selected for the example; (b) CLD of the critical variables within the three modules in the example.
Figure 3.
(a) Parts of the model selected for the example; (b) CLD of the critical variables within the three modules in the example.

The third loop describes the influence of oil consumption on economic performance through oil imports. The amount of oil imported affects the value of the fossil energy import and, subsequently, discourages economic performance. An adjustment of the economic performance influences energy consumers’ incomes and eventually discourages oil consumption.
Construction of Oil Production, Economic Growth and Oil Consumption Sub-Modules
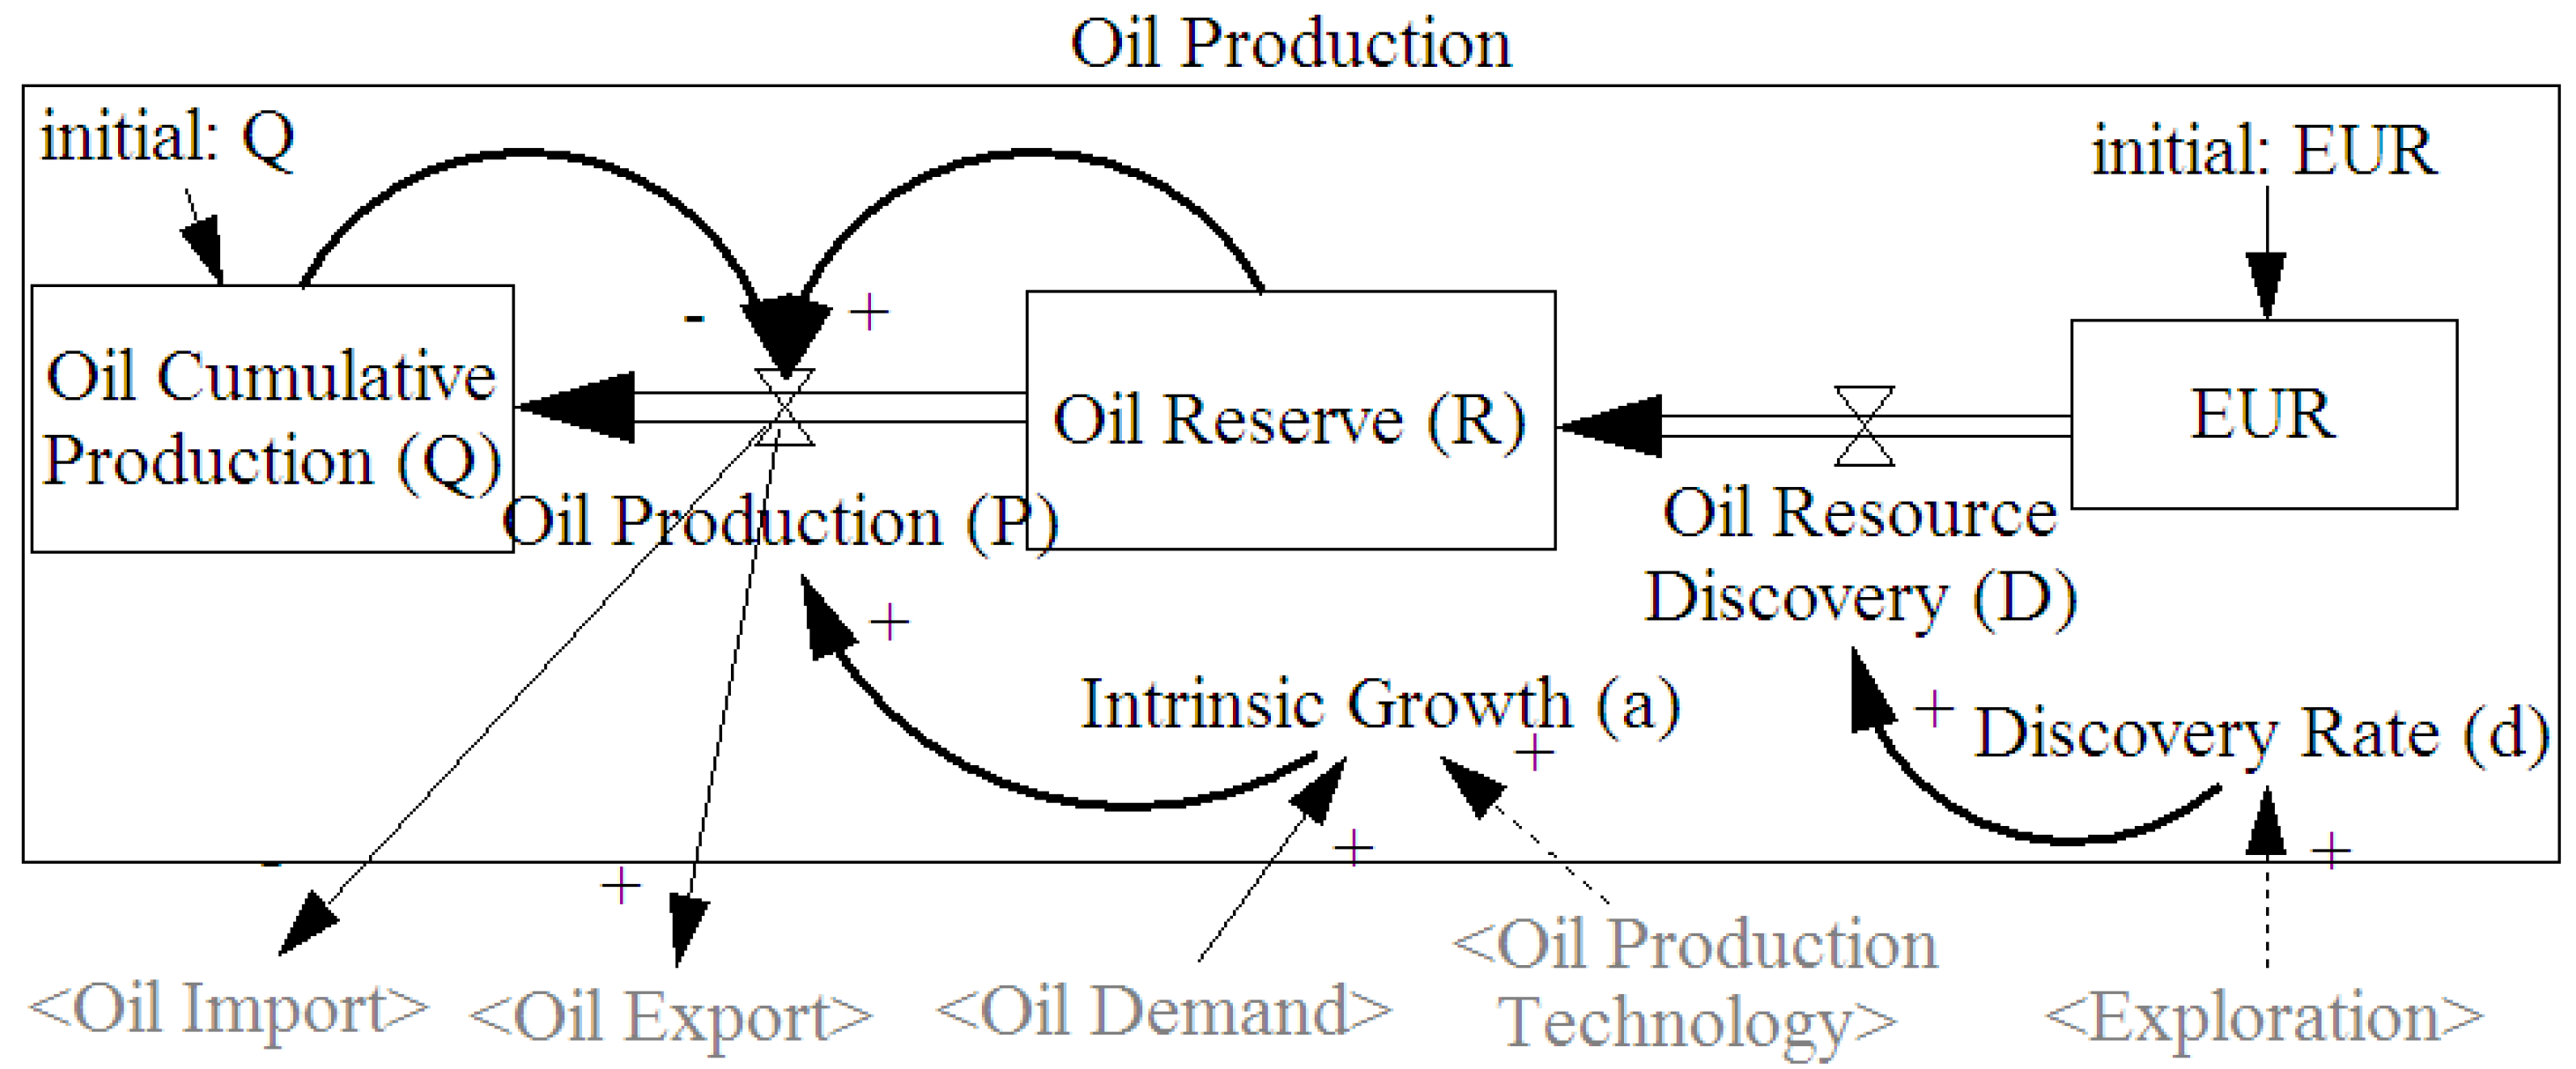
Next, we present the detail of the sub-modules. The oil production sub-module, depicted in Figure 4, is based on Hubbert’s oil production model [33,34], which can be expressed in the following equation:
where P is oil production on an annual basis, a is the intrinsic growth rate, Q is the cumulative oil production, and R is the ultimate oil reserve: that is, the known status of the total amount of oil in the ground. In our model, Q and a can be mathematically represented as follows:
where DMoil is oil demand, α is a coefficient, and TECHoil is a parameter to represent the effect of implementing major oil production technologies, such as enhanced oil recovery (EOR).
Figure 4.
Stock and flow structure of oil production sub-module. Thin arrows indicate influence from or toward factors within the same loop but from different sub-modules. Dashed arrows indicate influence from a parameter or a factor that belongs to other loops.
Figure 4.
Stock and flow structure of oil production sub-module. Thin arrows indicate influence from or toward factors within the same loop but from different sub-modules. Dashed arrows indicate influence from a parameter or a factor that belongs to other loops.

The historical data show that the oil reserve is changing overtime. Therefore, we modified the original Hubbert’s model by considering R as a variable, rather than a constant. Its behavior is dependent on oil resource discovery (D), which is influenced by the estimated ultimate resource (EUR) [30] and the discovery rate (DR). The dynamics of R can be expressed by the following equations:
where:
The inputs required for this sub-module to work are the outputs from oil demand, oil production technology and oil exploration. The output—that is, the calculated amount of oil production—is then used by the oil import and oil export variables in the economic growth sub-module.
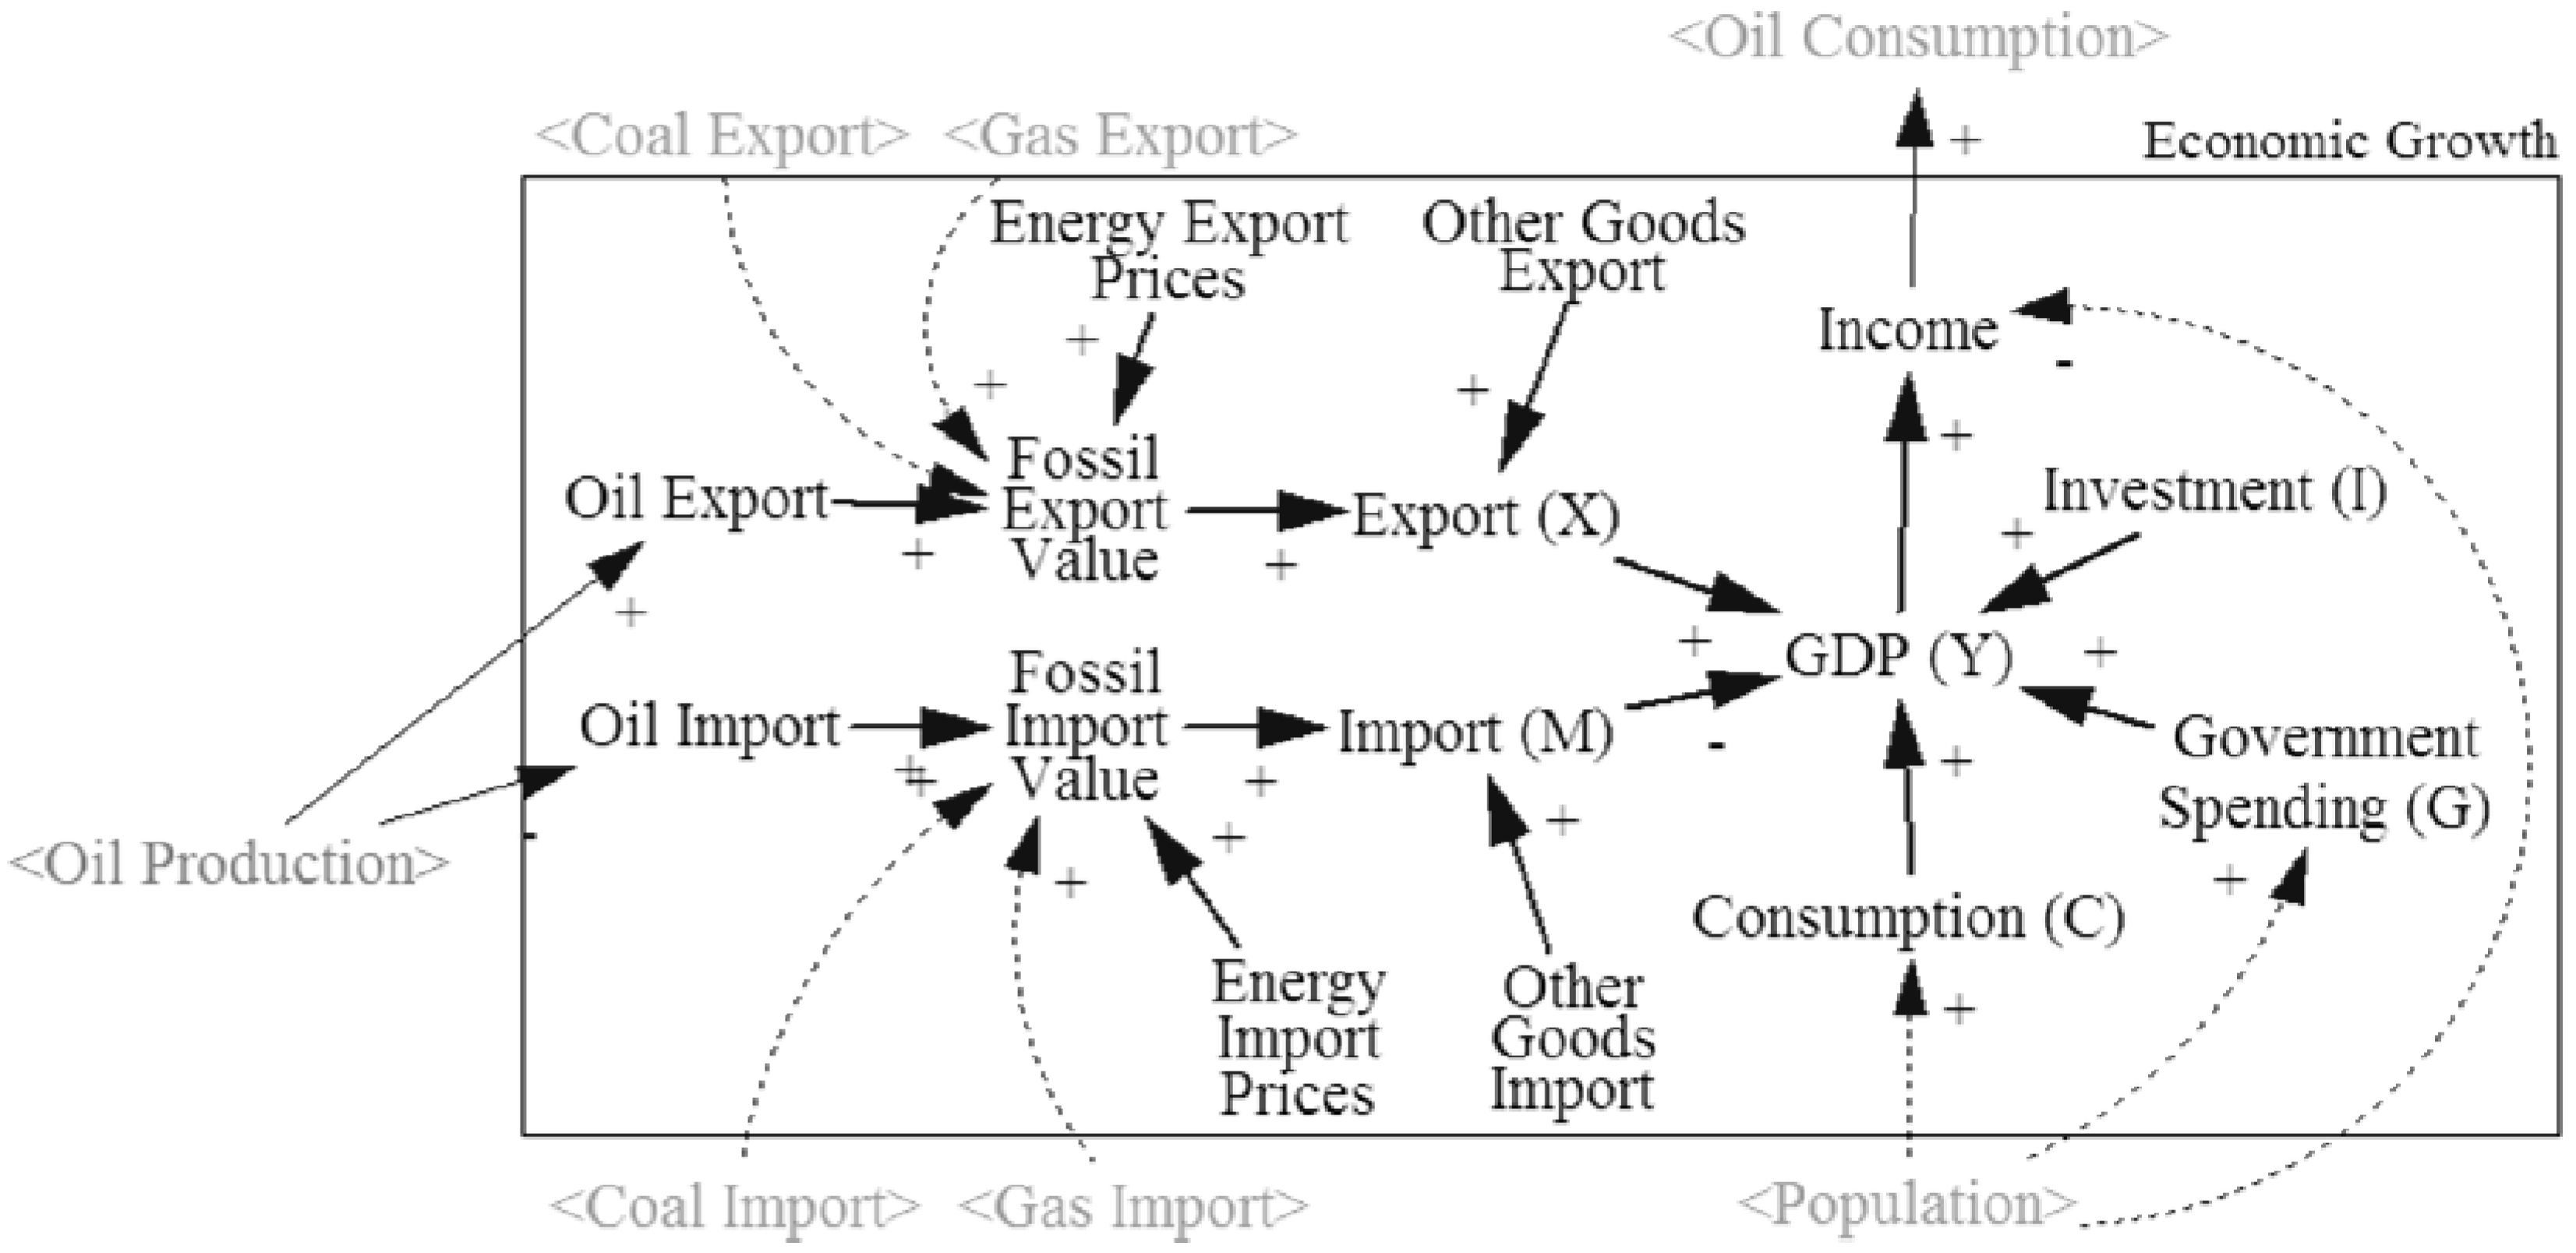
The economic growth sub-module presented in Figure 5 is based on the national accounts [35] formula:
where Y is GDP, C is economic consumption, I is investment, G is government spending, X is the value of exported goods and M is the value of imported goods.
Figure 5.
Economic growth sub-module.

Oil export and import, respectively, influence the export and import segments of the GDP via fossil energy exports and imports. Of course, the export and import of the other fossil energy (gas and coal) are also taken into account, but because they are not part of this loop, this is not further elaborated in this example. The mathematical representations of export and import are as follows:
where FXV is the value of the fossil export and FMV is the value of the fossil import. OGX is the value of the export of other goods, and OGM is the value of the import of other goods. OGX and OGM are estimated from the historical data:
where X is the exported amount of the energy source i (i = oil, gas, coal), XP is the export price, M is the imported amount of the energy source i and MP is the corresponding import price:
where Poil is oil production and Coil is oil consumption, and α and β are their respective coefficients.
The economic consumption and government spending are determined from the population as follows:
where POP is population, and α and β are, respectively, the coefficients used to calculate consumption and government spending. Investment is estimated from the historical data.
Income is proxied by the GDP per capita and calculated as follows:
where N is the income. This variable is then used in the following oil consumption sub-module.
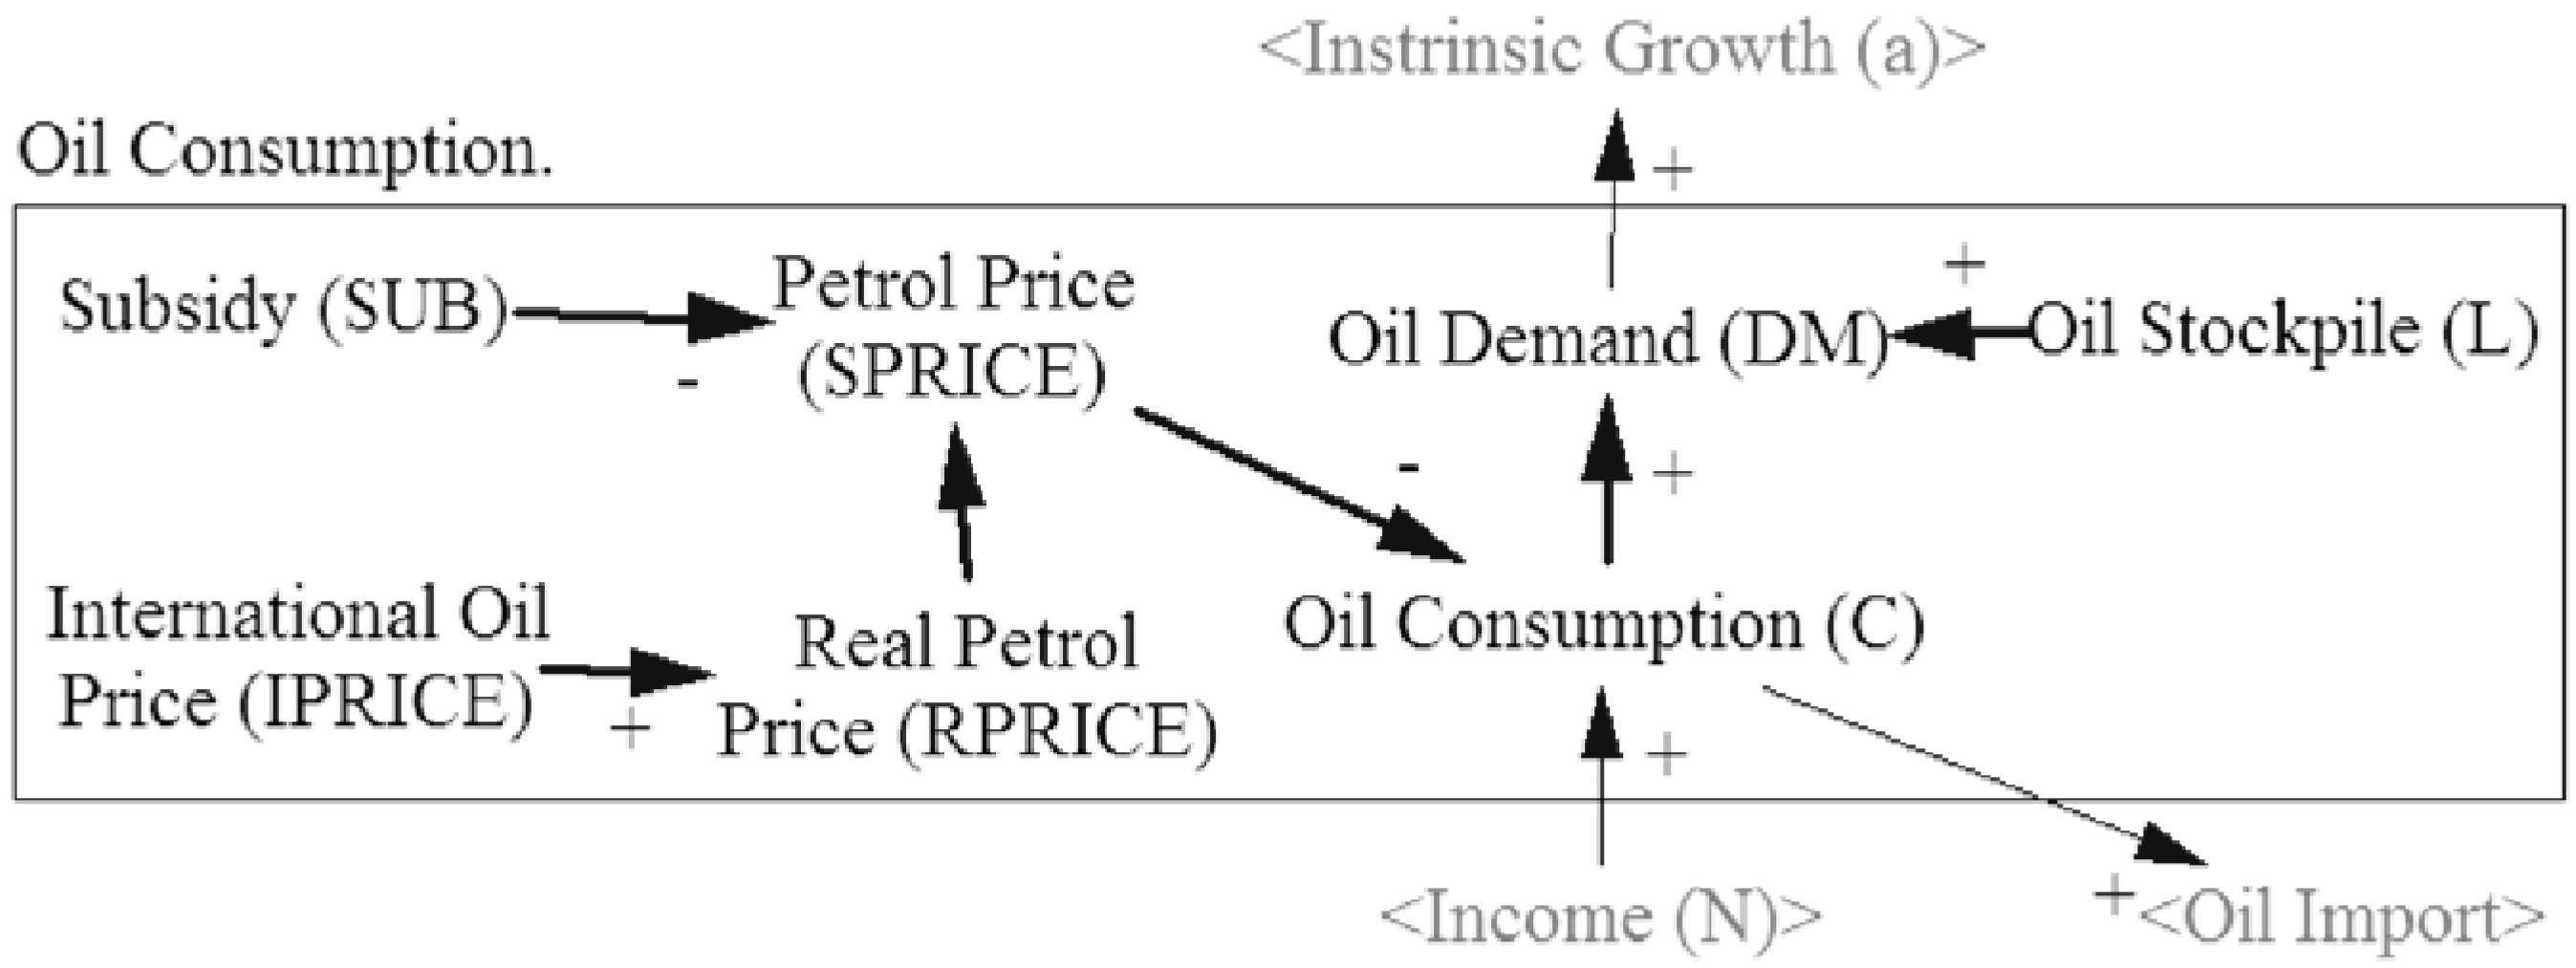
The oil consumption sub-module is presented in Figure 6. Oil consumption is considered to be a function of income and petrol price. The petrol price is influenced by oil subsidies and the international oil prices. Accordingly, the mathematical equations of this sub-module are as follows:
where Coil is oil consumption, N is income level, SPRICEpetrol is the subsidized price of petrol, α is a coefficient of income level and β is the coefficient for the subsidized petrol price. SPRICEpetrol is determined from the real (non-subsidized) price of petrol (RPRICEpetrol) and the amount of subsidy (SUBpetrol) given. The real price of petrol is determined from the international price of oil (IPRICEoil), with γ as the coefficient.
Figure 6.
Oil consumption sub-module.

The oil demand is determined by adding the desired oil stockpile level to the oil consumption as follows:
where DMoil is the demand for oil, Coil is the consumption of oil and Loil is the desired level of the oil stockpile. The desired level of the oil stockpile is estimated using the average of the available data. Oil demand is then used in the oil production sub-module, and oil consumption is used in the economic growth sub-module. Eventually, these variables complete the loops.
3.1.5. Verifying the Model
Structure Test
This test addresses two issues. The first issue is whether the energy security concept is correctly represented by the model. The second issue is whether the relationships that make up the model’s structure are maintained to be coherent. The first issue is addressed simply by comparing a checklist of the variables and links in the CLD against the components and relationships produced during the model definition step. The second issue is addressed by calculating the coefficient of determination or the R2 of the influential relationships based on historical data. By using the R2, the test shows that the total variation in one variable can be explained by its relationship with the other.
In this study, any relationship with anR2 value below 0.50 is considered too weak and does not pass the test. Accordingly, the strength of the relationships is maintained at a relatively high level. Consequently, the model is highly coherent. The constitutive relationship does not need to be verified due to its relationship clarity. Table 3presents the test results.
| Variable 1 | Variable 2 | R2 |
|---|---|---|
| Oil Production | Oil Import | 0.58 |
| Oil Production | Oil Export | 0.83 |
| Oil Consumption | Oil Import | 0.90 |
| Oil Demand | Oil Production | 0.78 |
| Income | Oil Consumption | 0.96 |
| Petrol Price | Oil Consumption | 0.88 |
Behavior Test
This test verifies whether the variables can mimic the historical data in an acceptable manner. To perform this test, we employ the root-mean-square error (RMSE) and the root-mean-square percentage error (RMSPE). The RMSE provides a measure of total error with the same unit as the variable. The RMSPE provides a normalized measure of the magnitude of error in terms of percentage. Table 4 presents the results of this test on the critical variables of the example.
| Variable | RMSE (in respective units) | RMSPE (%) |
|---|---|---|
| Oil Production (Mtoe) | 2.1 | 2.9 |
| Oil Consumption (Mtoe) | 2.9 | 1.7 |
| Oil Export (Mtoe) | 4.7 | 1.2 |
| Oil Import (Mtoe) | 4.3 | 2.1 |
| Export (Billion USD) | 9.3 | 3.1 |
| Import (Billion USD) | 7.6 | 1.4 |
| GDP (Billion USD) | 30.7 | 1.8 |
| Population (Million Persons) | 2.4 | 0.9 |
3.2. Experimentation
Numerous policy scenarios can be applied to Indonesia’s problem. However, we confine ourselves to policy scenarios that are timely and relevant to Indonesia’s current energy security situation. Thus, three policy scenarios are considered for the experiment.
First, the business-as-usual (BAU) scenario reflects the continuation of the current situation with no new policy implementations. This scenario serves as a reference.
Second, the PROD scenario reflects a situation of high fossil energy production. In this scenario, Indonesia attempts to maintain its oil production output [36] through the implementation of the enhanced oil recovery (EOR) program. It is assumed that the government endorsement for EOR implementation [36] will successfully increase the production rates of all matured reservoirs. On average, conventional oil production methods will produce 30% oil from a reservoir. The remaining 70% of oil is the target of the EOR program [37]. To emulate this, the TECHoil [Equation (6)] value is set to increase to 4.52 by 2015, while the α coefficient [Equation (6)] is set at its original value of 0.067. These settings result in an oil production rate of −0.96 Mtoe/year by 2015 or an increase of approximately 70% compared to the base year, at −3.2 Mtoe/year. The production rate remains at that level until the end of the simulation.
For the coal and gas sectors, we only manipulate their respective α coefficients. The TECH variables in the coal and gas sectors are set to their original value of 1 because the implementation of alternative technology that may increase coal and gas extraction is not considered in this scenario. For coal, the domestic-market-obligation measure [38] is assumed to be successful and to attract more coal producers to the market and encourage existing producers to increase their production. To emulate the situation, coal’s α coefficient value is set to increase to 0.25 by 2025. This setting leads to a coal production rate of 30.3 Mtoe/year by 2025 or 200% increase compared to the base year, at 10.1 Mtoe/year. It remains at that level until the end of the simulation.
Indonesia’s daily gas production has been stable over the last decade at an average of 8.12 BSCFD or 0.19 Mtoe/day [39]. However, the government has plans to add gas storage facilities in four locations by 2018 [39].Therefore, it is expected that gas production may increase to some extent. To emulate the situation, gas’s α coefficient value is set to increase up to 0.05 by 2018. The implementation of alternative technology that may increase gas extraction is not considered in this scenario. This parameter setting leads to a gas production rate of 1.6 Mtoe/year by 2018 or a 30% increase compared to the base year at 1.2 Mtoe/year and it remains at that level until the end of the simulation.
The third scenario (SUB scenario) describes a situation in which the petrol and electricity subsidy elimination is aggressively performed until all the forms of energy subsidy are 100% lifted by the end of 2020. To emulate this situation, all the subsidy variables are set to decrease to IDR 0 by the end of 2020. Other parameters outside these scenarios are held constant or follow the historical data trajectory. Table 5 summarizes the scenarios.
| Variable | Scenarios | ||
|---|---|---|---|
| BAU | PROD | SUB | |
| Production growth rate | Oil: −3.2 Mtoe/year | −0.96 Mtoe/year by 2015 | as BAU |
| Gas: 1.2 Mtoe/year | 1.6 Mtoe/year by 2018 | as BAU | |
| Coal: 10.1 Mtoe/year | 30.3 MToe/year by 2025 | as BAU | |
| Subsidy | Petrol *: Constant at IDR 9,500/L | as BAU | IDR 0/L by 2020 |
| Electricity **: Constant at IDR 402/kWh | as BAU | IDR 0/kWh by 2020 | |
3.3. Result Analysis
3.3.1. Performance by Dimensions
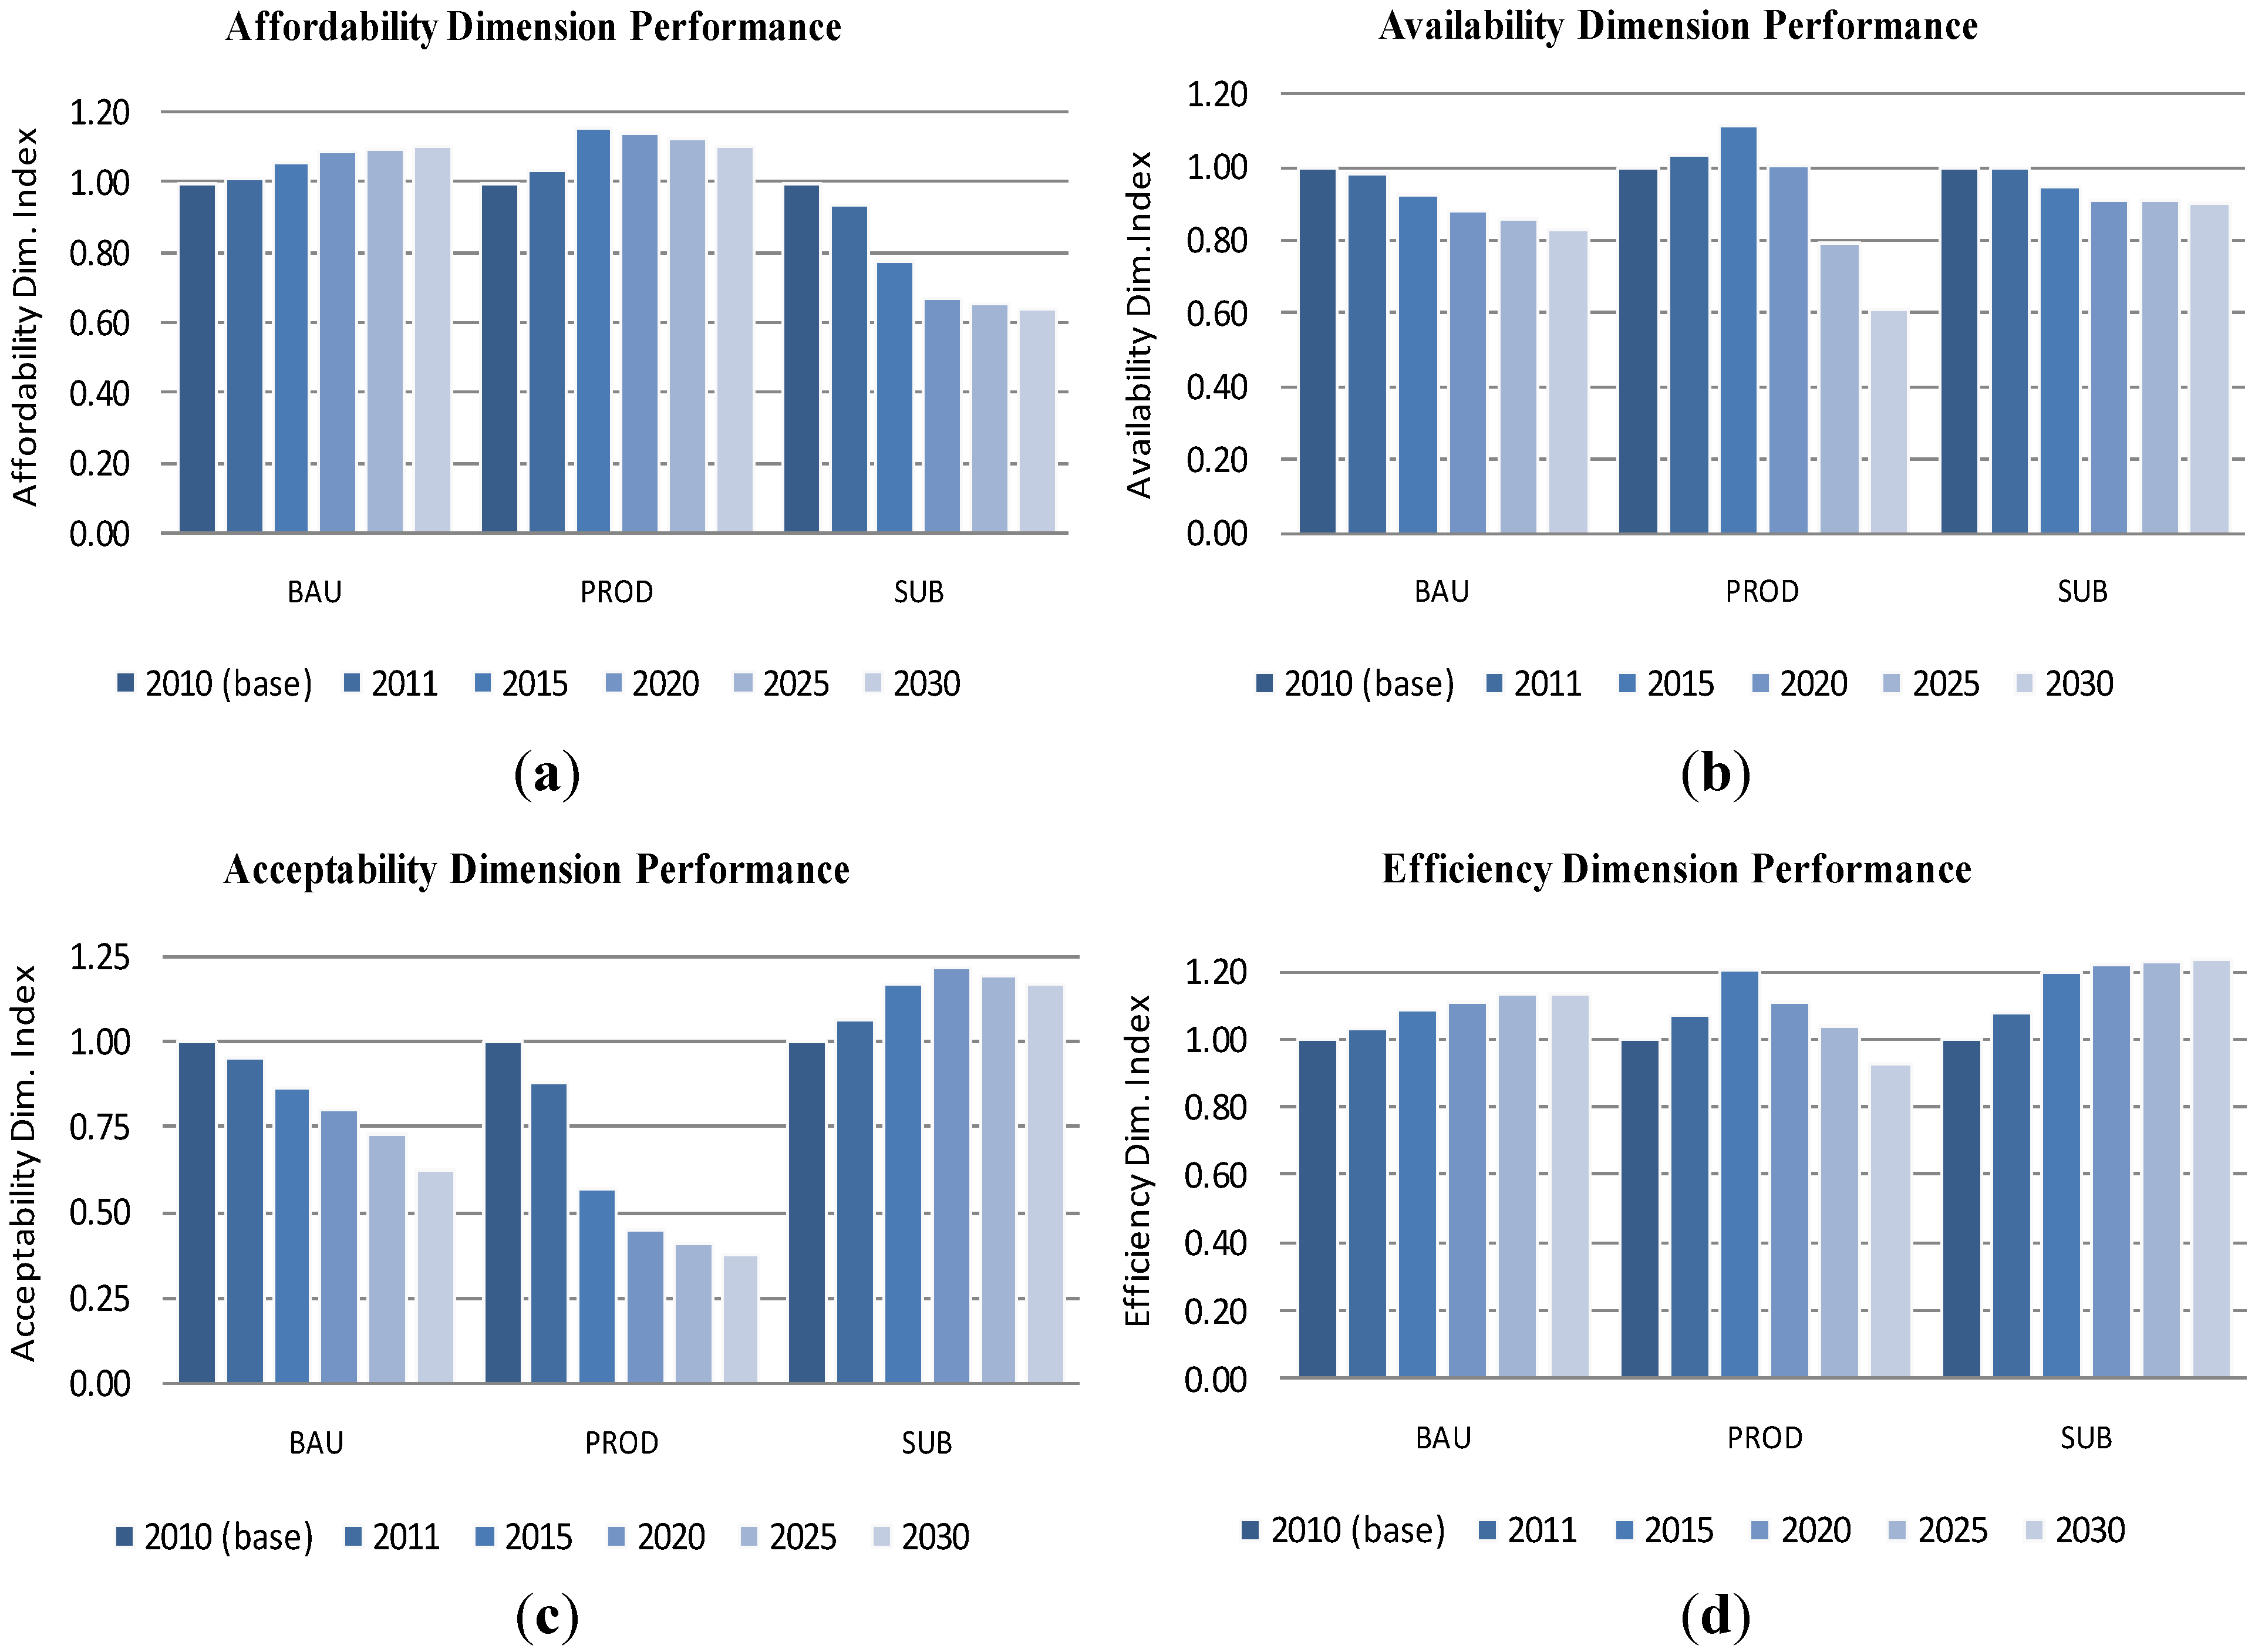
In the following section, the performance of each dimension is analyzed. Figure 7 presents the simulation results categorized according to each dimension.
Figure 7.
(a) Performance of availability; (b) affordability; (c) efficiency and (d) acceptability dimensions. The higher the index score, the better the performance. 2010 is the base year (Index Score = 1).
Figure 7.
(a) Performance of availability; (b) affordability; (c) efficiency and (d) acceptability dimensions. The higher the index score, the better the performance. 2010 is the base year (Index Score = 1).

Availability
According to the simulation, the performance of the availability dimensions would decline in every scenario. The PROD scenario would only yield a higher performance than the BAU over a short-term period. The highest score in 2015 is approximately 11.7% higher than the base year and 20.8% higher than the BAU scenario. However, the performance then declines rapidly. This can be explained accordingly. Provided that the energy resource discovery rate is constant, the higher energy production rate would accelerate the energy reserve depletion, causing energy production outputs to dwindle more quickly. In 2030, these levels were 39% lower than the base year and 26.4% lower than the BAU scenario.
The higher energy prices due to subsidy elimination (SUB scenario) would discourage energy consumption. This situation would slightly enhance the availability performance in 2030 by keeping it close to 2020 level. However, this scenario is still in a declining trajectory. This can be explained as follows: lower energy consumption translates to a lower energy import rate. At the same time, energy production remains at the same rate. The excess energy production translates as a higher energy export rate. This situation encourages GDP growth. Eventually, income begins to catch up with the higher energy prices. In 2030, the performance is 9.7% lower than the base year and 9% higher than the BAU in the same year.
Affordability
The PROD scenario would have some effects on the performance of the affordability dimension. The higher energy production in this scenario encourages energy exports that positively influence the GDP and eventually increase income. However, this is countered by increased energy imports due to higher levels of energy consumption as income increases. At its highest point, it improves affordability performance 15.8% over the base year, but if compared to the BAU in the same year, the improvement is only 9.3%. In 2030, the performance in this scenario is 11% higher than the base year, but only 0.5% better than the BAU in the same year.
Conversely, subsidy elimination would greatly affect this dimension. The effect of subsidy elimination is more significant to the people’s ability to buy petrol/electricity than on the cost of the subsidy in government spending. However, in later years, the effect is dampened by the increase in income due to GDP growth. In 2030, the affordability dimension index score is 26% lower than the base year and 41.6% lower than in the BAU scenario in the same year.
Efficiency
The higher energy production in the PROD scenario would provide short-term effects on energy intensity. The increased energy exports encourage faster GDP growth. However, as the energy export dwindles after 2015, the GDP growth also slows. At the same time, the energy consumption rate is also slowing but it is still faster than the GDP growth. Therefore, efficiency is declining. In 2015, the efficiency index score is 20.5% higher than it was in the base year and 10.4% higher than in the BAU scenario in the same year. This represents the greatest improvement. In 2030, however, it is 6.8% lower than in the base year and 18% lower than in the BAU scenario.
In the SUB scenario, higher energy prices due to subsidy elimination lead to lower energy consumption. This discourages energy import requirements while the energy production remains at the same rate. Therefore, the import portion of the GDP is adjusted and the GDP growth increases. This translates as lower energy intensity and, therefore, a higher efficiency performance. In this scenario, the performance of the efficiency dimension is increasing. In 2030, the index score is 22.4% higher than in the base year, but it is only 9.3% higher than in the BAU scenario in the same year.
Acceptability
In the PROD scenario, the increase in energy production will encourage CO2 emissions. In the short term, the increase of energy production outputs will encourage energy export, which eventually affects the export segment of the GDP and allows the GDP to increase. In turn, the increase in the GDP encourages energy consumption to increase; therefore, CO2 emissions increase as well. In the longer term, the increasing dominance of coal encourages higher CO2 emissions, which translates to a decreasing acceptability performance index score. In 2030, the acceptability index score is 62.4% lower than in the base year and 66.9% lower than in the BAU scenario in the same year.
On the other hand, the higher energy prices caused by the SUB scenario would lead to lower energy consumption. This would discourage CO2 emissions and lower emission intensity indicators. This translates to the increased performance of the acceptability dimension. In 2020, the acceptability index score increases to its highest level at 22.1% compared to the base year, but then it decreases between 2020 and 2030. In 2030, the score is 17.2% higher than in the base year and 47.6% higher than in the BAU scenario.
3.3.2. Overall Performance
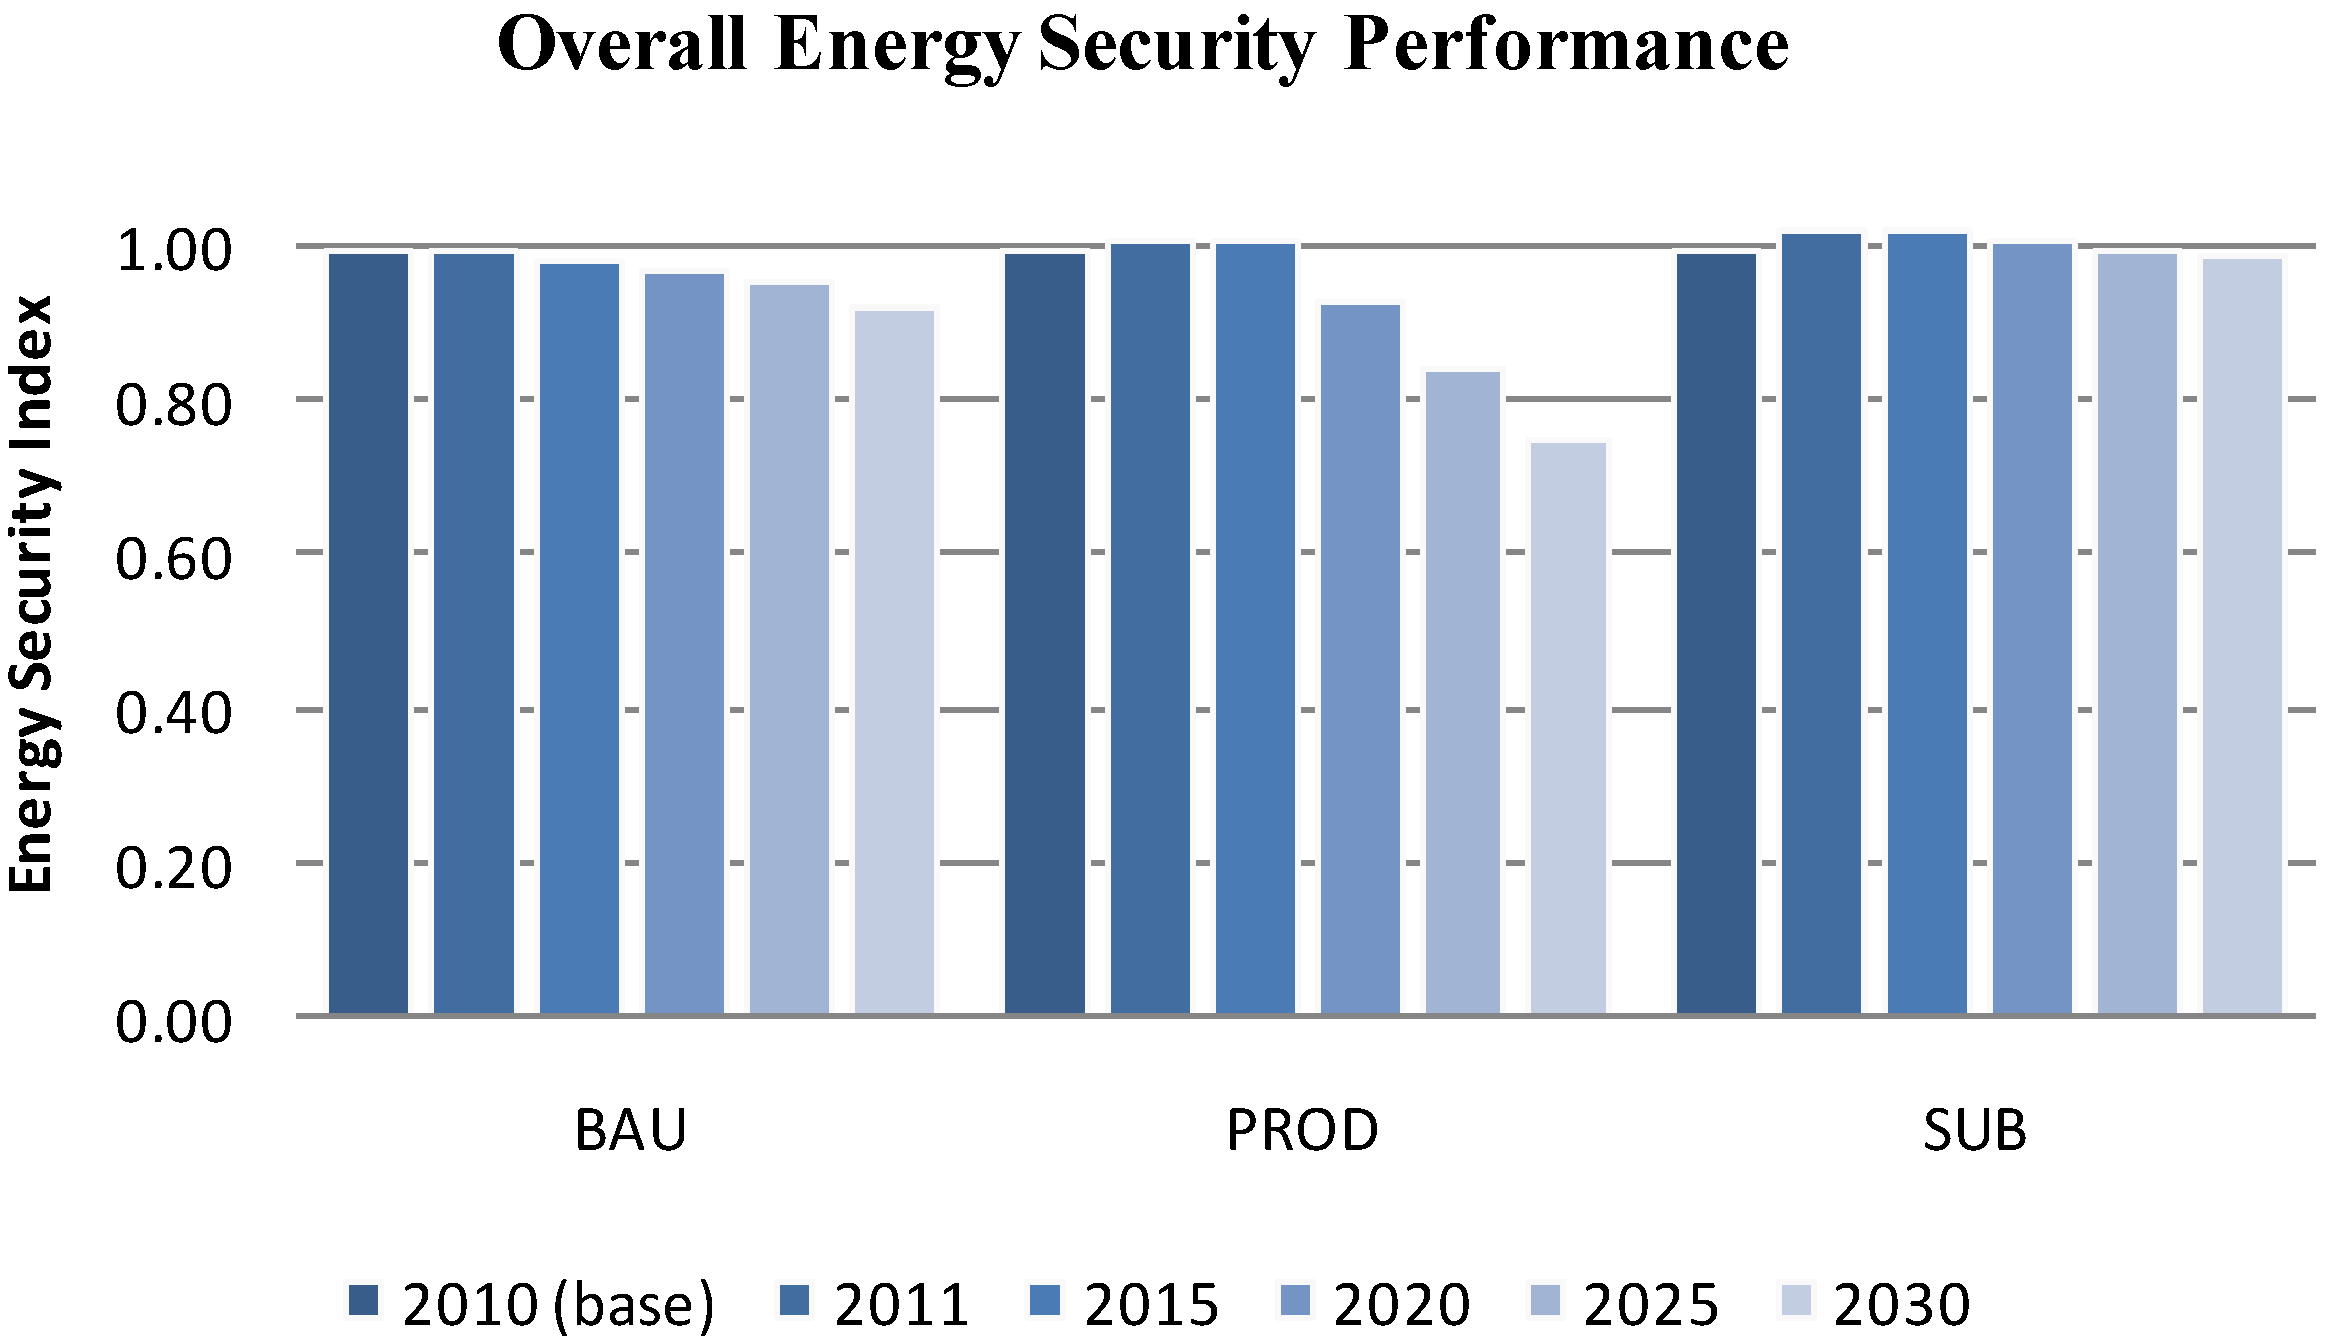
The overall performance of Indonesia’s energy security is presented in Figure 8. All the scenarios suggest that Indonesia’s energy security in 2030 will be worse than it was in 2010. From these results, it can be determined that the impact of increasing energy production in the PROD scenario on energy security improvement is not significant.
Figure 8.
Indonesia’s overall energy security performance.

This is because the considerable improvements in the availability and efficiency dimensions are offset by the sharp deterioration in the acceptability dimension performance. Furthermore, the improvement occurs only before 2020. After 2020, it leads to a lower performance than in the BAU. The highest improvement in the PROD scenario is in 2015, where it is 1.3% higher than the base year and 2.8% higher than in the BAU scenario. Conversely, the performance declines as we move forward toward 2030. In 2030, it is 24.4% lower than in the base year and 18.2% lower than in the BAU.
On the other hand, the impact of subsidy elimination in the SUB scenario would maintain the energy security index score very close to the level of the base year performance. In the availability dimension, subsidy elimination resulted in a better performance than in BAU. Furthermore, subsidy elimination improves the efficiency and acceptability dimensions significantly. The performance of the affordability dimension, however, dropped sharply in this scenario. Nevertheless, the overall energy security index in the SUB scenario is better than both the BAU and PROD scenarios. In this scenario, the highest performance is in 2015, with an index score 2.4% higher than in the base year. In 2030, the score is 1% lower than in the base year but still 8% higher than in the BAU.
4. Discussion
This study proposes a simulation model that allows energy security evaluations to be performed with greater reliability. The reliability is improved by integrating the dimensions of energy security in a coherent manner; this coherence is realized by establishing relationships between dimensions. Accordingly, the convergence and conflicts between dimensions’ performances can be observed.
It should be noted that the selection of indicators and their attachments to certain dimensions have influences the outcome of the evaluation. For example, this study asserts that the indicator for diversification (non-fossil) belongs in the availability dimension. However, one might also consider it as a component of the acceptability dimension because as diversification increases (a greater non-fossil energy share in the total energy supply) the less likely CO2 emissions are to worsen. In another example, two indicators specifically related to oil are included in the availability dimension: oil import cost (A6) and stockpile (A7). This causes the performance of the availability dimension to become more sensitive to changes in the oil sector. These arrangements, however, are dependent on how the stakeholders view the issue. Therefore, Indonesia’s energy security performance, both the individual dimension and overall performances, may differ if the stakeholders’ views are modified. This modification may lead to indicators alteration and their attachments to certain dimensions, which accords with what Chester [15] expressed with the term “polysemic”. For this reason, in the first part of our study, we defined both who the stakeholders were and their perspectives toward energy security. Therefore, although the model is quantitatively constructed, its structure is biased by stakeholder subjectivity.
Indonesia’s energy policy has focused primarily on the availability dimension. This focus is reflected in the Presidential decree No. 5/2006 on National Energy Policy and Law No. 30/2007 on Energy, in which self-sufficiency and the diversification of fossil energy are the main priorities [42]. This is a reasonable option due to Indonesia’s abundance of coal and gas. Concern over the environmental dimension, such as CO2 emission, remains rather low because the biggest contributor to Indonesia’s CO2 emissions is the forestry sector. However, the regional and international pressure on this issue is increasing, especially because Indonesia is a member of the East Asian Summit countries, which promoted climate change issues in their Cebu declaration on East Asia energy security [43]. Furthermore, Indonesia’s president announced a commitment to reducing Indonesia’s GHG emissions to 26% below its business-as-usual trajectory by 2020 (41% if financially aided by developed countries) at the G20 summit in Pittsburgh (PA, USA). On the contrary, however, with the current pro-coal policy and the rapid increase in energy consumption, it is expected that the energy sector will play a greater role in CO2 emissions in the future [42], thus increasing the GHG emissions. Furthermore, the energy subsidy poses another great challenge in Indonesia. Policies that propose reducing the subsidy are always fiercely opposed by various stakeholders, which often lead to social unrest. Energy affordability for low-income people is the main motivation of the proponents of the subsidy. On the other hand, the subsidy is a great burden on the government and encourages the overconsumption of energy [42].
This study contributes to the current energy policy debate in Indonesia by signifying that to improve Indonesia’s overall long-term energy security, its policy toward reducing energy consumption through energy subsidy elimination should be given more priority than policies inclined towards improvements in the availability dimension through promotion of the energy supply.
It can be observed in the simulation results that if policies to increase energy production are adopted, the availability, affordability and efficiency dimensions converge toward improving energy security. However, these dimensions are in conflict with the acceptability dimension. On the other hand, if a policy to eliminate the energy subsidy is adopted, the efficiency and acceptability dimensions would come into conflict with the availability and affordability dimensions. Taken as a whole, however, the option of increasing energy production is less effective towards improving the overall energy security level than eliminating the energy subsidy.
We identified some areas that will require further investigation. First, from the stakeholder’s perspective, certain dimensions or indicators may have different degrees of importance. If these perspectives are taken into account, they may have significant effect on the performance score. This study does not offer a way to address this issue. Second, the data resolution of our model is primarily aggregated. Therefore, the results of the model are appropriate for long-term and strategic analyses, but it lacks the detail to perform an operational analysis. However, the model’s results can suggest some directions in which further operational-level analyses can be performed. For example, an optimization approach can be conducted to determine how much of the petrol subsidy should be lifted at different classes of income to maintain a certain level of performance of the affordability dimension, considering a set of detailed constraints such as wage, amount of wage toward petrol costs, car ownership, competition between transportation modes, willingness to pay, etc. Third, this paper only presents two scenarios among a number of the possible policy options suitable to the case of Indonesia. Additional possible scenarios are, for example, an incentive scheme for the higher penetration of highly efficient technology (e.g., hybrid cars), possible options for nuclear development [44] or the implementation of carbon tax [45]. Therefore, future studies can be directed toward these subjects.
5. Conclusions
An integrated simulation model for ex-ante energy security evaluation is presented. The model takes the interrelationships between energy security dimensions into account to assure coherence when measuring the energy security performance across the dimensions. The case of Indonesia demonstrates that the model is able to capture the converging and conflicting performances of energy security. Accordingly, a reliable ex-ante energy security evaluation can be achieved, and the trade-offs between policy options can be analyzed.
There are two important aspects to consider when evaluating energy security using a simulation model. (1) Interrelationships between dimensions. To reveal the tradeoffs, it is important to make sure the feedback loops are identified. This can be achieved by establishing the interrelationships between dimensions. (2) Stakeholders’ perspectives. To be useful, it is necessary for the model to comply with the stakeholders’ subjectivity toward energy security.
From this case study, it can be suggested that to improve Indonesia’s energy security, a policy that aims to eliminate the energy subsidy will be more favorable than a policy that aims to increase energy production. However, individual analysis of the dimensions’ performances shows that policies designed to improve Indonesia’s energy security may conflict with each other. Increasing energy production will maintain the performance of the availability dimension at a high level in the short term and improve the affordability and efficiency dimensions’ performances in a similar way. However, the acceptability dimension will worsen, as subsidy elimination improves the availability, efficiency, and acceptability dimensions’ performances at the expense of the affordability dimension’s performance.
Acknowledgements
This publication was supported in part by the Keio University Global-COE program. We acknowledge and are very grateful for their support.
References
- Alhajji, A.F. What is energy security? 2007. Available online: http://archives.mees.com/issues/219/articles/8541 (accessed on 2 August 2012).
- Yergin, D. Energy security in the 1990s. Foreign Aff. 1988, 67, 110–132. [Google Scholar] [CrossRef]
- Yergin, D. Ensuring energy security. Foreign Aff. 2006, 85, 69–82. [Google Scholar] [CrossRef]
- Study on Energy Security and Geopolitics: Final Report; Institute for International Relations “Clingendael”: The Hague, The Netherlands, 2004.
- Feygin, M.; Satkin, R. The oil reserves-to-production ratio and its proper interpretation. Nat. Resour. Res. 2004, 13, 57–60. [Google Scholar] [CrossRef]
- Energy Security and Climate Change: Assessing Interactions; International Energy Agency: Paris, France, 2007.
- Von Hippel, D.; Savage, T.; Hayes, P. Introduction to the Asian energy security project: Project organization and methodologies. Energy Policy 2011, 39, 6712–6718. [Google Scholar]
- Vivoda, V. Evaluating energy security in the Asia-Pacific region: A novel methodological approach. Energy Policy 2010, 38, 5258–5263. [Google Scholar] [CrossRef]
- Sovacool, B.K. Evaluating energy security in the Asia pacific: Towards a more comprehensive approach. Energy Policy 2010, 39, 7472–7479. [Google Scholar] [CrossRef]
- Sovacool, B.K.; Mukherjee, I.; Drupady, I.M.; D’Agostino, A.L. Evaluating energy security performance from 1990 to 2010 for eighteen countries. Energy 2011, 36, 5846–5853. [Google Scholar] [CrossRef]
- Von Hippel, D.; Suzuki, T.; Williams, J.H.; Savage, T.; Hayes, P. Energy security and sustainability in Northeast Asia. Energy Policy 2011, 39, 6719–6730. [Google Scholar] [CrossRef]
- Winzer, C. Conceptualizing energy security. Energy Policy 2012, 46, 36–48. [Google Scholar] [CrossRef]
- Bassi, A.M. Evaluating the use of an integrated approach to support energy and climate policy formulation and evaluation. Energies 2010, 3, 1604–1621. [Google Scholar] [CrossRef]
- Sterman, J.D. A Skeptic’s guide to computer models. In Managing a Nation: The Microcomputer Software Catalog; Barney, G.O., Kreutzer, W.B., Garrett, M.J., Eds.; Westview Press: Boulder, CO, USA, 1998; pp. 209–229. [Google Scholar]
- Chester, L. Conceptualising energy security and making explicit its polysemic nature. Energy Policy 2010, 38, 887–895. [Google Scholar] [CrossRef]
- Sterman, J.D. Business Dynamics: Systems Thinking and Modeling for a Complex World; Irwin/McGraw-Hill: Boston, MA, USA, 2000. [Google Scholar]
- Kiani, B.; Pourfakhraei, M.A. A system dynamic model for production and consumption policy in Iran oil and gas sector. Energy Policy 2010, 38, 7764–7774. [Google Scholar] [CrossRef]
- Bassi, A.M.; Shilling, J.D. Informing the US energy policy debate with Threshold 21. Technol. Forecast. Soc. Change 2010, 77, 396–410. [Google Scholar] [CrossRef]
- Chi, K.C.; Nuttall, W.J.; Reiner, D.M. Dynamics of the UK natural gas industry: System dynamics modelling and long-term energy policy analysis. Technol. Forecast. Soc. Change 2009, 76, 339–357. [Google Scholar] [CrossRef]
- Prambudia, Y.; Nakano, M. Exploring Malaysia’s transformation to oil net importer and oil import dependence. Energies 2012, 5, 2952–2981. [Google Scholar] [CrossRef]
- Naill, R.F. A systems dynamic model for national energy policy planning. Syst. Dyn. Rev. 1992, 8, 1–19. [Google Scholar] [CrossRef]
- Pertumbuhan Ekonomi Indonesia; Biro Pusat Statistik: Jakarta, Indonesia, 2011.
- Proyeksi Penduduk 2000–2025; Badan Perencanaan Nasional and Biro Pusat Statistik: Jakarta, Indonesia, 2005.
- Outlook Energy Indonesia 2011; Badan Pengkajian and Penerapan Teknologi: Jakarta, Indonesia, 2011.
- Total Carbon Dioxide Emissions from the Consumption of Energy; Energy Information Administration: Washington, DC, USA.
- Handbook of Energy and Economic Statistics of Indonesia; Ministry of Energy and Mineral Resources: Jakarta, Indonesia, 2011.
- United Nations Development Programme. Human Development Report 2001: Making New Technologies Work for Human Development; Oxford University Press: Oxford, UK, 2001. [Google Scholar]
- Nasir, A.; Ali, T.M.; Shahdin, S.; Rahman, T.U. Technology achievement index 2009: Ranking and comparative study of nations. Scientometrics 2011, 87, 41–62. [Google Scholar] [CrossRef]
- APEC Energy Database. The Institute of Energy Economics Website. Available online: http://www.ieej.or.jp/egeda/ (accessed on 27 January 2011).
- Annual Report: Reserves, Resources and Availability of Energy Resources, 2005–2011; Bundesanstalt für Geowissenschaften und Rohstoffe: Hannover, Germany, 2011.
- International Energy Statistics, 2011. Energy Information Administration Website. Available online: http://www.eia.gov/cfapps/ipdbproject/IEDIndex3.cfm (accessed on 5 January 2011).
- Industrial Development Report 2005: Capability Building for Catching-up; United Nations Industrial Development Organization: Vienna, Austria, 2005.
- Hubbert, M.K. Nuclear energy and the fossil fuels. In Drilling and Production Practice; The American Petroleum Institute: New York, NY, USA, 1956; pp. 7–25. [Google Scholar]
- Hubbert, M.K. Techniques of Prediction as Applied to Production of Oil and Gas; U.S. Department of Commerce: Washington, DC, USA, 1982; pp. 1–121. [Google Scholar]
- National Accounts Statistics: Main Aggregates and Detailed Tables, 2011. United Nations Statistics Division Website. Available online: http://unstats.un.org (accessed on 14 December 2011).
- Pemerintah Siapkan Dua Aturan Peningkatan Produksi Migas. Kementerian Energi Dan Sumber Daya Mineral Website. Available online: http://www.esdm.go.id/berita/migas/40-migas/5196-pemerintah-siapkan-dua-aturan-peningkatan-produksi-migas.html (accessed on 25 March 2012).
- Terry, R.E. Enhance oil recovery. In Encyclopedia of Physical Science and Technology, 3rd ed.; Meyers, R.A., Ed.; Academic Press: San Diego, CA, USA, 2001; Volume 18, pp. 503–518. [Google Scholar]
- Blueprint Pengelolaan Energi Nasional 2010–2025; Ministry of Energy and Mineral Resources: Jakarta, Indonesia, 2009.
- Adi, A.C. Indonesia gas balance and energy policy. In Proceedings of 5th International Indonesia Gas Conference and Exhibition, Jakarta, Indonesia, 27 January 2011.
- Subsidi BBM buat Apa? Menjelaskan Kenaikan Harga Premium dan Solar; Ministry of Energy and Mineral Resources: Jakarta, Indonesia, 2012.
- Rahayu, S.L. Studi Efektifitas Pemberian Subsisi Listrik. Kaji. Ekon. Keuang. 2008, 12, 41–82. [Google Scholar]
- Resosudarmo, B.P.; Alisjahbana, A.; Nurdianto, D.A. Energy Security in Indonesia; Working Papers no. 2010/08; The Arndt-Corden Department of Economics Crawford School of Economics and Government ANU College of Asia and the Pacific: Canberra, Australia, 2010. [Google Scholar]
- Cebu Declaration on East Asian Energy Security; Association of Southeast Asian Nations: Jakarta, Indonesia, 2007.
- Sriyana, S. Current status of Indonesia’s nuclear power programme. Presented at IAEA Technical Meeting/Workshop on Topical Issues on Infrastructure: Managing the Development of National Infrastructure for NPP. Center for Nuclear Energy Development. IAEA Headquarters: Vienna, Austria, 2012. [Google Scholar]
- Ministry of Finance Green Paper: Economic and Fiscal Policy Strategies for Climate Change Mitigation in Indonesia; Ministry of Finance and Australia-Indonesia Partnership: Jakarta, Indonesia, 2009.
© 2012 by the authors; licensee MDPI, Basel, Switzerland. This article is an open access article distributed under the terms and conditions of the Creative Commons Attribution license (http://creativecommons.org/licenses/by/3.0/).
Share and Cite
MDPI and ACS Style
Prambudia, Y.; Nakano, M. Integrated Simulation Model for Energy Security Evaluation. Energies 2012, 5, 5086-5110. https://doi.org/10.3390/en5125086
AMA Style
Prambudia Y, Nakano M. Integrated Simulation Model for Energy Security Evaluation. Energies. 2012; 5(12):5086-5110. https://doi.org/10.3390/en5125086
Chicago/Turabian StylePrambudia, Yudha, and Masaru Nakano. 2012. "Integrated Simulation Model for Energy Security Evaluation" Energies 5, no. 12: 5086-5110. https://doi.org/10.3390/en5125086