A PEV Charging Service Model for Smart Grids


1
College of Information Technology, United Arab Emirates University, P.O. Box 17551, Al-Ain, UAE
2
College of Engineering, United Arab Emirates University, P.O. Box 17551, Al-Ain, UAE
*
Author to whom correspondence should be addressed.
Energies 2012, 5(11), 4665-4682; https://doi.org/10.3390/en5114665
Submission received: 6 September 2012
/
Revised: 25 October 2012
/
Accepted: 6 November 2012
/
Published: 16 November 2012
(This article belongs to the Special Issue Smart Grid and the Future Electrical Network)
Abstract
:Plug-in Electric Vehicles (PEVs) are envisioned to be more popular during the next decade as part of Smart Grid implementations. Charging multiple PEVs at the same time within a power distribution area constitutes a major challenge for energy service providers. This paper discusses a priority-based approach for charging PEVs in a Smart Grid environment. In this work, ideas from the communication network paradigm are being utilized and tailored toward achieving the desired objective of monitoring and controlling PEVs electric load in Smart Grid. A detailed example is given to show how uncontrolled penetration of PEVs can impact distribution transformer reliability. The paper introduces the concept of Charging Quality of Service (CQoS) as a smart electric vehicle charging scheme and models it using a priority-controlled leaky bucket approach. The performance of such a model is investigated under the umbrella of a Smart Grid environment.
1. Introduction
It is expected that demand for electric energy will triple by 2050 [1]. The Smart Grid or a modern electric grid system is becoming a priority for most developed countries. With soaring oil prices, cost of traditionally produced electricity, and environmental concerns, the integration of renewable energy sources as part of the electric grid is becoming more needed every day. Other contributing factors to the modernization of the current electric grid system involve the use of automation and integration of Information and Communication Technology (ICT) systems to improve the production, delivery, and efficiency of power load distribution as well as the reliability and security of such systems. Keys to designing a Smart Grid system include effective connectivity, proper monitoring, resiliency, reliability, security and adaptability [2]. Currently, connectivity for the power grid systems is limited and a considerable amount of work is needed to be able to serve the required tasks envisioned to be essential to a Smart Grid system. In this work, it is envisioned that the Smart Grid system is capable of two way communication flow in addition to the energy flow. We are focusing on providing a framework for smart charging of PEVs to help level load peaks within a power distribution area.
Although PEVs are currently more costly to buy, they are becoming more attractive as a means for personal commuting due to their zero emissions and lower cost maintenance in the long run. According to a recent survey conducted by Ernst & Young [3], around 10% of Americans and 60% of Chinese surveyed drivers indicated they would consider buying an electric vehicle in the future. In addition, the US Department of Energy expects about one million plug-in hybrid electric vehicles (PHEV) driven by 2015 [4]. The widespread of PEVs will, however, post a real challenge to existing power grids due to the massive power load that can be drawn by these vehicles when charging and the limited availability of charging stations. Synchronization of PEV charging is a great concern to power utility companies and innovative measures of avoiding such periods are needed. Most owners of PEVs are under the assumption that they will be able to charge their vehicles at home during the night time or at their workplace. Having more than a few PEVs charging at the same time within the same power distribution grid might cause an overload of the system and can be more costly to owners under certain load consumption pricing strategies. The impact of charging PEVs in a residential neighborhood is most significant on distribution transformers which are considered to be the weakest link in a residential grid [5]. In general, introducing PEVs into a distribution grid without taking the proper measures might result in several undesirable effects such as voltage fluctuations, blackouts and newly introduced load peak times. In this paper we introduce and evaluate a novel charging scheme, which can be used in the presence of a two way communication between a smart electric plug used to charge PEVs and a control and command centre, to manage energy consumption in a given distribution area. The motivation for the proposed scheme is borrowed from the networking paradigm of providing quality of service to users based on their configured profiles and service level agreements as will be elaborated on later. Our proposed framework is based on a newly proposed concept for priority charging of PEVs based on different classified charging services. These services are provided to the owners of the PEVs to choose from depending on their needs and the availability of power provided within a service area.
The rest of the paper is organized as follows: in Section 2 more background work on the topic is presented. Section 3 presents an example of an electric distribution system. Section 4 presents the proposed charging quality of service scheme while Section 5 discusses a PEV charging service monitoring and control example. Section 6 introduces the PEV priority service model and Section 7 discusses the obtained numerical results and simulation before the paper is concluded in Section 8.
2. Background
Charging PEVs or PHEVs and their effect on the load of a power system has been investigated by several researchers as part of Smart Grid initiatives and implementations. Most recently, Su et al. in [6] investigated the performance of an estimation distribution algorithm when used to intelligently allocate power to PHEVs which are connected to a power grid of a parking deck. In another example, Gormus et al. in [7] discussed load levelling challenges and how networking concepts can be used to help in the management of energy distribution and the levelling of the load. In particular, the authors have drawn an analogy between load levelling in power grids and the scheduling for optimization of resources in a communication network. In [8], Kabisch et al. looked at interconnection and communication between electric vehicles and a Smart Grid. The paper discussed the different kinds of charging locations, characteristics and the vehicle to grid integration, specifically the communication interface. In [9], Turitsyn et al. developed a control algorithm for randomization of electric vehicle charging times using a one way communication broadcast protocol to better utilize and manage the load in a Smart Grid. The authors used concepts from queuing theory and statistical analysis to reduce the probability of a system overload to a negligible number. However, the authors did not consider the option of having different charging services available for the owners of electric vehicles to choose from. In [5,10], Masoum et al. discussed how PEV charging at different rates and at different scheduling times significantly affects the power load curve in a residential grid. The authors also discussed the concept of having three charging scenarios and conducted simulations to analyze and demonstrate their impacts on the grid distribution system. In another paper, Lu et al. [11] defined three charging profiles for PHEVs, uncontrolled charging model, delayed charging model, and continuous charging model. The authors looked at the power grid load profile when a number of PHEVs are all being charged using one of the mentioned three models and they also investigated how vehicle to grid i.e., discharging PHEVs can be utilized to help level the load. More recently, Bordeau et al. [12] investigated how a distributed PEV charge control mechanism utilizing an agent-based approach can be used to allow PHEVs to make charging decisions based on load profile information made available to these PHEVs. On the other hand, Venables et al. [13] focused their attention on the main challenges the electric utility companies need to resolve in terms of infrastructure development due to the potential substantial increase of load that the power grids have to handle when electric vehicles are used. In the area of Smart Grid communication, Hochgraf et al. [14] looked at how existing cellular network features such as GSM in combination with SMS text messaging and GPS can be used for the control of PEV charging a cross a Smart Grid giving owners of PEVs the ability to decide on where and when to charge their vehicles.
On other fronts, research on power grid systems has been going on for some time focusing on various challenges such as power distribution management, fault monitoring and detection, connectivity and communication, security, integration of renewable energy and control. For example, early on, Ili [15] was concerned with the fundamental engineering planning and operation of an interconnected grid to achieve high energy efficiency given the dynamicity and uncertain changes in the generation and load inputs. In [16], Ali et al. presented a review of previous research done on the use of high performance computing in power system reliability and security analysis, operations, monitoring and control systems. In the area of modern control centers for Smart Grid [17], Pradeepa et al. proposed an information architecture design for power system control centers which are based on open standards focusing on desired features such as openness, interoperability, flexibility, scalability, vendor independence and event orientation. In the area of real-time monitoring [18], Demirci et al. developed a nationwide real-time monitoring system to monitor all electrical quantities and power quality parameters of the electricity transmission network including its interfaces with the generation and distribution systems. In the area of Smart Grid security [19], Davies outlined the major security challenges that might be encountered as part of a Smart Grid implementation when it is connected to the Internet. Our work is different from the work of others, as it looks at modelling the effect of charging PEVs using different proposed charging profiles with respect to granted charging service probability and the impact of the most demanding charging scheme on the requests of other users.
3. Electrical Distribution Systems and Load Profile with PEVs
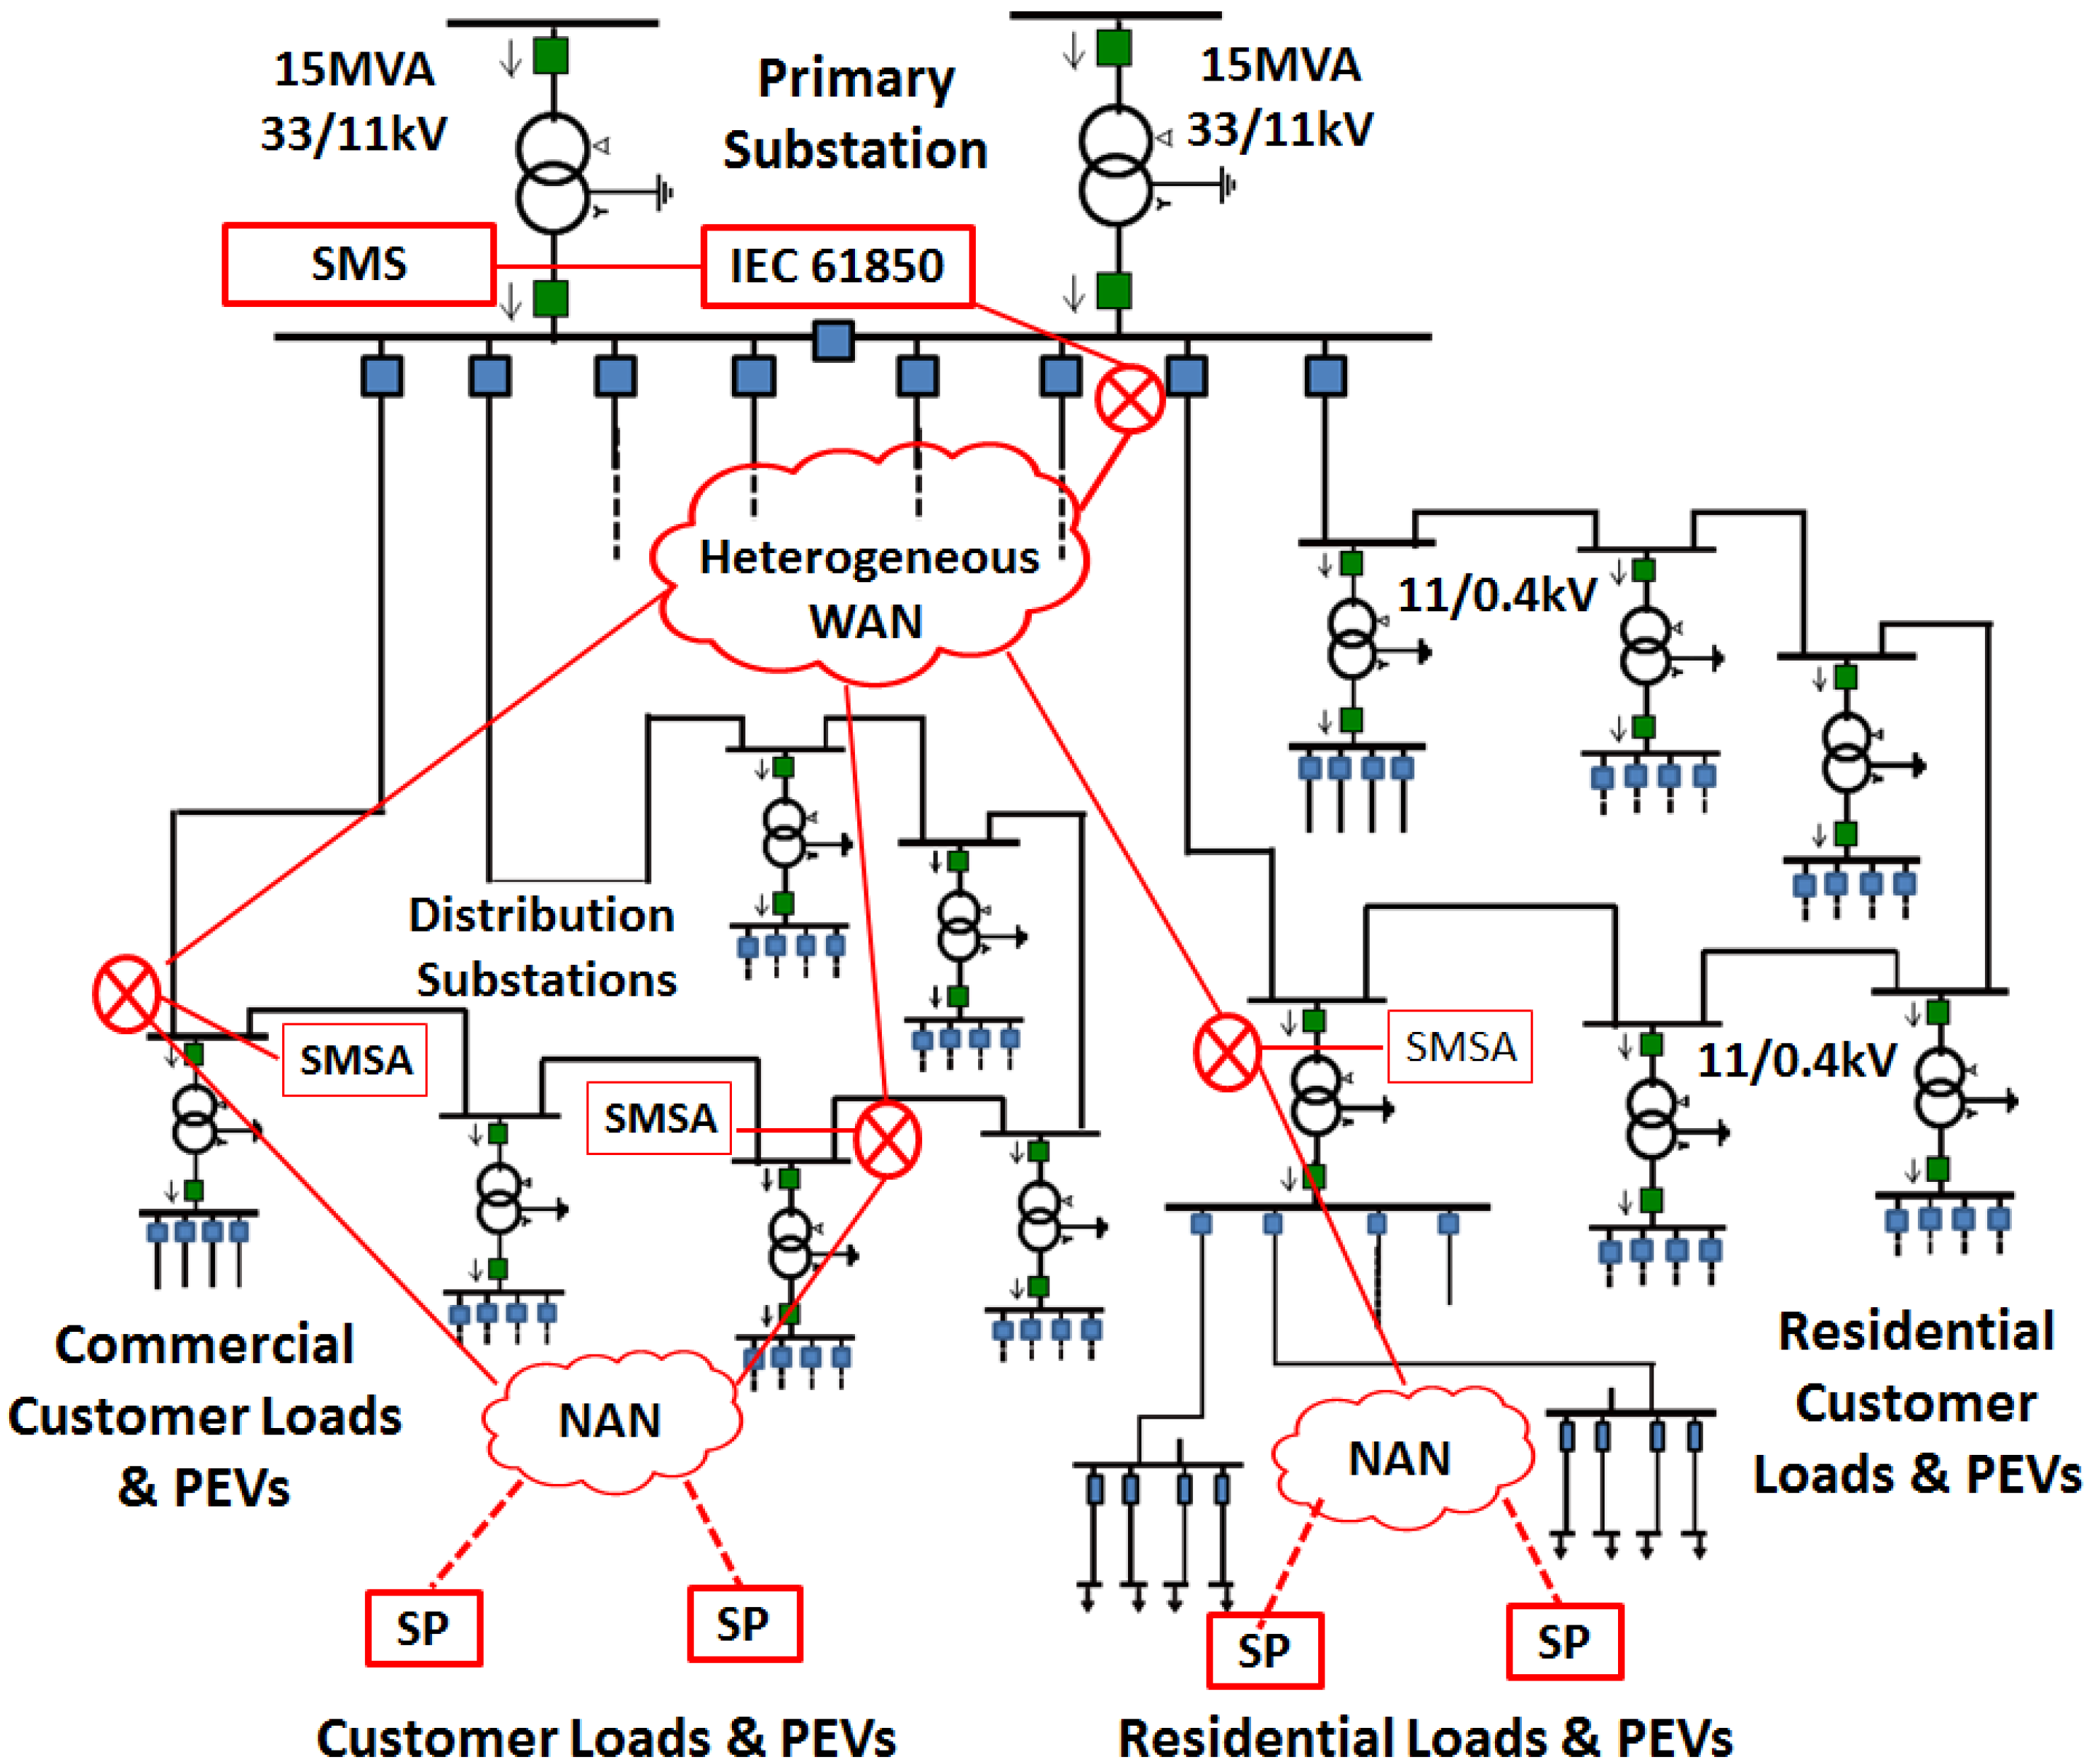
Integrating PEVs into existing electric distribution systems presents a challenging task. The additional load due to PEVs, if not controlled, might overload existing equipment; affect system operation conditions, increase losses and degrade the quality of service. Figure 1 illustrates part of a 33/11/0.4 kV energy distribution network (EDN) that utilizes underground cables to supply different residential and commercial customers in urban areas.
Figure 1.
Urban electric distribution system and PEVs in customer loads.

The primary substations (33/11 kV) have up to three-transformers rated at 15 or 20 MVA and supplying different distribution substations (11/0.4 kV) of 1.0 or 1.5 MVA transformers. Sample feeders that connect 1.0MVA, 11/0.4 kV distribution substation to residential customers having PEVs are presented in the figure. The proposed PEV priority charging service scheme is managed by the Smart Monitoring System (SMS) at the primary substation and their agent units (SMSA) at each distribution substation. PEVs are integrated with the system using Smart Plugs (SP) and through the neighbourhood communication area networks and other heterogeneous wide-area networks. Both SMSA and SMS share transformers’ loading conditions and categorize the PEVs charging services that can be offered at each hour. The goal of this paper is to propose a smart electric vehicle charging scheme that can overcome equipment overloading due to uncontrolled PEVs penetration. While the proposed technique can be utilized to control the effect of PEVs on transformer overloading, system losses and voltage profile, the proposed technique was illustrated and investigated considering transformer loading conditions using practical load profiles of distribution transformers.
As an example, consider the load profile of mixed residential and commercial load which is monitored at the distribution transformer as illustrated in Figure 2. For normal life expectancy of the distribution transformer, its loading condition as a percentage of its rated value should be limited to only 77.5%. This is due to the high ambient temperature of 45 °C, as well as other operation conditions.
Figure 2.
Distribution transformer load profile, (a) without PEVs and (b) with 100% penetration of 52 PEVs.
Figure 2.
Distribution transformer load profile, (a) without PEVs and (b) with 100% penetration of 52 PEVs.
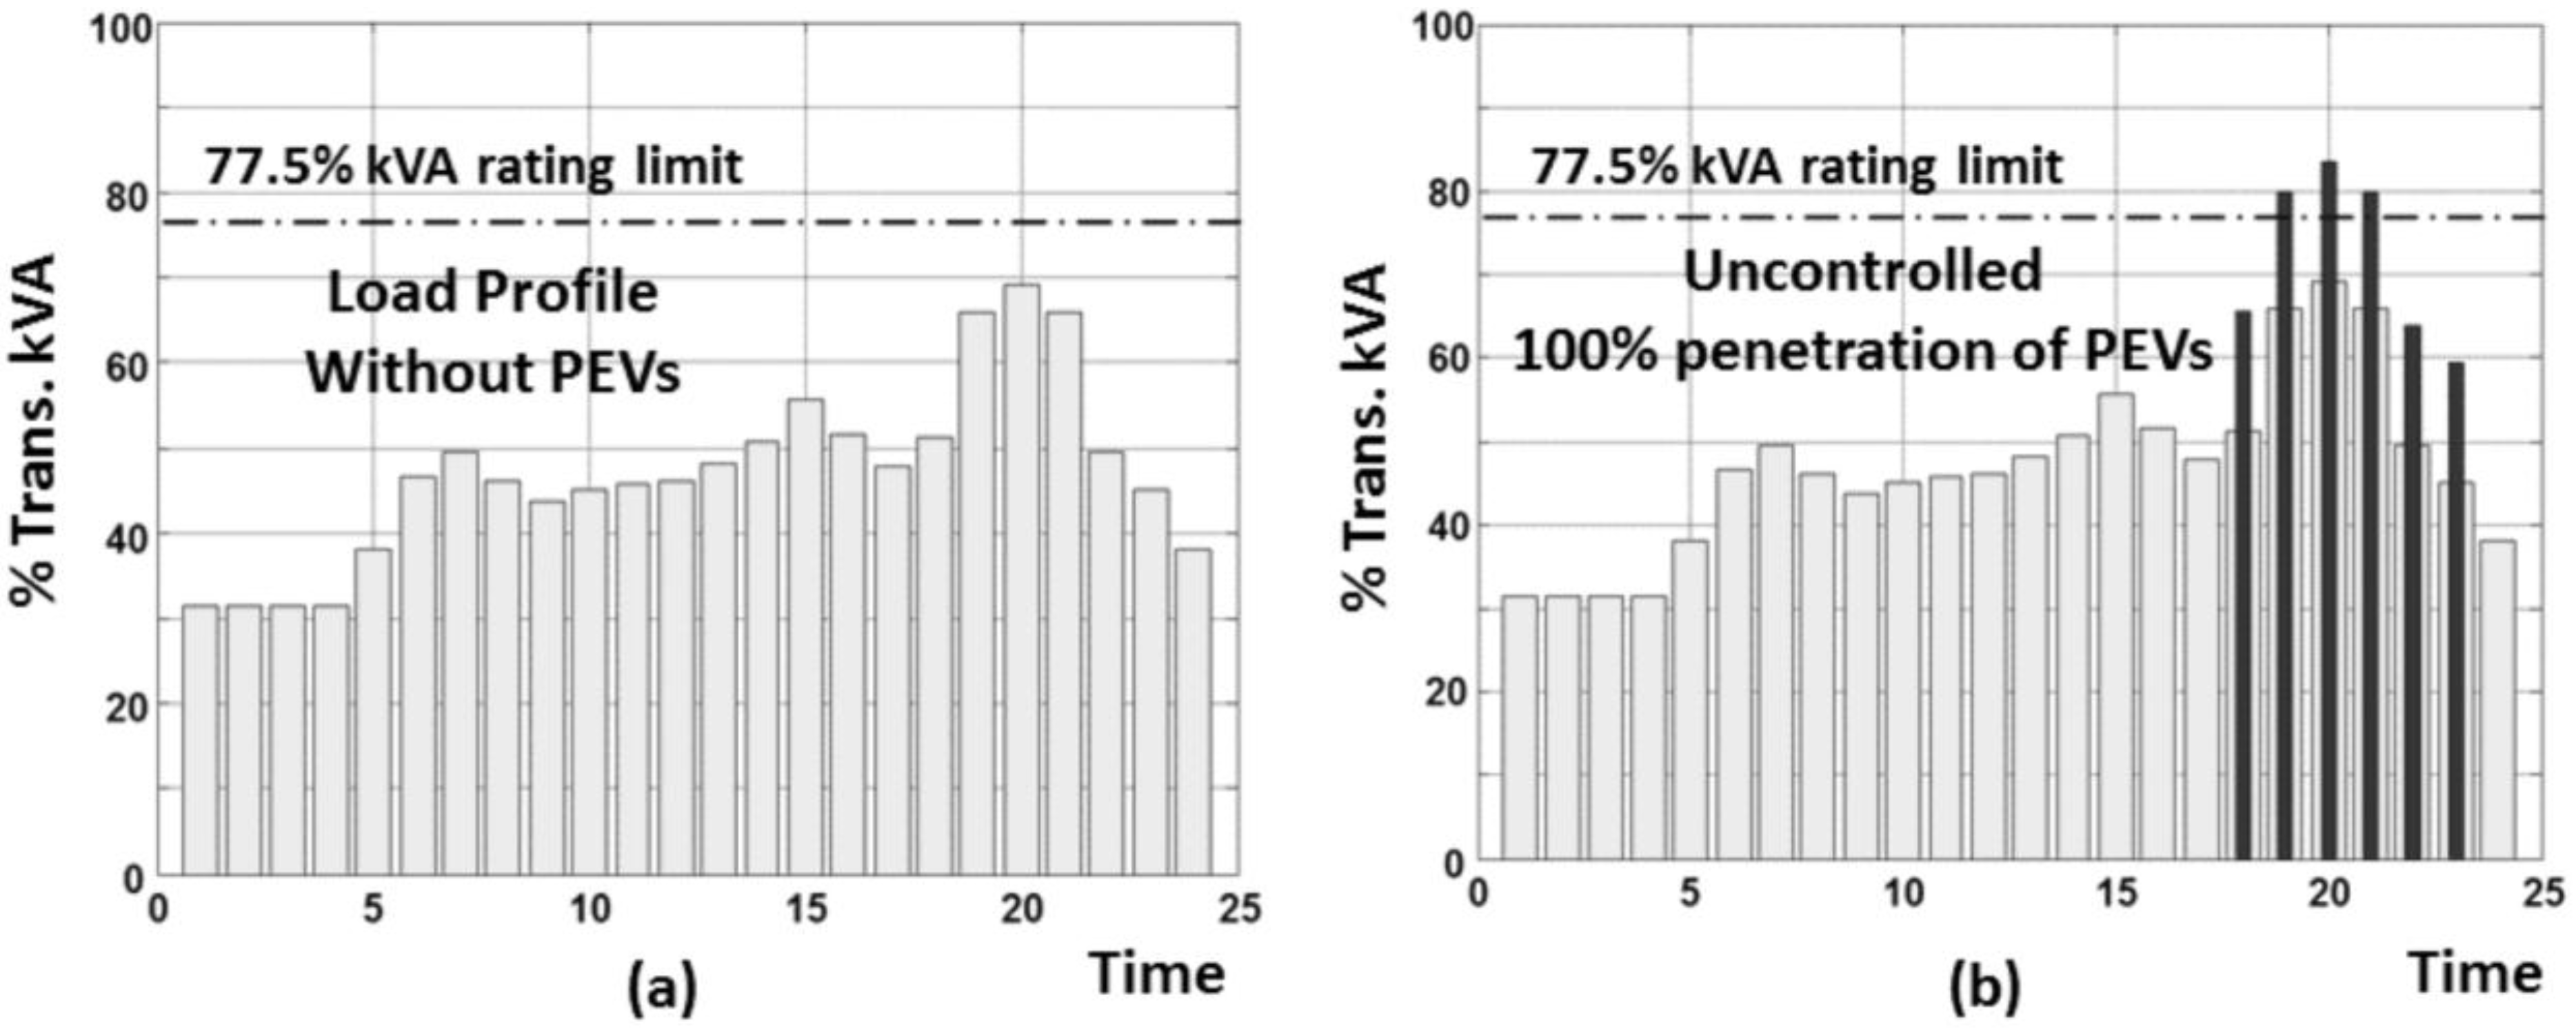
These loading conditions are reflected in the design and operation stages of these transformers considering peak and off-peak conditions as shown in Figure 2a. However, the penetration of PEVs as a new load for residential and commercial customers develops new operation conditions that represent a challenging task for the reliability of the operation of electric distribution systems. Uncontrolled charging may lead to daily overloading of the distribution transformer and other equipment. According to AL Ain Distribution Company (AADC) [20] practice, the LV cables are fed from the substation LV panels that typically have eight or ten out-going positions for services to feeder pillars, service turrets, or services directly to a building. The feeder pillar has two incoming cables and four outgoing cables that provided service of a peak demand of 220 to 300 kW. Uncontrolled charging may lead to daily overloading of the distribution transformer and other equipment. As shown in the example illustrated in Figure 2(b), the thin darker bars during the time interval 18:00–23:00 shows the percentage of transformer loading condition during an uncontrolled PEV charging process. The figure presents the 1.5 MVA transformer overloading condition assuming uncontrolled continuous charging in a residential community of 128 small apartments with 40% penetration (52 PEVs of 2.3 kW each, assuming 1 vehicle per household) under peak load conditions. This daily overloading will affect the transformer safe operation and degrade its lifetime expectancy. The concept of Charging Quality of Service (CQoS), discussed in the next section, is proposed here to provide the required power for charging any number of PEVs without degrading the distribution transformer lifetime expectancy. A Smart Grid environment is assumed and the charging process is classified and controlled assuming smart electric plugs which are capable of two-way communications and have the ability to communicate with a proposed energy management node (EMN) which monitors the load profile of the distribution transformer.
4. Charging Quality of Service for PEVs
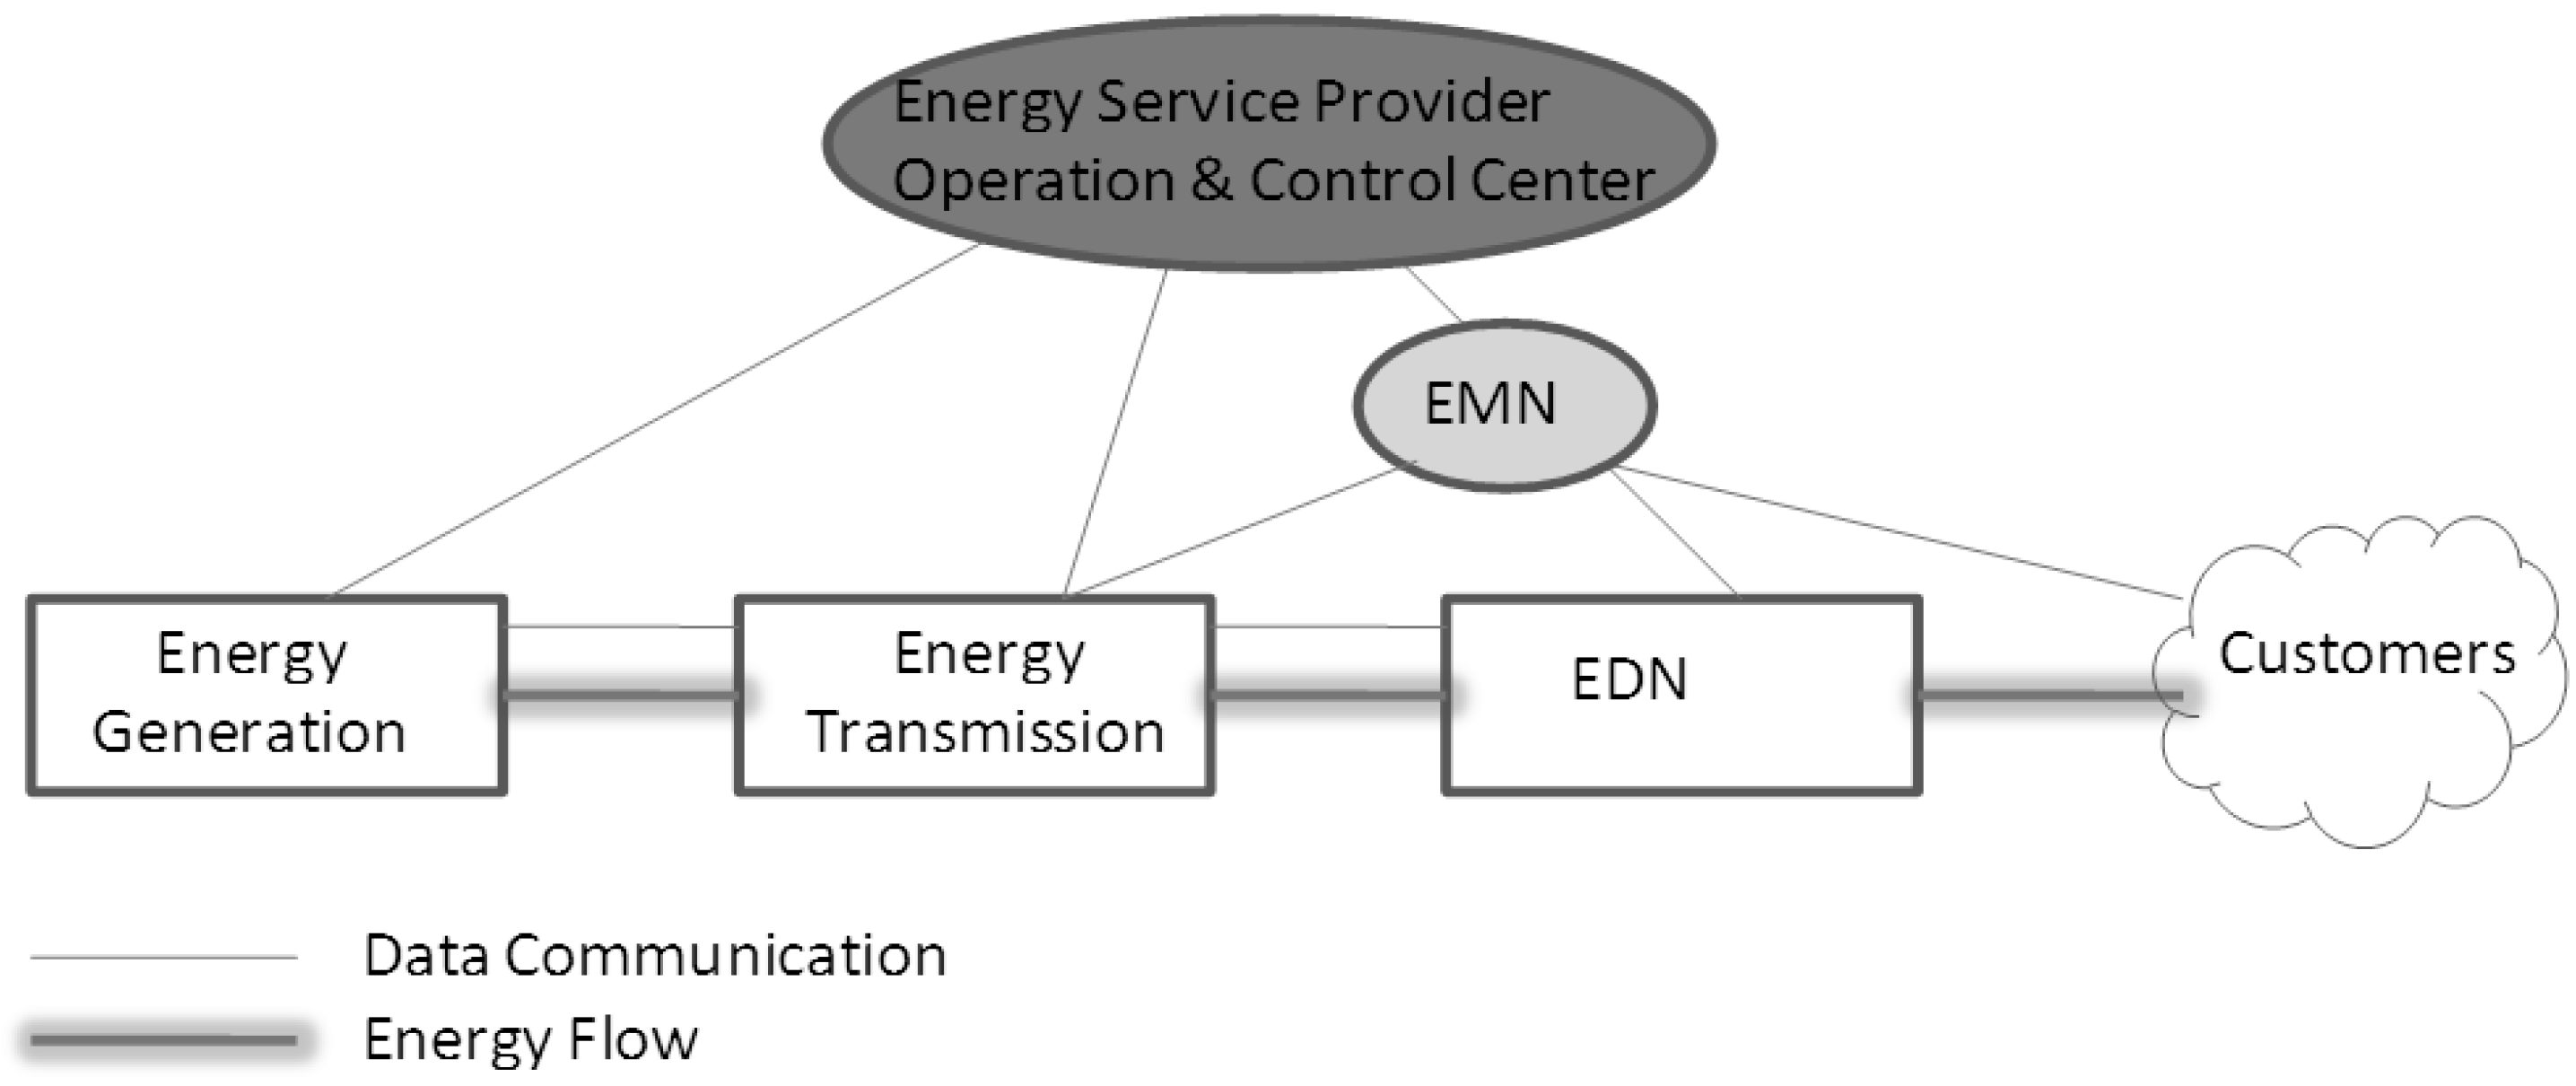
To formulate the problem of PEV charging in a Smart Grid environment, we assume that an energy service provider (ESP) is serving a particular area through an energy distribution network (EDN). Two main constraints are apparent in our proposed scheme. One is operating within the total energy limits the EDN can deliver to all connected consumers, without causing a system overload, which is assumed to be Et, and the other is the assumed availability of the needed communication infrastructure and bandwidth between the interacting entities. A number (N) of smart electric plugs (SP) used for charging PEVs is assumed to exist and being supported within an EDN. Figure 3 shows an overview of energy distribution within an EDN. It is assumed that SPs are capable of two-way communication with a Smart Grid energy management node which manages the load distribution in its area and can exchange data with an EDN and all SPs as needed. Communications within the Smart Grid entities is not the focus of this work and therefore it is envisioned that SPs can be connected to the network to communicate with an EMN via PLC, wired or wireless network as part of a LAN, a WAN, a cellular infrastructure or a combination of these communication networks. In the communication network paradigm, ITU-T E.800 and ETSI recommendation basically define Quality of Service (QoS) as “the collective effect of service performance which determines the degree of satisfaction of a user of the service” [21]. Borrowed from this concept of QoS paradigm in communication networks, we assume that there are various types of power delivery options available for the owner of a PEV to choose from. For simplicity, we assume that all PEVs use the same energy level.
Figure 3.
High level energy distribution system.

Charging quality of service is a concept we introduce to classify the power delivery options. Under CQoS a PEV can be charged using one of four schemes: Continuous Charging (CC), Delayed Continuous Charging (DCC), Intermittent Guaranteed Charging (IGC), and Intermittent Unguaranteed Charging (IUC), in which CC and DCC have higher priority than IGC and IUC. In the CC scheme charging is continuous until the battery becomes full or the process is stopped by the user, i.e., power is continuously supplied by the SP a PEV is connected to. Likewise, DCC also provides continuous charging service to a PEV after an initial delay provided that there is enough power to guarantee the needs for all PEVs requiring the CC service within a given time period. In the IGC scheme charging of the PEV is intermittent but an average supplied power within a time period is expected. In the IUC scheme no guarantees are provided on the amount of power to be supplied by controlling the associated SPs over a period of time, customers are supplied with power as it becomes available in access to other customers using the other charging schemes. Table 1 shows these charging schemes with possible charging scenarios that can apply to PEV owners.
A customer’s choice of a particular charging scheme can be driven by various factors such as price, customer behaviour and the availability of charging services. The price of charging can be used as an incentive to encourage customers to regularly schedule the charging time of their PEVs based on charging schemes. Pricing models can be generated by an energy service provider for the various charging schemes based on the area of service, the time of the day and the current load. This will have an effect on the general customer’s behaviour and his/her daily planning and on the energy market supply and demand principles. On the other hand, electric vehicles can also be used to transfer energy back to the grid for a price which can be maximized to the benefit of the owners of these vehicles. For example, the authors in [22] presented algorithms that allow electric vehicle owners to maximize their profit by charging their vehicles during off peak times and selling back the stored energy to the grid during peak times. In another example, the authors in [23] discussed the economic aspects of the integration of packs that used electric vehicle batteries as a source of power for micro-grids.
In this work our objective is to monitor the energy load utilization given an available amount of energy at any point in time. We assume that a number of PEVs arrive per second based on a Poisson distribution, to be charged while another number of PEVs leave the system after being charged or based on the owners’ desire. We also assume that these PEVs could be charged utilizing all four charging schemes. A performance study of the proposed charging mechanisms is conducted by looking at the charging service blocking probability of a PEV, and the effect of the various CQoS schemes on the overall performance of the system.

| Scheme | Possible Application |
|---|---|
| CC | While on a commuting trip, short term charging for urgent use, visit charging taking advantage of off peak periods. |
| DCC | Same as CC but with a possible initial delay until resources are freed by CC customers |
| IGC | Overnight charging, during work hours charging, during mall shopping charging. A customer needs a certain battery level to be achieved within a time period which is assumed to be much longer than what a DCC or CC customer requires. |
| IUC | Overnight charging, during work hours charging, weekend charging. Battery level before charging is sufficient for intended future use or no trips are planned. |
5. PEV Service Monitor and Control
The proposed technique was implemented to monitor and provide a complete charging of a challenging case of 100 PEVs (16 kWh, 2.3 kW each, assuming 40% penetration and 2 vehicles per household) within the same residential community of 128 small apartments. The vehicles’ batteries were assumed to have the same energy and required full charging with an expected charging time of 6 hours. The charging time-interval was selected during the peak load duration of the load profile. The following two scenarios were investigated.
5.1. PEVs Uncontrolled Charging
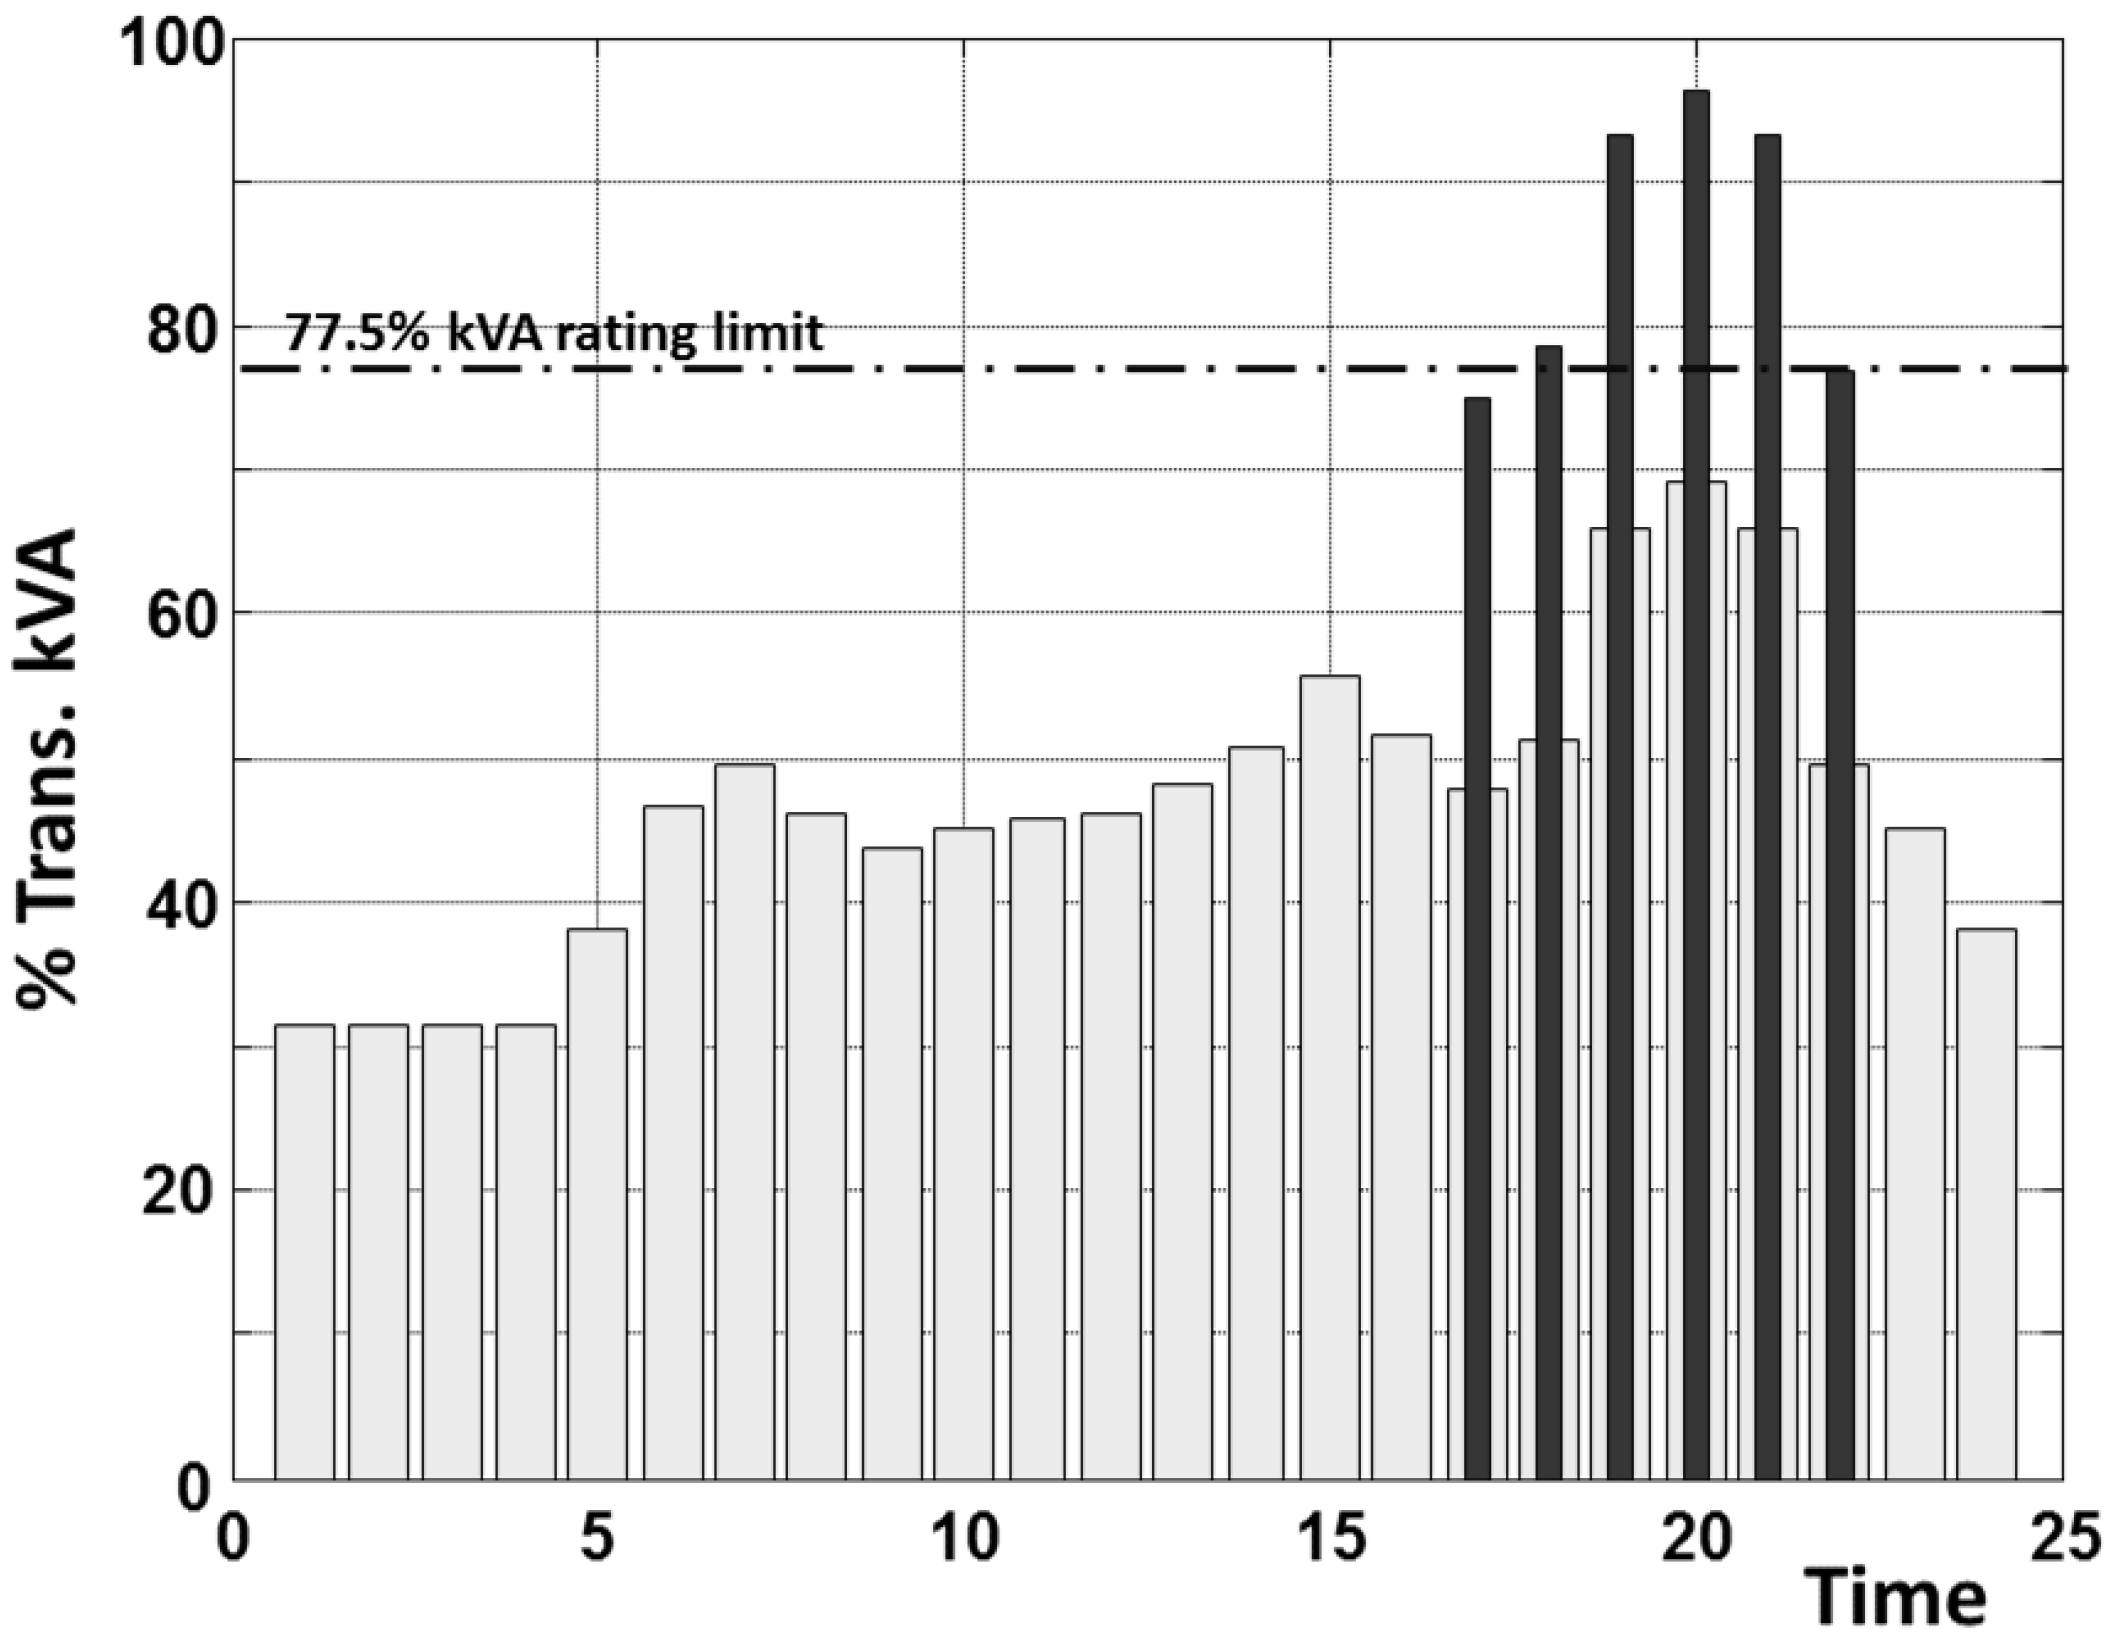
The PEVs charging process was started simultaneously for all the vehicles during the load peak period from 17:00 to 23:00. Figure 4 shows the load profile with the 100% penetration of the PEVs. The thin darker bars from 17:00 to 23:00 show the increase in the transformer loading condition during the PEVs’ continuous uncontrolled charging. The power requirement exceeds the distribution transformer kVA limit and hence affects the quality of operation and the lifetime expectancy of the transformer.
Figure 4.
Distribution transformer load profile with 100% penetration of PEVs under uncontrolled charging process.
Figure 4.
Distribution transformer load profile with 100% penetration of PEVs under uncontrolled charging process.

5.2. PEVS Smart Charging
The following two charging schemes are considered in the proposed smart CQoS for a PEV: Continuous Charging (CC), where 8% of the PEVs were always granted this service. The PEVs percentage of the CC scheme was varied between 8% and 100% based on the maximum load that can be supplied from the distribution substation without exceeding transformer operation limit.
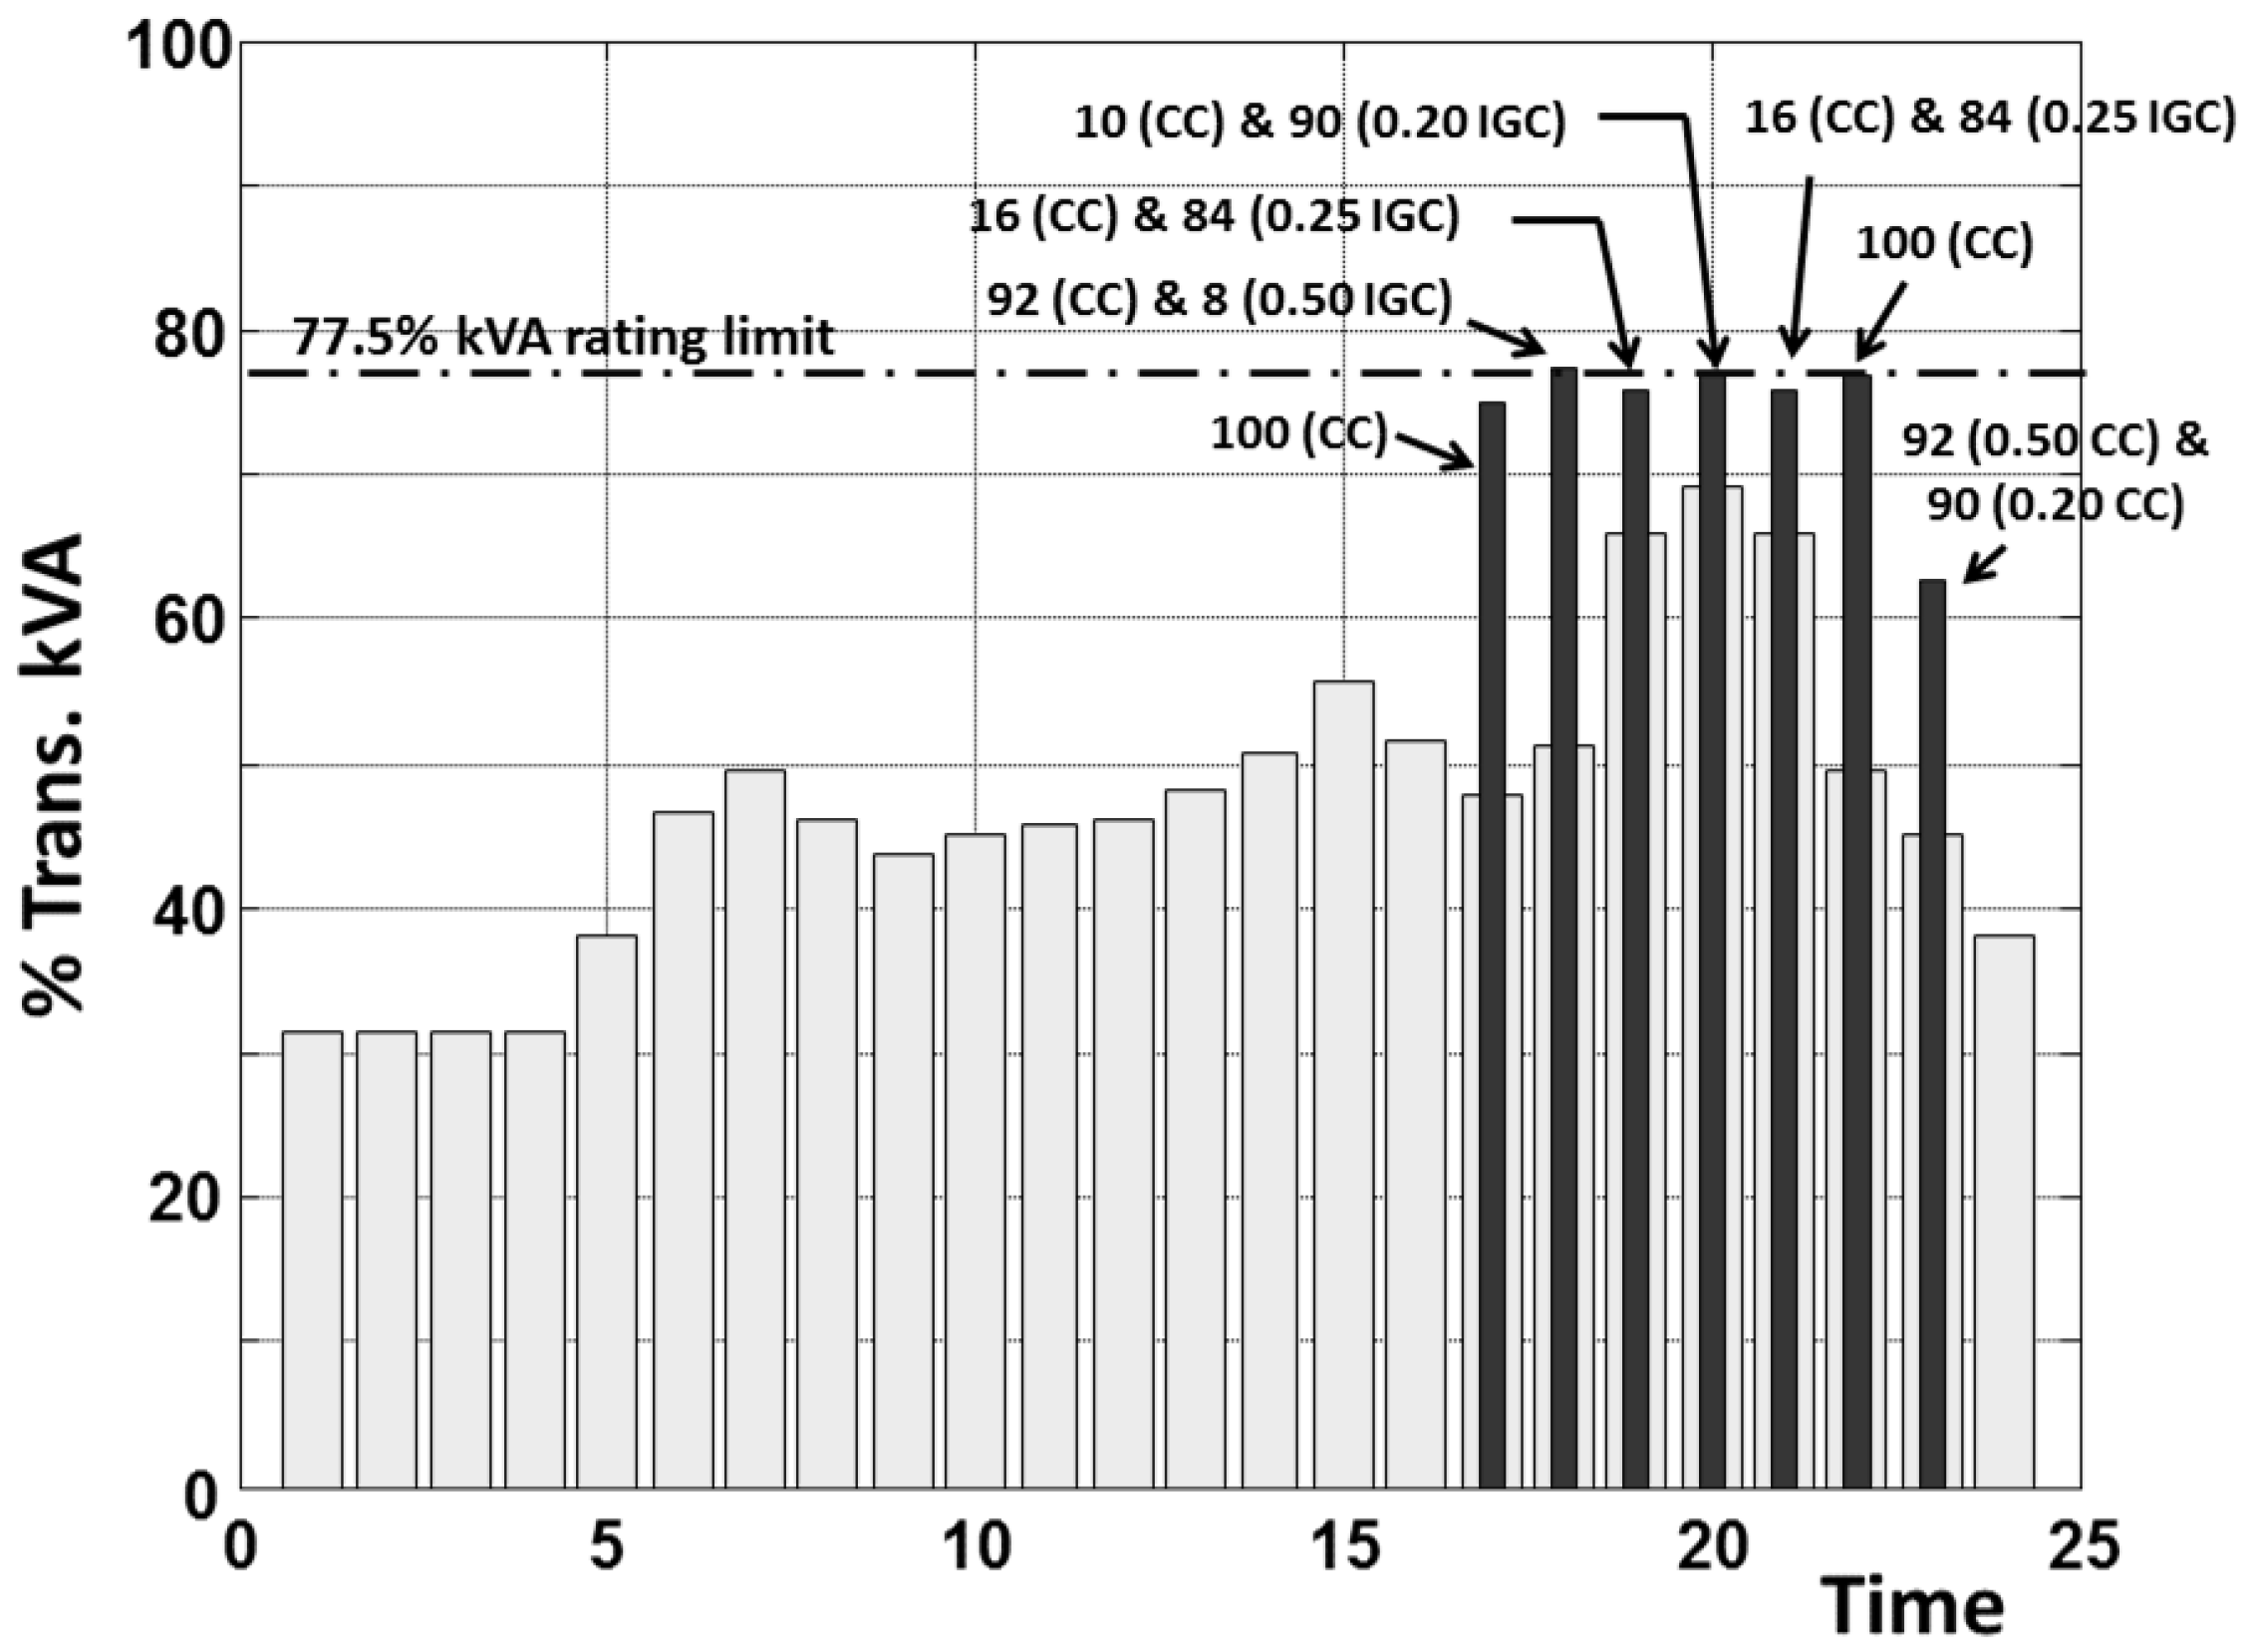
Figure 5.
Distribution transformer load profile with 100% penetration of PEVs under smart charging.

The other scheme is the Intermittent Guaranteed Charging (IGC), which allowed up to 92% of PEVs to have a charging time-interval per hour which lasted for 0.20, 0.25, 0.50 or 1.0 hours according to the distribution transformer load profile. Figure 5 shows the load profile with 100% penetration of 100 PEVs considering the proposed smart charging scheme. During the 17:00–18:00 time interval, the load profile can accommodate 100% CC of the PEVs without exceeding the transformer limit. Similar condition was met during 22:00–23:00 time interval. During the 18:00–19:00 time interval, IGC of 0.5 hour was considered for 8% of EVs and the rest were accommodated under CC charging. During the peak load condition (20:00–21:00 time interval), only 10% of PEVs were accommodated under CC charging and 90% were considered for a charging interval of 0.20 hour as IGC. An additional period (23:00–24:00 time interval) was used to accommodate the remaining charging energy required for full-charging of PEVs operated under the IGC schemes. Within this period, 92% of the PEVs were considered for a charging interval of 0.50 hour as CC then 90% of these PEVs continued to charge for an interval of 0.20 hour as CC to become fully charged. While in this application only CC and IGC were considered for smart charging of 100 PEVs, more vehicles can be accommodated with a longer charging period and considering addition services based on the DCC and IUC schemes as indicated by the proposed CQoS.
6. PEV Service Model
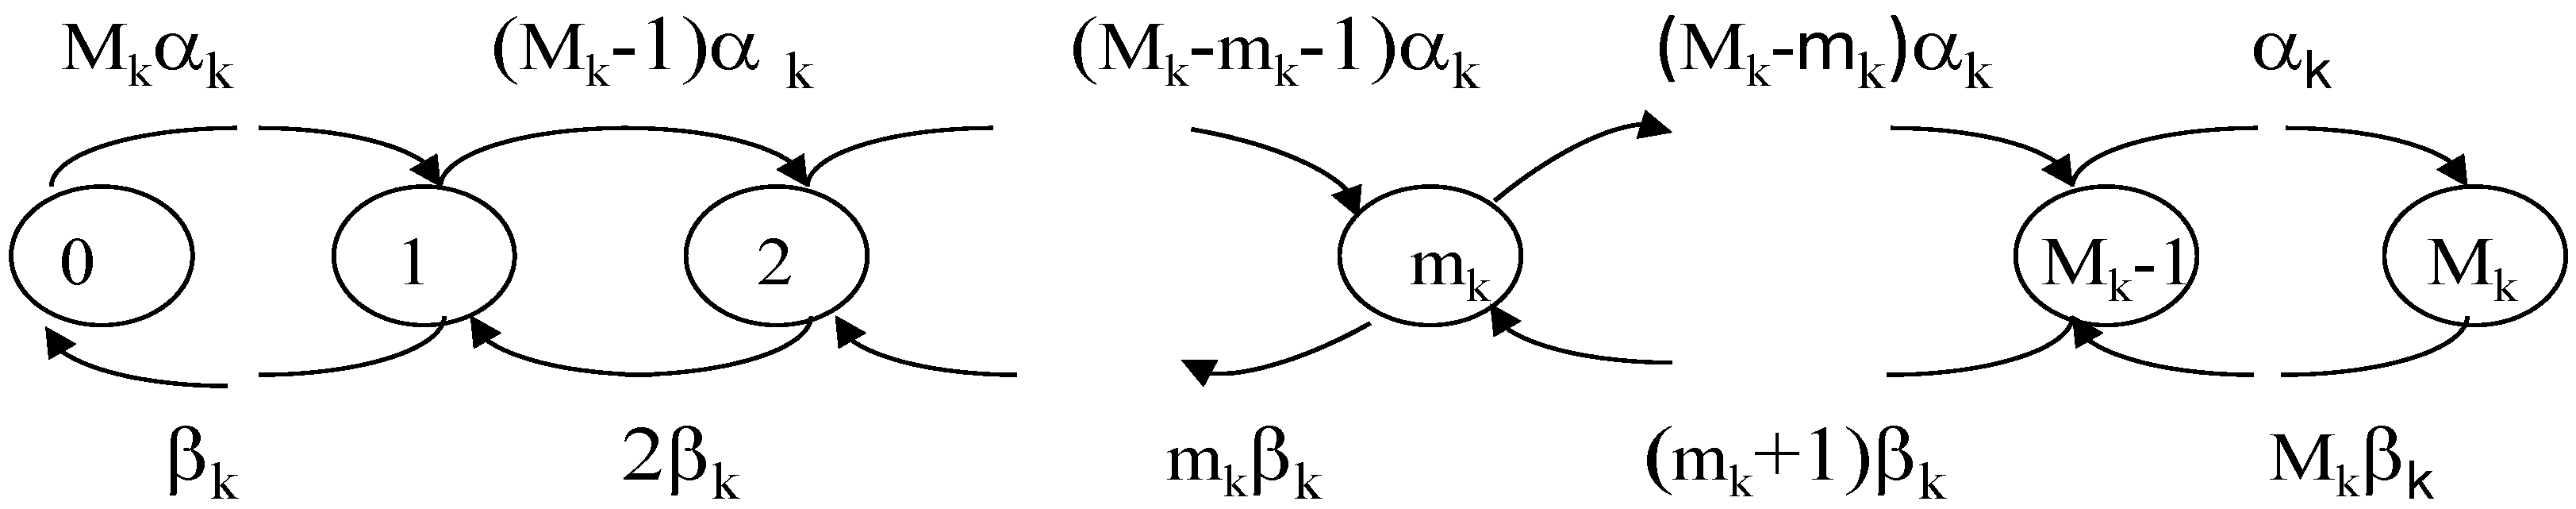
In this work it is assumed that an ESP is serving a particular area by delivering Et kilowatt per unit time through an energy distribution network, which is controlled by an energy management node. Let EB = θBEt and EP = θPEt be the energy rates in terms of kilowatt per unit time in support of background load and the various PEV charging services, where θB and θP are the distribution ratios to the different services, background and PEV, respectively, such that θB + θP = 1. The charging of PEVs is modelled by a priority leaky bucket system with maximum energy deliverable rate of EP kilowatts per unit time. In the following analysis, we introduce a service charging scheme index k = 1, 2, 3 and 4 to represent the service charging schemes CC, DCC, IGC and IUC, respectively. Note that the priority leaky bucket model operates on a first-in-first-out (FIFO) non-pre-emptive basis while PEVs are being served. Considering that the population of PEVs is M, each PEV generates a CC, DCC, IGC and IUC service with specified arbitrary parameter γk. These arbitrary parameters indicate the consumption behaviour of PEVs, which can be characterized by daily operation records of PEV charging services. The process for a PEV with a service charging scheme k is modelled as an ON-OFF Markov process [24], in which the state “ON” represents the PEV in an energy charging mode, while the state “OFF” represents the PEV in an idle mode. The transition rate from the “ON” to “OFF” state is represented as αk and the transition rate from the “OFF” to “ON” state is represented by βk. Note that both αk and βk are directly related to the charging-time assigned to the service charging scheme k in a particular given time interval during the day as discussed in Section 5.2. Considering that the population of PEVs generating request for a service charging scheme k is given by Mk = γkM, then when the service requests for charging from such Mk PEVs are multiplexed, the resultant service process can be represented by a (Mk + 1) state Markov modulated process as shown in Figure 6, where state mk ∈ [0,Mk], represents that mk PEVs are in the “ON” state. The transition rate from the state mk to the state (mk − 1) is mkβk and the transition rate from the state mk to the state (mk + 1) is (Mk − mk)αk. Let P(mk) be the probability that mk PEVs are in the “ON” state which is given by:
In the following analysis, the CQoS control is modelled as a priority leaky bucket associated by a set of thresholds, denoted as T1 = ξ1EP, T2 = ξ2EP and T3 = ξ3EP where ξk is a threshold parameter defined as ξ1 > ξ2 > ξ3. Therefore, the CQoS scheme can be implemented using the following thresholds for the various schemes:
where Pt is the instant power consumption requested by all PEVs.
Figure 6.
Markov modulated process.

6.1. Analysis of the Controlled Priority Leaky Bucket
The fluid flow technique [25] is used in the performance analysis of the priority leaky bucket associated with a set of thresholds, in which the population of PEVs is assumed to be large. Considering that the number of PEVs with service charging scheme k in the “ON” state equals to mk, at time t. Hence, three elementary events can take place during the next interval Δt, (Δt << 1), i.e., a PEV changes its state from “OFF” to “ON” with a probability (Mk − mk)αkΔt, a PEV changes its state from “ON” to “OFF” with a probability mkβkΔt or a PEV remains in its state with a probability 1−[(Mk − mk)αk + βk]Δt. Now we define Fmk(t, x), mk, t ≥ 0, x ≥ 0, as the Cumulative Distribution Function (CDF) which presents the probability that at time t, mk PEVs are in the “ON” state and the actual power consumed by these PEVs does not exceed x. By taking into account the three elementary events that can take place during the next interval Δt, (Δt << 1), then we have:
where λmk = ckmk is the summation of power requested by mk PEVs, in which ck is the power requested by a single PEV with service scheme k and is the actual power consumed by PEVs which completed their services during (t, t + Δt). In Equation (3), the first term is the transition probability of PEVs from the state (mk − 1) to the state mk during (t, t + Δt), the second term is the transition probability of PEVs from the state mk to the state (mk + 1) during (t, t + Δt), the third term is the probability of PEVs remaining in the state mk during (t, t + Δt) and the last term O(Δt2) is the probability of the compound events such as a PEV changes its state more than one time during (t, t + Δt). It is clear that O(Δt2) goes to zero much rapidly than Δt when Δt approaches zero. Hence, the effects of O(Δt2) is negligible when Δt is small enough. In Equation (3), we also assume that 0 ≤ mk ≤ Mk, hence, both F−1(t, x) and FMk+1(t, x) are set to be equal to zero. Now we expandand and for Δx = (λmk − Cmk)Δt and in their respective Taylor series with the assumption that the appropriate continuity conditions are satisfied. Let Δt → 0 to compute the partial derivation of (3) for mk, that is:
where Fmk(x) denotes the equilibrium probability that PEVs are in the “ON” state under the condition that the total consumed power does not exceed x. Now, define , then Equation (4) can be expressed in the following matrix notation as:
where and Hk is the (Mk+1) × (Mk+1) is the tri-diagonal matrix shown below:
Assuming λmk − Cmk is not equal to zero for any mk, then the general solution of Equation (5) can be given by:
The elements in are the eigenvalues of the matrix (Dk)−1Hk and Vmk is the eigenvector of the same matrix. In Equation (6), the coefficients {amk} can be obtained from the boundary conditions by defining and . Therefore, the boundary conditions of the specified priority leaky bucket can be obtained as:
where P(mk) is the probability that mk PEVs are in the “ON” state as it was defined in Equation (1). Therefore, the service charging output Y1 of PEVs with service charging scheme 1 can be calculated as: [Request Arrival of CC service] − [Reject Rate of CC Service Due to Actual Power Rate Overflow with Boundary T1], that is:
Likewise, the service charging output Yk of PEVs with service scheme k = 2, 3, 4 can also be calculated as:
Hence, the charging service blocking probability due to actual power overload based on the corresponding threshold can be given by:
7. Numerical Results and Discussions
For illustrative purposes only, the priority leaky bucket of capacity EP kW is assumed to consist of three thresholds, T1, T2 and T3. We consider M = 5000 independent PEVs, which are divided into four CQoS schemes with arbitrary parameters γ1, γ2, γ3 and γ4 corresponding to service scheme 1, 2, 3 and 4, respectively. The number of PEVs with service charging scheme k is given by Mk = γkM, are assumed to be homogeneous and modelled by a multiple ON-OFF Markov modulated process with steady-state performance as shown in Figure 6. Hence, the average power load consumed by the PEVs utilizing a service charging scheme k is calculated by .
Given the various CQoS schemes, scheme 1 is obviously the most demanding scheme with the highest priority for charging. The demand from PEVs requesting this CQoS will have the greatest effect on the service provided to the other schemes. To investigate this, Figure 7a illustrates the effect of scheme 1 demand for service charge on the performance of the service charge blocking probability of scheme 2, 3 and 4 when the total average service charge load ranges from 0.7Ep to 0.9Ep, the average service charge load of scheme 1 is fixed at 0.10Ep and scheme 2, 3, 4 have equal arbitrary distribution service loads. The thresholds used for the CQoS priority control mechanism are fixed at T1 = 0.8Ep, T2 = 0.6Ep and T3 = 0.4Ep. It can be seen from Figure 7(a) that as the total service load increases, the service change blocking probability for scheme 2 is less than that of the case when no priority is applied. As for schemes 3 and 4, they experience worse performance with a service charge blocking probabilities approaching 100% for scheme 4 when the total service load is above 85%.
Figure 7(b) demonstrates the effects of the average service charging load of scheme 1 on the performance of the service charging blocking probability of scheme 2, 3 and 4, where the total average service charging load is fixed at 0.8Ep. It can be seen that the service charging load of scheme 1 has a significant effect on the performance of the service blocking probability of the other schemes. For example, increasing the demand of scheme 1 from 0.10Ep to 0.15Ep, correspondingly, increases the service charge blocking probability for scheme 2 from 3.75 × 10⁻³ to 4.02 × 10⁻². By comparison, the service charge blocking probability for scheme 3 increases from 0.42 to 0.57 and for scheme 4, increases from 0.96 to 0.98. This indicates that changes in the scheme 1 load has more negative effect on the service provided to PEVs being charged using scheme 2 and less effect on the services provided to PEVs being serviced using the other schemes.
The use of a priority threshold control mechanism guarantees the service demanded by PEVs utilizing scheme 1 and 2. However, such guarantees are gained as a trade off with a much higher service charge blocking probability for scheme 3 and 4. This can help energy service providers to provide PEV charging service options and predict relative service blocking rates for customers ahead of time allowing them to choose when to charge and which service to use without causing an overload of the system. However, energy service providers need to control the total power assigned to scheme 1 and 2 by limiting the number of PEVs in these categories to achieve the best overall performance. This will be addressed in our future work which will focus on the design of cost functions to be used with the various schemes in order to optimize the overall system performance.
Figure 7.
The effect of total service load and scheme 1 on the service charge of scheme 2, 3, and 4. (a) Effect of increasing the overall service load on the various schemes, when the service load of scheme 1 is 0.10Ep; (b) Effect of increasing the service demand of scheme 1 on the other schemes when the total service load is 0.8Ep.

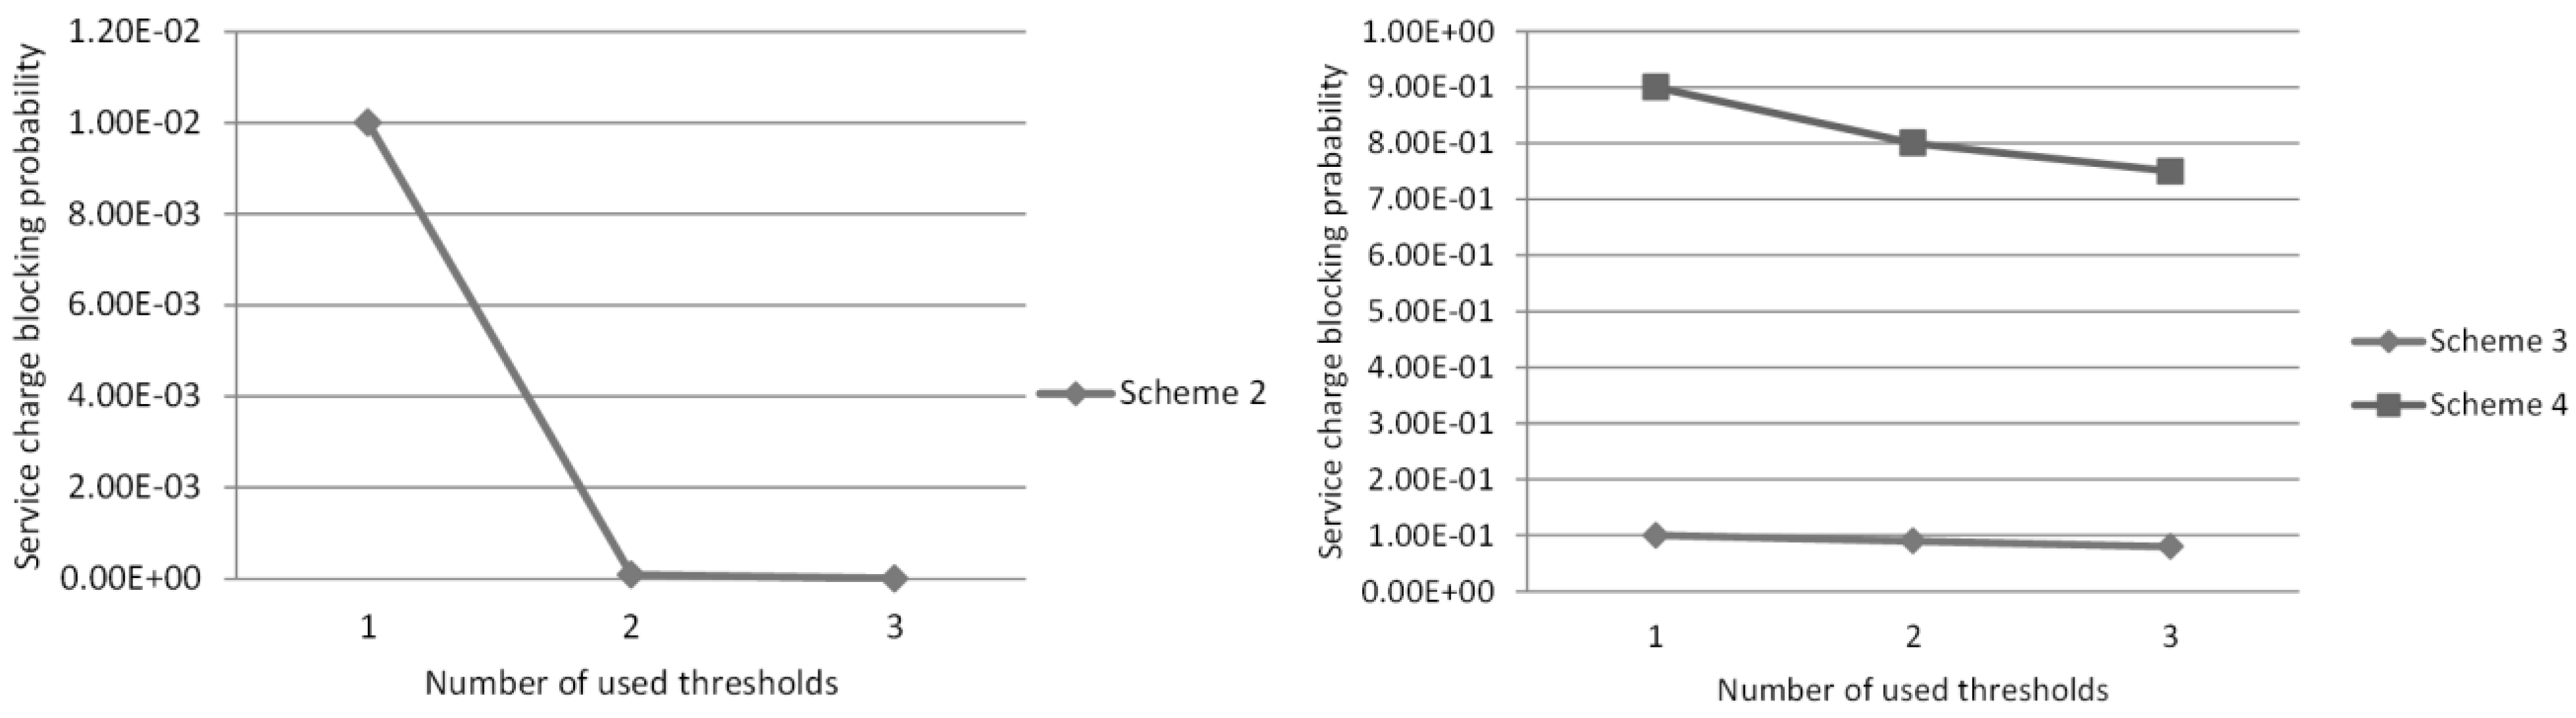
To look at the effect of thresholds for the priority control, Figure 8 shows the service charge blocking probability for different number of chosen thresholds where the service load of scheme 1 is fixed at 0.15Ep, the total service load is 0.65Ep and the service loads for scheme 2, 3 and 4 were arbitrary equally distributed. Two options are considered. In the first option, only two thresholds are considered, that is T1 = 0.8Ep, while T2 = 0.4Ep. In this case,
Likewise, in the second option, three thresholds are considered as T1 = 0.8Ep, T2 = 0.6Ep and T3 = 0.4Ep. In this case,
The results obtained from Figure 8 indicate how allocating resources properly through thresholds can affect the overall performance of the various schemes in terms of providing the needed service. It can be seen that using more thresholds is able to provide better distribution of services to PEVs with lower priorities than scheme 1 by reducing their service charge blocking probability.
Figure 8.
Effect of changing the number of thresholds on the service charge blocking probability of different CQoS schemes when fixing the service load of scheme 1 at 0.15Ep and the total service load at 0.65Ep.
Figure 8.
Effect of changing the number of thresholds on the service charge blocking probability of different CQoS schemes when fixing the service load of scheme 1 at 0.15Ep and the total service load at 0.65Ep.
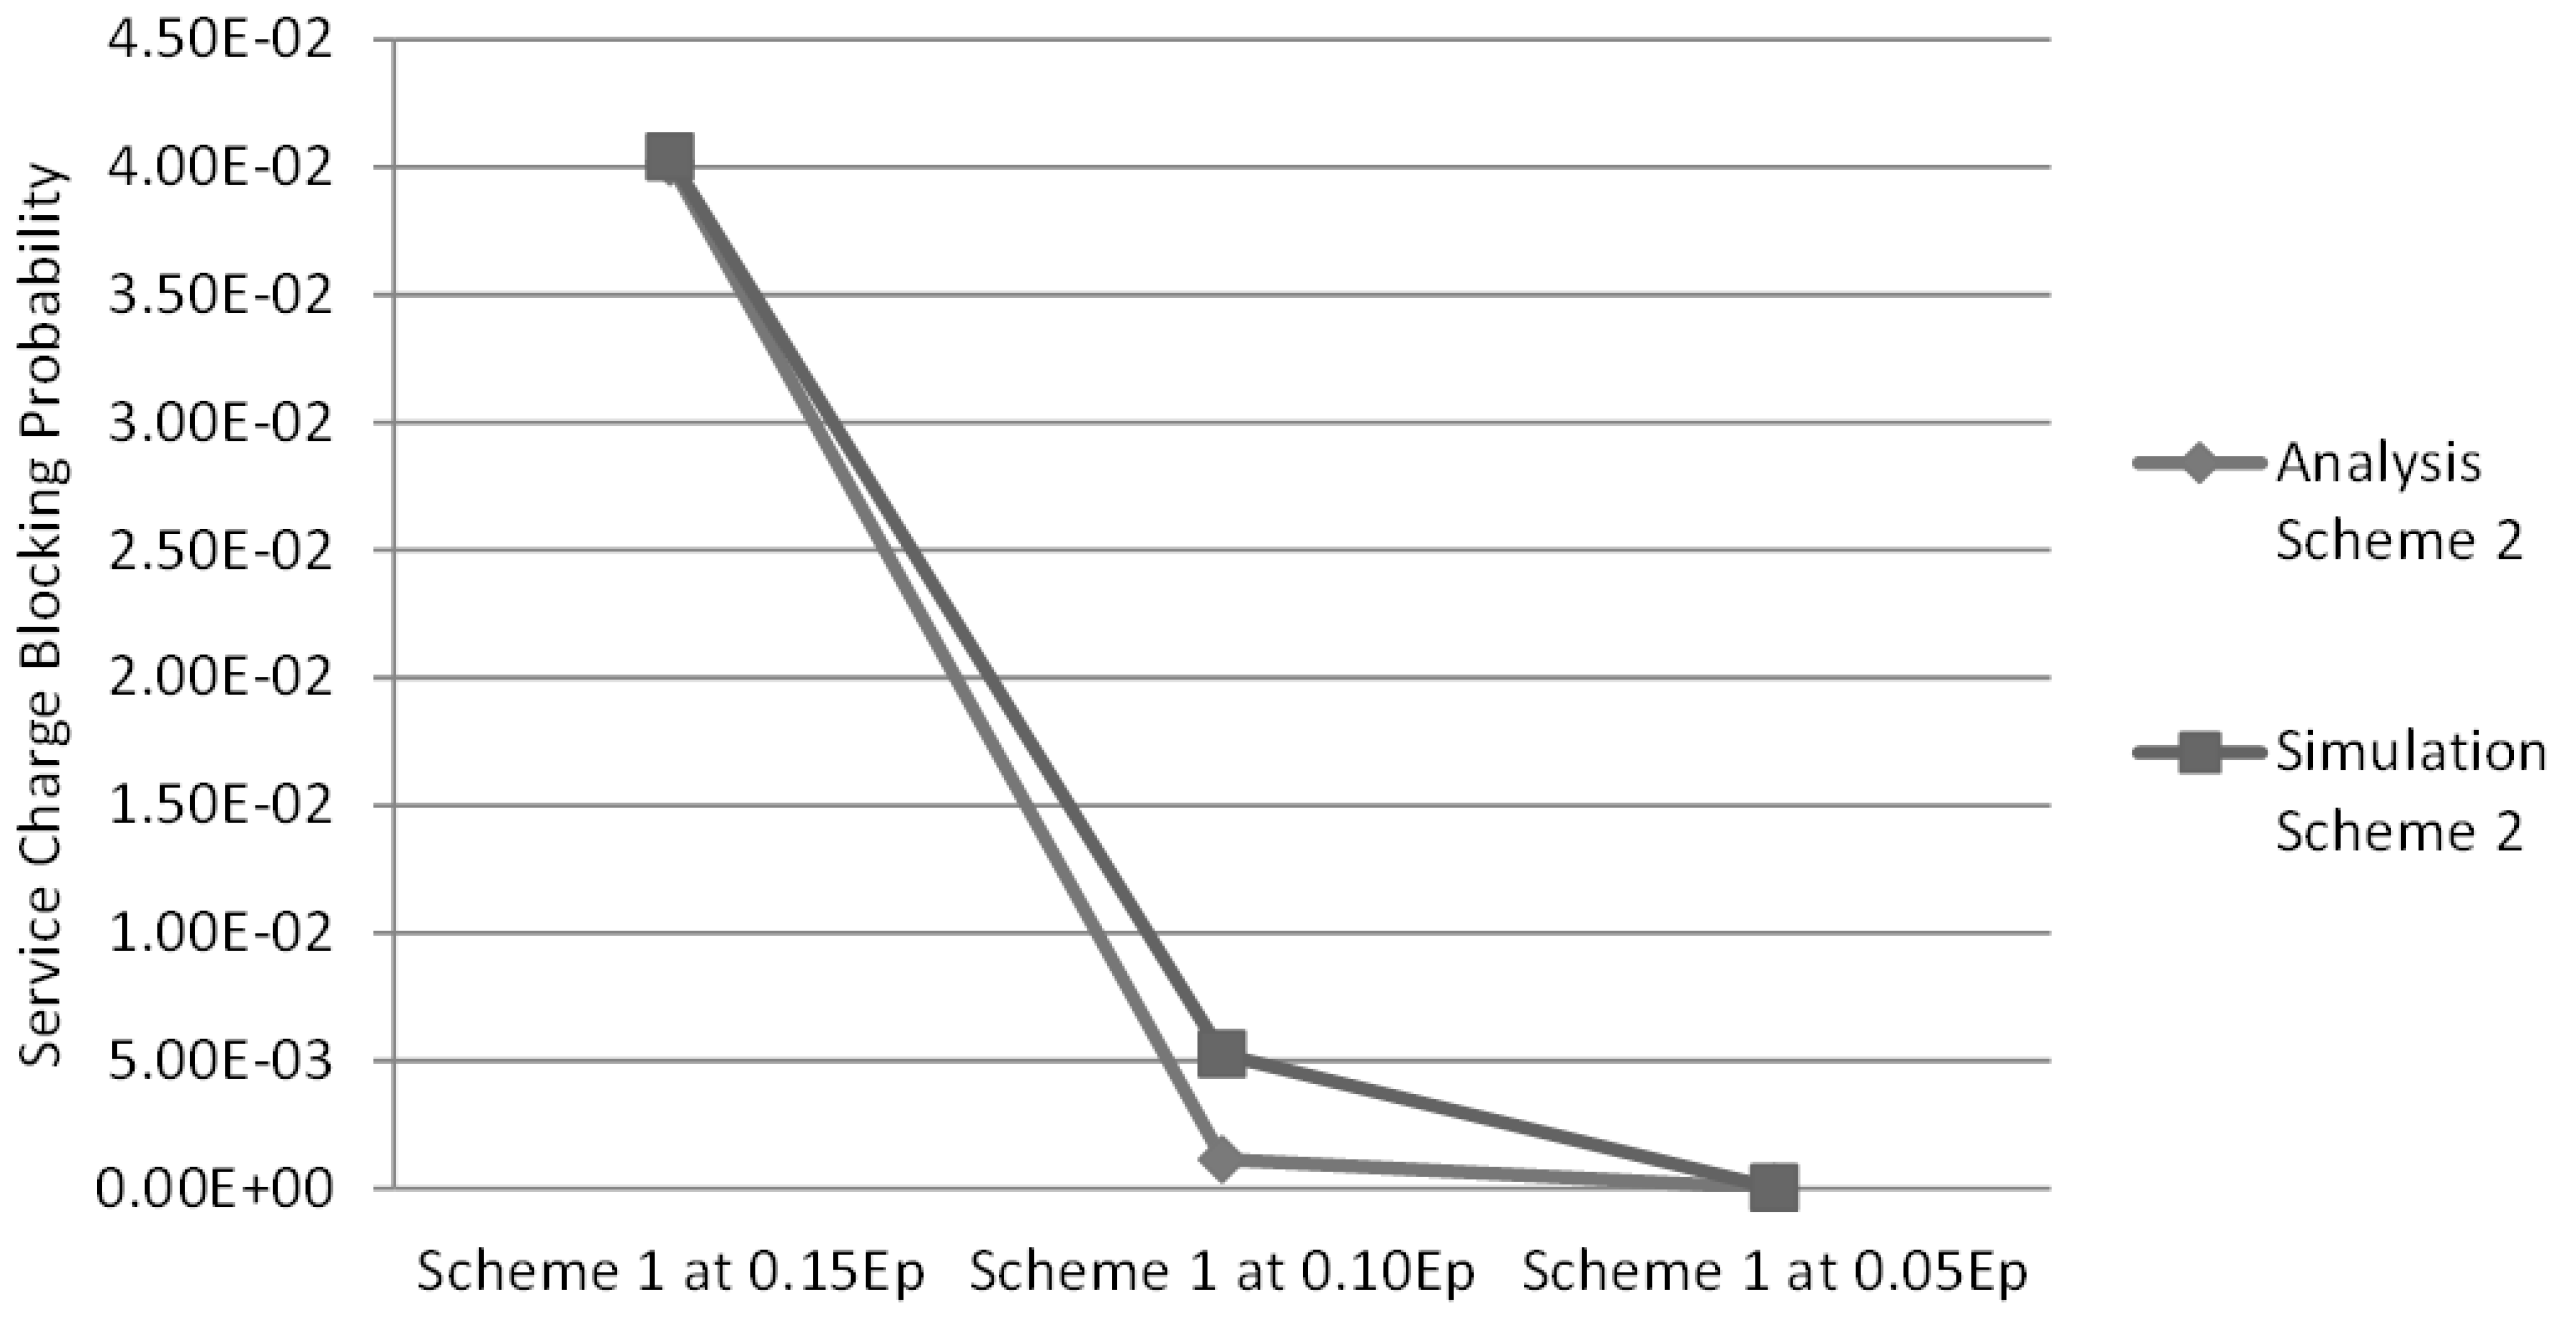
Finally, simulation runs have also been used to verify the obtained analytical results. The simulation model and the relevant parameters are the same as those used for the numerical analysis. A number of independent simulation runs were conducted using Matlab. Each simulation run consisted of 108 time slots plus a warm up period of 1000 time slots. Figure 9 shows an example of how the results obtained from the simulation are a good match to the numerical results.
Figure 9.
An example of analysis versus simulation results for the service load of 0.8Ep.

Given the proposed charging approach and the analytical results above, energy service providers can develop and deploy schemes for charging PEVs and link that to their supply and demand strategies through which they can aim to satisfy their consumers while protecting their infrastructure. In addition, PEV charging stations can utilize the proposed scheme to maximize their utilization and to gain customer satisfaction by providing different types of services.
As with any other proposed new approach, there are associated advantages and disadvantages. One of the main advantages of our proposed approach is the availability of four different charging schemes for PEV owners to choose from, based on their own preferred criteria such as price, time and place. Another advantage is that with proper communication a PEV owner will be able to choose a charging station based on the availability of resources and services ahead of time. For example, a PEV owner can subscribe to a web based mobile service to receive updates on the location and availability of services and resources based on certain preferences. Another example would be the possibility of reserving resources at a particular service station ahead of time based on the continuous charging scheme. In this case, a PEV will be entitled for service upon arrival regardless of any other conditions. With regards to service providers such as charging stations, dynamic pricing models can be developed to maximize their profits. In addition, utility companies will be able to effectively monitor and predict any additional load caused by PEVs and level that off. On the other hand, the proposed approach has the disadvantage of not incorporating V2G as part of the modelling and performance analysis. V2G can be incorporated based on a feedback component as part of the proposed model which will be addressed in our future work.
8. Conclusions
In this paper we have introduced the concept of priority-based CQoS to differentiate between the various possible charging schemes of PEVs in a Smart Grid environment where a smart electric plug is considered to be available. First we introduced the motivation behind using the CQoS concept and then investigated its possible performance if applied by the energy service providers. Examples are provided to show the effectiveness of the proposed scheme in controlling the load profile of a distribution sub-station. The performance conducted through numerical analysis and simulation showed how a priority threshold controlled leaky bucket approach can be used to regulate the charging service provided to PEVs and how the most demanding charging scheme, CC, can affect the charging services provided to other less prioritized charging schemes per the proposed charging methodologies.
Acknowledgments
This research was partially funded by the UAEU NRF Research Grant 21T023.
References
- Howard, D; Byron, F. SCADA Integrated with Transformer Monitoring Systems over a Secure Wireless Ethernet. In Proceedings of 15th Annual DistribuTECH Conference, San Diego, CA, USA, 25–27 January 2005.
- Electric Vehicle Charging Infrastructure Deployment Guidelines for British Columbia; Technical Report prepared by the Electric Transportation Engineering Corporation; ECOtality, Inc.: San Francisco, CA, USA, July 2009.
- Electric Drive Transportation Association (EDTA). Are US Drivers Beginning to Get Switched on to Electric Cars? Available online: http://www.electricdrive.org/index.php?ht=display/ReleaseDetails/i/15135/pid/2327 (accessed on 12 November 2012).
- Sikes, K.; Gross, T.; Lin, Z.; Sullivan, J.; Cleary, T.; Ward, J. Plug-in Hybrid Electric Vehicle Market Introduction Study: Final Report; Technical Report for Oak Ridge National Laboratory: Oak Ridge, TN, USA, 2010. [Google Scholar]
- Masoum, A.S.; Deilami, S.; Moses, P.S.; Abu-Siada, A. Impacts of Battery Charging Rates of Plug-in Electric Vehicle on Smart Grid Distribution Systems. In Proceedings of the IEEE Innovative Smart Grid Technologies Conference Europe, Gothenburg, Sweden, 11–13 October 2010.
- Su, W.C.; Chow, M.Y. Performance Evaluation of an EDA-Based Large-Scale Plug-in Hybrid Electric Vehicle Charging Algorithm. IEEE Trans. Smart Grid 2012, 3, 308–315. [Google Scholar] [CrossRef]
- Gormus, S.; Kulkarni, P.; Fan, Z. The Power of Networking: How Networking Can Help Power Management. In Proceedings of the 1st IEEE International Conference on Smart Grid Communications, Gaithersburg, MD, USA, 6–8 October 2010.
- Kabisch, S.; Schmitt, A.; Winter, M.; Heuer, J. Interconnections and Communications of Electric Vehicles and Smart Grids. In Proceedings of the 1st IEEE International Conference on Smart Grid Communications, Gaithersburg, MD, USA, 6–8 October 2010.
- Turitsyn, K.; Sinitsyn, N.; Backhaus, S.; Chertkov, M. Robust Broadcast-Communication Control of Electric Vehicle Charging. In Proceedings of the 1st IEEE International Conference on Smart Grid Communications, Gaithersburg, MD, USA, 6–8 October 2010.
- Masoum, A.S.; Deilami, S.; Moses, P.S.; Abu-Siada, A. Impact of plug-in electrical vehicles on voltage profile and losses of residential system. In Proceedings of Australasian Universities Power Engineering Conference, Christchurch, New Zealand, 5–8 December 2010.
- Lu, L.R.; Wen, F.S.; Ledwich, G.; Huang, J.S. Unit commitment in power systems with plug-in hybrid electric vehicles. Euro. Trans. Electr. Power. 2012. [Google Scholar] [CrossRef]
- Bordeau, K.; Parker, G.; Vosters, G.; Weaver, W.; Kelly, J.; Wilson, D.G.; Robinett, R.D., III. Distributed Control of Plug-in Hybrid Electric Vehicles on a Smart Grid. In Proceedings of 2012 International Symposium on Power Electronics, Electrical Drives, Automation and Motion, Sorrento, Italy, 20–22 June 2012.
- Venables, M. Plug-in power. IET Eng. Technol. 2011, 6, 79–81. [Google Scholar] [CrossRef]
- Hochgraf, C.; Tripathi, R. Smart Grid Charger for Electric Vehicles Using Existing Cellular Networks and SMS text Messages. In Proceedings of the 1st IEEE International Conference on Smart Grid Communications, Gaithersburg, MD, USA, 6–8 October 2010.
- Ili, M.D. Fundamental engineering problems and opportunities in operating power transmission grids of the future. Intern. J. Electr. Power Energy Syst. 1995, 17, 207–214. [Google Scholar] [CrossRef]
- Ali, M.; Dong, Z.Y.; Zhang, P. Adoptability of grid computing technology in power systems analysis, operations and control. IET Gener. Transm. Distrib. 2009, 3, 949–959. [Google Scholar] [CrossRef]
- Pradeepa, Y.; Seshurajub, P.; Khapardea, S.A.; Joshib, R.K. Flexible open architecture design for power system control centers. Intern. J. Electr. Power Energy Syst. 2011, 33, 976–982. [Google Scholar] [CrossRef]
- Demirci, T.; Kalaycıog, A.; Kucuk, D.; Salor, O.; Guder, M.; Pakhuylu, S.; Atalık, T.; Inan, T.; Cadırcı, I.; Akkaya, Y.; Bilgen, S.; Ermis, M. Nationwide real-time monitoring system for electrical quantities and power quality of the electricity transmission system. IET Gener. Transm. Distrib. 2011, 5, 540–550. [Google Scholar] [CrossRef]
- Davies, S. Internet of energy [smart grid security]. IET Eng. Technol. 2010, 5, 42–45. [Google Scholar]
- AADC is the local power and water distribution company in Al-Ain city, UAE.
- Marchese, M. QoS over Heterogeneous Networks; John Wiley & Sons: New York, NY, USA, 2007. [Google Scholar]
- Sortomme, E.; El-Sharkawi, M.A. Optimal Charging Strategies for Unidirectional Vehicle-to-Grid. IEEE Trans. Smart Grid 2011, 2, 131–138. [Google Scholar] [CrossRef]
- Beer, S.; Gomez, T.; Dallinger, D.; Momber, I.; Marnay, C.; Stadler, M.; Lai, J. An Economic Analysis of Used Electric Vehicle Batteries Integrated Into Commercial Building Microgrids. IEEE Trans. Smart Grid 2012, 3, 517–525. [Google Scholar] [CrossRef]
- Hirano, M.; Watanabe, N. Characteristics of a Cell Multiplexer for Bursty ATM Traffic. In Proceedings of IEEE International Conference on Communications: World Prosperity Through Communications, Boston, MA, USA, 11–14 June 1989; pp. 399–403.
- McDysan, D.E.; Spohn, D.L. ATM: Theory and Application; McGraw Hill: New York, NY, USA, 1994. [Google Scholar]
© 2012 by the authors; licensee MDPI, Basel, Switzerland. This article is an open access article distributed under the terms and conditions of the Creative Commons Attribution license (http://creativecommons.org/licenses/by/3.0/).
Share and Cite
MDPI and ACS Style
Shuaib, K.; Zhang, L.; Gaouda, A.; Abdel-Hafez, M. A PEV Charging Service Model for Smart Grids. Energies 2012, 5, 4665-4682. https://doi.org/10.3390/en5114665
AMA Style
Shuaib K, Zhang L, Gaouda A, Abdel-Hafez M. A PEV Charging Service Model for Smart Grids. Energies. 2012; 5(11):4665-4682. https://doi.org/10.3390/en5114665
Chicago/Turabian StyleShuaib, Khaled, Liren Zhang, Ahmed Gaouda, and Mohammed Abdel-Hafez. 2012. "A PEV Charging Service Model for Smart Grids" Energies 5, no. 11: 4665-4682. https://doi.org/10.3390/en5114665