Article

Exergy Analysis of an Intermediate Temperature Solid Oxide Fuel Cell-Gas Turbine Hybrid System Fed with Ethanol

by
Anastassios Stamatis
,
Christina Vinni
,
Diamantis Bakalis
,
Fotini Tzorbatzoglou
and
Panagiotis Tsiakaras
*
Department of Mechanical Engineering, School of Engineering, University of Thessaly, Pedion Areos, 38334, Greece
*
Author to whom correspondence should be addressed.
Energies 2012, 5(11), 4268-4287; https://doi.org/10.3390/en5114268
Submission received: 10 July 2012 / Revised: 24 September 2012 / Accepted: 18 October 2012 / Published: 24 October 2012
(This article belongs to the Special Issue Hydrogen Energy and Fuel Cells)

Abstract

:
In the present work, an ethanol fed Solid Oxide Fuel Cell-Gas Turbine (SOFC-GT) system has been parametrically analyzed in terms of exergy and compared with a single SOFC system. The solid oxide fuel cell was fed with hydrogen produced from ethanol steam reforming. The hydrogen utilization factor values were kept between 0.7 and 1. The SOFC’s Current-Volt performance was considered in the range of 0.1–3 A/cm2 at 0.9–0.3 V, respectively, and at the intermediate operating temperatures of 550 and 600 °C, respectively. The curves used represent experimental results obtained from the available bibliography. Results indicated that for low current density values the single SOFC system prevails over the SOFC-GT hybrid system in terms of exergy efficiency, while at higher current density values the latter is more efficient. It was found that as the value of the utilization factor increases the SOFC system becomes more efficient than the SOFC-GT system over a wider range of current density values. It was also revealed that at high current density values the increase of SOFC operation temperature leads in both cases to higher system efficiency values.

1. Introduction

The majority of current energy needs is supplied by combustion of non-renewable energy sources such as fossil fuels, which is associated with the release of large quantities of greenhouse gases, especially carbon dioxide (CO2), and other harmful emissions to the atmosphere. Energy demand is increasing at an exponential rate, leading to a gradual depletion of the fossil fuels. This fact, combined with the efforts against pollution and greenhouse gas emissions, has led to considerable interest in using alternative sources of energy [1].
An answer to the above consideration could be hydrogen, which is considered to be the energy carrier of the future as it can play a major role in reducing harmful environmental emissions [2]. Nevertheless, nowadays most of hydrogen produced derives from fossil-based materials. Therefore, a renewable and clean energy source for hydrogen production seems to be necessary. Ethanol is a promising source of hydrogen as it is produced from biomass in a renewable way providing a closed carbon loop. Moreover ethanol has high hydrogen content and low toxicity [3].
The hydrogen produced from ethanol can be fed to alternative energy conversion systems such as fuel cells. It is well known that fuel cells are electrochemical devices that can directly convert chemical energy (i.e., hydrogen) into electricity. Solid Oxide Fuel Cells (SOFCs) are currently the highest-temperature fuel cell in development and can be operated over a temperature range from 800 to 1100 °C so as to be highly efficient. During the last few years, many theoretical studies have appeared in the literature concerning Solid Oxide Fuel Cell systems [4,5,6,7] and Solid Oxide Fuel Cell combined with Gas Turbine (SOFC-GT) power cycles [8,9,10,11,12,13,14,15]. Most of these works have been devoted to high temperature SOFC systems fuelled by methane [12,13] and only very few of them concerned ethanol-fed SOFC-GT systems [14].
Srisiriwat [16] proposed a high temperature (1200 K) operation SOFC-GT combined system, integrated with an autothermal reformer and fed with ethanol for power generation. Also, Cocco et al. [17] demonstrated that alternative hydrogen carriers such as ethanol are very attractive fuels for SOFC-GT systems. Douvartzides et al. [18] tried to optimize ethanol-fed SOFC-based systems in terms of energy and exergy. Thermodynamic analysis for a solid oxide fuel cell with direct internal reforming fueled by ethanol has been performed in [19]. Performance of ethanol-fuelled solid oxide fuel cells was also investigated in terms of conductors used [20]. Casas et al. [21] recently studied a SOFC system integrated with an ethanol steam reforming unit using detailed model of all components of the plant, with a special attention to the kinetics of the ethanol steam reforming. Zhe et al. [22] also studied an ITSOFC co-generation system fueled by ethanol. Nevertheless, all the above works are based on theoretical models for the prediction of fuel cell performance. Low and intermediate temperature SOFCs have received considerable attention recently due to the improved stability, reliability and reduced cost. Moreover, SOFCs’ operation at lower temperatures could: (a) enable the use of inexpensive metal components as inter-connects, (b) enhance the stability and durability of all the components and (c) offer the potential of more rapid start-up and shutdown procedure [23].
Taking into consideration that novel materials have recently been developed for intermediate temperature solid oxide fuel cells (with peak power density of ~1 W/cm2 at 600 °C [24]), in the present investigation a mathematical model has been developed. The model simulates—from energy and exergy point of view—the operation of an intermediate temperature solid oxide fuel cell integrated with a conventional gas turbine (IT-SOFC-GT). It is the first time to our knowledge that experimental results for an intermediate temperature fuel cell performance taken from the open literature are used. Another aspect of this work is the exergetic comparison of a single ITSOFC system with an ITSOFC-GT system in order to investigate operating conditions where a hybrid system prevails in terms of efficiency.

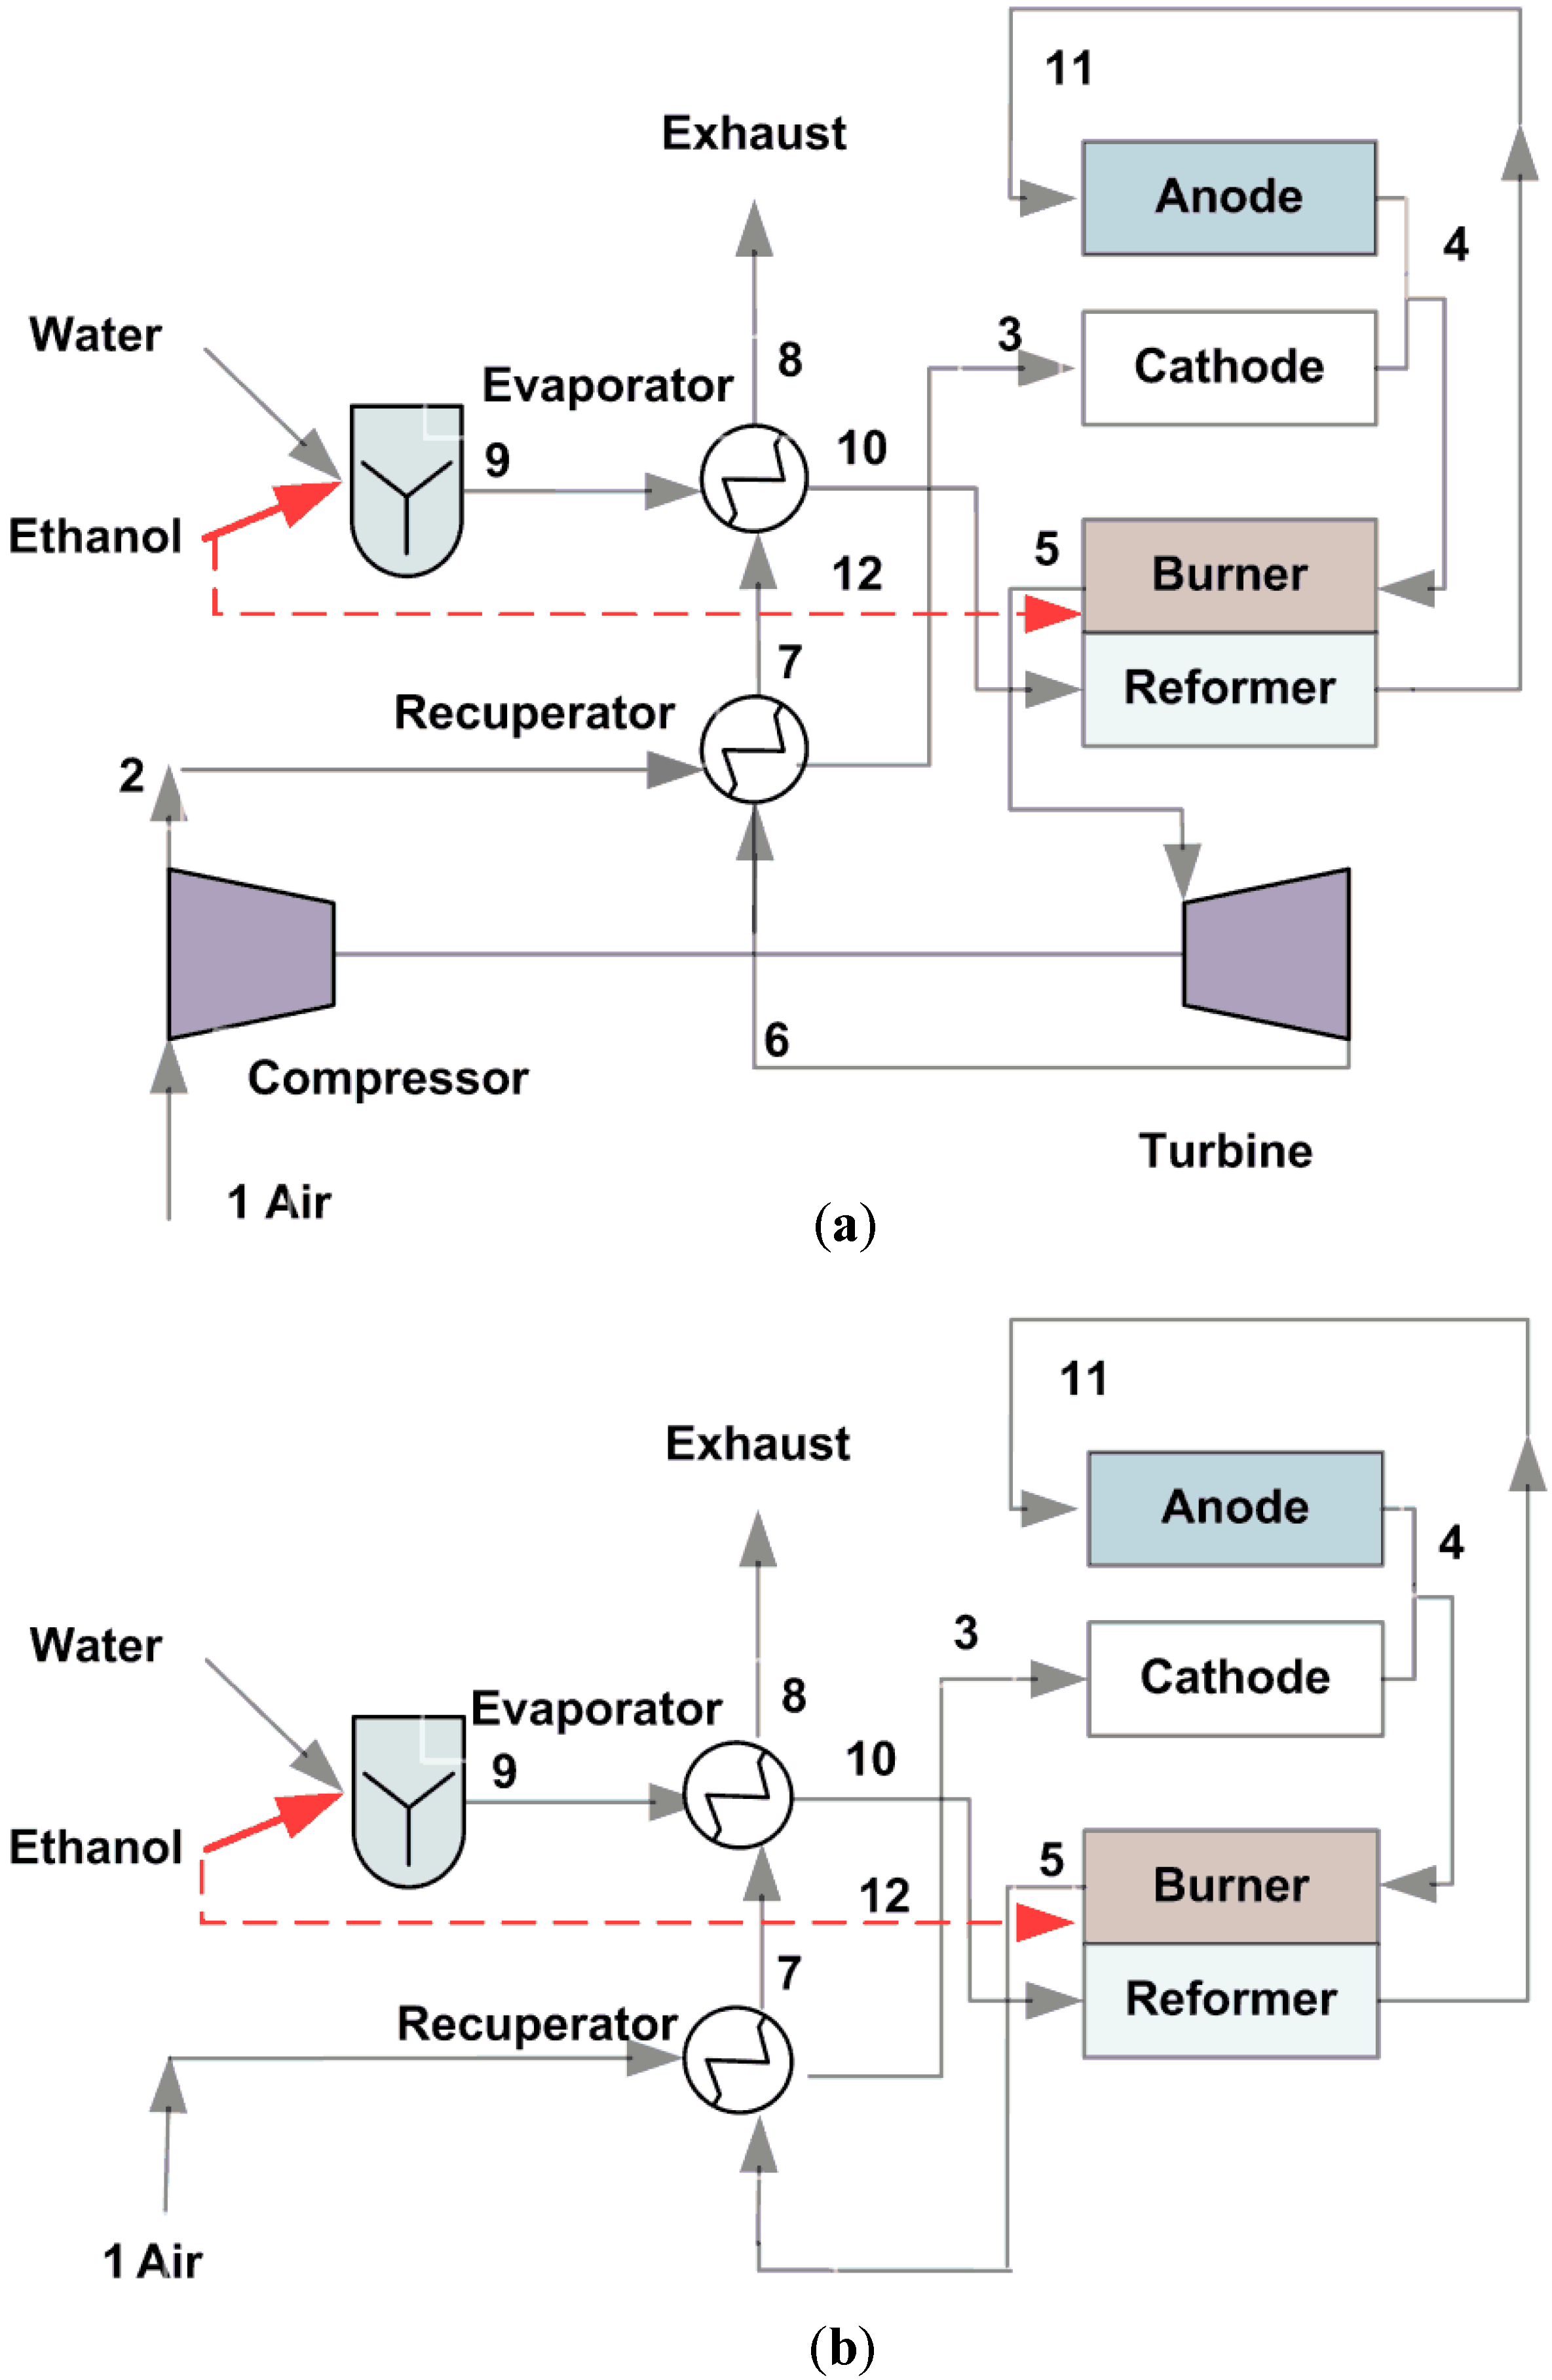
2. Systems Description

In the present work two different configurations were analyzed and compared in terms of exergy efficiency: (a) a SOFC-GT system consisted of a SOFC stack, a compressor, a recuperator, a burner-reformer device, an evaporator and a turbine and (b) a single SOFC system consisting of a SOFC stack, a recuperator, a burner-reformer device and an evaporator. The considered configurations for both systems are presented in Figure 1.
Figure 1. Systems’ configurations (a) SOFC-GT and (b) SOFC.
Energies 05 04268 g001
In the SOFC-GT system: air (1) is firstly compressed, (2) then is preheated at the recuperator at the operating temperature of the fuel cell (3) and enters the SOFC stack’s cathode. A liquid ethanol and water mixture (9), after being evaporated (10), enters the reformer where ethanol is completely externally reformed and converted into hydrogen rich gas (11) and then enters the SOFC stack’s anode. In the fuel cell the electrochemical reaction where heat and electricity are produced takes place. The fuel cell’s products (4) enter the burner where the un-reacted hydrogen is burnt. As additional heat is required for the operation of the plant additional ethanol is separately fed into the burner and is directly combusted. The hot exhaust burner-reformer’s products (5) are then expanded through the turbine. Finally, the exhaust gas (6) provides the heat required for (i) the inlet air preheated in the recuperator (7) and (ii) the liquid mixture evaporating in the evaporator, and then is discharged to the environment (8). The operation of the single SOFC system is similar. In this case the inlet air is preheated without being compressed, while the exhaust burner’s product is directly fed to the recuperator.

3. System Modeling

The thermodynamic properties of each compound of the gas streams for any operating point of the system are calculated using interpolation of thermodynamic tables [25]. The system is fed with ethanol and water (1:3) both in liquid phase and ambient temperature. Inlet air was considered as an ideal gas consisting of 21% O2 and 79% N2. All exhaust products were also considered as ideal gases and their composition was calculated taking into account the reactions occurred in each position. The programming environment was MATLAB. Simplified models similar to the ones used in references [26,27,28] have been used for the turbo machines as well as for heat exchangers, since the focus was given to compare the exergetic performance of a SOFC alone or incorporated with a GT rather than to investigate part load behavior of a SOFC-GT system.

3.1. Solid Oxide Fuel Cell

Although SOFC is fed with a mixture of H2, CO2 and H2O, H2 is the only reacting component with a Lower Heating Value (LHVH2) of 121,000 kJ/kg calculated from the reaction of hydrogen combustion applying thermodynamic rules [29].
The reactions taking place are:
Anode Reaction: 2H2 + 2O2− → 2H2O + 4e
Cathode Reaction: O2 + 4e → 2O2−
Overall Cell Reaction: 2H2 + O2 → 2H2O
Defining the current density i as electron transfer rate per unit activation area of the fuel cell, V the cell voltage and AC the activation area, the fuel cell power can be calculated through the relation:
W ˙ F C = i V A C
The stoichiometric amounts of air and hydrogen mass flows in the systems examined are calculated through the following relations [30]:
m ˙ a i r , s t o i c = 3.57 × 10 7 W ˙ F C V
m ˙ H 2 , c o n s u m e d = 1.05 × 10 8 W ˙ F C V
Since hydrogen from the fuel and oxygen from the air are not completely consumed by the electrochemical reactions, the actual mass flows of fuel (anode inlet) and air (cathode inlet) can be determined from the fuel (Uf) and air (Ua) utilization factors expressed as below:
U a = m ˙ O 2 , c o n s u m e d m ˙ O 2 , i n = m ˙ a i r , s t o i c m ˙ a i r
U f = m ˙ H 2 , c o n s u m e d m ˙ H 2 , i n
Utilization (U) refers to the fraction of the total fuel or oxidant introduced into a fuel cell that reacts electrochemically. The amount of hydrogen (produced in reformer device) that is electrochemically oxidized in fuel cell is related to the fuel utilization factor (Uf) and produces heat and electrical power. Through this reaction oxygen from air is consumed, water is produced and the unreacted hydrogen is directed to the burner device. Applying the first Law of Thermodynamics to the SOFC device, an energy balance relationship results, as presented in Equation (9):
H 3 + H 11 + U f m ˙ H 2 L H V H 2 H 4 W ˙ F C = 0
where:
Energies 05 04268 i001
Energies 05 04268 i002
Energies 05 04268 i003

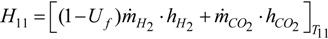
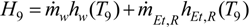
3.2. Burner-Reformer

The preferred ethanol steam reforming process is represented by the following endothermic reaction with the formation of CO2 as the desired product:
C2H5OH + 3H2O → 2CO2 + 6H2 − 173 kJ/kmol
At the chosen temperature values (550 and 600 °C) the conversion of the above reaction reaches the thermodynamically predicted values [31]. The analysis of the ethanol reforming process, which is very complex, can be greatly simplified, from the computational point of view, assuming that the ethanol steam reforming reaction is driven to completion. It is possible to use such simplification because the hydrogen produced by the reforming reactions is consumed by the electrochemical reaction and because of the high value of its equilibrium constant in the operating conditions considered [32]. In fact many studies have shown that the ethanol steam reforming reaction is driven to completion using appropriate catalysts [33,34,35].
The hydrogen produced in the reformer is consumed at the fuel cell for the production of electricity. The un-reacted hydrogen (in case of Uf < 1) reaches the burner where it is oxidized producing thermal energy. When necessary, ethanol can also be oxidized in the burner device to satisfy the required thermal energy needs:
C2H5OH + 3O2 → 2CO2 + 3H2O + 1234,855 kJ/mol
The produced thermal energy is calculated through Equation (15):
Energies 05 04268 i004
Part of the thermal energy produced from this process is required for ethanol steam reforming and is given through the following relation:
Q ˙ R = m ˙ E T , R Δ H E T , R
The energy balance for the Burner-Reformer lumped device can be expressed as:
H 4 * H 5 + Q ˙ B Q ˙ R = 0
where:
Energies 05 04268 i005
Energies 05 04268 i006
and * refers to the resulting composition after the reactions have taken place in the burner and the mixture is in equilibrium.

3.3. Compressor

The isentropic efficiency of the compressor in the SOFC-GT system is defined as follows:
η C = h a ( T 2 s ) h a ( T 1 ) h a ( T 2 ) h a ( T 1 )
where T2s represents the ideal (isentropic) temperature corresponding to pressure P2:
s a ( T 2 s ) s a ( T 1 ) = 0
and the compressor’s power consumption is calculated from Equation (22):
W ˙ C = m ˙ a ( h a ( T 2 ) h a ( T 1 ) )

3.4. Turbine

The turbine isentropic efficiency is defined from Equation (23):
η T = h g ( T 5 ) h g ( T 6 ) h g ( T 5 ) h g ( T 6 s )
where T6s is the ideal (isentropic) temperature:
s g ( T 6 s ) s g ( T 5 ) = 0
and the turbine generated power is calculated from Equation (25):
W ˙ T = m ˙ g ( h g ( T 5 ) h g ( T 6 ) )

3.5. Recuperator

The recuperator effectiveness is defined as the heat that is actually transferred to the maximum heat that could be transferred given through the simplified relation:
ε R e c = T 3 T 2 T 6 T 2
It is assumed that heat transfer from the recuperator to environment is negligible so the energy balance is:
Energies 05 04268 i007

3.6. Evaporator

The evaporator is modeled through equations similar to the ones used in the recuperator device:
ε E v = T 10 T 9 T 7 T 9
Energies 05 04268 i008
Energies 05 04268 i009
Energies 05 04268 i010

3.7. Simulation of the Systems

In order to simulate the operation of the SOFC-GT plant, Equations (4)–(31) are used, while for the simulation of the SOFC plant operation, the same equations are used except from Equations (20)–(25) that concern the compressor and the turbine.
From both examined systems, the overall work output that is finally utilized is given from the following equations:
Energies 05 04268 i011
Energies 05 04268 i012
where ηAC represents the AC inverter efficiency.

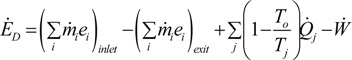
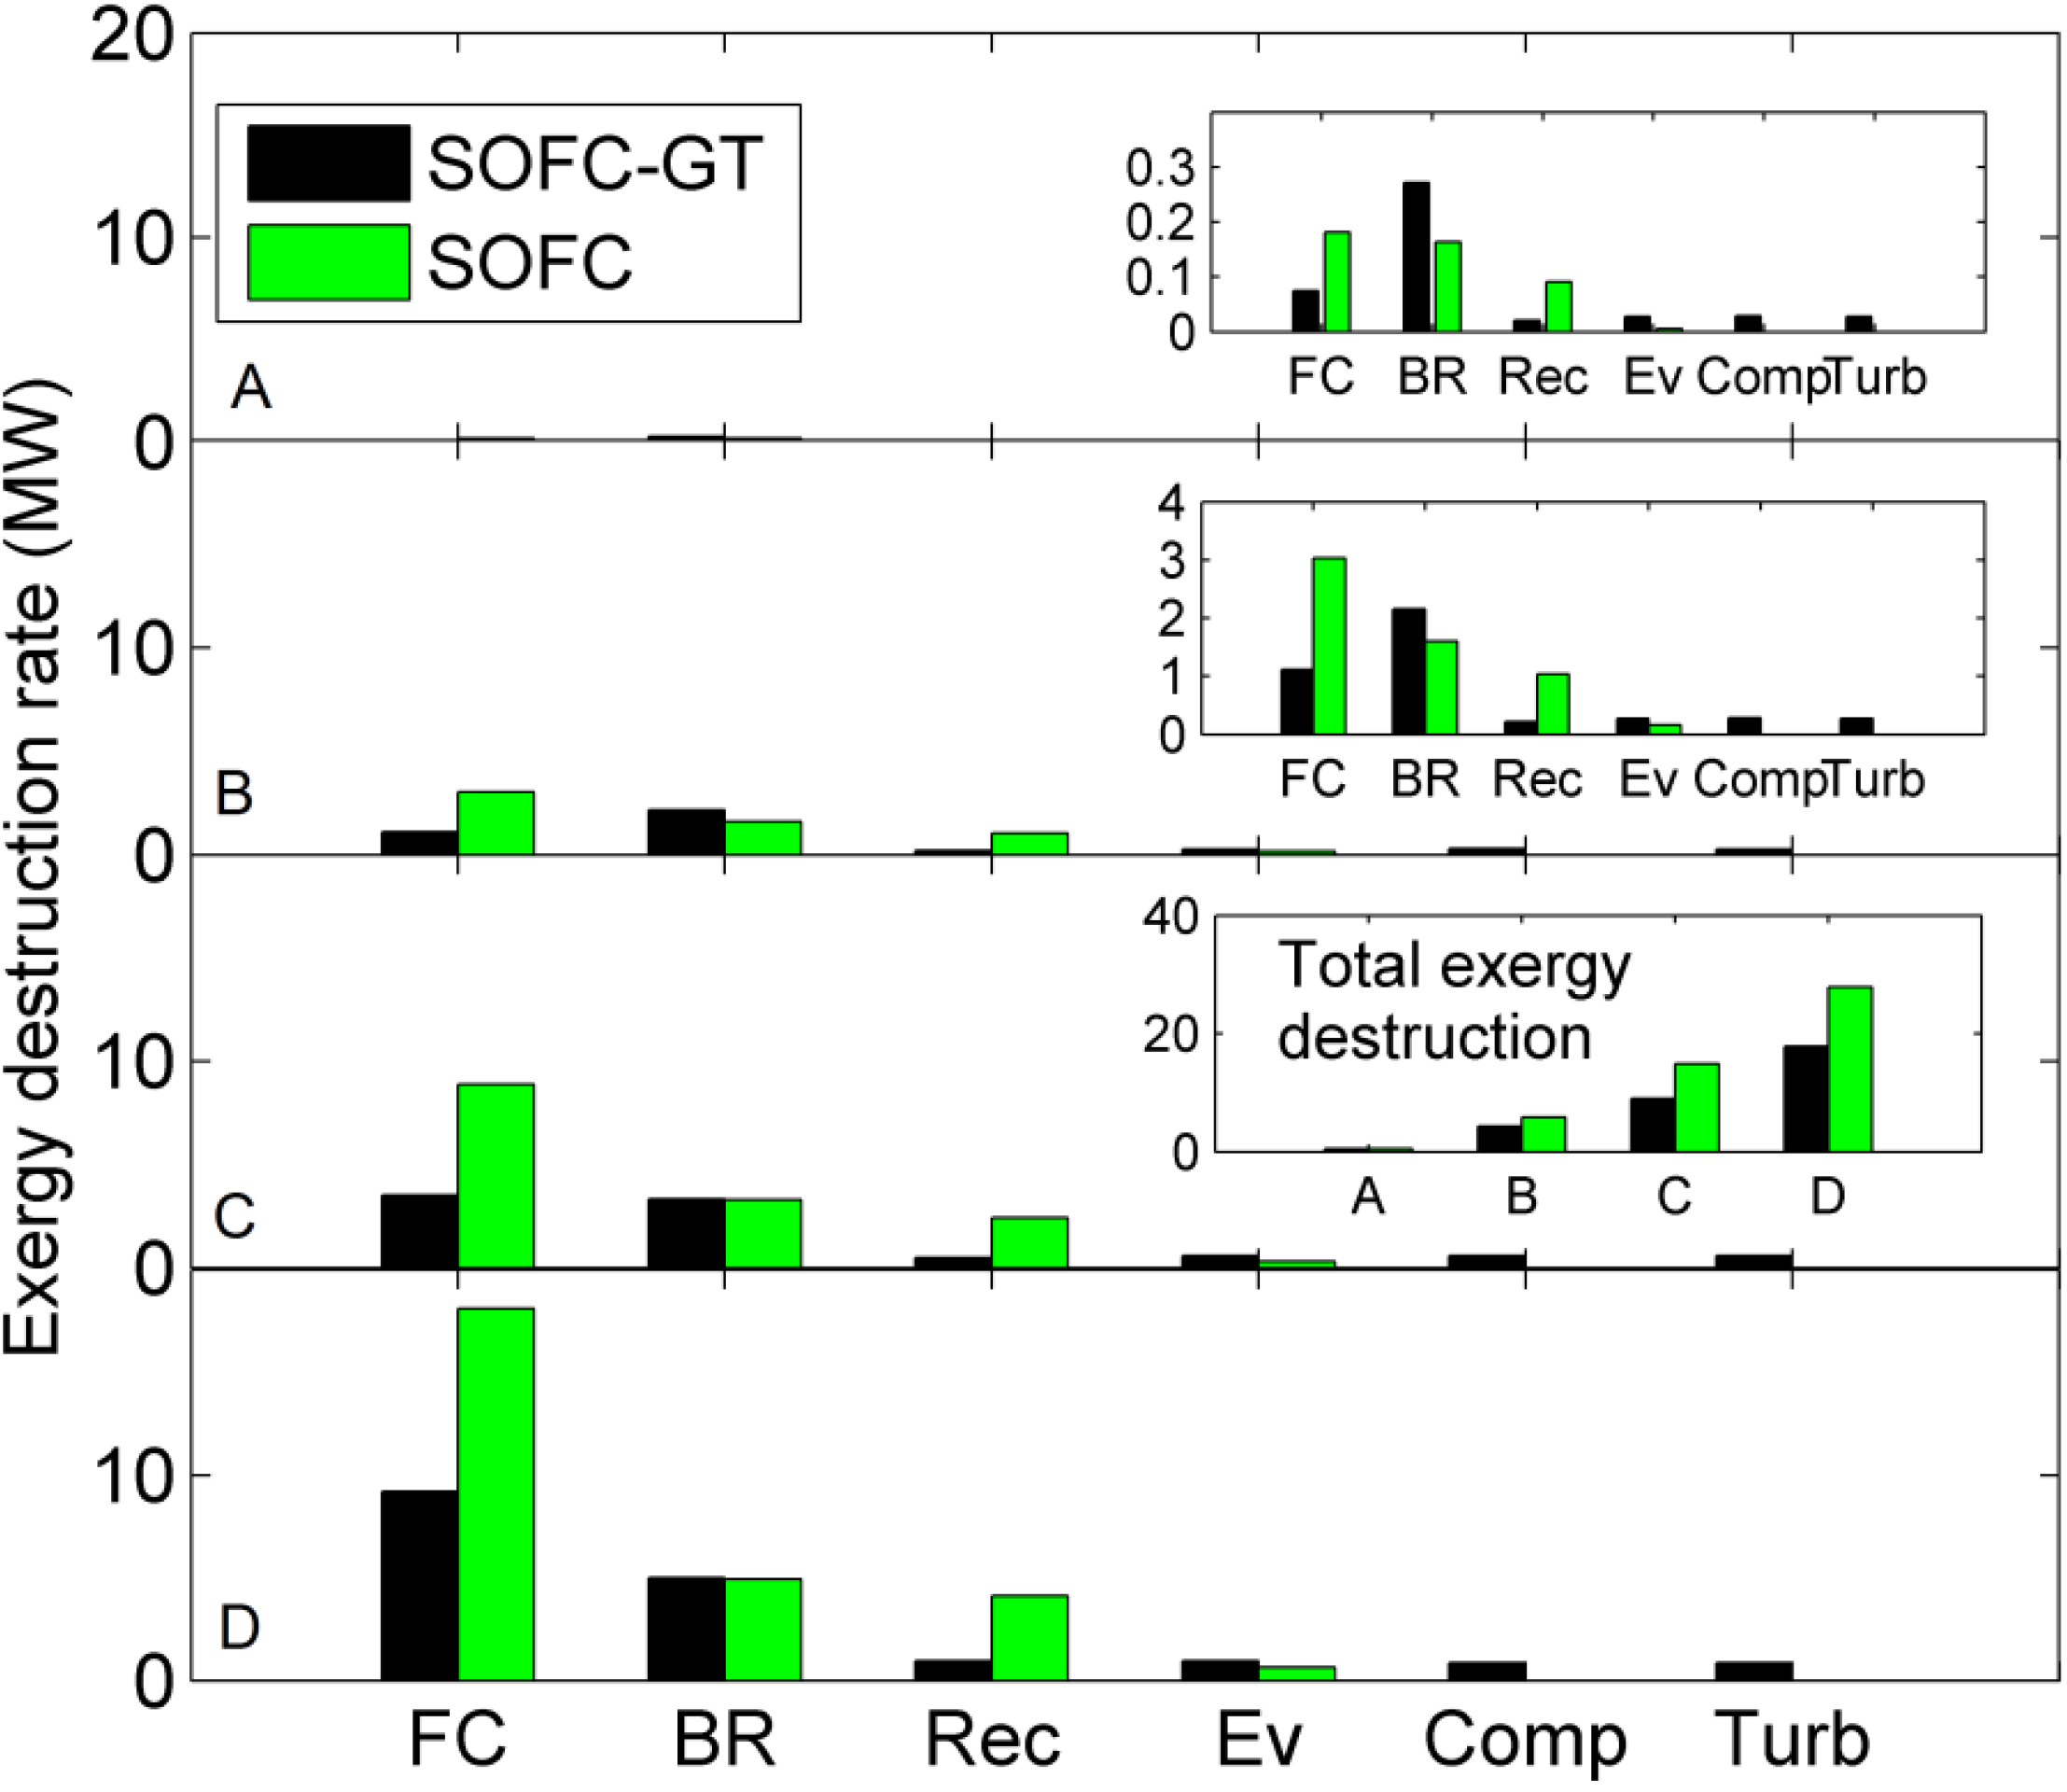
3.8. Exergy Analysis of the Systems

It is well known that the exergy of a system is the maximum useful work that can be extracted from that system when it is brought reversibly to equilibrium with its environment. An exergy balance applied to a system provides information on the wasted work potential during a process as a result of irreversibilities (exergy destruction or lost work) defined also as second-law efficiency [3,36]. An exergy analysis is a powerful tool for optimizing thermodynamic systems and can be used to identify which components of the system are responsible for irreversibilities, or lost work. Exergetic analysis could lead to more realistic conclusions concerning the specification of design conditions than the conclusions resulting from conventional energy analysis [37].
Using Equations (4)–(33), the thermodynamic variables in each position for both systems are calculated. Exergy analysis of both cycles is carried out applying for each position Equations (34)–(36). The total exergy at a specific position (e.g., compressor outlet) has been estimated from Equation (34) and is the sum of the physical and chemical exergy of the components that are associated with their physical and chemical properties, respectively. An exergy balance for a control volume at steady state is formulated to calculate exergy destruction ĖD using Equation (35). Exergy efficiency is referred to the exergetic potential of the primary fuel (standard exergy of ethanol) and is expressed through Equation (36):
Energies 05 04268 i013
Energies 05 04268 i014
Energies 05 04268 i015
In Equation (34), all quantities are on a “per kmol” basis, then are converted to “per kg” basis in order to be used in other equations.

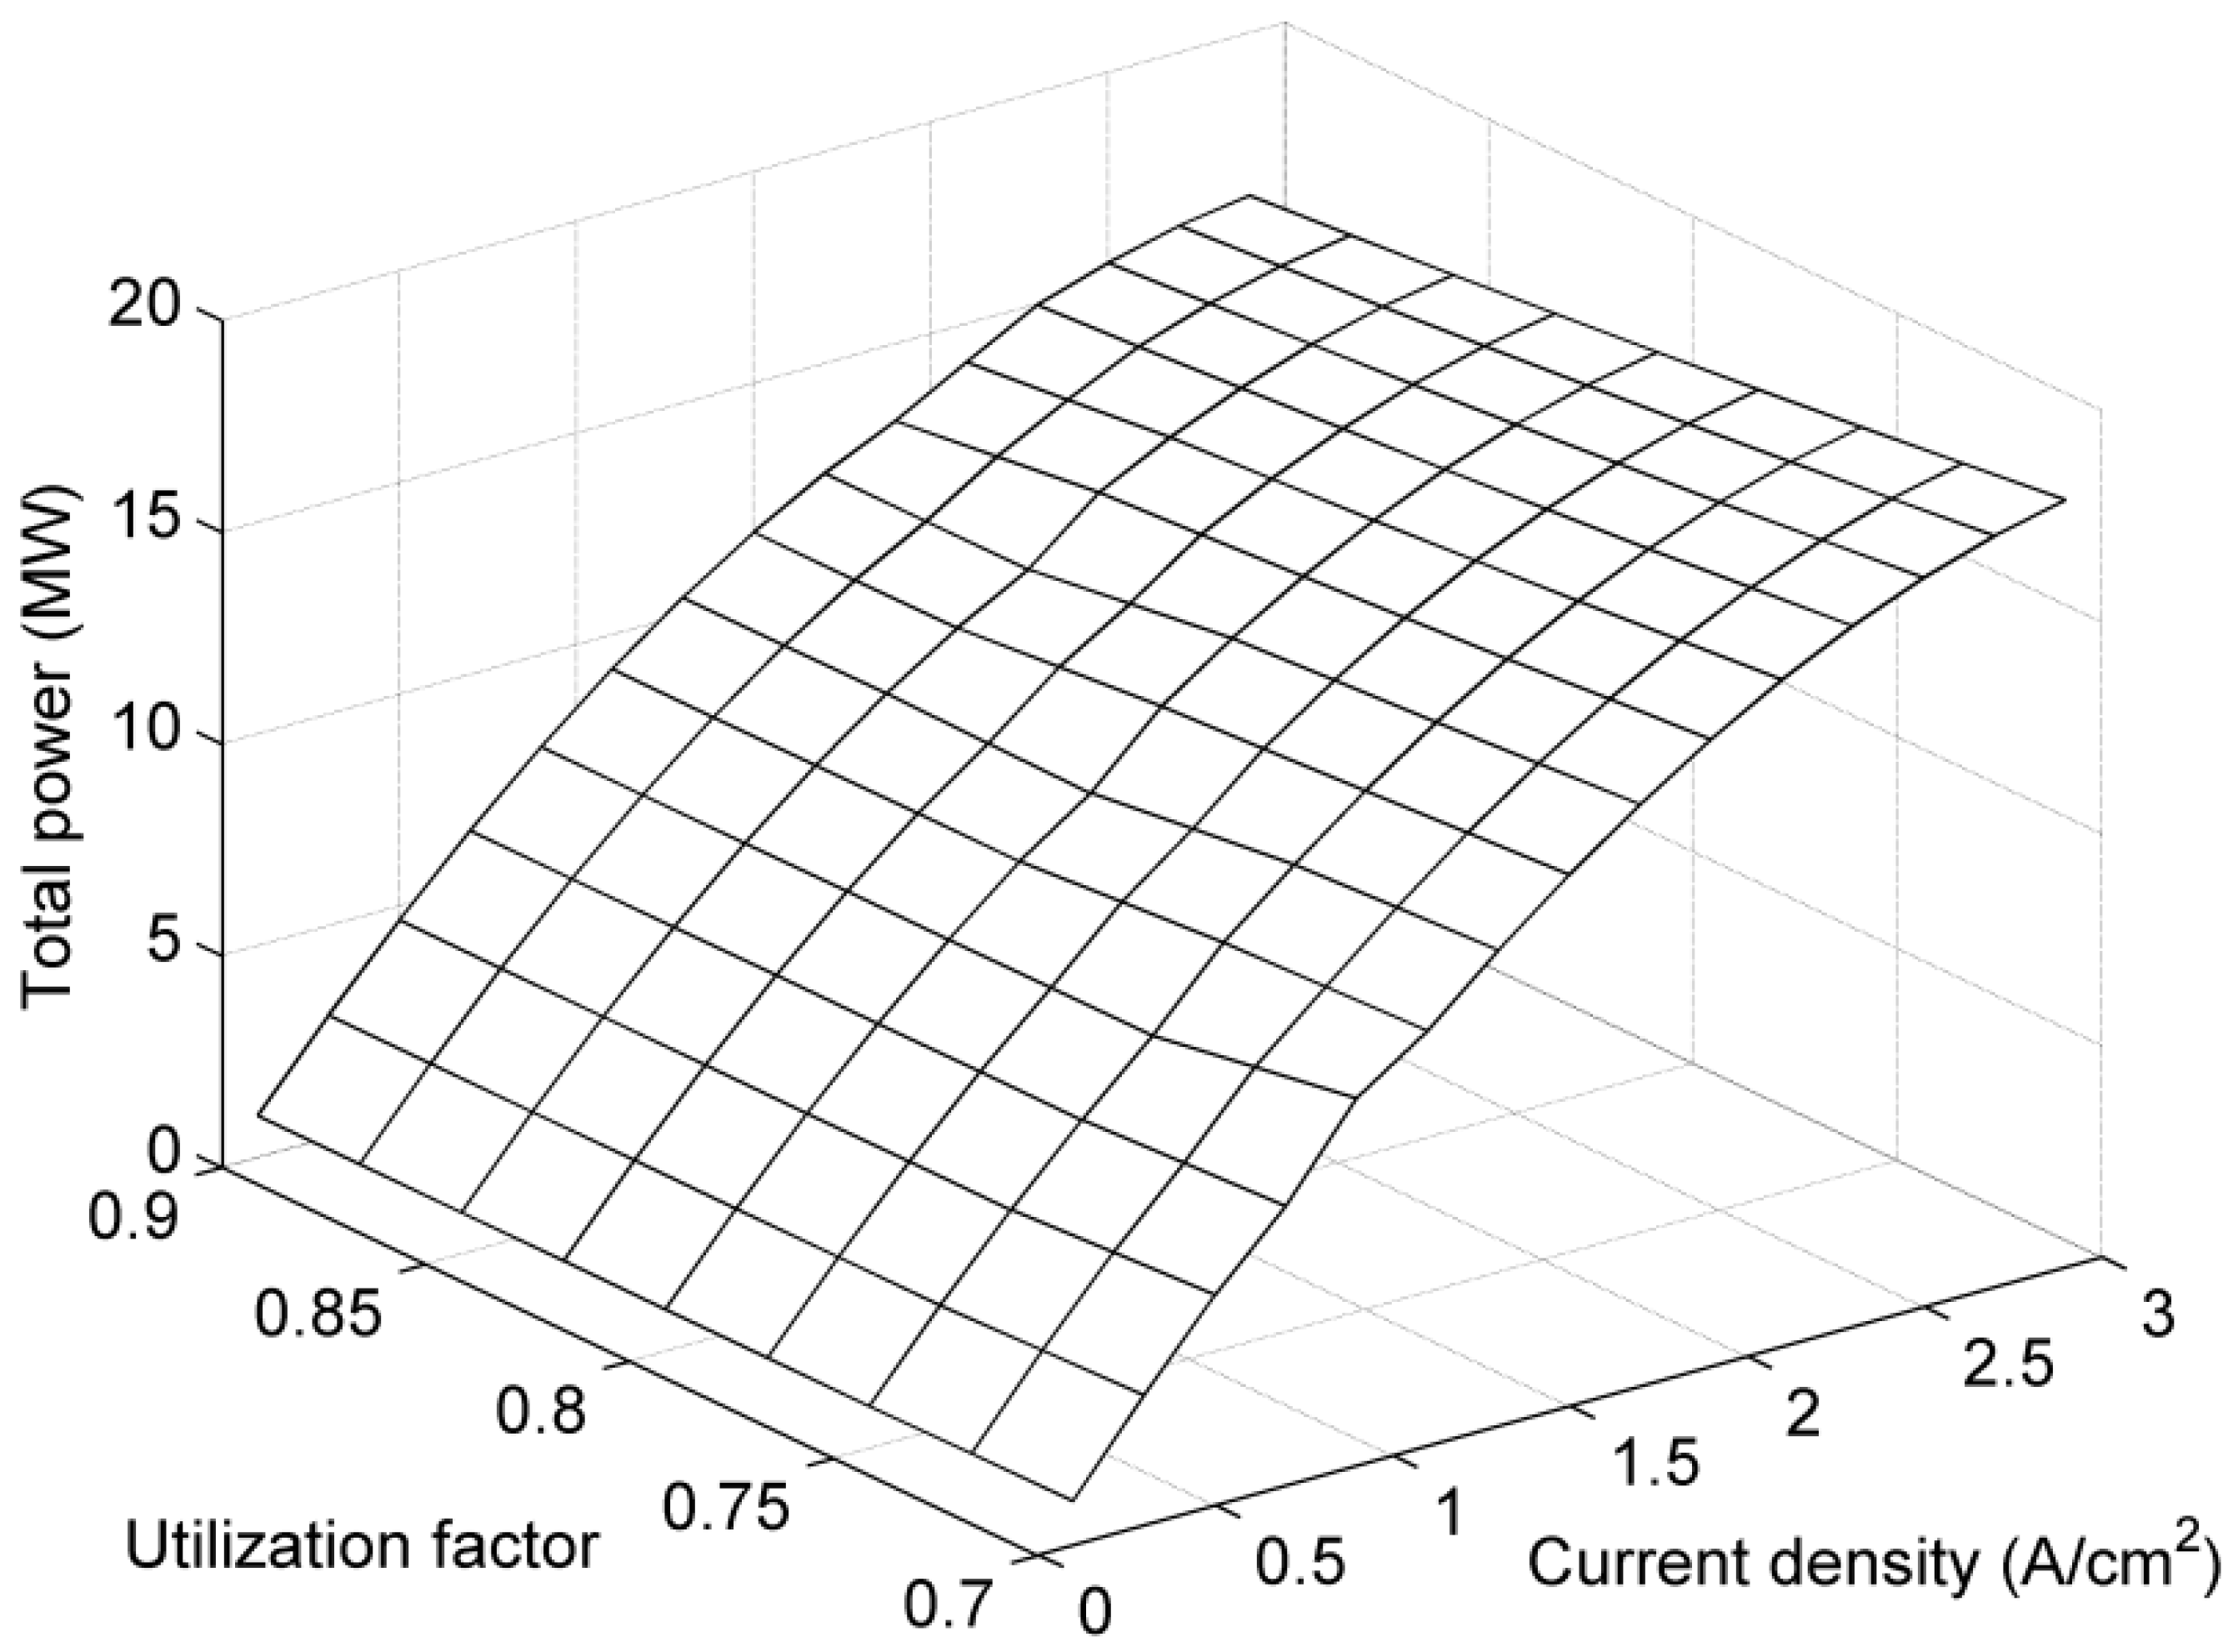
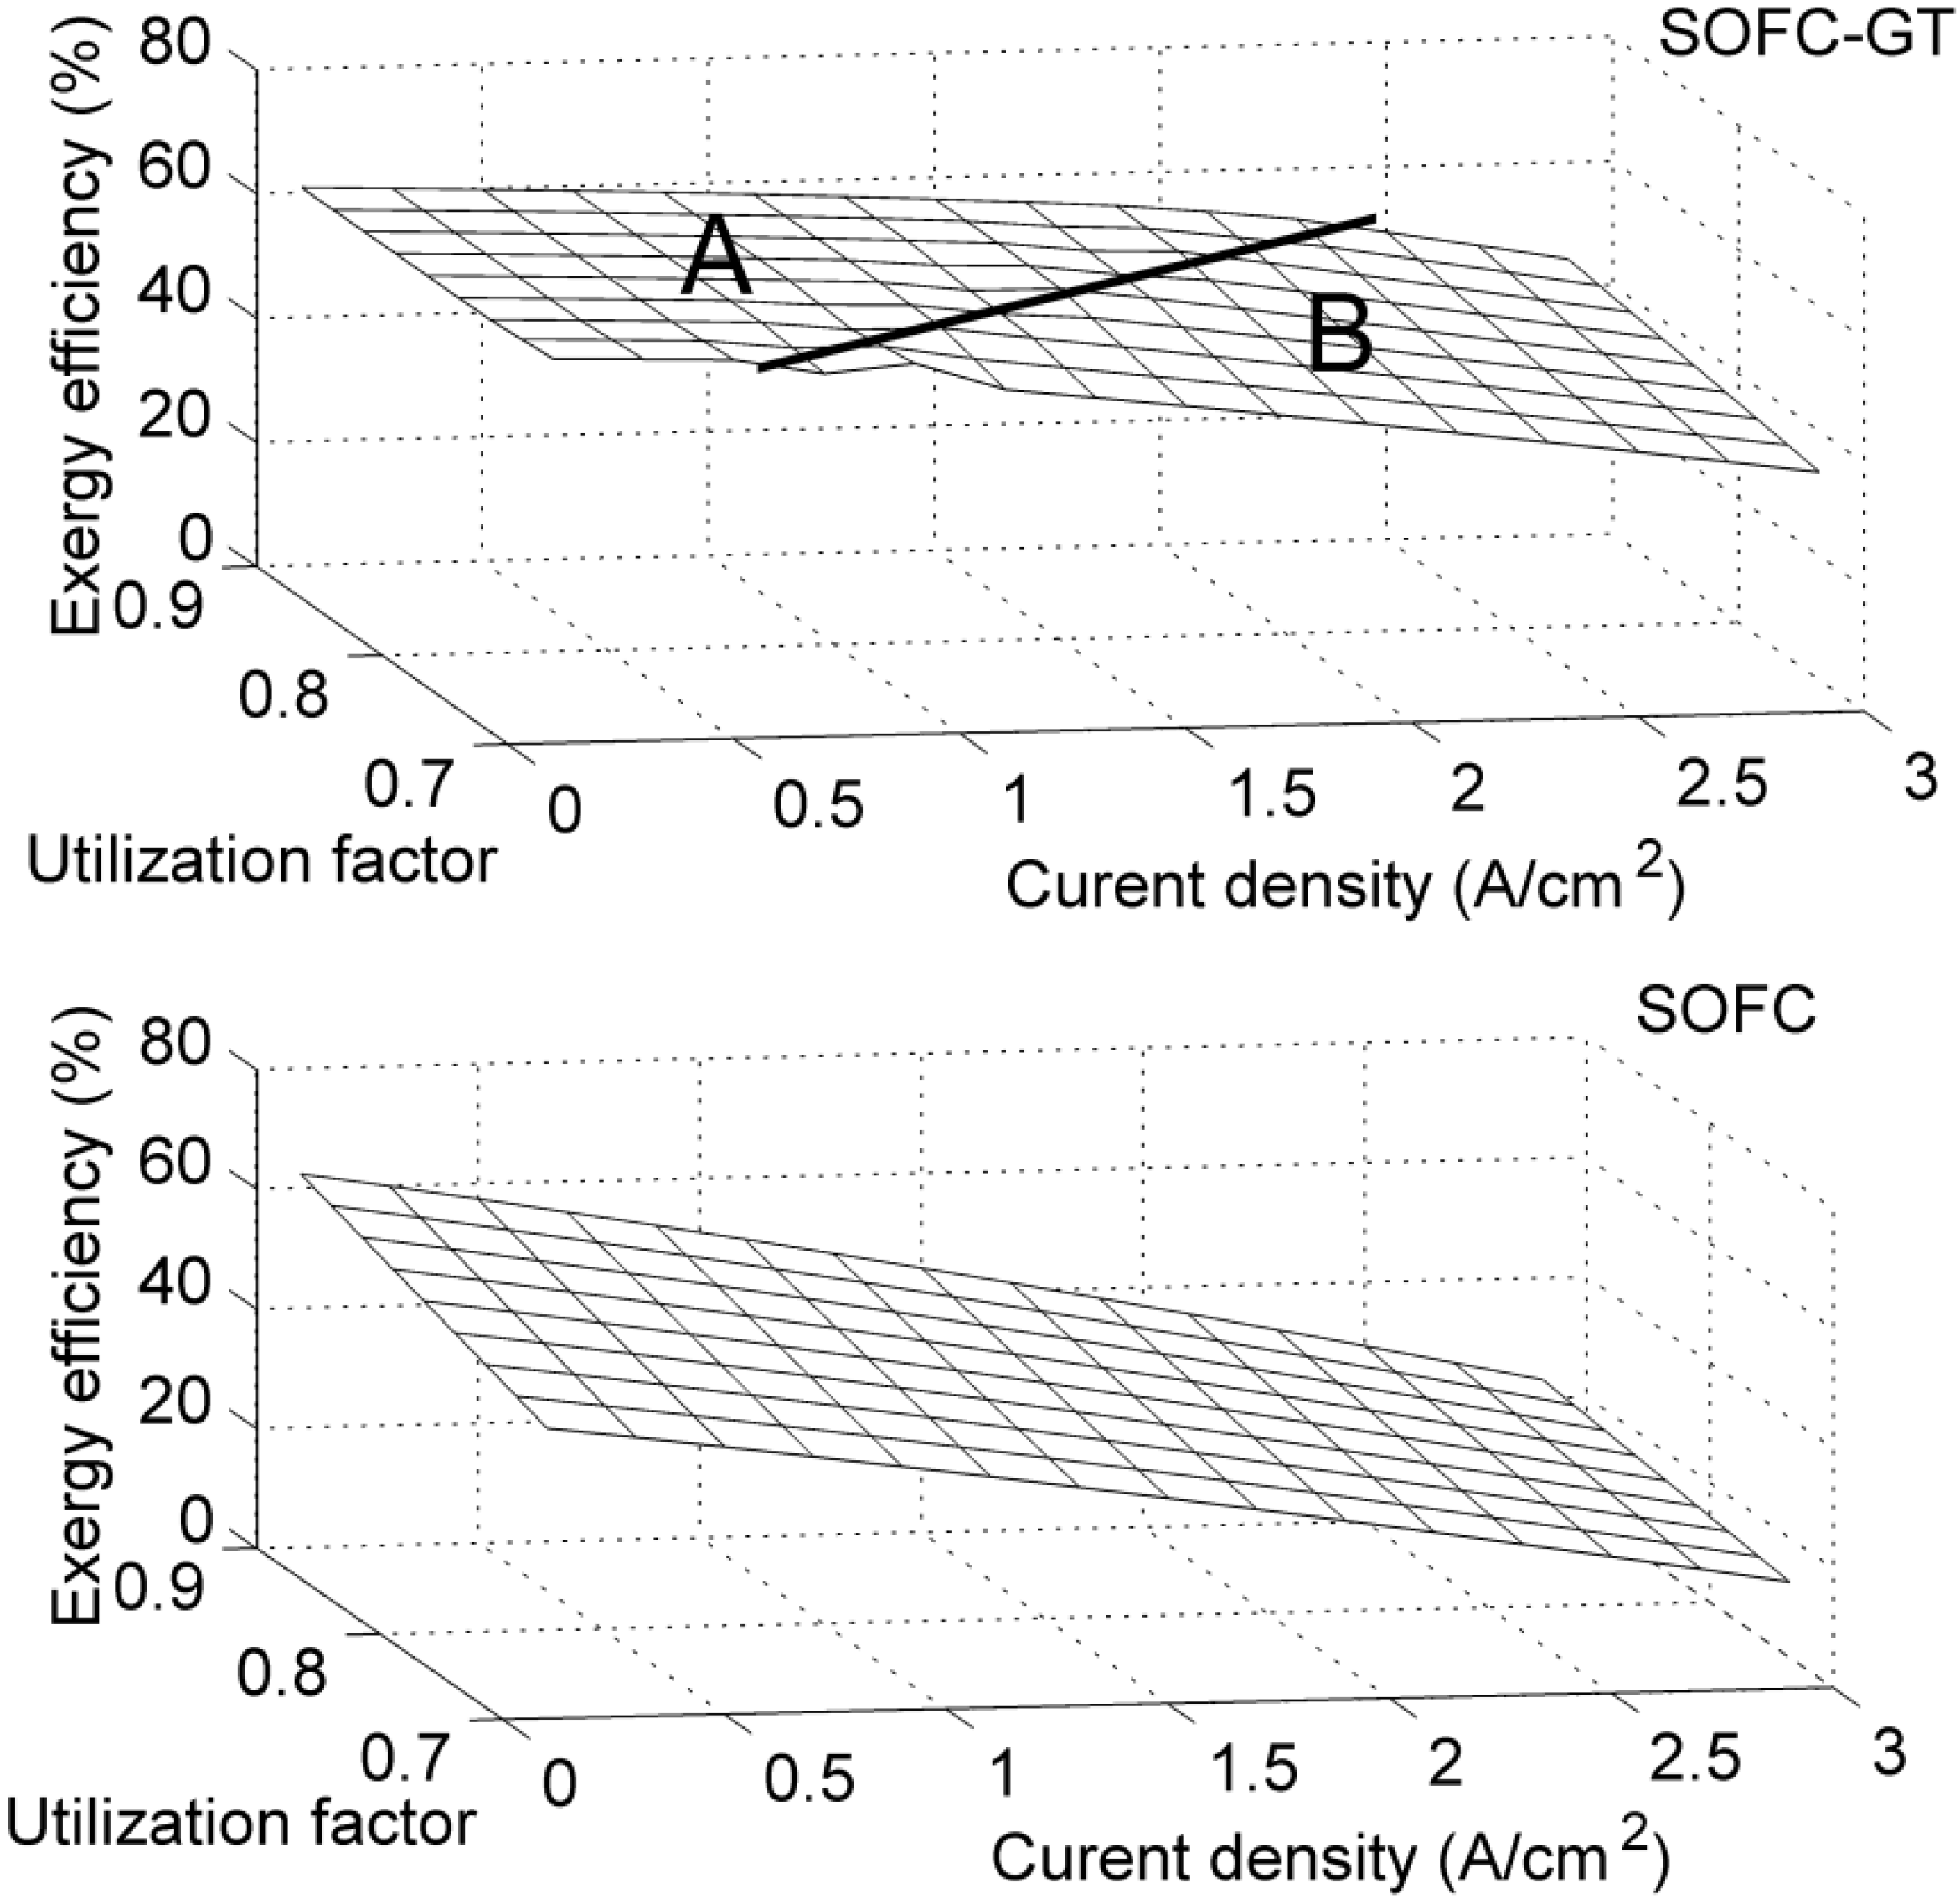
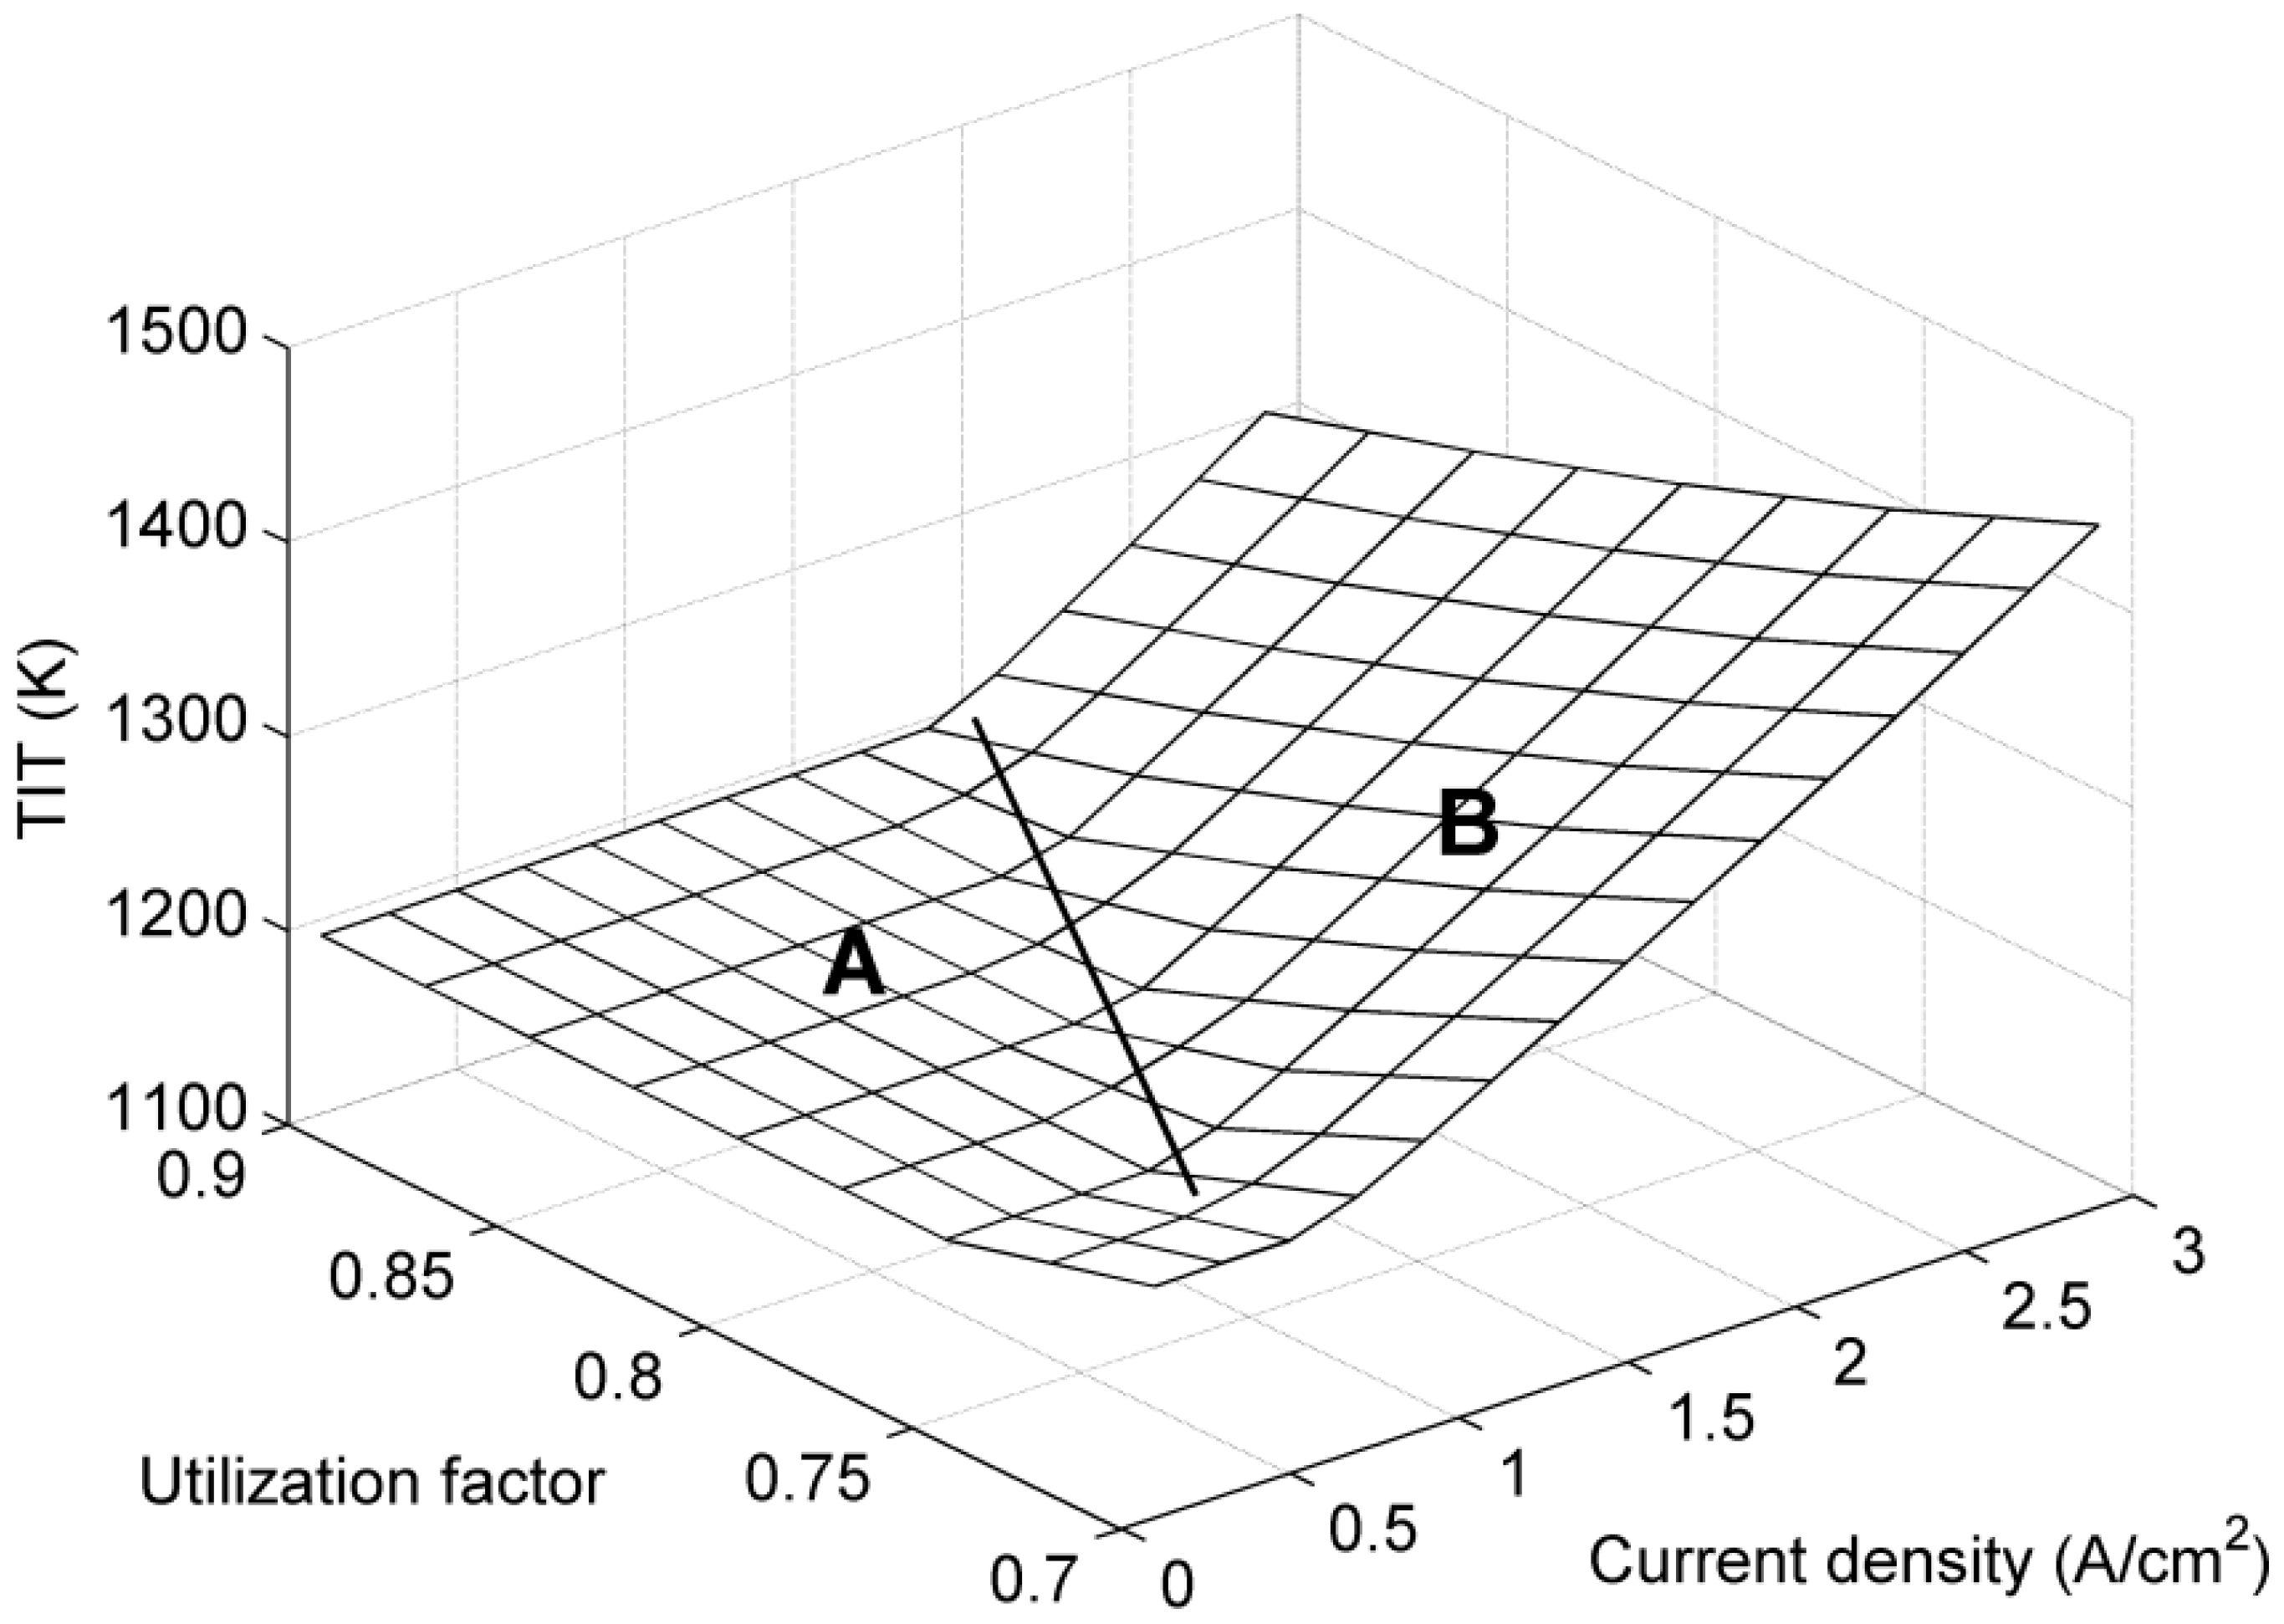
4. Results and Discussion

The systems under investigation presented in Figure 1 are simulated at steady state performance. Reasonable operating parameters of the systems investigated have been adopted from the literature [13,17], and are presented in Table 1. Discussion on the parameters selection for systems with power rate in the range considered can be found in the above references. The variation of fuel cell voltage and power density with current density at 550 and 600 °C operating temperature of the fuel cell is shown in Figure 2. This information comes from existing experimental results reported in the literature [24]. The specific curves are used to define the reference cell voltage. The model also incorporates semiempirical correlations [38,39,40] to evaluate the effects of the operating pressure and fuel composition on the actual (final) voltage value. Higher current densities increase the irreversibilities in the cell and results in lower voltages. Concentration losses are the main reason for the low output voltages at high current densities. These losses are higher at 550 °C than at 600 °C. Points A, B, C and D distinguished in Figure 2 represent the operating points of an intermediate solid oxide fuel cell operating at 600 °C at 0.1, 1, 2 and 3 Α/cm2 respectively. In this work, the system’s exergetic performance is examined at these points.
The exergy efficiency variation for both systems (SOFC-GT, SOFC) in relation to the current density and fuel utilization factor is illustrated in Figure 3. It can be observed for both systems that the exergy efficiency value approaches 60% when the fuel cell operates at very low current density and Uf approaching 90%. However, when higher current densities are required, the SOFC-GT exergetic efficiency prevails that of SOFC (close to 50% and 25% respectively at Uf = 0.90 and current density 3 A/cm2). Two different regions can be distinguished in case of the SOFC-GT system: region A and region B. The region A represents the operating conditions where an additional amount of ethanol has to be consumed in the burner for the thermal needs of the system to be covered. Region B represents the operating area where there is no need for additional ethanol to be supplied to the burner. In this region the values of fuel utilization factor are low and the values of current density are high. When the value of the utilization factor is low additional thermal energy is provided to the system due to un-reacted hydrogen from the fuel cell which is eventually burnt in the burner device. When the value of current density is high, thermal energy sufficient to cover the thermal needs of the system is derived from the polarization losses.
Table 1. Main operating parameters of the SOFC-GT system [13,17].
Gas turbine cycle
Compressor isentropic efficiency0.81
Compressor pressure ratio4
Turbine isentropic efficiency0.84
AC generator efficiency0.95
Burner-Reformer
Ethanol Steam-to-Carbon Ratio1.5
Burner efficiency0.98
Pressure losses (%)5
SOFC
Air utilization factor (Ua)0.25
Fuel utilization factor (Uf)0.85
Pressure losses (%)4
DC/AC conversion efficiency0.95
Recuperator
effectiveness0.85
Pressure losses gas/air sides (%)4
Ambient conditions
Temperature (K)288
Pressure (bar)1.013
Figure 2. Experimental results of an IT-SOFC performance. Cell voltage and power density as function of current density at 600 and 550 °C [24].
Energies 05 04268 g002
Figure 3. The effect of current density and fuel utilization factor on the efficiency of both systems; TFC = 600 °C.
Energies 05 04268 g003
With reference to the simple SOFC system the region A decays to a single point. This means that the system operates with additional ethanol amount to the burner (region B) for all operating conditions. The exergy efficiency decreases with the increment of current density and decrement of fuel utilization factor.
The dependence of the exergy efficiency of both systems (SOFC-GT, SOFC) in relation with the current density at different values of fuel utilization factor is better illustrated in Figure 4. When the systems are operating with low fuel utilization factor, the SOFC-GT plant is more efficient than the SOFC plant. As the value of the utilization factor increases two discrete regions can be observed, limited by point I. This point depends on the fuel cell’s working conditions—especially on the utilization factor—and can be defined as the equivalent point where the exergy efficiency of the SOFC-GT plant becomes equal to that of the SOFC system. In the region before point I (lower current densities) the exergy efficiency of the SOFC system is slightly higher than the efficiency of the SOFC-GT system. After this point it becomes evident that the efficiency of the SOFC-GT is higher than the efficiency of the SOFC system.
Figure 4. The effect of current density at specific values of fuel utilization factor on exergy efficiency of both systems; TFC = 600 °C.
Energies 05 04268 g004
Polarization losses actually mean loss of potential useful work that is converted to heat. At the SOFC plant, polarization losses in the current density range from 0.1 to 3 A/cm2 lead to high efficiency drop (>60%). At the SOFC-GT plant, part of the heat generated from polarization losses is further converted to useful work through the gas turbine and consequently the efficiency drop of this system is lower (<35%). It can also be observed in Figure 4 that while fuel utilization factor increases, the equivalent point described before is displaced at higher value of current density and the region where the exergy efficiency of the SOFC plant is slightly higher than the efficiency of the SOFC-GT is also extended. This is expected as the increase of the fuel utilization factor means better and more efficient fuel cell operation as un-reacted fuel decreases.
Figure 5 illustrates the effect of fuel utilization factor Uf on the exergy efficiency for both systems at specific values of current density. It is clear that the value of fuel utilization factor affects more the efficiency of the SOFC’s system than the efficiency of the SOFC-GT’s system, although the value of fuel utilization factor shows no impact on systems’ performance when their operating points are in A region. It is also observed that the efficiency of the SOFC system is considerably lower compared to the efficiency of the SOFC-GT system at higher values of current density and the rate of efficiency reduction for the SOFC system is higher too.
Figure 5. The effect of fuel utilization factor on exergy efficiency of both systems for specific values of current density; TFC = 600 °C.
Energies 05 04268 g005
In Figure 6 the exergy efficiency of the SOFC-GT plant at 600 °C fuel cell operating temperature is compared to the one at 550 °C respectively for different values of current density and fuel utilization factor. It is observed that the system is more efficient at low values of current density and lower fuel cell operating temperature. As the value of utilization factor increases the efficiency of the plant at 550 °C is higher than the efficiency at 600 °C for a wider range of current density values. Moreover, the rate of the efficiency decrease (as the current density increases), is higher at 550 °C, as polarization losses at lower temperature occur at greater extend as illustrated in Figure 2.
Figure 6. The effect of current density, fuel utilization factor and fuel cell operating temperature on the exergy efficiency of the SOFC-GT.
Energies 05 04268 g006
Figure 7 illustrates the turbine inlet temperature (TIT) at different values of current density and fuel utilization factor. When the SOFC-GT operates in region A (described before) TIT is almost constant at about 1200 K. In region B TIT increases with the current density and fuel utilization, reaching high values. This fact must be taken into account during system operation in order to avoid a turbine failure, especially for a turbine without blade cooling that is usually the case for small gas turbines with pressure ratio in the range considered.
Figure 7. The effect of current density and the fuel utilization factor on the gas turbine inlet temperature (TIT); TFC = 600 °C and rp = 4.
Energies 05 04268 g007
Exergy destruction rate of the systems’ devices is presented in Figure 8. It is observed that for all the devices exergy destruction rate increases along with the increase of the current density. In both systems, the maximum irreversibilities occur in the fuel cell device. As it can be distinguished from Figure 8, high amounts of exergy are also destructed in the burner and the recuperator especially in the case of the SOFC system.
In Figure 9 is presented the exergy destruction rate of each device for both systems for the different fuel cell’s operating points (V-I) A, B, C, D shown in Figure 2. It is obvious that the SOFC plant is more exergy destructive than the SOFC-GT plant. It is observed that as the value of current density increases the total exergy destruction rate of the SOFC plant overcomes the total exergy destruction rate of the SOFC-GT plant. When the value of current density remains low, the maximum irreversibility occurs in the burner-reformer device for the SOFC-GT system and in the fuel cell stack for the SOFC system. As the current density increases the fuel cell becomes the most exergy destructive device for both systems. At low current densities the burner–reformer device of the SOFC-GT system, where additional ethanol has to be burnt for the thermal needs of the system, is more exergy destructive than the same device at the SOFC plant. At high current densities where there is no need for additional heat, the exergy destruction rate in the burner-reformer device becomes equal for both systems. The exergy destruction rate of the compressor, the turbine and the evaporator is low comparing to the other devices. Additionally the exergy destruction rate of the recuperator of the SOFC plant is approximately three times higher than the one of the SOFC-GT.
Figure 8. The effect of current density on exergy destruction of SOFC-GT’s and SOFC’s devices; TFC = 600 °C and Uf = 0.85.
Energies 05 04268 g008
Figure 9. Exergy destruction of SOFC-GT’s and SOFC’s devices; TFC = 600 °C and Uf = 0.85.
Energies 05 04268 g009
The total power produced from the SOFC-GT system is illustrated in Figure 10. At higher values of current density, power output increases with the decrease of utilization factor as gas turbine has a significant contribution to the total power output. At lower values of current density the SOFC-GT system’s power output seems to be insensitive to the change of fuel utilization factor. Maximum power output occurs at higher current densities for decreasing fuel utilization factors.
Figure 10. The effect of current density and fuel utilization factor on the total power output of the SOFC-GT; TFC = 600 °C and rp = 4.
Energies 05 04268 g010
Figure 11. The effect of current density and fuel utilization factor on the power output of the SOFC device, on the total power output of the SOFC-GT, and on the fuel consumption; TFC = 600 °C.
Energies 05 04268 g011
In order to be better understood the operation of the SOFC-GT system, the effect of current density on: (a) the total ethanol consumption (in terms of power), (b) the power produced from the SOFC device and (c) the total power produced (sum of the power produced from the SOFC and the Gas Turbine device) is presented in Figure 11, for utilization factors of 0.7 and 0.9, respectively. The marked region represents the power produced by the gas turbine. In other words the power contribution of the gas turbine to the total power output from the SOFC-GT system. It is clear that as the current density increases and/or the Uf decreases, the gas turbine’s power output increases, while the fuel cell’s power output remains constant.
Finally, in Figure 12 the effect of current density and utilization factor on the ethanol rate consumption (in terms of kgs per second): (a) in the reformer, (b) in the burner and (c) in the SOFC-GT system (total rate) is illustrated. The ethanol is consumed in the reformer for hydrogen production and as it can be distinguished in Figure 12a, its rate increases as the current density increases. Moreover, at high current density values, as the utilization factor decreases—unreacted hydrogen increases—the ethanol consumption rate becomes higher. In Figure 12b, the rate of ethanol consumption in the burner device as a function of current density and utilization factor is depicted. It can be seen that at high current densities and low Uf, no ethanol is required for the burner. As discussed above, in this case the rate of the heat production in the fuel cell device (polarization losses) is high enough to support the whole system’s energy requirements. On the other hand, when the fuel cell operates at low current densities and high utilization factor values, ethanol supply is necessary. Figure 12c simply depicts the total ethanol consumption rate (sum of ethanol consumption rate in the burner and the reformer device) as a function of current density and utilization factor.
Figure 12. The effect of current density and fuel utilization factor on the ethanol consumption rate in: (a) the reformer, (b) the burner, (c) the whole SOFC-GT system; TFC =600 °C and rp = 4.
Energies 05 04268 g012

5. Conclusions

In this work two Solid Oxide Fuel Cell based systems (SOFC-GT and SOFC) are exergetically analyzed and compared. It was found that for both cases the exergy efficiency value approaches 60% when the fuel cell operates at very low current density values and high utilization factor. However, when higher current densities are required, the SOFC-GT exergetic efficiency prevails that of the SOFC. Moreover, when the systems are operating with low fuel utilization factor, SOFC-GT plant is more efficient than the SOFC plant. As the utilization factor increases there is a region in which the later becomes more efficient than the former. This region increases as the Uf increases. Additionally, it is also concluded that only at low values of current density lower operating fuel cell temperature leads to higher efficiency for both plants.

Nomenclature:

Ac
Fuel cell stack area (m2)
e
Specific exergy (kJ/kg)
Ė
Exergy rate (kW)
h
Specific enthalpy (kJ/kg)
i
Current density (A/m2)
LHV
Lower heating value (kJ/kg)
Mass flow rate (kg/s)
Q ˙
Thermal energy (kW)
rp
Pressure ratio
s
Specific entropy (kJ/kg·K)
T
Temperature (K)
U
Utilization factor
V
Voltage (V)
Power (kW)
x
Mole fraction
ε
Effectiveness
η
Isentropic efficiency
ηII
Exergy efficiency

Subscripts

1...12
Station numbering
a
Air
B
Burner
C
Compressor
D
Destruction
e
Exhaust
Et
Ethanol
Ev
Evaporator
f
Fuel
FC
Fuel cell
g
Exhaust gas
i
Inlet
o
Reference
R
Reformer
Rec
Recuperator
stoic
Stoichiometric
w
Water

Acknowledgments

Finally, for the financial support, P. Tsiakaras is grateful to the Greek Ministry of Development-GSRT “SYNERGASIA” Program (09SYN-32-615: ECHOCO2) and F. Tzorbatzoglou is grateful to the Research Funding Program: Heracleitus II of the Operational Programme “Educational and Lifelong Learning” which is co-funded by the European Union (European Social Fund) and National Resources.

References

  1. Dunn, S. Hydrogen futures: Toward a sustainable energy system. Int. J. Hydrog. Energy 2002, 27, 235–264. [Google Scholar] [CrossRef]
  2. Cherry, R.S. A hydrogen utopia? Int. J. Hydrog. Energy 2004, 29, 125–129. [Google Scholar] [CrossRef]
  3. Silveira, J.L.; Braga, L.B.; de Souza, A.C.C.; Antunes, J.S.; Zanzi, R. The benefits of ethanol use for hydrogen production in urban transportation. Renew. Sust. Energ. Rev. 2009, 13, 2525–2534. [Google Scholar] [CrossRef]
  4. Douvartzides, S.; Coutelieris, F.; Tsiakaras, P. Exergy analysis of a solid oxide fuel cell power plant fed by either ethanol or methane. J. Power Sources 2004, 131, 224–230. [Google Scholar] [CrossRef]
  5. Recknagle, K.P.; Williford, R.E.; Chick, L.A.; Rector, D.R.; Khaleel, M.A. Three-dimensional thermo-fluid electrochemical modeling of planar SOFC stacks. J. Power Sources 2003, 113, 109–114. [Google Scholar] [CrossRef]
  6. Padullés, J.; Ault, G.W.; McDonald, J.R. An integrated SOFC plant dynamic model for power systems simulation. J. Power Sources 2000, 86, 495–500. [Google Scholar] [CrossRef]
  7. Campanari, S.; Iora, P. Definition and sensitivity analysis of a finite volume SOFC model for a tubular cell geometry. J. Power Sources 2004, 132, 113–126. [Google Scholar] [CrossRef]
  8. Chan, S.H.; Ho, H.K.; Tian, Y. Multi-level modeling of SOFC–gas turbine hybrid system. Int. J. Hydrog. Energy 2003, 28, 889–900. [Google Scholar] [CrossRef]
  9. Kandepu, R.; Imsland, L.; Foss, B.A.; Stiller, C.; Thorud, B.; Bolland, O. Modeling and control of a SOFC-GT-based autonomous power system. Energy 2007, 32, 406–417. [Google Scholar] [CrossRef]
  10. Song, T.W.; Sohn, J.L.; Kim, T.S.; Ro, S.T. Performance characteristics of a MW-class SOFC/GT hybrid system based on a commercially available gas turbine. J. Power Sources 2006, 158, 361–367. [Google Scholar] [CrossRef]
  11. Yi, Y.; Rao, A.D.; Brouwer, J.; Samuelsen, G.S. Analysis and optimization of a solid oxide fuel cell and intercooled gas turbine (SOFC–ICGT) hybrid cycle. J. Power Sources 2004, 132, 77–85. [Google Scholar] [CrossRef]
  12. Calise, F.; Palombo, A.; Vanoli, L. Design and partial load exergy analysis of hybrid SOFC–GT power plant. J. Power Sources 2006, 158, 225–244. [Google Scholar] [CrossRef]
  13. Haseli, Y.; Dincer, I.; Naterer, G.F. Thermodynamic analysis of a combined gas turbine power system with a solid oxide fuel cell through exergy. Thermochim. Acta 2008, 480, 1–9. [Google Scholar] [CrossRef]
  14. Vinni, C.; Stamatis, A.; Tsiakaras, P. An Exergetic Analysis of an Ethanol Fed SOFC-GT Hybrid System. In Proceedings of the 3rd European Fuel Cell Technology & Applications Conference—Piero Lunghi Conference (EFC), Rome, Italy, 15–18 December; 2009. [Google Scholar]
  15. Massardo, A.F.; Lubelli, F. Internal reforming solid oxide fuel cell-gas turbine combined cycles (IRSOFC-GT): Part A—Cell model and cycle thermodynamic analysis. J. Eng. Gas. Turb. Power 2000, 122, 27–35. [Google Scholar] [CrossRef]
  16. Srisiriwat, A. High Temperature Solid Oxide Fuel Cell Integrated with Autothermal Reformer. In Proceedings of the IEEE 2nd International Power and Energy Conference (PECon), Johor Bahru, Malaysia, 1–3 December 2008.
  17. Cocco, D.; Tola, V. Use of alternative hydrogen energy carriers in SOFC–MGT hybrid power plants. Energy Convers. Manag. 2009, 50, 1040–1048. [Google Scholar] [CrossRef]
  18. Douvartzides, S.L.; Coutelieris, F.A.; Tsiakaras, P.E. On the systematic optimization of ethanol fed SOFC-based electricity generating systems in terms of energy and exergy. J. Power Sources 2003, 114, 203–212. [Google Scholar] [CrossRef]
  19. Assabumrungrat, S.; Pavarajarn, V.; Charojrochkul, S.; Laosiripojana, N. Thermodynamic analysis for a solid oxide fuel cell with direct internal reforming fueled by ethanol. Chem. Eng. Sci. 2004, 59, 6015–6020. [Google Scholar] [CrossRef]
  20. Jamsak, W.; Assabumrungrat, S.; Douglas, P.L.; Laosiripojana, N.; Suwanwarangkul, R.; Charojrochkul, S.; Croiset, E. Performance of ethanol-fuelled solid oxide fuel cells: Proton and oxygen ion conductors. Chem. Eng. J. 2007, 133, 187–194. [Google Scholar] [CrossRef]
  21. Casas, Y.; Arteaga, L.E.; Morales, M.; Rosa, E.; Peralta, L.M.; Dewulf, J. Energy and exergy analysis of an ethanol fueled solid oxide fuel cell power plant. Chem. Eng. J. 2010, 162, 1057–1066. [Google Scholar] [CrossRef]
  22. Zhe, Y.; Qizhao, L.; Zhu, B. Thermodynamic analysis of ITSOFC co-generation system fueled by ethanol. Int. J. Energy Res. 2011, 35, 1025–1031. [Google Scholar] [CrossRef]
  23. Pikalova, E.Y.; Maragou, V.I.; Demina, A.N.; Demin, A.K.; Tsiakaras, P.E. The effect of co-dopantaddition on the properties of Ln0.2Ce0.8O2−δ (Ln = Gd, Sm, La) solid-state electrolyte. J. Power Sources 2008, 181, 199–206. [Google Scholar] [CrossRef]
  24. Shao, Z.; Haile, S.M. A high-performance cathode for the next generation of solid-oxide fuel cells. Nature 2004, 431, 170–173. [Google Scholar] [CrossRef] [PubMed]
  25. Cengel, Y.A.; Boles, A.M. Thermodynamics: An Engineering Approach, 5th ed.; McGraw-Hill: New York, NY, USA, 2006. [Google Scholar]
  26. Akkaya, A.V.; Sahin, B.; Huseyin Erdem, H. Exergetic performance coefficient analysis of a simple fuel cell system. Int. J. Hydrog. Energy 2007, 32, 4600–4609. [Google Scholar] [CrossRef]
  27. Haseli, Y.; Dincer, I.; Naterer, G.F. Thermodynamic modeling of a gas turbine cycle combined with a solid oxide fuel cell. Int. J. Hydrog. Energy 2008, 33, 5811–5822. [Google Scholar] [CrossRef]
  28. Park, S.K.; Oh, K.S.; Kim, T.S. Analysis of the design of a pressurized SOFC hybrid system using a fixed gas turbine design. J. Power Sources 2007, 170, 130–139. [Google Scholar] [CrossRef]
  29. Smith, J.M.; van Ness, H.C.; Abbot, M.M. Introduction to Chemical Engineering Thermodynamics, 6th ed.; McGraw-Hill: New York, NY, USA, 2001. [Google Scholar]
  30. Larminie, J.; Dicks, A. Fuel Cells Systems Explained, 2nd ed.; John Wiley and Sons Ltd.: Sussex, UK, 2003. [Google Scholar]
  31. Zhang, B.; Cai, W.; Li, Y.; Xu, Y.; Shen, W. Hydrogen production by steam reforming of ethanol over an Ir/CeO2 catalyst: Reaction mechanism and stability of the catalyst. Int. J. Hydrog. Energy 2008, 33, 4377–4386. [Google Scholar] [CrossRef]
  32. Contreras, J.L.; Salmones, J.; García, L.A.; Ponce, A.; Zeifert, B.; Fuentes, G.A. Hydrogen production by ethanol steam reforming over co-hydrotalcites having basic sites. J. New Mater. Electrochem. Syst. 2008, 11, 109–117. [Google Scholar]
  33. Li, M.; Wang, X.; Li, S.; Wang, S.; Ma, X. Hydrogen production from ethanol steam reforming over nickel based catalyst derived from Ni/Mg/Al hydrotalcite-like compounds. Int. J. Hydrogen Energy 2010, 35, 6699–6708. [Google Scholar] [CrossRef]
  34. Ma, H.; Zhang, R.; Huang, S.; Chen, W.; Shi, Q. Ni/Y2O3-Al2O3 catalysts for hydrogen production from steam reforming of ethanol at low temperature. J. Rare Earth. 2012, 30, 683–690. [Google Scholar] [CrossRef]
  35. Wu, Y.J.; Díaz Alvarado, F.; Santos, J.C.; Gracia, F.; Cunha, A.F.; Rodrigues, A.E. Sorption-enhanced steam reforming of ethanol: Thermodynamic comparison of CO2 sorbents. Chem. Eng. Technol. 2012, 35, 847–858. [Google Scholar] [CrossRef]
  36. Kotas, T.J. The Exergy Method of Thermal Plant Analysis; ButterWorth-Heinemann Ltd.: London, UK, 1985. [Google Scholar]
  37. Hotz, N.; Senn, S.M.; Poulikakos, D. Exergy analysis of a solid oxide fuel cell micropowerplant. J. Power Sources 2006, 158, 333–347. [Google Scholar] [CrossRef]
  38. Fuel Cell Handbook, 5th ed.; EG&G Services Parsons, Inc., Science Applications International Corporation: Morgantown, WV, USA, 2000.
  39. Campanari, S. Thermodynamic model and parametric analysis of a tubular SOFC module. J. Power Sources 2001, 92, 26–34. [Google Scholar] [CrossRef]
  40. Zhang, W.; Croiset, E.; Douglas, P.L.; Fowler, M.W.; Entchev, E. Simulation of a tubular solid oxide fuel cell stack using AspenPlusTM unit operation models. Energy Convers. Manag. 2005, 46, 181–196. [Google Scholar] [CrossRef]

