Energy Use in Day Care Centers and Schools

VTT Technical Research Centre of Finland/P.O. 1000, FI-02044 VTT, Finland
Energies 2011, 4(6), 998-1009; https://doi.org/10.3390/en4070998
Submission received: 27 May 2011
/
Revised: 22 June 2011
/
Accepted: 23 June 2011
/
Published: 27 June 2011
(This article belongs to the Special Issue Energy Savings in the Domestic and Tertiary Sectors 2011)
Abstract
:Typically the aim in the construction process is to calculate the energy, space and cost efficiency in the design phase. These factors’ influence on decision making extends to the whole building process. How these decisions affect the use of the building and user satisfaction as well as maintenance is still not that well understood. This study analyses different schools and day care centers and their energy as well as primary energy use. The buildings are located in southern Finland. Each building has had different objectives with respect to energy efficiency in the design phase. Our objective was to find out how those decisions made in the design and construction phase have influenced the overall energy performance of the building compared to existing building stock of similar building type. The results show that the studied buildings had lower thermal energy consumption compared to existing building stock. Thus the special attention in the design phase allowed achieving the desired goal. However, for the electricity consumption such a correlation could not be found. One of the reasons could be also different service level of buildings (more equipment). Also other quality values could not be compared since such data were not available from the existing building stock. As many earlier studies have indicated users have a high influence on the energy consumption. In the future, when feed-back from the users are obtained it will be interesting to analyze the results and compare what kind of influence that user behavior will have on the overall energy consumption of the studied buildings.
1. Introduction
It is widely agreed that climate change due to emissions of greenhouse gases is one of the major environmental challenges facing our globe today. Carbon dioxide (CO2) is the most important greenhouse gas since it is released in the greatest quantities. The major source for CO2 emissions is the use of fossil fuels in the production of electricity and heat, and for transportation as well as industry. Many nations are committed to reduce emissions as expressed already by the Kyoto agreement (IPCC, 2001) and also in recently released proposals for post Kyoto goals such as the UK year-2050 60% CO2 reduction goal and the EU post Kyoto goal (which aims to reduce CO2 emissions with 15–30% until the year 2020 compared to the 1990 level). The Finnish Government has committed to cut down CO2 emissions by 80% by the year 2050 compare to the level of 1990 [1]. In order to meet these goals it is obvious that the whole energy system including production and use has to undergo significant changes, which most probably are both technical and institutional in nature.
The energy consumption of schools and day care centres is often rather high and do have a clear impact on energy consumption of communities and hence to the energy bill [2,3,4,5,6,7]. For example, in the U.S.A the annual energy bill to operate America’s primary and secondary schools totals nearly $8 billion which is more than it is spent on textbooks and computers combined. Typically as much as 30 percent of a schools total energy is used inefficiently or unnecessarily. According to Butala [8] in Slovenia the schools which had the highest energy consumers also had a poor indoor air quality, as expressed by 60% of the surveyed pupils.
Typical annual heating consumptions for some European school buildings are reported as 96 kWh/m2 for Ireland [9], 192 kWh/m2 for Slovenia [8] and 157 kWh/m2 for the UK [10]. According to the literature [11], the average annual thermal energy consumption of school buildings in Greece is estimated to be close to 31 kWh/m2 for the entire Greek region and 46 kWh/m2 for the coldest climatic zone of Greece, where the examined building sample is located. An older monitoring campaign in the entire Greek region [11,12] found the average annual thermal consumption to be 68 kWh/m2 for non-air-conditioned buildings. Studies on the energy performance of Greek school buildings [13], concluded that there is a considerable potential for energy conservation in heating loads ranging from 36% to 72% compared to the present state.
The energy efficiency of 15 schools in Argentina was reported in [14]. The average annual energy consumption was 123 kWh/m2 while 87% of the primary and secondary schools were characterized as “low emission buildings”. The life cycle energy consumption of 20 public secondary school projects in New South Wales, Australia is reported in [15]. The energy consumption in 29 investigated school buildings in Slovenia was found to exceed the acceptable limits of the Slovenian codes [8]. In the same study the IEQ is reported as rather poor, with CO2 concentrations exceeding 4000 ppm. The thermal and electrical energy consumption is reported in [16] for a total of 42 schools in Perugia, Italy. Energy indices are derived for three different types of schools classified according to their construction period. In addition, a total of 117 schools were investigated in the Province of Torino [17], in order to derive energy consumption indices. The obtained average annual consumption for space heating was 100 kWh/m2. According to the Natural Resources Canada, the average annual energy consumption of schools in Canada is 472kWh/m2, while the reference building according to the Model National Energy Code for Buildings (MNECB) of Canada averages 357 kWh/m2 [18]. However, even under the adverse winter Canadian conditions there are excellent examples of energy efficient buildings. For example, a 2300 m2 school with actual energy consumption of 72 kWh/m2 as a result of well insulated thermal envelope (0.27 W/(m2 K) for walls, 0.25 W/(m2 K) for roof), double-pane, low-e glazing filled with argon, low lighting power demand (8.7 W/m2) optimizing the use of daylight and high efficient lamps, geothermal heat pumps, two solar walls for preheating the outdoor fresh air entering the building, heat recovery, occupancy and CO2 sensors connected on an intelligent control system [19].
In Finland municipalities, municipal federations, and public corporations owned by them possessed all together 35,471 buildings in 2005. Gross floor area in these buildings is 33 billion square meters and gross volume 140 billion cubic meters. Out of the number of these buildings 65% (22,557 pcs) are other than residential buildings, i.e., public buildings, corresponding to 85% of the floor area (28 billion m2).
The greatest group in floor area and volume are elementary schools and high schools which total 25% of the building stock. Judging by these indicators the second greatest group is “other buildings” which consists mainly (60%) of industrial buildings, agricultural buildings (30%), and commercial buildings (10%). The third largest group is formed by welfare buildings. Offices and places of assembly constitute for equal shares of the public building stock.
Buildings are complex industrial products which have a long life time, commonly many decades. Health issues related to the environmental impacts of buildings, e.g., sick building syndrome, have increased the awareness of the role of the buildings in our wellbeing and health. There are already many efforts to control and manage quality of buildings (e.g., building codes, automation and control schemes, thermal comfort), but holistic approaches have been in a minor role [20,21], especially in the design stage as the holistic approach is still in a very modest role in practice. However, it is in the design stage in which the greatest opportunities are to choose effective solutions whose benefits can last for decades.
In Finland, residential and commercial buildings account for 40% of all energy use, in addition commercial and apartment buildings have a notable influence on the peak demand in some periods. Energy and electric intensity in commercial buildings has clearly increased, and residential energy use continues to increase (mainly due to electricity use).
For Finnish climate thermal energy use is dominating in the building stock. The heating degree day in Espoo (southern Finland) in the year 2008 was 3836 °Cd and whereas it was in Sodankylä (northern Finland) 5865 °Cd in the same year. The Finnish building stock is relatively new, as the majority of the buildings were built in the years 1960–1970 thus, the exterior walls have rather good thermal insulation. In new buildings the thermal insulation corresponds to 0.25–0.17 W/(m2 K) For old building stock typically only mechanical exhaust or natural ventilation is used, but in new buildings the ventilation heat recovery is in practice in every building.
Key features of the Finnish energy policy are improved energy efficiency and increased use of renewable energy sources [22]. To achieve these goals, a target set by the authorities, both energy savings and increased use of low primary energy sources are therefore priority areas. Building low-energy buildings, characterized by lower thermal energy demand than new buildings with ordinary energy standard, is in accordance with the declared national aim of reducing energy use. However, the use of electricity and domestic hot water will be of more importance to CO2 emissions in the future.
The space heat demand of buildings has decreased by improved insulation, reduced air leakage and by heat recovery from ventilation air. However, the actual amount of energy used in buildings is often different from the calculated or expected energy use. According to Haas et al. [23], energy savings due to conservation measures will be lower in practice than those calculated because the impact of consumer behavior is neglected. The difference between actual and predicted energy use depends on the final realization of the construction and the technical installations, and on the utilization of the dwelling’s systems, such as interior temperature and ventilation rate [23]. For example, in this experimental study by Branco et al. [24], in which the measurement period was over three years, the real energy use was 50% higher than the estimated energy use (246 MJ/m2 as opposed to 160 MJ/m2) in multi-family buildings in Switzerland. The differences between measured and calculated values was due to the real conditions of utilization, the real performance of the complete technical system and the actual weather conditions. In another study on the effect of an energy audit on energy use in dwellings in the USA, Hirst and Goeltz [25] found that less energy was saved than was predicted by the audit.
The main objective of the study was to find out how much the targets in energy saving at design phase are affecting the actual use of the energy and primary energy compared to the existing building stock with similar type of buildings in the same city. This study focuses on schools and day care centers.
2. Methods and Studied Buildings
The studied buildings were located in south Finland in the city of Espoo. All buildings were rather new ones completed after the year 2000. The studied buildings were mainly schools, but two day care centers were also included. Energy use in all buildings was monitored at least at a monthly level. The monitored energy consumptions were thermal energy (space heating and domestic hot water) and electricity. The thermal energy could not be separated for space heating and domestic hot water since the measurement is done only for the total thermal energy. In addition water consumption was monitored. Three of the buildings were still in the design or construction phase thus no measurements of energy consumption were available.
Two of the buildings were pilot buildings in a climate change and environment program called Julia 2030. This national program has 30 pilot buildings for energy efficiency. The aim is to decrease their emissions by 8% from year 2009 to year 2011. The reductions are done by decreasing electricity and thermal energy consumption as well as by reducing the use of paper. Also the decrease in waste production and waste separation has a high importance in the program. In Finland a voluntary indoor climate classification [26] has a rather high priority and often some target values in the design phase are set according to indoor climate classification. The Classification has three categories: S1, S2 and S3. Category S1 corresponds to the best quality, meaning higher satisfaction with the indoor climate and personal options to control the air quality. Category S3 the corresponding level by Finnish building codes. The Classification is commonly used in office and public buildings. In addition to the target values, the Classification gives the most important design values for heating, ventilation and air conditioning equipment and systems. The studied buildings are shown in Table 1. As a reference the whole building stock of schools and day care centers in the same city was used.

| Type | Year of Completion | No. of Occupants | Gross Area (m2) | AB/AS * | Indoor Climate | Energy |
|---|---|---|---|---|---|---|
| Day care centre | 2008 | 100 | 1290 | 1.35 | S3 and 20% option for increased ventilation | Part of environment program |
| School | 2003 | 3376 | ||||
| School | 2009 | 664 | 7770 | 1.5 | S3 and 20% option for increased ventilation | Part of environment saving program, solar heat, ground cooling |
| School | 2010 | S3 and 20% option for increased ventilation | ||||
| School | 2005 | 235 | 3270 | S3 and demand controlled ventilation with CO2 sensors | Energy and water use measurement and feedback to user | |
| School | 2010 | 705 | 9835 | S3 and 20% option for increased ventilation | Renovation | |
| School | 2009 | 425 | 5300 | S3 and 20% option for increased ventilation | Renovation | |
| Day care centre | 2006 | 113 | 1656 | 1.5 | S3 and 20% option for increased ventilation |
* AB/AS corresponds to the ratio of gross floor area of the building and gross area of the building site (schools or day care centre’s parcel). This value is typically used in Finnish building permission in defining the preferred gross floor area in the building site.
Primary Energy Factors
The studied alternatives for primary energy factors are shown in Table 2. The average values in district heating and electricity refer to average values in Finland between the years 2000–2008. In Finland 75% of the district heating is produced in electricity co-generations power plants.
| Primary Energy Factor | |
|---|---|
| District heating | 0.9 |
| Electricity | 2.2 |
| Oil | 1.0 |
| Pellets and wood | 1.0 |
3. Results
3.1. Building Size and Year of Completion
Since building size and architecture are one of the key factors in efficient energy and space use, first the building floor area and its increase or decrease trends were studied. It seems that the gross floor area has been rather similar during the last 100 years but the gross volume has higher deviation and has tended to increase towards this century. However, a clear trend cannot be seen, as shown in Figure 1. It can be seen that the studied buildings as similar to the main building stock in their gross floor area. In addition the proportion between gross floor area and building volume are rather similar in the studied buildings compared to existing building stock, as shown in Figure 2, which means that the architecture has in that sense remained rather similar. For example the share of lobbies or corridors with low floor area but high volume has not increased or decreased during these years. Thus, the geometry of the new buildings is not different compared to existing stock. This is slightly surprising since the building geometry has a rather big impact on energy consumption.
Figure 1.
Gross floor area and volume of studied buildings compared to Espoo building stock in schools and day care centers.
Figure 1.
Gross floor area and volume of studied buildings compared to Espoo building stock in schools and day care centers.
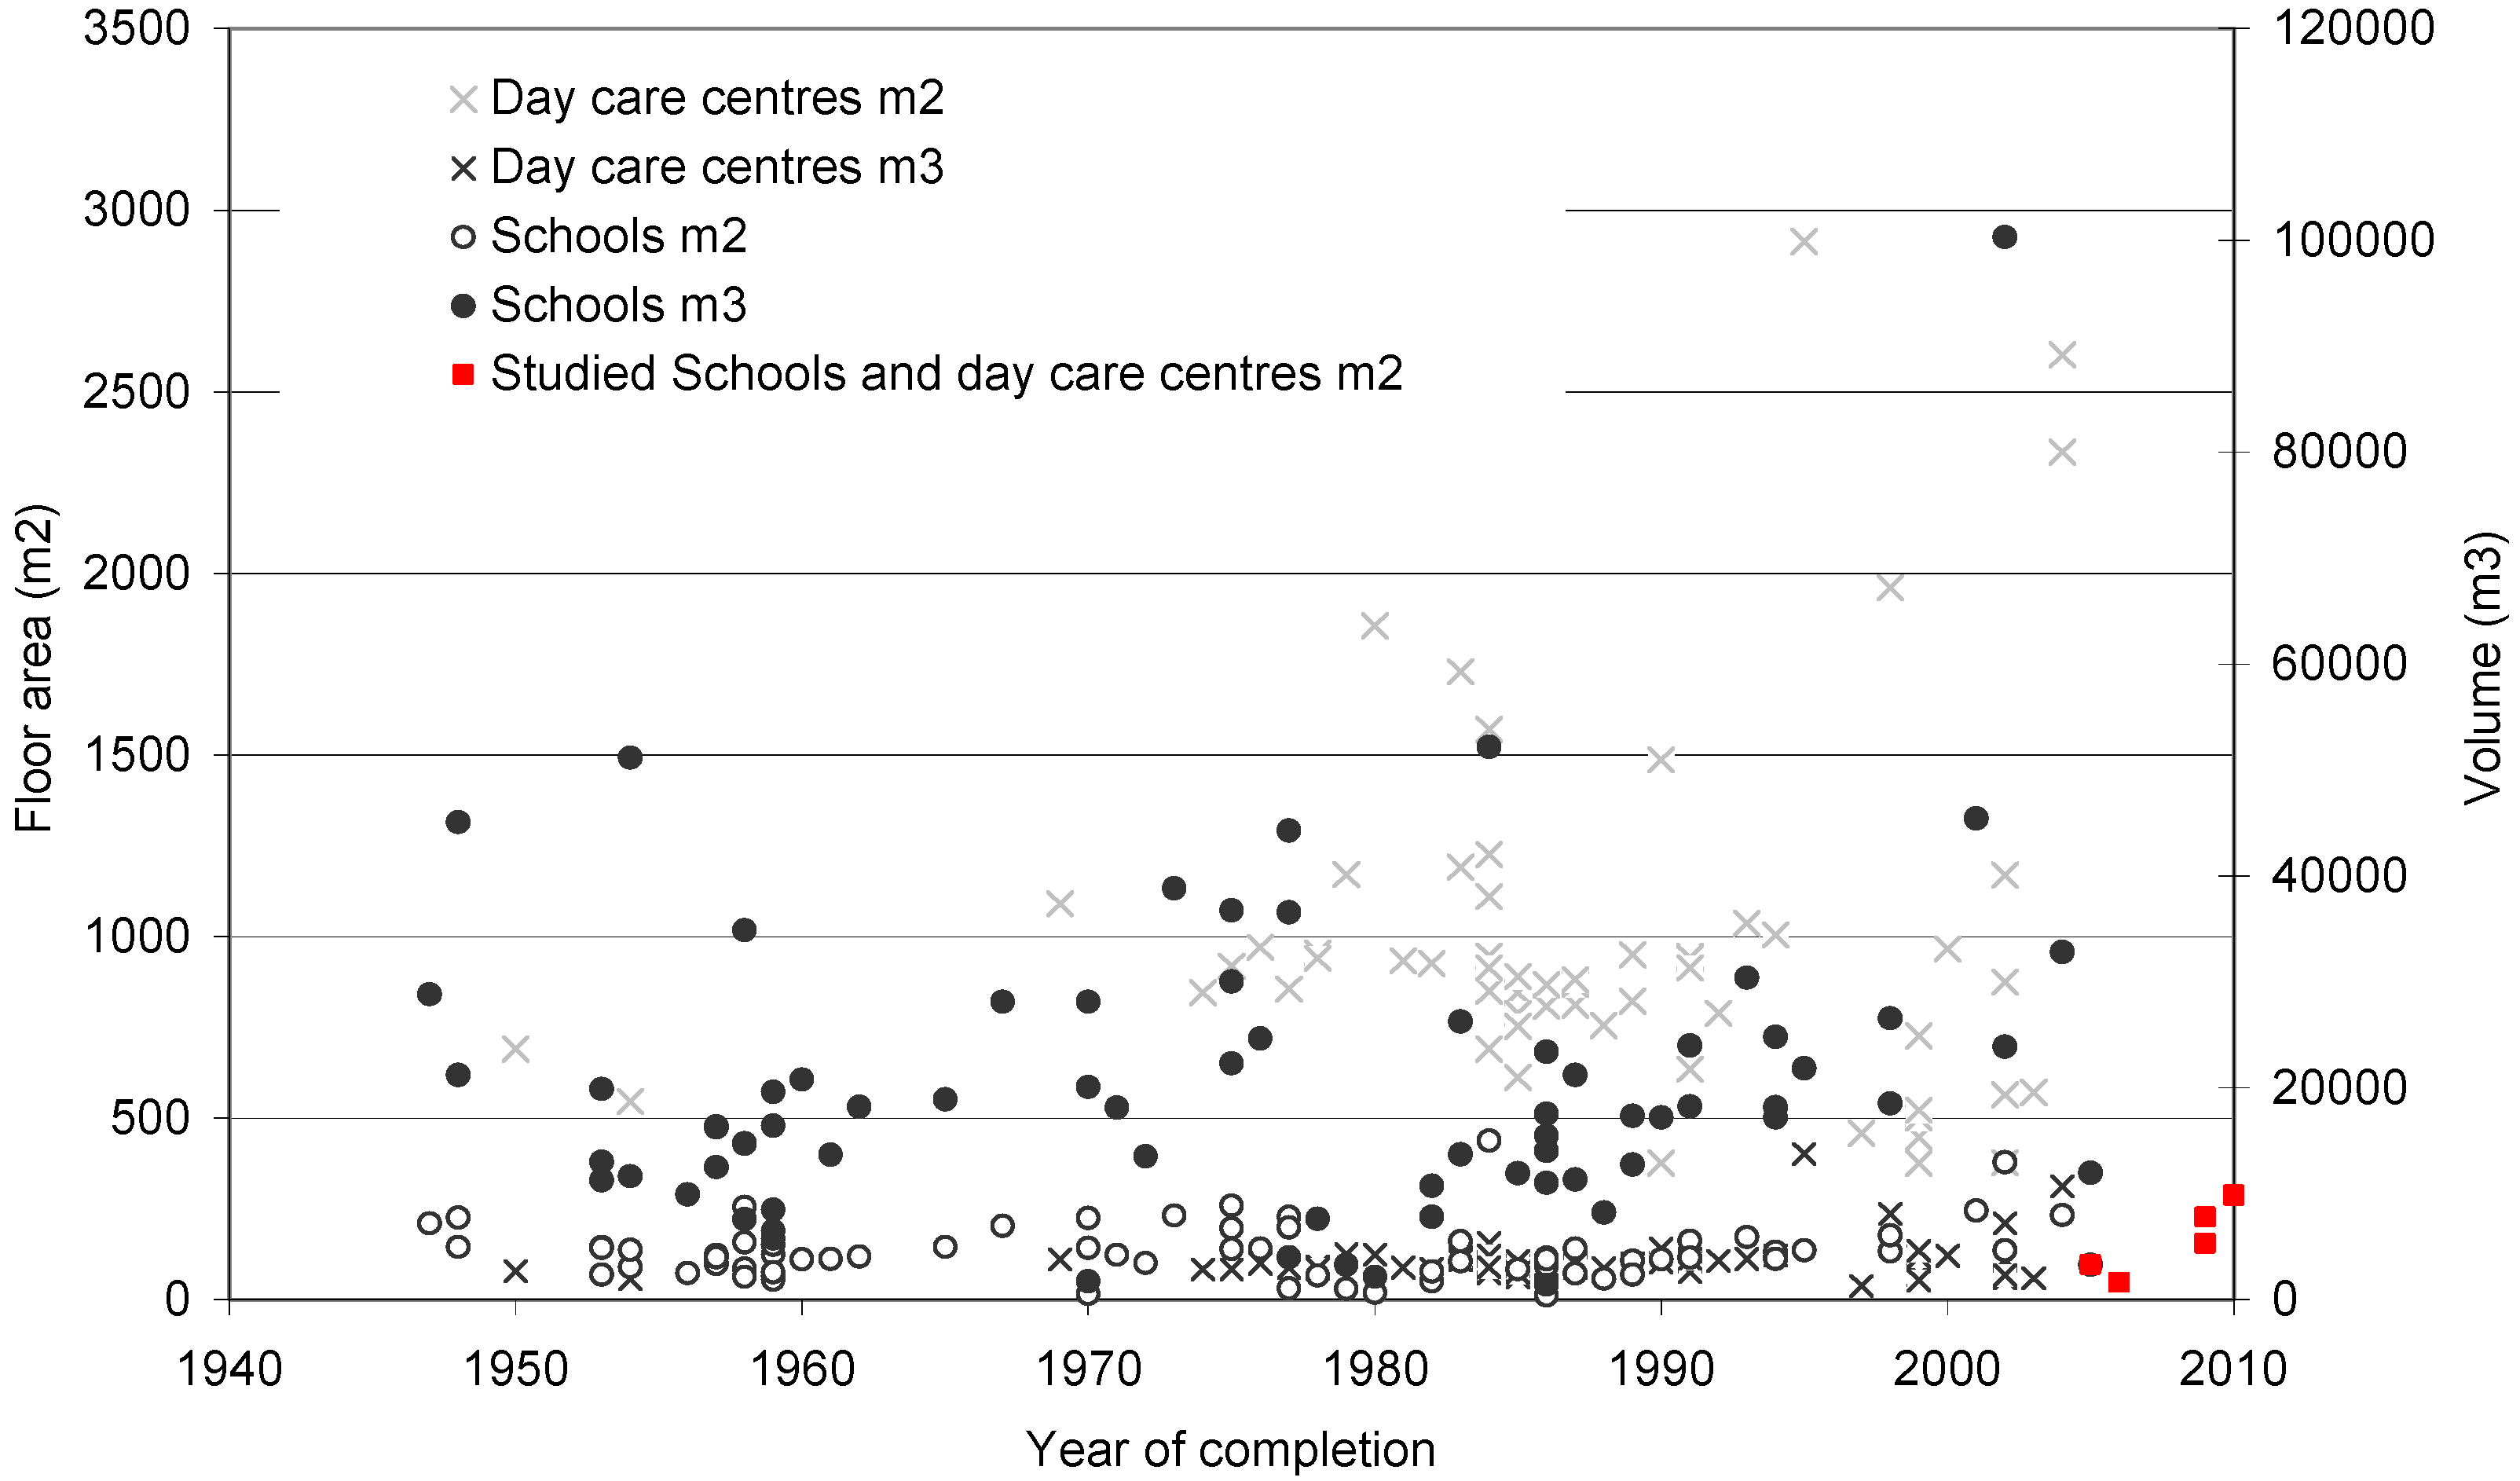
Figure 2.
Gross floor area and volume proportion (A/V-proportion) of studied buildings compared to Espoo building stock in schools and day care centers.
Figure 2.
Gross floor area and volume proportion (A/V-proportion) of studied buildings compared to Espoo building stock in schools and day care centers.
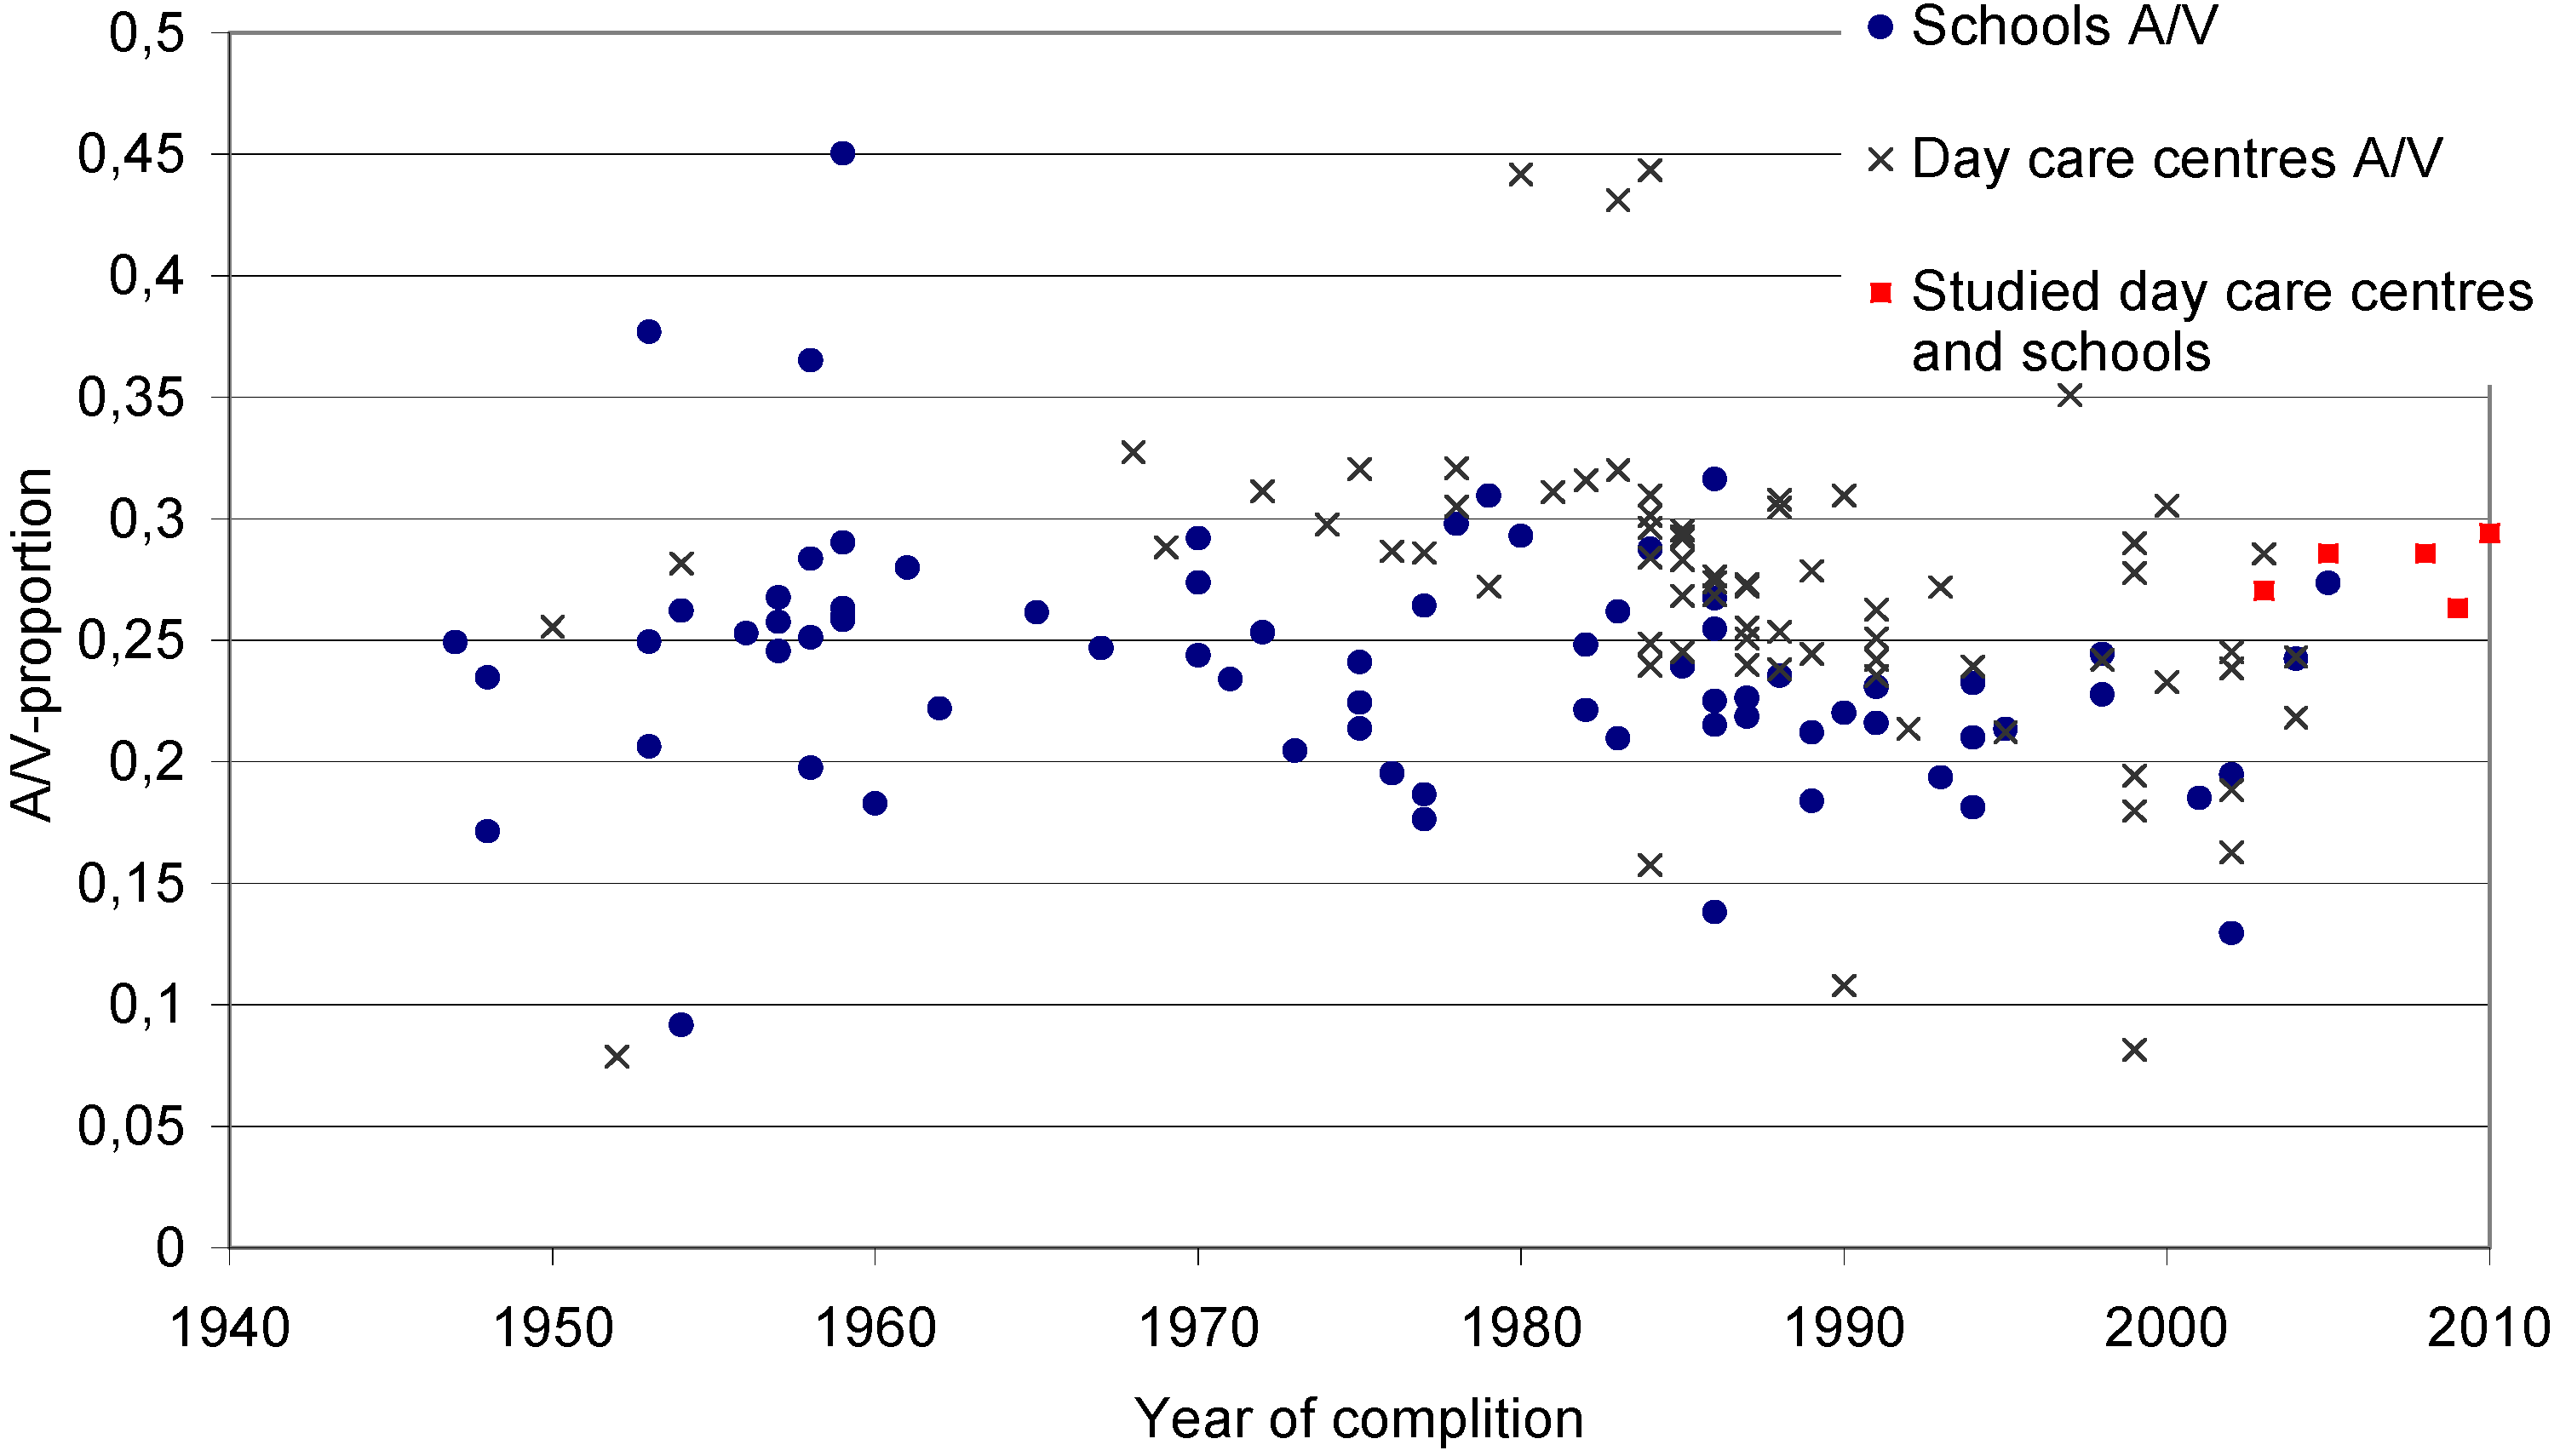
When the proportion between gross floor area and building volume was compared it seems that the ratio has remained the same.
3.2. Thermal Energy Consumption
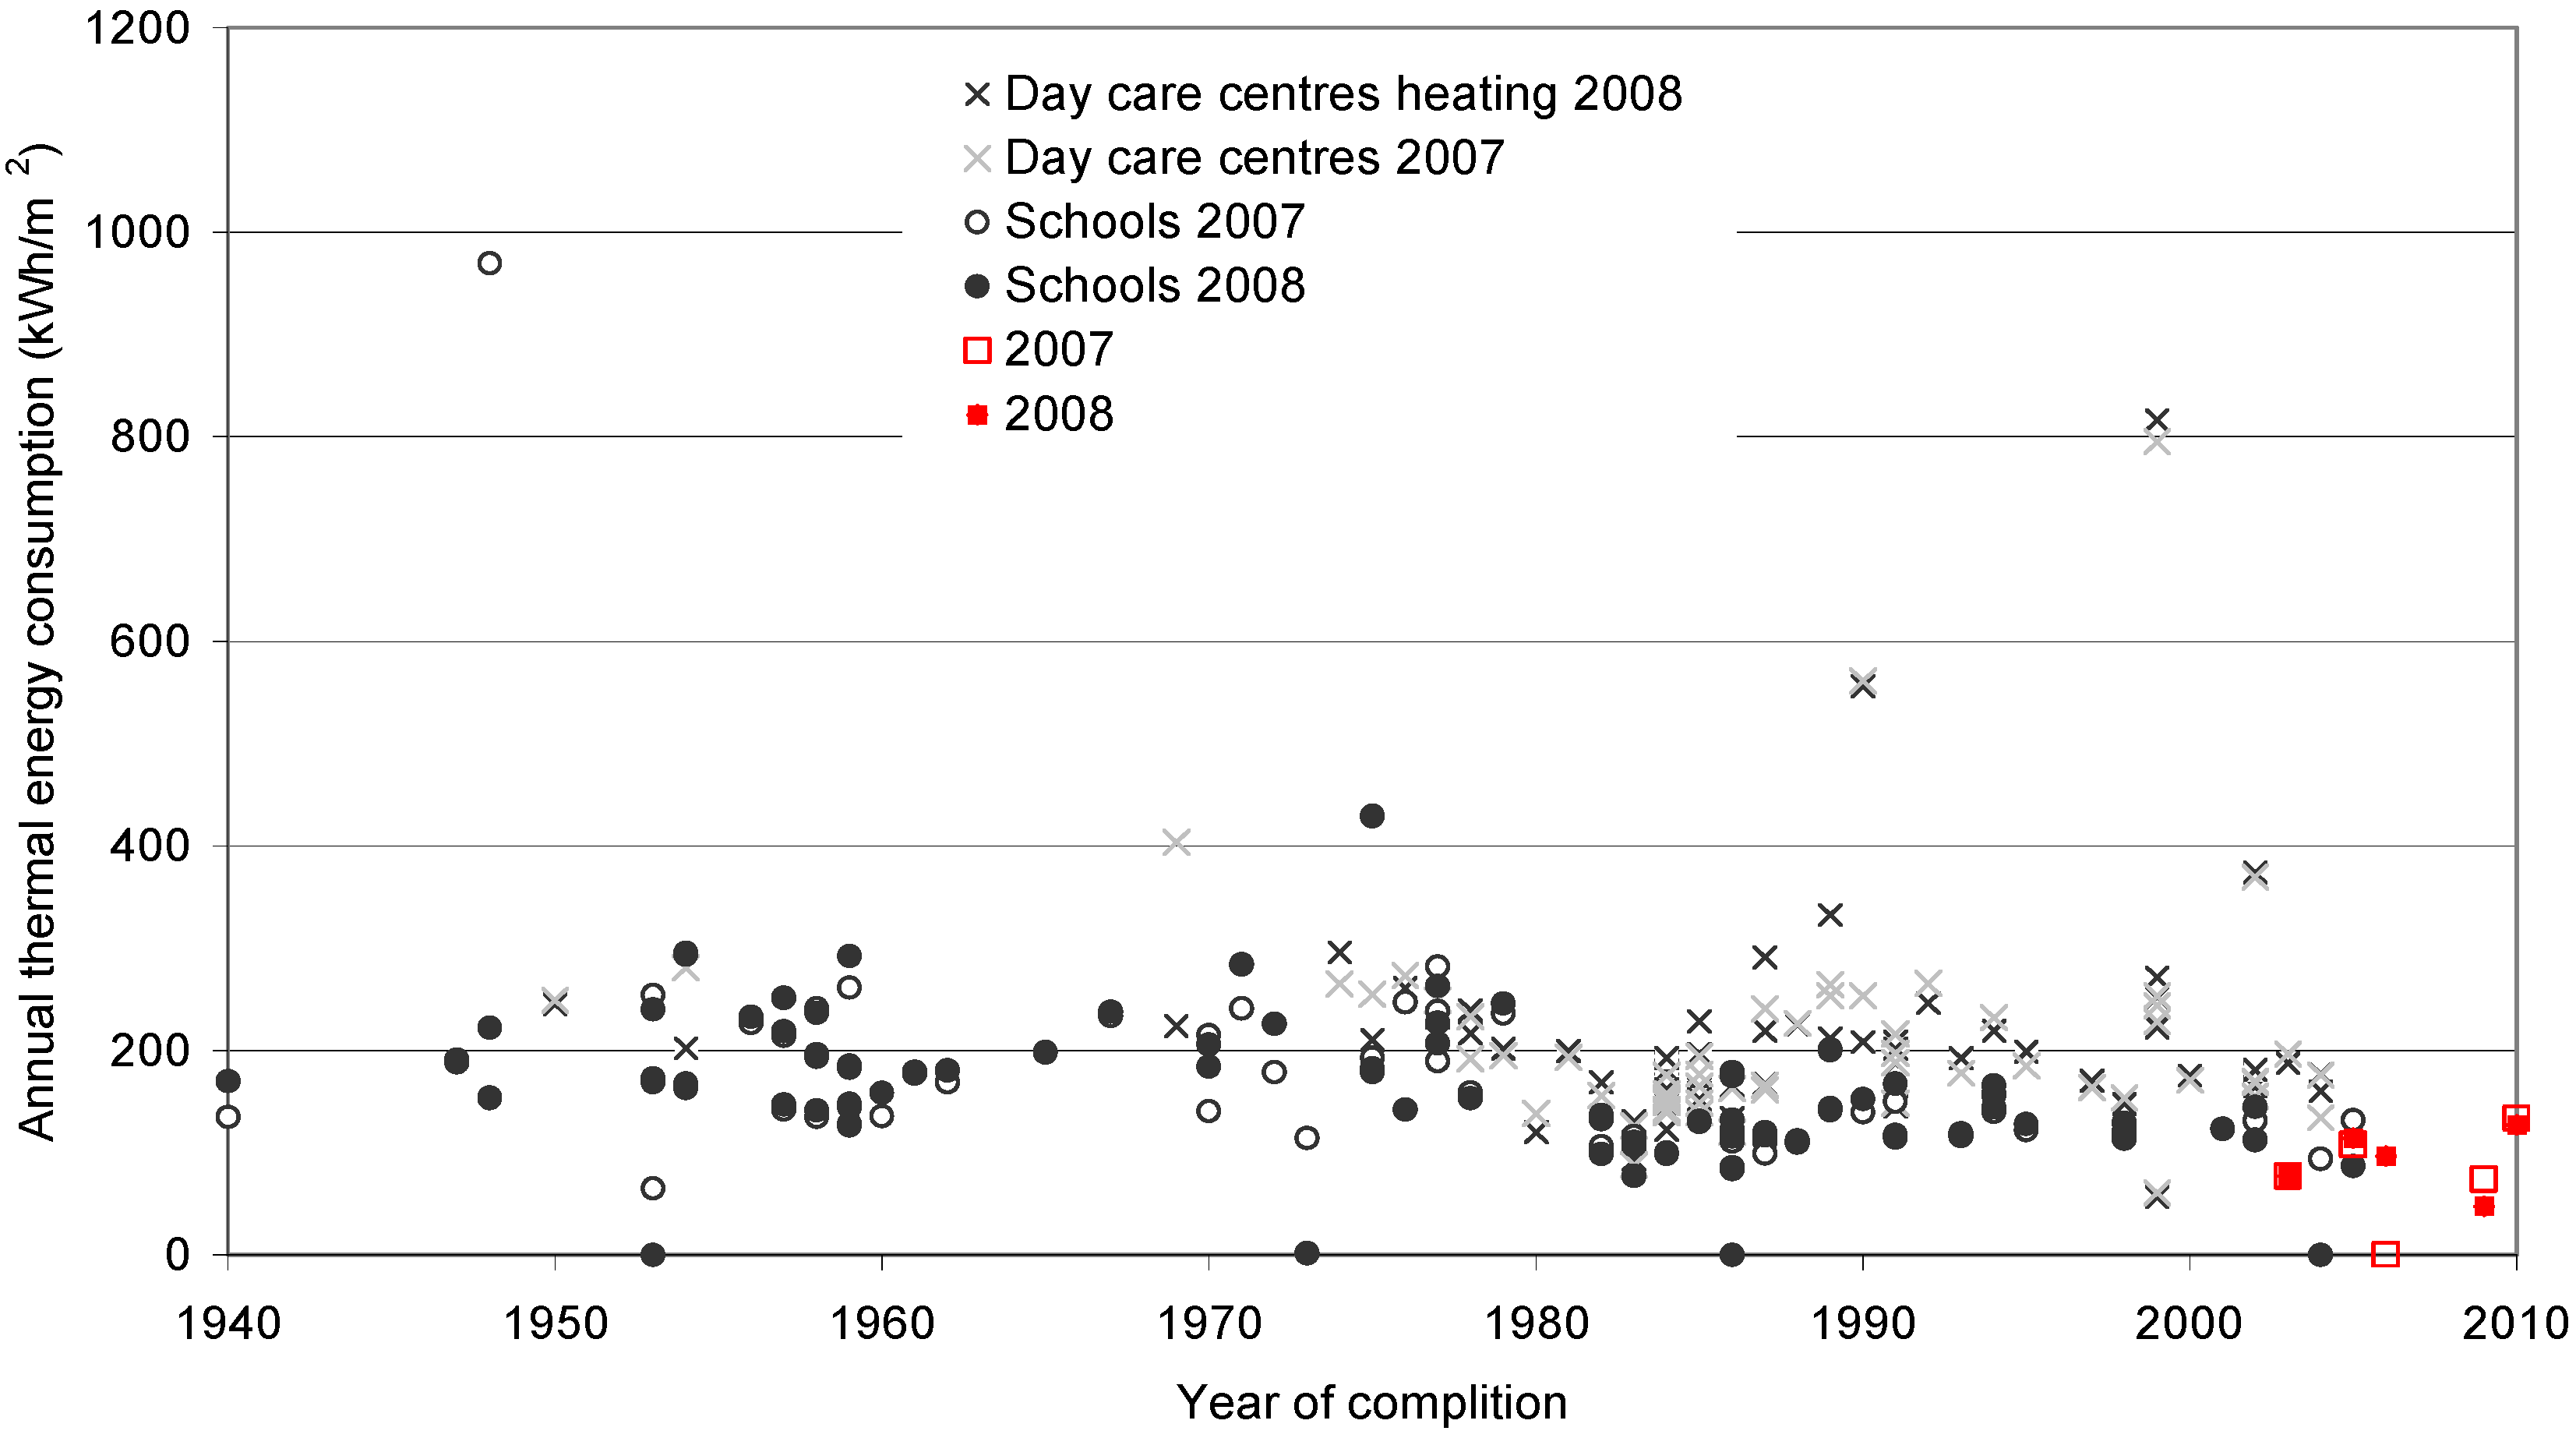
The measured thermal energy consumption includes both space heating and domestic hot water heating. Majority of the buildings are connected to a district heating network. As shown in Figure 3, when the thermal energy is studied a slight decreasing trend in consumption can be seen, that is, newer buildings consuming slightly less thermal energy. However, this was not true with all buildings. In measured thermal energy consumptions clearly lower thermal energy consumption can be seen in the studied buildings in which the energy efficiency has been a higher priority in design. In addition the building code has changed during years resulting in lower reference U-values (better insulation) and higher ventilation heat recovery values. Even though the building use profiles are clearly different in schools and day care centers, no big difference between these two building types could be indentified in the measured thermal energy. The day care centers did have slightly higher thermal energy consumption in rather modern buildings (built after 1985). Also there were no clear differences between day care centers and schools, even though generally the hot water consumption and opening hours are slightly higher in day care centers. It seems that the improvements in energy efficiency during the years has also improved the quality of air (higher ventilation rates) which have lead the higher energy consumption and therefore the trend between years 1970 to 2000 is only a slight decrease in thermal energy consumption. However, a stronger trend towards lower thermal energy consumption can be seen between the years 2000–2010. The normalized thermal energy consumptions were rather similar in studied building during many years (not shown in the Figure), indicating the consumption is rather stable and no big changes nor complaining from the users.
Figure 3.
Annual thermal energy consumption in studied buildings and reference building stock in the city of Espoo. Thermal energy consumption includes both space heating and domestic hot water.
Figure 3.
Annual thermal energy consumption in studied buildings and reference building stock in the city of Espoo. Thermal energy consumption includes both space heating and domestic hot water.
3.3. Electricity Consumption
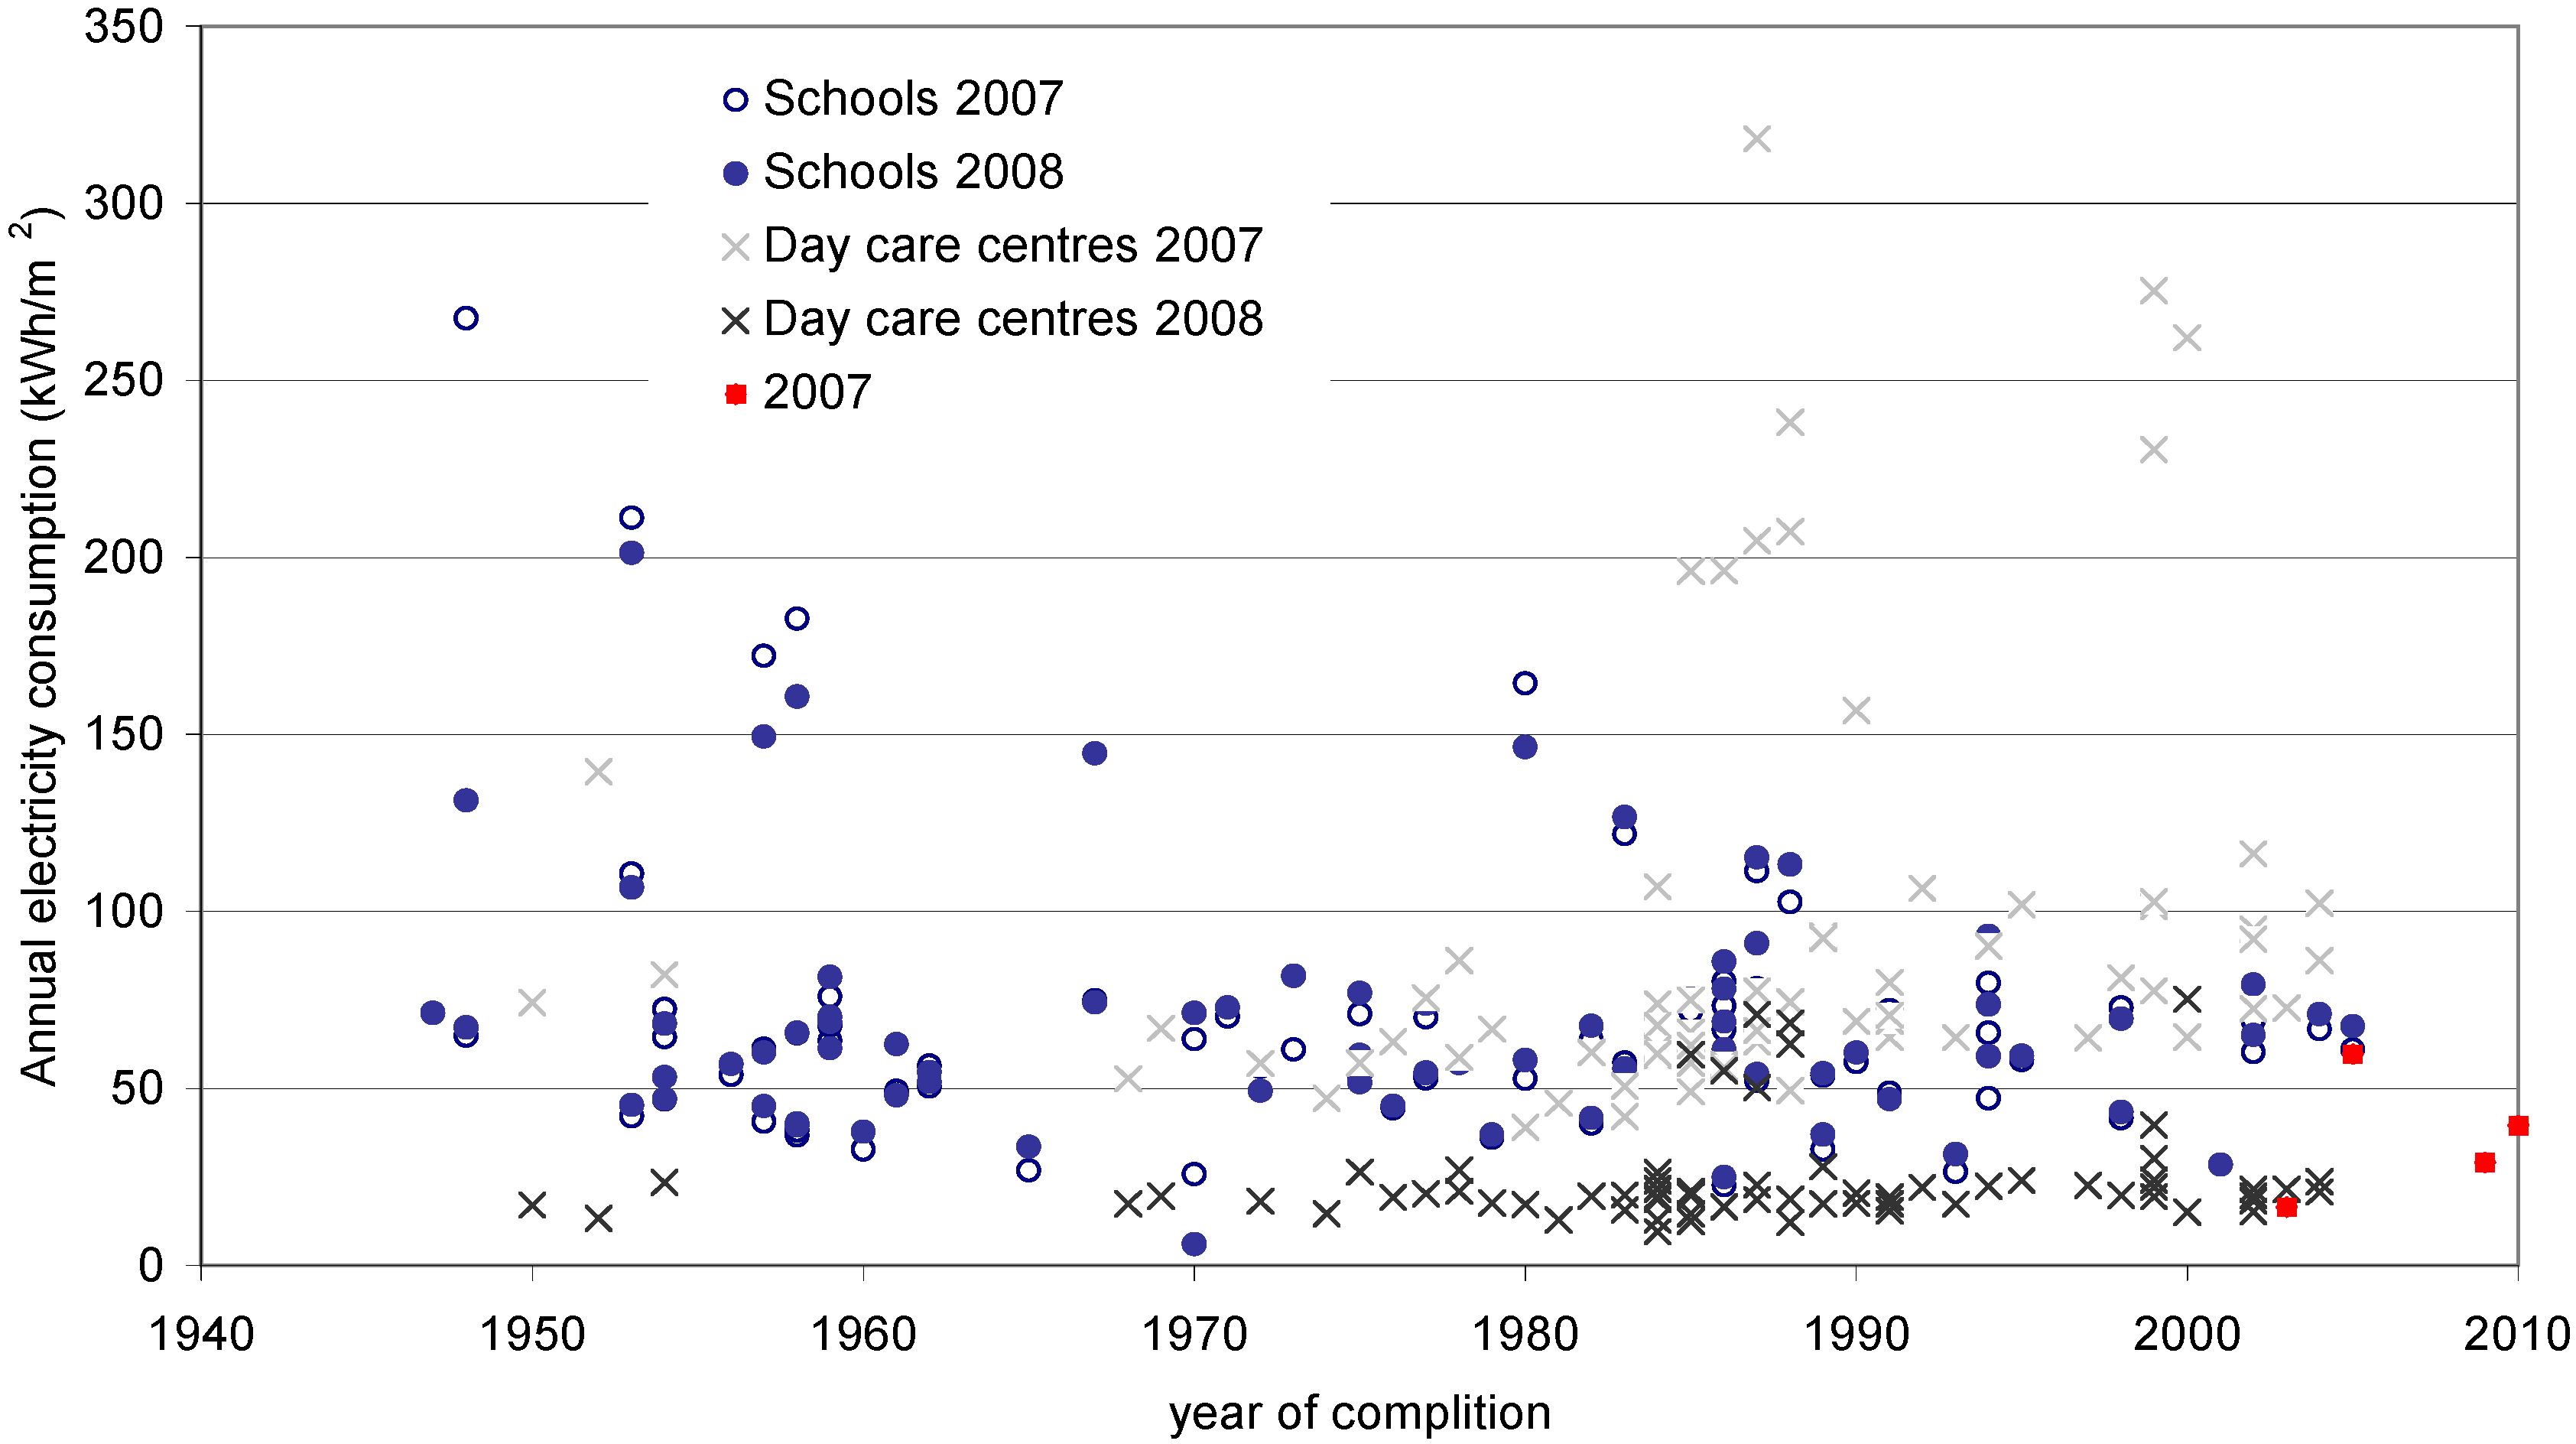
The electricity consumption does not have any trends, and the consumption values are scattered. As shown in Figure 4, the studied buildings also did not perform better in electricity use compared to relevant building stock in the same city. Both in schools and in day care centers the electricity consumption was mainly higher in the year 2007 compared to 2008. However, there were some problems in electricity measurement readings and the values from year 2008 might not be reliable. In addition in some of the day care centers renovations were done, which can be seen in higher electricity use. Especially in the day care centers the differences between these two years were substantial. There was not clear evidence why this had happened but part of the reason could be that the city performed some energy audits during those years and some of the components are changed. The studied buildings did not perform better compared to reference buildings in the electricity consumption.
Figure 4.
Annual electricity consumption in studied buildings (data from year 2007) and reference building stock (data from years 2007 and 2008).
Figure 4.
Annual electricity consumption in studied buildings (data from year 2007) and reference building stock (data from years 2007 and 2008).
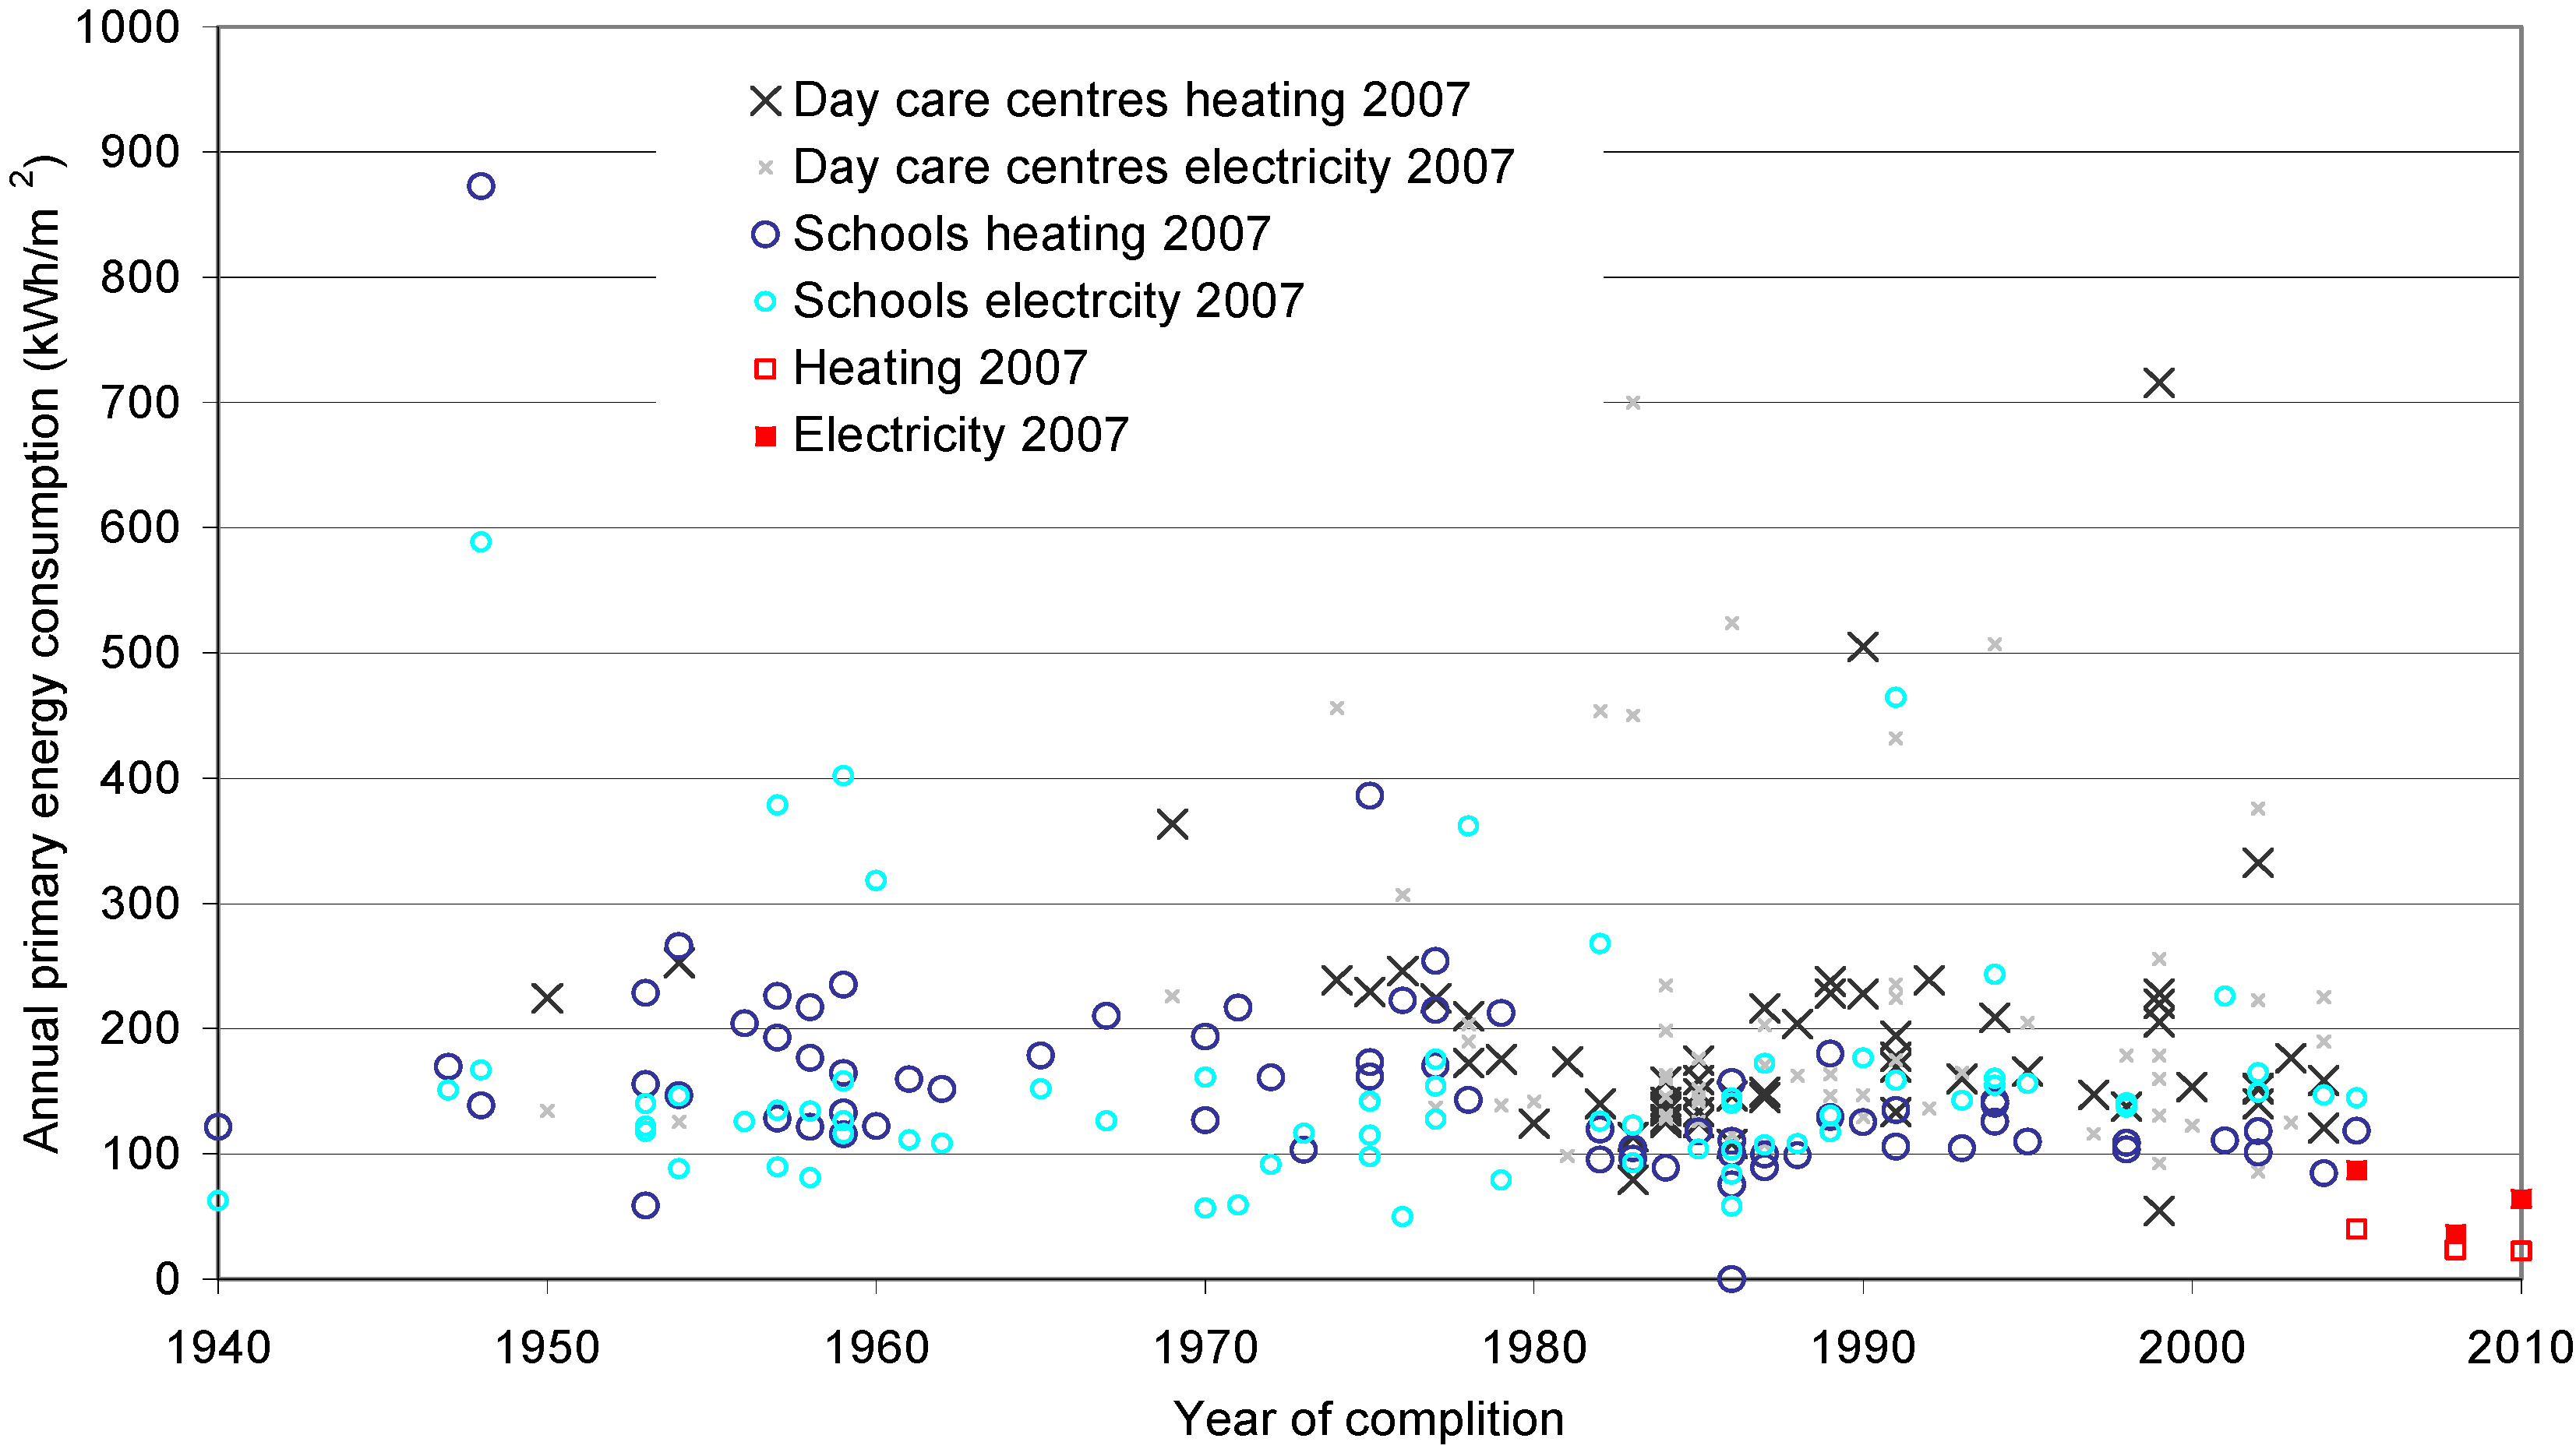
3.4. Primary Energy Consumption
The primary energy consumption of the studied buildings was lower in thermal energy than in the existing building stock (schools and day care centers), as shown in Figure 5. In electricity the primary energy use was slightly lower than in the existing building stock. However, the differences were not substantial and especially some of the studied energy efficient buildings did not perform better in heating than a rather new reference building. All studied buildings are connected to district heating.
Figure 5.
Annual primary energy consumption in studied buildings (data from year 2007) and reference building stock (data from years 2007 and 2008).
Figure 5.
Annual primary energy consumption in studied buildings (data from year 2007) and reference building stock (data from years 2007 and 2008).

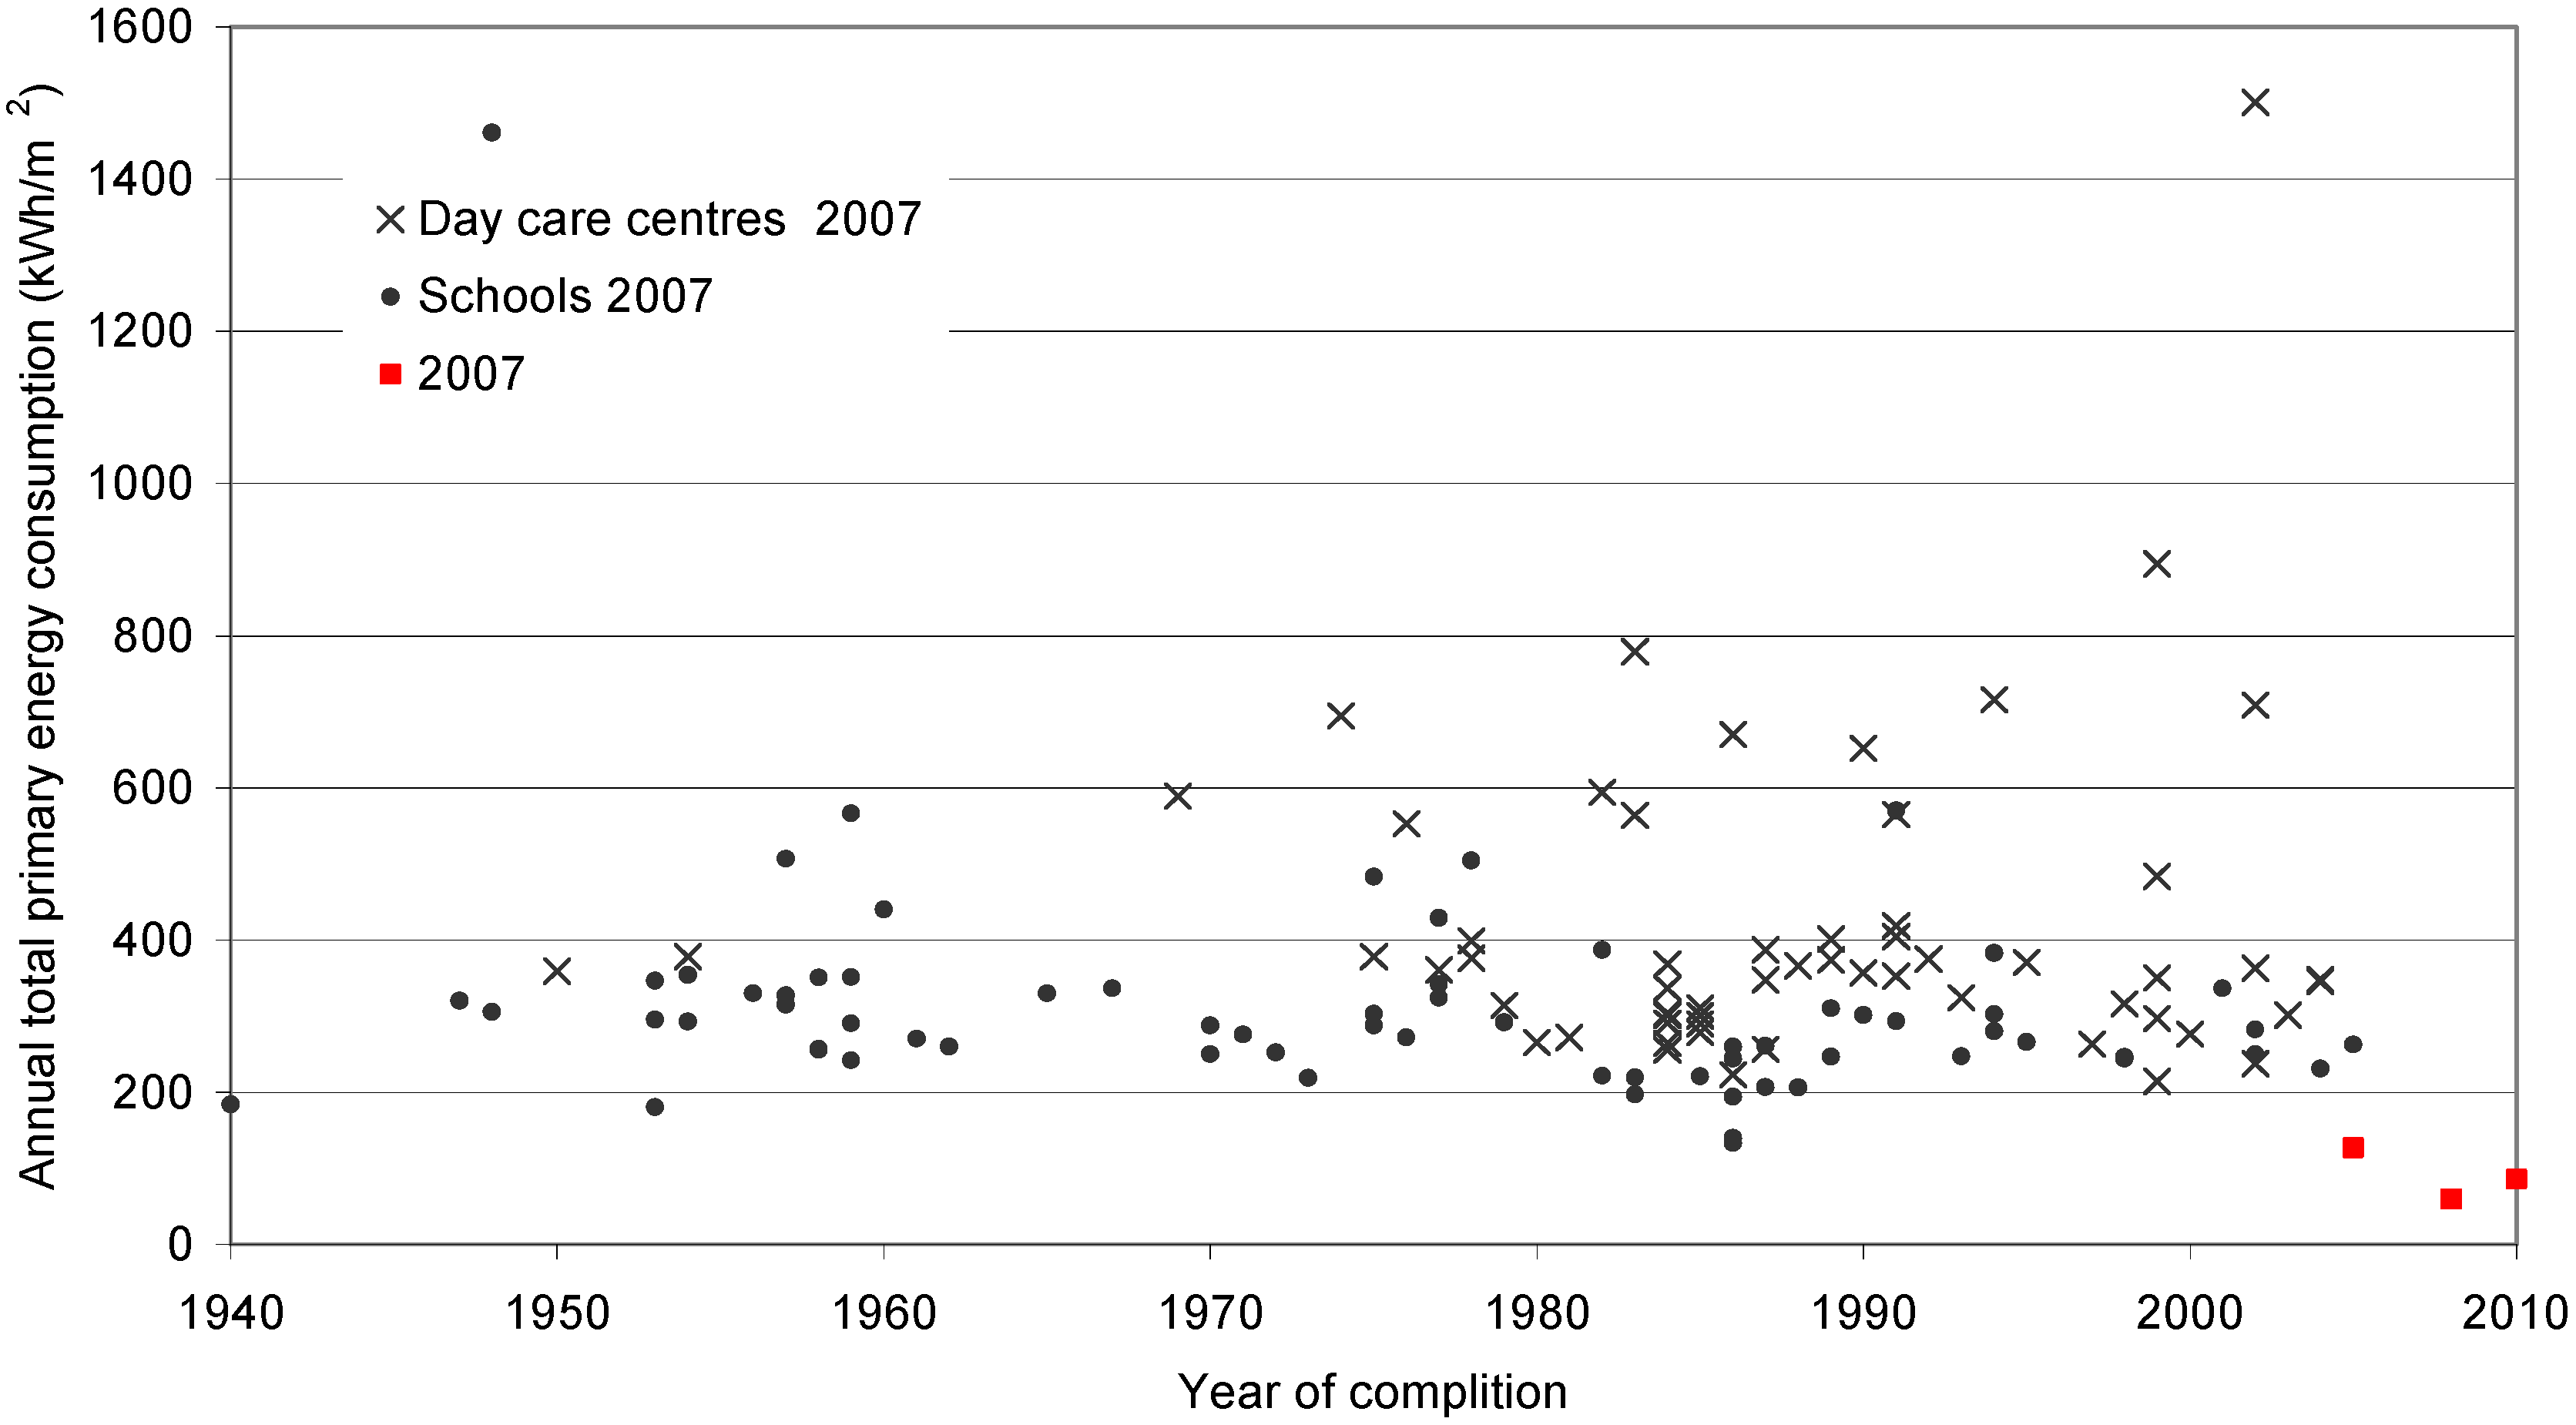
When the total primary energy consumption was compared the slight differences added up to bigger differences and the deviation can be seen more clearly in Figure 6. The whole primary energy consumption was lower in the studied buildings compared to the existing building stock. However, again, some of the reference buildings did have the total primary energy consumption at the same level emphasizing how important the building use and users are.
Figure 6.
Total primary energy consumption in studied buildings (data from year 2007) and reference building stock (data from year 2007).
Figure 6.
Total primary energy consumption in studied buildings (data from year 2007) and reference building stock (data from year 2007).

4. Discussion and Conclusions
The studied buildings were all completed after the year 2000, and thus are rather new buildings. Also all buildings had some target values in respect to energy or eco-efficiency. In addition they had good indoor climate targets. When the studied buildings were compared to relevant building stock in the same city it was found out that the thermal energy consumption was smaller in the studied buildings where a special attention was paid to energy efficiency in the design phase. However, for the electricity consumption such a correlation could not be found. One of the reasons could be also different service level of buildings (more equipment). Also other quality values could not be compared since such data were not available from the existing building stock. However, it seems that the new buildings do not have stingingly lower energy consumption. But when the primary energy consumptions were compared, a slight difference could be seen indicating the studied buildings in which attention was paid to energy efficiency in the design phase, were using less primary energy. However, in some other previous studies a clear correlation between new buildings and low energy consumption could be found. This clearly shows how complicated the relationships in energy consumption and the factors affecting it are. In this study some of the buildings in the existing building stock reached the same level in the primary energy use. This shows the importance of the building use and users’ impact on primary energy use.
In this study the studied buildings were connected to a district heating network which was typical also in the existing building stock. Currently there are many new buildings in the design phase which are located in the district heating area network but are considering ground heating as a more eco-friendly option. However, in district heating network areas, where the heat is produced in co-generation (heat and power), ground heat would increase the use of electricity and decrease the use of district heating, which in the long run will ruin the benefits of co-generation of heat and power, and might even lead to increased primary energy use. In addition that will result in increasing the peak demand of the electricity which will lead to higher CO2 emissions in current Finnish energy production profile. Therefore it is important that the heating options are considered carefully and the district optimum in also considered since the local building optimum might not lead to a optimal solution in respect of energy generation.
As many earlier studies have indicated, users have a high influence on the energy consumption. In the future, when feedback for the users are informed it will be interesting to analyse the results and compare what kind of influence that will be on the overall energy consumption of the studied buildings. The user information and real time feed back is also extremely important in respect to peak shaving. The demand side has a huge potential in shaving the peak and should be utilised much more effectively.
Acknowledgements
This study was funded by City of Espoo which is greatly acknowledged for the support. Also the persons from City of Espoo are greatly acknowledged for the fruitful discussions during this ongoing process.
References
- Finnish Government. The Future of Finnish Climate and Energy Policy; 2009. Available online: http://www.valtioneuvosto.fi/toiminta/tulevaisuusselonteko/fi.jsp (accessed on 5 May 2011).
- EU Energy and Transport in Figures, Statistical Pocket Book 2007/2008; European Communities: Brussels, Belgium, 2008.
- Intergovernmental Panel on Climate Change (IPCC). Climate Change 2001: Mitigation, Third Assessment Report, Working Group III; IPCC: New York, NY, USA, 2001. [Google Scholar]
- Recast of the Energy Performance of Buildings Directive (2002/91/EC); COM (2010) 755/SEC(2010) 2821; Commission of the European Communities: Brussels, Belgium, 2010.
- A European Strategic Energy Technology Plan (SET-PLAN); COM (2007) 723 Final. Commission of the European Communities: Brussels, Belgium, 2007. Available online: http://eur-lex.europa.eu/LexUriServ/LexUriServ.do?uri=COM:2007:0723:FIN:EN:PDF (accessed on 22 November 2007).
- Itard, L.; Meijer, F. Towards a Sustainable Northern European Housing Stock: Figures, Facts and Future; IOS Press: Amsterdam, The Netherlands, 2009. [Google Scholar]
- Towards Energy Efficient Buildings in Europe; Final Report. EuroACE: London, UK, 2004. Available online: http://www.euroace.org/EuroACE%20documents/050731%20Towards%20Energy%20Efficient%20Buildings%20in%20Europe%20(Jul%2005%20update).pdf (accessed on 5 May 2011).
- Butala, V.; Novak, P. Energy consumption and potential energy savings in old school buildings. Energy Build. 1999, 29, 241–246. [Google Scholar] [CrossRef]
- Hernandez, O.; Burke, K.; Lewis, J.O. Development of energy performance benchmarks and building energy ratings for non-domestic buildings: An example for Irish primary schools. Energy Build. 2008, 40, 249–254. [Google Scholar] [CrossRef]
- Good Practice Guide. In GPG343: Saving Energy—A Whole School Approach; The Carbon Trust: London, UK, 2005.
- Gaglia, A.; Balaras, C.A.; Mirasgedis, S.; Georgopoulou, E.; Sarafidis, Y.; Lalas, D.P. Empirical assessment of the Hellenic non-residential building stock, energy consumption, emissions and potential energy savings. Energy Convers. Manag. 2007, 48, 1160–1175. [Google Scholar] [CrossRef]
- Santamouris, M.; Balaras, C.A.; Dascalaki, E.; Argiriou, A.; Gaglia, A. Energy consumption and the potential for energy conservation in school buildings in Hellas. Energy 1994, 19, 653–660. [Google Scholar] [CrossRef]
- Santamouris, M.; Mihalakakou, G.; Patargias, P.; Gaitani, N.; Sfakianaki, K.; Papaglastra, M.; Pavlou, C.; Doukas, P.; Primikiri, E.; Geros, V.; et al. Using intelligent clustering techniques to classify the energy performance of school buildings. Energy Build. 2007, 39, 45–51. [Google Scholar]
- Filippín, C. Benchmarking the energy efficiency and greenhouse gases emissions of school buildings in central Argentina. Build. Environ. 2000, 35, 407–414. [Google Scholar] [CrossRef]
- Ding, G. Life cycle energy assessment of Australian secondary schools. Build. Res. Inf. 2007, 35, 487–500. [Google Scholar] [CrossRef]
- Desideri, U.; Proietti, S. Analysis of energy consumption in the high schools of a province in central Italy. Energy Build. 2002, 34, 1003–1016. [Google Scholar] [CrossRef]
- Corgnati, S.P.; Viazzo, S.; Filippi, M. A method for heating consumption assessment in existing buildings: a field survey concerning 120 Italian schools. Energy Build. 2008, 40, 801–809. [Google Scholar] [CrossRef]
- Lemire, N. School and more. ASHRAE J. 2010, 52, 34–38. [Google Scholar]
- Harouni, R.; Nichols, L.; Jean-Louis, M.J. Head of the class for no GHG-school. ASHRAE J. 2006, 48, 22–27. [Google Scholar]
- Citherlet, S.; Clarke, J.A.; Hand, J. Integration in building physics simulation. Energy Build. 2001, 33, 451–461. [Google Scholar] [CrossRef]
- Jonsson, A. Tools and methods for environmental assessment of building products—methodological analysis of six selected approaches. Build. Environ. 2000, 35, 223–238. [Google Scholar] [CrossRef]
- Finnish Ministry of Environment. Permits Related to Land Use and Building; 2010. Available online: http://www.ymparisto.fi (accessed on 5 May 2011).
- Haas, R.; Auer, H.; Biermayr, P. The impact of consumer behavior on residential energy demand for space heating. Energy Build. 1998, 27, 195–205. [Google Scholar] [CrossRef]
- Branco, G.; Lachal, B.; Gallinelli, P.; Weber, W. Predicted versus observed heat consumption of a low energy multifamily complex in Switzerland based on long-term experimental data. Energy Build. 2004, 36, 543–555. [Google Scholar] [CrossRef]
- Hirst, E.; Goeltz, R. Comparison of actual energy saving with audit predictions for homes in the North Central Region of the USA. Build. Environ. 1985, 20, 1–6. [Google Scholar] [CrossRef]
- Finnish Society of Indoor Air Quality and Climate (FiSIAQ). Classification of Indoor Climate 2008; FiSIAQ: Espoo, Finland, 2008. [Google Scholar]
© 2011 by the authors; licensee MDPI, Basel, Switzerland. This article is an open access article distributed under the terms and conditions of the Creative Commons Attribution license (http://creativecommons.org/licenses/by/3.0/).
Share and Cite
MDPI and ACS Style
Airaksinen, M. Energy Use in Day Care Centers and Schools. Energies 2011, 4, 998-1009. https://doi.org/10.3390/en4070998
AMA Style
Airaksinen M. Energy Use in Day Care Centers and Schools. Energies. 2011; 4(6):998-1009. https://doi.org/10.3390/en4070998
Chicago/Turabian StyleAiraksinen, Miimu. 2011. "Energy Use in Day Care Centers and Schools" Energies 4, no. 6: 998-1009. https://doi.org/10.3390/en4070998