Analysis of a Residential Building Energy Consumption Demand Model

1
Key Lab of the Three Gorges Reservoir Region’s Eco-Environment, Chongqing University, Ministry of Education, Chongqing, 400045, China
2
Faculty of Urban Construction and Environmental Engineering, Chongqing University, Chongqing, 400045, China
*
Author to whom correspondence should be addressed.
Energies 2011, 4(3), 475-487; https://doi.org/10.3390/en4030475
Submission received: 31 January 2011
/
Revised: 15 February 2011
/
Accepted: 8 March 2011
/
Published: 10 March 2011
(This article belongs to the Special Issue Energy Savings in the Domestic and Tertiary Sectors 2011)
Abstract
:In order to estimate the energy consumption demand of residential buildings, this paper first discusses the status and shortcomings of current domestic energy consumption models. Then it proposes and develops a residential building energy consumption demand model based on a back propagation (BP) neural network model. After that, taking residential buildings in Chongqing (P.R. China) as an example, 16 energy consumption indicators are introduced as characteristics of the residential buildings in Chongqing. The index system of the BP neutral network prediction model is established and the multi-factorial BP neural network prediction model of Chongqing residential building energy consumption is developed using the Cshap language, based on the SQL server 2005 platform. The results obtained by applying the model in Chongqing are in good agreement with actual ones. In addition, the model provides corresponding approximate data by taking into account the potential energy structure adjustments and relevant energy policy regulations.
1. Introduction
Building energy consumption accounts for one-third of the societal energy consumption in China, and has the largest energy-saving potential [1]. In recent years, with the rapid development of urbanization, economic development, people's incomes and living standards, China's building energy consumption has increased dramatically. From 1996 to 2006 building energy consumption increased from 0.243 billion tce (ton of standard coal equivalent) to 0.563 billion tce, which represents a 1.3-fold increase. In 2006, urban residential building energy consumption was 0.255 billion tce, or 45 percent of the total building energy consumption. That is to say, residential building energy consumption accounts for a large proportion of the total building energy consumption [1,2]. Furthermore, residential building energy consumption is affected by both domestic and international factors, and has time-variance, complexity, randomness, regionalism and other features. Various areas of the residential building energy consumption have corresponding different characteristics and impact indicators, due to their different environments and conditions.
Treating the residential building energy consumption as a relatively independent statistical object is good for systematically accumulating the underlying data for residential building energy consumption and understanding the basic conditions of residential building energy consumption. It can also provide forceful data supporting energy mix readjustment and energy policy formulation (regulations), therefore we should establish a relatively independent building energy consumption statistical system and explore effective statistical methods for studying building energy consumption as soon as possible since it is very important to promote the work of building energy efficiency [3].
At the same time, civil building energy systems are closely related to national or regional energy and environmental policies, and an energy demand model is also the foundation of making strategy and plans for the entire industry development [4]. Therefore it is necessary for us to understand the characteristics of each area of residential building energy consumption to provide the correct guidelines for building energy efficiency by analysis and study of residential building energy demands.
2. Research Background
Different models have different data input requirements, so building energy consumption models may differ in their calculation and predictions. In general, according to the principle of energy consumption modeling technology, energy consumption models can be mainly divided into macro models and micro models [5]; this article only discusses a macro model.
Firstly, using the macro method to calculate energy consumption depends on the country’s total energy consumption and related factors to split the energy consumption, and then applying regression to get the predicted values. Models based on macro technology can be divided into two sub-categories: economic models and technological models. Technological models are related to all relevant parameters in buildings, such as the number of owned devices, as in the model given by [6]:
where E = Annual energy consumption of a power users’ group; S = the number of houses; C = the number of owned devices; R = the power of devices; U = service condition.
Ean,e,f = S·Ce,f·Re,f·Ue,f
Economic models depend primarily on the relevant prices, income and other parameters, as indicated in the following models [7]:
where E = annual energy consumption; I = household income; P = energy prices; HDD = heating days.
Ean,t = b + c1Ean,t−1 + c2Idisp,t + c3Pct
Ean,t = b + c1Ean,t−1 + c2Idisp,t + c3Pct + c4HDDt
Ean,t = b + c1Ean,t−1 + c2Idisp,t + c3Pct + c4HDDt + c5Pct−1
Hirst [8] also proposed a U.S. residential annual energy consumption model that is based on the economic and housing ownership changes, and the model has developed into an economic model including housing ownership and technical parameters [9,10].
Summing up the above models, existing models are mostly regressed with various methods according to the macro data, and the required data are as follows: macro-economic indicators (GDP, employment, and prices), weather conditions, number of new buildings, equipment and building ownership—historical data, etc. However, these models are difficult to consider all the influencing factors which including social factors, economic factors and natural factors, this is because the influencing factors not only affect the energy consumption of residential building significantly, but also interact and interconnect with each other.
3. Methodology
Based on the technical shortcomings of the foreign and domestic macro-energy-consumption-models, this paper adopts an artificial neural network forecasting method to establish a residential building energy demand model. Neural networks have unique advantages when dealing with complex nonlinear relationships between system input and output. A reasonably designed neural network can approach any complex nonlinear functions with accuracy through training and learning system input and output. Neural network models are relatively easy to construct; they do not usually need idealized assumptions. Neural networks have the ability to continuously make adjustment according to the actual situation. This makes neural network models have a stronger adaptability in systems, and especially in prediction in non-linear complex systems they have more advantages than linear regression models [11,12].
3.1. Artificial Neural Network (ANN)
An Artificial Neural Network is an information processing paradigm which attempts to simulate the functionality of the human brain and model non-linear systems. This study will mainly use a forward neural network model and select the second layer BP network model, which includes the input layer, a hidden layer and the output layer. The errors of the output from a BP network are back propagated by means of the same connections used in the feed-forward mechanism by the derivation of the feed-forward transfer function. It has higher performance and greater value in use than the traditional macro model method [13,14]. This paper selects the standard BP learning and training functions with the standard BP algorithm. The process of a single hidden layer BP network algorithm with converse error propagation is as follows [15]:
When a sample NO.p in the sample set is read, the operating characteristic of the NO.j neuron in NO.l layer network is:
![Energies 04 00475 i001]() where: wji is the connection threshold from neuron I to neuron J; nl − 1 is the number of nodes in layer l − 1:
where: wji is the connection threshold from neuron I to neuron J; nl − 1 is the number of nodes in layer l − 1:
![Energies 04 00475 i002]()


For the output layer:
![Energies 04 00475 i003]()

Learning neural network aims to achieve Ep of each sample minimum, thus ensuring the total error of the grid:
![Energies 04 00475 i004]() where, m is the number of output nodes (in this case these are living energy consumption of residential buildings, total energy consumption, total number of persons, gross domestic product, disposable income of urban residents, etc.).
where, m is the number of output nodes (in this case these are living energy consumption of residential buildings, total energy consumption, total number of persons, gross domestic product, disposable income of urban residents, etc.).

 are the expected output and the actual output of NO.j node in the output layer. The gradient descent method can be used to find the changes of weighted value and error propagation and gradient algorithm to correct weighted value of network and threshold. Then we get the iterative equation of the weighted value in NO.l layer:
 , where η is learning efficiency (value η = 0.01 − 0.8).
The training sample set which this study selected selects the sample which is similar to the forecasting energy consumption to train the artificial neural network forecasting system through two principles: near time and matching input. This is because it has several advantages as follows [3]:
- The training samples which are continuously changing keep up with changes of the energy consumption characteristics as possible;
- Using similar samples for training can ensure the accuracy of prediction;
- The training time is saved by filtering the sample.
3.2. The Design of the BP Neural Network
Hsu found that a three-layer BP neural network can solve a random function’s fitting and approximation problem [16], so we adopted a three-layer BP neural network in this study. The number of the hidden nodes is calculated by empirical formula Equation 5 [17]:
![Energies 04 00475 i008]() where, n is the number of input nodes, m is the number of output nodes, a is constant between [1,10]. From the calculated results we get that the range of n1 is
where, n is the number of input nodes, m is the number of output nodes, a is constant between [1,10]. From the calculated results we get that the range of n1 is ![Energies 04 00475 i009]() ; then we determined the number of hidden nodes by neural network training results; the training results show that the network error is minimum when n1 is 13.
; then we determined the number of hidden nodes by neural network training results; the training results show that the network error is minimum when n1 is 13.

 ; then we determined the number of hidden nodes by neural network training results; the training results show that the network error is minimum when n1 is 13.
 Thus we can get the BP neural network’ structure: 16-13-1. In order to get the best approximation results, we adopt different functions for training, and the network error is shown in Table 1. From the Table 1, Levenberg-Marquarde is the optimal function for this case since the BP neural network could converge rapidly.

| Training Funciton | Traingdm | Traingdx | Trainlm | Taingda |
|---|---|---|---|---|
| Error | 0.0018 | 0.0032 | 0.0008 | 0.0108 |
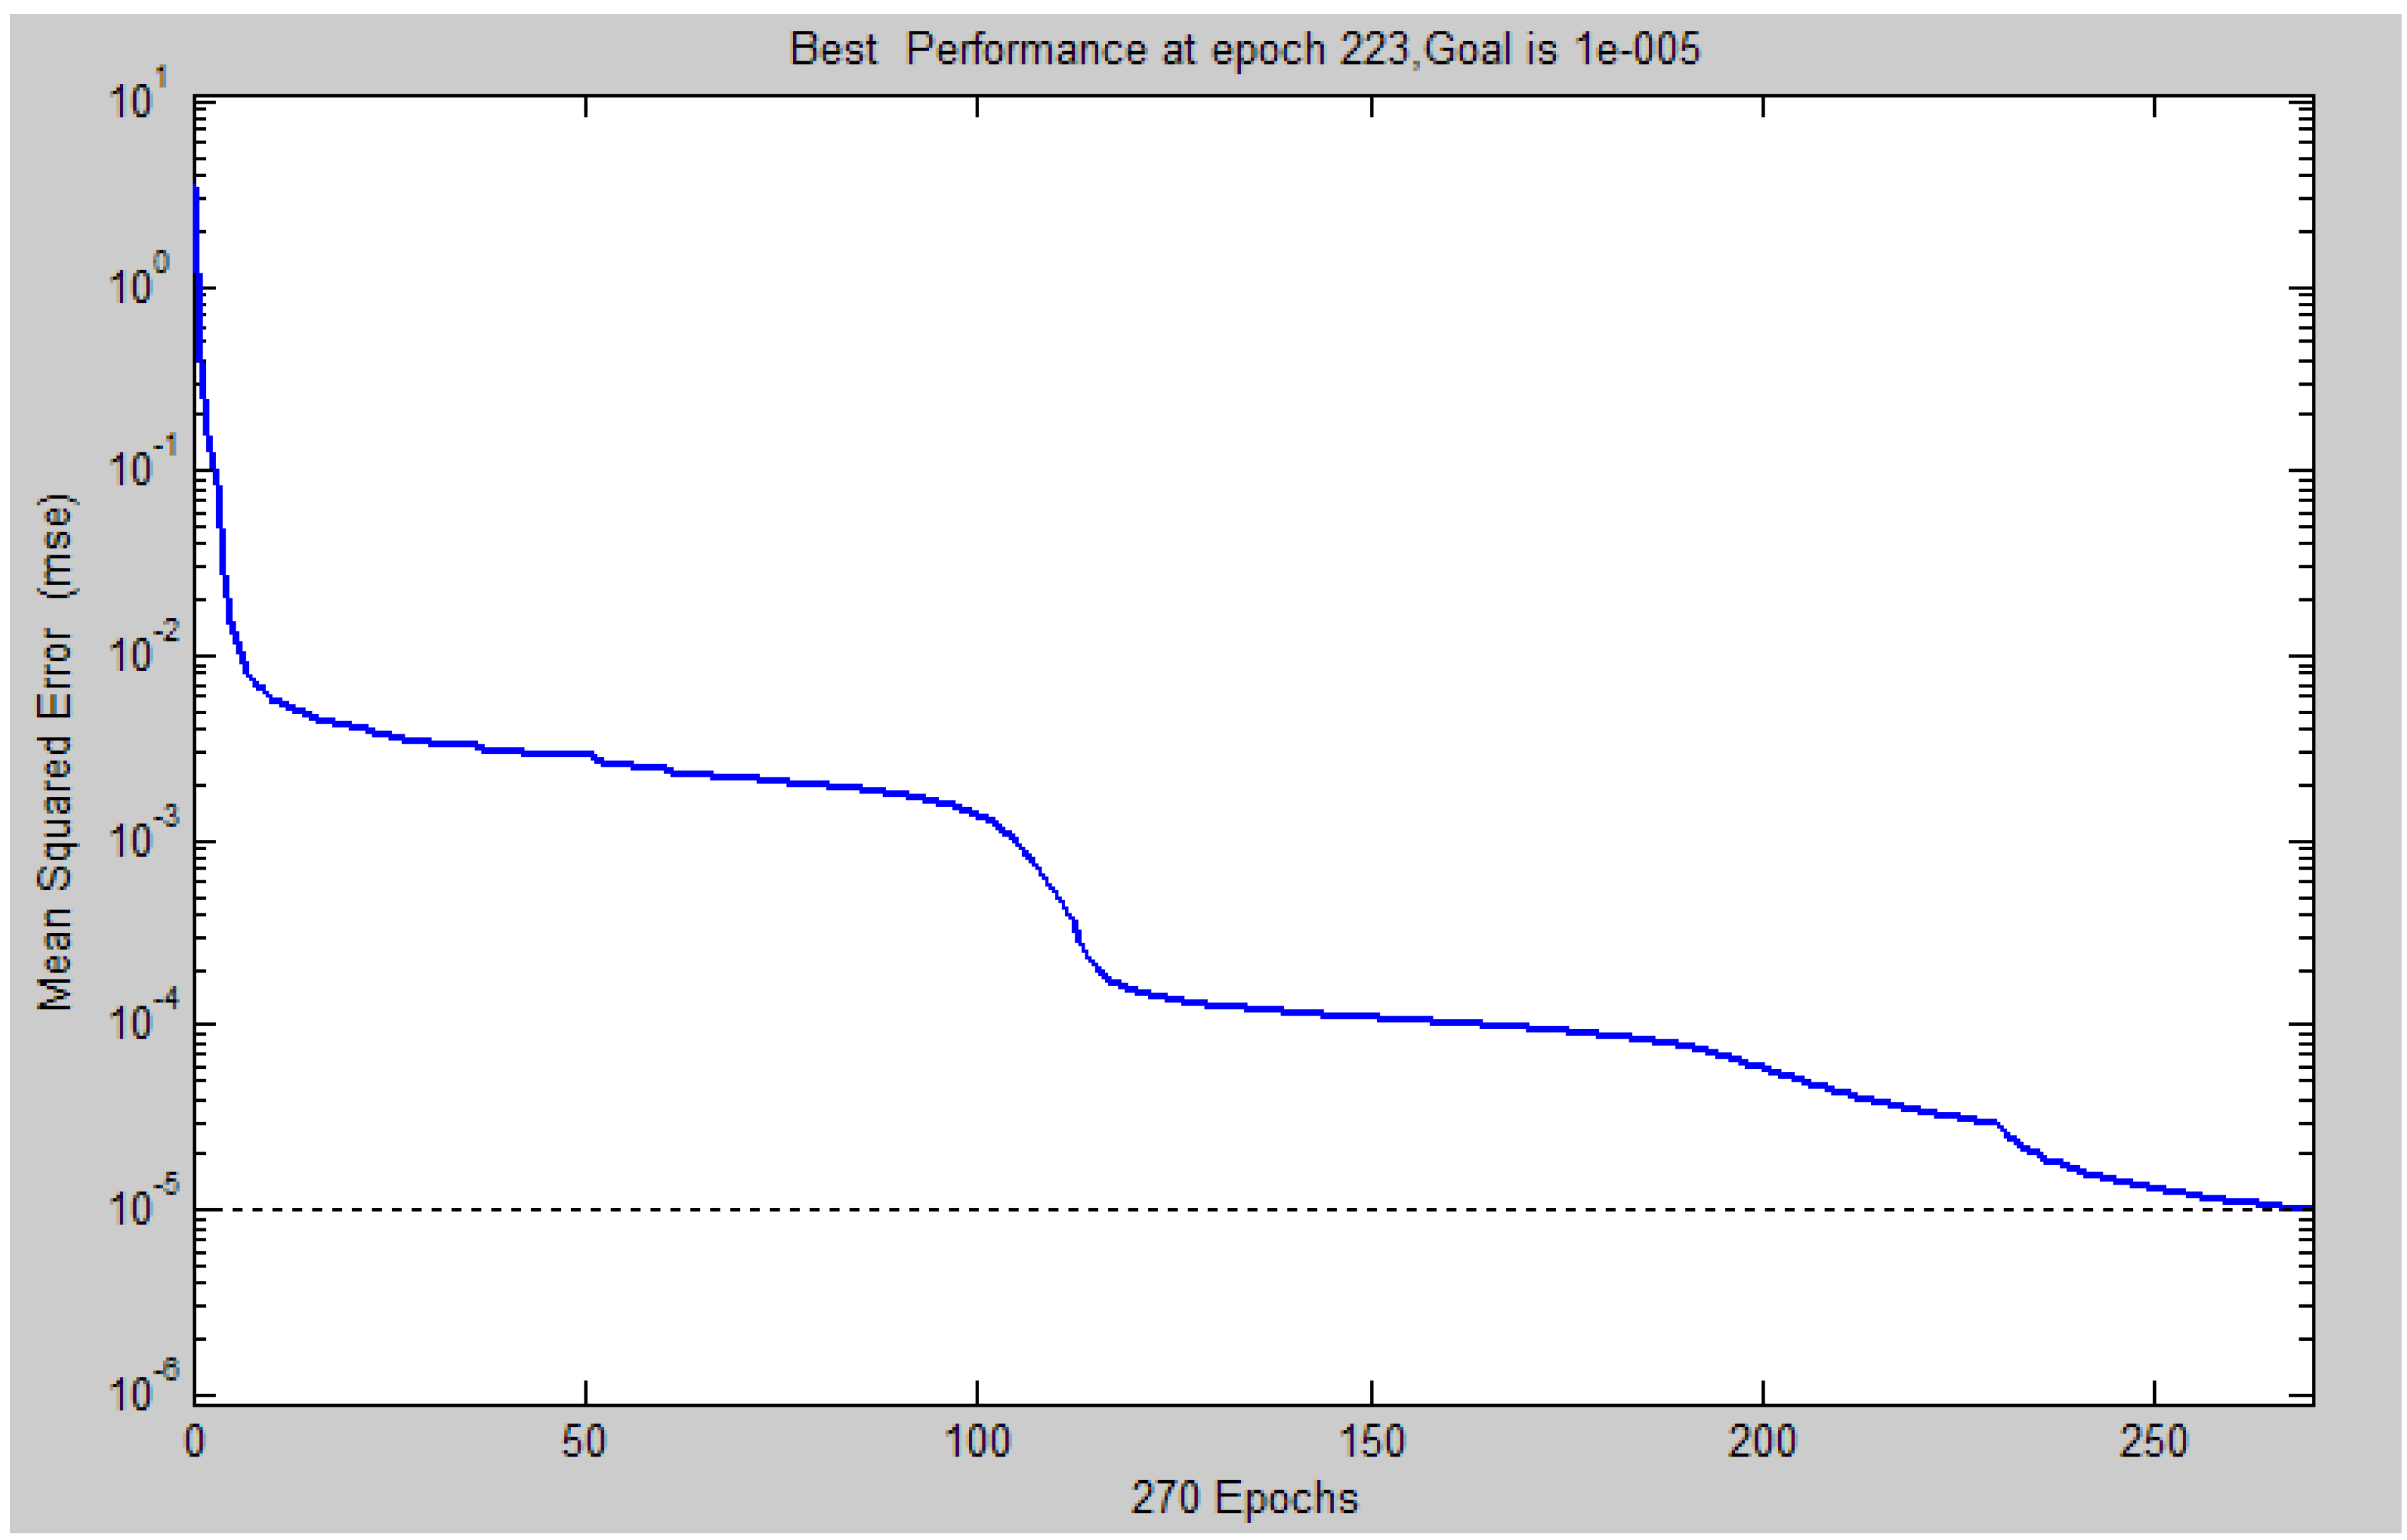
The BP neural network training parameters settings are as below: the target training mean squared error is 1e-5, the learning rate is 0.5, and max_epoch is 2000 [17]. The training and testing procedure were carried out for different year’s cases which have different form factors. The error variation curve related to the number of training epochs for the network is shown in Figure 1.
Figure 1.
Training of the network.

4. Residential Building Energy Consumption Model
Chongqing is taken as a case study to analyze the residential building energy demand model by applying methods mentioned above, and the required parameters are taken from research data and the Statistical Yearbook [18].
4.1. The Analysis of Affecting Indicators of Residential Building Energy Consumption
There are three categories of factors effecting living energy consumption: internal factors, social factors and individual factors [19]. The internal factors are the main factors. This paper analyzes the internal factors which affect the living energy consumption changes in Chongqing, develops a dynamic forecasting model and predicts living energy consumption changes in Chongqing. In terms of the other two factors, individual factors have a great randomness and not suitable for quantitative methods, so they are not considered in general while modeling. Social factors can be affected by “the five-year plan” primarily on the basis of relevant policies and regulations, so that the forecast model can be corrected, so social factors are also not considered.
In allusion to the special geographic environment, congenital conditions and favorable environment of residential buildings’ living energy consumption [18,20], we will divide the indicators that affect the residential buildings living energy consumption into several categories: the population, living standards, urban development level, social development level and natural conditions. The population is a simple quantitative indicator. We preliminarily selected four resident living standards indicators: disposable income of urban residents, private possession of civilian vehicles, the average number of employed persons per household, capita RMB deposit; three urban development level indicators: the rate of urbanization, residential area at the end of the year, gas coverage; six social development level indicators: GDP, total investment in fixed assets, the total of employed people, the production of construction, total value of imports and exports, retail sales of consumer goods; five natural condition indicators: standard deviation of annual air temperature, maximum temperature in summer, sunshine hours, mean relative humidity and wind velocity. This gives a total of 19 selected indicators, and then the analysis of the correlations between the living energy consumption and each indicator is done using the formula:
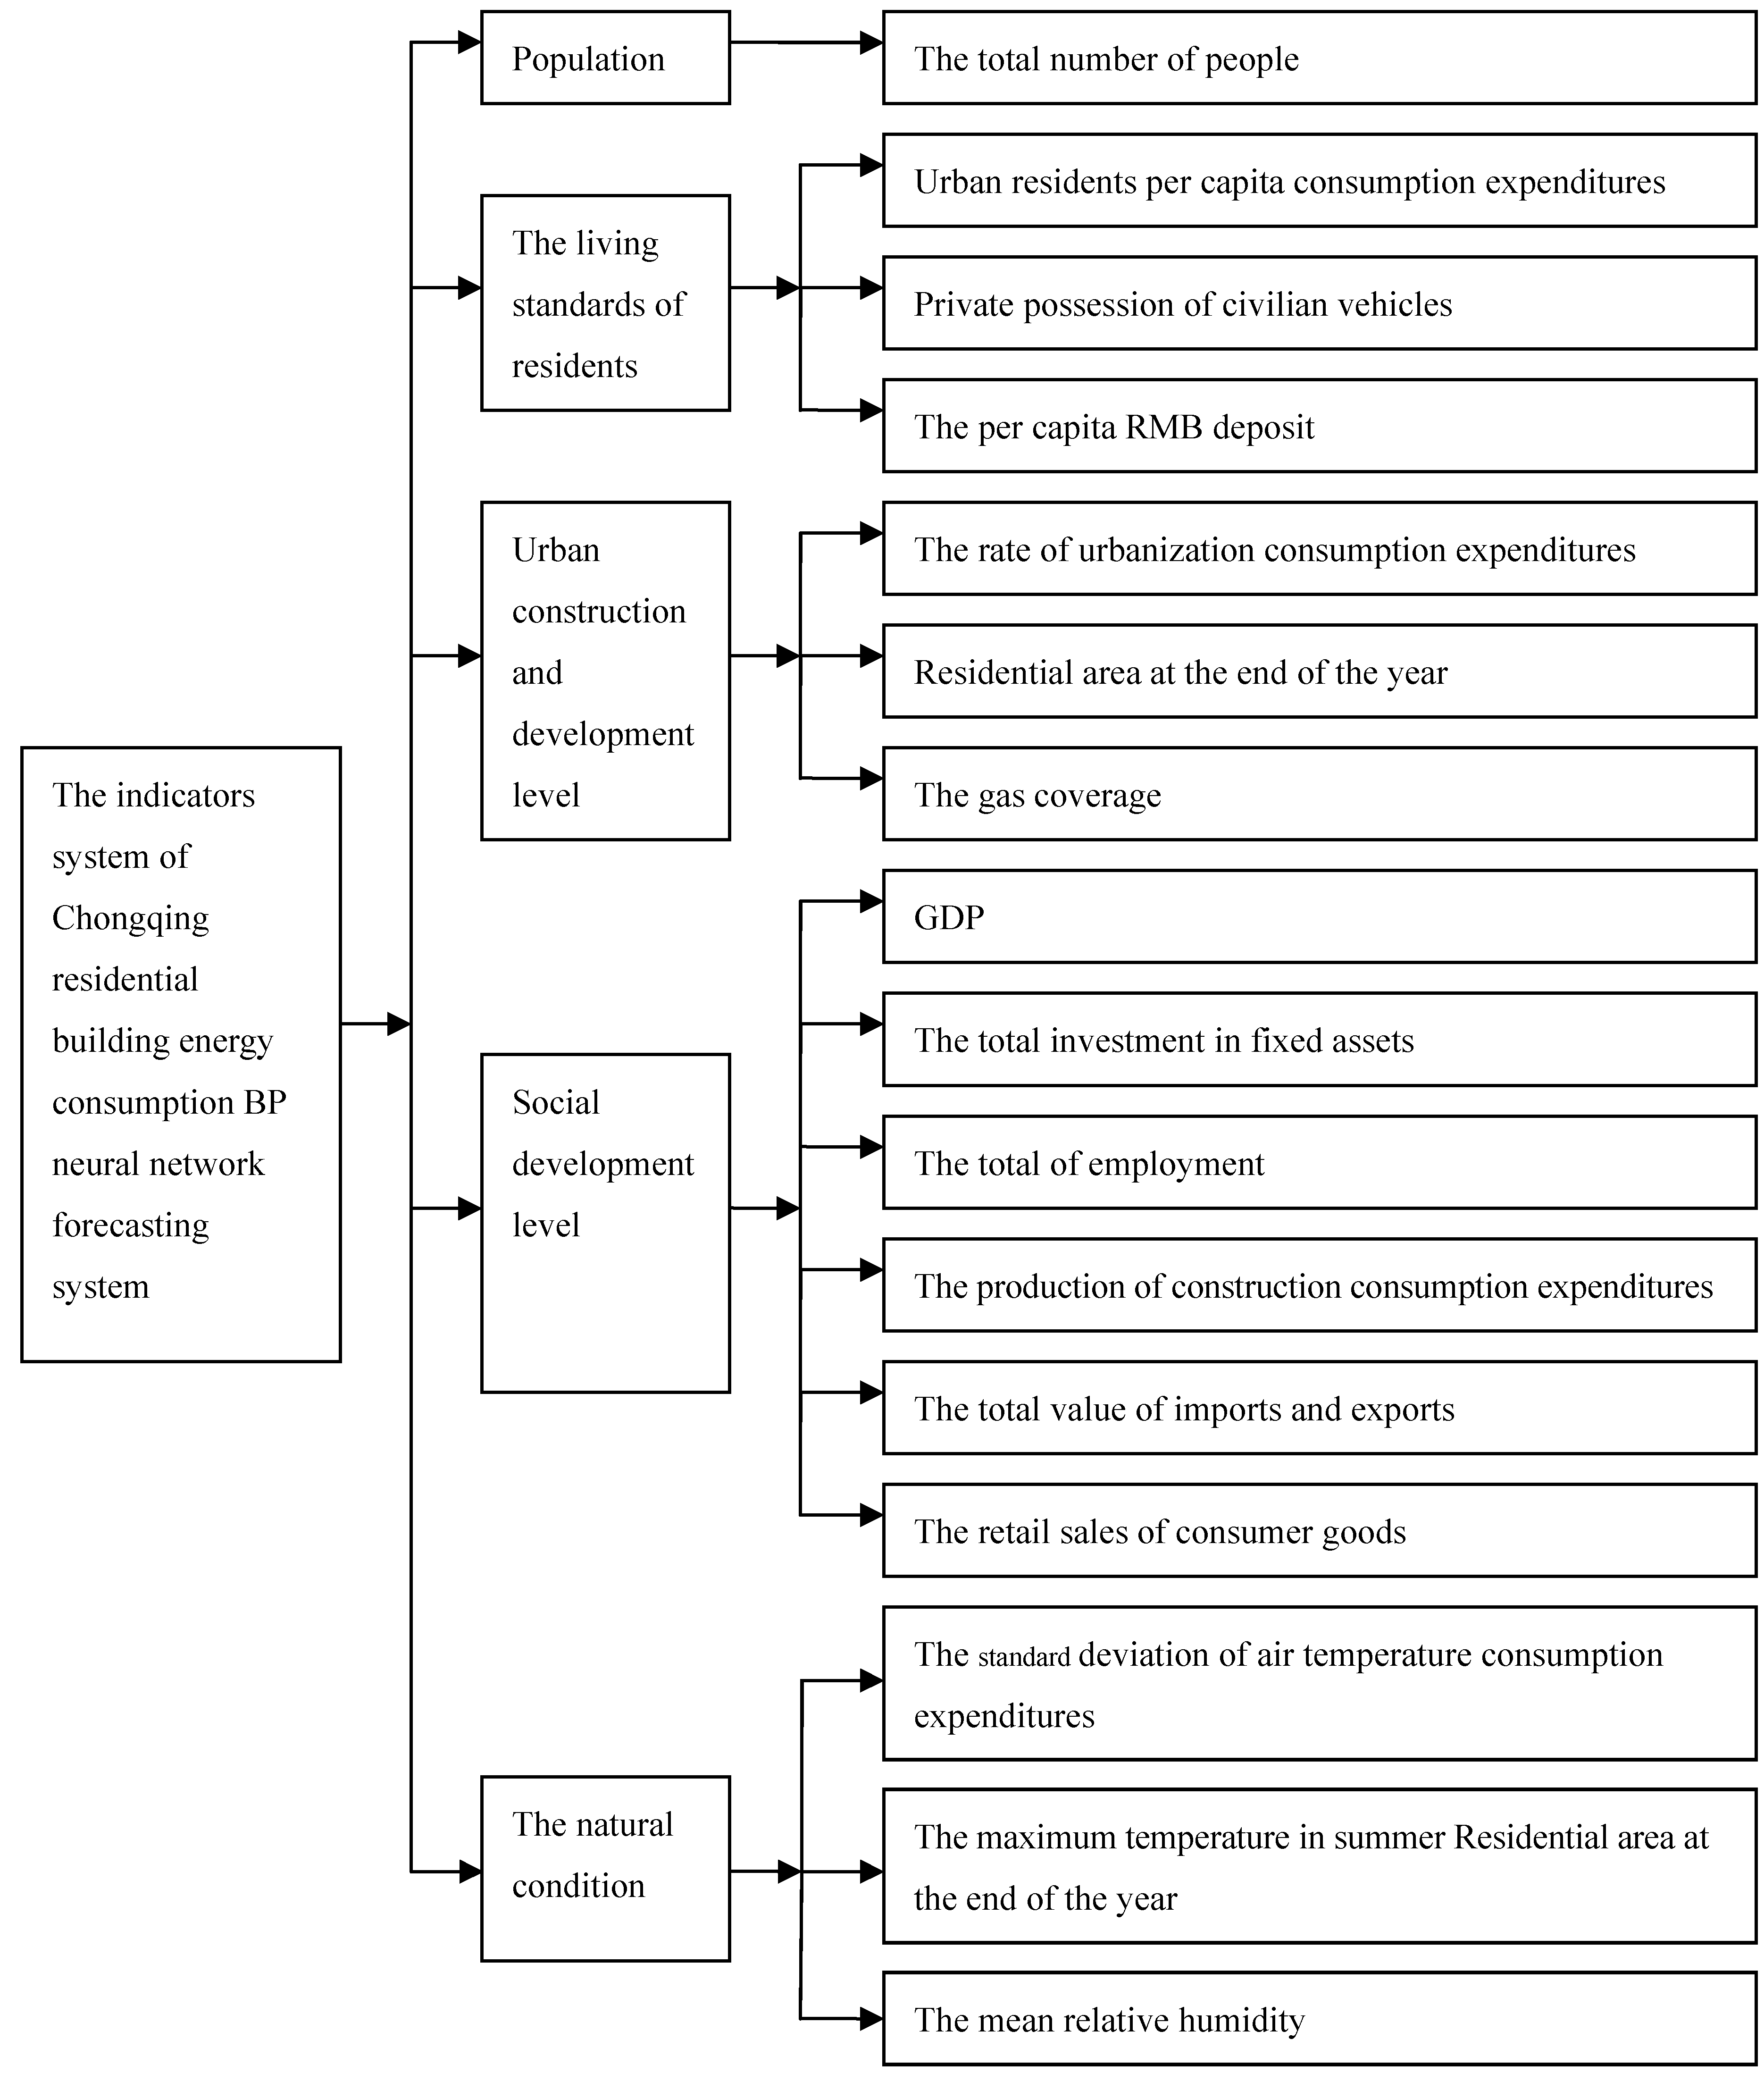
![Energies 04 00475 i010]() where x and y are two random variables. Through calculation and analysis we then get the correlation coefficients listed in Table 2. From Table 2 it can be concluded that the correlation between living energy consumption and four indicators which are sunshine hours, wind velocity and the average employment per household is not significant, so when we established the system of indicators, these four indicators were then eliminated. We then develop the indicator system of the Chongqing residential building energy consumption BP neural network forecasting system through the filtered indicators, as shown in Figure 2.
where x and y are two random variables. Through calculation and analysis we then get the correlation coefficients listed in Table 2. From Table 2 it can be concluded that the correlation between living energy consumption and four indicators which are sunshine hours, wind velocity and the average employment per household is not significant, so when we established the system of indicators, these four indicators were then eliminated. We then develop the indicator system of the Chongqing residential building energy consumption BP neural network forecasting system through the filtered indicators, as shown in Figure 2.

Figure 2.
BP neural network forecasting model of the indicator system.

4.2. The Establishment of Residential Building Energy Consumption Demand Model
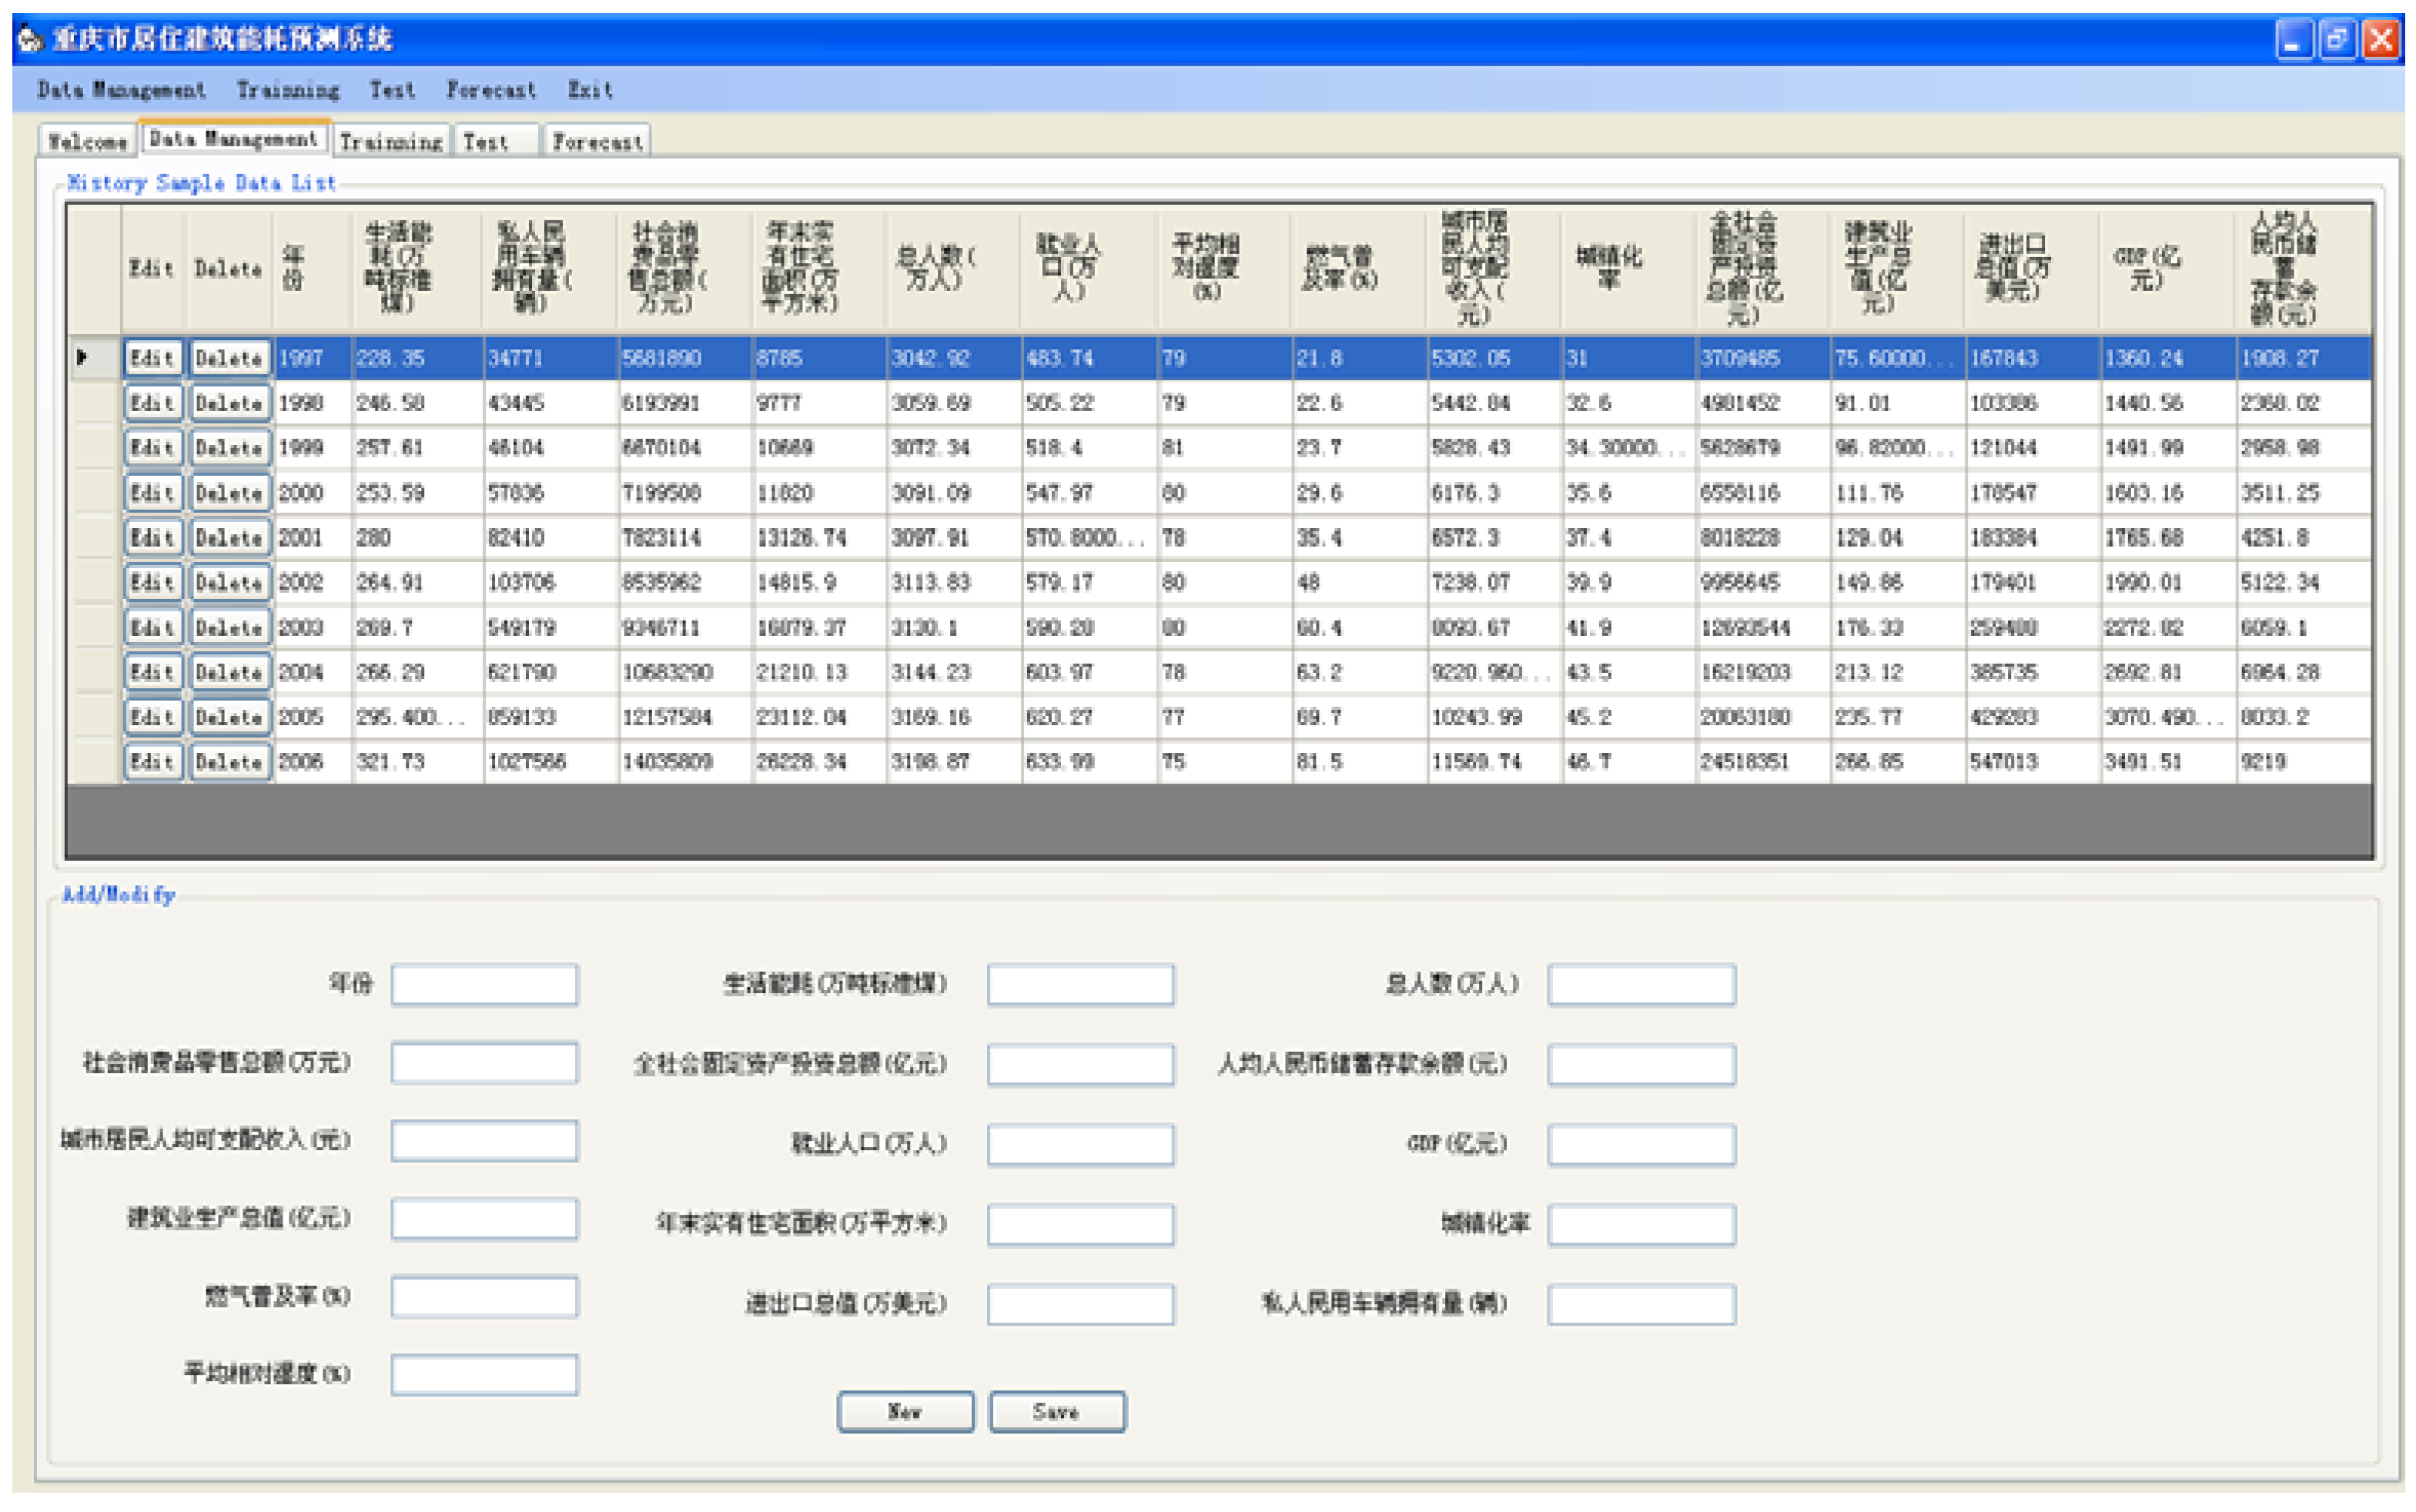
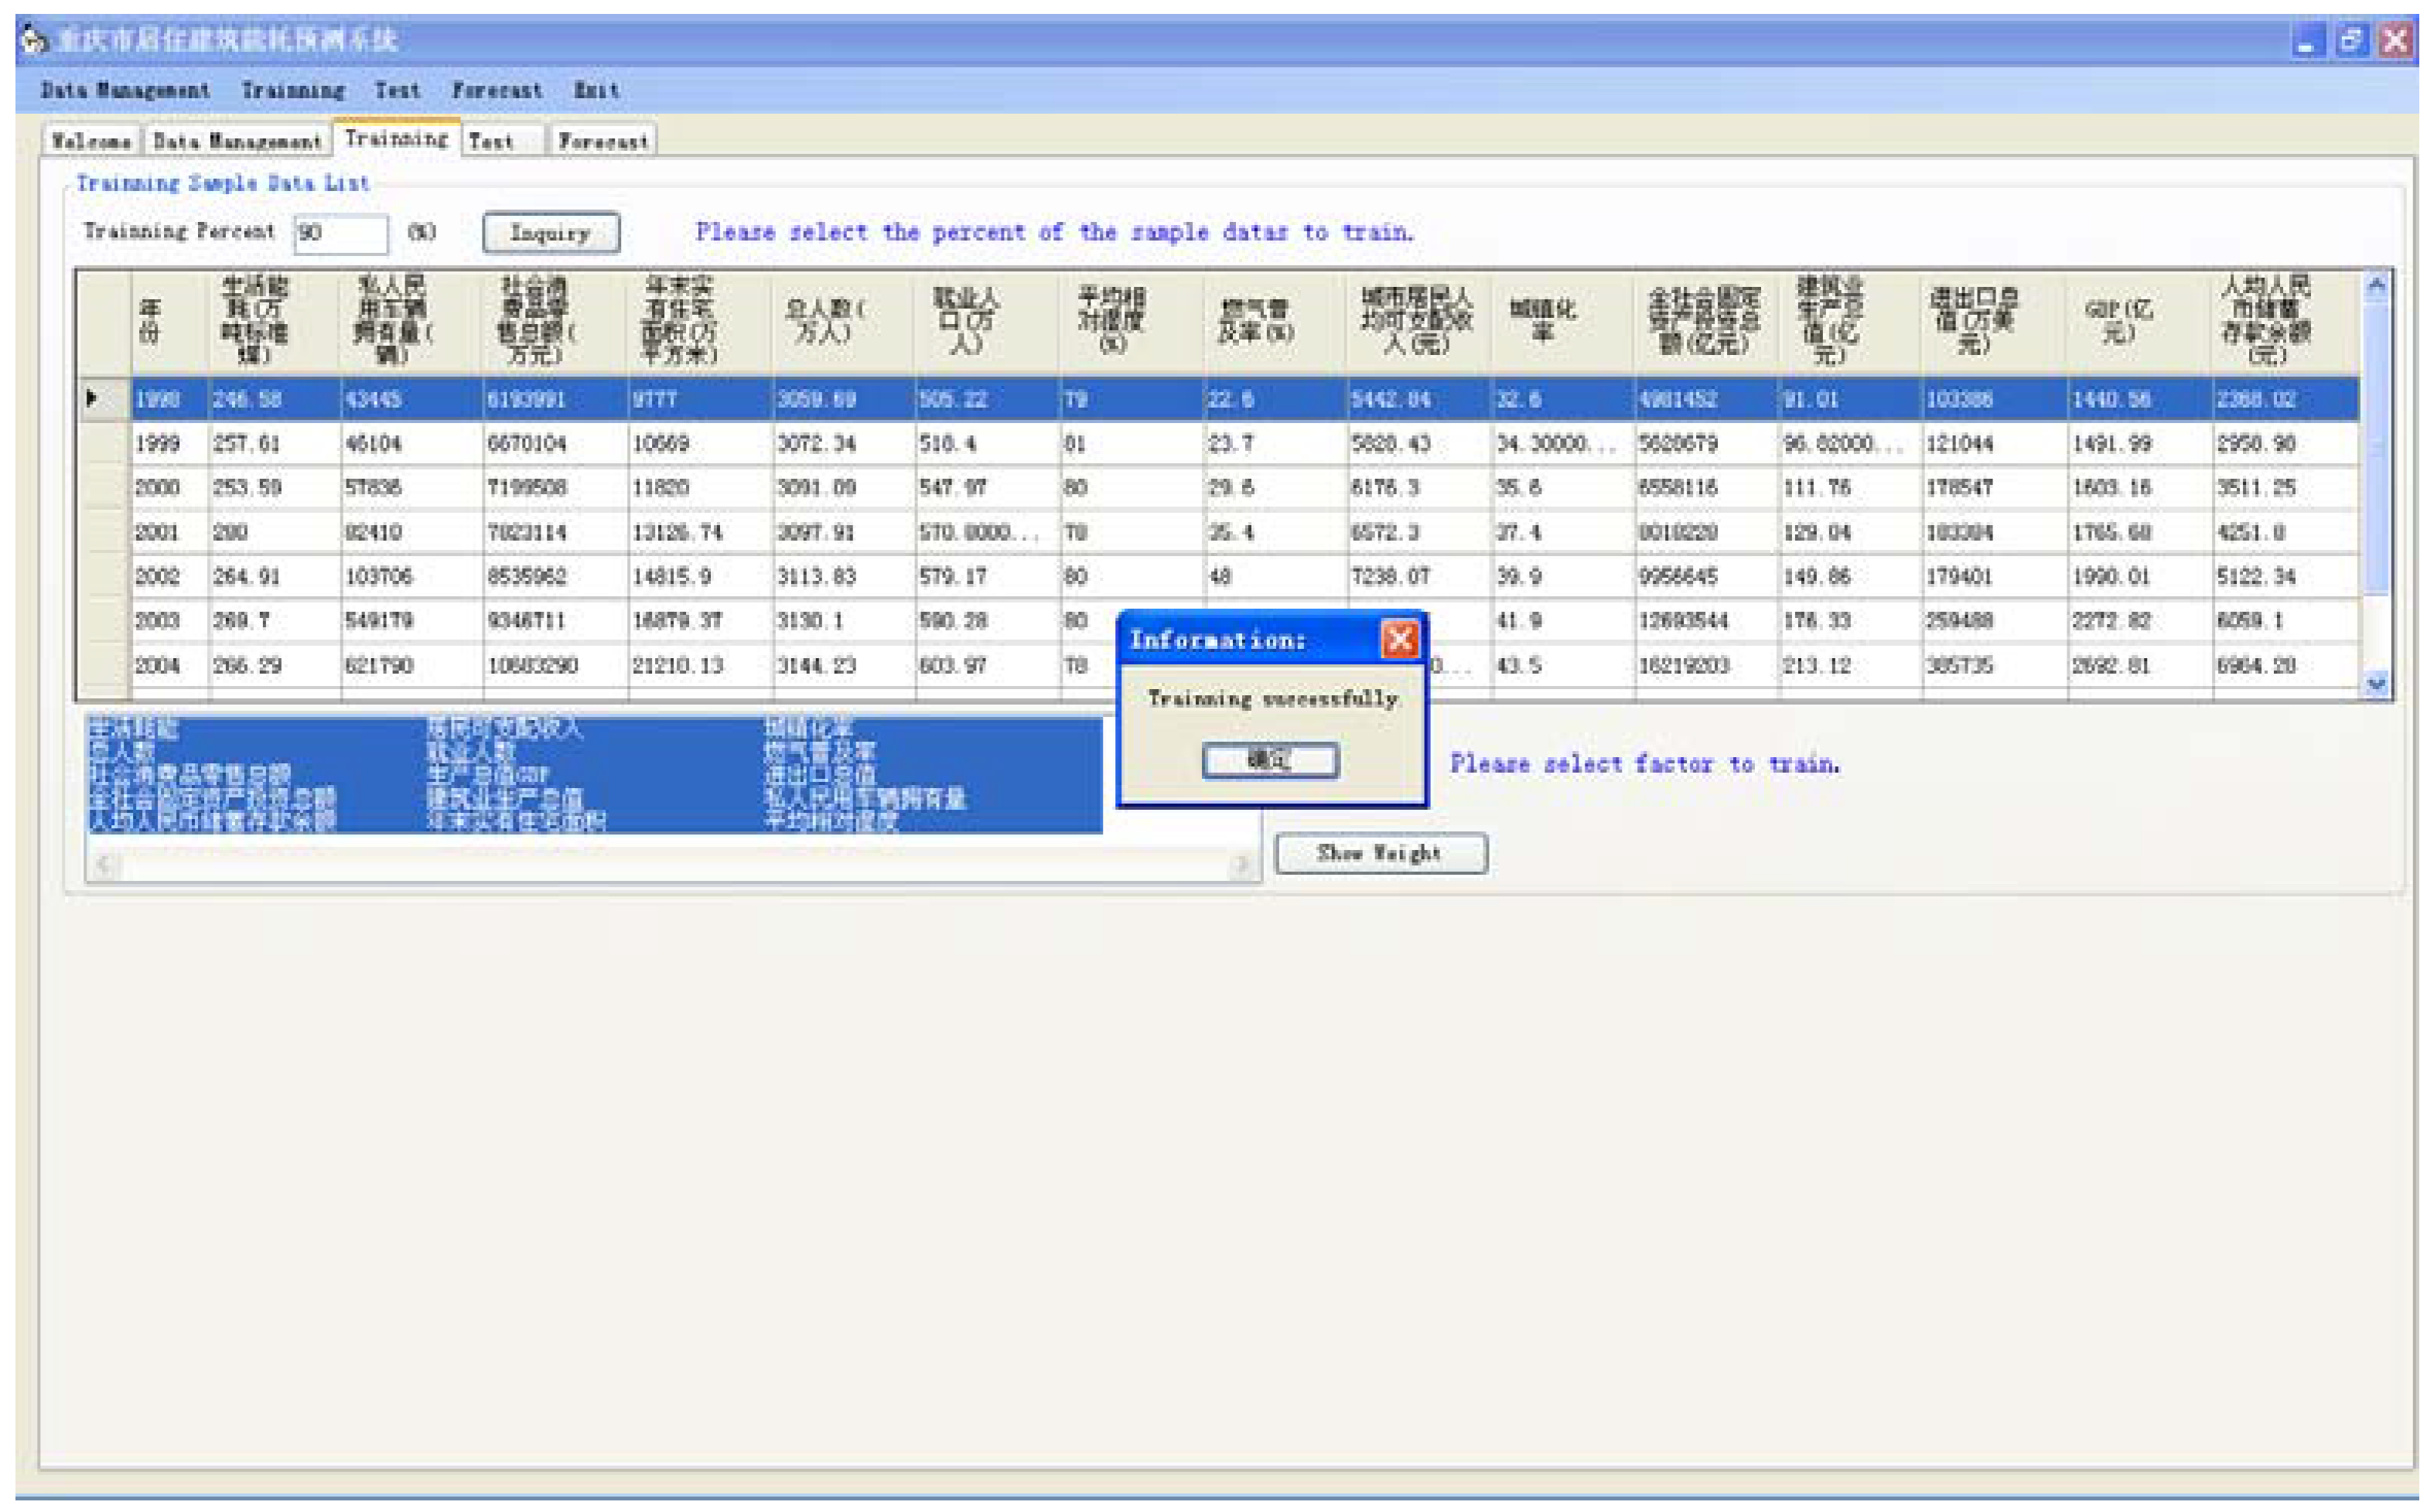
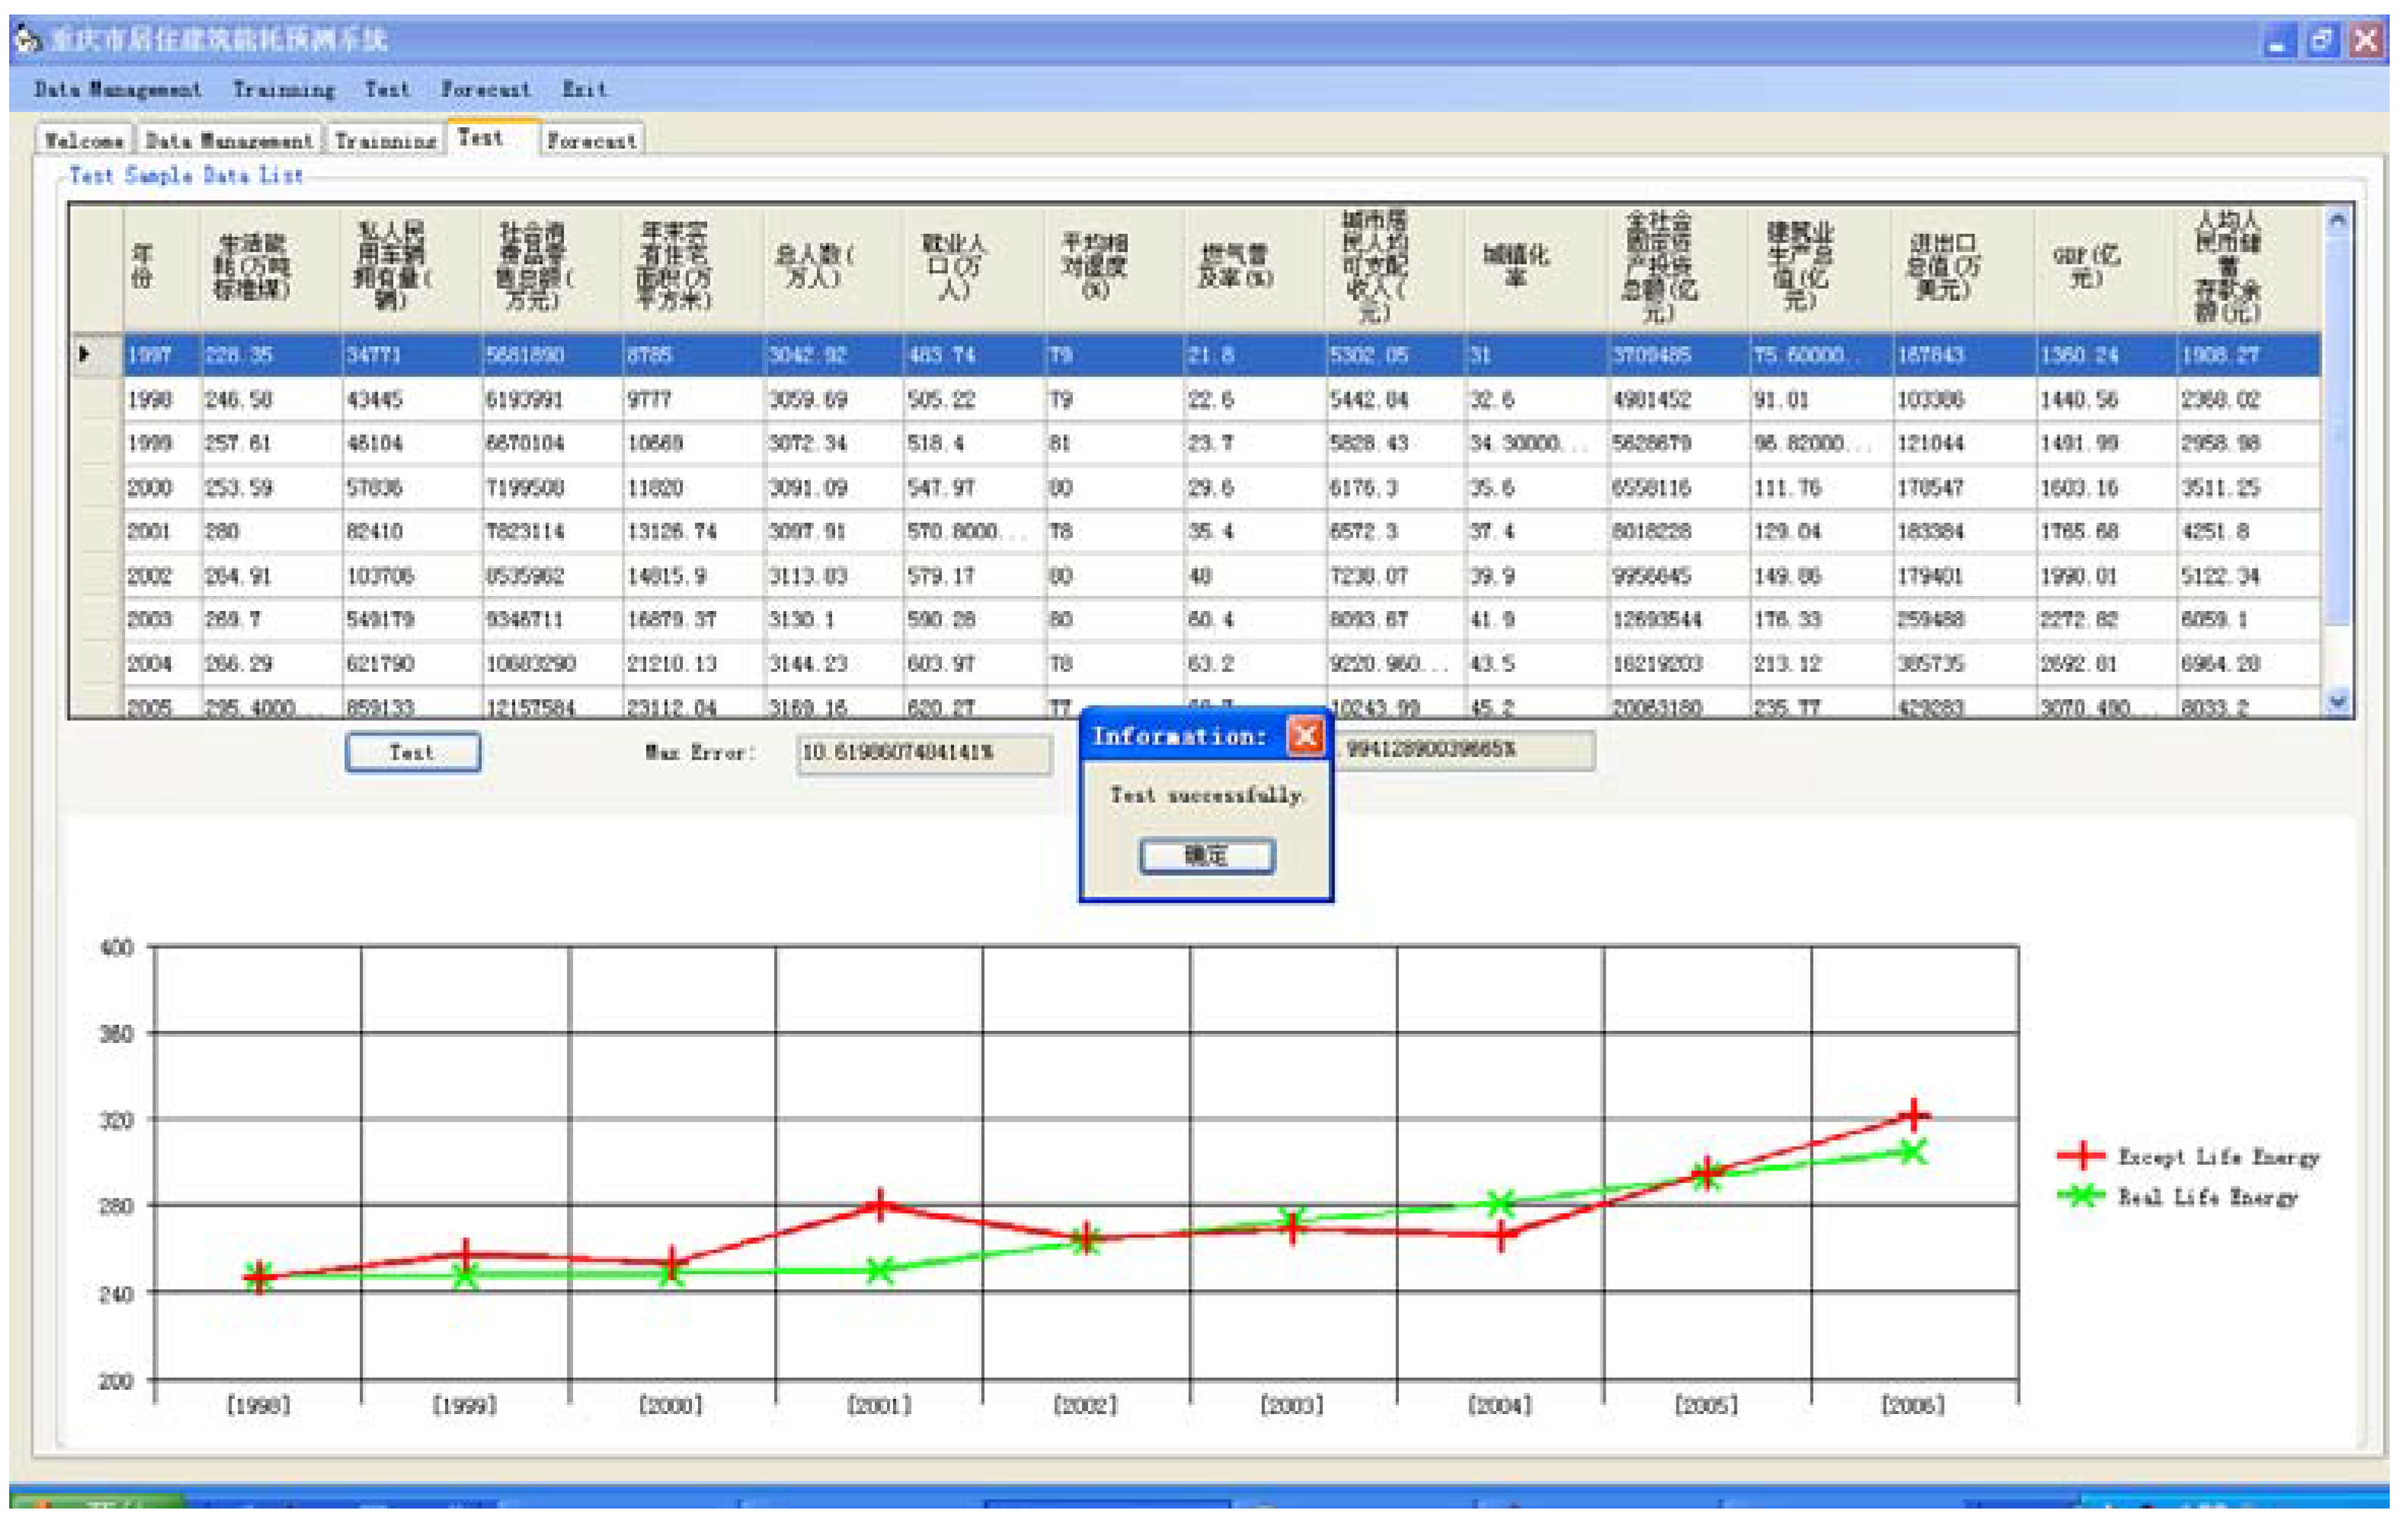
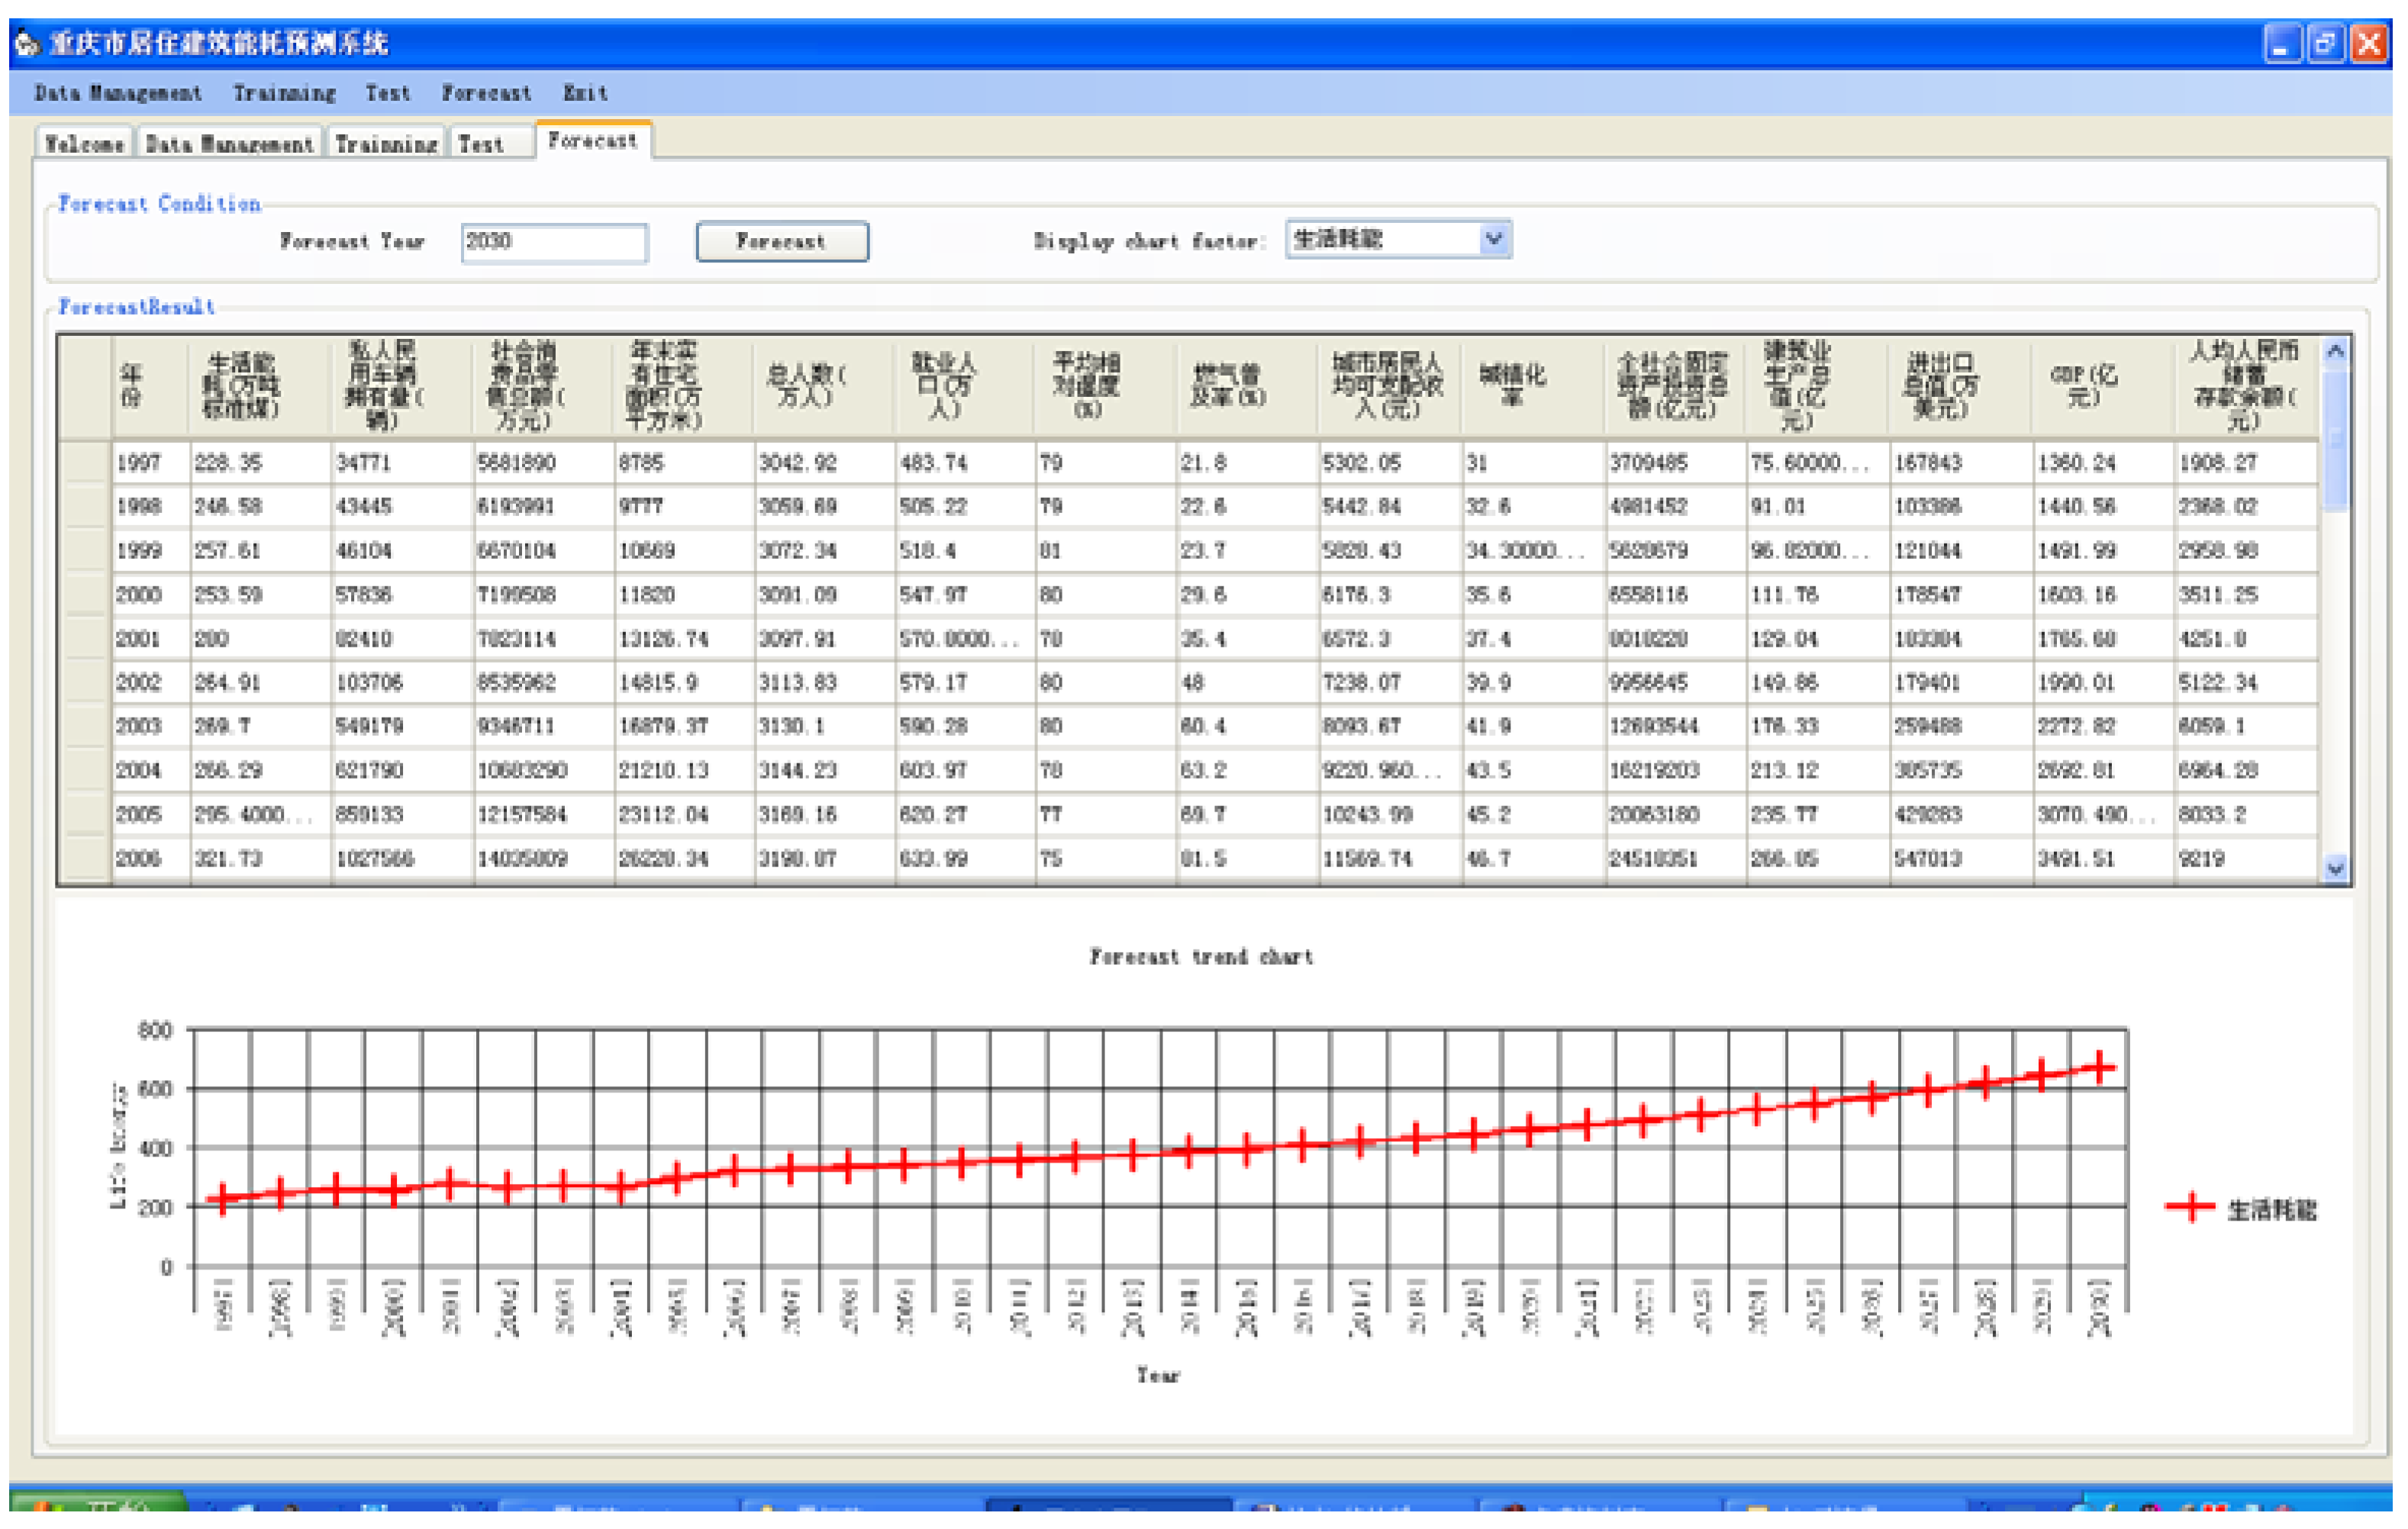
For the NET platform used as a development platform and using the Cshap language, which is based on the SQL server 2005 platform, the system uses the C/S structure and establish the BP neural network to build a model of Chongqing residential building energy consumption. According to the historical data from the Chongqing Statistical Yearbook 1997–2007 [20], we can filter out insignificant factors. In doing so we can build a data base of Chongqing residential building energy consumption indicators, and through historical data management, training, testing, we can draw the residential building energy consumption demand model as shown in Figure 3, Figure 4, Figure 5 and Figure 6 below. At the same time, we can draw the Chongqing residential building energy requirements as shown in the Table 3 below.
| Item | Correlation |
|---|---|
| GDP (0.1 billion Yuan) | 0.88 |
| Total investment in fixed assets (0.1 billion Yuan) | 0.894 |
| The total of employment (0.01 million people) | 0.883 |
| The production of construction (0.1 billion Yuan) | 0.877 |
| Total value of imports and exports (0.01 million $) | 0.826 |
| Retail sales of consumer goods (0.01 million Yuan) | 0.91 |
| Standard deviation of air temperature (°C) | 0.855 |
| Sunshine hours (hour) | 0.422 |
| Mean relative humidity (%) | −0.759 |
| Maximum temperature in summer (0.01 million people) | 0.839 |
| Wind velocity(m/s) | −0.047 |
| The rate of urbanization | 0.867 |
| Residential area at the end of the year (0.01 million m2) | 0.875 |
| Gas coverage (%) | 0.842 |
| Urban residents per capita consumption expenditures (Yuan) | 0.885 |
| Private possession of civilian vehicles (vehicles) | 0.82 |
| The average employment per household (persons) | −0.462 |
| Per capita RMB deposit (Yuan) | 0.892 |
| The total number of people (0.01 million people) | 0.915 |
| Year | Residential Building Energy Requirements Million tce (Ton of Standard Coal Equivalent) | GDP 100 Million RMB | Residents’ Disposable Income $ | Urbanization Rate % | Total Number | Final Residential Area 10,000 Square Meters |
|---|---|---|---|---|---|---|
| 2007 | 329.08 | 3609.36 | 11951.17 | 45.70 | 3207.43 | 27346.47 |
| 2008 | 336.57 | 3730.81 | 12345.45 | 47.56 | 3215.97 | 27987.57 |
| 2009 | 344.43 | 3856.61 | 12755.83 | 48.46 | 3224.75 | 28664.88 |
| 2010 | 352.77 | 3988.51 | 13188.73 | 49.40 | 3233.93 | 29550.47 |
| 2011 | 361.64 | 4126.96 | 13646.13 | 49.60 | 3243.53 | 30475.52 |
| 2012 | 371.05 | 4272.27 | 14129.13 | 50.39 | 3253.57 | 31541.68 |
| 2013 | 381.06 | 4424.77 | 14639.18 | 51.42 | 3264.06 | 32651.56 |
| 2014 | 391.68 | 4584.80 | 15177.79 | 52.51 | 3275.03 | 33705.78 |
| 2015 | 402.96 | 4752.74 | 15746.58 | 53.65 | 3286.50 | 34798.54 |
| 2016 | 414.95 | 4928.98 | 16347.22 | 54.85 | 3298.49 | 35894.86 |
| 2017 | 427.67 | 5113.94 | 16981.51 | 56.10 | 3311.02 | 37958.56 |
| 2018 | 441.19 | 5308.04 | 17651.32 | 57.42 | 3324.13 | 38213.37 |
| 2019 | 455.55 | 5511.73 | 18358.65 | 58.80 | 3337.83 | 39534.34 |
| 2020 | 470.81 | 5725.50 | 19105.60 | 60.25 | 3352.15 | 41587.19 |
From the perspective of growth trends of the residential building energy consumption the residential building energy consumption grows steadily. Meanwhile, the percentage of the annual growth rate is significant. The growth percentage is greater than 10% at the interval of five years. This situation explains the need to implement energy-saving measures for the energy consumption of residential buildings, otherwise, the proportion of energy consumption of residential buildings in the total energy consumption will become larger.
From the perspective of GDP growth trend for Chongqing municipality, its economic level is increasing, but its residential building energy consumption growth rates are comparable to economic growth. In this case, the growth in energy consumption of residential buildings will affect the Chongqing economic development.
Figure 3.
Database management.

Figure 4.
Data training.

Figure 5.
Data test.

Figure 6.
Energy demand forecasting.

5. Residential Building Energy Demand Model Validation
The aim of this paper is to study the main line of residential building energy consumption and to predict the energy consumption demand of residential buildings. Predicted and actual values are shown in Table 4
| Year | True Value | Forecast Values | Error (%) |
|---|---|---|---|
| (Million tce) | (Million tce) | ||
| 1998 | 246.58 | 243.19 | 1.37 |
| 1999 | 257.61 | 263.84 | −2.42 |
| 2000 | 253.59 | 258.71 | −2.02 |
| 2001 | 280.00 | 275.18 | 1.72 |
| 2002 | 264.91 | 263.79 | 0.42 |
| 2003 | 269.20 | 268.45 | 0.28 |
| 2004 | 266.29 | 264.69 | 0.60 |
| 2005 | 295.40 | 294.98 | 0.14 |
| 2006 | 321.73 | 320.76 | 0.30 |
As we can see from Table 4, the energy value difference between the one predicted by the established BP artificial neural network model of residential building energy requirements and the actual one is quite small, with an error of 3% or less. The results confirm that this model provides accurate results, and the demand of the future residential buildings energy consumption predicted by the model is reliable.
6. Recommendations and Conclusions
Firstly, this paper discusses the status and shortcomings of domestic energy consumption models. The paper then proposes the establishment of a residential building energy consumption demand model approach based on a BP neural network model.
Secondly, 16 indicators of energy consumption in Chongqing residential buildings are introduced by analyzing the characteristics of Chongqing residential buildings, and then the index system of the BP neural network prediction model is established.
Thirdly, the multi-factor BP neural network prediction model of Chongqing residential building energy consumption is developed by using the Cshap language, which is based on the SQL server 2005 platform. The predicted results from the model show that the energy consumption demand model is precise and reliable.
The model is in line with the actual data trends and helps formulate Chongqing residential building energy-saving measures and standards and correctly guide and organize Chongqing residential construction industry and helps optimize the structure of residential buildings in Chongqing. The model can provide the guidelines for Chongqing residential building energy-saving programs and measures by predicting the energy consumption of residential buildings in Chongqing.
However, only 16 factors which impact the energy consumption of residential buildings are considered in this paper. Other factors (such as national policies, etc.) have not been taken into account, so in the future, we can add these to this model as a correction function. In addition, the established residential building energy demand model is only based on macroeconomic indicators. In the future the model should be extended to the micro-sphere of residential building energy demand to forecast and propose specific energy-saving programs.
Acknowledgements
This paper is funded by the project (50838009) of the National Natural Science Foundation of China, and by the project (CDJXS1021002) of Chongqing University Postgraduates’ Science and Innovation Fund. The authors are grateful for the valuable comments from an anonymous referee.
References
- CAE Consulting Project, Tsinghua University Building Energy Research Center. Annual Report on the Development on China Building Energy 2009; China Construction Industry Press: Beijing, China, 2009; pp. 28–36. [Google Scholar]
- Jiang, Y.; Lin, B.R.; Zeng, J.L.; Zhu, Y.X. The Energy Saving of Residential Building; China Construction Industry Press: Beijing, China, 2006; pp. 3–8. [Google Scholar]
- Lei, Y.R. The Study on Chongqing Residential Building Energy Consumption Forecast Method. Master Thesis, Chongqing University, Chongqing, China, 2008; pp. 18–26. [Google Scholar]
- Li, B.Z. Sustainable Response to the Urbanisation in China. J. Cent. South Univ. Technol. 2007, 14, 1–7. [Google Scholar]
- Swan, L.G.; Ugursa, V.I. Modeling of end-use energy consumption in the residential sector: A review of modeling techniques. Renew. Sustain. Energy Rev. 2009, 13, 1819–1835. [Google Scholar] [CrossRef]
- Saha, G.P.; Stephenson, J. A model of residential energy use in New Zealand. Energy 1980, 5, 167–175. [Google Scholar] [CrossRef]
- Bentzen, J.; Engsted, T. A revival of the autoregressive distributed lag model in estimating energy demand relationships. Energy 2001, 26, 45–55. [Google Scholar]
- Hirst, E.; Lin, W.; Cope, J. A residential energy use model sensitive to demographic, economic, and technological factors. Q. Rev. Econ. Finance 1977, 17, 7–22. [Google Scholar]
- Hirst, E. A model of residential energy use. Simulation 1978, 30, 69–74. [Google Scholar] [CrossRef]
- O’Neal, D.L.; Hirst, E. An energy use model of the residential sector. IEEE Trans. Syst. Man Cybern. 1980, 10, 749–755. [Google Scholar] [CrossRef]
- Crompton, P.; Wu, Y.R. Energy consumption in China: Past Trends and Future Directions. Energy Econ. 2005, 27, 195–208. [Google Scholar] [CrossRef]
- Chen, W.Y.; Wu, Z.X. Study on China’s future sustainable energy development strategy using MARKAL model. J. Tsinghua Univ. Sci. Technol. 2001, 41, 103–106. [Google Scholar]
- Lou, S.T.; Shi, Y. MATLAB-Based Systems Analysis and Design—Neural Network; Xidian University Press: Xi’an, China, 1998; pp. 68–78. [Google Scholar]
- Yuan, Z.R. Artificial Neural Network Technology and Its Applications; Tsinghua University Press: Beijing, China, 1999; pp. 132–142. [Google Scholar]
- Chen, X.G.; Pei, X.D. Artificial Neural Network Technology and Its Applications; Electric Power Press: Beijing, China, 2003; pp. 168–181. [Google Scholar]
- Hsu, K; Cupta, H.V. Artificial neural network molding of the rainfall runoff process. Water Resour. Res. 1995, 31, 2517–2530. [Google Scholar] [CrossRef]
- Basheer, I.A; Hajmeer, M. Artificial neural networks: fundamentals, computing, design, and application. J. Microbiol. Methods 2000, 43, 3–31. [Google Scholar]
- Chongqing Municipal Bureau of Statistics. The Chongqing Statistical Yearbook 1997–2007; China Statistics Press: Beijing, China, 2007.
- Ren, J.; Liu, J.P. Residential building energy-saving design and evaluation of research on EHTV method. J. Xi’an Constr. Sci. Tech. 2004, 2, 138–141. [Google Scholar]
- Li, X.F.; Xu, J.P.; Wang, Y.Q. BP artificial neural networks Adaptive learning algorithm and its application. Theory Pract. Syst. Eng. 2004, 5, 1–8. [Google Scholar]
© 2011 by the authors; licensee MDPI, Basel, Switzerland. This article is an open access article distributed under the terms and conditions of the Creative Commons Attribution license (http://creativecommons.org/licenses/by/3.0/).
Share and Cite
MDPI and ACS Style
Yu, W.; Li, B.; Lei, Y.; Liu, M. Analysis of a Residential Building Energy Consumption Demand Model. Energies 2011, 4, 475-487. https://doi.org/10.3390/en4030475
AMA Style
Yu W, Li B, Lei Y, Liu M. Analysis of a Residential Building Energy Consumption Demand Model. Energies. 2011; 4(3):475-487. https://doi.org/10.3390/en4030475
Chicago/Turabian StyleYu, Wei, Baizhan Li, Yarong Lei, and Meng Liu. 2011. "Analysis of a Residential Building Energy Consumption Demand Model" Energies 4, no. 3: 475-487. https://doi.org/10.3390/en4030475