Estimating the Energy Consumption Impact of Casual Carpooling

1
Co-Founder and Managing Director, Trip Convergence Ltd /17/130 Great South Road, Epsom, Auckland 1051, New Zealand
2
Co-Founder and Director, Trip Convergence Ltd / 276A Victoria Street, Remuera, Auckland 1050, New Zealand
*
Author to whom correspondence should be addressed.
Energies 2011, 4(1), 126-139; https://doi.org/10.3390/en4010126
Submission received: 8 December 2010
/
Revised: 9 January 2011
/
Accepted: 10 January 2011
/
Published: 14 January 2011
(This article belongs to the Special Issue Energy-Friendly Transportation)
Abstract
:Some of the transportation energy consumed during peak commuter periods is wasted through slow running in congested traffic. Strategies to increase average vehicle occupancy (and reduce vehicle counts and congestion) could be expected to be at the forefront of energy conservation policies. Casual carpooling (also called “slugging”) is a system of carpooling without trip-by-trip pre-arrangement. It operates in three US cities, and has been suggested in New Zealand as a strategy for managing transportation challenges when oil prices rise. The objective of the paper is to find out if casual carpooling reduces energy consumption, and if so, how much. Energy consumption by single occupant vehicles; casual carpool vehicles; and a mix of buses and single occupant vehicles; are estimated and compared, and the impact on the rest of the traffic is calculated. The paper estimates that casual carpooling in San Francisco is conserving in the order of 1.7 to 3.5 million liters of gasoline per year, or 200-400 liters for each participant, much of which comes from the impact on the rest of the traffic. The paper concludes by calling for applied research to discover how to catalyze casual carpooling in other cities as a means of reducing transportation energy consumption.
1. Introduction
1.1. Background
The transportation sector is a significant user of energy. Encouragement of carpooling is one known strategy for reducing traffic that some suggest is second only to a driving ban in its potential for reducing energy use [1]. However, in Moving Cooler, An Analysis of Transportation Strategies for Reducing Greenhouse Gas Emissions, carpooling is discounted as being an expensive strategy, and given little emphasis [2].
The authors’ interest in traffic reduction had led them (in 2002) to hypothesize a high volume “express” carpooling solution that, when it happens, will look like “park-and-ride” but without the buses, using carpoolers’ own vehicles instead, leaving two thirds of the carpoolers’ vehicles in suburban parking lots, and carpooling either for the full trip to the employment destination or as a feeder to transit services. The key difference between the envisaged system and existing carpooling systems will be that the express carpooling system will involve no trip-by-trip pre-arrangement of rides. It will operate to high volume destinations on routes that are attracting lots of single occupant vehicle (SOV) drivers, and people will form fuller cars in the order they arrive at a convergence-point meeting-place [3]. Each meeting-place would serve in the order of 300 people each morning. Implementation of a large number of such routes would collectively make a measurable difference to the total traffic in a metropolitan area.
This approach was found to resemble, to some extent, the casual carpooling systems which arose, apparently spontaneously, in Washington DC and in San Francisco, California, during the early 1970s, and had spread to Houston, Texas during the 1990s and which continue to operate successfully in all three cities.
The approach also resembles, to some extent, the “park and share” concept in use in Ireland, parts of the UK, the US, and Canada, where “car pool parking” is provided as a meeting place for pre-arranged car pools.
The authors had proposed to the Auckland Regional Council (ARC) that ARC support the introduction express carpooling in Auckland, and ARC had estimated the likely impact on local congestion costs. The ARC used the Auckland Traffic Model, and used as inputs the origins and destinations of 5000 SOVs that the authors predicted the system could take off the road (in 2500 three person carpools). The output from the model had suggested significant reductions in energy use by the remaining traffic [4].
A feasibility study is underway funded by the Transit IDEA program of the Transportation Research Board, entitled “Flexible Carpooling to Transit Stations”, developing a methodology for assessing the potential for express carpooling routes and developing an implementation proposal for one such route including estimates of the costs and benefits of such an implementation, but not including actual implementation [5].
1.2. Objective of the Paper
The authors’ objective in writing this paper was to find out if casual carpooling reduces final energy use, and if so by how much. The authors had been unable to find any evidence of such a calculation being carried out before, and many disputed their contention that this form of carpooling would in fact reduce total energy consumption.
1.3. Outline
2. Literature and Research
2.1. Casual Carpooling
A carpool is usually an ongoing arrangement amongst a group of individuals to regularly share rides for a particular purpose, often for traveling to work, using a car belonging to the driver. Carpooling systems typically involve “turn about” driving (each person taking a week in turn, for example), or sharing of costs. Establishing a carpool involves finding people with matching schedules and routes. Other criteria may also be considered, such as matching tastes in radio stations, preferences for smoking, or mixes of genders. There is a relatively long-term relationship between members of the carpool, which may involve two, three, or four people. Members must usually be ready at the agreed time and place to ride with the carpool, regardless of what else is happening.
A casual carpool retains the feature of shared rides, but is very different in the way it is created. Casual carpooling systems (operating only in San Francisco CA, Washington DC, and Houston TX, and called “slug lines” in the latter two locations) are based around morning pick-up points. Riders queue at these pick-up points, as if they are waiting at a taxi stand. Drivers pick up the appropriate number of riders that allows them to access the 3+ high occupancy vehicle (HOV) lane to drive to the pre-determined destination. Many of the pick-up points are located in commuter parking lots. Pick-up points and destinations are “local knowledge”, or can be located using websites that have been developed for each of the systems [6,7]. When multiple destinations are served from a single pick-up point, drivers might call out their destination and the person at the front of the line might repeat it loudly for the rest of the line to hear [8].
The characteristics of these three casual carpooling systems are summarized in Table 1.
A New Zealand Transport Agency review suggested implementation of casual carpooling as a strategy for managing transport challenges when oil prices rise [9].
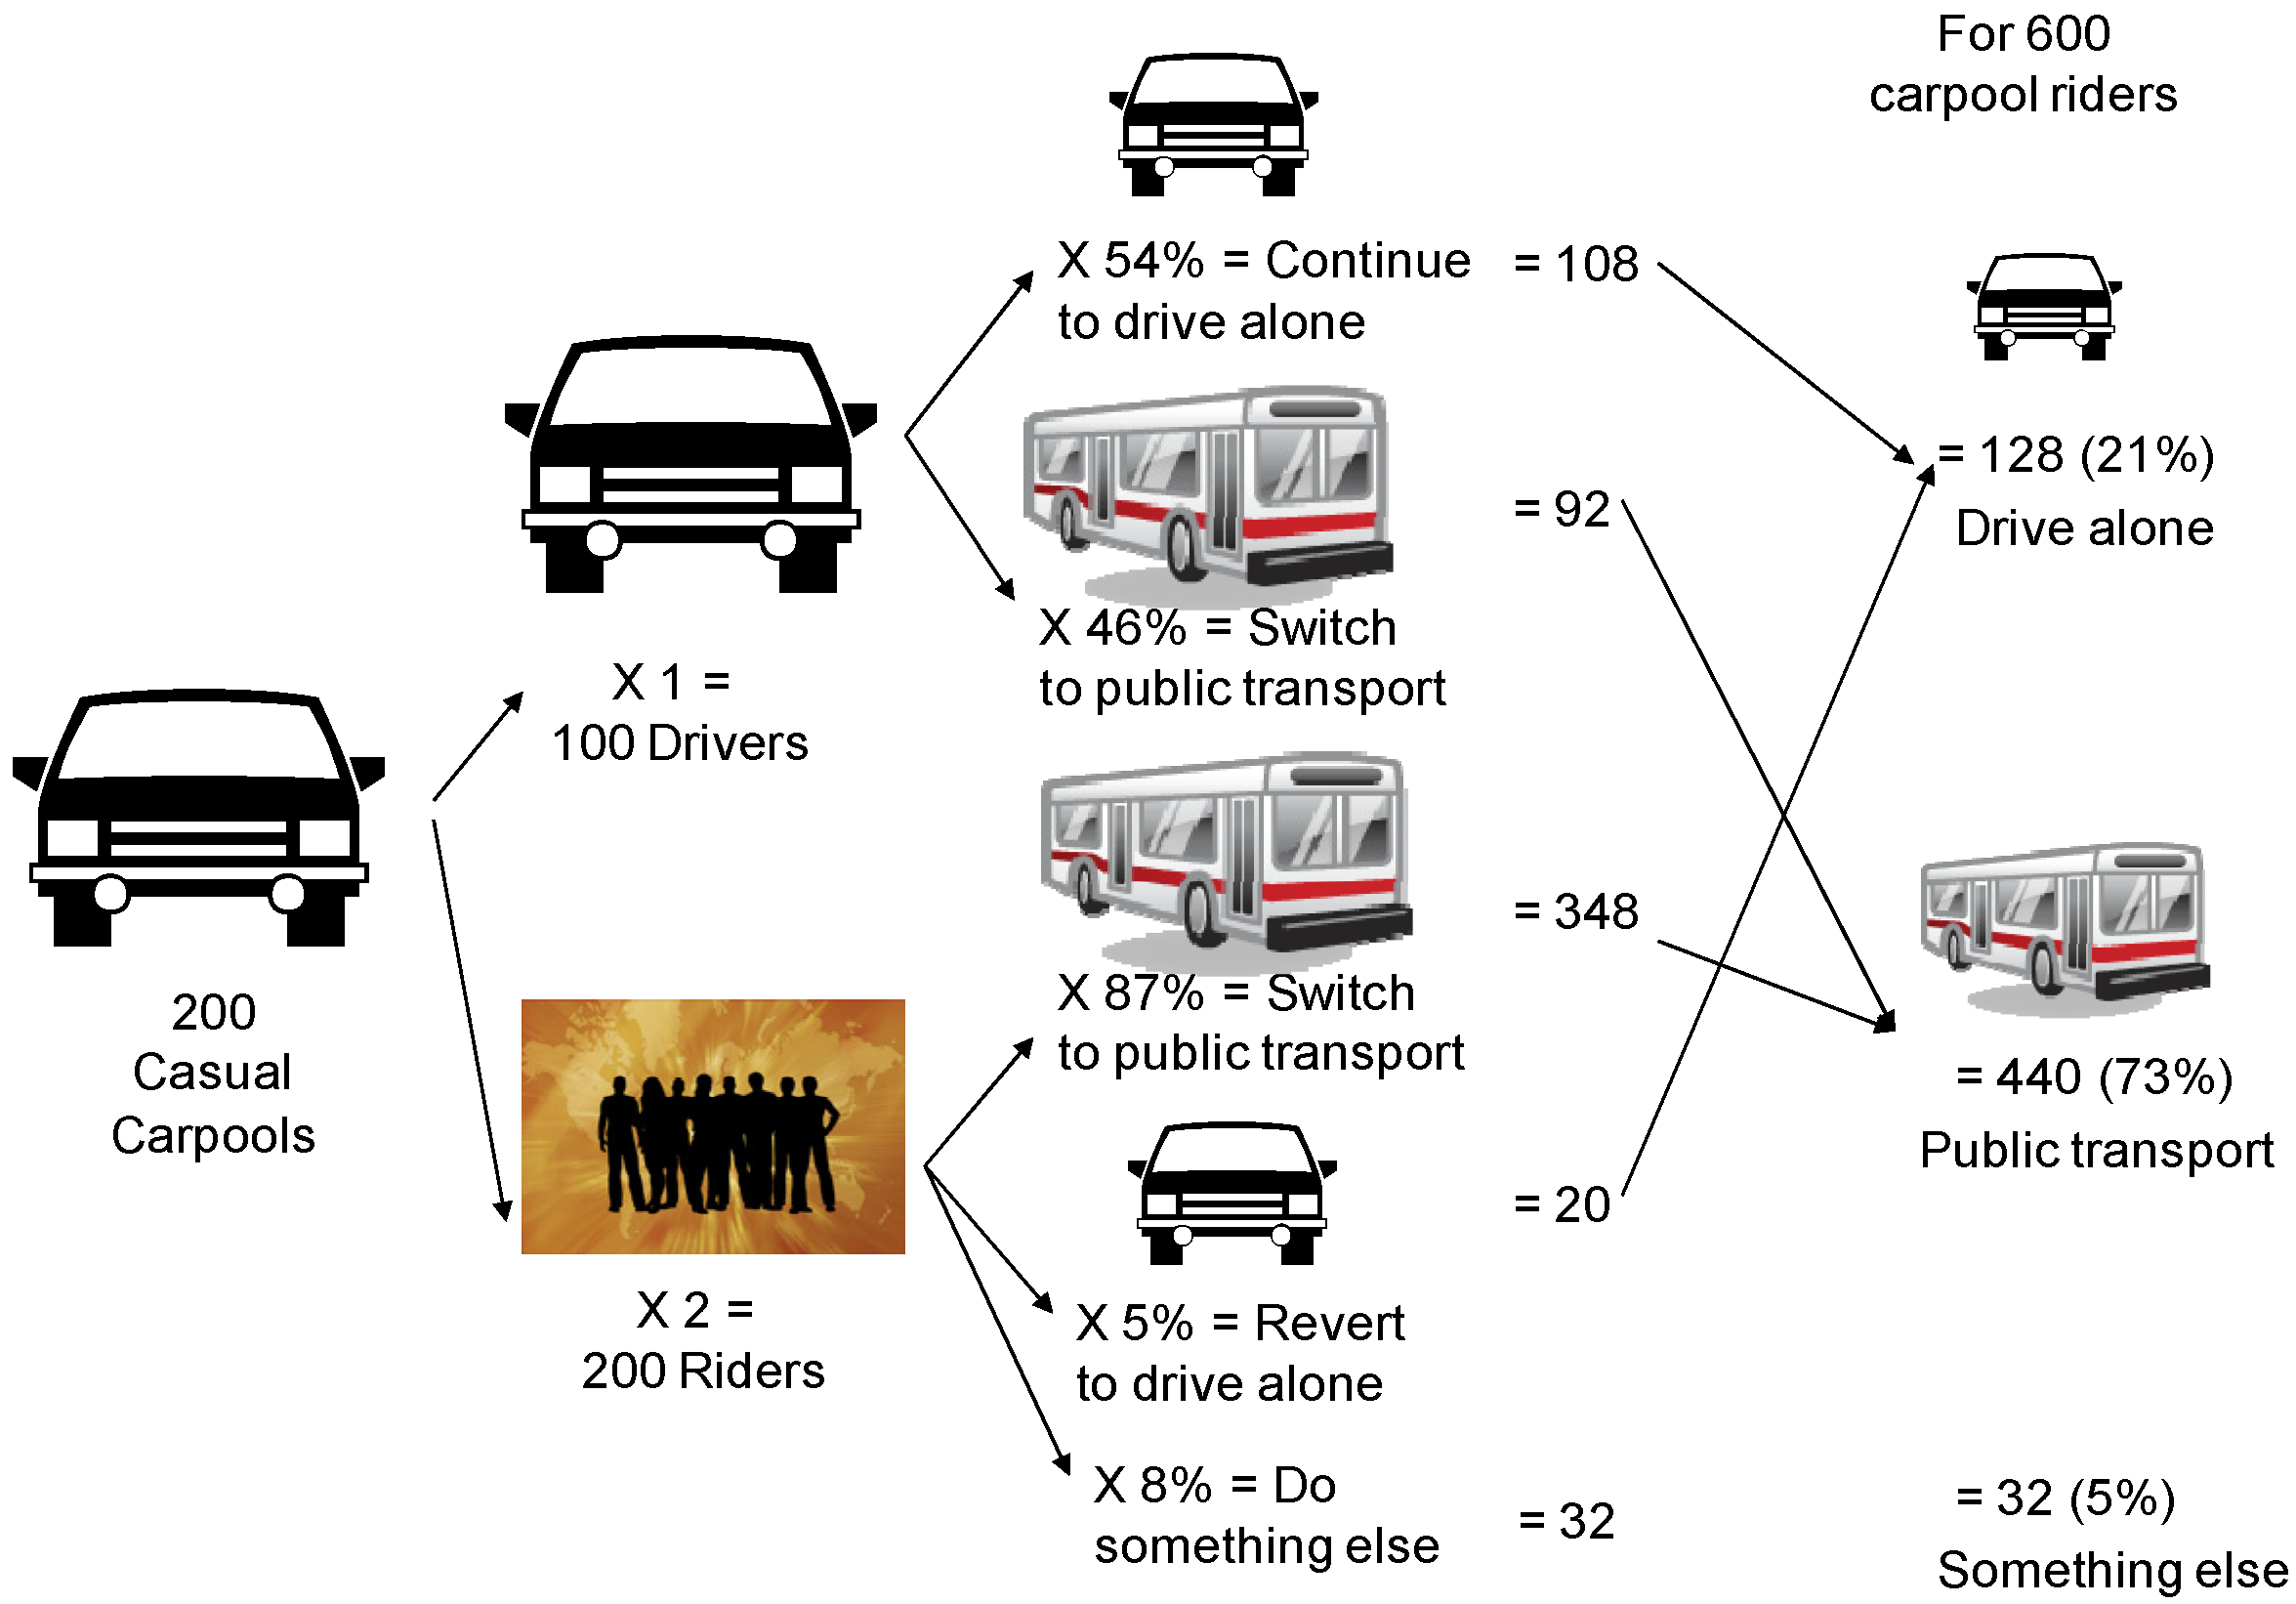
Concern has been expressed that casual carpooling takes passengers from public transport, and that if casual carpooling did not exist there would be fewer cars on the road. This is supported by survey data from San Francisco in 1998 (2010 update in brackets) that found that, if casual carpooling were not available, 87% (90%) of riders would otherwise be public transport passengers, and 46% (77%) of drivers would switch to an alternative all or most of the time [10,11]. The following sections show that even with more cars on the road, total energy consumption is probably being reduced.

| Location | Morning Pick-up Pts | After-noon Pick-up Pts | Average Daily Car-pools Per Pick-up Point | Participants Per Day (Year of Last Report) | Extent of Payment by Riders |
|---|---|---|---|---|---|
| Washing-ton, DC | 24 | 16 | 134 | 9689 (2006) | Nil |
| San Francis-co, CA | 22 | 1 | approx. 150 | 8000–10,000 (1999) 6800–8500 (2010) | Some riders on some routes pay $1.00 or $1.25 towards cost of discounted bridge toll since July 2010 |
| Houston, TX | 3 | 1 | 100 | approx. 900 (2007) | Nil |
2.2. Transportation Energy Consumption Calculations
Estimating transportation energy consumption is very complex. This is largely because the range of relevant factors is extensive. Time of travel, mode of travel, costs of travel at different times of the day, options regarding parking, toll rates, the convenience of alternatives, friendliness of carpool partners (whether casual or otherwise), and the ebb and flow of everyone’s individual decisions leading to varying levels of congestion, will all have an impact. Further, every segment of road has characteristics that lead to different assumptions about traffic speed, and the combination of all the segments is a large modeling exercise.
Such models exist. For example, the Auckland Regional Council has the Auckland Region Traffic (ART) Model. This is described as: “a fairly conventional four-step transportation demand model. It is a regional strategic model covering the whole of the Auckland Region urban area (population >1 million) with a relatively coarse zoning structure (203 internal zones) and having largely only the major arterial and motorway roading systems in its networks. It was designed to be sensitive to a range of urban dynamics and to undertake the investigation and evaluation of a range of regional transport policies and issues. It provides input to the development of regional transport plans and to regional urban form planning.”
In 2005 the ARC had modeled the potential impact of 2500 three-person express carpools in Auckland, using the ART Model. The modeling assumed that the source of the 5000 carpool riders would be existing SOV drivers. It predicted trip-time savings of 8539 hours per peak period, an increase in average speed from 37.81 kilometers per hour (km/h) to 40.44 km/h, and a reduction in annual energy consumption of 9.5 million liters of fossil fuel, or about 4% of existing consumption levels. The results of this modeling have been compared with the amount of energy consumption that would be avoided by the participants themselves (about 2.5 million liters). Compared with “all SOV driving”, these results suggest reduced energy consumption by all the traffic (the express carpoolers and everyone else) in the order of four times the reduced energy consumption by the express carpoolers themselves [4].
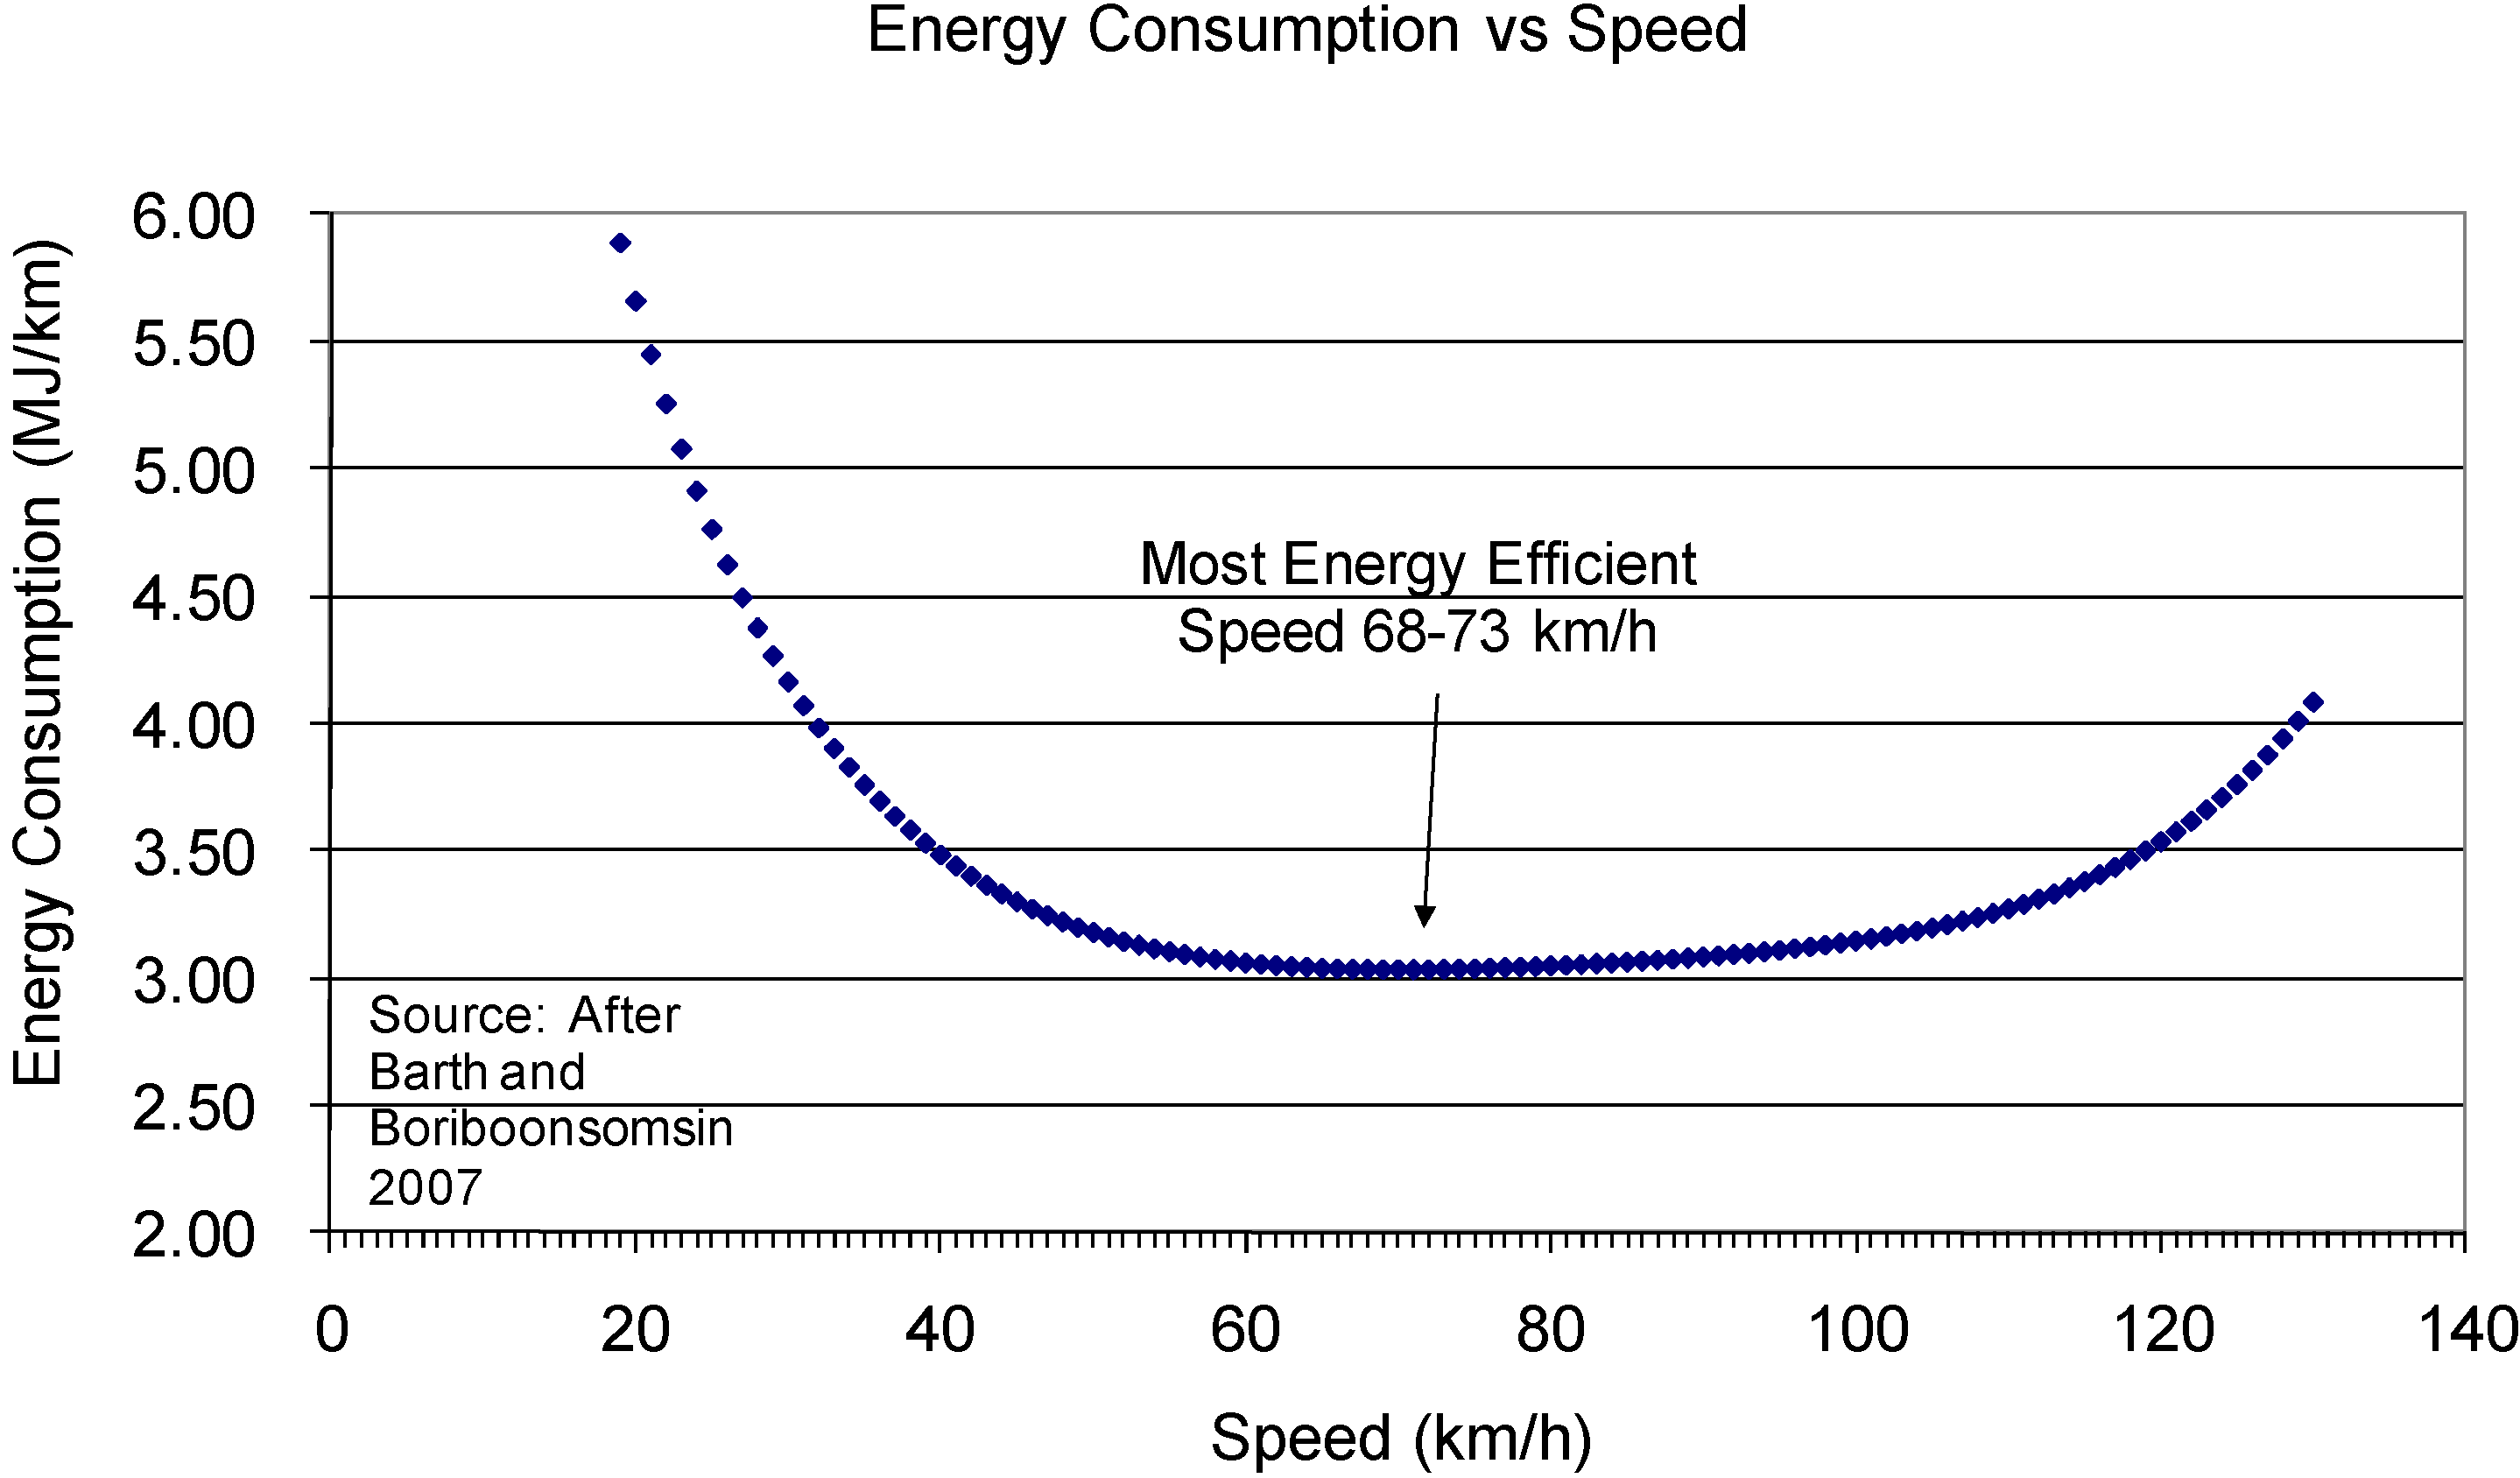
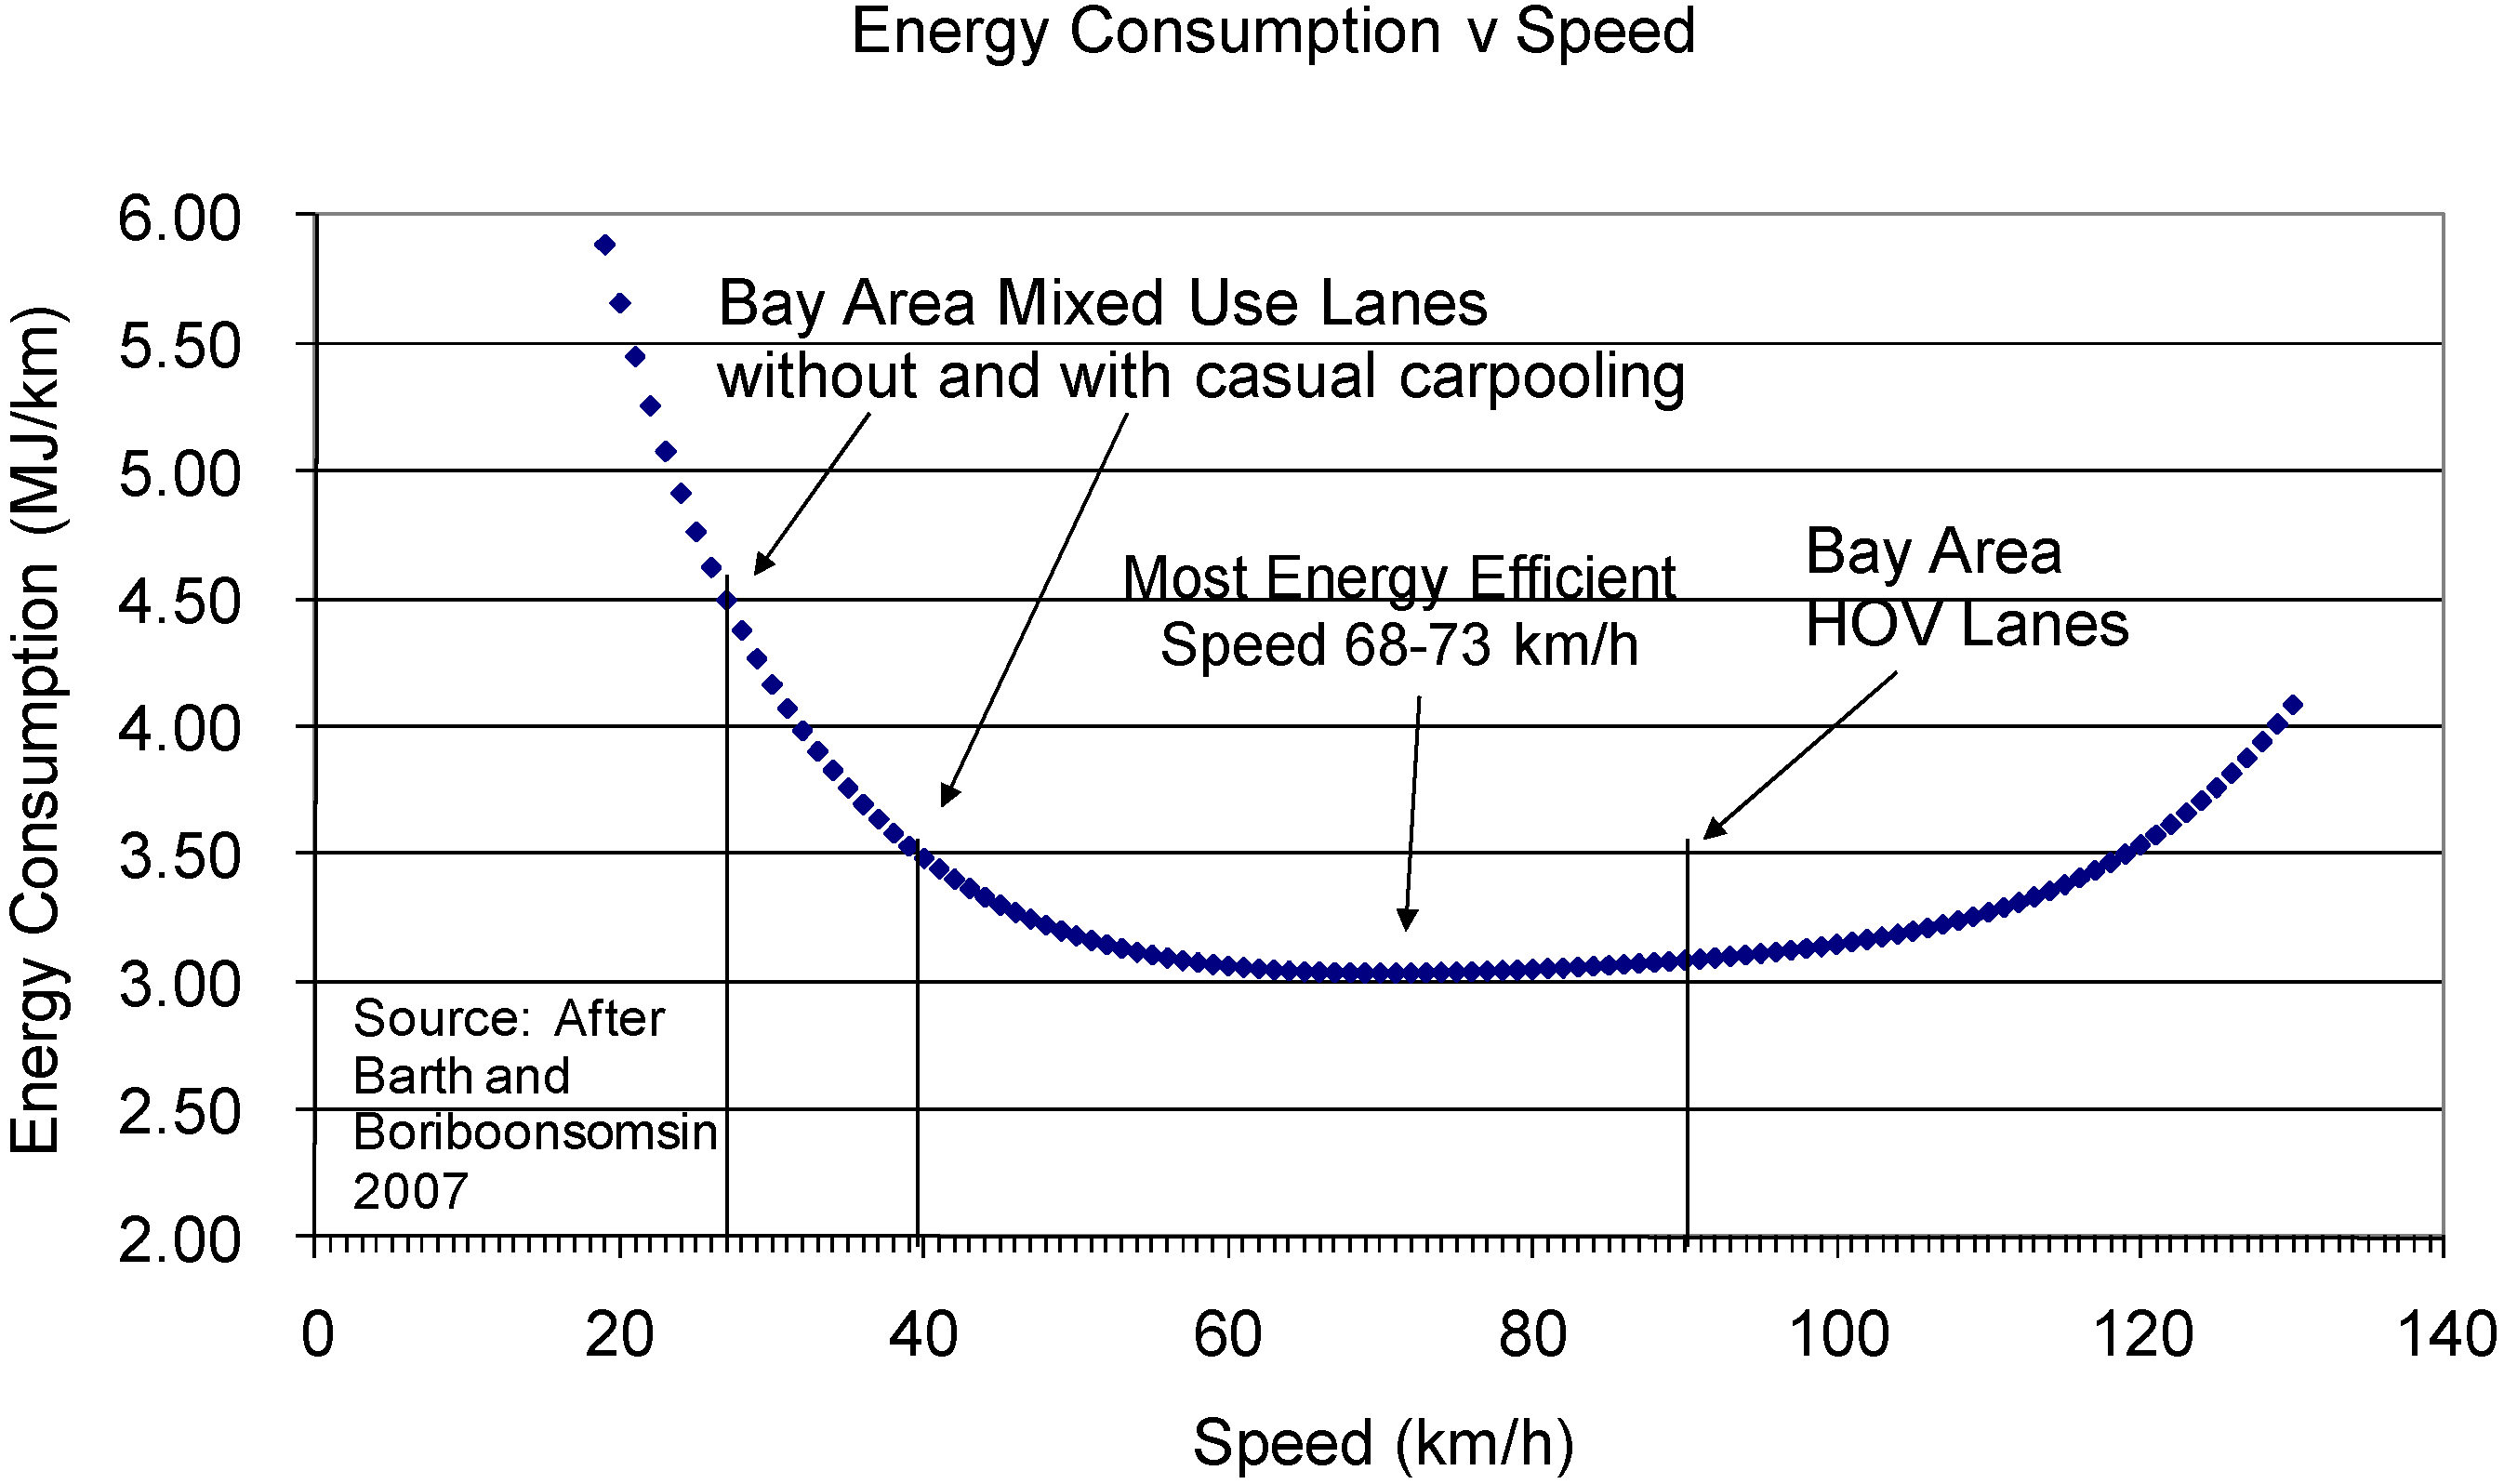
Figure 1 models energy consumption against changing traffic speeds, based on work by Barth and Boriboonsomsin [13]. (The work done by [13] focused on the carbon dioxide emission impacts of traffic at different speeds. Their carbon dioxide findings were converted into energy impacts to derive the chart).
Figure 1.
Energy Consumption Impact of Different Traffic Speeds.

As traffic moves at slower or higher speeds than the optimum of about 70 km/h, energy consumption per unit distance increases.
Taking the calculated starting and altered speeds for Auckland and applying them to the model from [13] would suggest a reduction in fuel use of 3.6%, or a similar magnitude to the results of the ARC modeling.
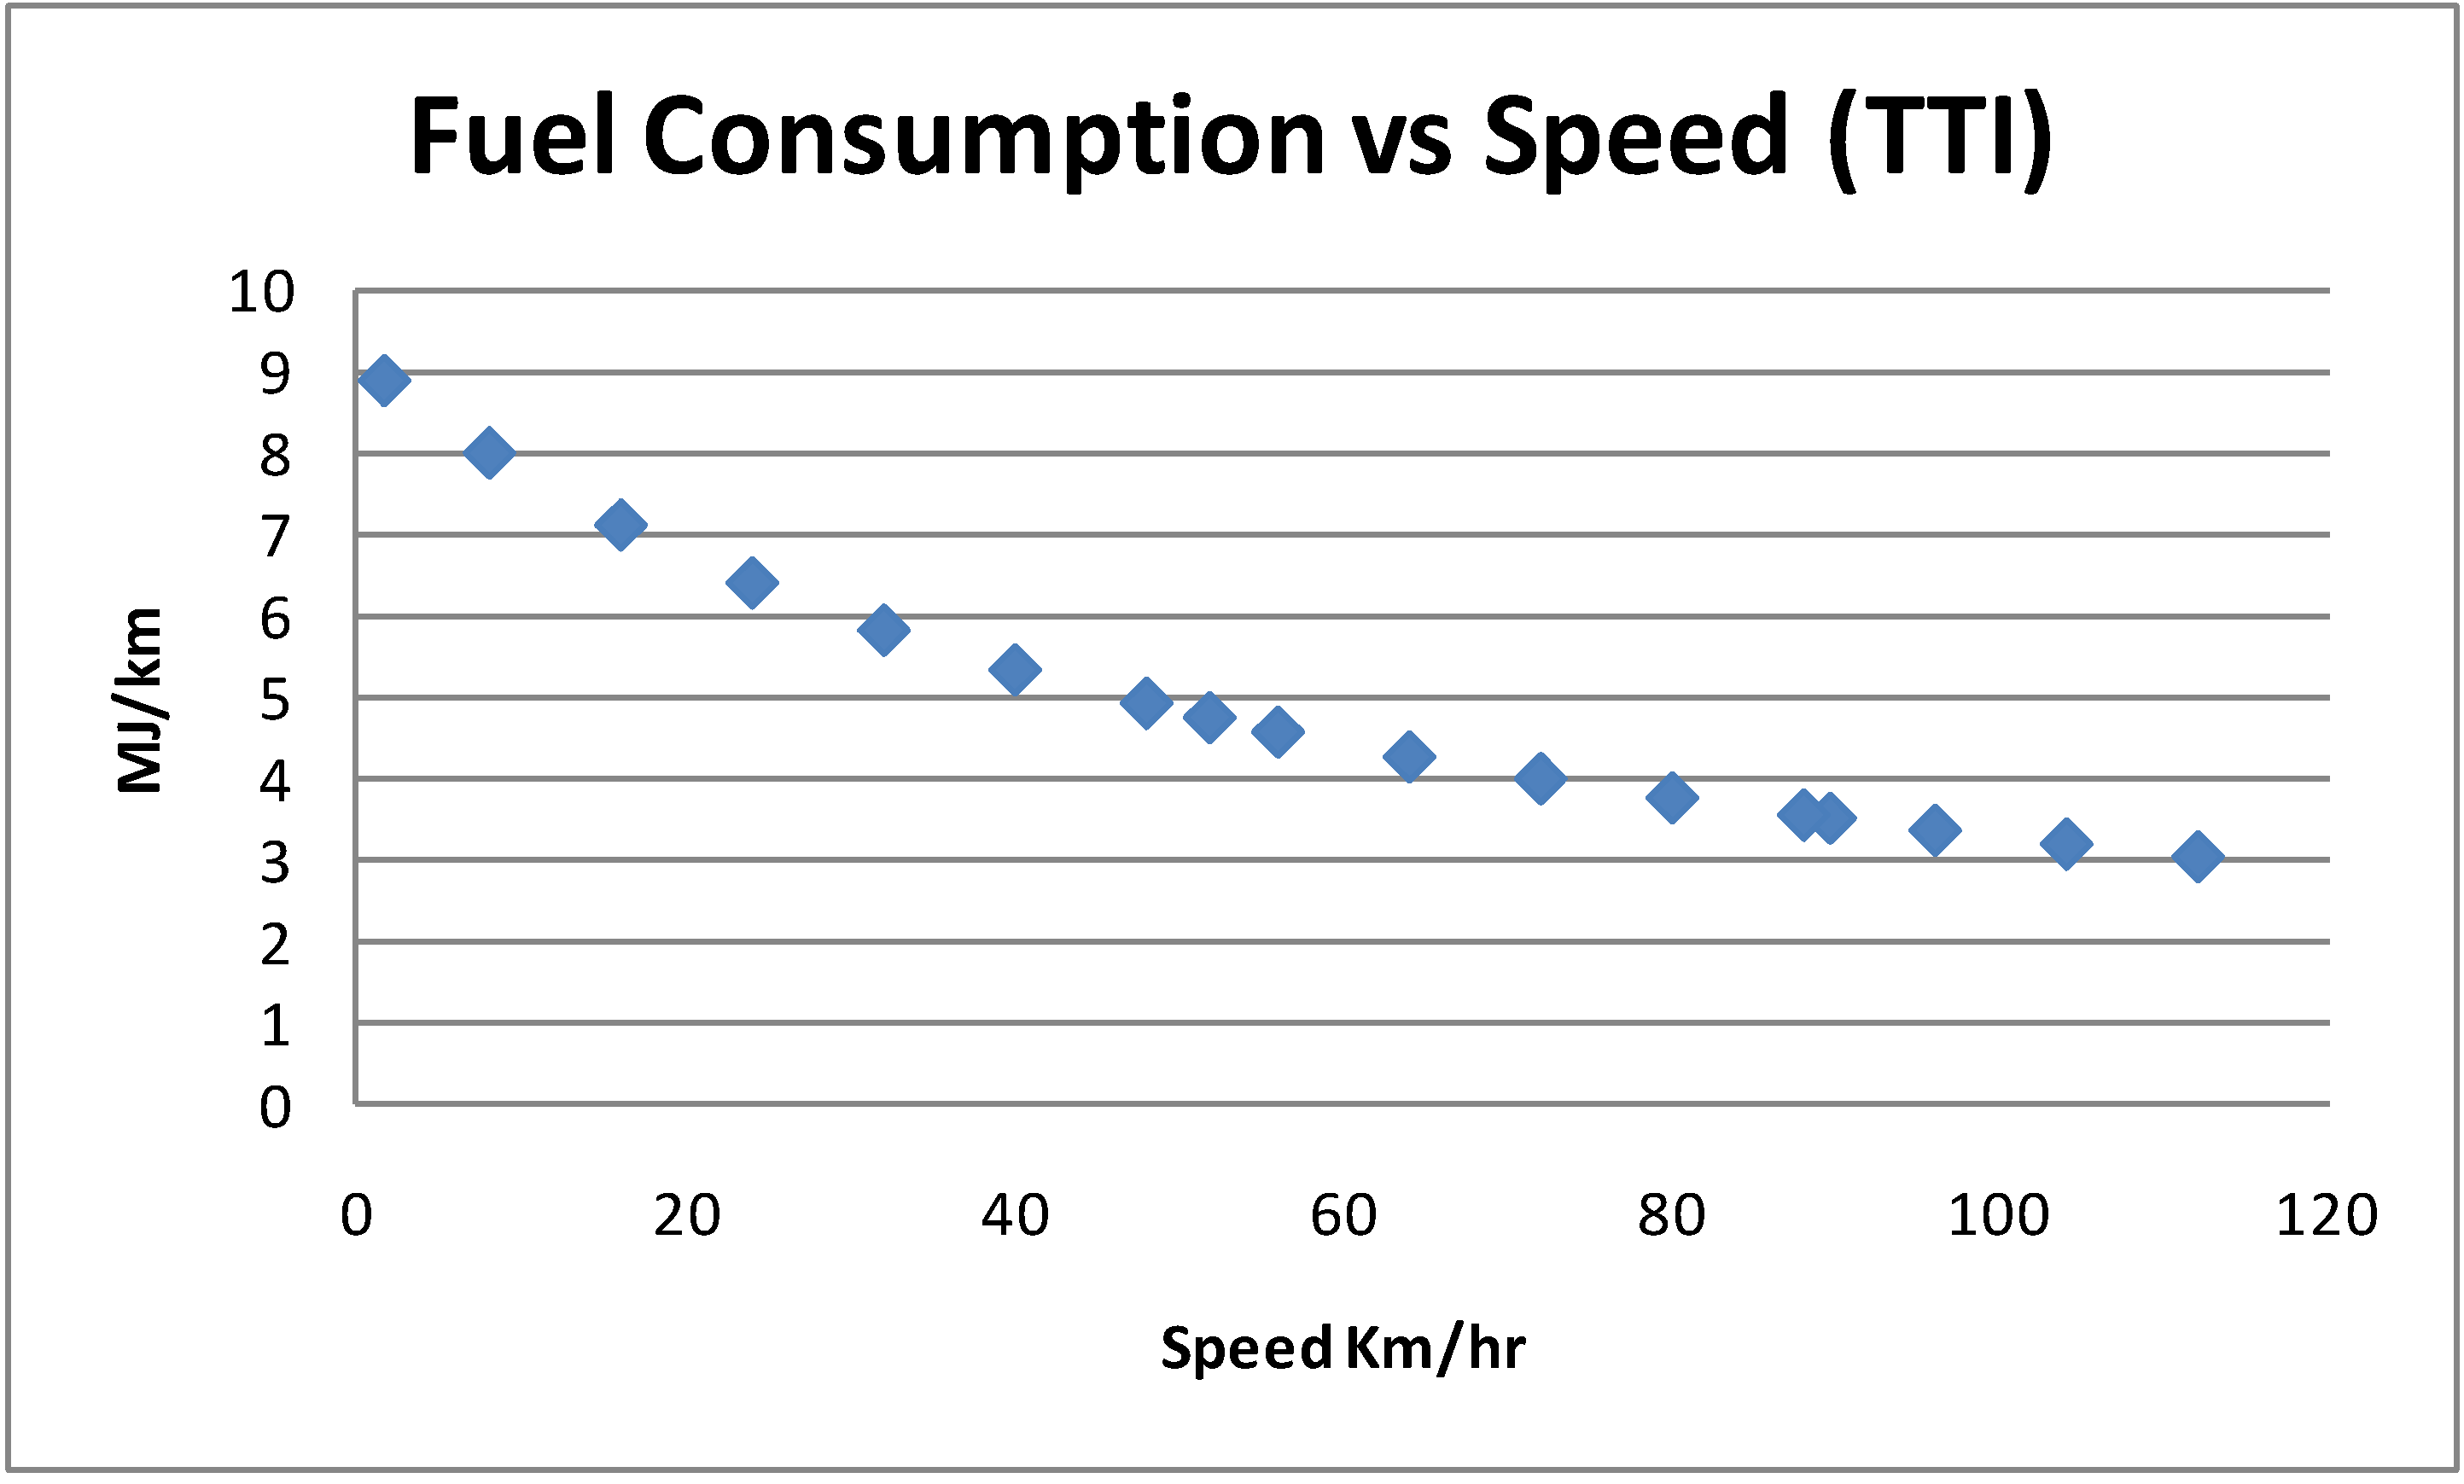
Figure 2 models energy consumption against different traffic speeds based on work by the Texas Transportation Institute (TTI) [14]. In calculating energy wasted in congested traffic for its occasional Urban Mobility Report, TTI uses the following formula: 8.8 mpg + (0.25 × speed).
Figure 2.
TTI Fuel Consumption vs. Speed.

Taking the calculated starting and altered speeds for Auckland and applying them to the TTI model would suggest a reduction in fuel use of 2.8%, about 70% of the level arrived at by the ARC modeling.
The authors have not attempted to rationalize the differences between the two models of energy consumption. The fact that the TTI model does not increase consumption at high speeds raises a question, but it is noted that the model is mainly used for estimated fuel wastage due to congestion, therefore likely to have been validated for lower speeds.
These methodologies suggest that if the change in vehicle numbers from casual carpooling could be estimated, and in turn the impact on the average speed could be estimated, then an estimate could be made of the energy impact.
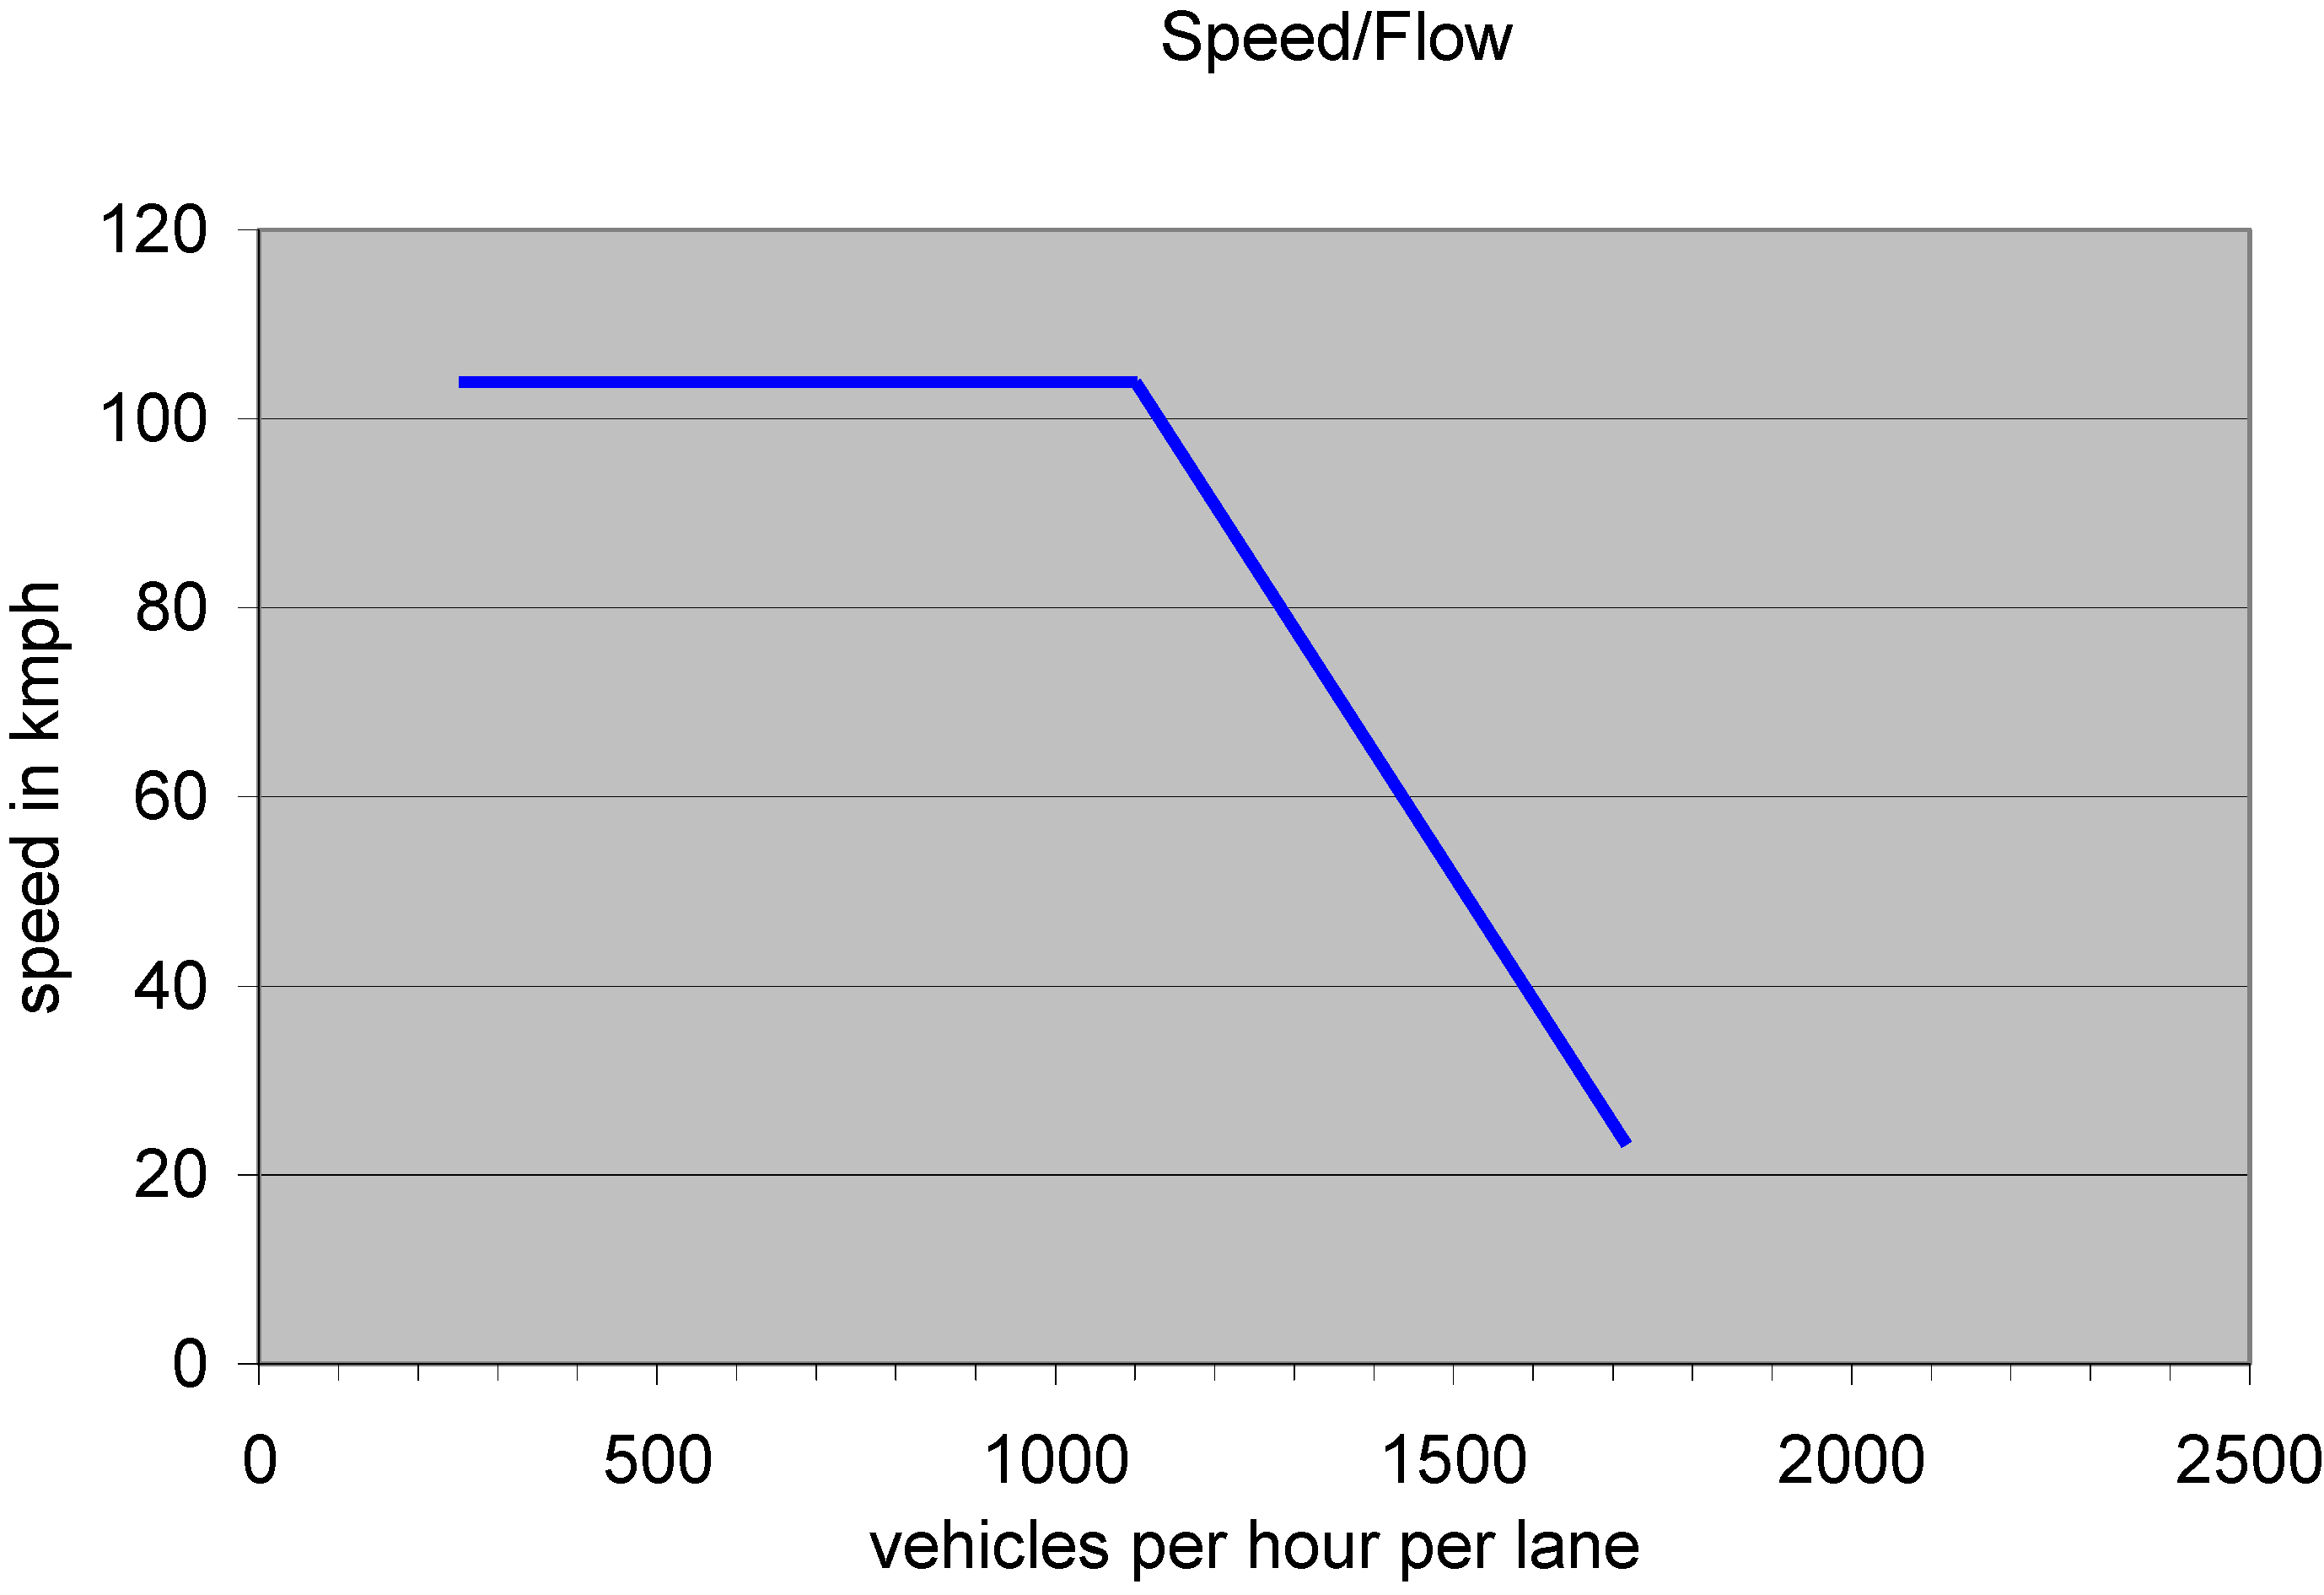
Speed/flow is a very complex relationship. Traffic moving at the same speed will have different density and therefore energy consumption implications if the speed is a result of the breakdown of traffic due to congestion (for example slowing to 30 km/h), than if the speed is a result of the speeding up of traffic as the congestion frees up (speeding up to 30 km/h). Figure 3 is a simplified speed/flow diagram, based on regression analysis (by Pearce, 2004, unpublished [15]) of HOV lanes in the San Francisco Bay Area [16].
Figure 3.
Simplified Model of Speed vs. Flow.

This speed/flow relationship assumes that the traffic runs smoothly at freeway speeds for rates up to 1100 vehicles per lane per hour. When demand exceeds 1100 vehicles per lane per hour the traffic speed can be expected to degrade. The model uses a constant rate of 12% speed change for each 100 vehicles added or removed per lane hour, a gross simplification of the complex relationship between speed and flow. This will be incorrect at the boundaries, but it is expected that the order of magnitude is reasonable. Some lanes move greater numbers of vehicles at lower speeds (there are reports of up to 2500 vehicles per lane hour, for example), while stop-start traffic achieves well below these levels.
3. Analysis: Energy Impact of Casual Carpooling
It seems intuitive that carpools reduce energy consumption when compared with the same people driving alone. But if some casual carpoolers would otherwise be bus or train riders the question becomes more complex. This section attempts to address this complex question, including giving consideration to the impact of this type of carpooling on the energy consumption of the other traffic on the same roads.
To find out if casual carpooling reduces energy consumption compared with a mix of people riding in buses and single occupant cars, and whether it therefore reduces energy use overall, this section brings together three simple energy consumption models.
- In 3.1 the energy use is estimated for casual carpoolers in a single casual carpooling route, compared with a mixture of bus riding and SOV driving.
- In 3.2 a simple model is created for estimating the impact of casual carpooling on other traffic in the same corridor, and
- In 3.3 the simple model is used to estimate the total impact of casual carpooling in San Francisco.
3.1. Comparing the Energy Use of a Single Casual Carpooling Route with a Bus/SOV Alternative
A comparison is made between the real situation of casual carpooling, with hypothetical services that some of the casual carpoolers would use if casual carpooling did not exist.
Casual carpoolers in San Francisco were surveyed in 1998 [10]. The survey, the fifth in a series stretching back to 1985, involved the distribution of questionnaires to casual carpoolers, and had a response rate of 31% (2350 questionnaires distributed and 725 returned). Among other questions, the survey asked how likely casual carpool drivers would be to continue driving if casual carpooling was not available and what mode passengers would use if they could no longer use casual carpooling. The survey also asked “prior commute mode” of passengers and drivers. The survey reached the surprising conclusion that if casual carpooling did not exist there would be fewer cars on the road. The report estimated that there could be between 317 and 645 more cars on the road with casual carpooling, than there would be in a hypothetical situation where casual carpooling did not exist. What the report did not consider was the possibility that the net impact would still be positive from an energy consumption point-of-view, given that the casual carpool cars would be operating at more efficient speeds in the HOV lane, compared with inefficient speeds in the general purpose (GP) lanes, and there would be less traffic in the GP lanes so it would run more efficiently.
3.1.1. A Hypothetical Case with 600 Participants Daily (200 Three-Person Carpools)
Applying the 1998 survey proportions for alternatives to casual carpooling to a single casual carpooling meeting-place with 600 participants (200 three-person carpools), Figure 4 shows that with casual carpooling there will be 200 vehicles, while without casual carpooling there will be 128 (plus buses). Note that the totals differ slightly compared to the 1998 survey report due to simplification.
Figure 4.
Alternative Mode for Casual Carpoolers (based on [12]). Note that 32 riders either stop commuting or revert to traditional carpools.
Figure 4.
Alternative Mode for Casual Carpoolers (based on [12]). Note that 32 riders either stop commuting or revert to traditional carpools.

Because the participants are using casual carpooling it is not possible to be sure of the features of the public transport service that participants would take if they could not use casual carpooling. A hypothetical bus service is therefore described, to carry these riders. For the following calculation assumptions have been made about such a bus service. The assumptions are stated below.
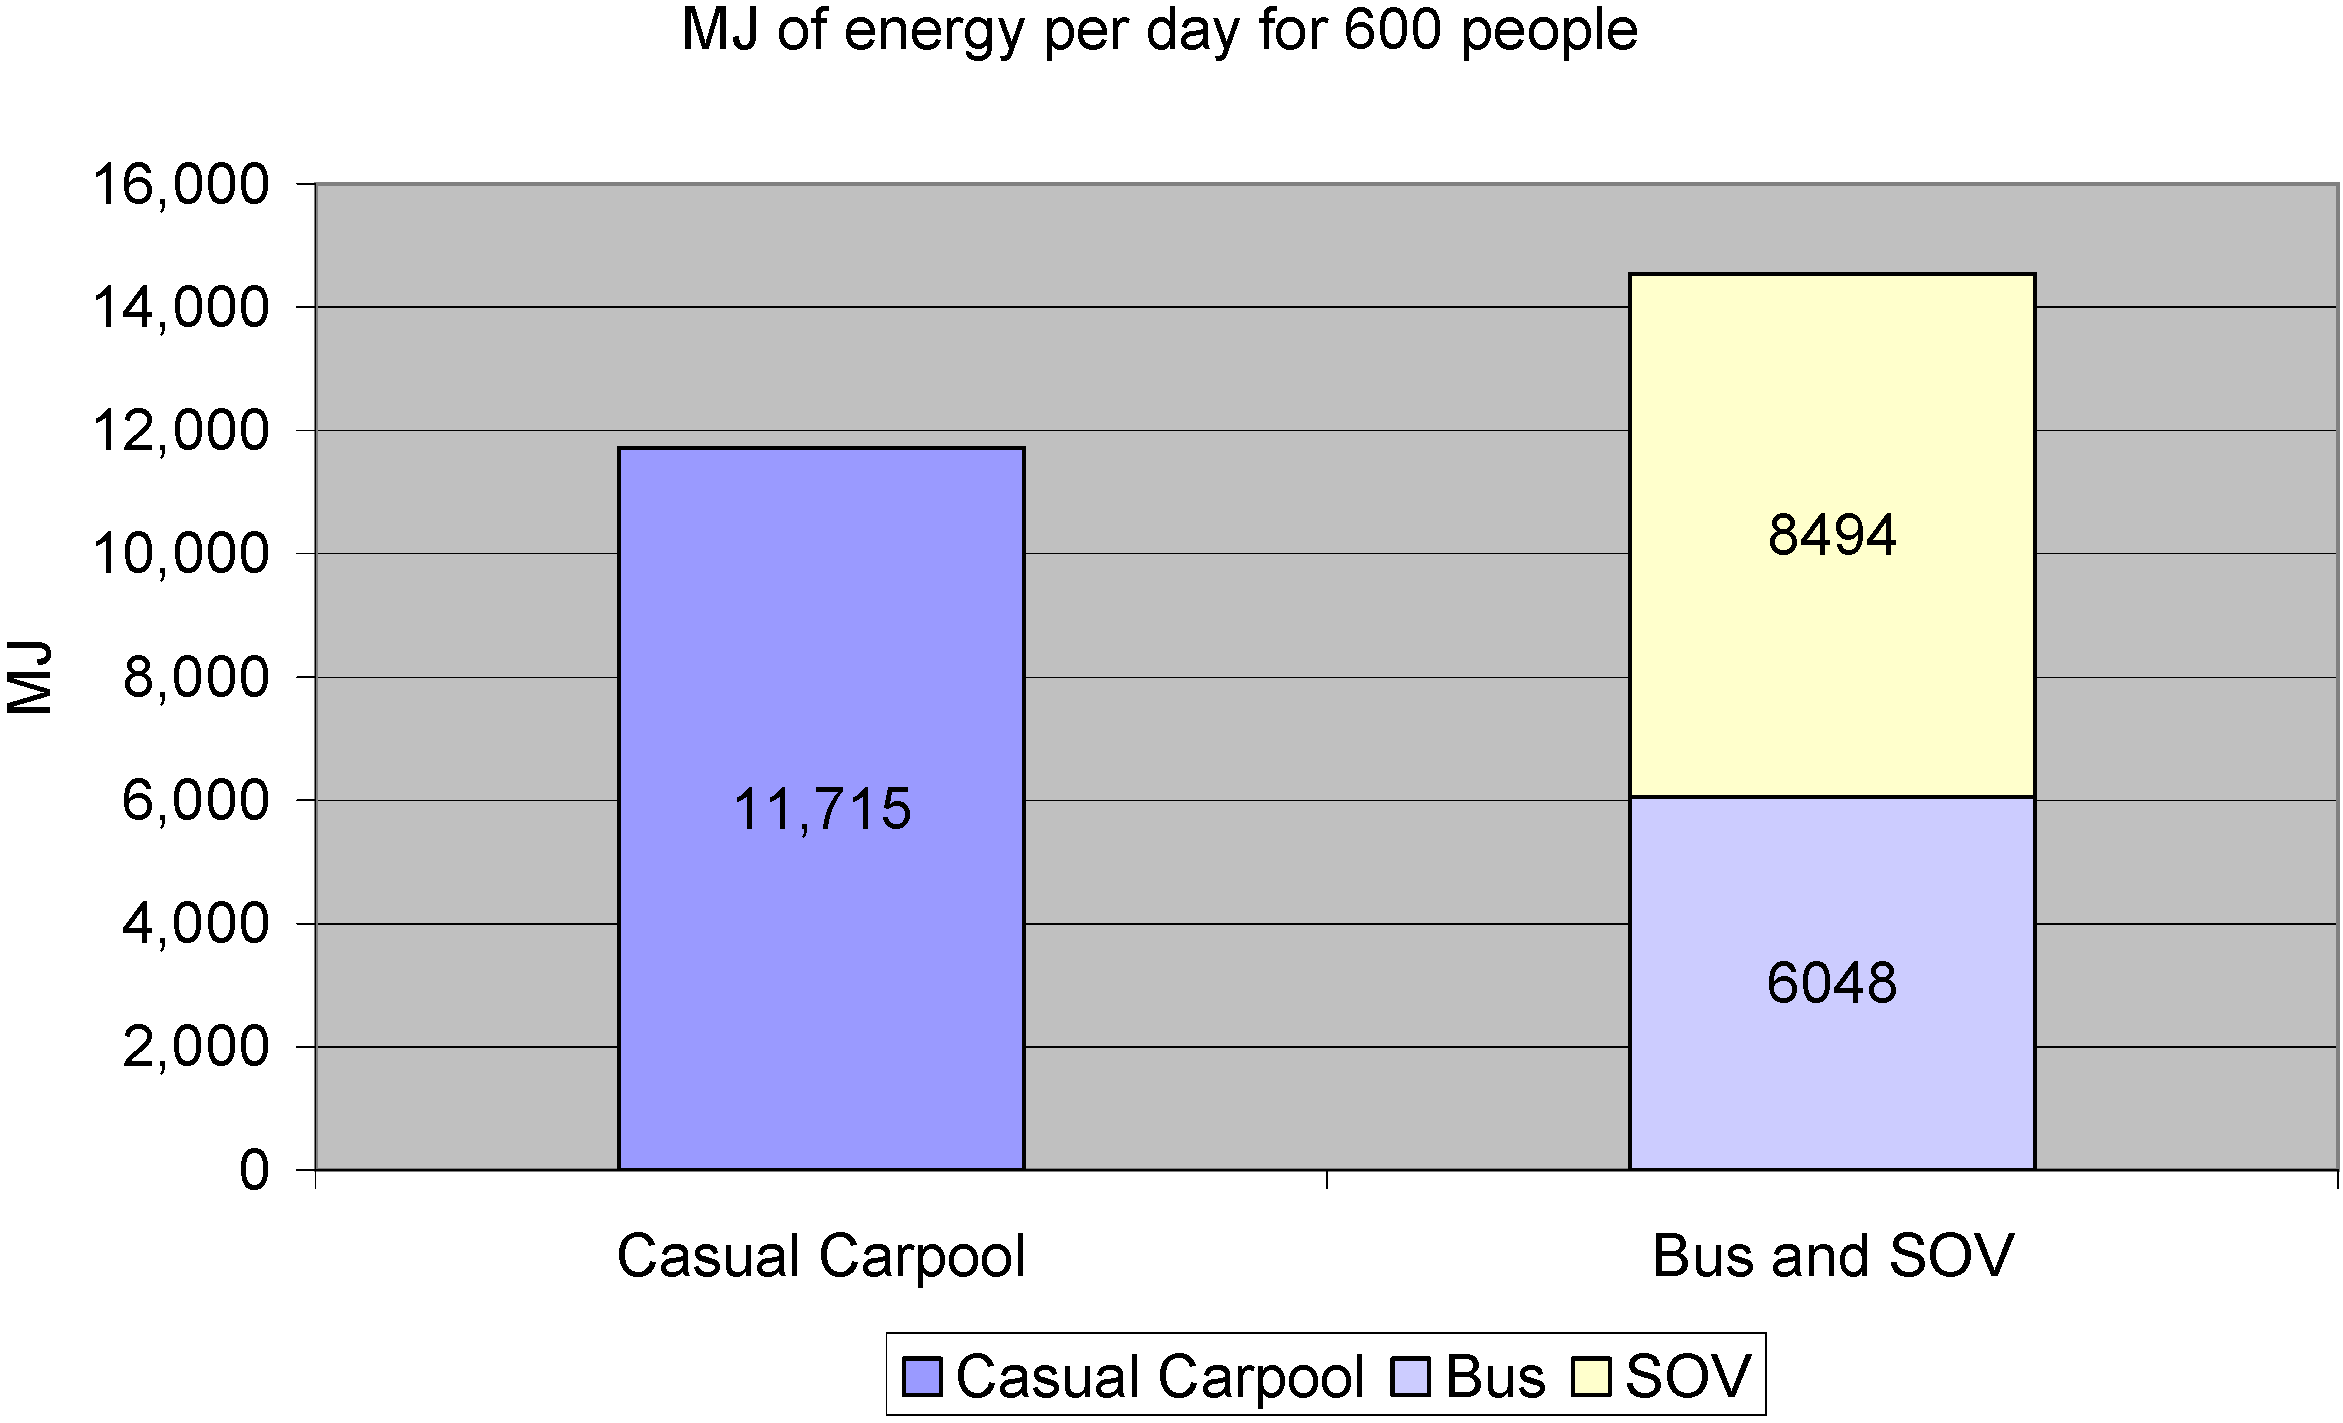
Figure 5 compares the energy requirements of casual carpooling from such a San Francisco casual carpooling location with the energy requirements for the combination of buses and SOVs that would replace them. It shows two scenarios, each of which involves 600 travelers, traveling a distance of 22.4 km (the weighted average length of all the San Francisco casual carpooling routes).
Scenario 1: 200 casual carpools, (600 travelers) and Scenario 2: 128 SOVs plus enough buses for 440 people.
Figure 5.
Comparative Energy Consumption of Travel for 600 People.

The key assumptions are:
- Three 55-seat buses will be used. (Some may argue that San Francisco commuters would switch to Bay Area Rapid Transit (BART) trains rather than to buses. It is noted that this could be correct, however there are capacity constraints on BART as described in Consider Congestion Pricing for BART, [17], and while individual passengers would probably be able to make the change, a wholesale switch from casual carpooling would probably swamp the system. Further, whether three 55 seat buses would be used, or some other configuration of bus size and frequency, would be a management decision for the operator. A different configuration would deliver a different energy consumption answer).
- Table 2 shows a potential trip pattern.
- Buses deadhead (return empty) three times each in order to carry the full number of passengers, achieving an average load factor of 44.4%.
- Buses use 15.0 MJ/km [18].
- The casual carpools use the HOV lane and travel at the average speed for the East Bay HOV lanes, 90 km/h, while
- The SOVs travel in the East Bay general purpose lanes at 38.5 km/h.
The result based on these assumptions is that the bus and SOV combination uses 24% more energy than the casual carpool scenario. It is the combination of the deadhead travel for the buses and slower travel in the GP lane for the SOVs (and therefore greater energy consumption [13,14]) that leads to the counter-intuitive result.
This analysis compares only the energy consumption of the participants’ transport in cars or buses. It does not include the energy impact on the other traffic in the corridor resulting from the casual carpools operating in the HOV lane instead of a subset or multiple of those vehicles operating in the GP lanes. This is considered in the next two subsections.
| Passengers | ||||
|---|---|---|---|---|
| Departure | Bus 1 | Bus 2 | Bus 3 | Cumulative |
| 6:30 | 27 | 27 | ||
| 6:45 | 55 | 82 | ||
| 7:00 | 55 | 137 | ||
| 7:15 | 55 | 192 | ||
| 7:30 | 55 | 247 | ||
| 7:45 | 55 | 302 | ||
| 8:00 | 55 | 357 | ||
| 8:15 | 55 | 412 | ||
| 8:30 | 28 | 440 | ||
| Trips per Bus | 3 | 3 | 3 | 9 |
| Distance per Round Trip | 44.8 | |||
| Total km bus travel | 403.2 | |||
| MJ/km for bus | 15 | |||
| MJ Consumed | 6048 | |||
| Casual Carpools Fuel Use | |||
|---|---|---|---|
| Hybrid | Standard | Total | |
| Distance | 22.4 | 22.4 | 22.4 |
| Cars | 20 | 180 | 200 |
| Total km | 448 | 4092 | 4480 |
| MJ/km | 1.58 | 2.73 | |
| MJ consumed | 707.84 | 11007.36 | 11715.2 |
3.2. A Simple Model for Estimating the Impact of Reduced Traffic on Fuel Consumption
In order to estimate an order of magnitude impact on the rest of the traffic the following calculations compare the energy consumption in the traffic flows with and without casual carpooling. The key variables used are the estimated speeds in the GP lanes with and without casual carpooling, which in turn is driven by the proportion that the changed traffic has to the existing traffic. Energy impacts will be proportionally greater when the existing traffic speeds are low, resulting in high changes in consumption per unit distance, and proportionally smaller when the existing traffic speeds are high (and there is less congestion).
Figure 6 shows the model developed by [13] with an overlay of the estimated speeds of the Bay Area traffic with and without casual carpooling (estimated by the authors and checked for reasonableness with the model of speed vs. flow in Figure 3).
Figure 6.
Consumption Impact of Different Traffic Speeds.

3.3. Estimating the Total Impact of Casual Carpooling
The above assumptions and models allow estimation of the impact of casual carpooling on energy consumed by the traffic in the GP lanes of the San Francisco Bay Area:
- With existing casual carpooling, and
- If casual carpooling ceased to operate from all locations, participants switching mode according to the survey findings reported by [10].
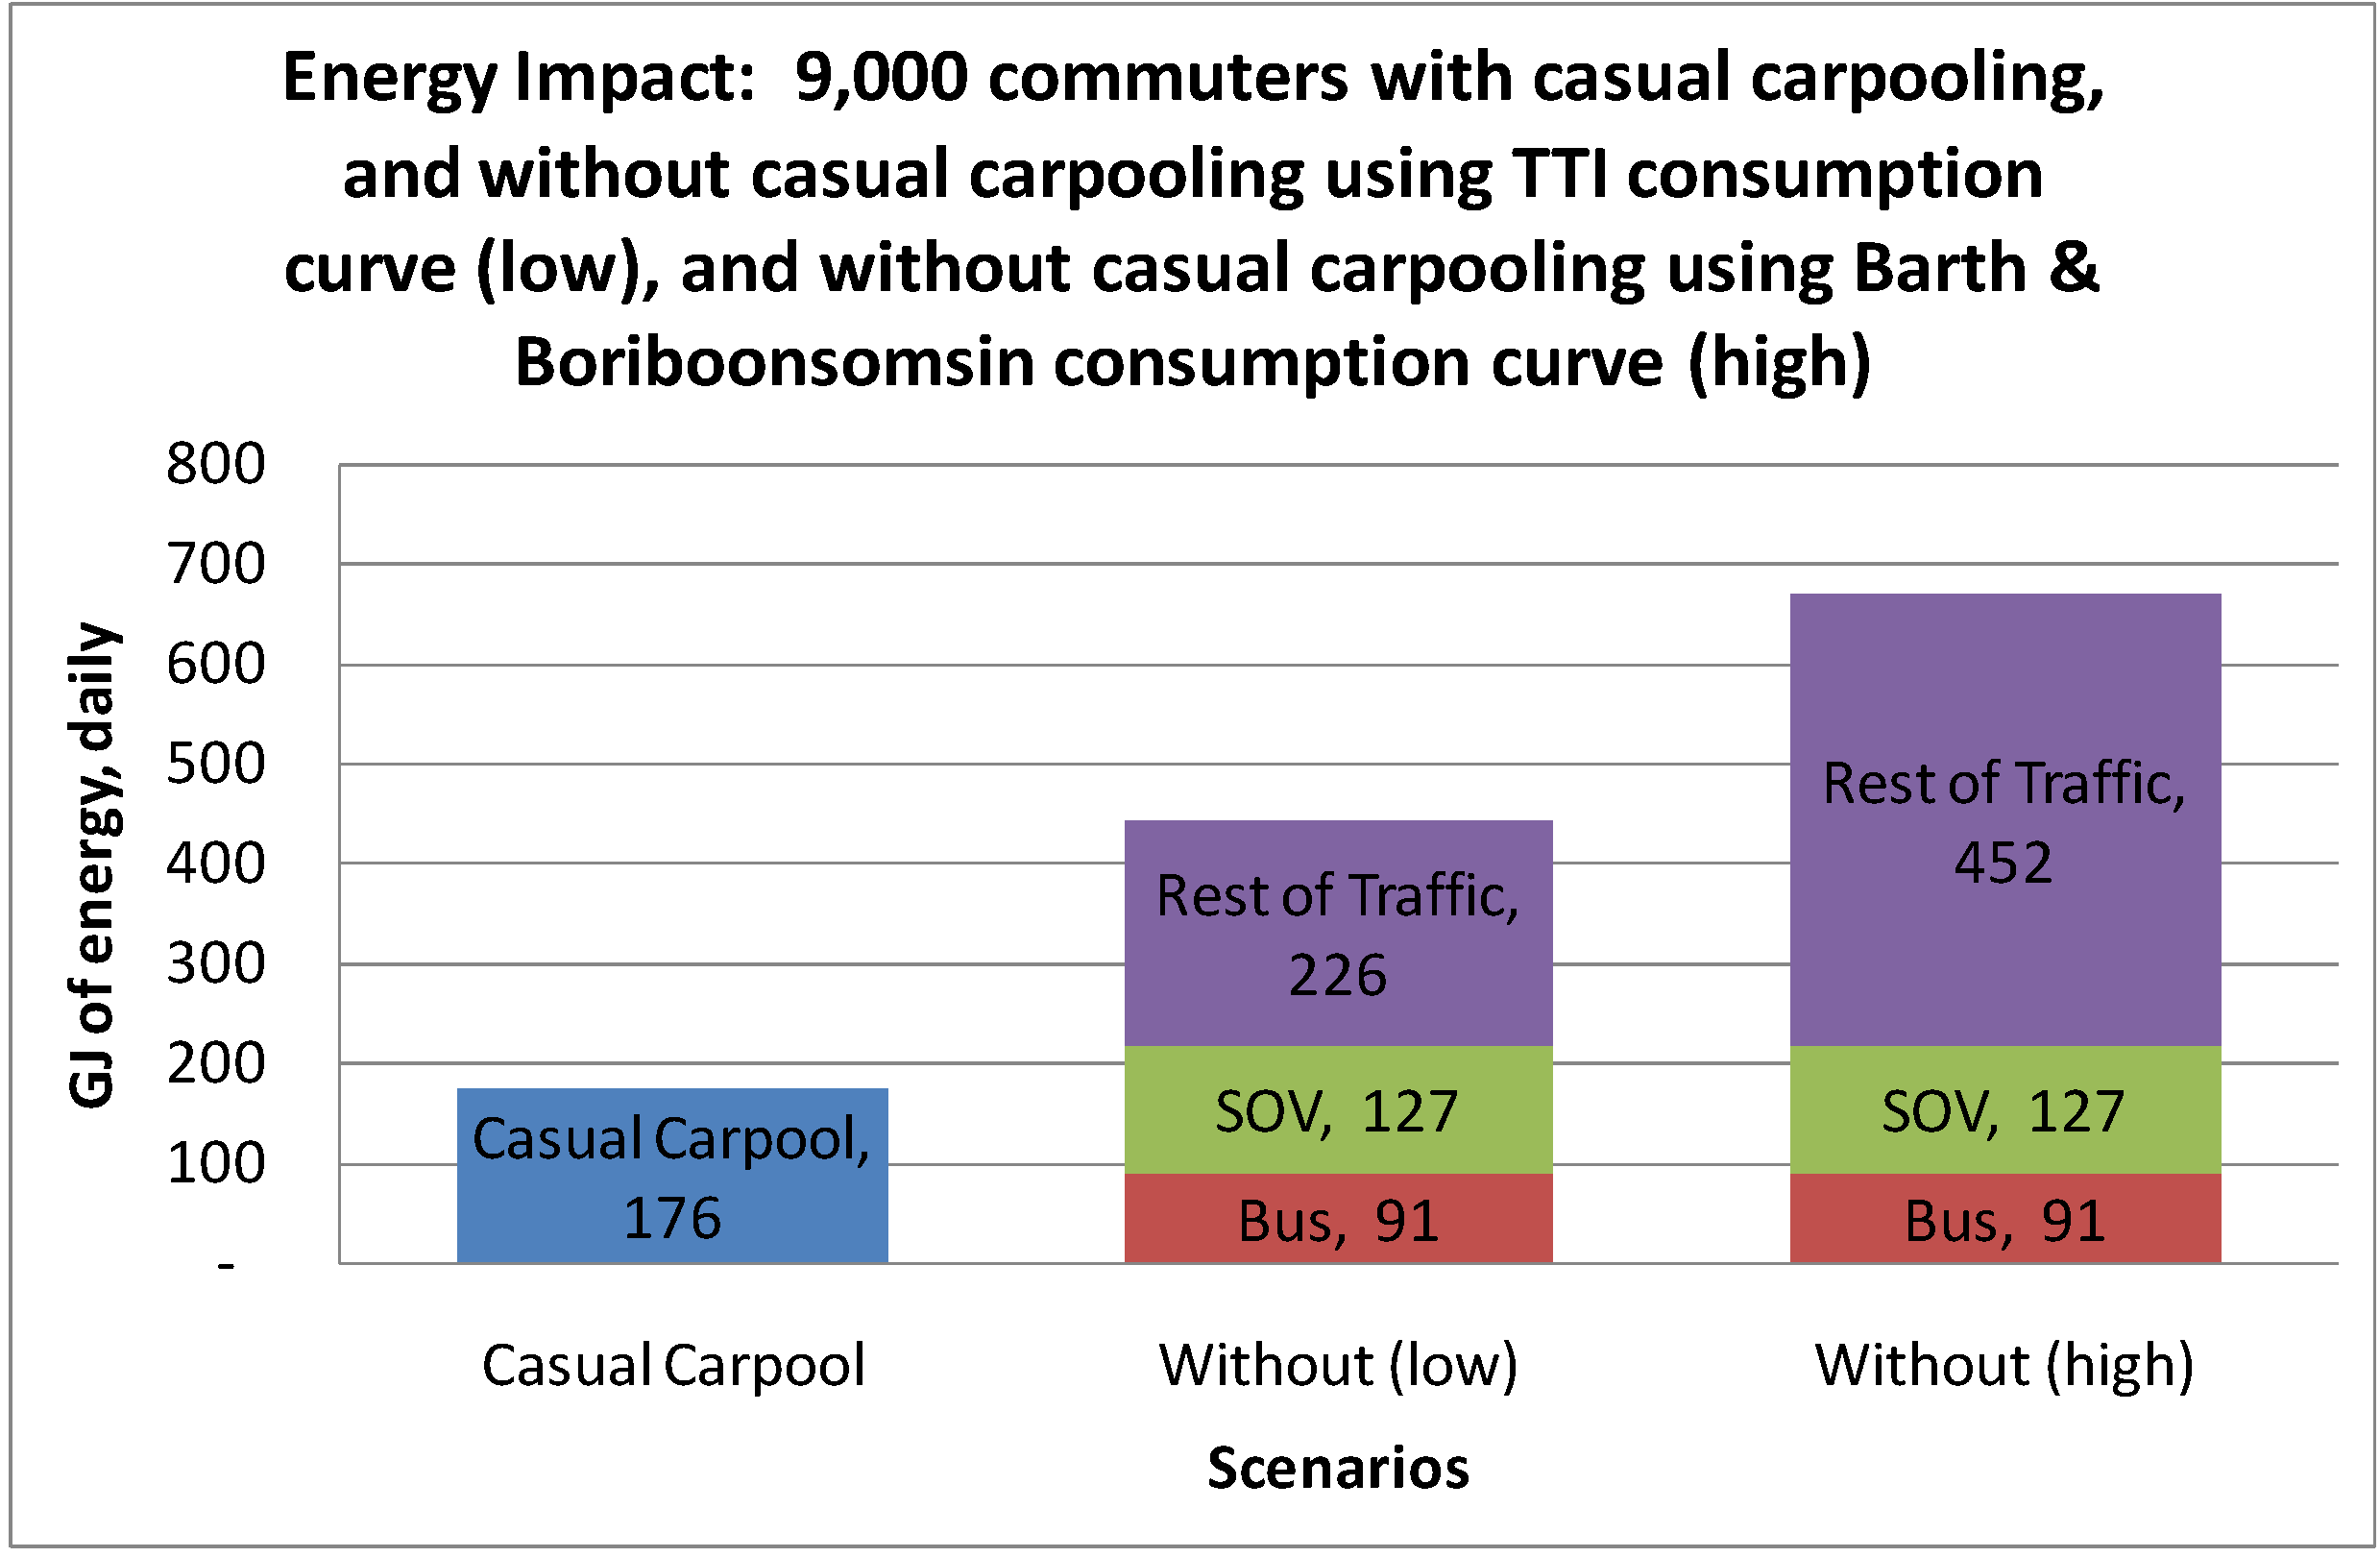
Based on chart in Figure 3 the average speed of the 32,880 vehicles arriving at the Bay Bridge Toll Plaza in the general purpose lanes (not including carpoolers) (across the network of highways leading to the Bay Bridge) would be reduced from an existing average of 39.5 km/h with casual carpooling to an average of 27 km/h without casual carpooling. Based on the consumption curve in Figure 1 the traffic would consume 35% more energy as the speed reduced. Based on the consumption curve in Figure 2 (TTI) the traffic would consume 15% more energy as the speed reduced. This equates to a range of 194 to 452 GJ of energy per day being conserved as a result of casual carpooling.
The daily energy impacts of the 600 members of a single casual carpooling route are grossed up to reflect the impact for 9000 users (midpoint of 8000–10,000) of the whole system.
These figures suggest that casual carpooling conserves in the order of 250 to 500 GJ per day (or the equivalent of 1.7–3.5 million liters (450,000–900,000 US gallons) of gasoline per year). This benefit would increase if congestion worsens, or if the average energy consumption of cars was greater than the figures used in the model, and decrease if there was less congestion or cars were more efficient.
Figure 7 shows the calculated fleet energy consumption impact of casual carpooling, combining both the direct and indirect impacts at the level suggested by the consumption curves in Figure 1 & Figure 2.
Figure 7.
Comparing daily transportation energy impact of 9000 San Francisco casual carpoolers with and without casual carpooling.
Figure 7.
Comparing daily transportation energy impact of 9000 San Francisco casual carpoolers with and without casual carpooling.

While it stretches the scope of this paper it is worth exploring non-energy benefits of casual carpooling for San Francisco. These include the value of time saved, buses not purchased and operated, bus drivers not paid, and flow-on benefits such as lower emissions and fewer accidents. Alameda County Transit (responsible for moving people from Oakland to San Francisco on the routes where the casual carpooling operates) has publically stated that bus related savings exist [19]. If all factors were valued they could amount to more than $US 30.0 million per year, for the morning commute alone, as shown in Table 4.
It seems reasonable to conclude that casual carpooling conserves energy and generates other collateral benefits. This appears to be true even if participants would otherwise take the bus, because casual carpooling reduces the number of buses needed, (therefore avoiding deadheading of buses), and increases the energy efficiency of traffic in the GP lanes.
Table 4.
Estimate of Annual Savings from Casual Carpooling in San Francisco. All volumes and values in Table 4 have been estimated by the authors.
| Factor | Volume | Value | Total $US Million per Annum |
|---|---|---|---|
| Energy (million liters gasoline | 1.7–3.5 | $3.00 | 1.35–2.7 |
| Emissions (tonnes CO2e) | 4100–8200 | $15 | 0.05–0.1 |
| Time Savings for all Commuters | 900,000 hours | $30 | 27.0 |
| Buses not purchased | 45 buses | $0.5 million @10% per annum | 2.20 |
| Bus Operating Costs not incurred | 45 drivers | $50,000 pa | 2.20 |
| Accidents avoided | ? | ? | ? |
| Total per annum | >30.0 |
The estimated 6000 daily riders, at 230 days per year, take something in the order of 1.3 million casual carpool trips per year (morning only). The saved bus-driver costs and capital costs alone are estimated at $US 4.4 million, or $3.38 per trip, to which would be added bus fuel, repairs, maintenance and management costs (not listed above) while the total saving per trip could exceed $US 23.00 ($US 30.0 million divided by 1.3 million trips).
If casual carpooling is considered through the lens of transit revenues and costs, it is unlikely that the lost transit revenues would exceed the saved transit costs, and the lost transit revenues would be much lower than the saved total costs, so there would be a net gain to transit from the existence of casual carpooling.
This example of the San Francisco situation, comparing “with” and “without” casual carpooling suggests that there may be benefits available from deployment of casual or express carpooling to other cities.
4. Discussion and Conclusions
The objective of this paper was to estimate the energy consumption impacts of casual carpooling.
Casual carpooling in three US cities moves high volumes of people at very low cost. The benefit to San Francisco is estimated to exceed $US 30.0 million per year, including conserving an estimated 1.7–3.5 million liters (0.45–0.9 million US gallons) of fuel, at almost no public expenditure.
It is noted that the majority of the benefits attributed to casual carpooling are comprised of the assumed impact on the rest of the traffic (90% of the conserved energy) and time savings (at $30 per hour, 90% of the value savings). It is observed that the key justification for most transportation initiatives rests on the impact on the traffic, and the amount of time saved. Casual carpooling should be no different.
Further research is suggested, in two directions. Firstly, effort could be put into firming up the rough estimations used in this paper. The magnitude of the estimated benefits, even allowing reasonable margins for error in the calculations, suggest that further analysis is likely to support a conclusion that benefits exist. This seems intuitive. Secondly, given a reasonable conclusion that benefits exist, effort could be put into applied research to find out how to bring these benefits to other locations.
The success of carpooling (or any other consumer product, including transit) depends on providing a sufficient mix of benefits to attract the desired number of users. Casual carpooling effectively adds schedule flexibility to the usual mix of carpooling benefits, or removes schedule inflexibility from the usual mix of carpooling barriers. Successful adaptation of this system that leads to deployment in other cities would bring benefits of reduced energy consumption for the participants and the rest of the traffic.
Successful introduction of casual carpooling to additional locations would result in an increase in average vehicle occupancy. Raising assumptions about average vehicle occupancy rates could reduce forecast demand for vehicle miles travelled (VMT) and transportation energy.
References
- Noland, R.B.; Cowart, W.A.; Fulton, L.M. Travel demand policies for saving oil during a supply emergency. Energy Policy 2006, 34, 2994–3005. [Google Scholar] [CrossRef]
- Cambridge Systematics. Moving Cooler: An Analysis of Transportation Strategies for Reducing Greenhouse Gas Emissions; Urban Land Institute: Washington, DC, USA, 2009. [Google Scholar]
- Homepage of Trip Convergence Ltd. Available online: www.flexiblecarpooling.org (accessed on January 10, 2011).
- ARC. Modeling of flexible carpooling using the Auckland Region Traffic Model. Personal communication, Auckland Regional Council: Auckland, New Zealand, 2005. [Google Scholar]
- Transportation Research Board. Transit IDEA project: Flexible Carpooling to Transit Stations. Available online: http://144.171.11.40/cmsfeed/TRBNetProjectDisplay.asp?ProjectID=2697 (accessed on January 10, 2011).
- Ridenow. Available online: www.ridenow.org/carpool (accessed on January 12, 2011).
- Slug-lines. Available online: www.slug-lines.com (accessed on January 12, 2011).
- Oliphant, M. The Native Slugs of Northern Virginia: A Profile of Slugging in the Washington D.C. Region. Master Thesis, Virginia Tech Department of Urban Affairs and Planning, VA, USA, December 2008. [Google Scholar]
- Donovan, S.; Genter, J.; Petrenas, B.; Mumby, N.; Hazledine, T.; Litman, T.; Hewison, G.; Guidera, T.; O’Reilly, L.; Green, A.; Leyland, G. Managing Transport Challenges When Oil Prices Rise; Technical Report for New Zealand Transport Agency: Wellington, New Zealand, August 2008. [Google Scholar]
- Beroldo, S. Casual Carpooling 1998 Update (January, 1999). Report of a 1998 Survey of Casual Carpooling; Technical Report for Bay Area Commuters, Inc.: San Francisco, CA, USA, January 1999. [Google Scholar]
- 511 Rideshare. Casual Carpool Survey Summary 2010—Final. Report of A 2010 Survey of Casual Carpooling; 511 Rideshare: Oakland, CA, USA, 2010. [Google Scholar]
- VDOT. Dynamic Ridesharing (Slugging) Data; Technical Report for Virginia Department of Transport: Chantilly, VA, USA, June 2006. [Google Scholar]
- Barth, M.; Boriboonsomsin, K. Real-World CO2 Impacts of Traffic Congestion. TRB 2008 Annual Meeting CD-ROM. In Proceedings of the 87th Annual Meeting of the Transportation Research Board, Washington, DC, USA, 13–15 January 2008.
- Schrank, D.; Lomax, T. 2009 Urban Mobility Report. Available online: http://mobility.tamu.edu (accessed on January 13, 2011).
- Pearce, J. Unpublished analysis of Bay Area HOV Lanes based on District 4, Year 2004 Annual HOV Lane Report. Personal communication, 10 June 2005. [Google Scholar]
- Caltrans. Year 2004 Annual HOV Lane Report; Technical Report for California Department of Transport: San Francisco, CA, USA, March 2004. [Google Scholar]
- San Francisco Chronicle. Consider congestion pricing for BART. San Francisco Chronicle, 15 September 2008; Page B-10. [Google Scholar]
- Strickland, J. Energy Efficiency of Different Modes of Transportation. Available online: http://www.strickland.ca/efficiency.html (accessed on January12, 2011).
- Knox-White, J. Casual Carpooling and the Environment. Available online: www.flexiblecarpooling.org/casual_carpooling_and_the_environment.pdf (accessed on January 12, 2011).
© 2011 by the authors; licensee MDPI, Basel, Switzerland. This article is an open access article distributed under the terms and conditions of the Creative Commons Attribution license (http://creativecommons.org/licenses/by/3.0/).
Share and Cite
MDPI and ACS Style
Minett, P.; Pearce, J. Estimating the Energy Consumption Impact of Casual Carpooling. Energies 2011, 4, 126-139. https://doi.org/10.3390/en4010126
AMA Style
Minett P, Pearce J. Estimating the Energy Consumption Impact of Casual Carpooling. Energies. 2011; 4(1):126-139. https://doi.org/10.3390/en4010126
Chicago/Turabian StyleMinett, Paul, and John Pearce. 2011. "Estimating the Energy Consumption Impact of Casual Carpooling" Energies 4, no. 1: 126-139. https://doi.org/10.3390/en4010126