Rapid Gas Hydrate Formation Processes: Will They Work?

1
National Energy Technology Laboratory (NETL), U.S. Department of Energy (DOE), 626 Cochrans Mill Road, PO Box 10940, Pittsburgh, PA 15236-0940, USA
2
Oak Ridge Institute for Science and Education (ORISE), Department of Energy (DOE), 626 Cochrans Mill Road, PO Box 10940, Pittsburgh, PA 15236-0940, USA
*
Author to whom correspondence should be addressed.
Energies 2010, 3(6), 1154-1175; https://doi.org/10.3390/en3061154
Submission received: 8 April 2010
/
Revised: 20 May 2010
/
Accepted: 2 June 2010
/
Published: 7 June 2010
(This article belongs to the Special Issue Natural Gas Hydrate)
Abstract
:Researchers at DOE’s National Energy Technology Laboratory (NETL) have been investigating the formation of synthetic gas hydrates, with an emphasis on rapid and continuous hydrate formation techniques. The investigations focused on unconventional methods to reduce dissolution, induction, nucleation and crystallization times associated with natural and synthetic hydrates studies conducted in the laboratory. Numerous experiments were conducted with various high-pressure cells equipped with instrumentation to study rapid and continuous hydrate formation. The cells ranged in size from 100 mL for screening studies to proof-of-concept studies with NETL’s 15-Liter Hydrate Cell. Results from this work demonstrate that the rapid and continuous formation of methane hydrate is possible at predetermined temperatures and pressures within the stability zone of a Methane Hydrate Stability Curve (see Figure 1).
1. Introduction and NETL Development of Rapid Gas Hydrate Formation Concepts
Natural gas hydrates (NGHs) or methane gas hydrates (MGHs) have the potential to serve as an energy source for the World over the next several hundred years. While these hydrates occur naturally at ocean depths, in sediments, and in permafrost regions, the natural gas they contain is not easily recovered. In addition, the gas contained is considered as stranded gas reserves regarding storage, transportation and utilization. Nearly 50 percent of worldwide natural gas reserves of ~6,254 trillion ft3 (tcf) are considered as stranded gas reserves, with 36 percent or ~86 tcf of the U.S natural gas reserves totaling ~238 tcf, as stranded gas [1,2]. In addition, the U.S. Geological Survey has also estimated that almost 1,700 tcf of previously undiscovered natural gas resources exist within the Arctic Circle [3].
While there will be a future need for these energy sources, there may be a requirement for improved synthetic hydrate formation processes which can provide new and economic storage, transportation and processing capabilities. Building new pipelines and/or railway systems are expensive and labor intensive. In addition, compressed natural gas [(CNG) at 20.67 to 24.82 MPa (3000 to 3600 psia)], and liquefied natural gas [(LNG) requiring cryogenic temperatures at less than 112 K (–161 °C)] also require large capital investment and elaborate safety systems. A rapid and continuous gas hydrate formation technique could potentially compete with current means to store and transport these energy reserves in a more economically effective manner, but again, these new formations techniques are in need of development.
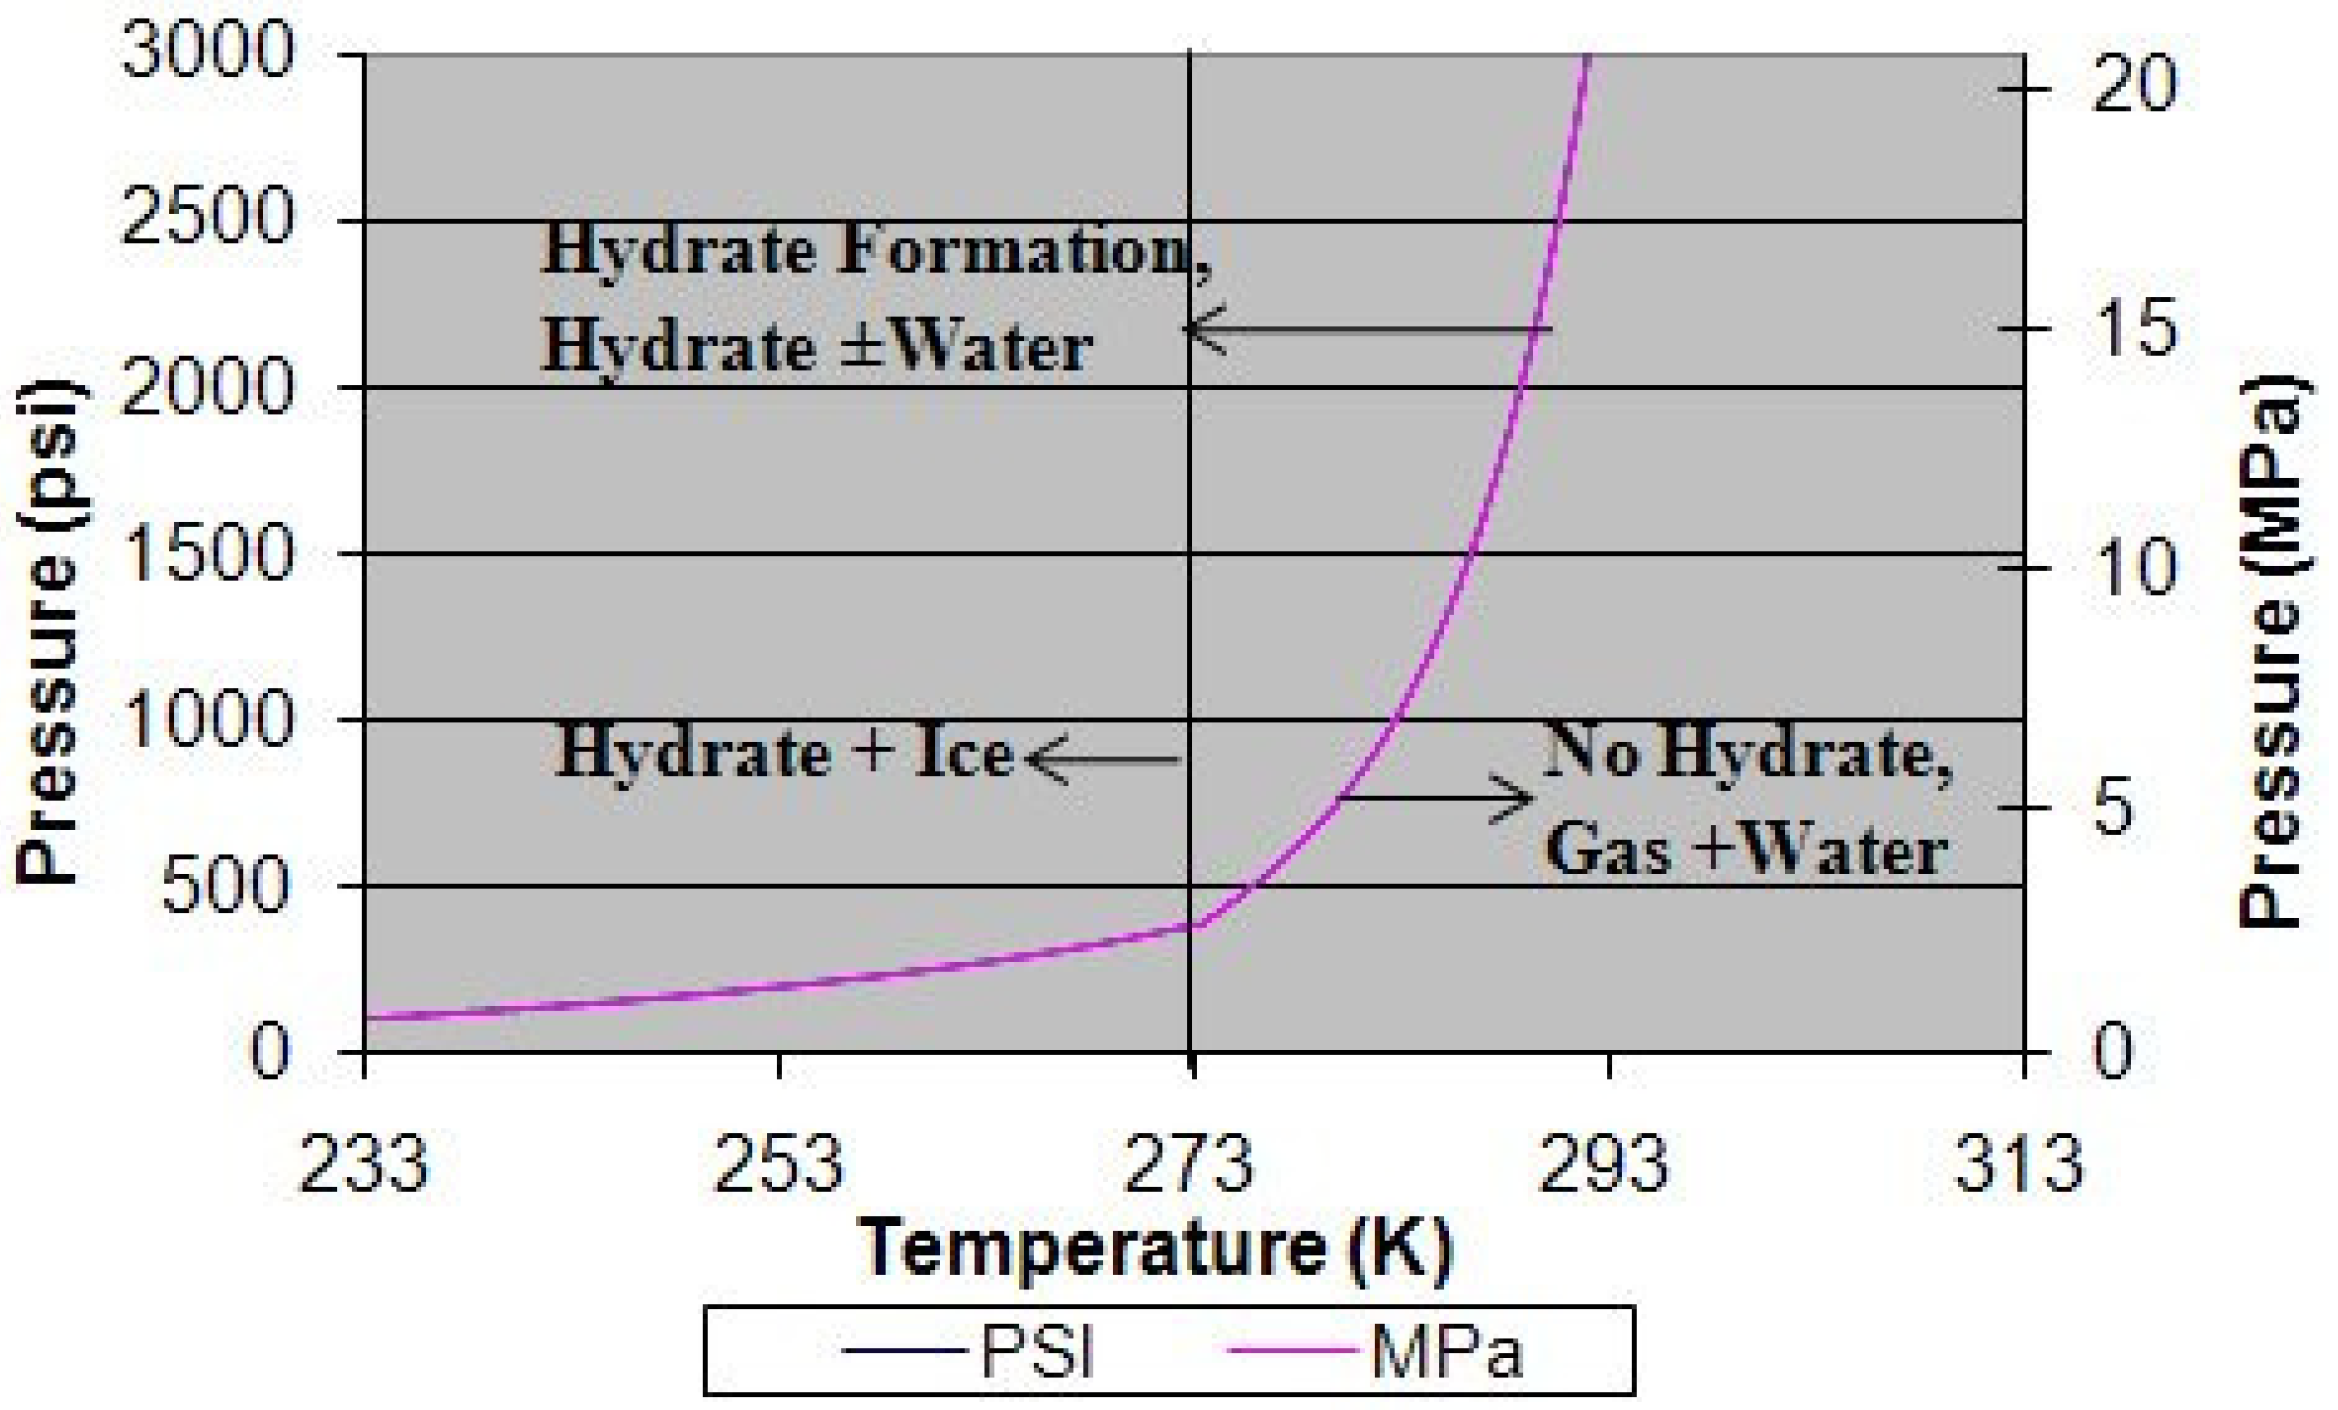
Before investigating rapid and continuous gas hydrate formation mechanisms/techniques an understanding of the typical formation mechanisms is required. Methane gas hydrate (MGH) deposits are formed in locations where methane gas meets water at temperatures and pressures that are favorable for hydrate formation. These conditions are most often found in ocean sediments and in arctic permafrost. Most of the past and current non-resource research has mainly focused on investigating the formation and dissociation mechanisms associated with various GHs [4,5]. These investigations led to an understanding of the kinetics of formation and dissociation, with the kinetic mechanisms being extremely slow. Shown in Figure 1 is a typical Pressure-Temperature (P-T) Methane Hydrate Formation Diagram or Methane Hydrate Stability Curve utilized to set conditions for hydrate formation and dissociation kinetic experiments [6].
Figure 1.
Typical Pressure-Temperature (P-T) methane hydrate formation diagram or methane hydrate stability curve [6].
Figure 1.
Typical Pressure-Temperature (P-T) methane hydrate formation diagram or methane hydrate stability curve [6].

Previous and current NETL hydrate experiments utilized pressures >4.14 MPa (>600 psia) at temperatures >273 to 280 K (>0 to ≤7 °C). Operating above the freezing of water allows one to prevent ice during hydrate formation. This stability curve can be shifted depending on the quality of gas and water, and in specific cases to the left when additives such as methanol are utilized to avoid hydrate formation in oil/gas production lines [7]. The formation of hydrate typically takes anywhere from 6-hours to days and weeks within a laboratory setting. The model in Figure 2 shows moles of gas consumed over time during a typical (6-hour) hydrate formation experiment [8].
An examination of the model data [8] and various NETL-generated experimental data [9] processed in this study (both shown in Figure 2) reveal three basic insights about the hydrate formation process.
The hydrate formation process occurs in a three-step sequence:
- Transport of gas from the gas phase to the aqueous liquid phase (Dissolution taking ~1 hour).
- Diffusion of gas from the aqueous phase and through the liquid film to the hydrate-liquid interface (Induction Time taking ~4 hours).
- Reaction of gas with the aqueous phase (Nucleation and Crystallization or Growth Time taking ~1 hour) to form hydrate at the interface (total period of ~6 hour).
In order to form hydrate, there is a critical radius of the hydrate nuclei that must form during the induction time. This requires a radius of hydrate nuclei to be greater than the critical radius to enable both a stable nuclei and continued growth of the hydrate. Any nuclei with radius smaller than this critical radius will re-dissolve in the liquid medium.
The rate of phase transformation is directly related to the three-phase equilibrium pressure. Deviations from the three-phase equilibrium will generate conditions necessary for formation with the reaction taking place.
Figure 2.
Non-equilibrium kinetic theoretical model approach to hydrate formation comparing model to laboratory data [8].
Figure 2.
Non-equilibrium kinetic theoretical model approach to hydrate formation comparing model to laboratory data [8].
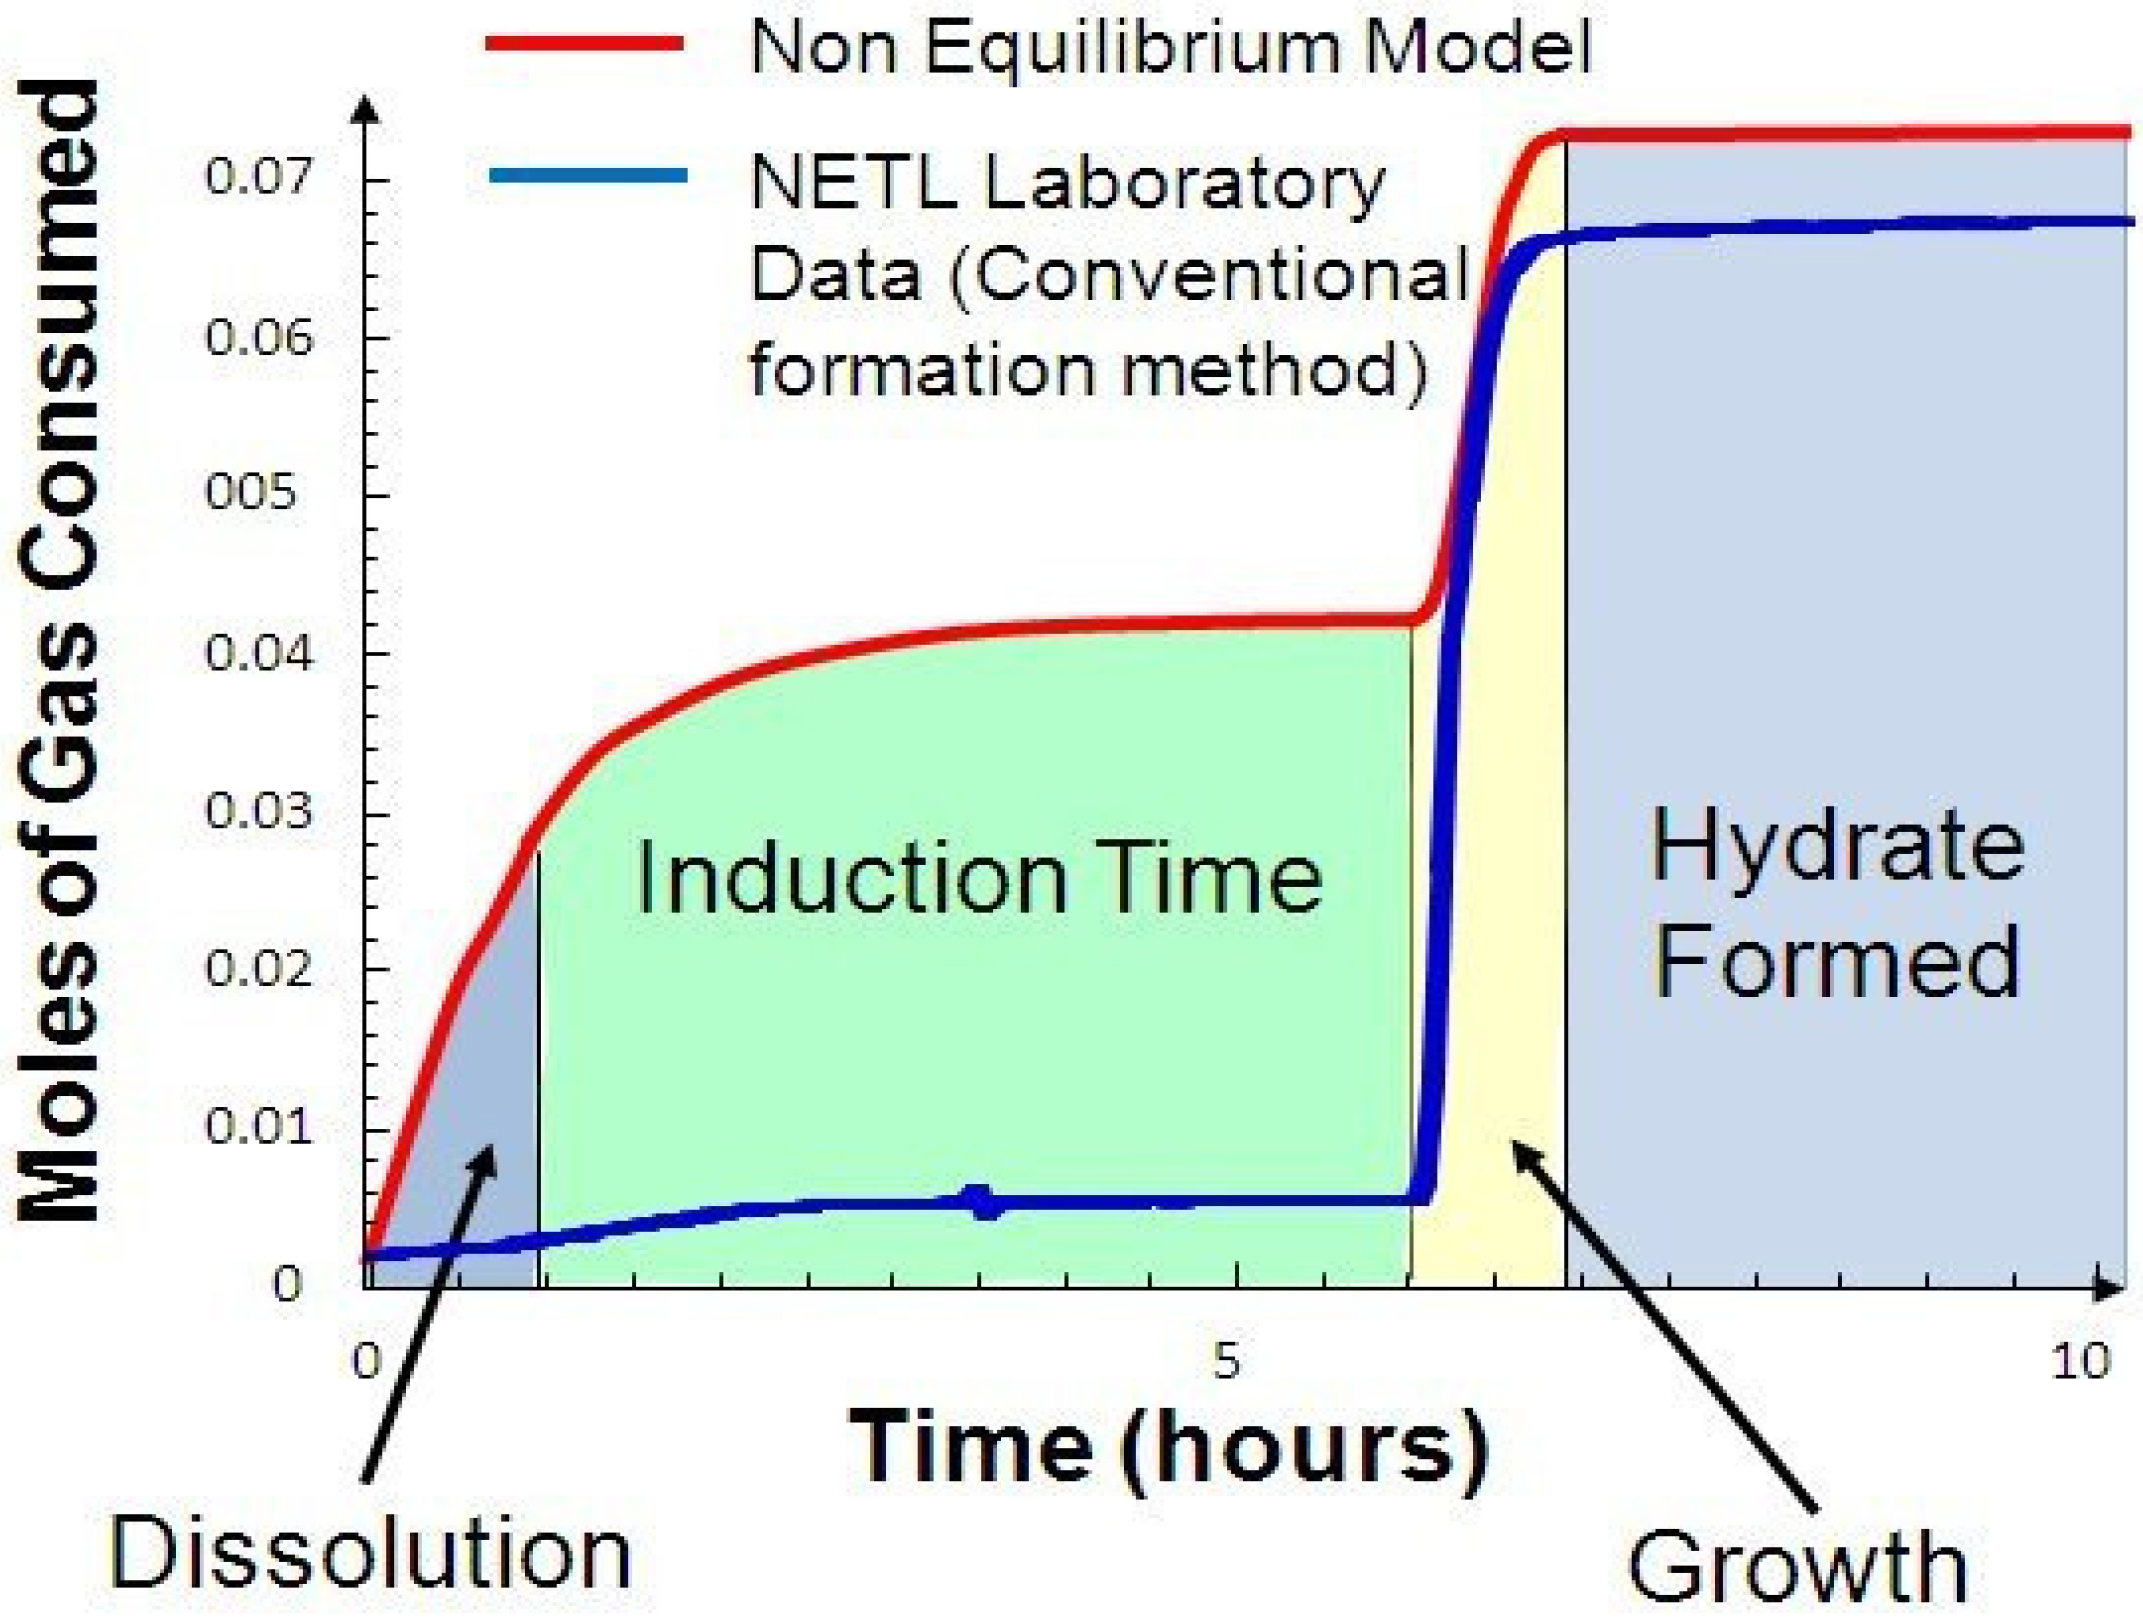
NETL experimental data, as shown in Figure 2, differs from the non equilibrium model owing mainly to the model utilizing an infinite surface area for water with increased dissolution of gas in water and increasing through the Induction Time. While there is an increase in dissolution for the model, the NETL experimental data and model results for gas uptake during Growth and Formation Times are almost identical. Increasing the surface area of the water in contact with the hydrate gas is a critical factor for a rapid gas hydrate formation process (RGHFP).
In order to develop a rapid gas hydrate formation process for stranded gas and hydrate reserves, the nominal ≥6-hour formation time needed during batch hydrate formation processes (BHFP) must be reduced to a few seconds or less. This requires reducing all of the following:
- The one-hour Dissolution Time associated with the low solubility of methane in water near/at hydrate formation temperatures and pressures (≥0.0005 to 0.001 mole(s) of methane in water at 1 to ~3 MPa (145 to 425 psia) [10];
- The 4-hour Induction Time; and
- The one-hour Growth (nucleation and crystallization) Time which is the most problematic to solve.
This is not all inclusive to consider for the development of a rapid gas hydrate formation process. Other thermodynamic and kinetic processes associated with hydrate formation must also be considered.
In a batch process, heat release during super-cooling of the water and dissipation of this heat prior to formation contribute to the extended times observed in forming hydrate. During any rapid and continuous process, the heat released during super-cooling must be continuously removed in order to facilitate an increase in hydrate formation rate. Therefore, heat transfer is another critical parameter for a successful rapid gas hydrate formation process. In addition, and as seen in Figure 2 for the above model results, a rapid process would require a much larger surface area of the water with a faster dissolution rate or an increase in solubility of methane in water. Song [11], Feneyrou [12], and Besnard [13] indicated a significant increase in the solubility of methane, carbon dioxide, etc., (gases commonly contained in natural gas reservoirs) in water at a temperature slightly above the hydrate formation temperature and just prior to hydrate formation. Servio [14] found that methane solubility increased in pure water just prior to hydrate formation, while methane solubility decreased when hydrate was present.
Referring to Figure 2, one can observe from both sets of data, that the highest uptake of methane in water is again, prior to hydrate formation. A rapid process must consider and try to promote this phenomenon which could be problematic owing to factors impacting the absolute temperature at a given pressure just prior to hydrate formation [4,5].
Maximizing methane uptake to levels greater than 90 percent of the theoretical value in synthetic hydrate is another major aspect of concern for both a batch and any rapid formation process. It is important to maximize and substantially increase the rate of formation for an individual gas while coinciding with its overall or increased uptake within synthetic hydrate. In addition, it is important to maximize the stability of synthetic hydrates while minimizing excess water. These and other thermodynamic and kinetic aspects could render it problematic for a rapid and continuous hydrate process.
Considering previous hydrate formation efforts, fundamental hydrate formation concepts related to rapid hydrate formation, potential aspects to promote rapid hydrate formation and detailed designs of an experimental plan and setup of the facilities experiments were conducted.
2. NETL Rapid Gas Hydrate Formation Process (RGHFP) Experiments
As previously stated, the following are important aspects that must be considered and realized for a useful Rapid Gas Hydrate Formation Process or RGHFP:
- Increasing formation rates to within a few seconds or even instantaneously, while virtually eliminating the long dissolution, induction, and growth times (Figure 2);
- Maximize gas uptake ≥85 to 95%, while minimizing un-reacted water (reduced hydrate mass);
- Separating and packing hydrate particles for storage and eventual transport.
Recent research reported at NETL focused on the first two (2) aspects. Aspect 3 will commence once these aspects are nearly optimized, as well as any storage, transportation, and overall process capabilities compared to current practices.
To increase the formation rate, there are several parameters that needed addressed. First, is the requirement to increase the surface area of the water while increasing the solubility of the gas in the water or allow for smaller droplets while increasing their intimate contact with hydrate forming gases.
Table 1 illustrates the increase of surface area and droplet count per unit volume as the diameter of liquid (e.g., water) droplets deceases, while assuming spherical droplets (droplet sizes in micrometers (μm)–1000 μm = 1 mm.) [15]. The use of nozzles for combustion (e.g., fuel oils, coal-water/coal-oil-slurries, etc.), gasification (e.g., coal-water-slurries), spray drying, gas cooling (close-to-approach), etc., have been utilized to increase surface area of the liquid media. This increase allows for improved combustion/gasification conditions utilizing slurries, drying cooling requirements, and chemical reactions within closed or open vessels.
Nozzles whether being single- or twin-fluid in design utilize the interaction of gas resistance and surface tension to break the liquid into droplets holding them together at their respective velocities. Depending on the spray environment of the gas resistance, this can overcome the surface tension of larger droplets while being able to form droplets of smaller diameters. As shown in Table 1, by cutting the droplet size in half of a given volume of liquid, eight times as many droplets will be formed while doubling the total surface area [15].

Table 1.
Relationships of volume and surface area for various droplet diameters [15].1
| DropletDiameter, µm | Surface Area of One Droplet, mm2 | Volume of One Droplet, mm3 | Total Droplet Count per Liter | Total SurfaceArea per liter, m2 |
|---|---|---|---|---|
| 2,000 | 12.6 | 4.19 | 239,000 | 3 |
| 1,000 | 3.14 | 0.524 | 1,910,000 | 6 |
| 500 | 0.785 | 0.0655 | 15,300,000 | 12 |
| 250 | 0.196 | 0.00819 | 122,000,000 | 24 |
| 125 | 0.0491 | 0.00102 | 977,000,000 | 48 |
| 60 | 0.0113 | 0.000113 | 8,840,000,000 | 100 |
| 30 | 0.00283 | 0.0000141 | 70,700,000,000 | 200 |
| 15 | 0.000707 | 0.00000177 | 565,000,000,000 | 400 |
Industry provides a variety of nozzle designs for specific applications. Table 2 indicates relative efficiency of various nozzles deigns as spray patterns with corresponding droplet sizes for a given flow rate and pressure [15]. In contrast, Table 3 provides information of a nozzle design utilizing a cluster of one type of nozzle with corresponding droplet sizes as the flow rate and pressures are varied [15]. Atomizing with air (twin-fluid nozzle design) versus the ‘other’ single-fluid nozzles, provide relative lower droplet sizes at the same flow rate and pressure. Therefore, one would expect a reduction in droplet size of water when atomizing with a gas (e.g., air, methane, etc.) at higher flow rates (both atomizing gas and water) and higher pressures. Of course, the internal design of the twin-fluid nozzle, as well as the size of the orifice plays an important role in the resulting decreased droplet size, but the maximum operating pressure and flow decreases with decreasing orifice size.
Table 2.
Relative efficiency of various nozzle designs/spraying 20 L/min at 3 bar [15].
| Spray Pattern | Droplet Size (d32), µm |
|---|---|
| Full Cone | 550 |
| Flat Fan | 470 |
| Hollow Cone | 420 |
| Cluster (7 orifices) | 240 |
| Air Atomizer | 120 |
Table 3.
Pressure vs. droplet size in a standard 7-orifice cluster nozzle [15].
| Pressure, bar | Droplet Size, µm (d32) | Flow, L/min |
|---|---|---|
| 1 | 398 | 20 |
| 2 | 264 | 28 |
| 6 | 191 | 49 |
| 10 | 172 | 63 |
The previously mentioned aspects of nozzle design for increased atomization to provide the required intimate contact or mixing of water and a hydrate forming gas were the basis of this study’s investigations. Prior to any designs, machining/fabrication, testing, or optimization of nozzles for rapid gas hydrate formation, testing at a smaller scale was prudent. This was done to determine, if any appropriate ranges of possible temperature and pressure conditions were conducive for rapid hydrate formation, while being within the formation curve and being above 273 K (0 °C) previously shown in Figure 1. Operating above 273 K (0 °C) allows formation of hydrate or hydrate + water and not hydrate + ice.
Utilizing this information, an experimental test matrix (Table 4) was developed providing a narrow range of temperatures and pressures at conditions thought to be conducive of rapid hydrate formation.
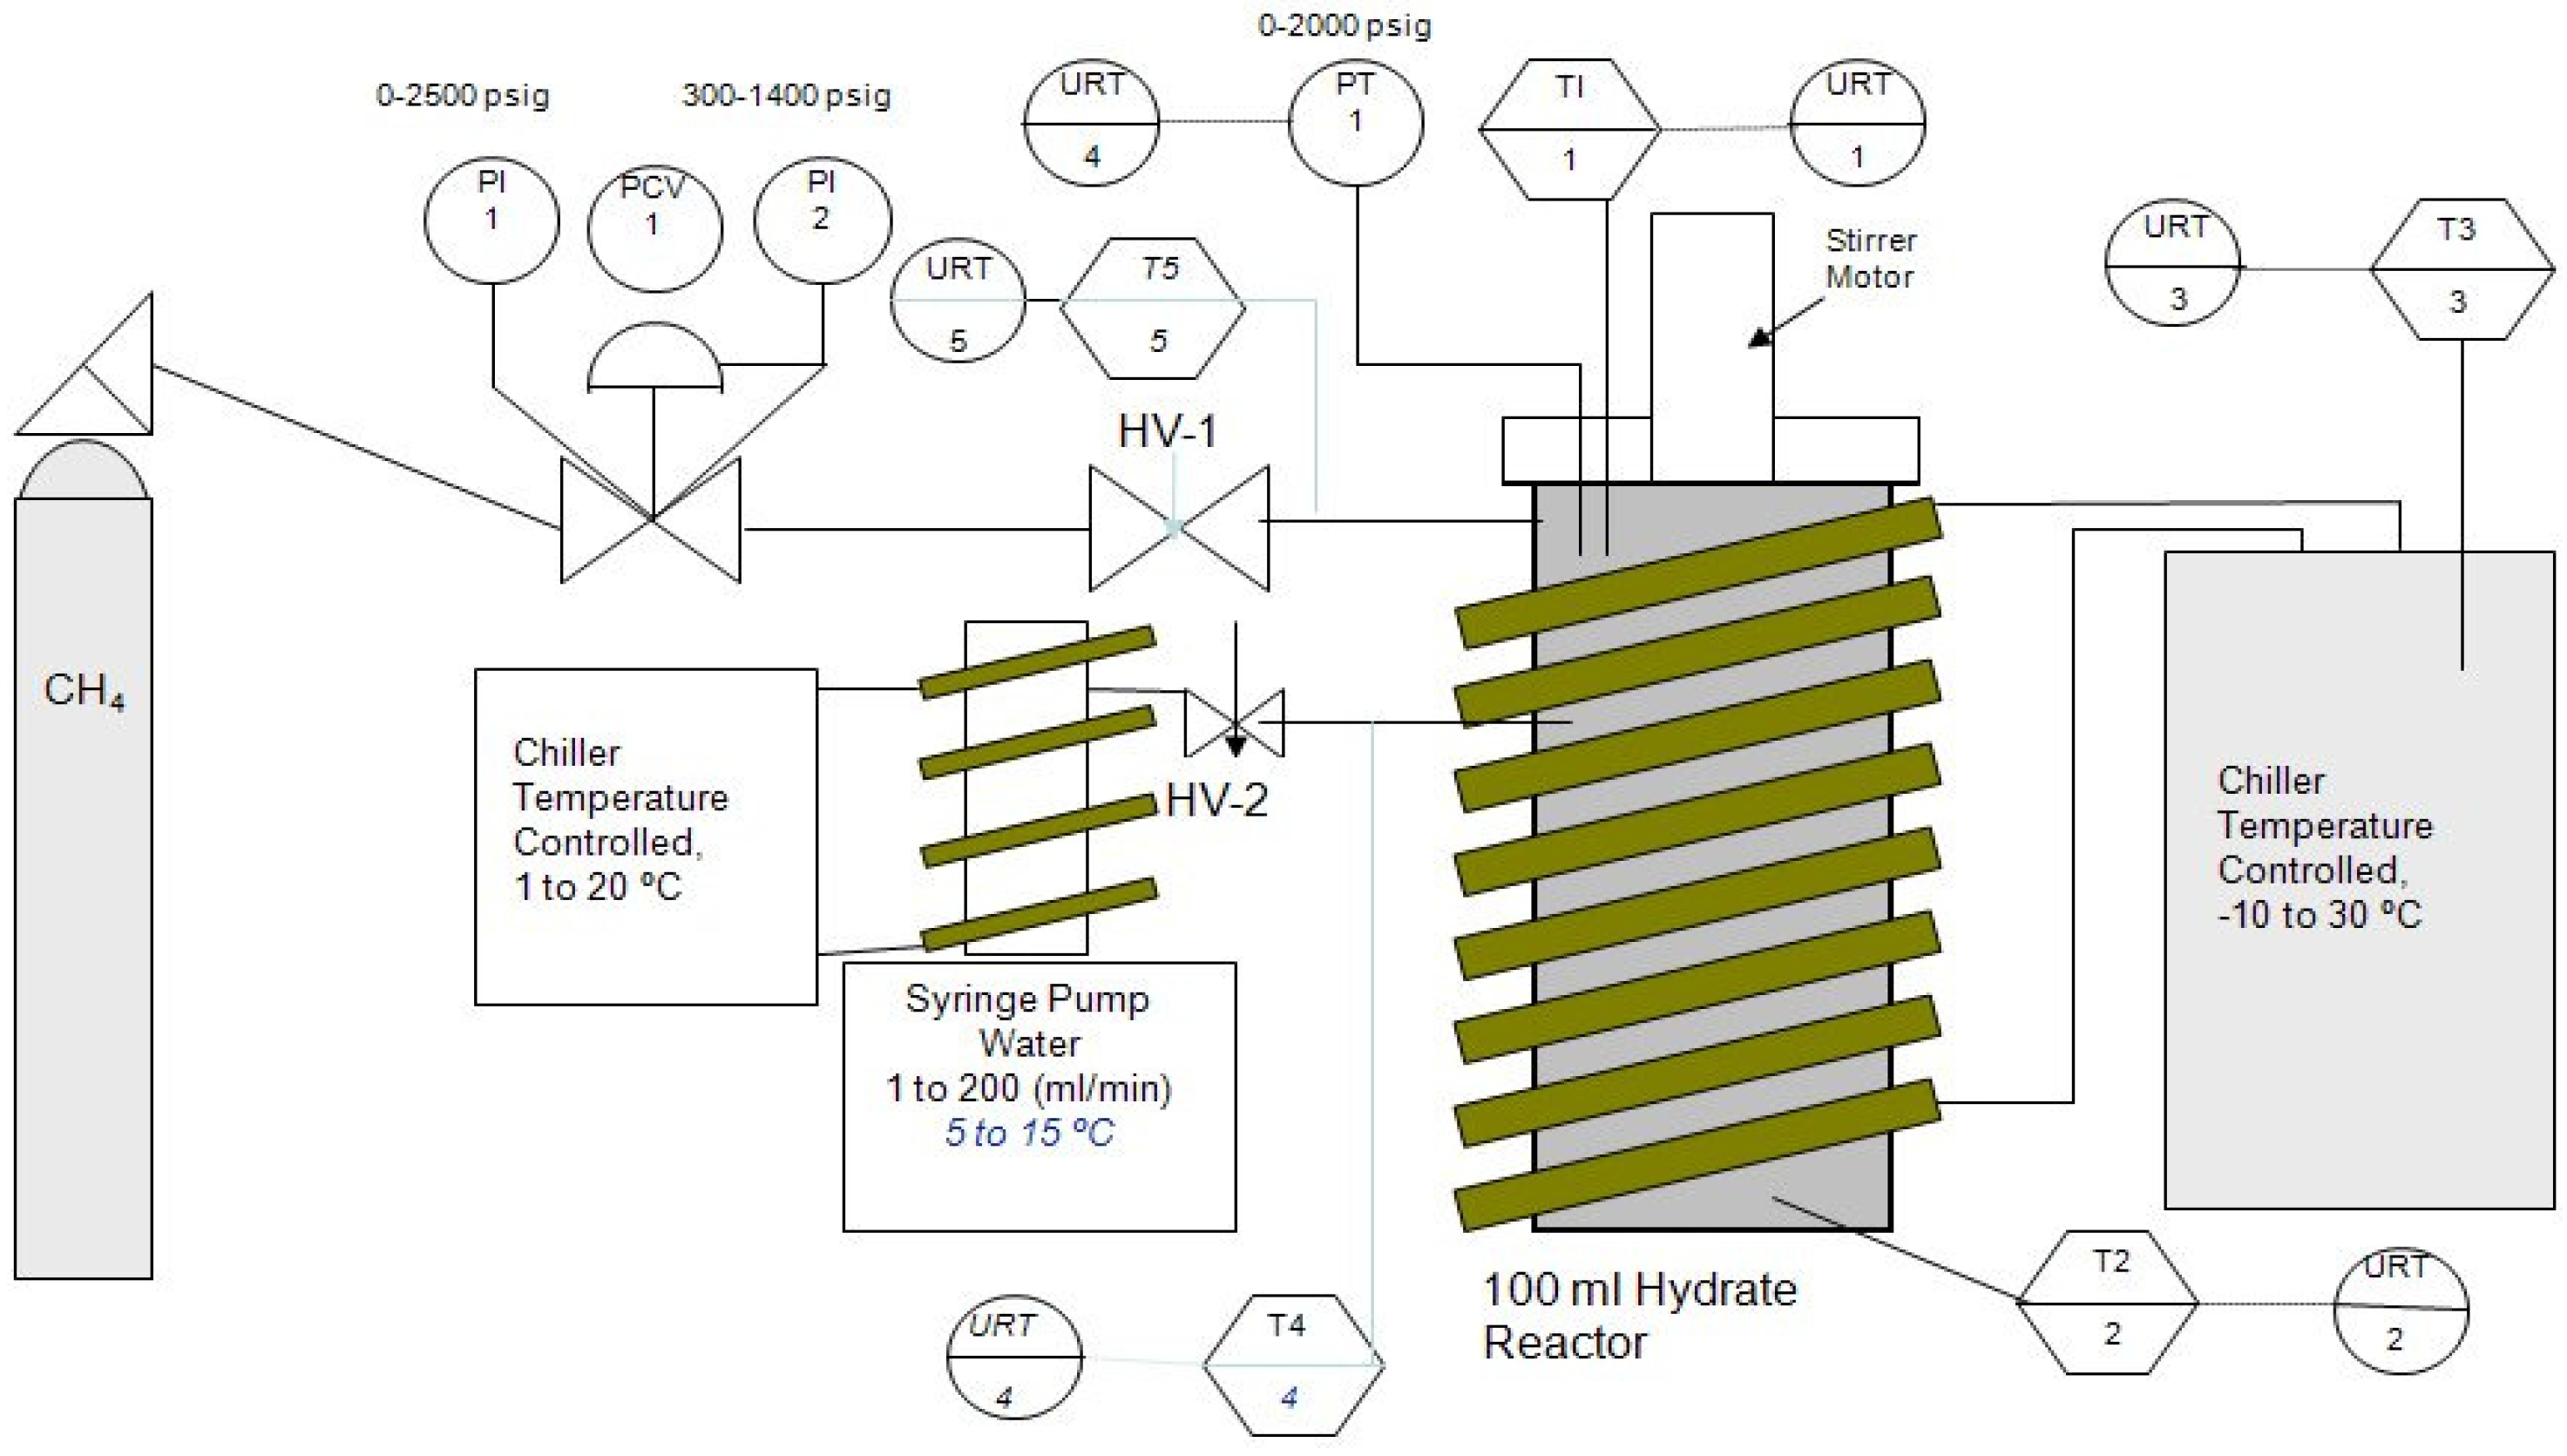
The initial rapid hydrate formation experiments were conducted within the NETL 100 mL Gas Hydrate Unit. Figure 3 shows a drawing of the unit utilized for these experiments. The cell comprises of a Thar Technologies Inc., nominal 100 mL (actual 111 mL accounting for ports, tubing, etc., to all external valves) pressure cell or stirred reactor with a control consol (stirrer, temperature and pressure measurements, output to computer, etc.), certified for 41.4 MPa at 423 K (6000 psia at 150 °C). The cell has four (4) ports (gas/water inlets, additional thermocouple insertions, outlets for gas sample collection, etc.), and separate ports for a pressure transducer, and another thermocouple.
The cell also has two (2) 6.35 mm (¼") Sapphire view ports (90 degrees apart) utilized for a color video camera and a light source, respectively. One Lauda Recirculating Chiller was utilized to control cell temperatures through insulated cooling coils wrapped around the cell. Another Lauda Recirculating Chiller provides temperature control within an ISCO Syringe Pump and associated feed line(s) (tube-to-tube heat exchanger) of water (distilled and Pittsburgh Tap) to be injected into the cell. Water feed rate was set via the pump’s control unit.
Methane was delivered through a Matheson Tri-Gas regulator up to 20.7 MPa (up to 3000 psia) connected to a 1A Ultra-High Purity Methane Cylinder. Temperatures were measured by thermocouples with all monitoring device outputs being connected to a computer for data acquisition/collection and reduction efforts.
Once the unit was assembled, experiments were conducted to develop methane hydrate formation and dissociation data comparing to those data previously reported by others [4,5]. After confirmation with their results (not reported in this manuscript), experiments were conducted at the conditions indicated in Table 4 to determine if this would allow for rapid hydrate formation.
| Gas | Water | |||
|---|---|---|---|---|
| Temperature K/°C | Pressure MPa/psia | Temperature K/°C | Pressure1 MPa/psia | Flow Rate2 (mL/min) |
| 278/5 | 9.66/1400 | Ambient | >9.66/>1400 | 30 |
| 278/5 | 9.66/1400 | 281.5/8.5 | >9.90/>1400 | 30 |
| 278/5 | 6.90/1000 | 278.2/5.2 | >6.90/>1000 | 30 |
| 275/2 | 9.66/1400 | 281.5/8.5 | >9.66/>1400 | 30 |
| 275/2 | 6.90/1000 | 281.2/5.2 | >6.90/>1000 | 30 |
| 273.5/0.5 | 9.66/1400 | 281.5/8.5 | >9.66/>1400 | 30 |
| 273.5/0.5 | 6.90/1000 | 281.5/5.2 | >6.90/>1000 | 30 |
1Water pressure was adjusted automatically owing to the ISCO Syringe Pump being set in the “Constant Flow” Mode2–the pump would flow water at the preset point2 at a nominal pressure1 to account for any pressure drop within the feed lines, across the needle valve during injection in the cell
Figure 3.
Drawing of NETL 100 mL gas hydrate unit utilized for the initial rapid gas hydrate formation experiments.
Figure 3.
Drawing of NETL 100 mL gas hydrate unit utilized for the initial rapid gas hydrate formation experiments.

At each condition, methane was allowed to flow into the cell and allowed it to stabilize at a temperature and at a pressure (again, values in columns 1 and 2, Table 4), respectively. Water was then injected into the cell at temperatures and pressures (values in columns 3 and 4, Table 4), respectively. Water flow for all experiments was set at 0.5 mL/sec for one minute or at 30 mL/min (column 5, Table 4).
As water flowed into the cell, the methane pressure increased due to the compression of the gas in the head space. Within seconds after water injection, the cell temperature increased. This was due to heat being released from the super-cooling of the water prior to hydrate formation. As the hydrate was forming, there was a decrease in the rate of pressure rise as water continued to flow into the cell. This was a result of the volume of the gas being reduced in the head space owing to (1) it dissolving in the water, and (2) being consumed as hydrate was forming.
After the temperatures and pressures leveled off and all 30 mL of water were in the cell (end of Stage 1), the stirrer was turned on (2 min @ ~200 rpm) providing shear forces on both hydrate and excess water remaining in the cell. Shear forces allowed for continued disturbance in the surface tension of the water with increased mixing of methane producing more hydrate. This was confirmed by a corresponding increase in temperature, as well as a decrease in pressure within the cell. The temperature and pressure then leveled off (end of Stage 2).
The cell was held at temperature and pressure conditions indicated in Table 2 until there was maximum hydrate formed with minimal or no water remaining (end of Stage 3). At 95% of the theoretical level of methane uptake, the moles of methane would be 0.275 for 1.67 (nominal 30 g of water) moles of water used for each experiment. The ranges in percent methane consumed as hydrate from the head space during each of the three (3) stages of the experiments is are presented in Table 5.
Table 5.
Calculated range of methane consumed from cell head space during the three (3) formation stages and for all experiments.
| Stage | Time (seconds) | Percent (%) of the 0.275 Mole Methane Consumed |
|---|---|---|
| 1 | 10–60 | 40 to 60 |
| 2 | 120–130 | 60 to 80 |
| 3 | 130–(6 hours) | 80 to >90 |
In this dynamic system, it was assumed that limited dissolution of methane in water took place after hydrate was formed during Stage 1. Stirring created more breakup of the hydrate and provided better mixing of methane and water resulting in a rapid consumption of methane in water while further forming hydrate. As previously stated, there were counter actions taking place, (1) the rate of pressure increase (from water flowing into cell) versus, (2) a corresponding pressure decrease owing to the methane being consumed as hydrate. The calculated values in Table 5 were based on these aspects. Similar considerations were made for the calculated values for Stage 2, with a more straight forward approach being made for values after Stage 3. As the experiments continued, determining accurate of values of methane uptake is more problematic in a dynamic system versus a typical batch system.
For any novel concept being proposed to rapidly form hydrates, video conformation or video presence during data collection of temperature, pressure, volume reduction, heat release etc., is critical. As indicated above, conditions at initial hydrate formation through complete utilization of water and methane coinciding within individual frames of the video is again, critical to the interpretation and formulation of presentable data/results.
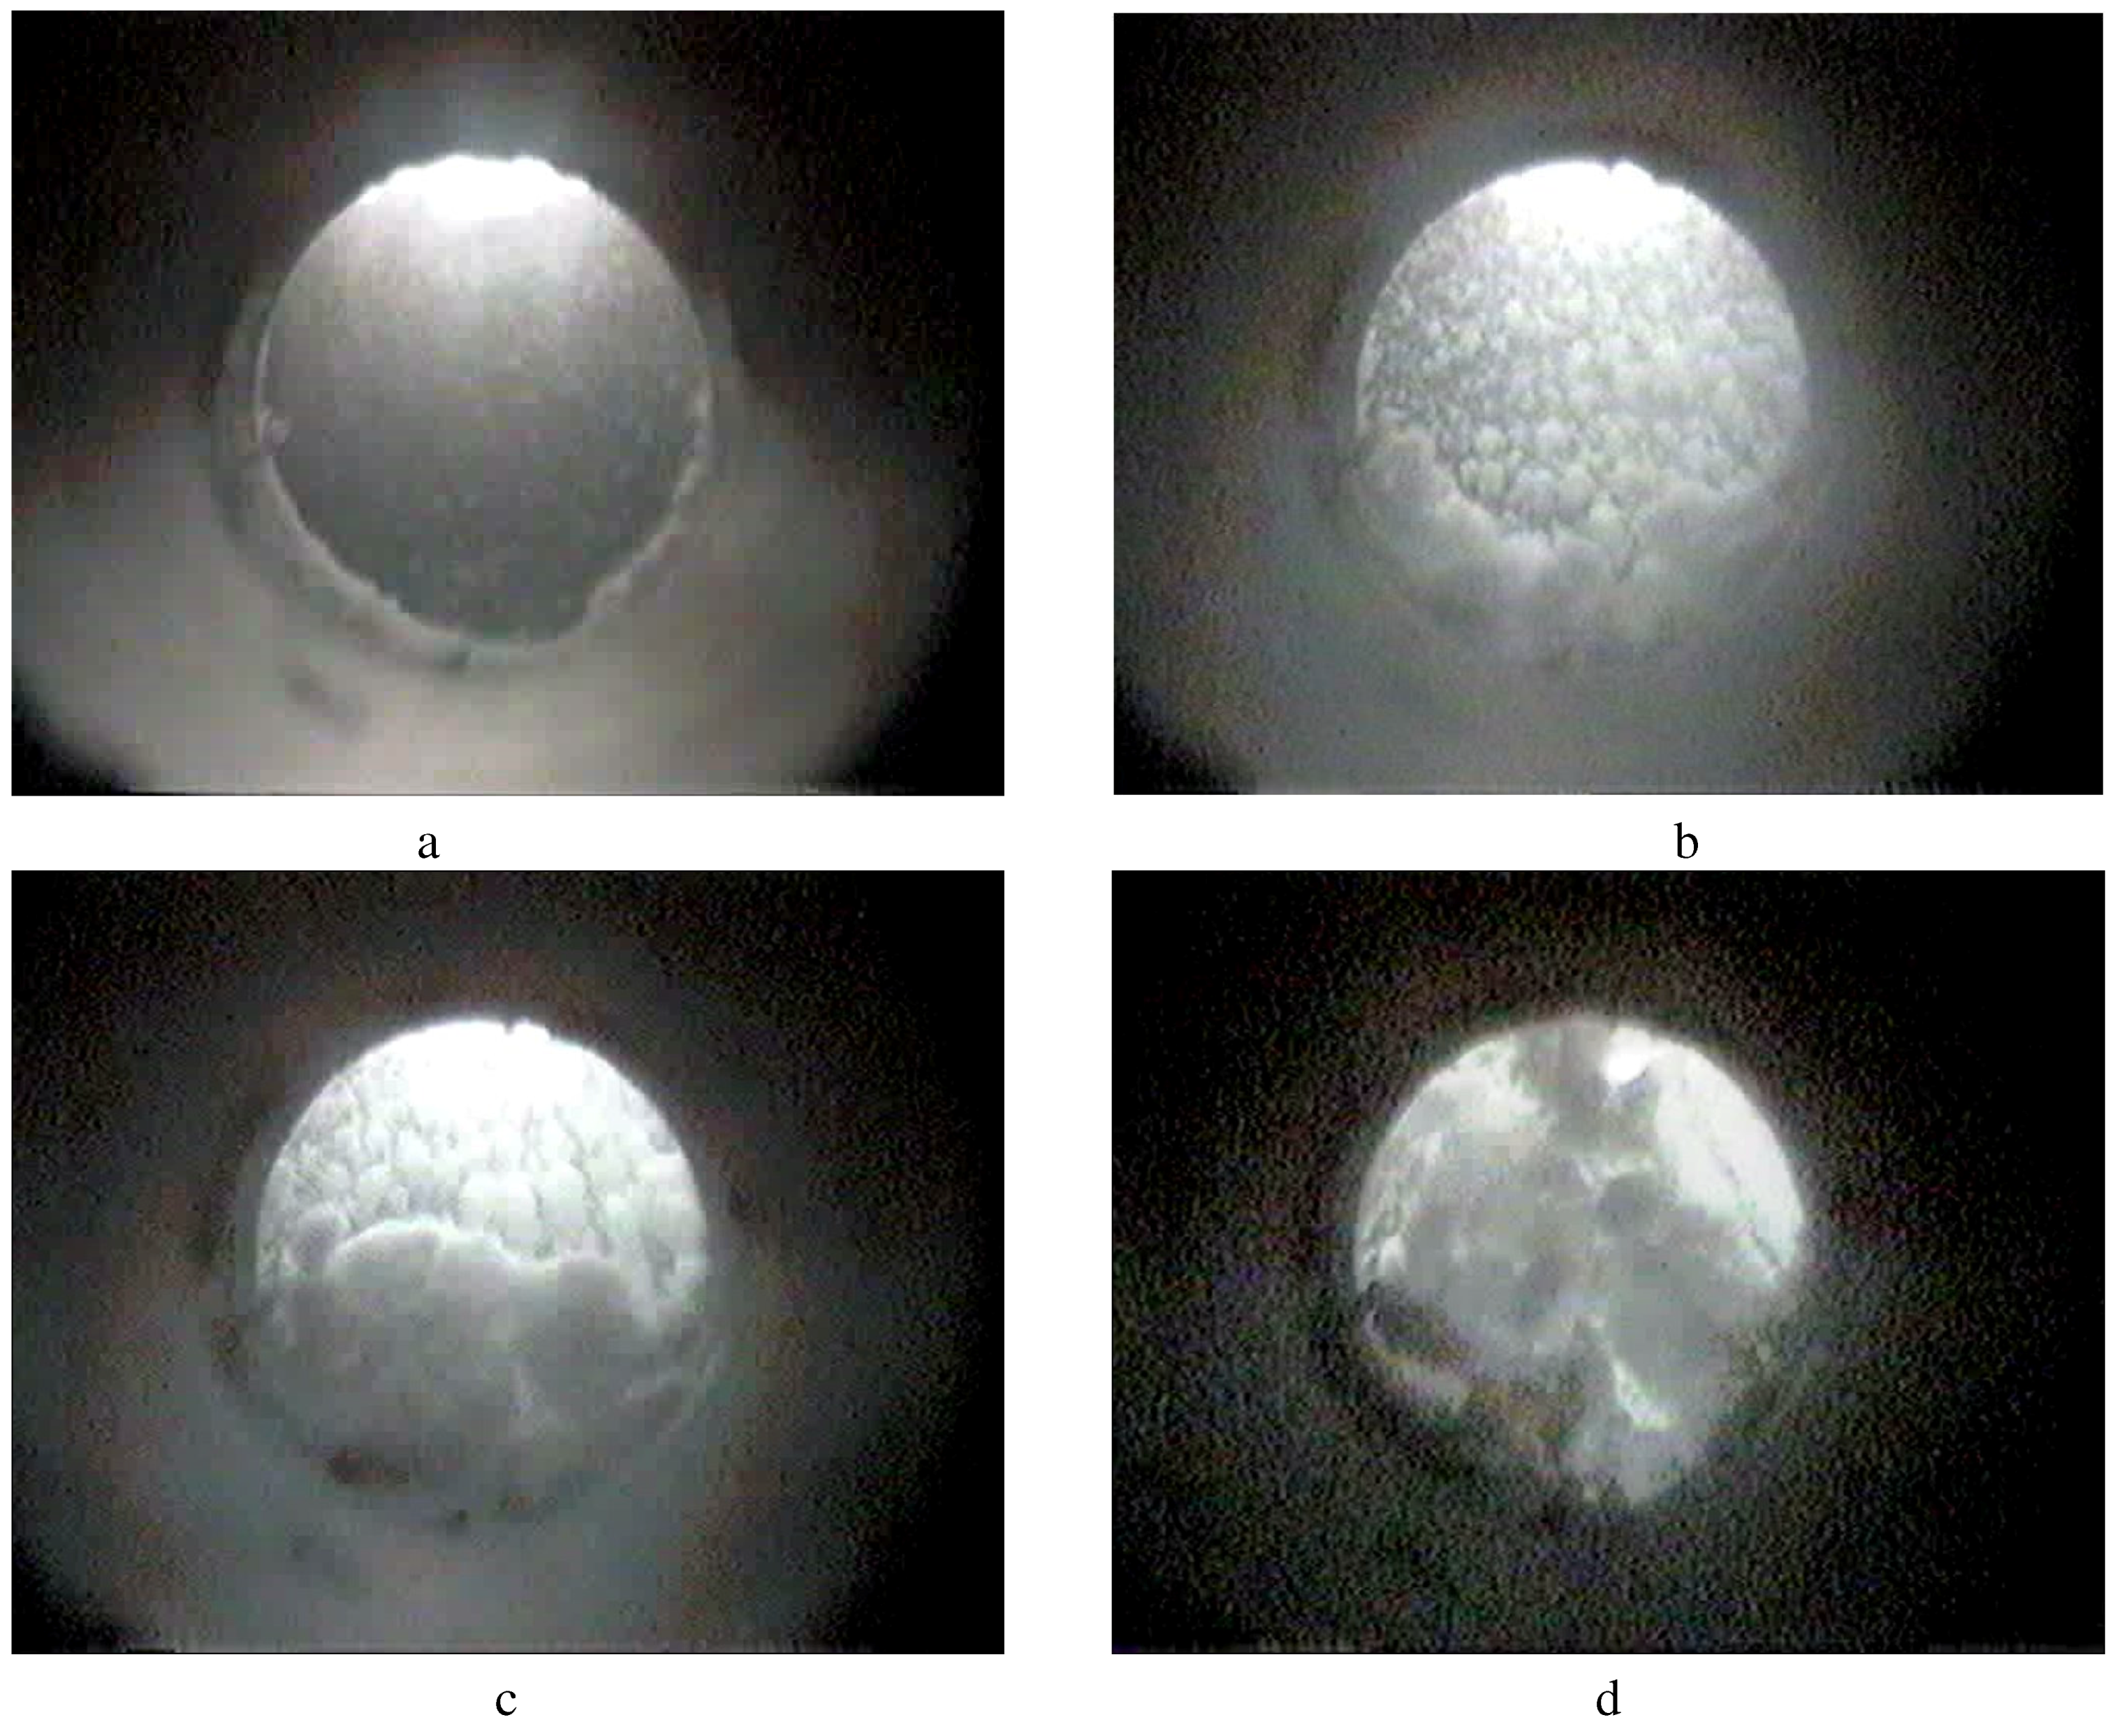
Figure 4a thru Figure 4d provide individual frames from a video of a typical rapid hydrate formation experiment. Figure 4a shows hydrate within the cell ~20 seconds after injection. The subsequent frames (Figure 4b thru Figure 4d) show hydrate formation during further water injection; Figure 4d is when all 30 mL of water was injected after 60 seconds. After water continued to flow into the cell (~60 second), the hydrate progressed up while covering the shaft and stirrer blades (center of cell) as shown in Figure 4a thru Figure 4c. These frames are somewhat darker than most of the frames in this manuscript since the stirrer blades and the formed hydrate blocked most of the light from the lit view port.
Figure 4.
(a) Hydrate ~20 sec after water injection; (b) hydrate ~30 sec after water injection; (c) hydrate ~40 sec after water injection; (d) hydrate ~60 sec after water injection.
Figure 4.
(a) Hydrate ~20 sec after water injection; (b) hydrate ~30 sec after water injection; (c) hydrate ~40 sec after water injection; (d) hydrate ~60 sec after water injection.
It should be noted that the small volume of the cell (cooled cell walls) and the cold stirrer within the flowing water of the cell provided enough surface area for a relatively good transfer of heat during super-cooling of the water prior to formation of hydrate. This will be address further in the manuscript.
At temperatures above 273 K (0.0 °C) along with pressures within the formation zone (Figure 1 and in Table 4, above), it was evident rapid methane hydrate formation was shown with individual video verification being recorded for each experiment. In addition, all data collected confirms hydrates were formed between 10 and 60 seconds during Stage 1 and 120 to 130 seconds during Stage 2 over the range of parameters investigated. The best or lowest rapid formation times were reflective of both lower methane and water pressures and temperatures as indicated in Table 4.
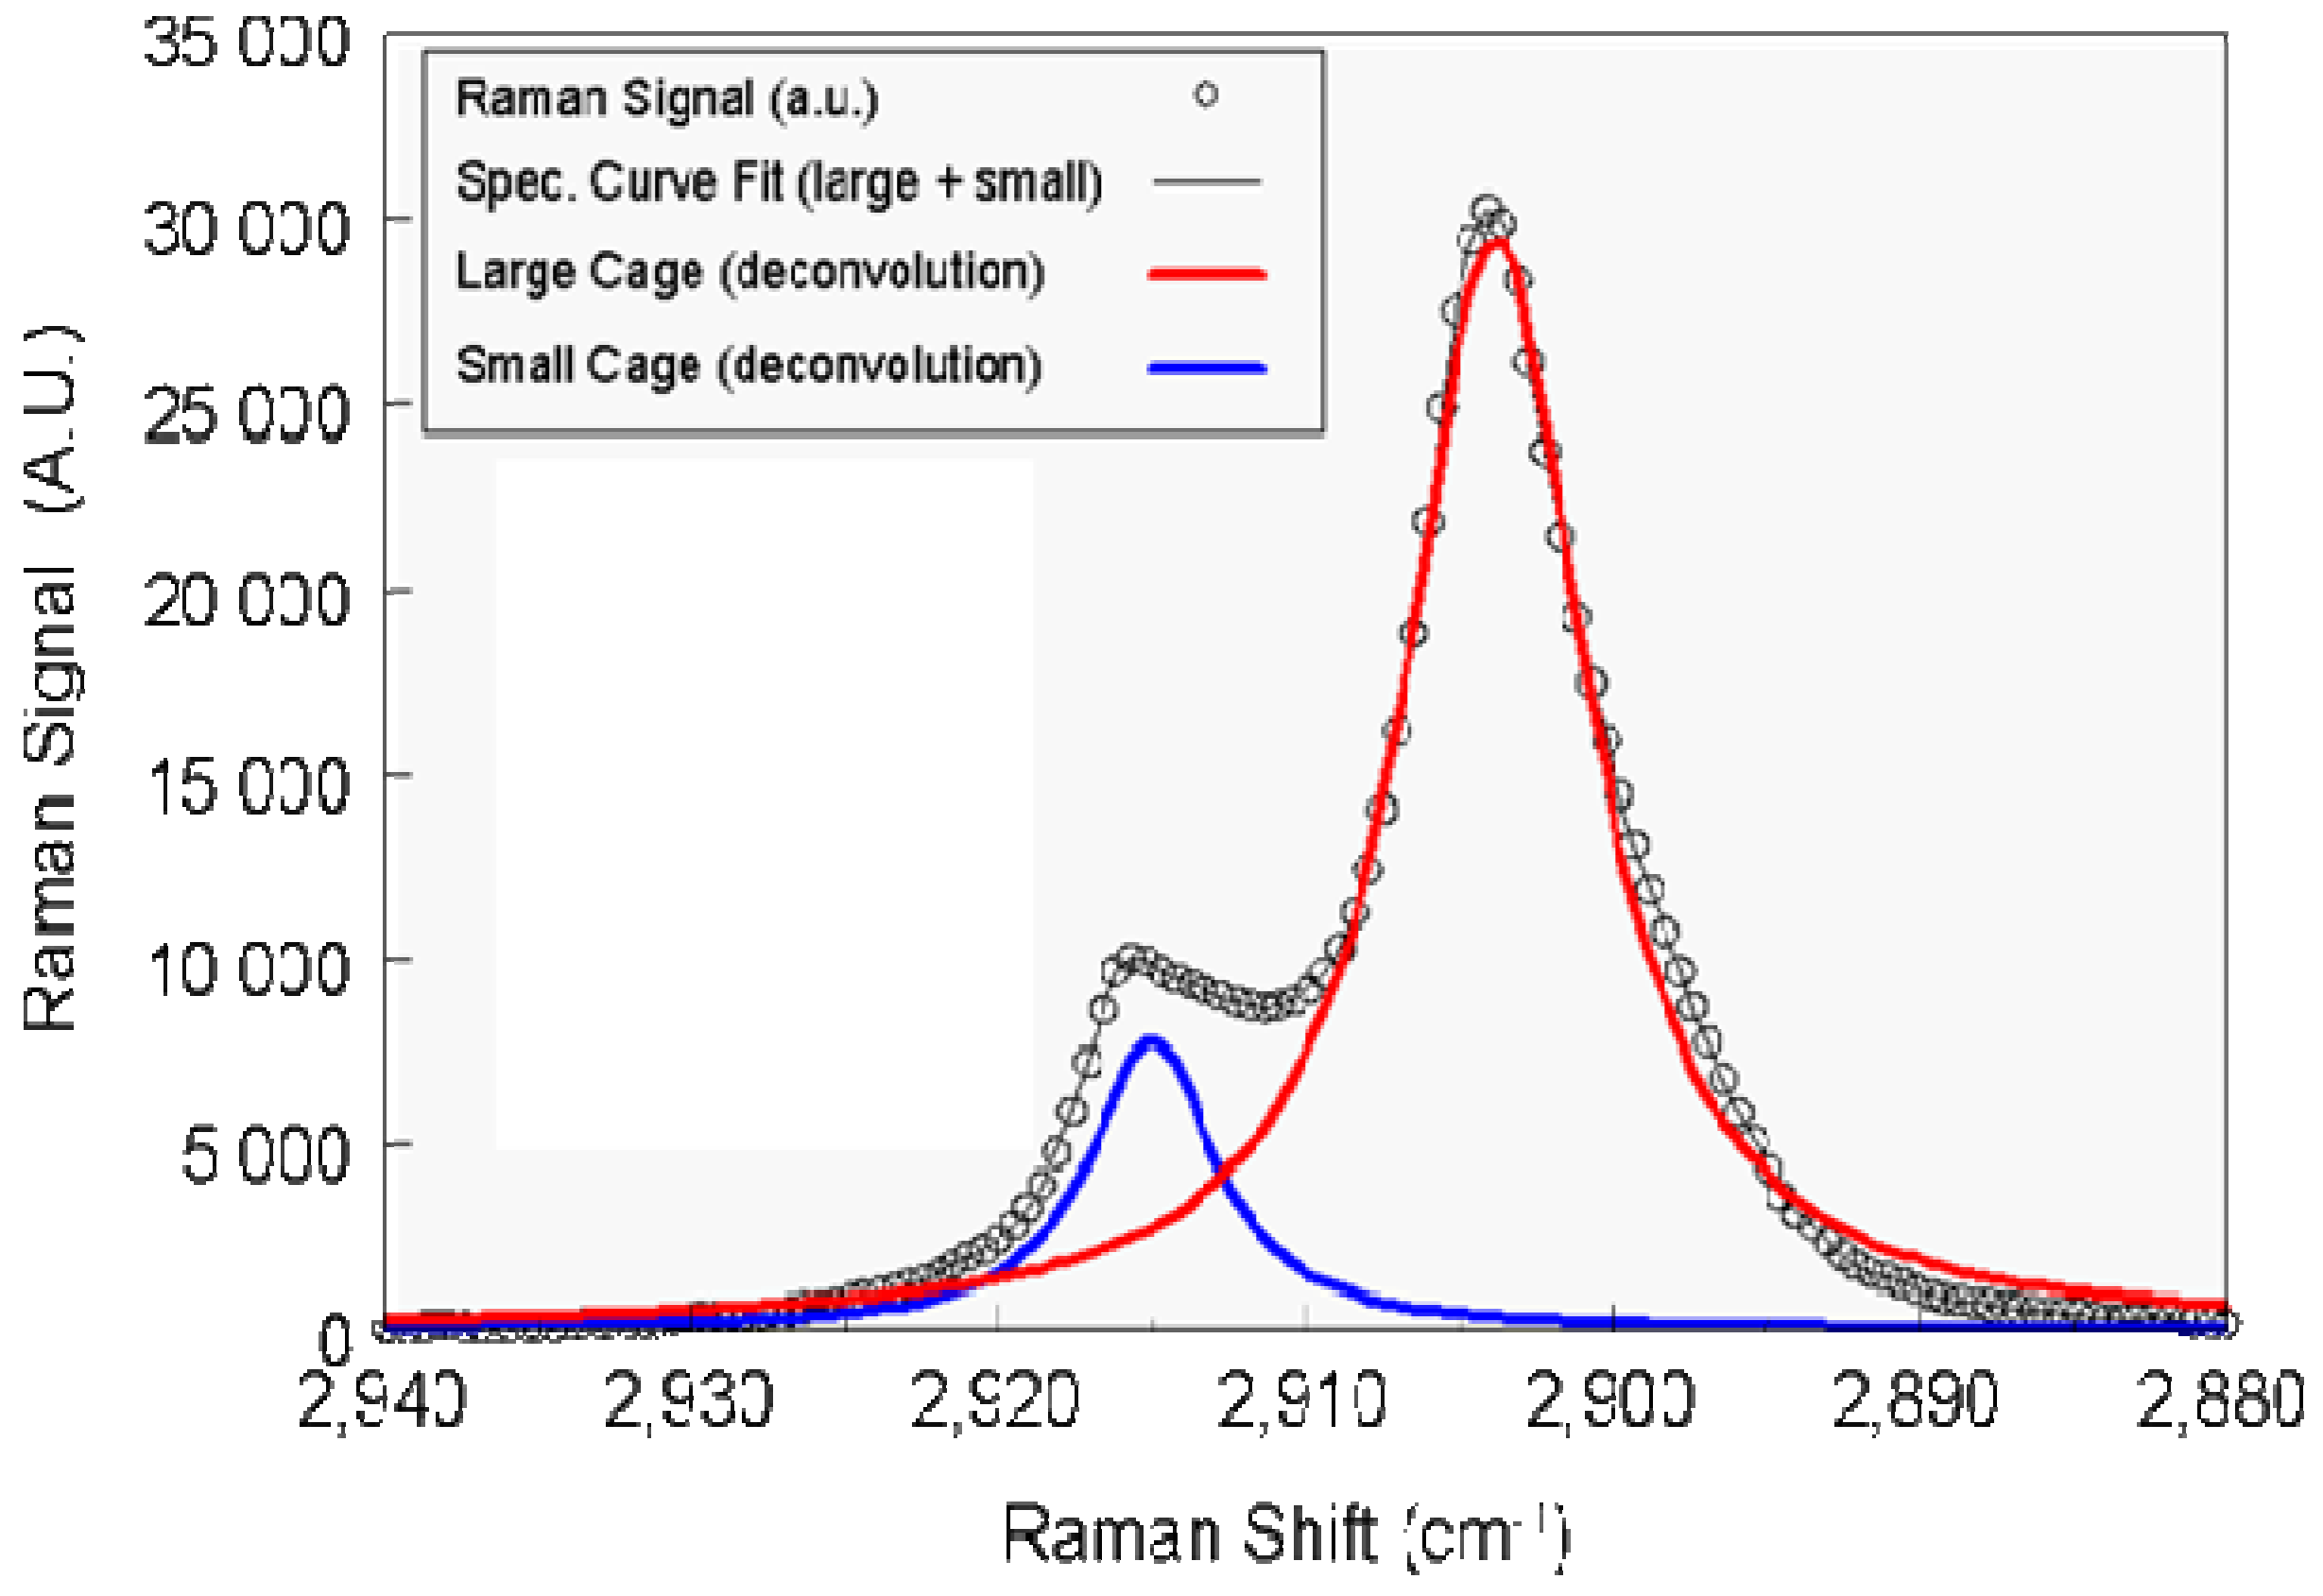
To prove methane hydrate was formed, Raman spectroscopy was conducted on numerous hydrate samples collected throughout these experiments. Figure 5 provides a typical Raman Spectra representative of the hydrate samples studied, further verifying structure I (sI) methane hydrate was formed.
Figure 5.
Typical Raman spectra representative of sI hydrate samples collected during NETL rapid hydrate formation experiments.
Figure 5.
Typical Raman spectra representative of sI hydrate samples collected during NETL rapid hydrate formation experiments.

New experiments were designed to acquire/collect information on the formation of hydrate on individual water droplets and methane bubbles at temperatures and pressures (Figure 1 and Table 4) conducive for hydrate formation. Video recording during these experiments proved to be invaluable as indicated below.
Figure 6a thru Figure 6c provide frames from a video showing the formation of methane hydrate on the surface of a nominal 3.0 mm diameter droplet of water suspended from a capillary tube in a methane environment at 6.90 MPa and 275 K (~1000 psia and ~2.0 °C). The hydrate formed from the stainless steel capillary tube and propagated down (gravity) to the bottom of the droplet within a second. In the following frames (Figure 7a and Figure 7b), it is important to note that upon further flow of water (via a high pressure hand pump) and exposed surface area, hydrate continued to form as a film covering the droplet surface. Owing to the size and weight of the droplet, it extended down to the water/hydrate film at the bottom of the cell creating a conduit for water to flow, as shown in Figure 7b.
Figure 8a through Figure 8c are frames from a video showing the formation of methane hydrate on the surface of a nominal 2.0 mm diameter methane bubble at the exit of a capillary tube submerged in water at 6.90 MPa and 275 K (~1000 psia and ~2.0 °C). A hydrate film formed within a few seconds from the top of the bubble and propagated down covering the exposed surface of the bubble. When methane continued to flow, the hydrate film expanded as the bubble surface expanded similar to the expansion of the water droplet, above.
Figure 6.
(a) Water droplet; (b) hydrate formed on ~2/3s of droplet; (c) full hydrate on droplet in ~1.0 sec.
Figure 6.
(a) Water droplet; (b) hydrate formed on ~2/3s of droplet; (c) full hydrate on droplet in ~1.0 sec.
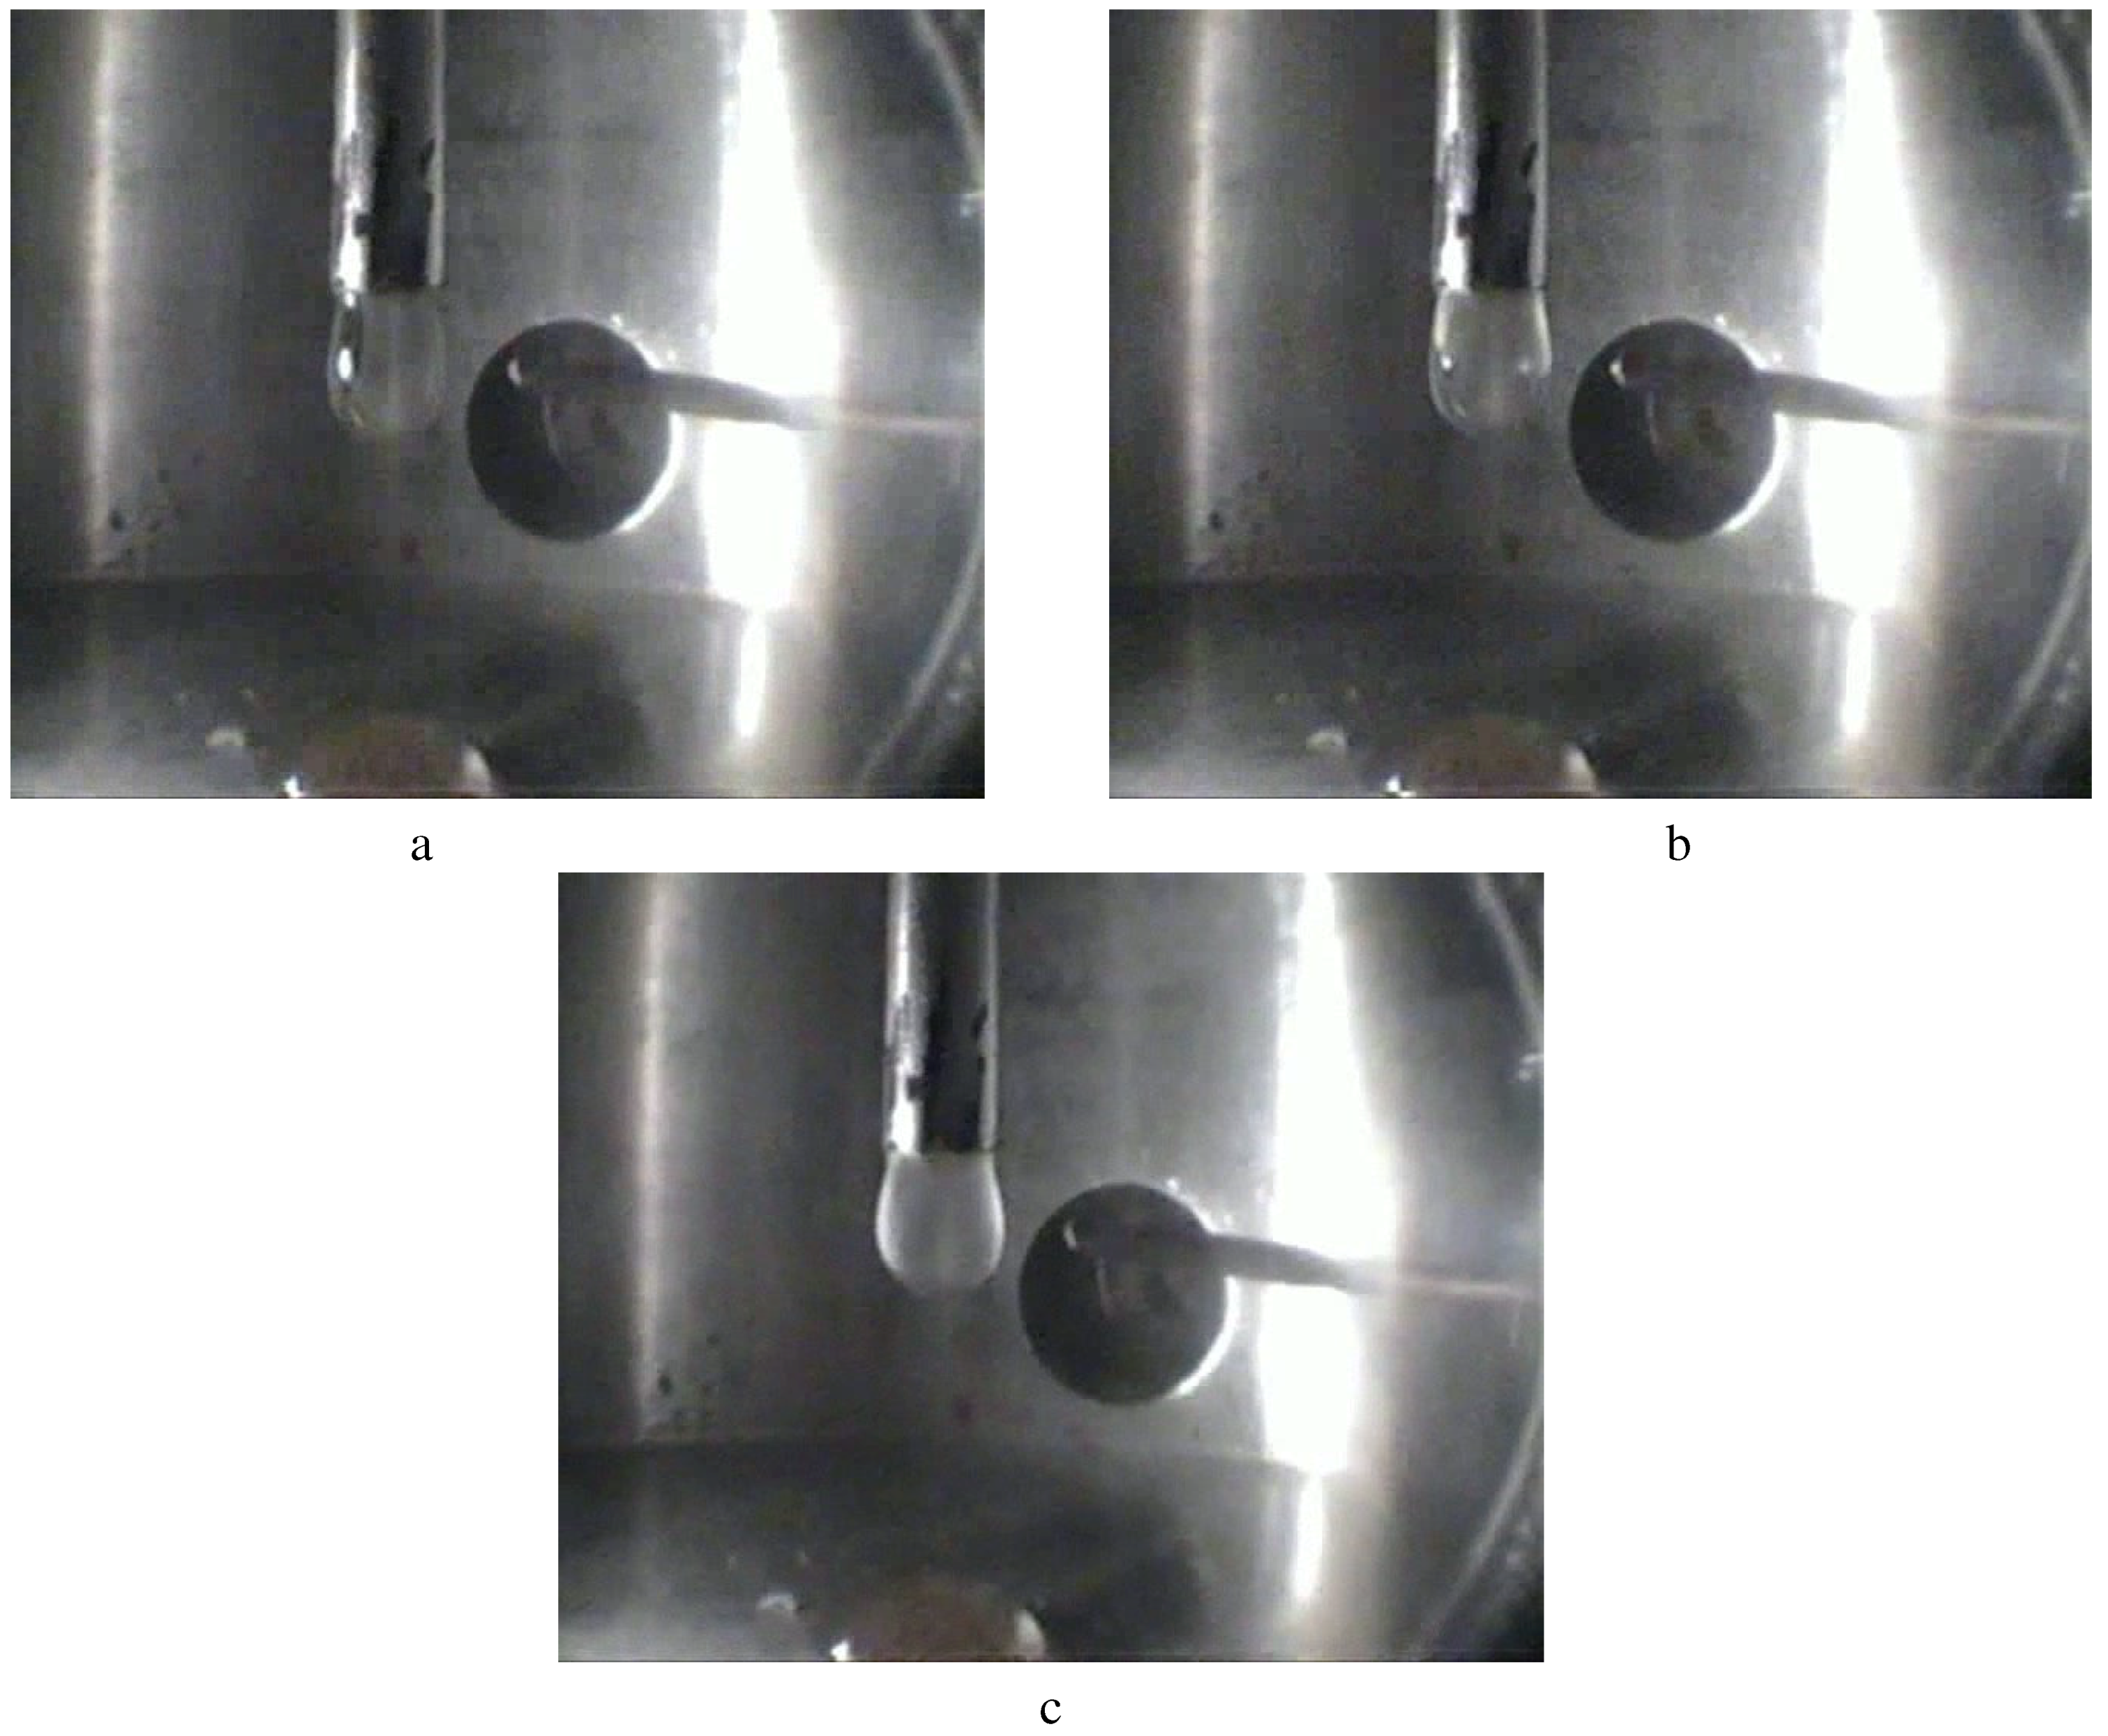
Figure 7.
(a) Hydrate rapidly forming as droplet expands; (b) a conduit made of hydrate allowing water flow to the bottom of the cell.
Figure 7.
(a) Hydrate rapidly forming as droplet expands; (b) a conduit made of hydrate allowing water flow to the bottom of the cell.
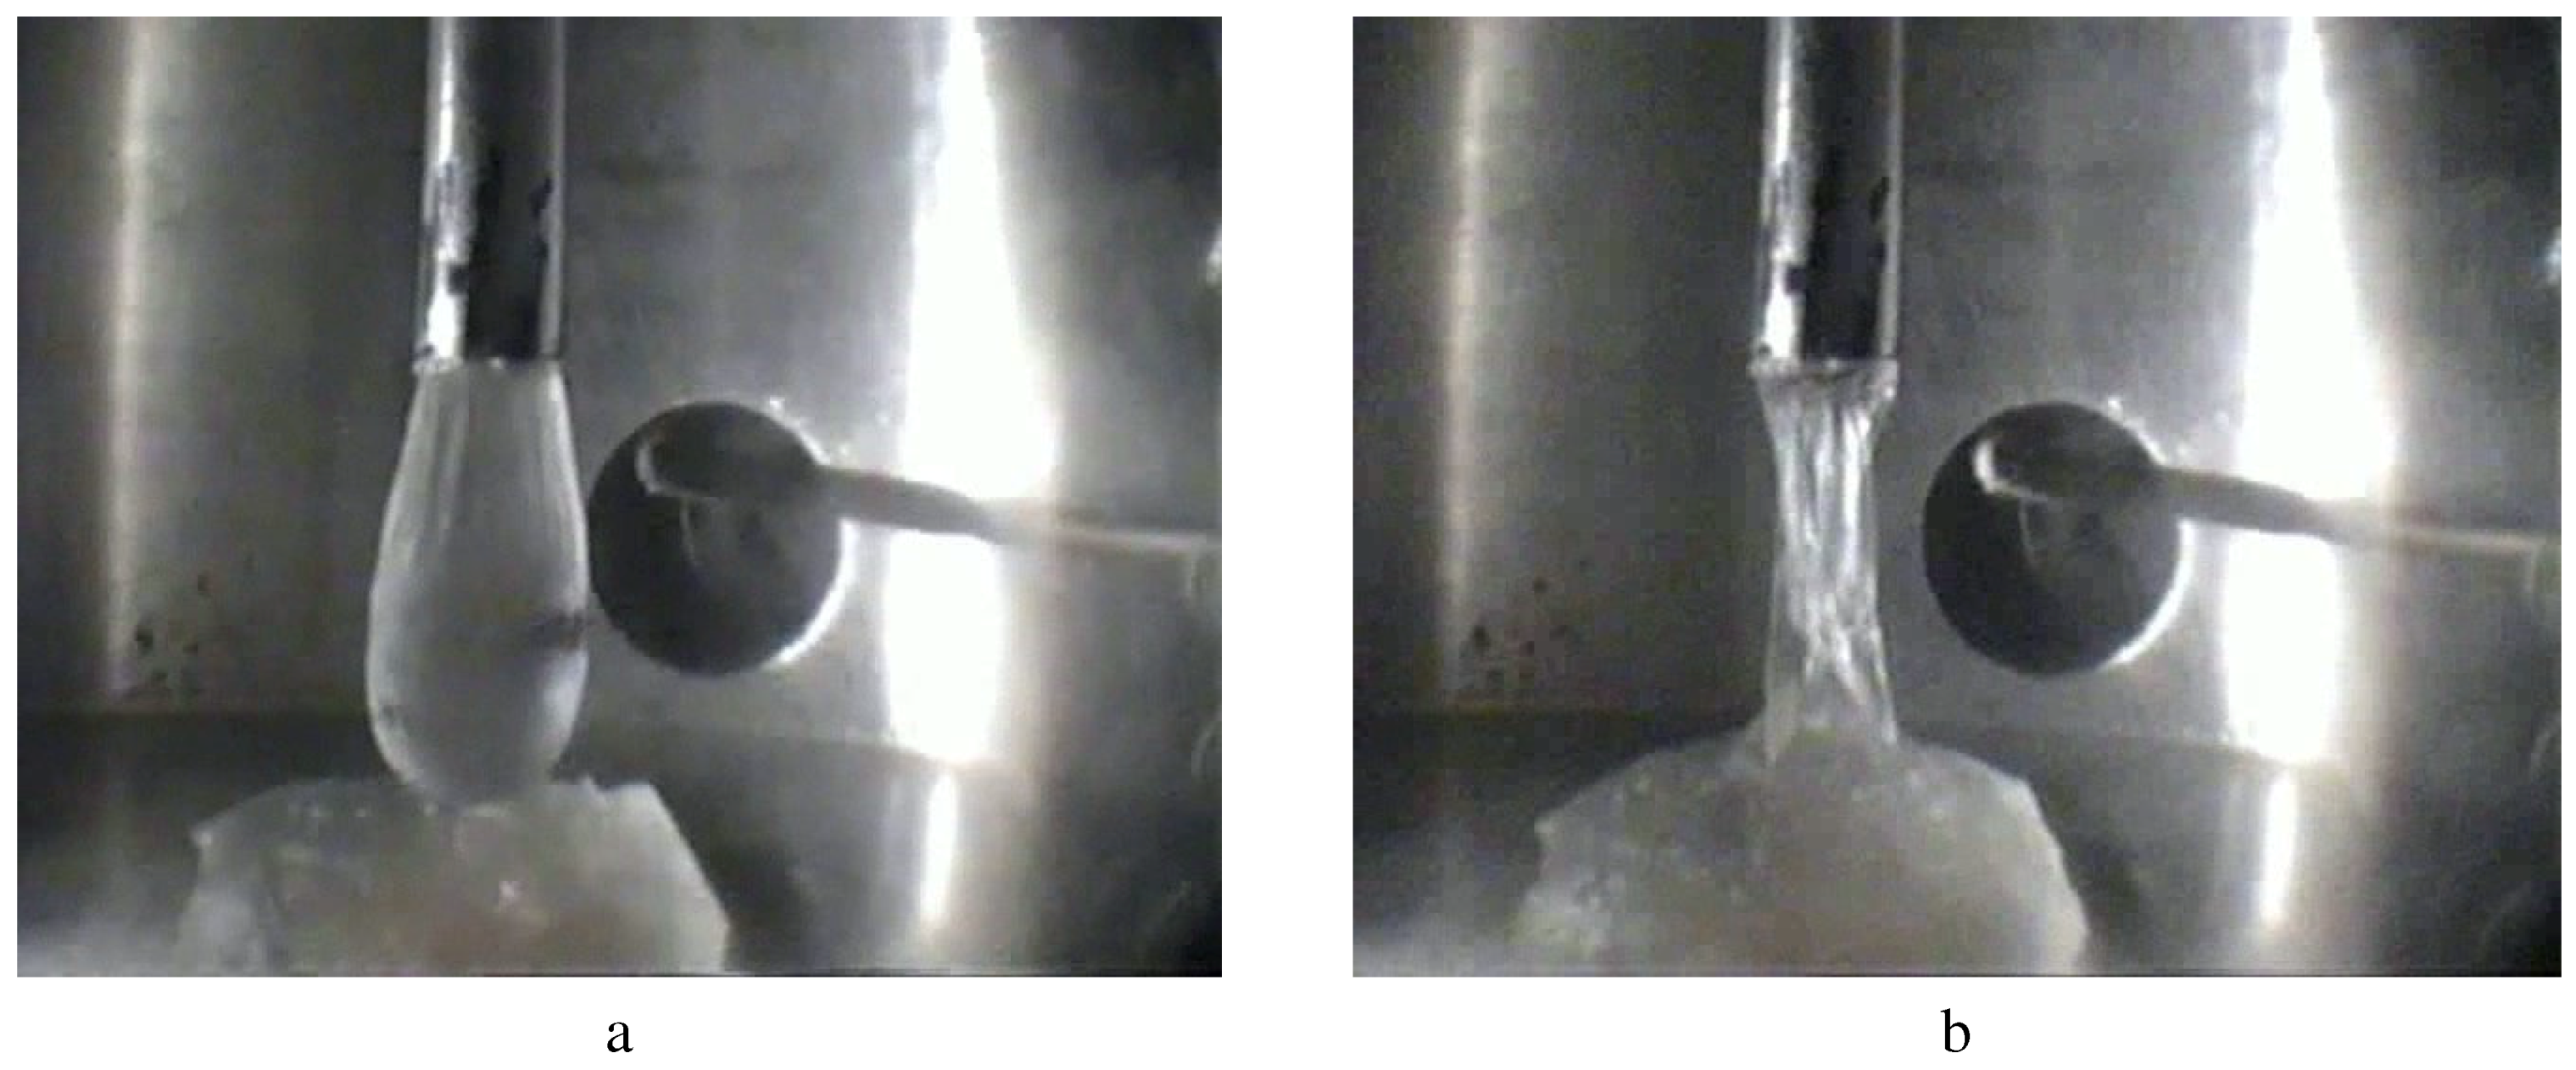
Figure 8.
(a) No hydrate; (b) hydrate on ~2/3s of bubble; (c) hydrate covering bubble.
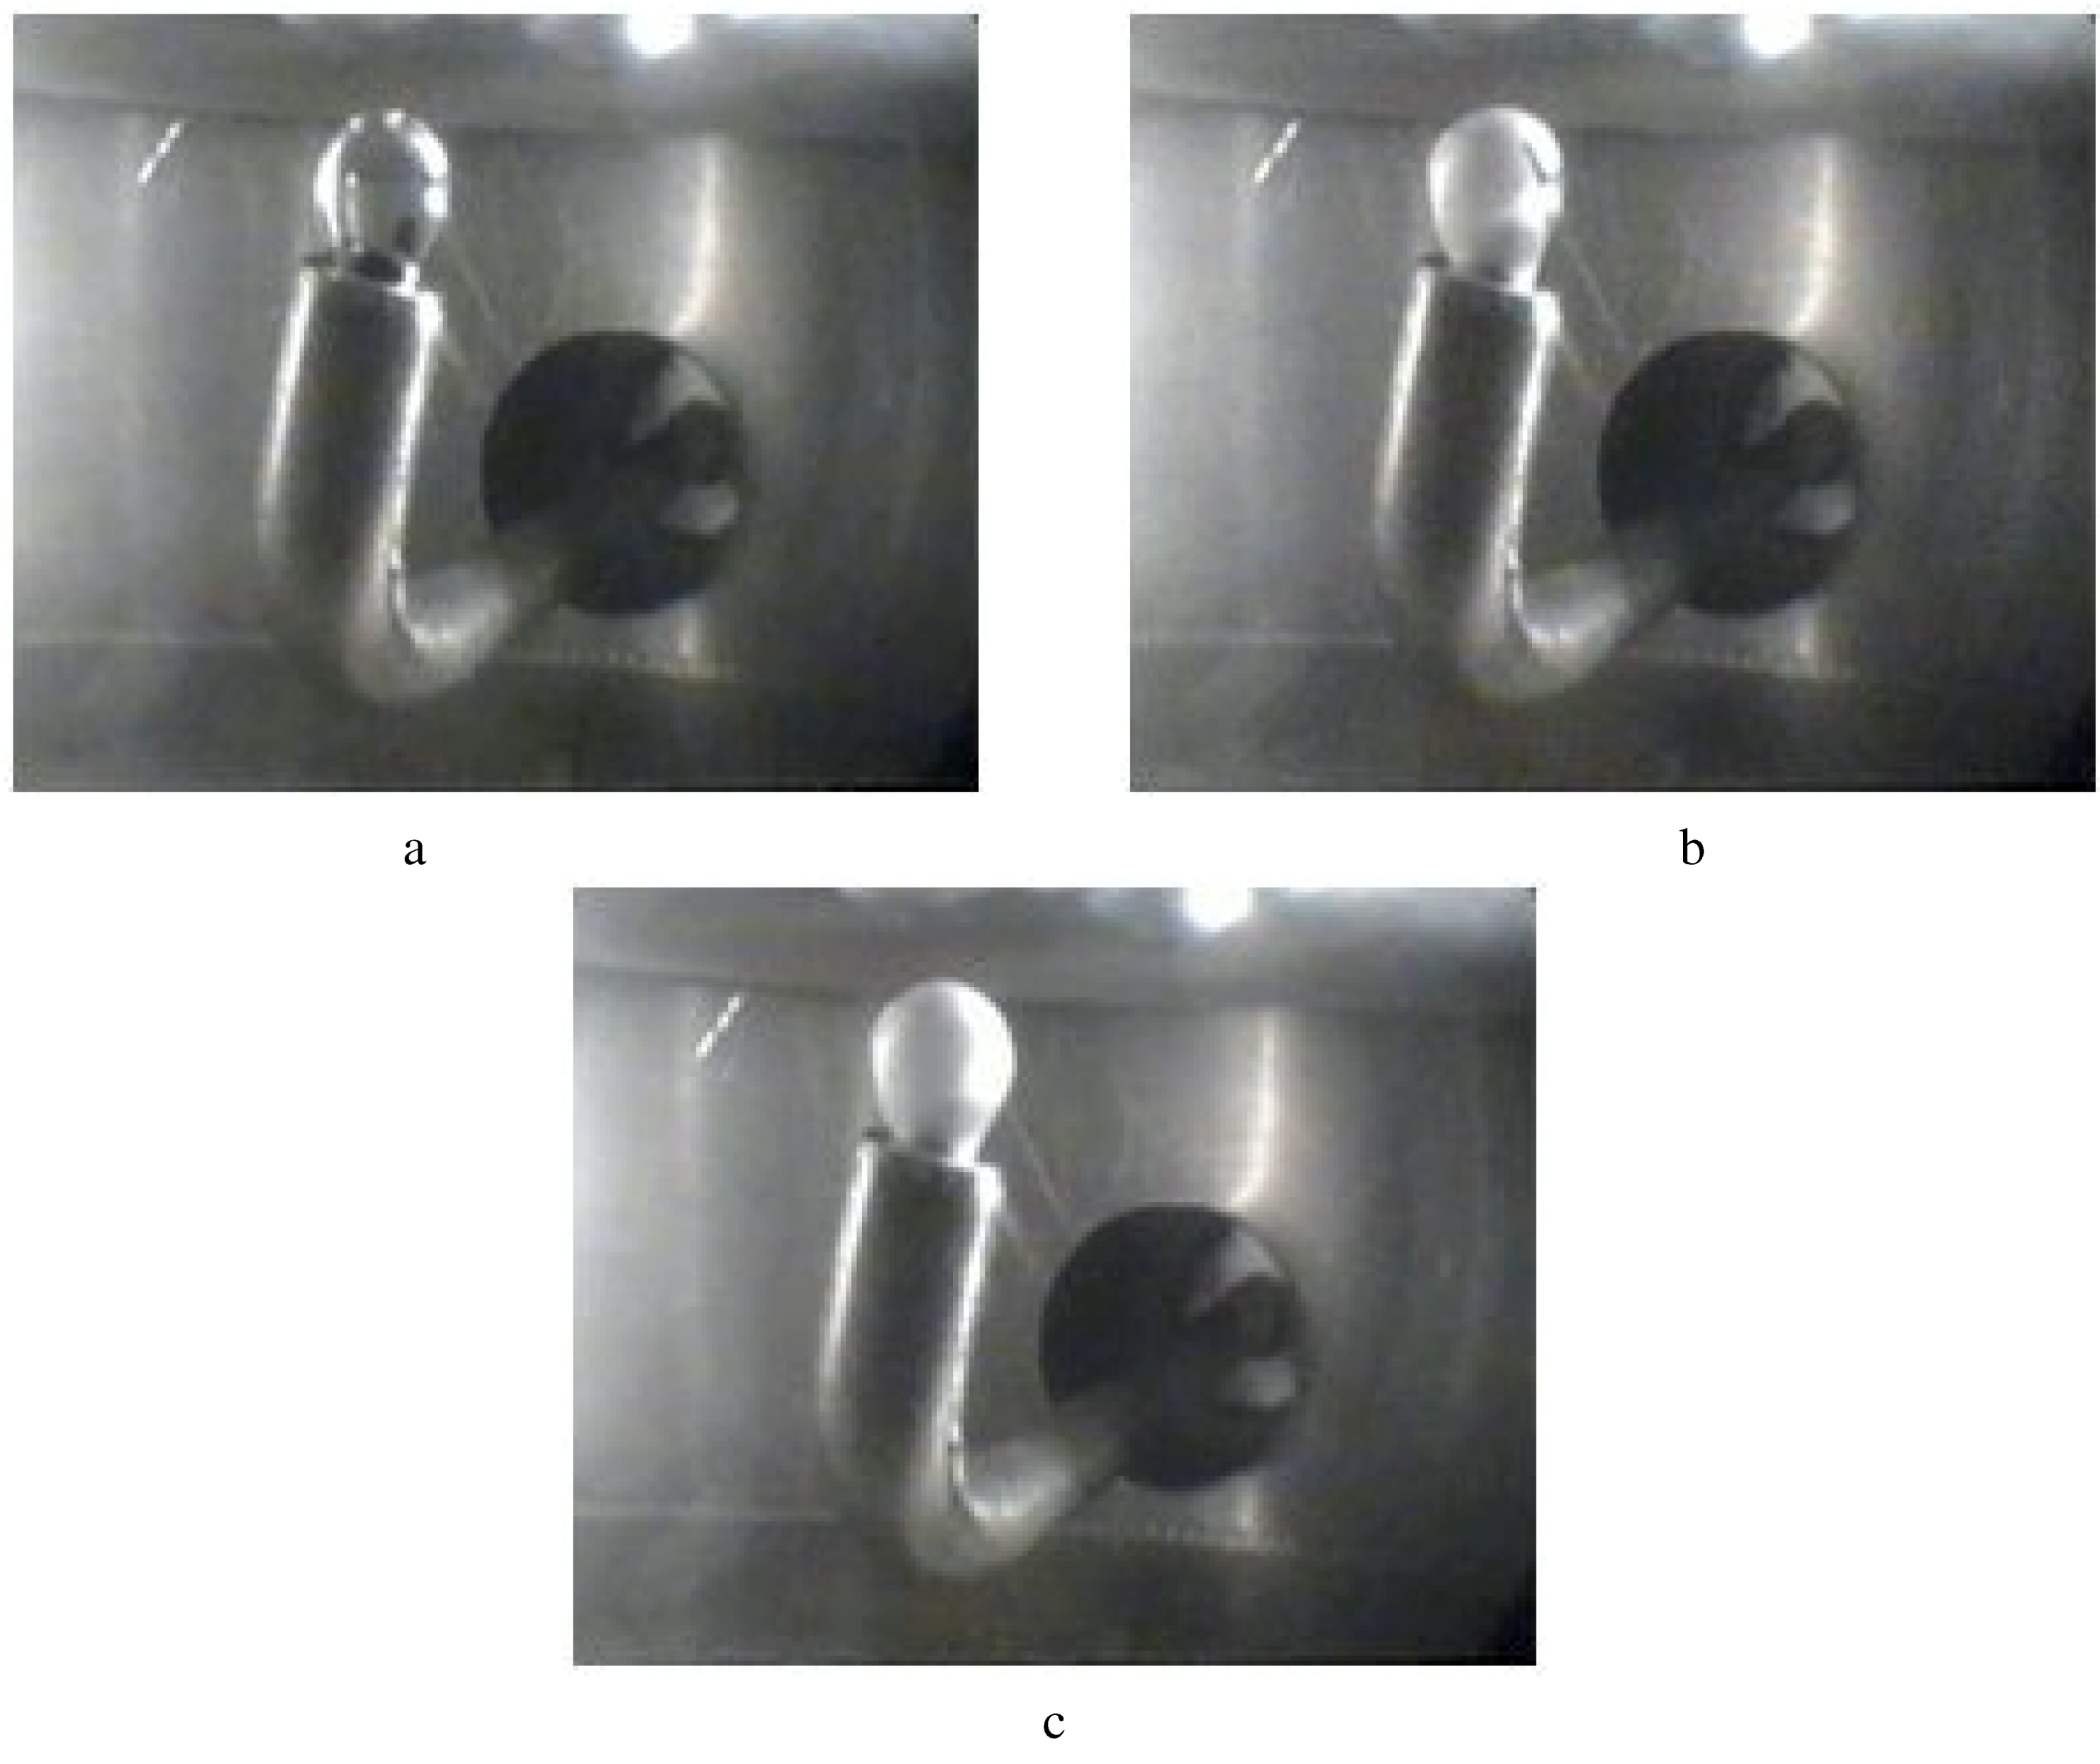
Hydrate growth internal to the hydrate surface film of the droplet surrounded by the methane, and the methane internal to the bubble to the surrounding water was slowed down or virtually nonexistent owing to each of the hydrate films. Both films provided a barrier prohibiting contact of the two (2) hydrate forming media, as reported by others [16,17,18,19]. Once the hydrate film was formed on either the droplet or bubble, respectively and with a further increase in size, the hydrate continued to form on the exposed surfaces while completely covering them. Basic hydrate formation concepts are presented in these videos, and are consistent with hydrate formation in nature, natural gas transport pipelines, BP’s Dome placed over leaking oil/gas at the bottom [7.08 km (4.4 miles)] of the Gulf, and synthetic hydrate studies conducted in laboratories [4,5].
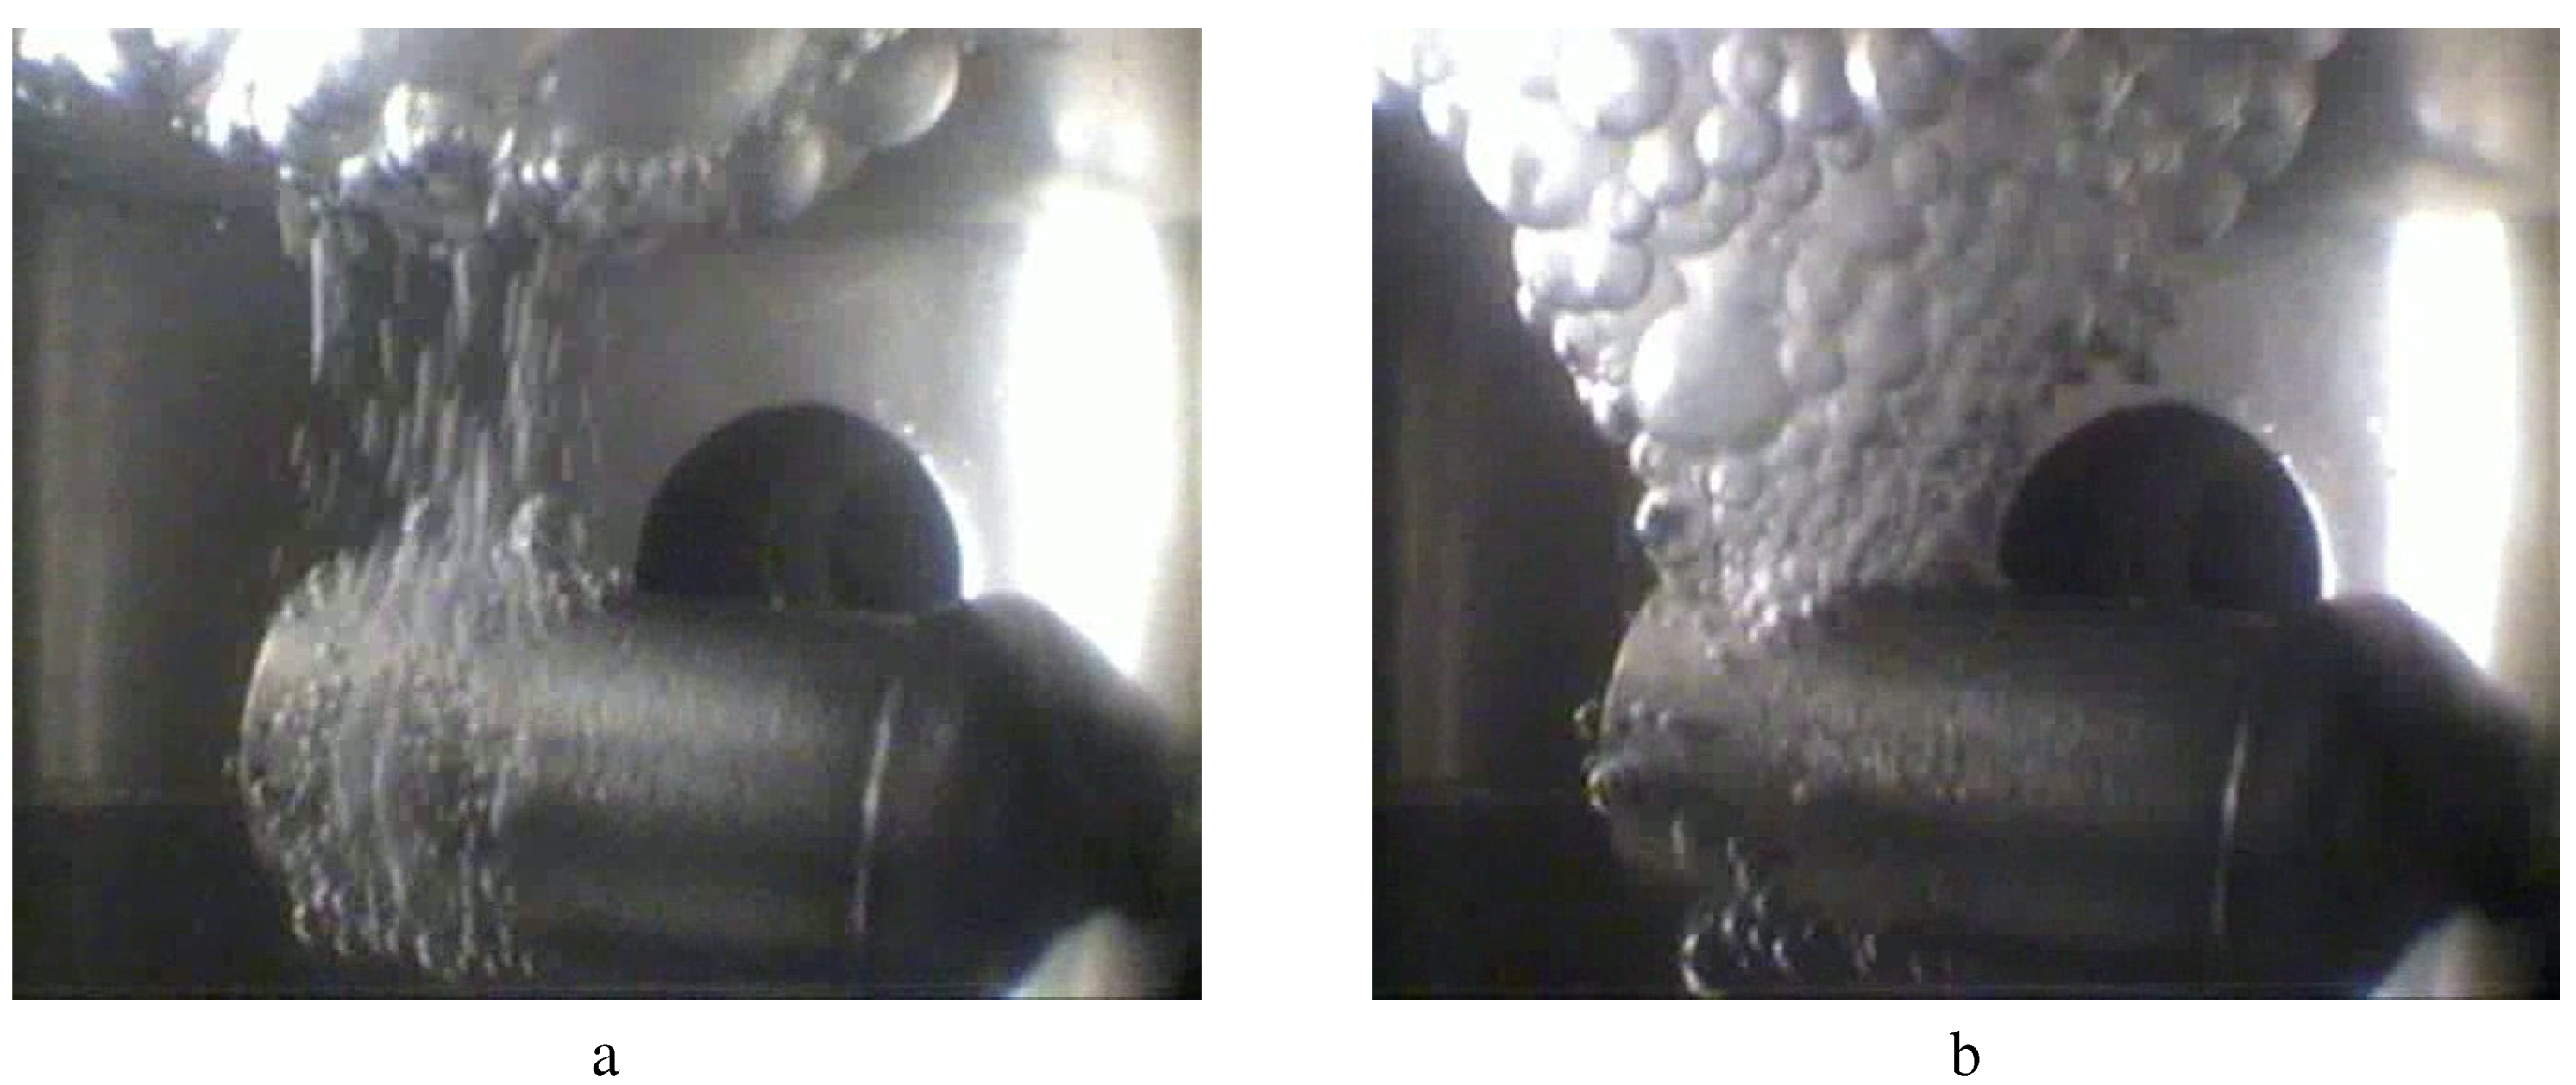
Figure 9a and Figure 9b provide frames from a video showing the formation of a hydrate film on the surface of different sized methane bubbles flowing from the end of a 10 µm Stainless Steel sintered frit submerged in water at 6.90 MPa and 277 K (~1000 psia and ~4.0 °C). A hydrate film formed within a few seconds on the flowing bubbles. As shown in each frame, when the flow of methane was changed there was a corresponding change in bubble size. Figure 9b shows the buildup of hydrate bubbles narrowing down to the outlet of sintered frit.
Figure 9.
(a) Methane injection through a sintered filter into water; (b) methane injection through a sintered filter into water.
Figure 9.
(a) Methane injection through a sintered filter into water; (b) methane injection through a sintered filter into water.

The experimental conditions and observations made from the individual frames of the videos in Figure 6a through Figure 9b provided valuable information regarding initial designs for a rapid gas hydrate formation process; this information includes the following:
- The flow of water in a methane environment at hydrate formation temperatures and pressures provide for rapid (a few to 10 and 20 seconds) hydrate formation into a small volume cell;
- Controlling the temperatures and pressures within in a finite range provided hydrate formation times according to the range;
- Heat release and heat transfer were increased prior to and during formation, respectively in a small volume cell;
- Applying shear forces to both water and methane at formation temperatures and pressures through mixing increase further hydrate being formed;
- An increase in water surface area is a critical factor with the propagation across the surface being rapid once hydrate initially forms;
- Hydrate only formed on the surfaces of the bubble and droplet bringing about how one would increase the surface area while consuming all the methane and water as hydrate; and
An important aspect is that data from these experiments correlated closely with the observations of the respective frames/pictures from videos while clearly indicating hydrate formation within seconds in a dynamic system at various formation temperatures [experiments conducted above 273 K (0.0 °C)] and pressures.
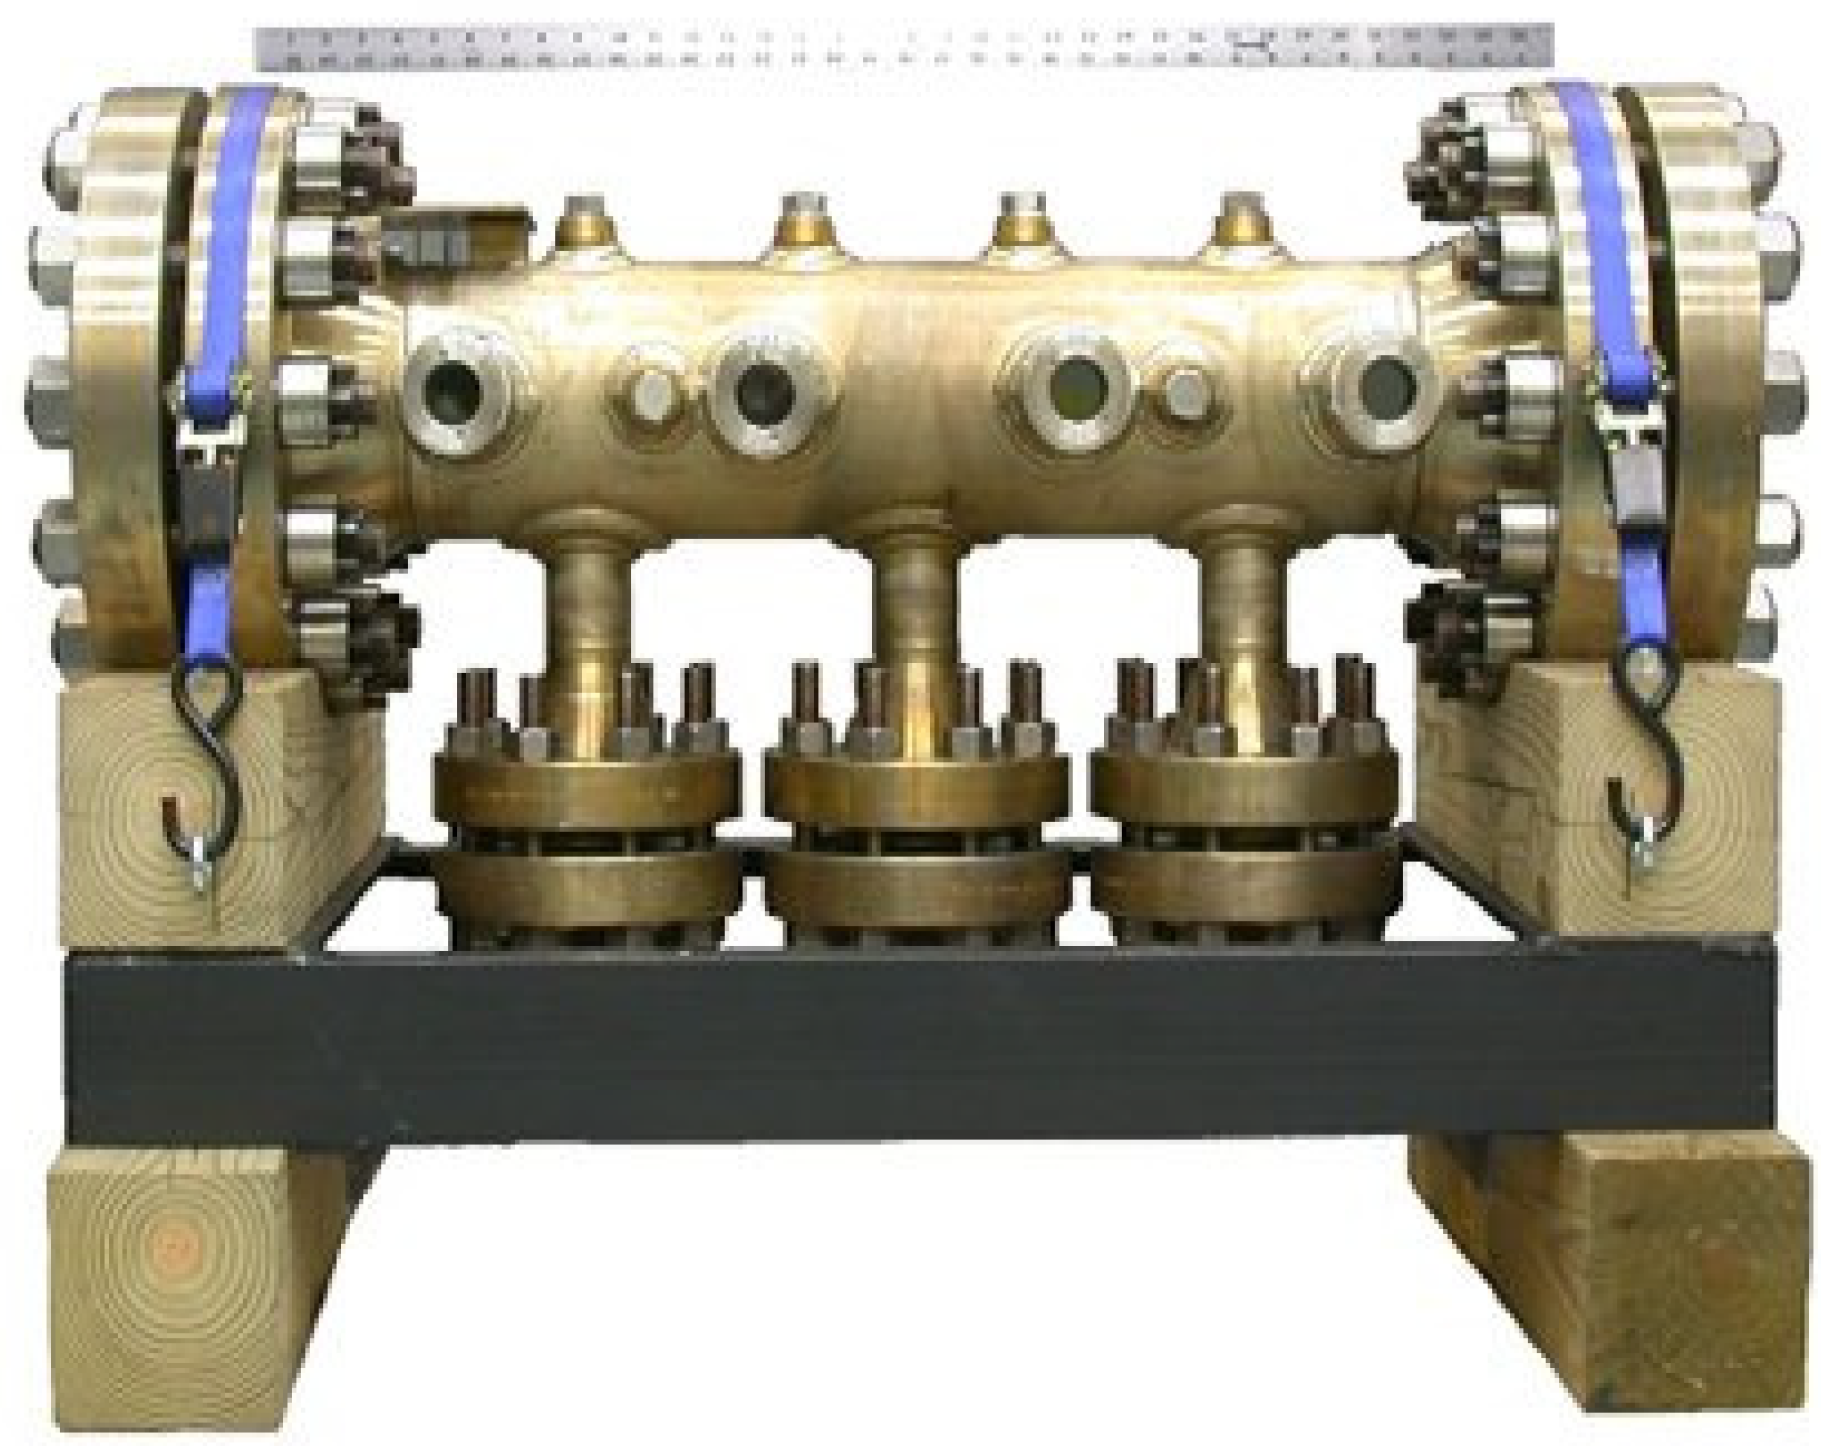
With promising results and observations collected during the efforts with the NETL 100 mL Gas Hydrate Unit, decisions were made to conducted experiments at a larger scale. All rapid gas hydrate formation techniques were now going to be conducted within the 15-Liter High-Pressure Viewcell 10.34 MPa (1500 psi) or NETL 15-Liter Hydrate Cell. Figure 10 depicts a drawing of the cross-section of the cell in the vertical position. Figure 11 is a photograph of the cell in the horizontal position. The cell was designed to operate in either the vertical or horizontal configuration.
Figure 10.
Schematic of NETL 15-Liter Hydrate Cell utilized for rapid hydrate formation experiments.
Figure 10.
Schematic of NETL 15-Liter Hydrate Cell utilized for rapid hydrate formation experiments.
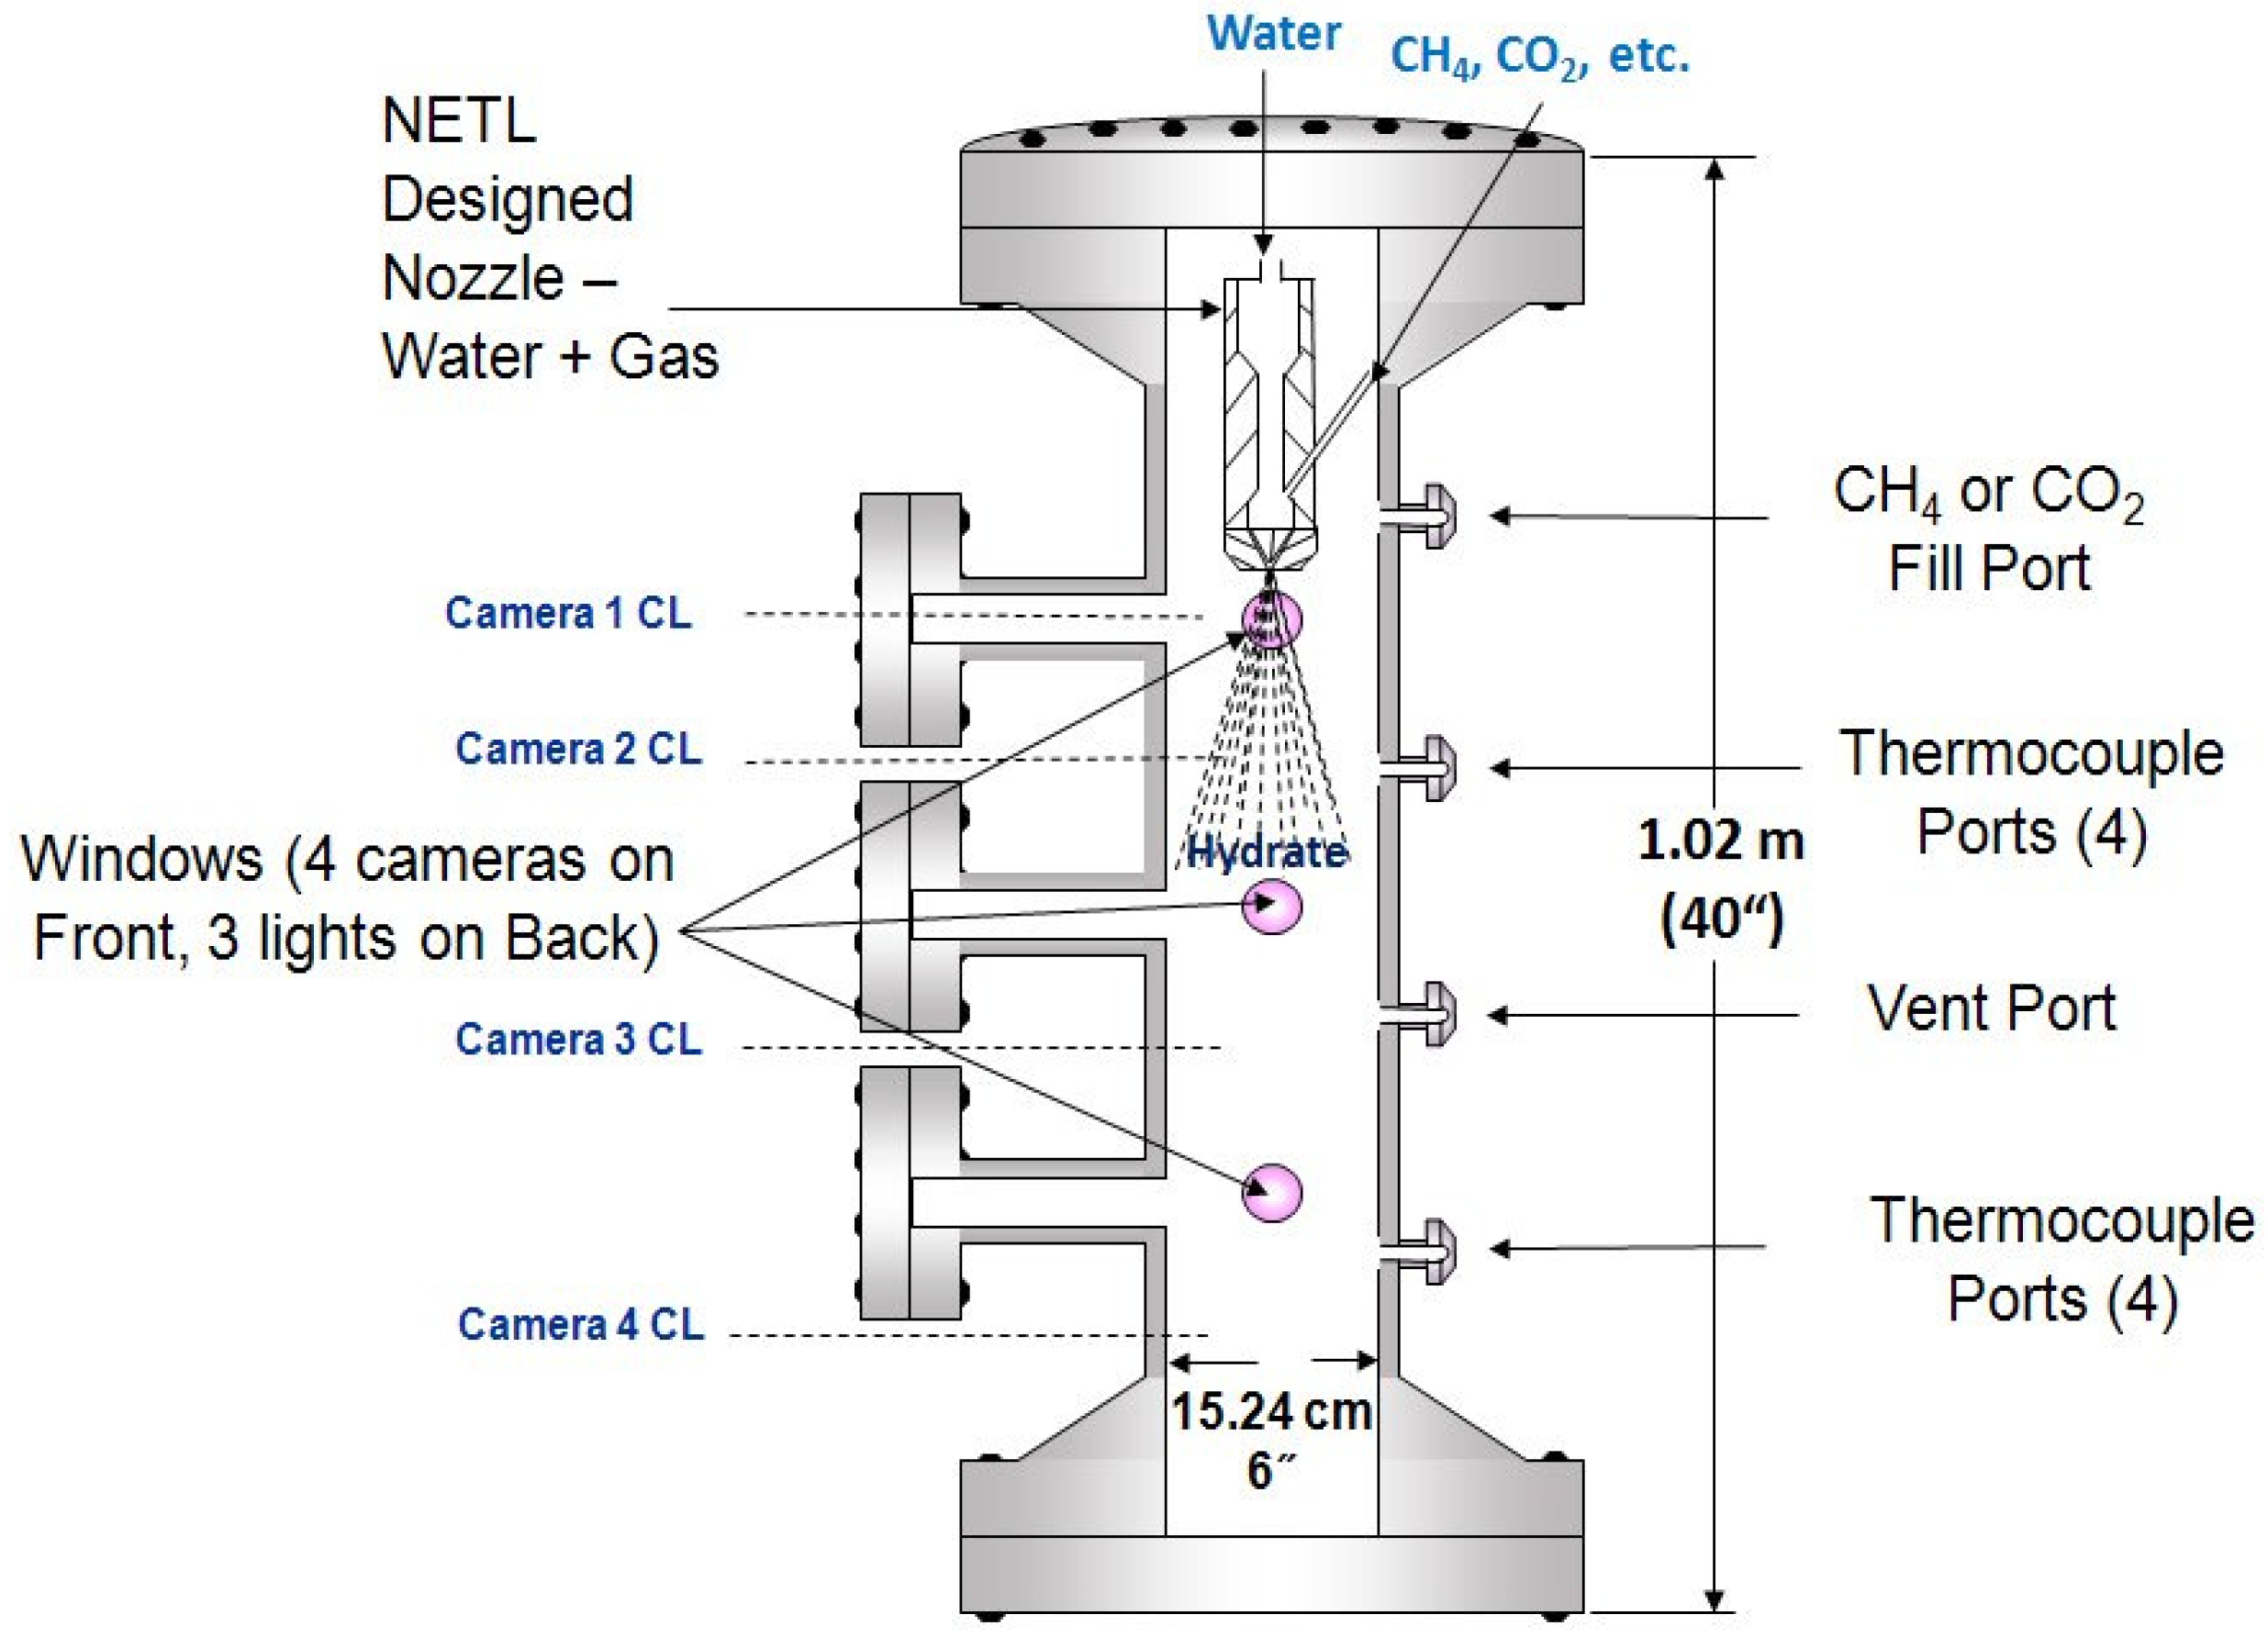
Figure 11.
NETL 15-Liter Hydrate Cell; horizontal installation with viewports (4 Cameras) along equator, and numerous instrumentation ports throughout the cell.
Figure 11.
NETL 15-Liter Hydrate Cell; horizontal installation with viewports (4 Cameras) along equator, and numerous instrumentation ports throughout the cell.

The desire in constructing the 15-Liter cell was to create a laboratory unit that was larger than the small scale unit (100 mL in size) which would closer approximate some of the conditions require for hydrate formation experiments. By significantly increasing both the volume and the instrumentation capability, a new level of resolution was possible in monitoring the behavior of hydrates during typical and rapid formation studies. The cell is an ASME coded vessel rated for 10.34 MPa (1500 psia) at a temperature rating of 328 K (55 °C), with pressure tests conducted up to 13.45 MPa (1950 psia). The interior of the cell is coated with Teflon® to minimize wall effects and minimize possible corrosion during dissociation.
The various ports including view ports serve as a means for instrumentation, process connections and cameras/light sources, respectively. The ports are used in conjunction with thermocouple bundles positioned along the length of the cell such that the temperature in the methane feed line, water feed line, methane environment, and around the nozzle can be recorded.
The cell is housed in an environmental chamber procured from Associated Environmental Systems (AES). This AES environmental chamber allows for precise temperature control and the temperature range of the chamber is from 236 to 473 K (–37 to 200 °C).
A Lauda Chiller was set to allow for the various water temperatures within an ISCO Syringe Dual-Pumping System (50 to 200 mL/min flow rates) capable of operating over ten (10) hours without any interruptions in the flow. The chiller also provided temperature control of the water feed lines (tube-to-tube heat exchanger) to the cell.
As previously mention, visual and video recording of all observations must be conducted during any rapid gas hydrate formation investigations. To accomplish this, four (4) closed circuit cameras are placed in front of the four (4) view ports to visually observe and record conditions within the cell. Hydrate formation has been recorded during the initial testing period and a number of conditions have been observed. The view ports in the rear of the cell are utilized exclusively for lighting. They are offset from the ones in front to eliminate any lighting difficulties. Additional thermocouples record the temperature of the environmental chamber. Mass flow meters monitor the uptake of methane during cell charging and hydrate formation, and during injection through the nozzles, while vented methane or dissociated methane from hydrates are measured by a downstream wet test meter. Pressure within the cell is monitored by a pressure transducer.
The 15-Liter Cell is monitored and data collected on a personal computer using National Instruments Labview® software. The software is common to other methane hydrate cell operations in NETL laboratories and data can be retrieved and shared very readily among researchers.
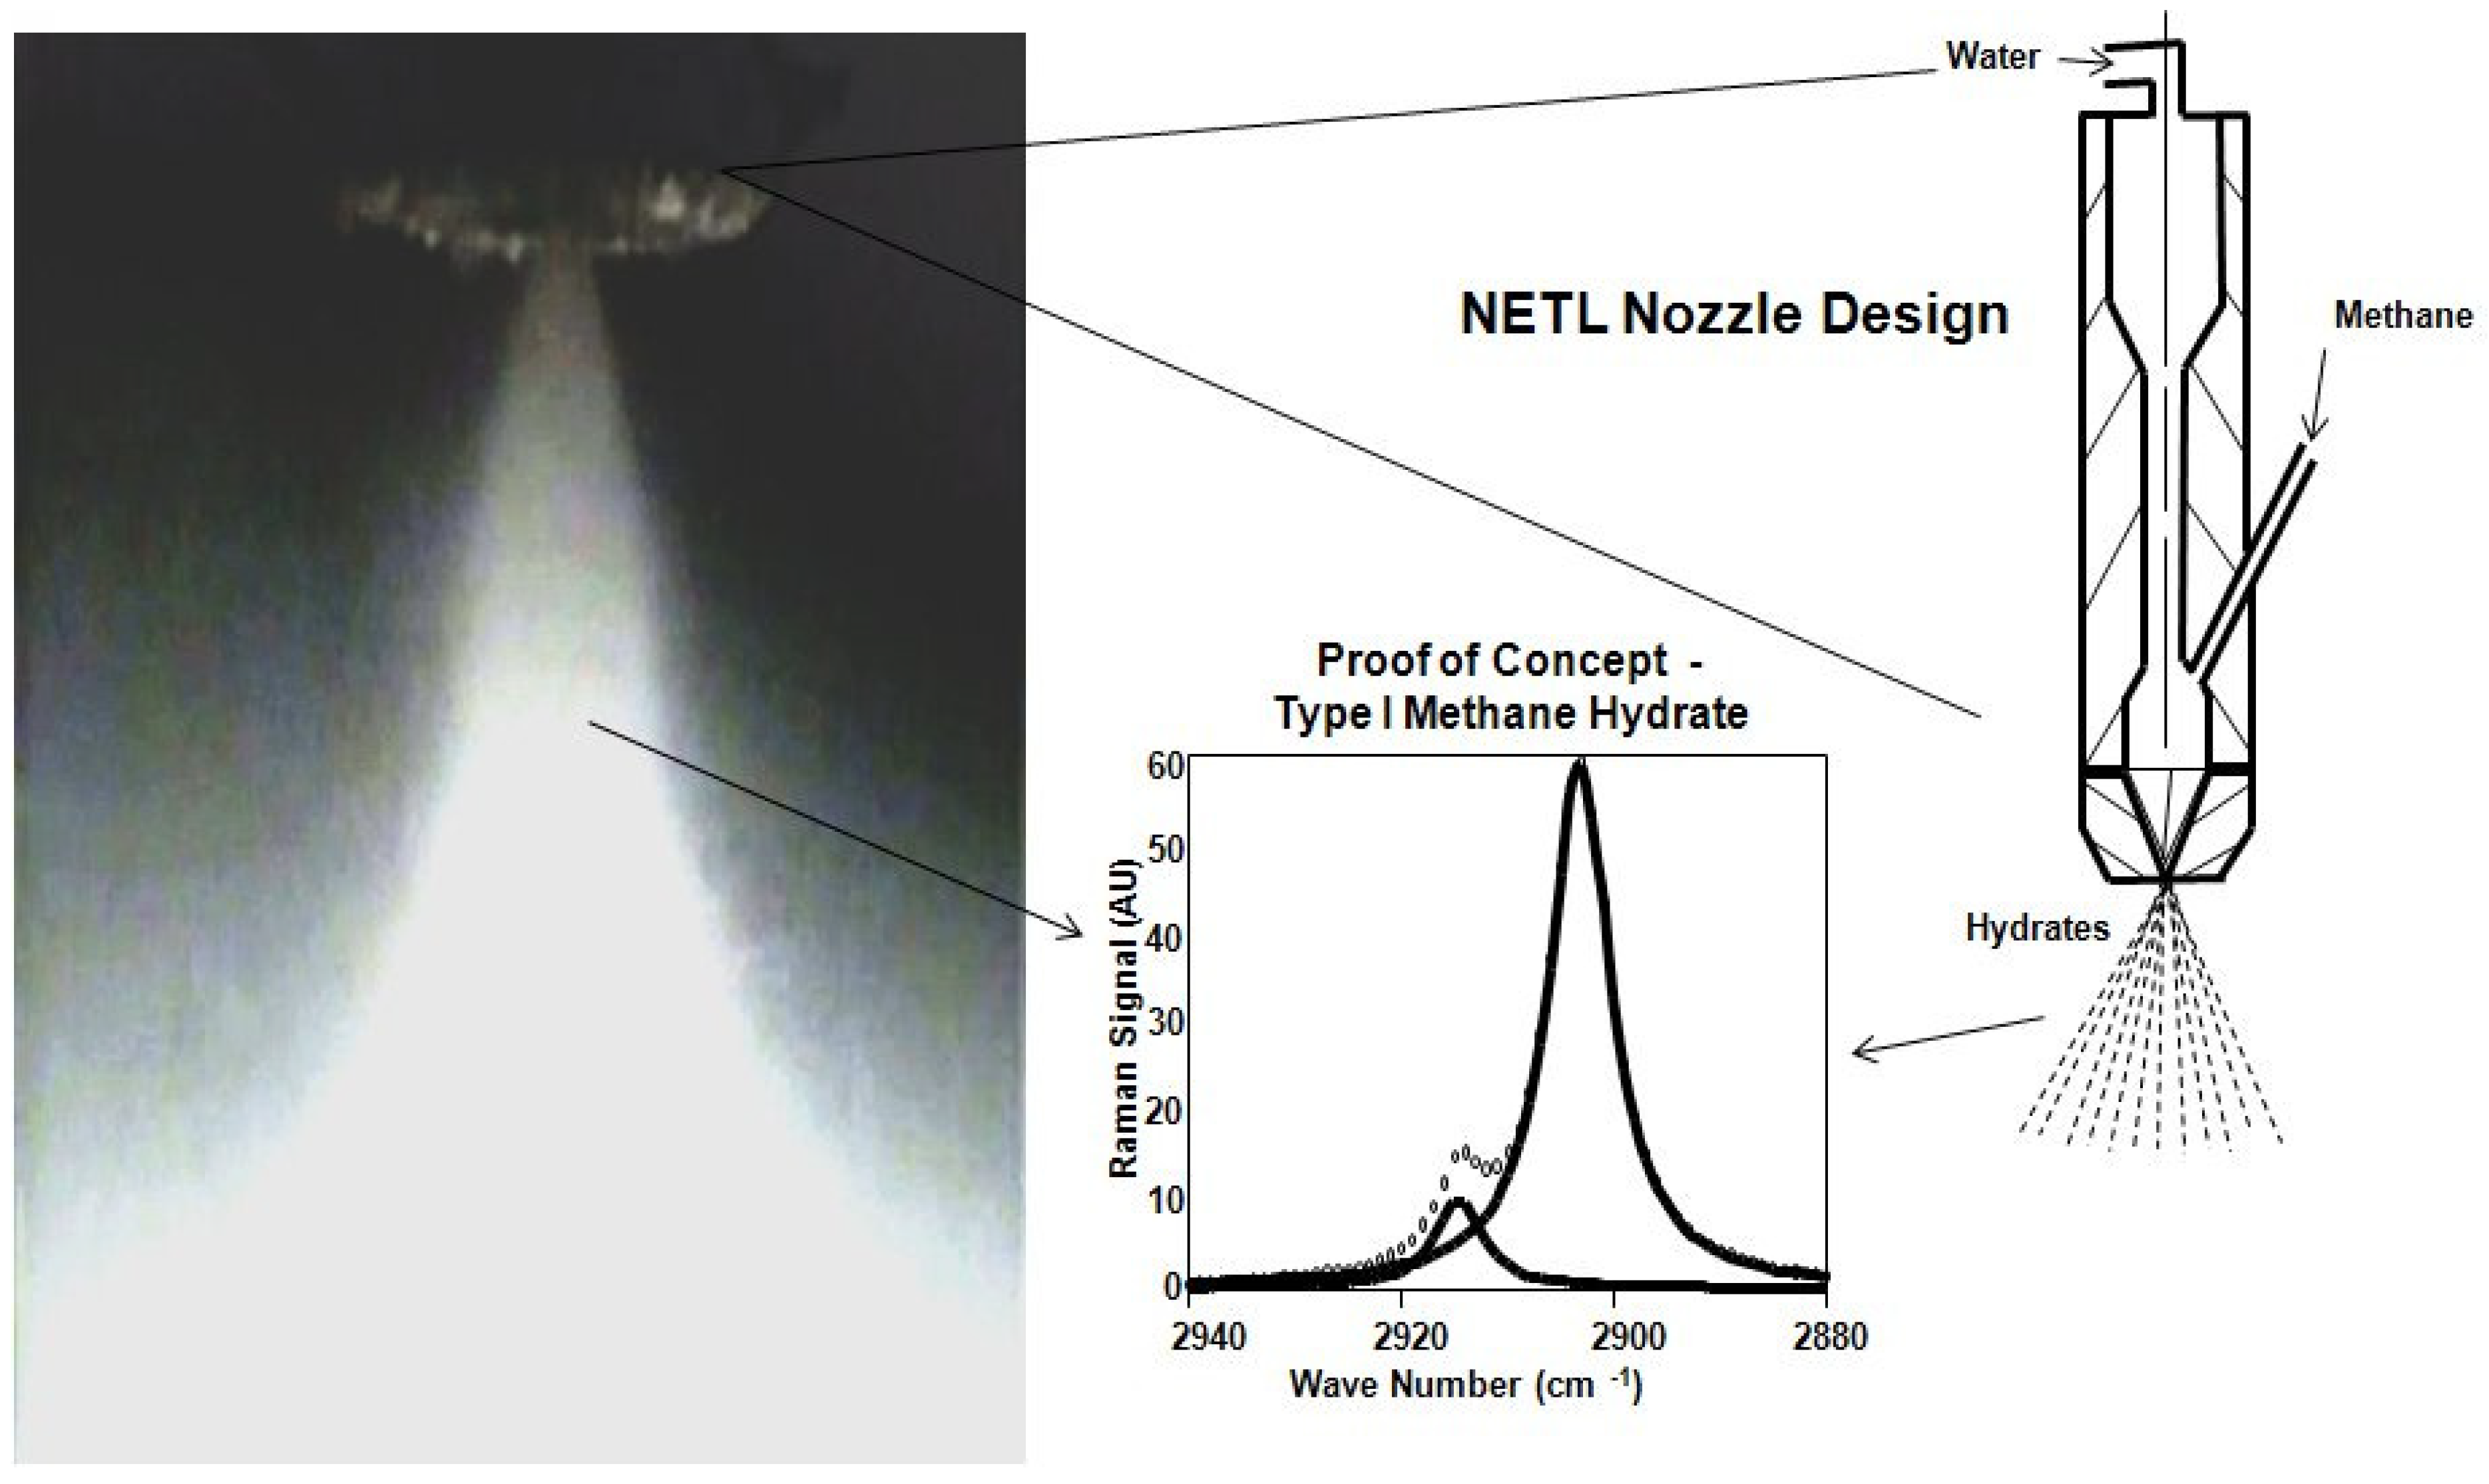
Based on results, data, observations, etc., collected from experiments and screening tests conducted within the NETL 100 mL Gas Hydrate Unit, a variety of nozzles and nozzle assemblies were designed, machined and assembled. Figure 12 depicts one of the NETL designs that proved to be very effective in demonstrating the rapid and continuous formation of gas hydrates.
The NETL Nozzle Assembly was designed and constructed to receive both water and gas(es) at high velocities by machining separate flow passes while creating a small mixing zone resulting in atomization (1st stage) of the water. This design allowed for the conversion and connection of a variety of single-fluid nozzles utilized as twin-fluid nozzles while providing low residence times (owing to high velocities) of the water-gas mixture. The strainer (nozzle company piece) or sintered filter (NETL adapted piece) provided mixing/atomization (2nd stage) of water-gas mixture with micron-sized gas bubbles being further produced. This water-gas mixture was further mixed/atomized (3rd stage) when passing thru swirl inserts (nozzle company piece). Final atomization within the nozzle(s) (4th stage) was provided when the water-gas mixture passed through the spray orifices. The single-fluid nozzles were commercially available from Delevan Spray Technologies, and Spraying Systems Company.
The commercial available nozzles were also selected for their respective fluid flow rates (25 to 200 mL/min) and spray angles (35, 45, 60 to 70, 90 degree). The outside diameters of the hollow- and full-cone fluid sprays were between 10.16 to 13.97 cm (4.0 and 5.5 inches) and varied in length from 10.16 to 20.32 cm (4.0 and 8.0 inches). These nozzle parameters made them compatible with the nominal 15.24 cm (6.0 inches) internal diameter of the NETL 15-Liter Cell while preventing impingement of the spray on the cell walls.
Figure 12.
Early NETL nozzle and nozzle assembly designs utilized to demonstrate rapid and continuous gas hydrate formation.
Figure 12.
Early NETL nozzle and nozzle assembly designs utilized to demonstrate rapid and continuous gas hydrate formation.
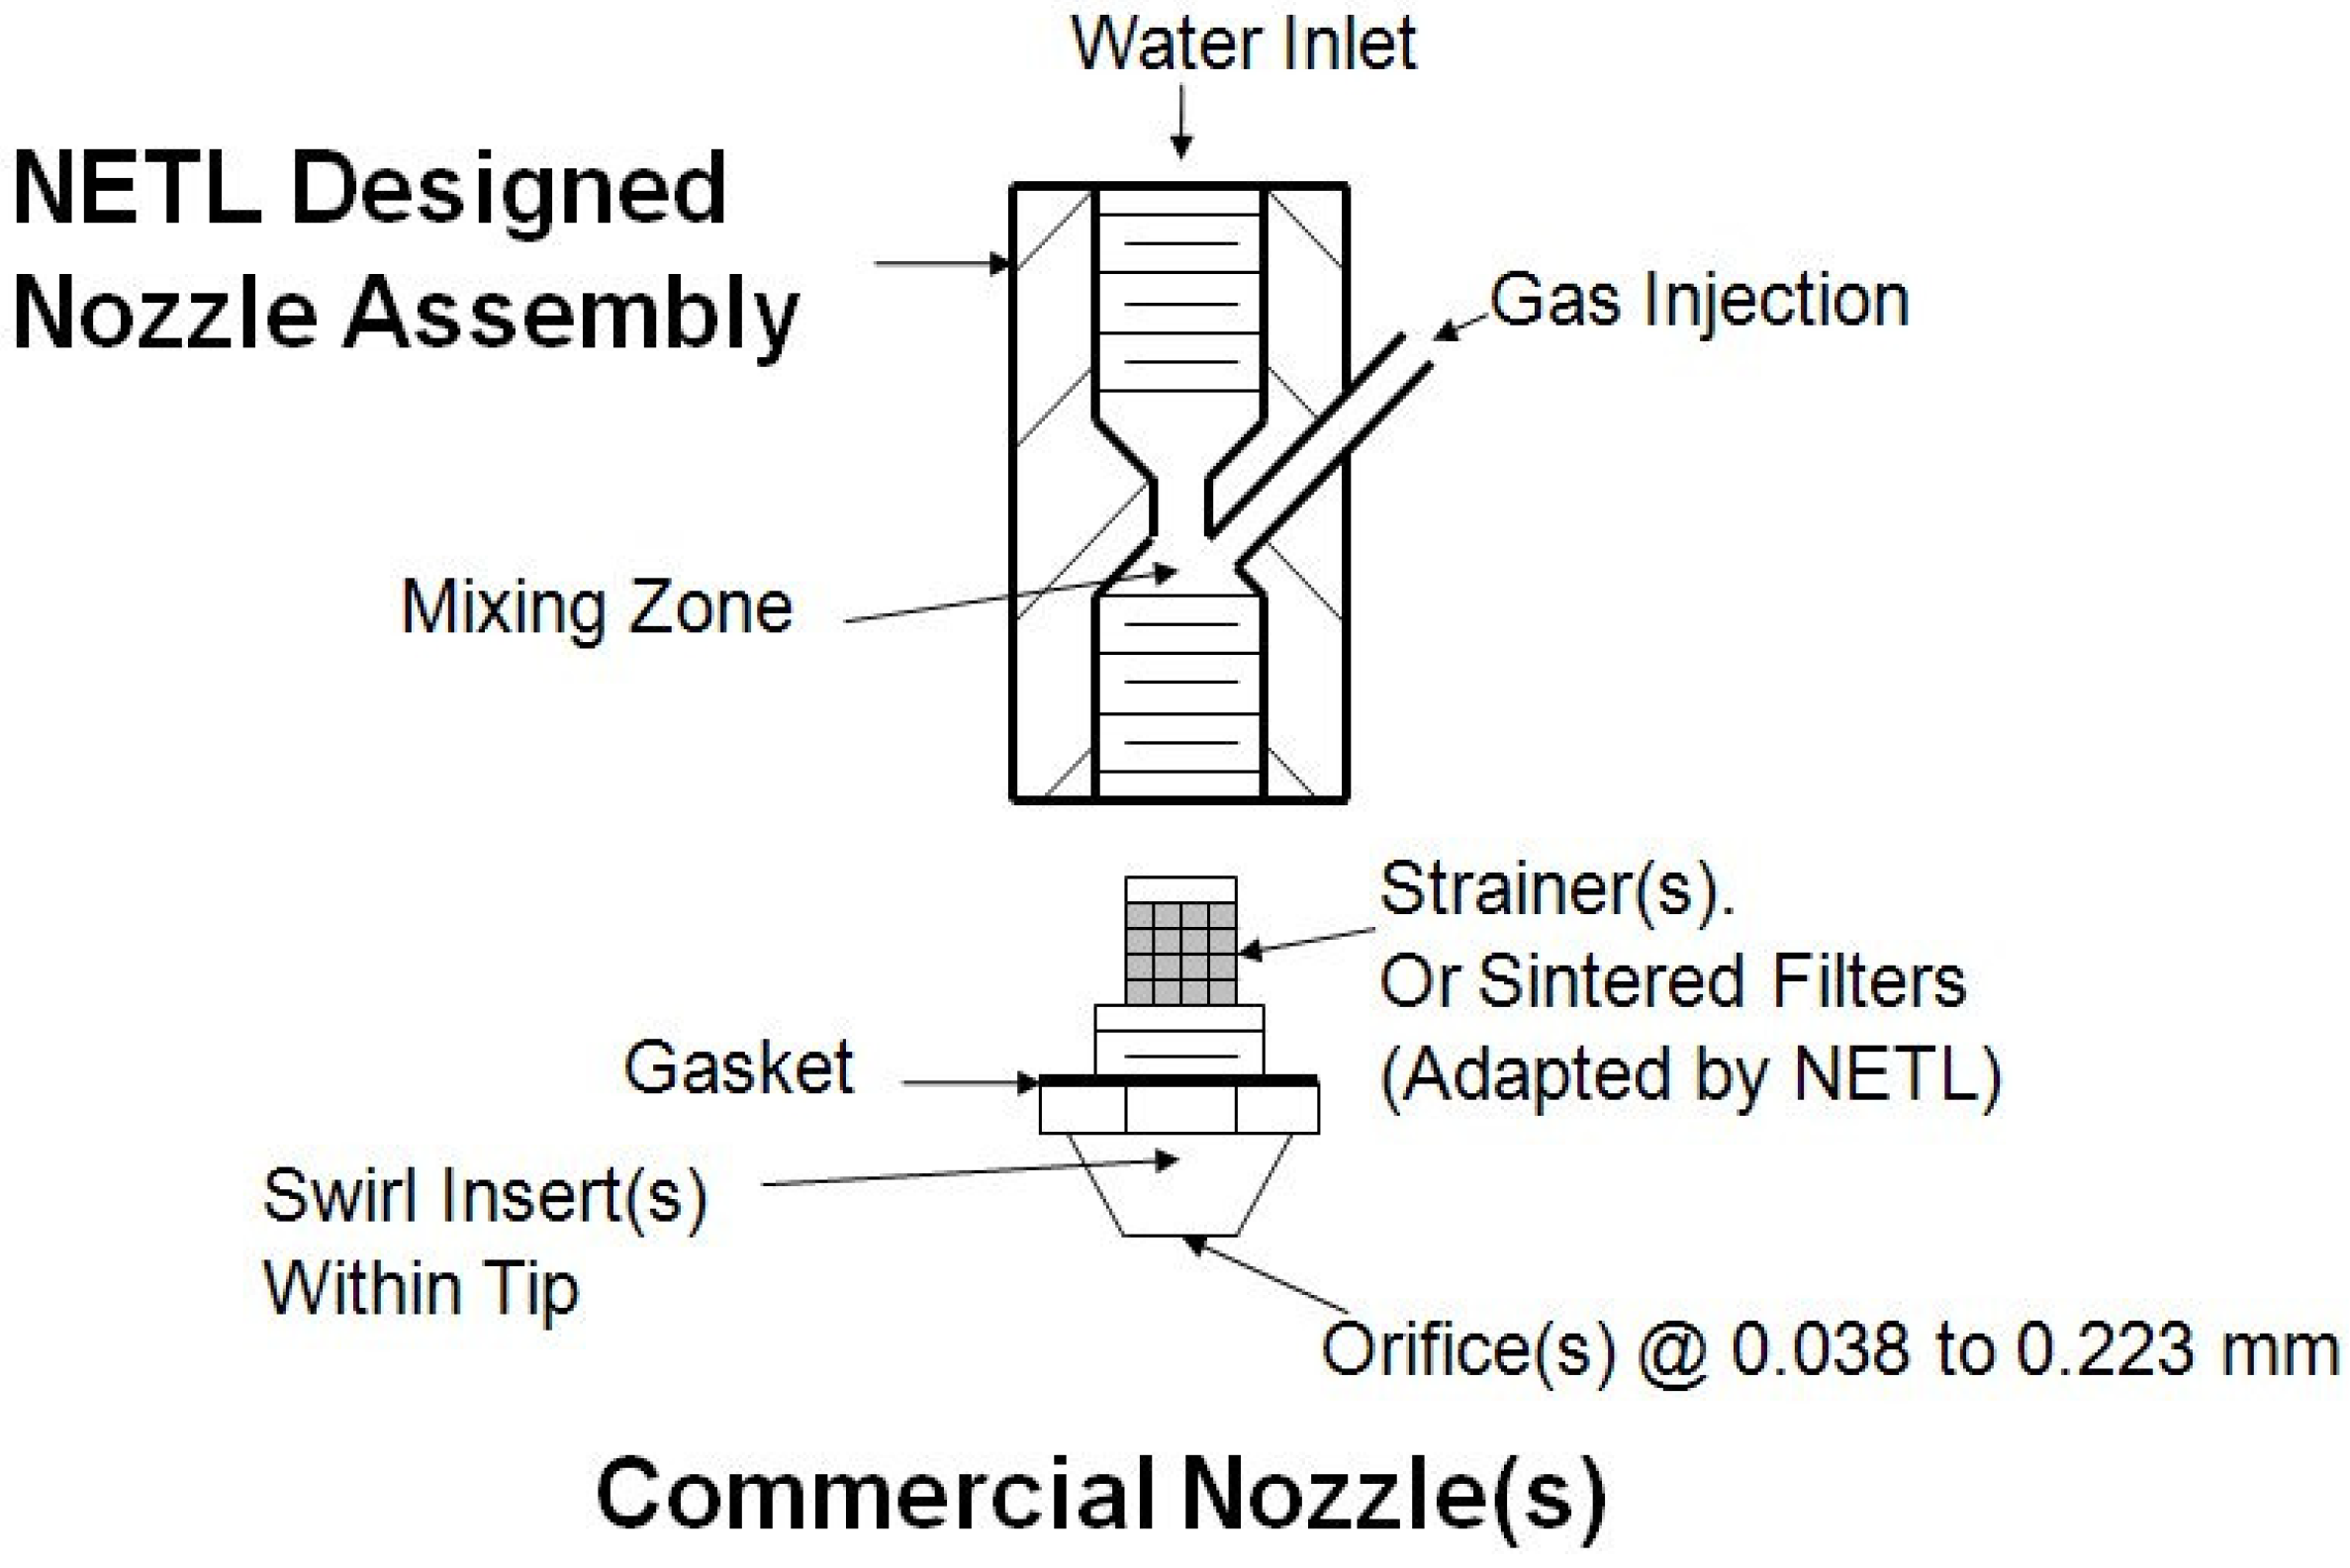
Table 6 indicates the conditions for the environment of the 15-Lter Cell and those for the various nozzle designs for the injection of the water-gas mixtures into the 15-Liter Cell.
| Location | 15-Liter Cell | NETL Nozzle(s) | |||||
|---|---|---|---|---|---|---|---|
| Parameter | Temperature K/ºC | Pressure MPa/psia | Temperature1 K/ºC | Pressure2 MPa/psia | Flow Rate3 mL/min | ||
| Media | Gas (CH4) | Gas (CH4) | Gas (CH4) | Water | Gas (CH4) | Water | Water |
| Range | 273.5–275/0.5–3.0 | 4.14–6.90/600–1000 | 279–288/6.0–15 | 278–288/5–15 | 4.48–8.28/650–1200 | 25–200 | |
1 and 2 the temperature and pressure of the atomizing gas (CH4) and water mixing within the nozzle assembly/nozzle were deliberately set at conditions near hydrate formation or within the conditions to form hydrate, and never at conditions to form hydrate and ice. For example, operating at 279 K at 4.48 MPa for CH4 and 280 K at 4.48 MPa for water (near hydrate formation conditions) or 279 K at 6.90 MPa for CH4 and 278 at 6.90 MPa for water (within hydrate formation conditions), respectively. While the temperatures of the CH4 were different to those of the water, the pressures where essentially the same for both media owing to the automatic pressure regulation built into the ISCO Syringe Pump during the Constant Flow Operation Mode. 3 In addition, the CH4 flow rate was adjusted to coincide with the water flow rate allowing for 0.75 to 1.0 to 1.25 mole(s) of CH4 per 5.76 mole(s) of water (1.0 mole CH4 per 5.76 mole(s) water or Theoretical Molar Ratio to form CH4 hydrate).
These designs allowed for extremely short residence times of the mixed and atomized media within the mixing zone and other sections of the nozzle. Hydrate formation at lower temperatures and pressures would be advantageous, but testing at a smaller scale was prudent. In addition, forming hydrate within the mixing zone/nozzle at very short resident times would allow for some initial heat removal of heat generated during the super-cooling of the water. Heat transfer would be elevated owing to the nozzle assembly/nozzle providing a path for heat removal since these components were partially or completely inserted within the 15-Liter Cell.
The theory, if any hydrate formed within the nozzle at high exit velocities they would breakup or be atomized through the orifice of the nozzle while providing nucleation sites for additional hydrate formation within the vessel. In addition, while mixing the atomizing gas and water within the nozzle at higher pressures than the injected environment, one could possibly take advantage of the Joule-Thomson Effect (i.e., expansion of a gas while providing cooling) for the gas (lower temperature).
In practice and based on the atomization of liquid fuels, the injected micron-sized water droplets should be surrounded by methane while also having micron-sized bubbles within them. These micron-sized droplets having micron-sized bubbles inside would be elongated when exiting the spray orifice(s) of the nozzles allowing them to be smaller in overall diameter. There are two (2) advantageous possibilities either separate or together allowing for rapid hydrate formation; (1) the bubbles within the droplets are at a higher pressure [anywhere from 0.35 to 1.38 MPa (50 to 200 psia)–Table 6] relative to the environment being injected. This would allow for these bubbles to expand while further breaking-up/atomizing the micron-sized water droplets (5th stage of atomization); (2) if these bubbles within the droplet do not breakup, it could allow for the formation of hydrate from the inside out corresponding with hydrate formation from the outside into the droplet owing to the methane rich environment surroundings. This could eliminate the need for droplets less than 15 micrometer (nominal size to form solid hydrate particles [7]). This smaller diameter would allow for hydrate formation at the temperatures of the environment being injected.
In summary, the NETL designed techniques at a range of operating conditions shown in Table 6 could allow for possible rapid hydrate formation and are again, based on the following:
- Higher pressure within the nozzle assembly/nozzle(s) for better atomization with atomization increasing with increased pressure while producing micron-sized droplets;
- Multiple stages of atomization for the water-gas mixture(s) being utilized for developing even smaller micron-sized droplets with micron-sized CH4 bubbles inside these droplets;
- Higher pressure of the bubbles within the droplets for further atomization through their expansion and breaking up of the micron-sized droplets exiting the spray orifice(s) of the nozzles within the cell environment;
- Smaller droplet diameters having CH4 bubbles inside owing to the droplets being elongated during their exit at the spray orifice(s) of the nozzle(s);
- Bubbles within the droplets expanding while further breaking-up/atomizing the micron-sized water droplets;
- Bubbles within the exiting droplets allowing for hydrate formation from the inside out and from the outside in while not complying with the nominal 15 micrometer sized droplets for solid hydrate formation;
- High velocities of both the water and gas feeds within a small mixing zone near and within the T-P of hydrate formation corresponding to extremely short residence times eliminate plugging within the nozzle(s). New nucleation sites are provided in the cell environment owing to these hydrates breaking up at the exit of the orifice(s) of the nozzle(s); and
- The longer length of the 15-Liter Cell provides longer residence times of the droplets still in a methane environment for hydrate to form away from the nozzle.
Based on practices utilized in the atomization and eventual combustion of liquid fuels, twin-fluid nozzle designs, theories and operating conditions developed from the initial test results from the 100 mL cell, experiments commenced within the 15-Liter Cell. The result was the formation of hydrate as a powder, resembling snow as observed through the 15-Liter cell’s viewports.
These experiments and their results allowed for instantaneous and continuous formation of methane hydrates, with a dramatic increase during the added atomization associated with methane injected within the nozzle. The instantaneous and continuous hydrate formation process was repeated over several months while varying the flow rate of water and methane (atomization media within nozzle), their temperatures and the overall temperature of the methane environment within the cell. These results clearly indicated that hydrates formed immediately after the methane and water left the nozzle at temperatures above the freezing point of water throughout the range of operating conditions.
Figure 13 is a still photo from a video showing the hydrate spray and subsequent hydrate formation away from the NETL designed nozzle. Furthermore, a typical Raman spectra on samples collected from the cell verified formation of sI methane hydrate is also shown.
Figure 13.
Typical hydrate spray and subsequent hydrate formation downstream from NETL designed nozzle, Camera 1 CL location shown in Figure 10, above (11/25/09).
Figure 13.
Typical hydrate spray and subsequent hydrate formation downstream from NETL designed nozzle, Camera 1 CL location shown in Figure 10, above (11/25/09).

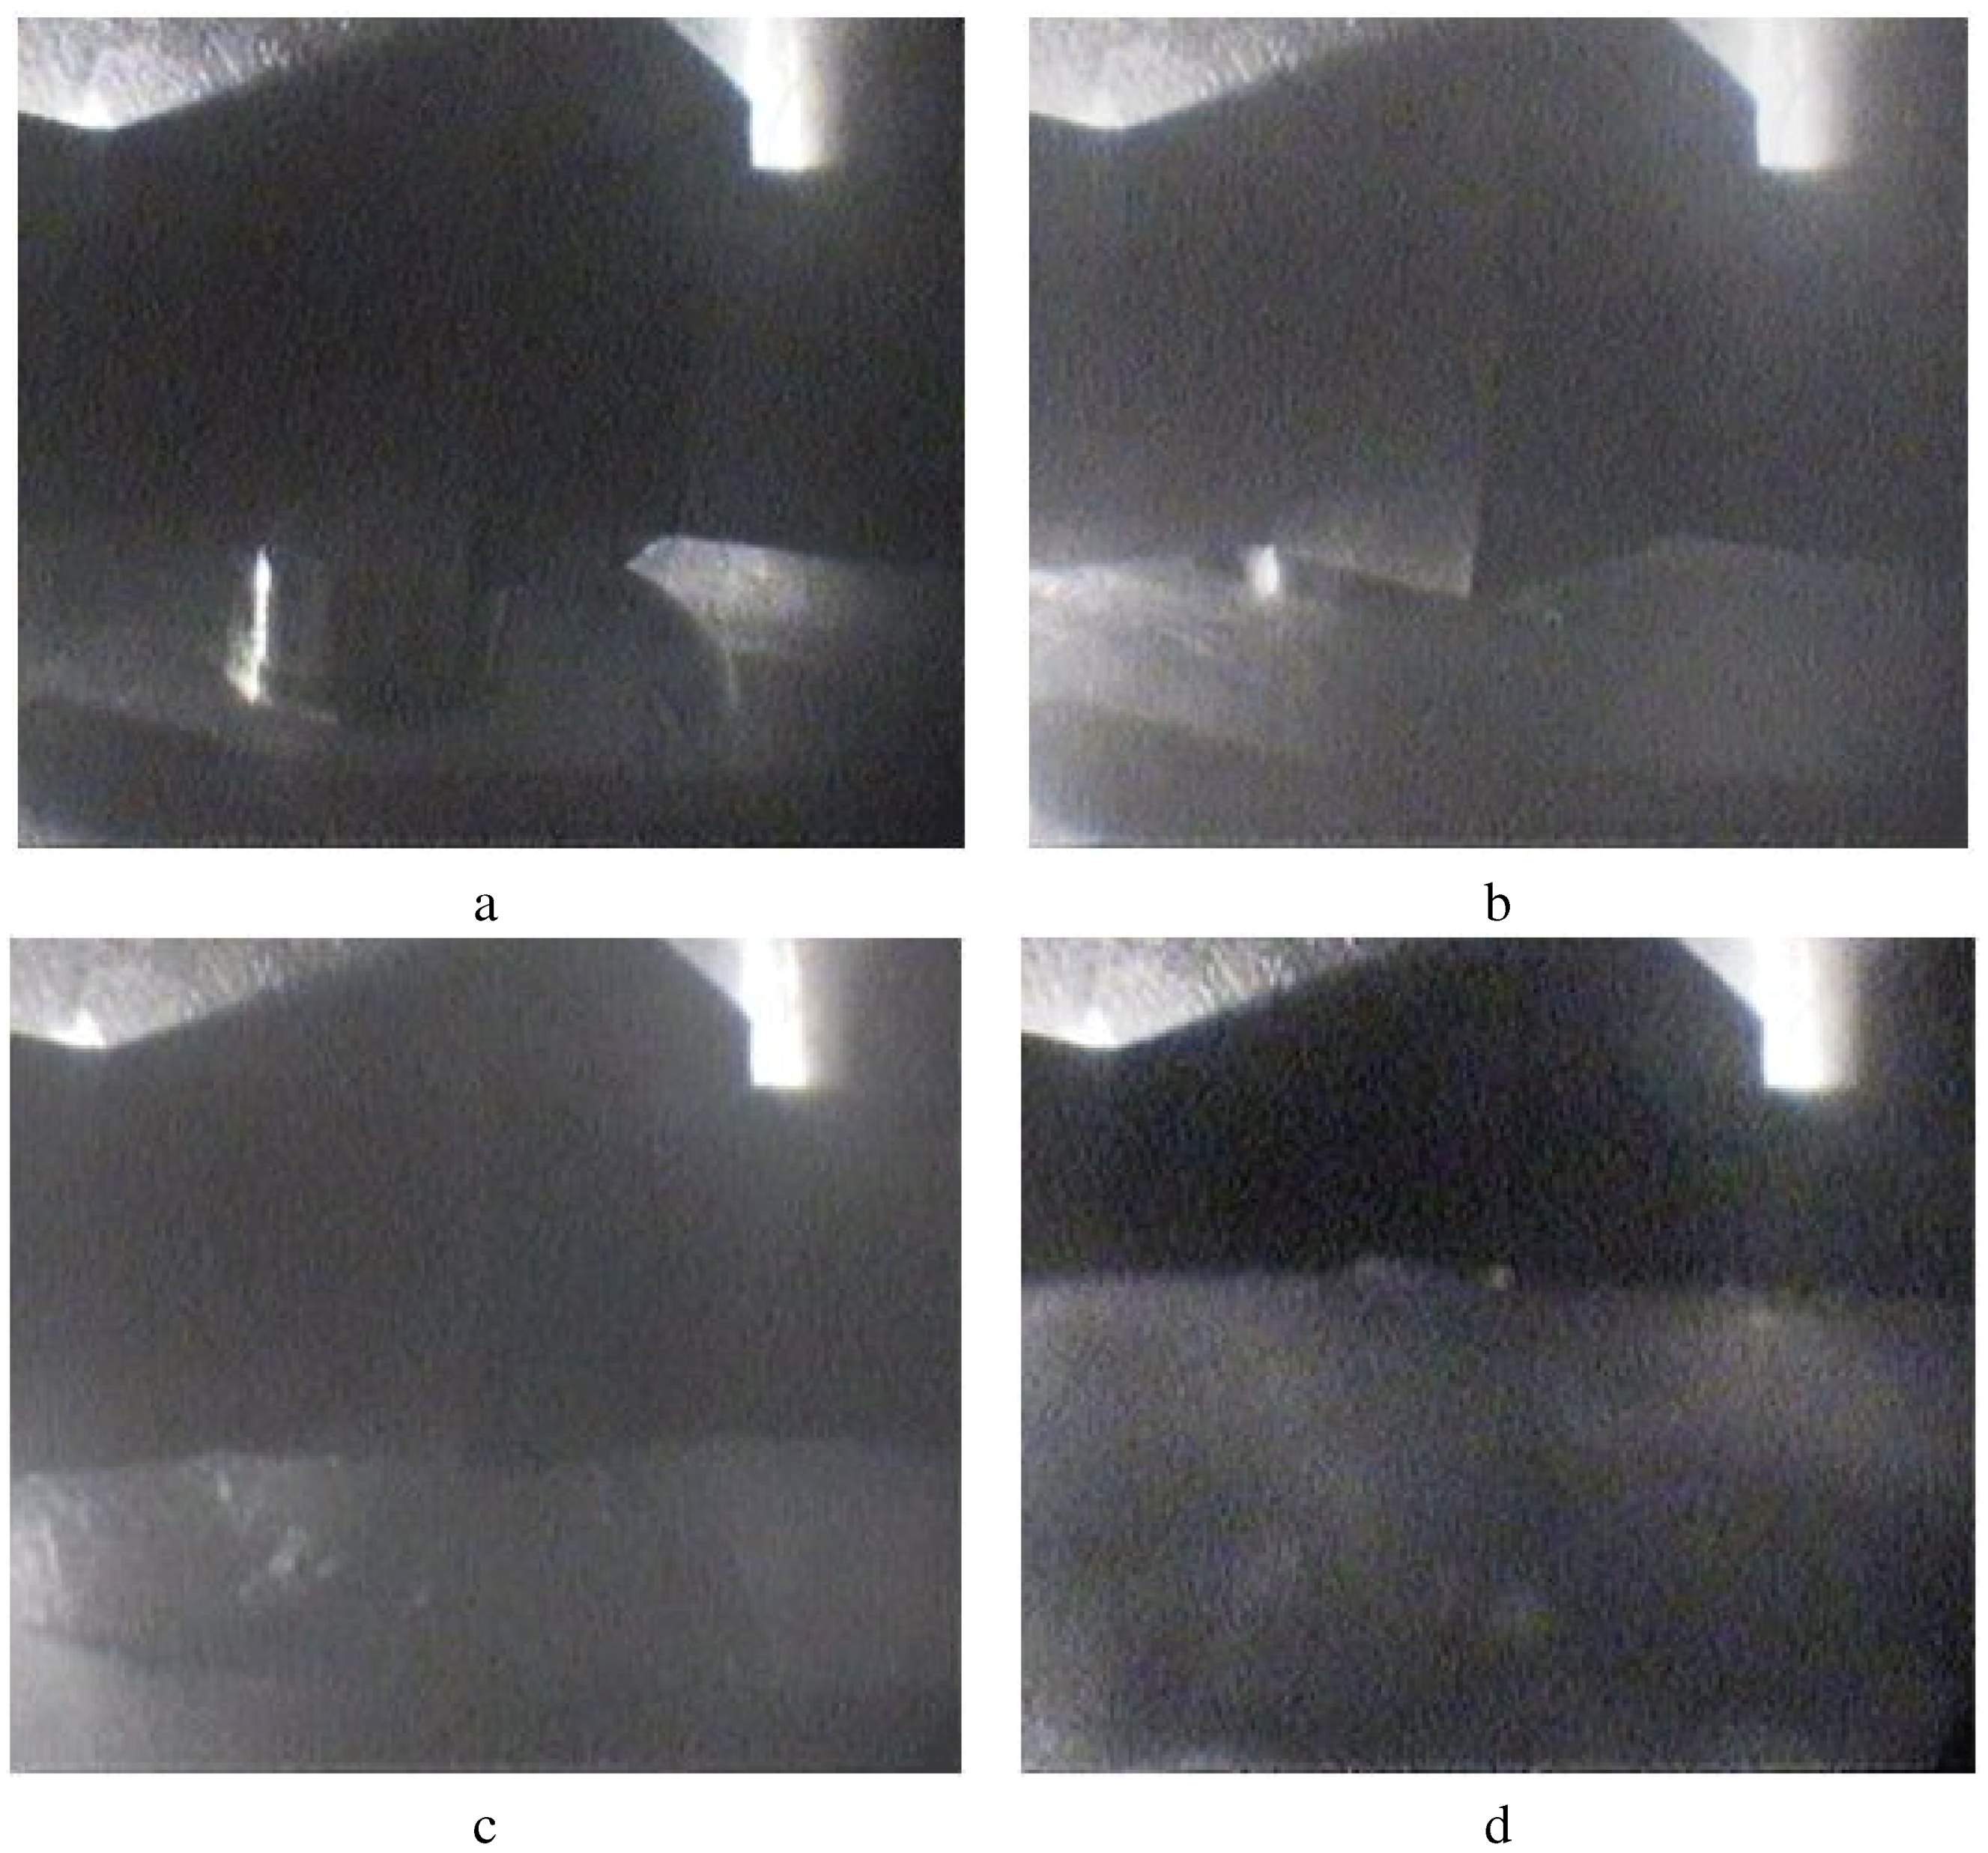
Figure 14a through Figure 14d are still photos from videos starting at the first few minutes of a typical experiment showing the hydrate spray and subsequent deposition over a twenty-five minute period within the 15-Liter Hydrate Cell at Camera 3 CL location, as referenced in Figure 10, above.
Figure 14.
(a) Typical hydrate spray and subsequent hydrate deposition within NETL 15-Liter Hydrate Cell two (2) minutes into experiment–Camera 3 CL in Figure 10, above; (b) Typical hydrate spray and subsequent hydrate deposition within NETL 15-Liter Hydrate Cell ten (10) minutes into experiment–Camera 3 CL in Figure 10, above; (c) Typical hydrate spray and subsequent hydrate deposition within NETL 15-Liter Hydrate Cell fifteen (15) minutes into experiment–Camera 3 CL Figure 10, above; (d) Typical hydrate spray and subsequent hydrate deposition within NETL 15-Liter Hydrate Cell twenty-five (25) minutes into experiment–Camera 3 CL in Figure 10, above.
3. Conclusions
Numerous experiments were performed on a variety of NETL nozzle designs under different operating conditions to investigate and subsequently develop techniques to rapidly and continuously form gas hydrates. While monitoring every temperature and pressure condition and flow rates of both water and methane, calculations have shown methane uptake was greater than 80% during the most successful rapid hydrate formation experiments. Furthermore, multiple Raman Spectroscopy analyses were conducted on samples collected during all experiments. These analyses confirm the formation of methane hydrate under the specified test conditions. The results have shown rapid and continuous formation of methane hydrates is possible utilizing novel nozzle designs under narrow hydrate forming temperature and pressure conditions. These results also show a different perspective or unconventional method for the formation of gas hydrates as posed to conventional wisdom associated with natural and synthetic gas hydrate formation studies conducted over the past few decades [4,5].
While these results are encouraging, there is still a need for additional research efforts in the area of rapid formation of gas hydrates utilizing these concepts/methods.
Areas for further R&D efforts include the following:
- Optimize droplet and bubble sizes through improved atomization for subsequent hydrate formation.
- Optimize methane-to-water flow for maximum methane uptake (>90%) while reducing excess water.
- Utilize other NETL in situ droplet characterization techniques (i.e., bubble and water droplet sizes, velocities, transition from gas-water mixtures to hydrate, etc.), to prove the proposed theories associated with internal and external atomization.
- Determine best practices for in situ Raman Spectroscopy Analysis.
- Optimize heat removal during hydrate formation while investigating and quantifying the full contribution, if any of the Joule-Thomson Effect.
- Investigate additional methods for improve rapid hydrate formation.
- Design efforts for an overall rapid gas hydrate process to compete or replace current natural gas storage and transportation techniques from stranded gas reserves.
- Perform economic analyses for rapid gas hydrate formation processes comparing them to current storage and transport techniques.
Acknowledgements
The authors would like to thank the assistance of the following: Christopher Matranga and Jonathan Lekse for all the Raman Spectroscopy analyses they performed; Alfred Unione and Thomas Kalapos from Parsons for their contributions during the 15-Liter Hydrate Cell experiments; and Catherine Madden, ORISE Intern for her contributions during the 100 mL Hydrate Cell experiments.
Disclaimer
Reference in this report to any specific commercial product, process, or service is to facilitate understanding and does not necessarily imply its endorsement or favoring by the United States Department of Energy.
References and Notes
- Radler, M. New estimates boost worldwide oil, gas reserves. Oil Gas J. 2008, 106, 20–23. [Google Scholar]
- Mid-Term Natural Gas Supply: Analysis of LNG Import. In Natural Gas Markets: Mid-Term Prospects for Natural Gas Supply; SR-OIAF/2001-06; Energy Information Administration, Office of Integrated Analysis and Forecasting, U.S. Department of Energy: Washington, DC, USA, 2001; Available online: http://www.eia.doe.gov/oiaf/servicerpt/natgas/chapter3.html; http://www.eia.doe.gov/oiaf/servicerpt/natgas/pdf/tbl7.pdf; (Accessed on 7 June 2010).
- Bird, K.J.; Charpentier, R.R.; Gautier, D.L.; Houseknecht, D.W.; Klett, T.R.; Pitman, J.K.; Moore, T.E.; Schenk, C.J.; Tennyson, M.E.; Wandrey, C.J. Circum-Arctic Resource Appraisal: Estimates of Undiscovered Oil and Gas North of the Arctic Circle: U.S. Geological Survey, 2008; U.S. Geological Survey Fact Sheet 2008-3049; U.S. Department of the Interior, U.S. Geological Survey: Denver, CO, USA. Available online: http://pubs.usgs.gov/fs/2008/3049/ (Accessed on 7 June 2010).
- Sloan, E.D., Jr.; Koh, C. Clathrate Hydrates of Natural Gases; 3rd Edition; CRC Press, Taylor & Francis Group, LLC: Boca Raton, FL, USA, 2008. [Google Scholar]
- Taylor, C.E.; Kwan, J.T. Advances in the Study of Gas Hydrates; Kluwer Academic/Plenum Publishers: New York, NY, USA, 2004. [Google Scholar]
- Moridis, G.; Lawrence Berkeley National Laboratory, Berkeley, CA, USA. Private communication, 2005.
- Sloan, E.D.; Koh, C.A.; Sum, A.K. Workshop notebook on Natural Gas Hydrates in Flow Assurance. Colorado School of Mines: Golden, CO, USA, 10–12 June 2009. [Google Scholar]
- Chacin, M.C.G.; Hughes, R.G.; Civan, F.; Taylor, C.E. Phenomenological modeling of hydrate formation and dissociation. In Advances in the Study of Gas Hydrates; Taylor, C.E., Kwan, J.T., Eds.; Kluwer Academic/Plenum Publishers: New York, NY, USA, 2004; pp. 27–38. [Google Scholar]
- Taylor, C.E.; Link, D.D.; English, N. Methane hydrate research at NETL: Research to make methane production from hydrates a reality. J. Pet. Sci. Engineering 2007, 56, 186–191. [Google Scholar] [CrossRef]
- Chapoy, A.; Mohammadi, A.H.; Richon, D.; Tohidi, B. Gas solubility measurement and modeling for methane–water and methane–ethane–n-butane–water systems at low temperature conditions. Fluid Phase Equilibria 2004, 220, 111–119. [Google Scholar] [CrossRef]
- Song, K.Y.; Feneyrou, G.; Fleyfel, F.; Martin, R.; Lievois, J.; Kobayashi, R. Solubility measurements of methane and ethane in water at and near hydrate conditions. Fluid Phase Equilibria 1997, 128, 249–260. [Google Scholar] [CrossRef]
- Feneyrou, G. Elucidation of the Formation and Decomposition of Clathrate Hydrates of Natural Gases through Gas Solubility Measurements. M.S. Thesis, Rice University, Houston, TX, USA, 1996. [Google Scholar]
- Besnard, G. Thermodynamics and Kinetics Studies of Formation and Decomposition of Clathrates Hydrates of Methane, Carbon Dioxide and Their Mixtures using a Differential Heat Flux Calorimeter. M.S. Thesis, Rice University, Houston, TX, USA, 1997. [Google Scholar]
- Servio, P.; Englezos, P. Measurement of dissolved methane in water in equilibrium with its hydrate. J. Chem. Eng. 2002, 47, 87–90. [Google Scholar]
- Welander, P.; Vincent, T.L. Designing and optimizing gas/liquid reactions for: Environmental processes/chemical reactions/heat transfer. Brochure from Exhibition at the Chem Show: New York, NY, USA, 1999. [Google Scholar]
- Mori, Y.H.; Mochizuki, T. Mass transport across clathrate hydrate films–A capillary permeation model. Chem. Eng. Sci. 1997, 52, 3613–3616. [Google Scholar] [CrossRef]
- Kobayashi, I.; Ito, Y.; Mori, Y.H. Microscopic observations of clathrate-hydrate films formed at liquid/liquid interfaces. I. Morphology of hydrate films. Chem. Eng. Sci. 2001, 56, 4331–4338. [Google Scholar] [CrossRef]
- Servio, P.; Englezos, P. Morphology of methane and carbon dioxide hydrates formed from water droplets. AIChE J. 2003, 49, 269–276. [Google Scholar] [CrossRef]
- Lee, J.D.; Susilo, R.; Englezos, P. Methane-ethane and methane-propane hydrate formation and decomposition on water droplets. Chem. Eng. Sci. 2005, 60, 4203–4212. [Google Scholar] [CrossRef]
© 2010 by the authors; licensee MDPI, Basel, Switzerland. This article is an open access article distributed under the terms and conditions of the Creative Commons Attribution license (http://creativecommons.org/licenses/by/3.0/).
Share and Cite
MDPI and ACS Style
Brown, T.D.; Taylor, C.E.; Bernardo, M.P. Rapid Gas Hydrate Formation Processes: Will They Work? Energies 2010, 3, 1154-1175. https://doi.org/10.3390/en3061154
AMA Style
Brown TD, Taylor CE, Bernardo MP. Rapid Gas Hydrate Formation Processes: Will They Work? Energies. 2010; 3(6):1154-1175. https://doi.org/10.3390/en3061154
Chicago/Turabian StyleBrown, Thomas D., Charles E. Taylor, and Mark P. Bernardo. 2010. "Rapid Gas Hydrate Formation Processes: Will They Work?" Energies 3, no. 6: 1154-1175. https://doi.org/10.3390/en3061154