1. Introduction
Electricity supply networks are subject to various disturbances depending on the potential of production, atmospheric conditions, and industrial loads which affect them during the transportation and distribution of the energy produced. The control and management of these factors are of primary importance for reliability, availability, maintainability and efficiency of the network, as well as for the safety of persons and property. The power network supervision and control in most developing countries is manual. This method has a high annual rate of power failure (more than 10%) as compared to the rate of power failure in developed countries (less than 5%) [
1] which use an artificial intelligence- based method .
Studies made on the AES-SONEL electric power distribution network, with a focus on the lower network of the Ngousso station (Yaounde, Cameroon) during the period from June 2005 to April 2006, show that:
- i)
the company recorded 131,544 kWh of undistributed energy
- ii)
the D113 circuit breaker tripped 20 times during this period
- iii)
this led to 120 hours of power cuts, an average of 6 hours per power cut [
2].
According to the data experimentally collected by the Network Load-dispatching Centre (NLC), there is typically a time lapse of between 50 minutes to 2 hours from the detection of the fault to the beginning of the search for a solution. In the case of loss of phase, it is usually customers who inform the NLC of the cut [
3]. As for the duration of the search for a fault, this depends on the distance from the sub-station to the location of the fault, since the search is done manually. It also depends on the time of day when the fault occurs. To ensure power availability throughout the network and at all times, AES-SONEL should have a reliable system for the control and management of these faults. This availability requires a reliable system of diagnosis which is an important first step to detection and localisation of faults. Such a system will be of paramount importance in contributing to early and rapid detection, improving availability and productivity of the network equipment as well as the profitability of capital invested [
4].
The purpose of this research is to design an automatic system for the diagnosis of failures on the MV distribution network on the lower part of the Ngousso sub-station. After listing the various potential faults in the electric power network, a tool is proposed for their identification. This is followed by a proposal of an automatic system for the detection and localization of faults as well as the results obtained during system implementation.
2. Types of Faults, Characteristic Network Parameters and Identification of Faults on Electric Power Networks
The various types of faults common in electric power networks are listed and the algorithms for the monitoring of characteristic network parameters are explained.
2.1. Various types of faults
A fault occurs when there is a discrepancy between the reference value and the measured value for any given network parameter [
5]. In this regard, the electric power network is subjected to four main types of faults: short-circuits, over voltages, overloads and line ruptures (loss of phase).
A Short-circuit is the contact between two live conductors or between a live conductor and the earth conductor. It results in a rapid flow of current between the source and the fault. This current is limited only by the impedance of the line.
An Over voltage is any disturbance superimposed on the nominal voltage of the network, and can appear either between phases or between a phase and earth. The operating mode of the surge arresters gives rise to a high flow of current.
An Overload is generally due to power demand by the load which is more than the rated capacity of the line. Overload does not always lead to tripping of the circuit breaker because certain overloads are tolerated for reasons of the continuity of supply. For the distribution network, the acceptable level of overload is 140% during 0.3 s. Overloads can be detected by the measurement of the forwarded power. Since the network voltage is fixed, an overload on the network is equivalent to an overflow of an over current.
A Loss of phase occurs when a live phase ruptures. If the part under voltage touches another live wire or earth, then we have a short-circuit. The identification of these faults relies on two guiding principles: recording data on the networks, analyzing them, and then drawing conclusions about the state of the network.
2.2. Collecting characteristic parameters of the network
With the help of current and voltage transformers, samples are taken at a specific point of the network, at predetermined intervals. According to Shannon’s theorem, a sampling rate that is at least equal to twice the frequency of the original signal is good enough.
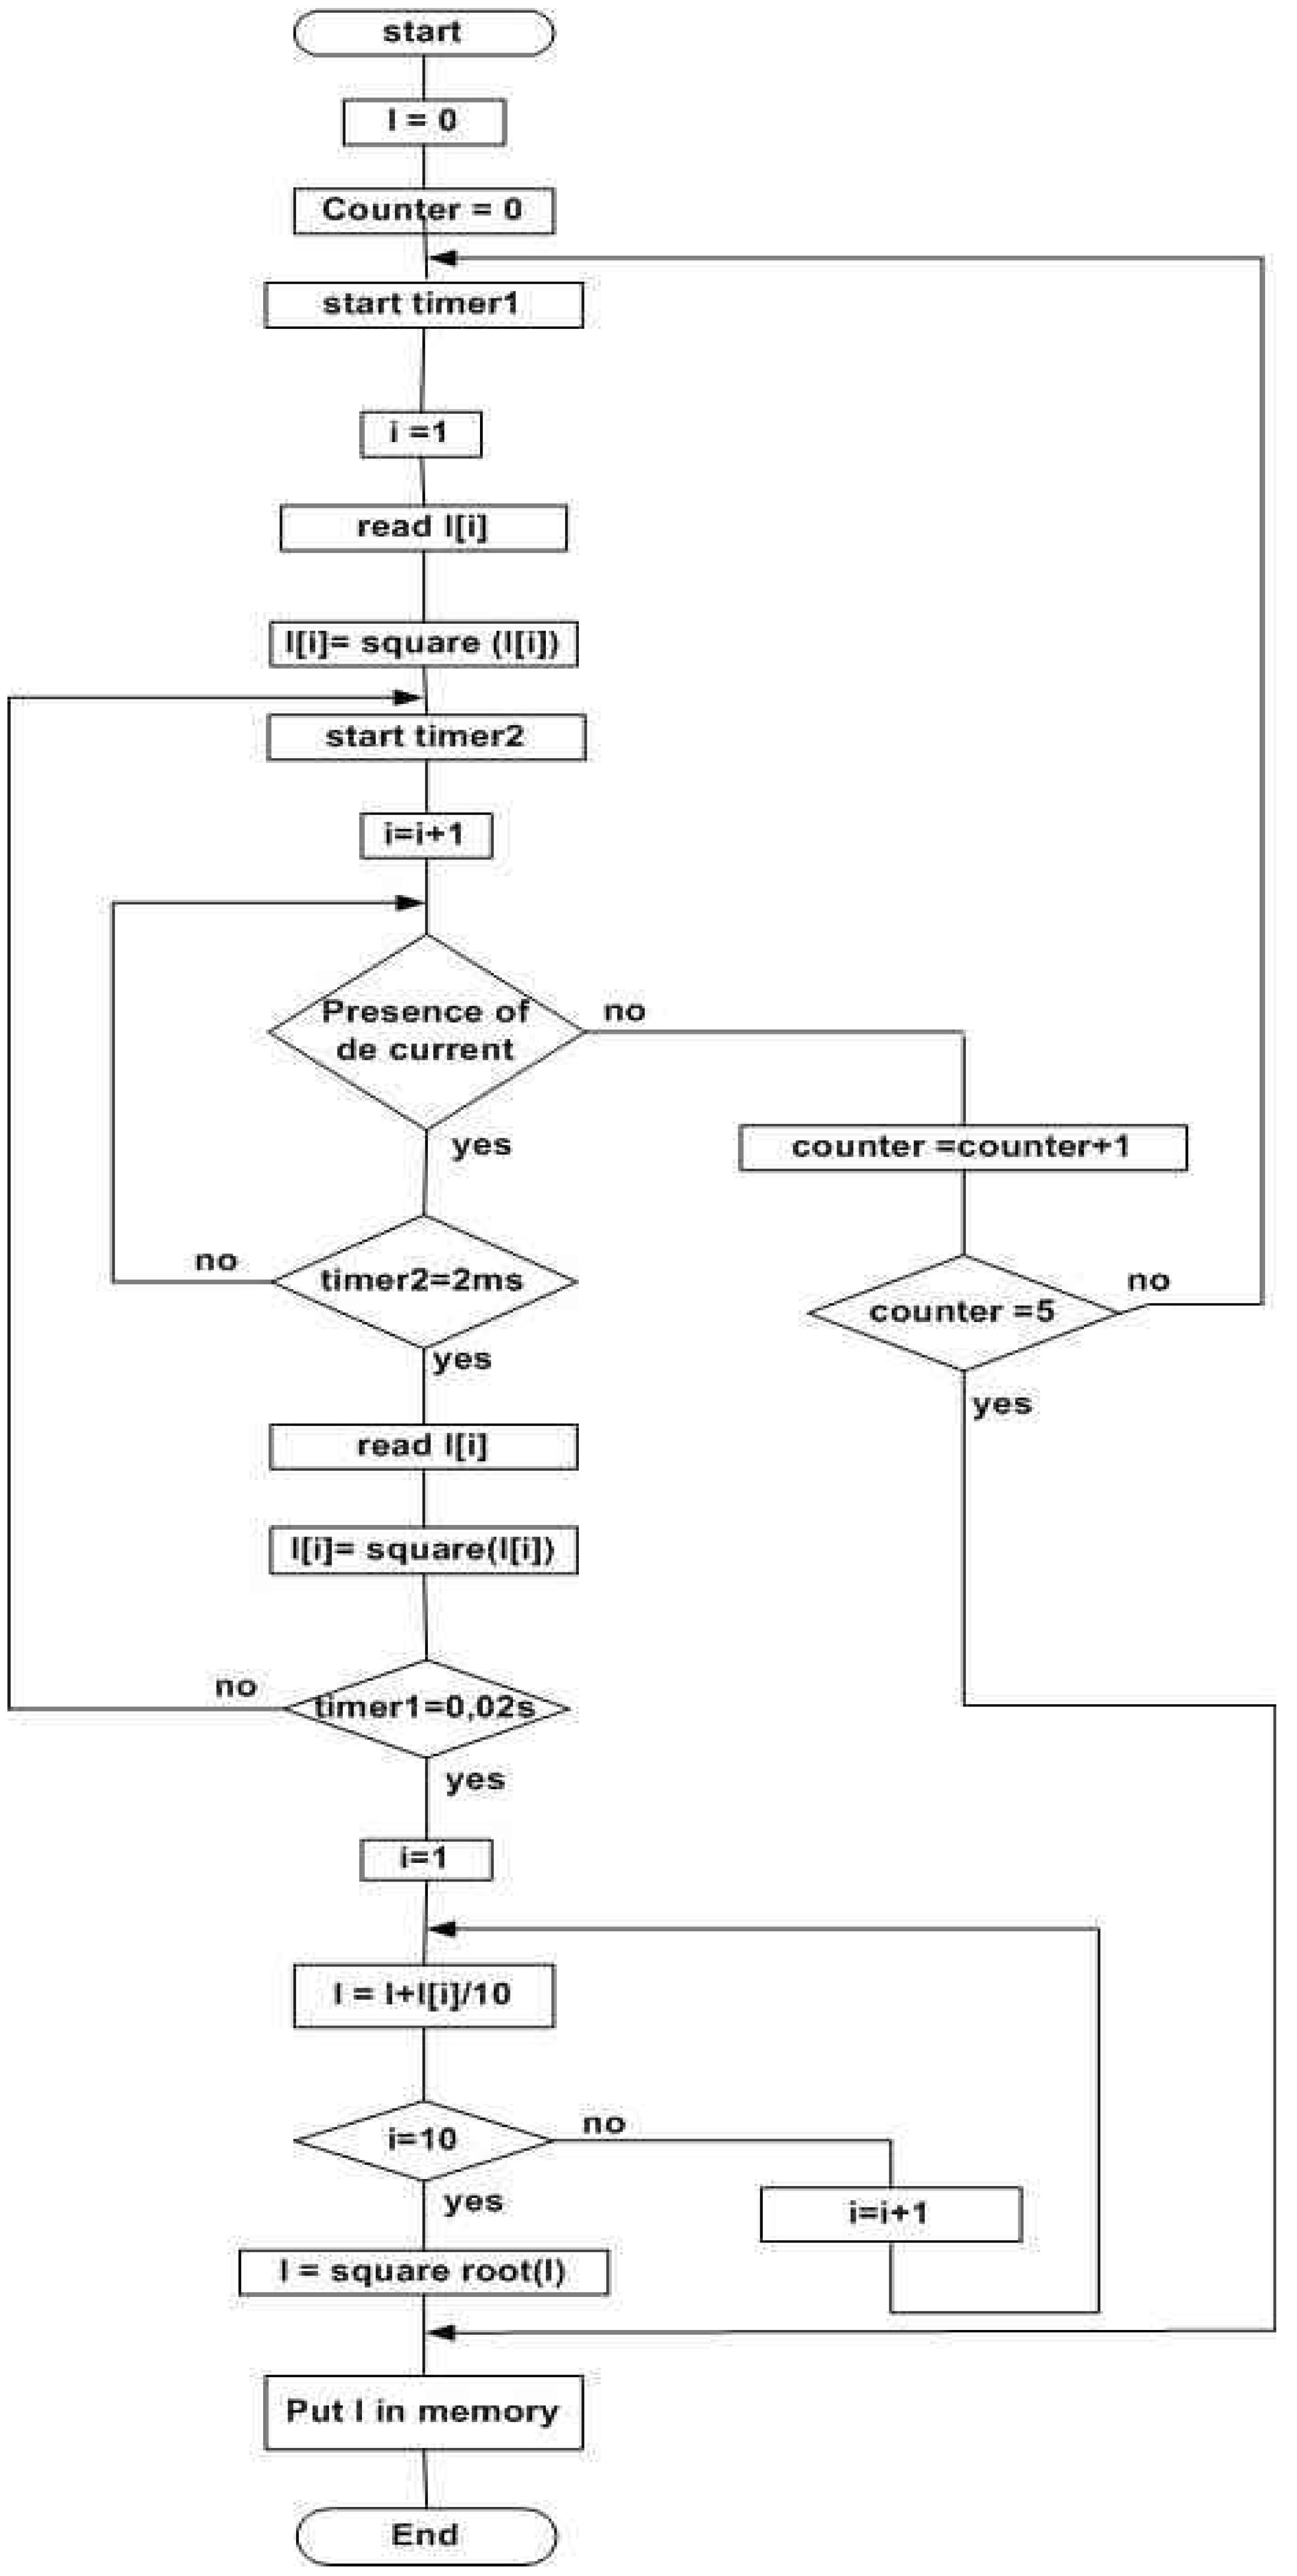
The voltage between phases is sampled as follows: the effective value of the voltage is obtained by getting the average of the squares of samples taken at regular intervals. Then the square root of this average is calculated. A sample is taken every 20/N ms, the square is calculated and kept in memory. After 20 ms, which corresponds to one period, the average of all the samples taken is calculated, then the square root of this average gives us an approximate value of the effective phase-to-phase voltage. For N=10 and the following table can be obtained:
Table 1.
Evaluation of the effective value of phase-to-phase voltage using voltage samples taken every 2 ms.
Table 1.
Evaluation of the effective value of phase-to-phase voltage using voltage samples taken every 2 ms.
| I | 1 | 2 | 3 | 4 | 5 | 6 | 7 | 8 | 9 | 10 |
|---|
| U[i] (kV) | 0 | 12,469 | 20,174 | 20,174 | 12,469 | 0 | -12,469 | -20,174 | -20,174 | -12,469 |
| Square (U[i]) | 0 | 155,475 | 406,990 | 406,990 | 155,475 | 0 | 155,475 | 406,990 | 406,990 | 155,475 |
| average | 224,986 | | | | | | | |
| U (kV) | 14,9994 | | | | | | | |
This is within the 5% tolerance rating stipulated by AES SONEL. For a higher degree of accuracy, the sampling interval is fixed at 1 ms, (N=20). The algorithm for the calculation of phase-to-phase voltage is established.
Sampling of phase current I: Given that the current signal period is identical to that of the voltage, the methodology is exactly the same as that used in sampling the voltage. By replacing U with I in the calculation algorithm for the value of U, one obtains the calculation algorithm for the value of I (
Figure A5 in the Appendix).
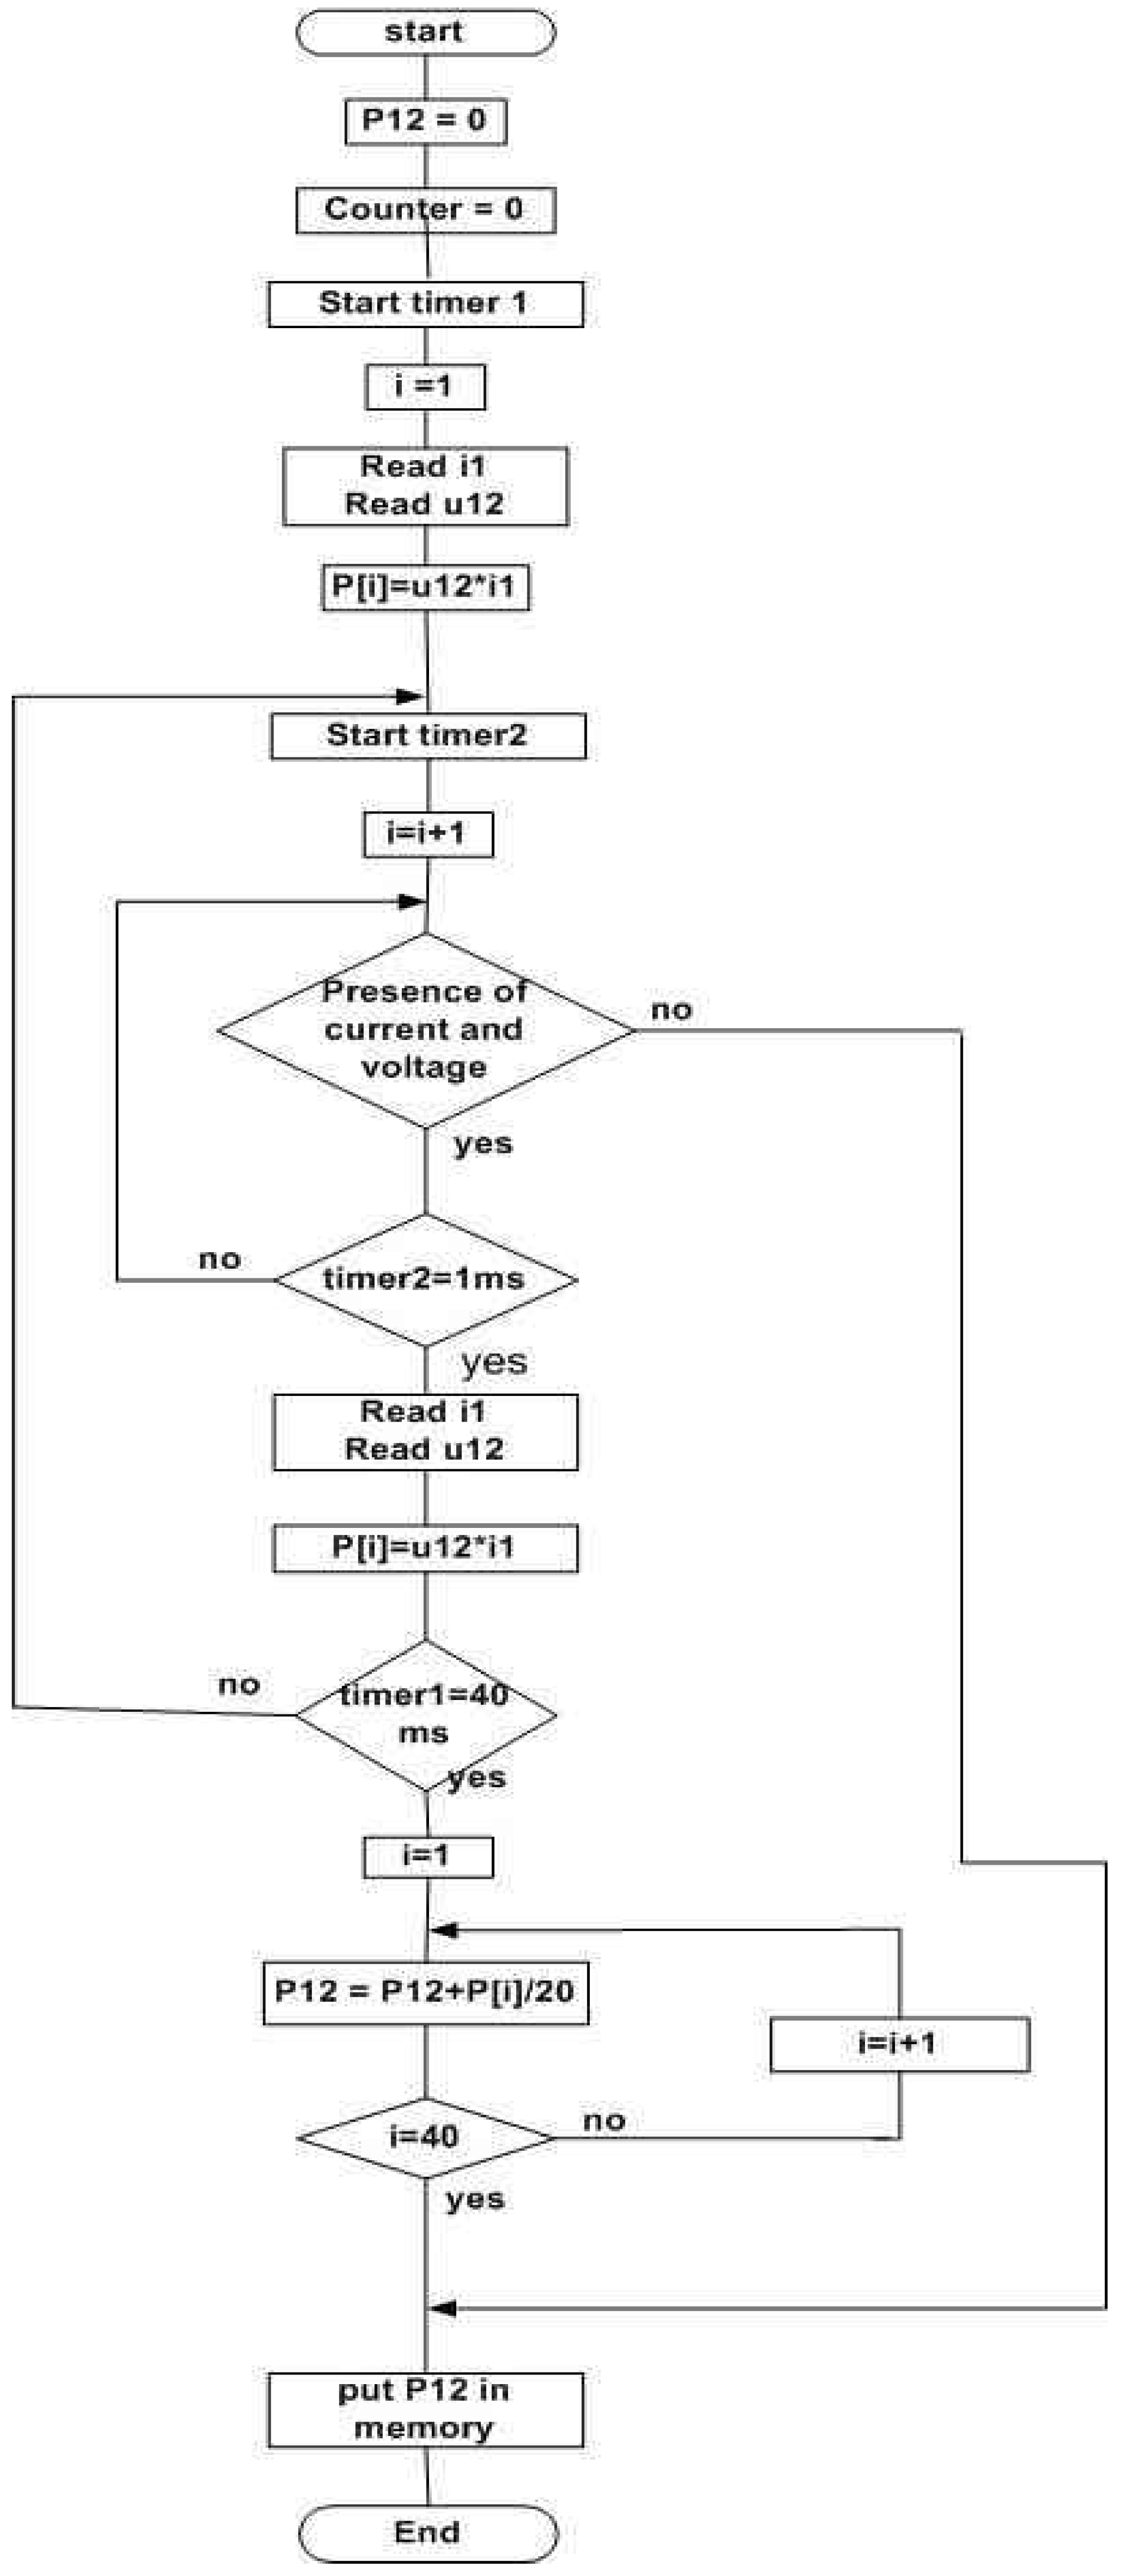
Sampling of active power P: This is a signal with a period of 40 ms. This requires 40 samples of the current and the voltage to be obtained simultaneously. The sampling interval is therefore 1 ms. The sampling method is that of two wattmeters, since the neutral is not being distributed. An approximate value of the active power is given by the average of the products of samples taken. The current is taken on phases 1 and 3. The voltage is taken between phases 1 and 2, then 2 and 3. The power P12 is calculated between phases 1 and 2 and then the power P23 between phases 2 and 3. The power P = P12 + P23. The algorithms for the calculation of P12 and P are established (
Figure A6 of the Appendix).
Sampling of power factor cosφ: This follows from three preceding measurements, if none of them is not zero, because:
The algorithm for the calculation of cosφ is established.
Sampling of apparent power S: This follows from the measurements of P and cos φ
The algorithm of the calculation of S is established.
Once kept in the memory, this data is scrutinized every 20 ms to detect a possible overflow of the pre-set thresholds or an abnormal operation of the installation. The above samplings enable us to identify the faults on the electric power network.
2.3. Identification of faults on electric power network
This identification shall involve faults on overload, homopolar current and the loss of phase.
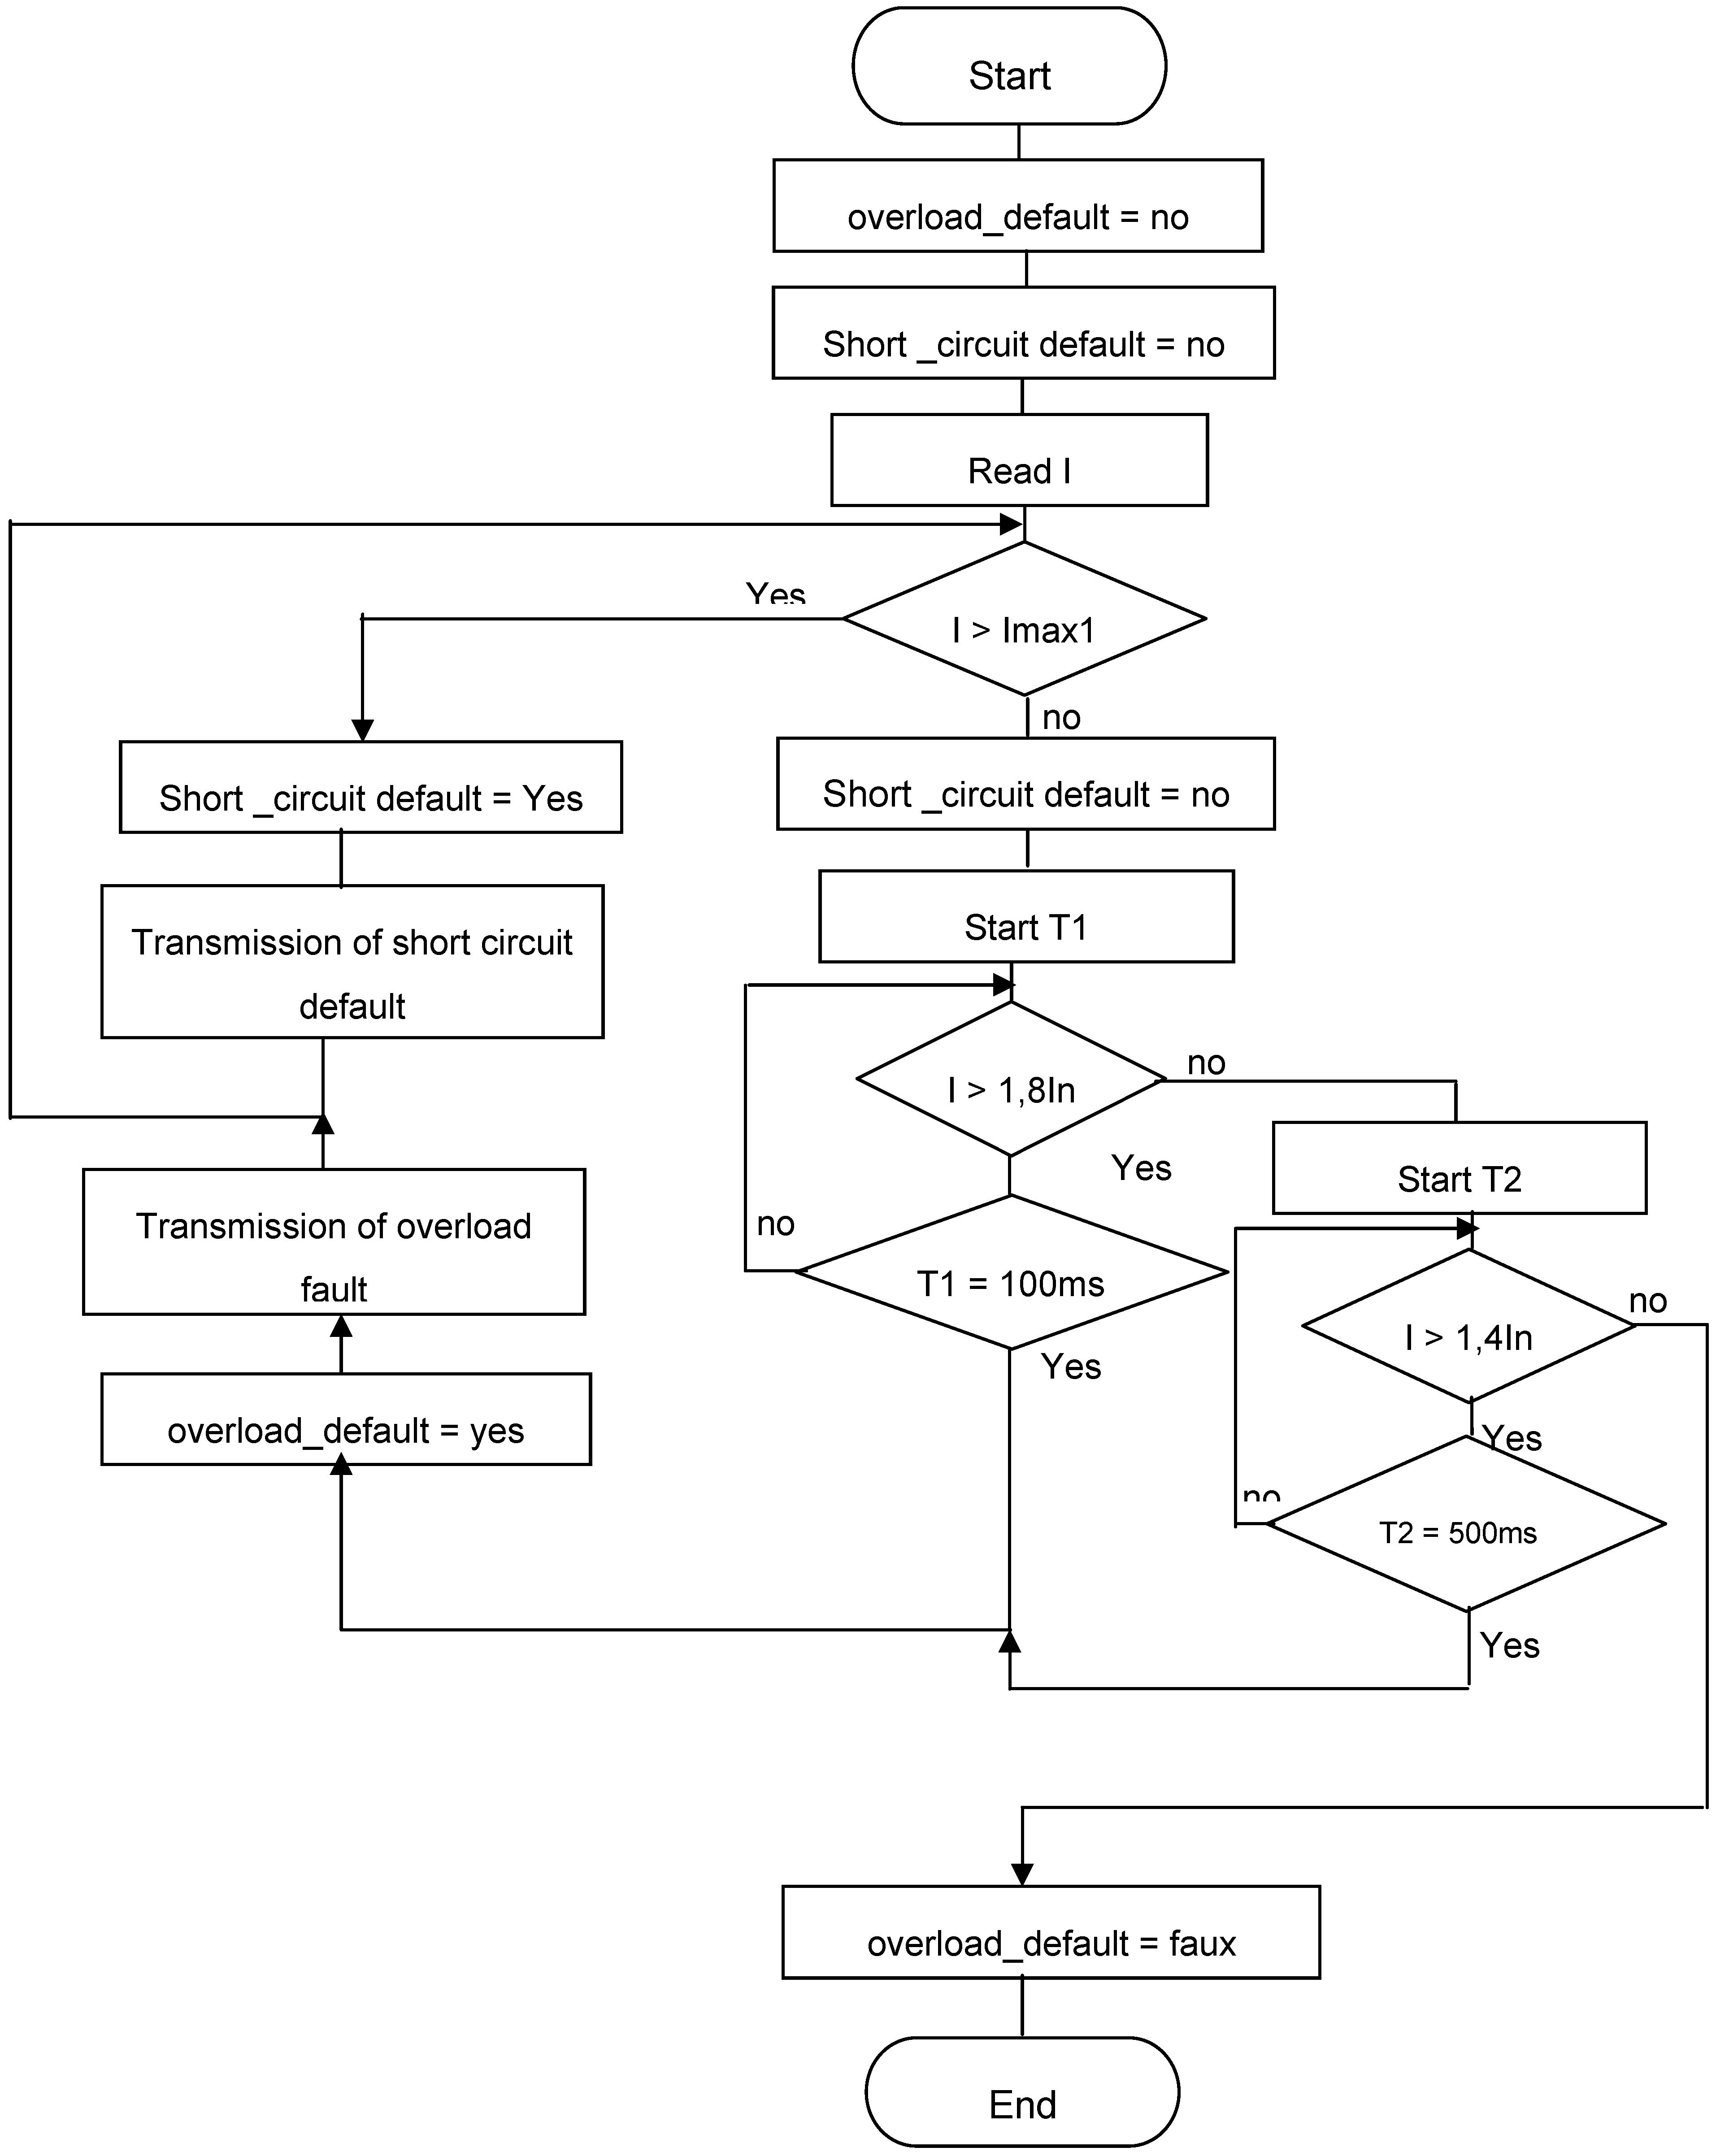
Identifying line overload faults: We must define the various thresholds of current intensity and duration at the end of which a fault indication must be issued. We have three thresholds of overload. The first corresponds to an operating current higher than 140% of the nominal intensity for 500 ms; the second is that in which the current is higher than 180% of the nominal intensity for 100 ms; the third corresponds to the current of minimal short-circuit during an instantaneous time. The algorithm for the identification of an overload fault is shown in
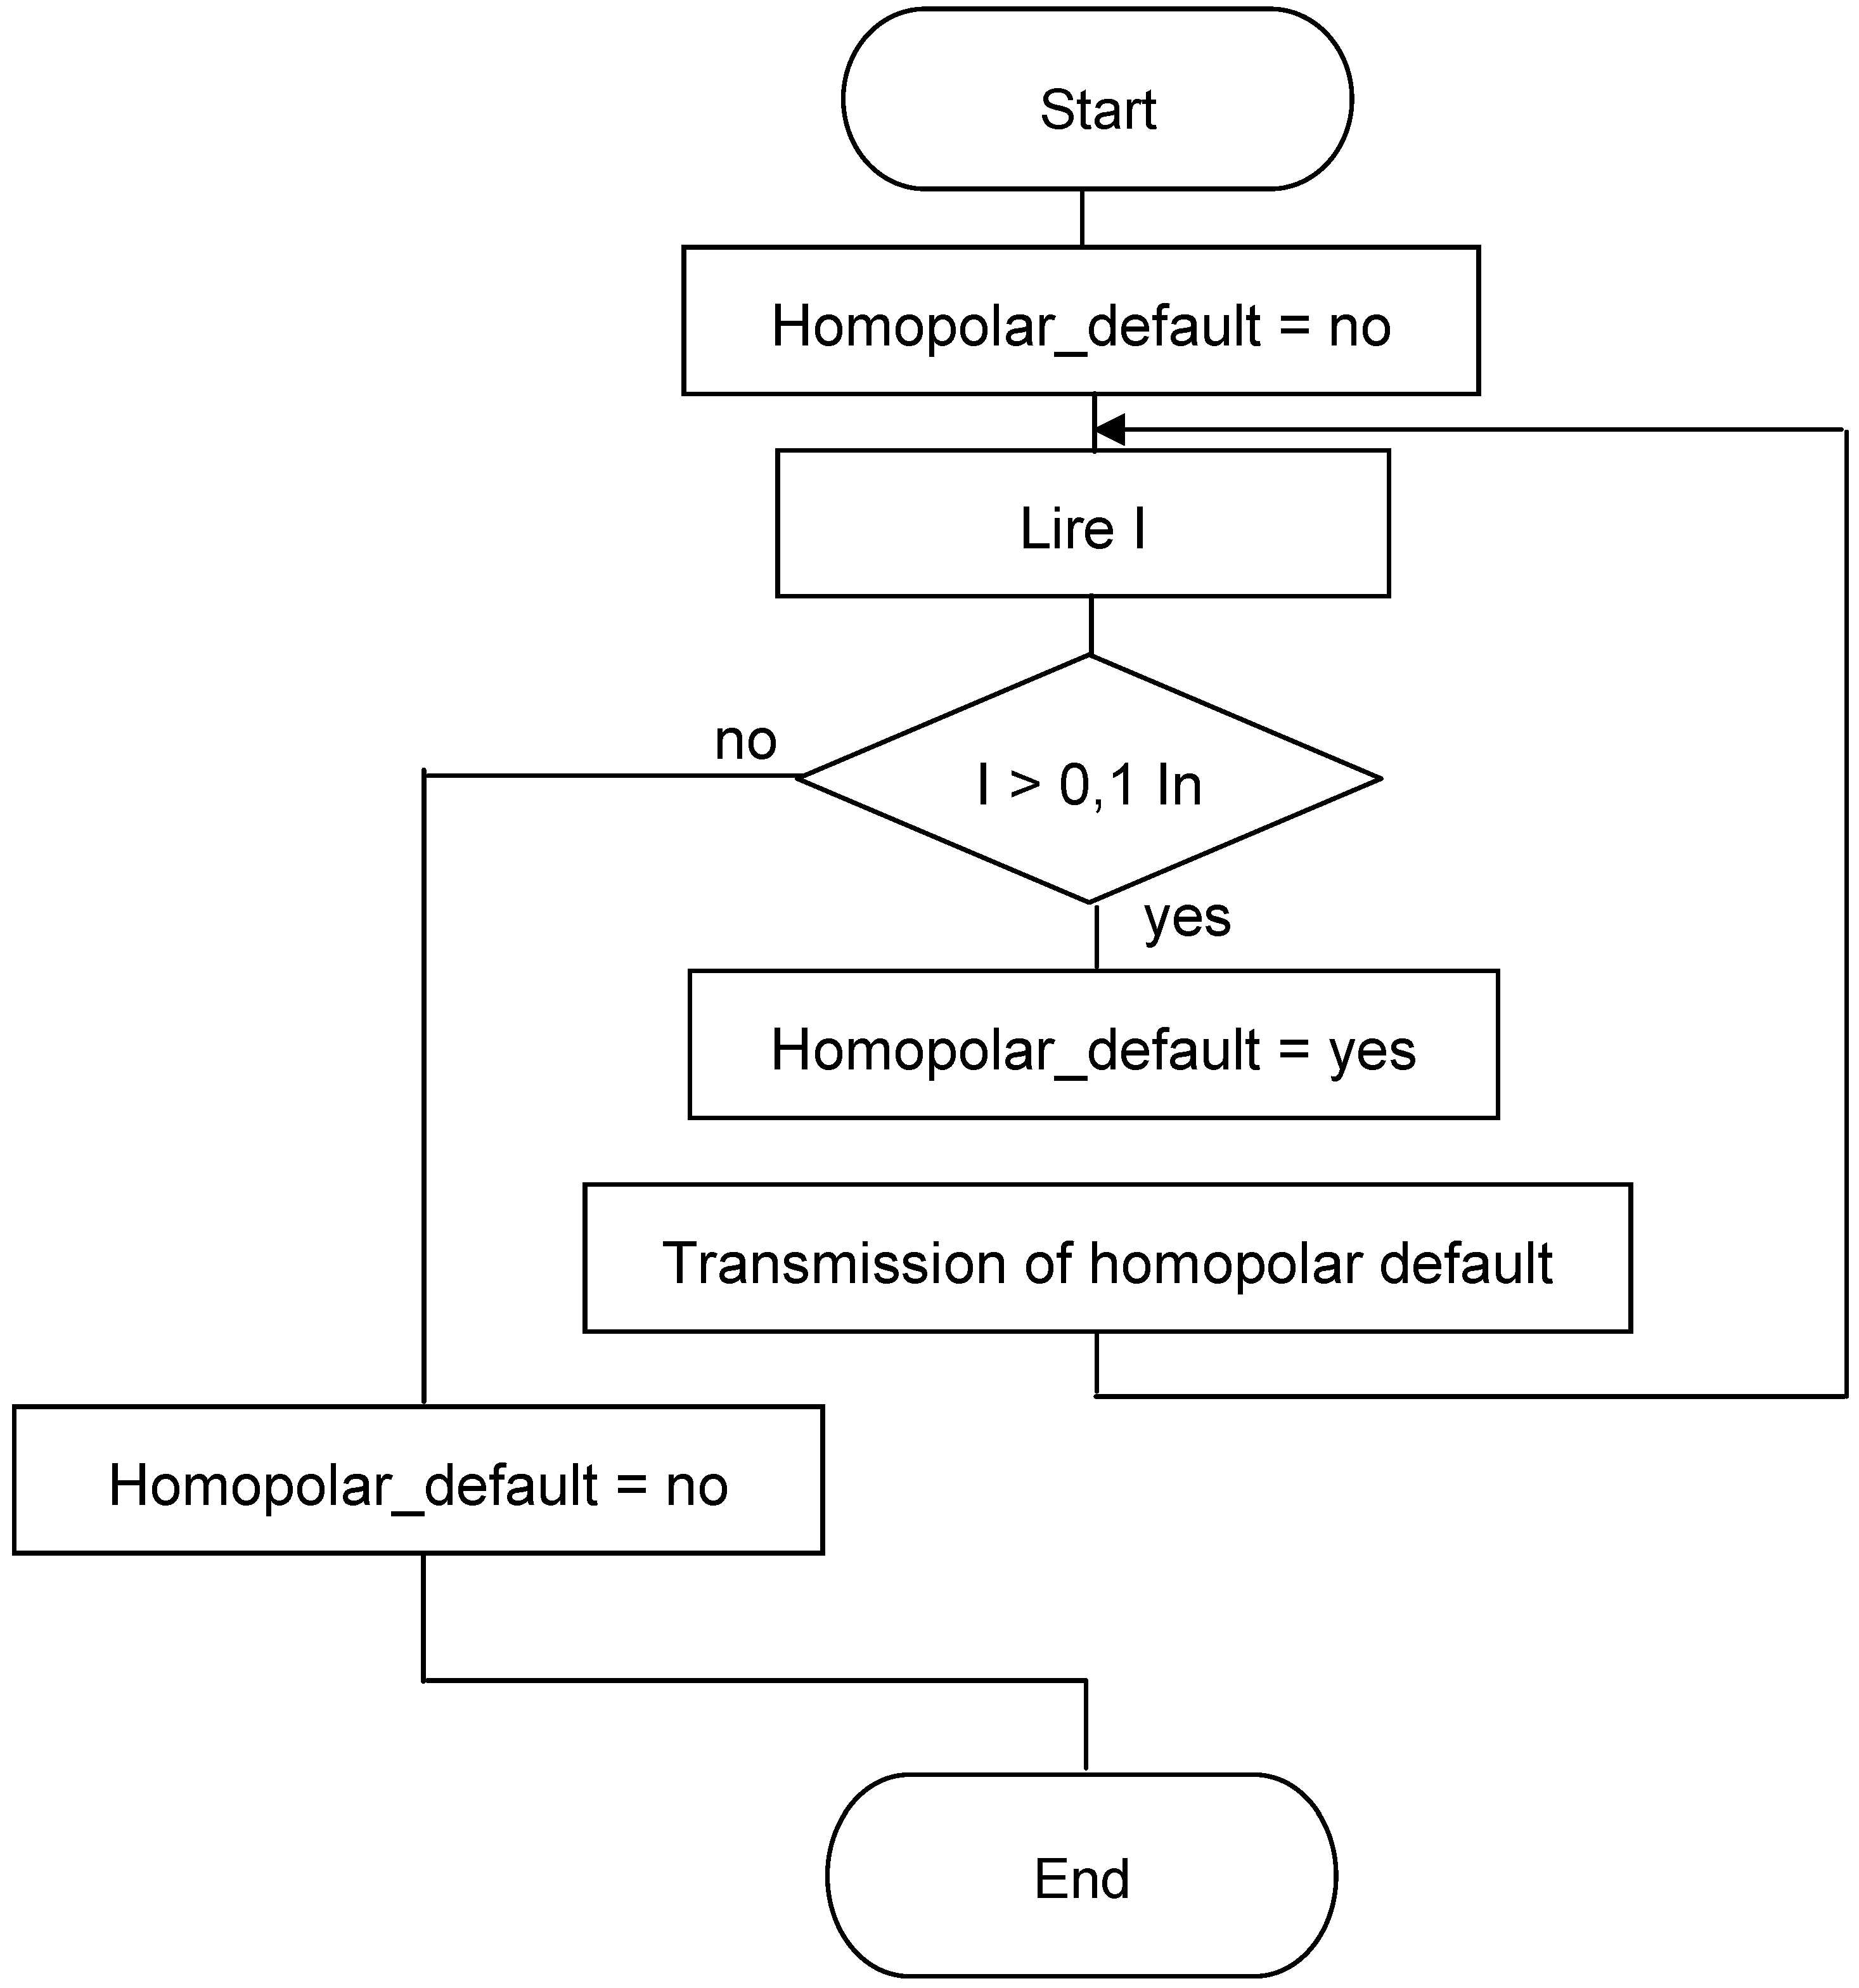
Figure A1 of the appendix Identifying homopolar current faults: Homopolar current is the algebraic sum from the instantaneous values of electrical currents in the three phases. The threshold of the homopolar current is selected between 130% from I
0 and 10% of the nominal phase current. I
0 is the value of the current due to the ground-phase capacitance at the upper level of the network. The algorithm for the identification of homopolar current fault is shown in
Figure A2 of the appendix.
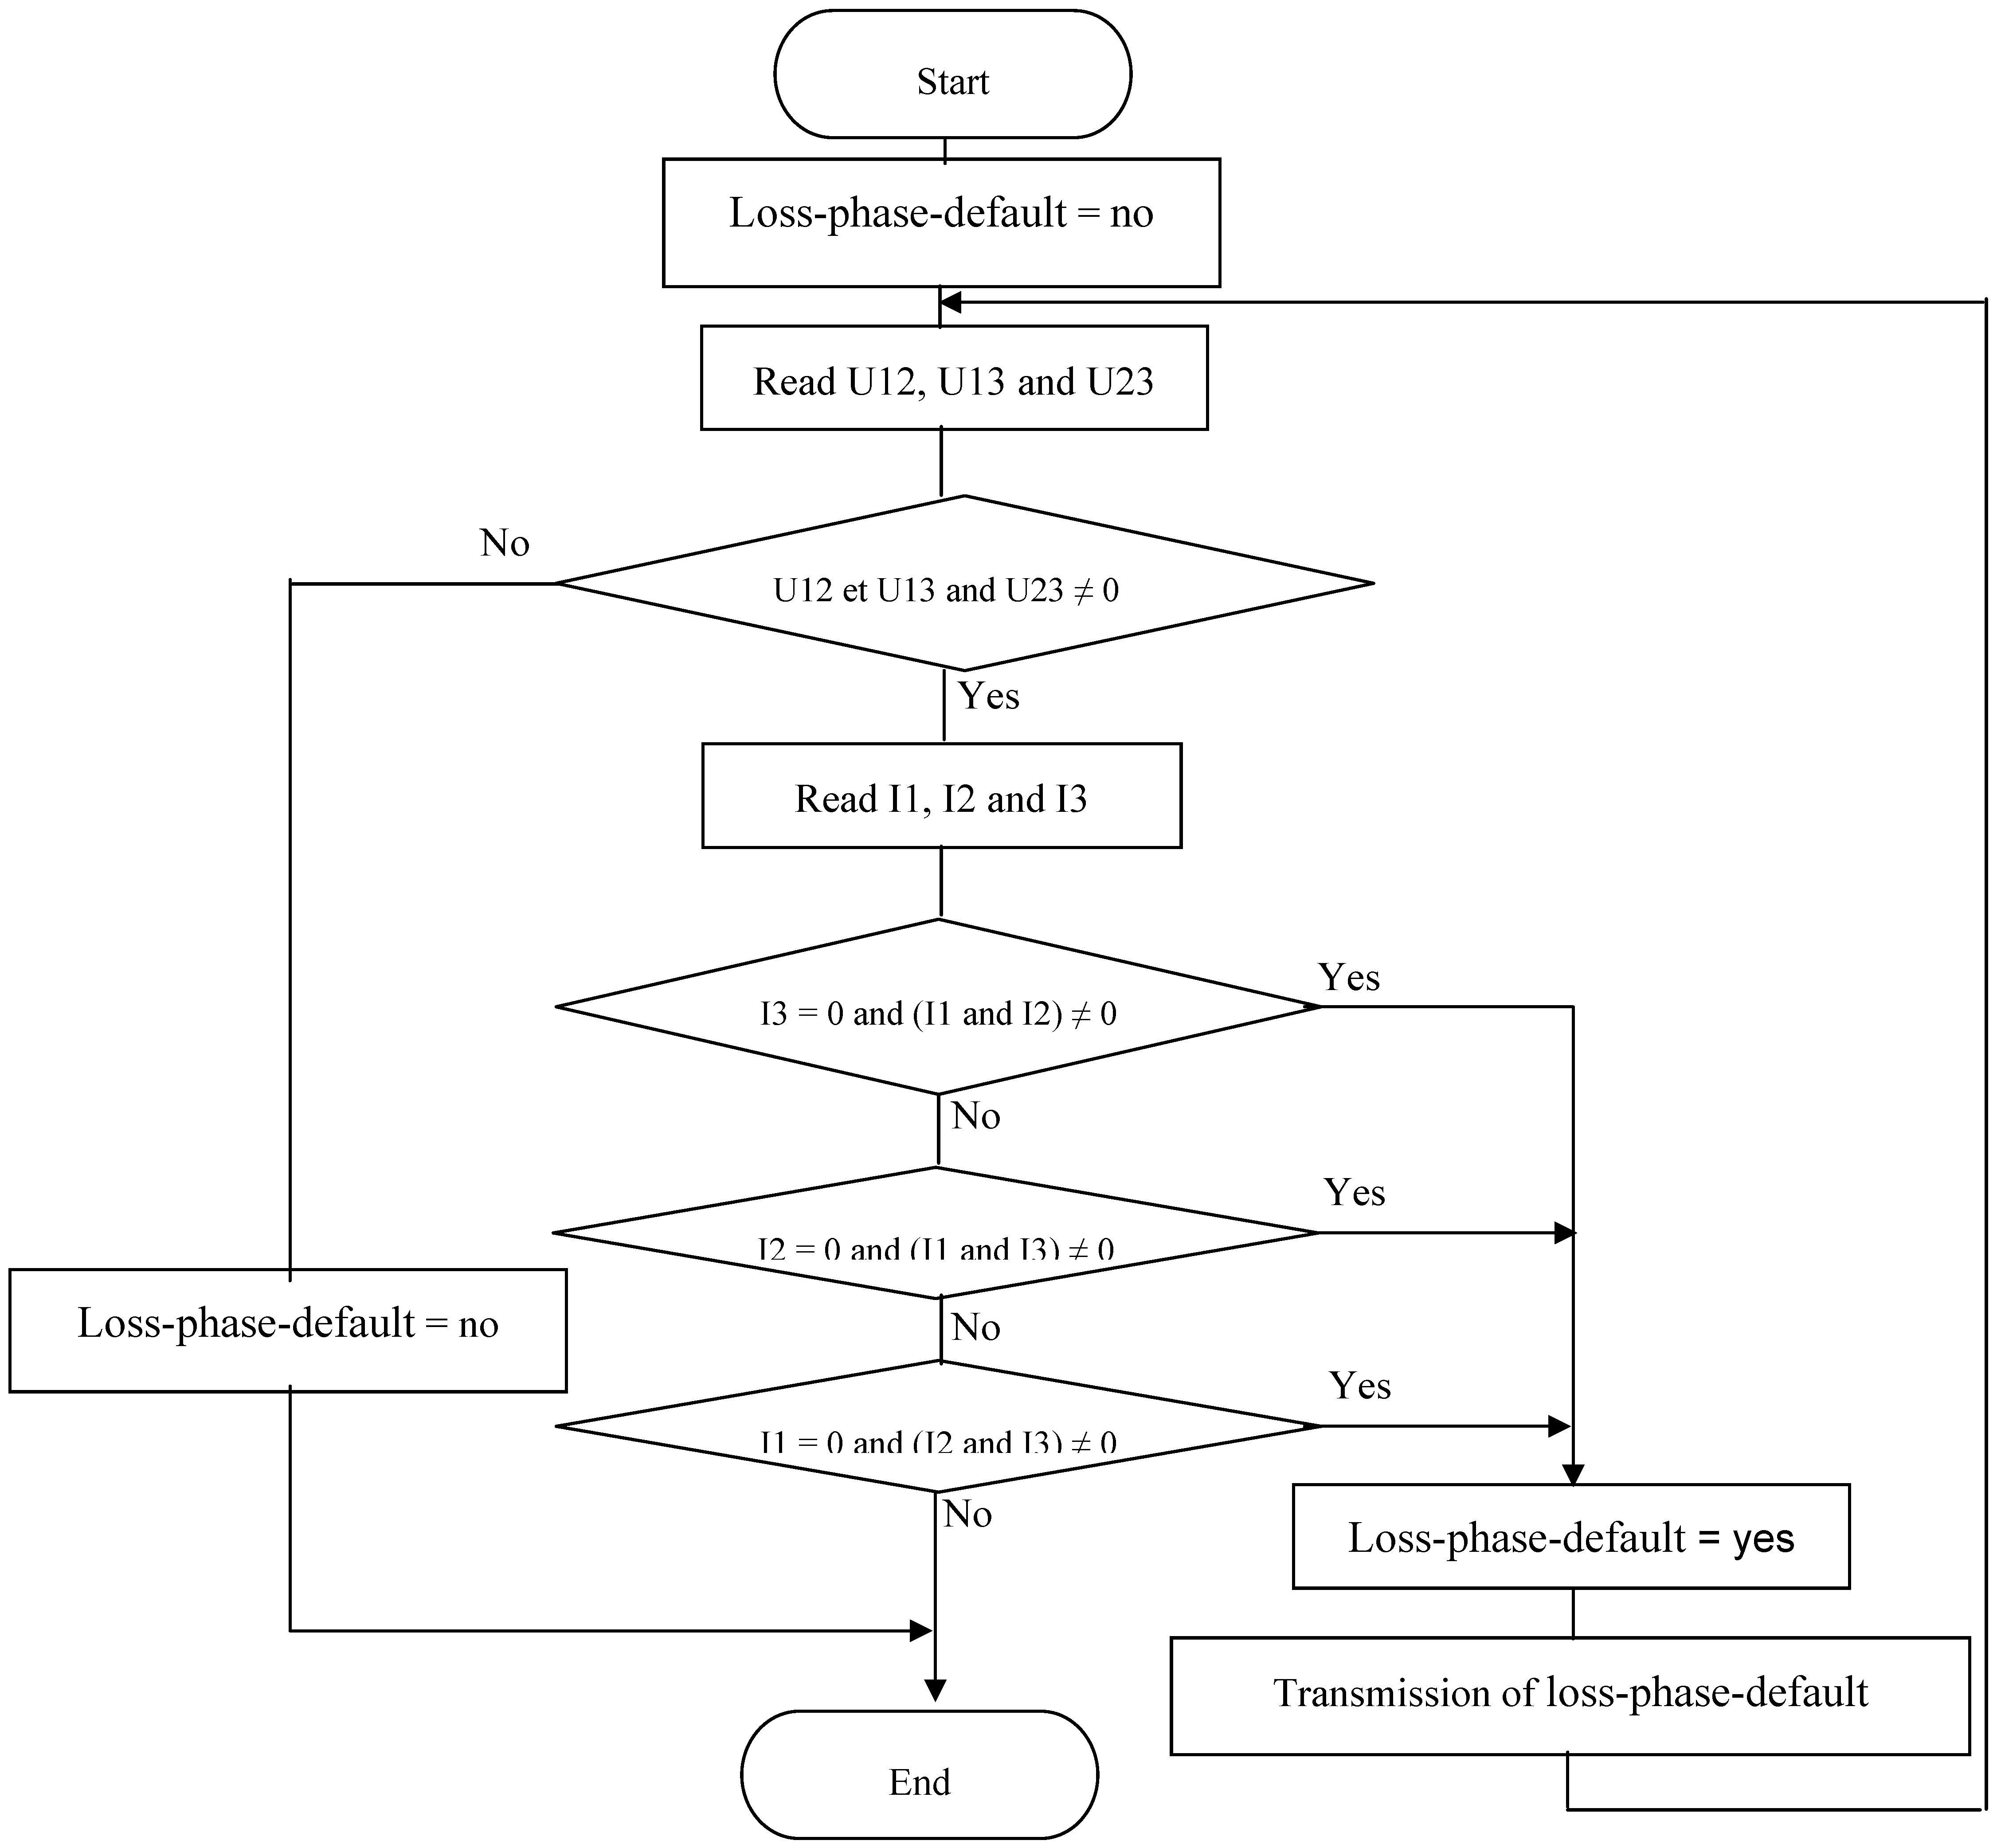
Identifying loss-of-phase faults: There is loss of phase when at the upper level all the three phases are live, whereas only two phases have current. The algorithm for the identification of loss-of-phase fault is shown in
Figure A3 of the appendix.
3. Proposal of a System for the Detection and Localization of Faults on an Electric Power Network
To identify any fault, the processing unit needs to have all the characteristics of the network in real time. These characteristics are furnished to the treatment unit by detection modules placed in a specific point of the network, and which must fulfil the following requirements:
- -
Be able to forward to the NLC the exact geographical position of the faults which they detect;
- -
Be able to disconnect and accurately isolate the defective portion of the network, and as such limit the number of customers not having electricity;
- -
Be able to delimit the portion where technicians shall look for the faults.
3.1. Localizing the faults
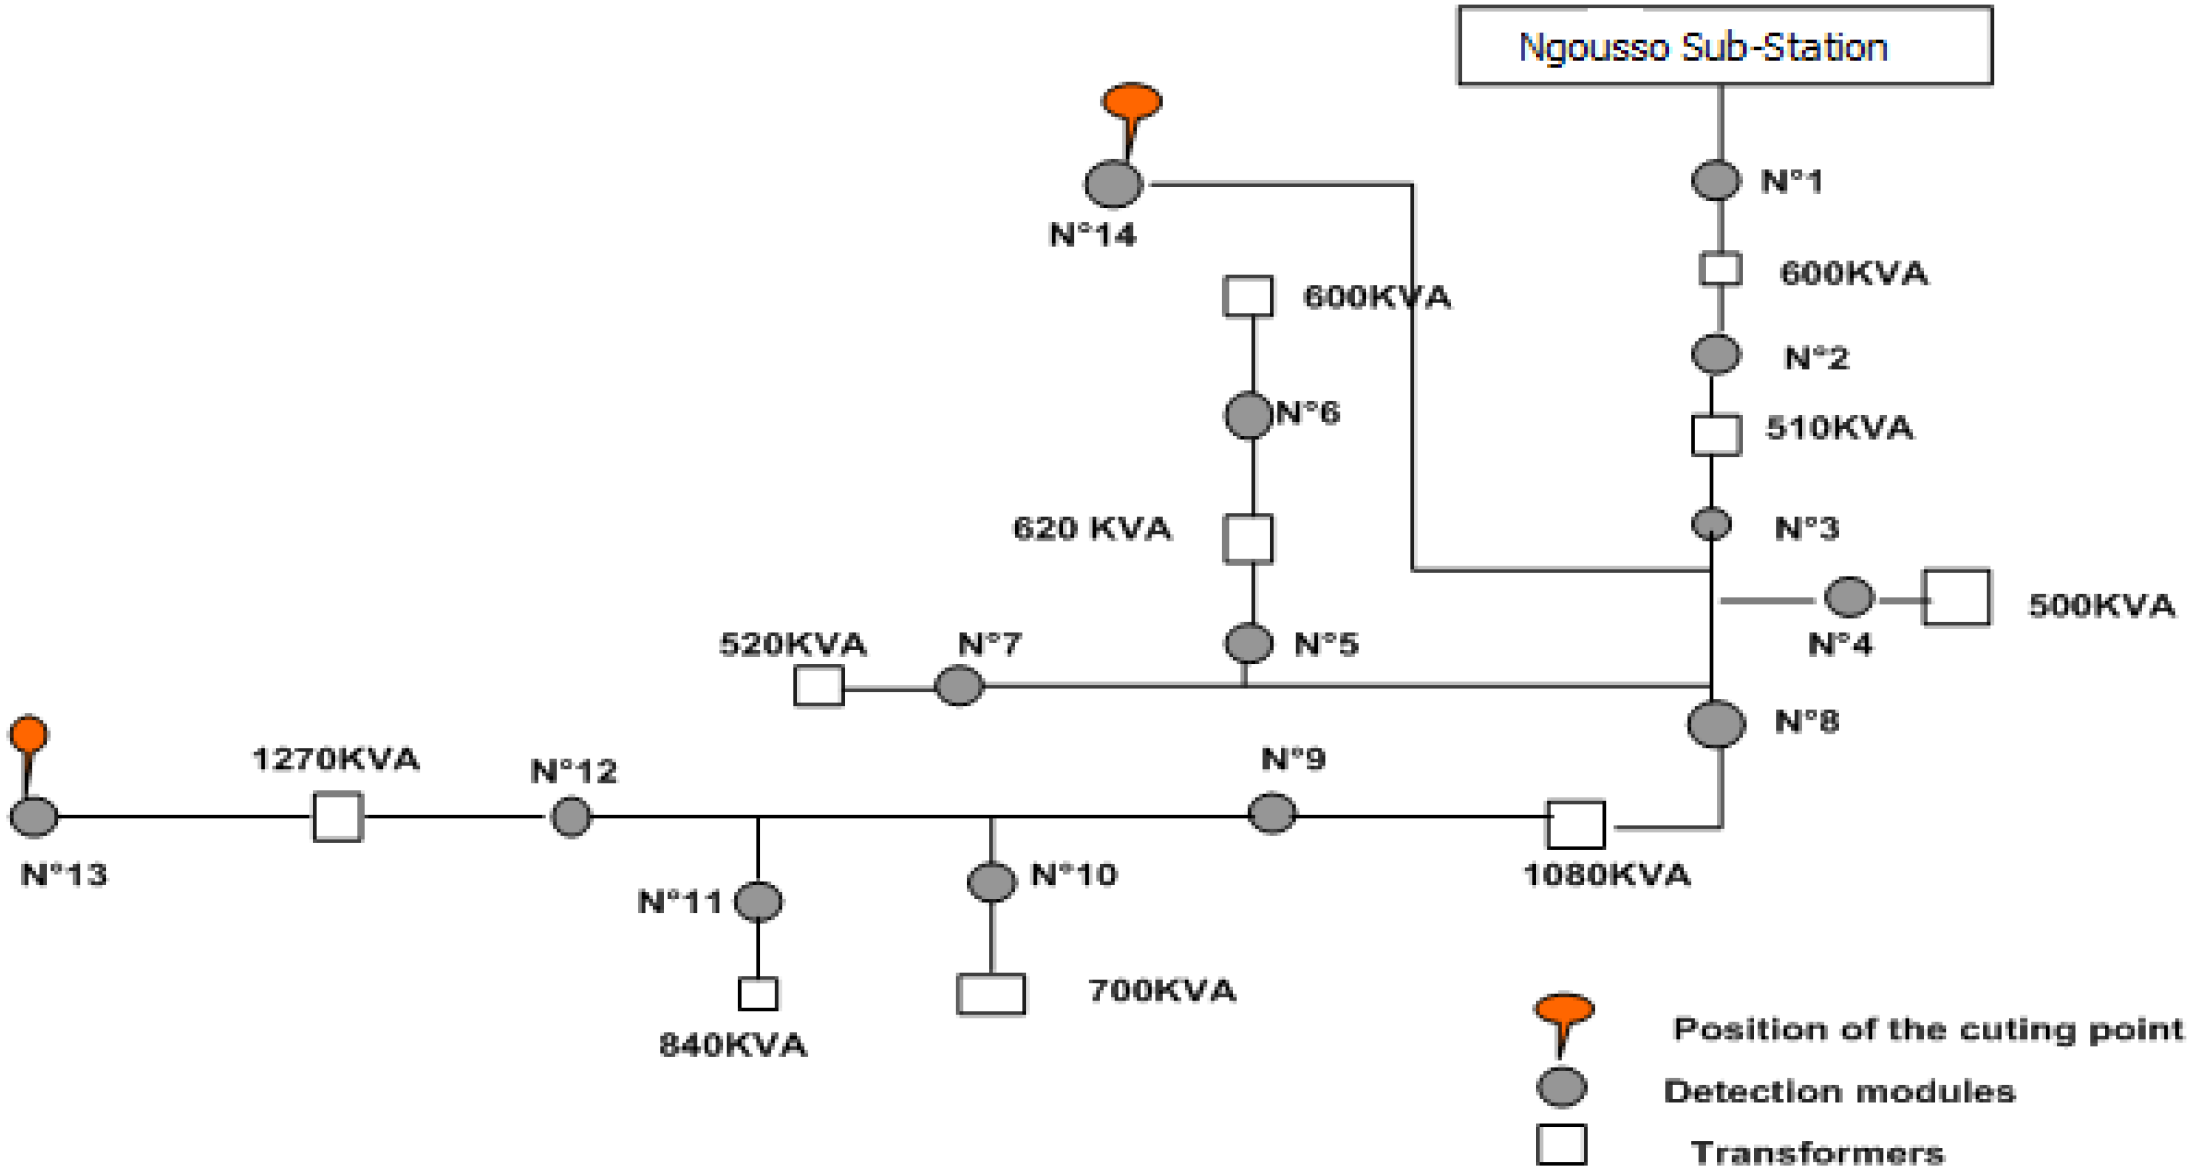
To meet the requirements prescribed for the detection modules, and to limit the portion for the search for faults to 1 km, the network nodes are used by the detection modules. For the sending end D113 [
6], which we use as example, fourteen detection points were defined. They are indicated on the following diagram:
Figure 1.
Positions of detection modules at sending end D113.
Figure 1.
Positions of detection modules at sending end D113.
3.2. Current and voltage sensors
Sensors are used to provide electric current and voltage to the treatment system in real time. Three voltage transformers are used to record voltage at each point where the detection module is placed. These transformers are placed together between two phases. The transformation ratio depends on the input voltage of the treatment system. To protect the voltage entries, one thus uses a resistance adaptation of
Ra whose value depends on the output voltage of the transformer
U, on the input impedance of the voltage module
Re and on the maximum entry voltage of the module
Umax:
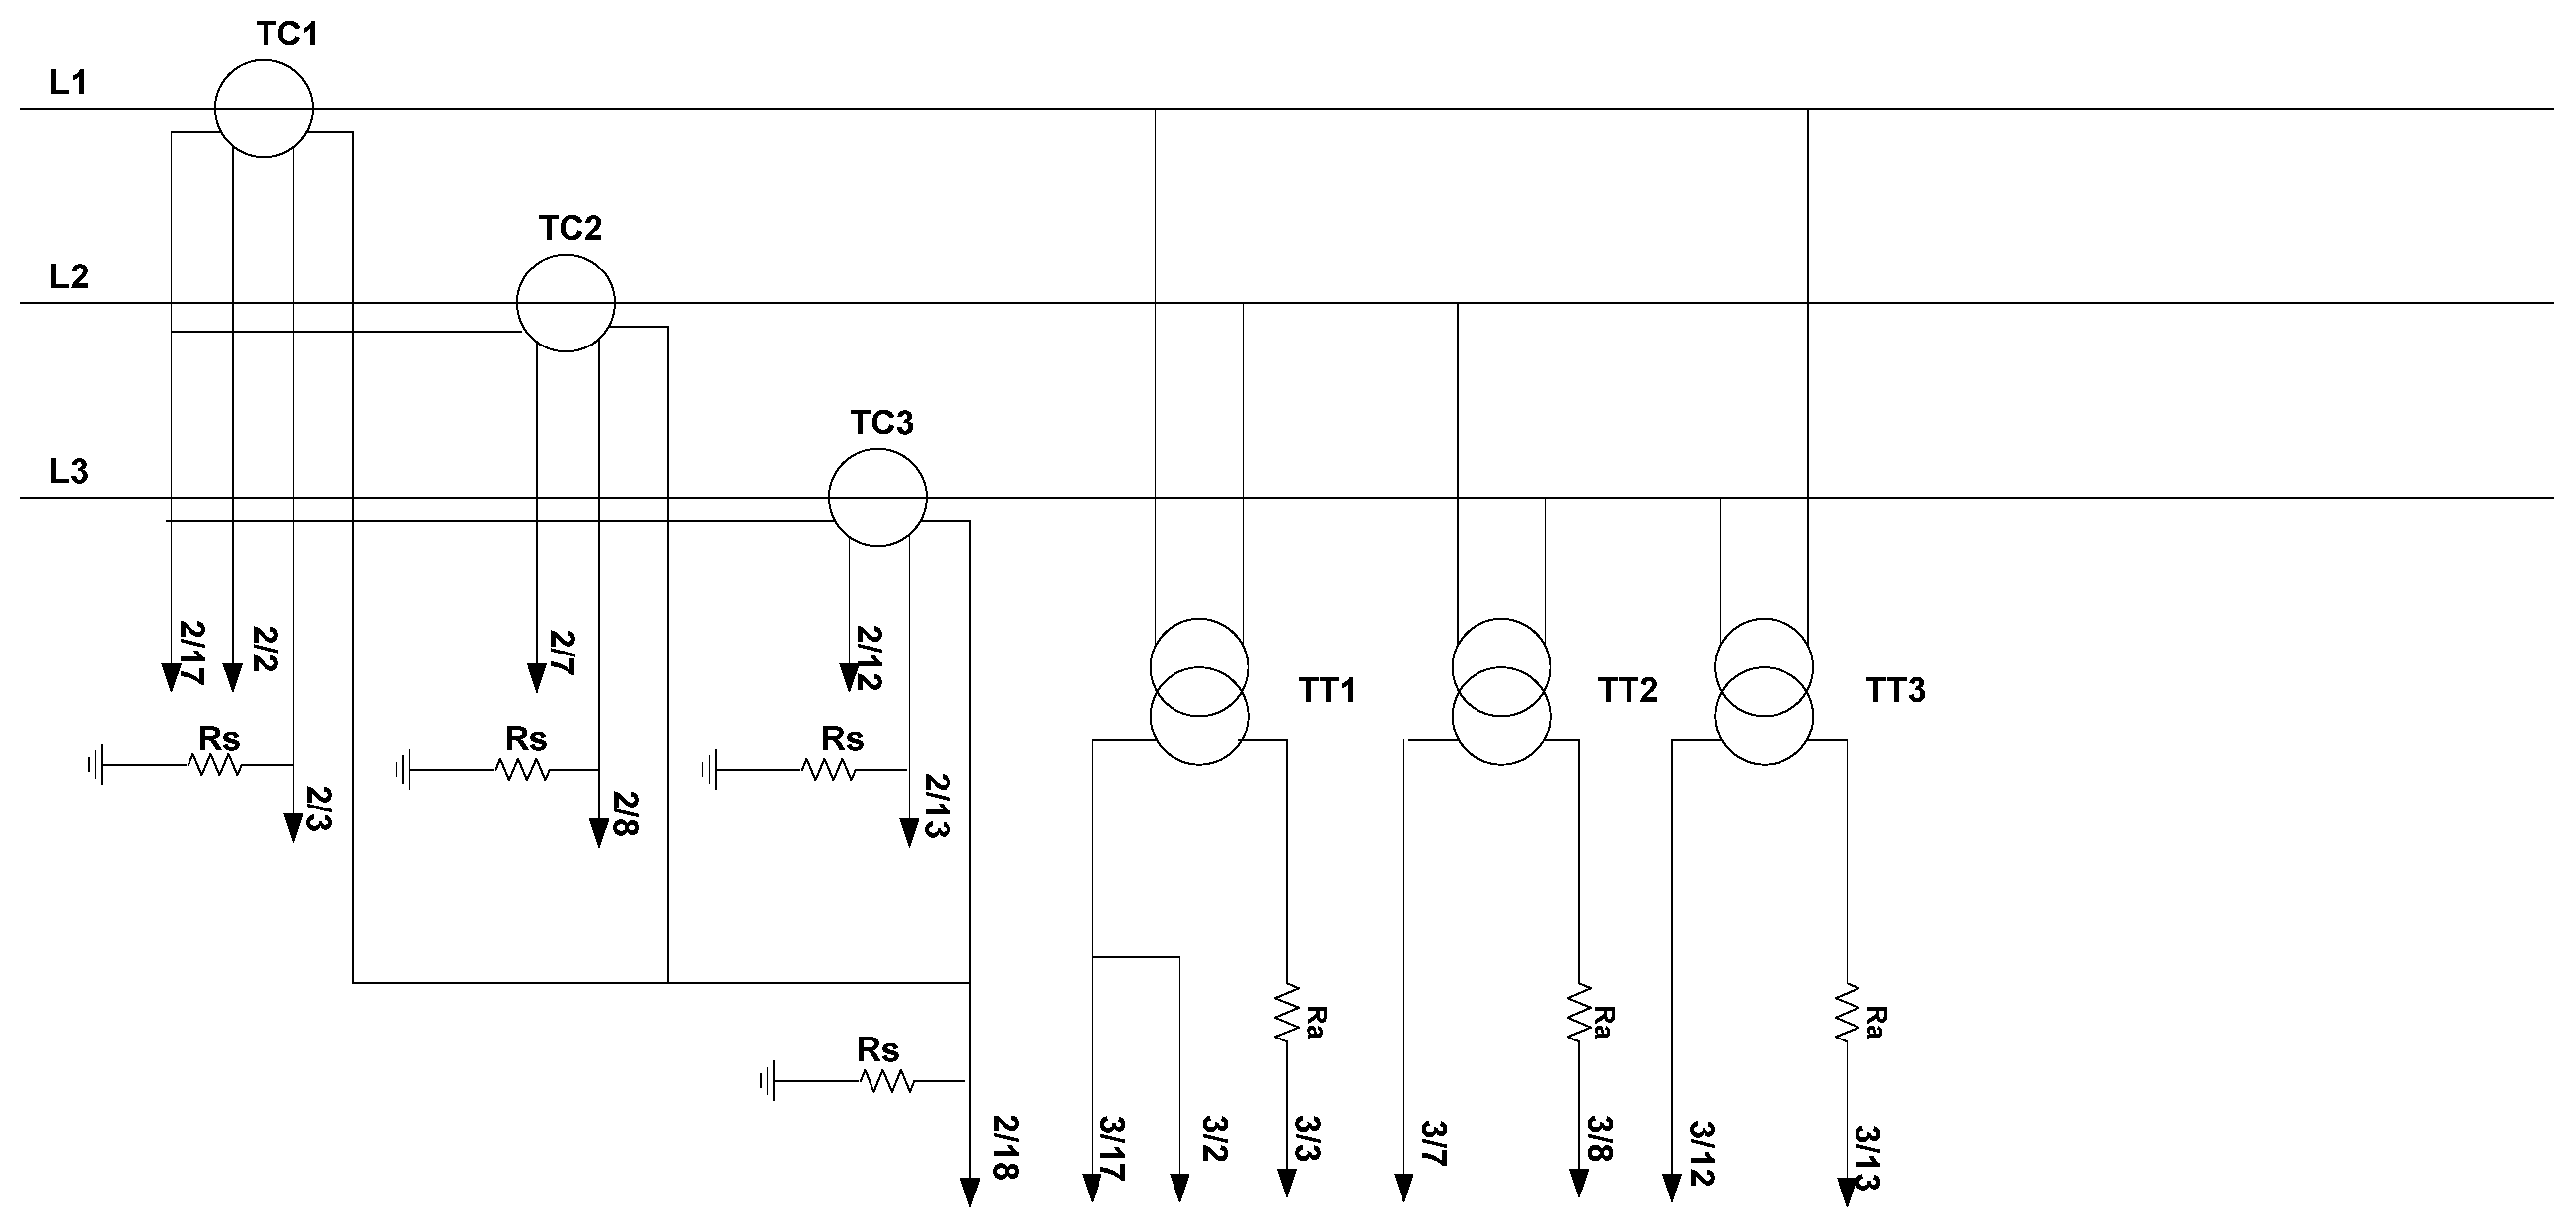
As for the current magnitude, a current transformer with two windings is used on each phase: the first winding is shunted and connected to the treatment module to record a current intensity by phase, while the second winding is dedicated to the detection of homopolar current. All the transformers are star-connected. The transformation ratio now depends on the load. The shunt resistance
Rs, depends on the output current of the current transformer
I, on the input impedance of the current module Re and on the maximum value of the input current of the module Im
ax:
The circuit diagram showing these transformers is as follows:
Figure 2.
Diagram showing the module for current and voltage detection.
Figure 2.
Diagram showing the module for current and voltage detection.
TC: current transformers; TT: voltage transformers
4. System for Data Processing and diagnosis
4.1. System for the data processing
This data processing system which is defined for a well defined portion of the network; shall be capable of:
Recording current and voltage for that part of the network
Calculating the other parameters of operation of the part of network
Deducing the operating condition of the part of network (be able to indicate if the portion is under normal operation or if a fault was detected thereon )
Identifying the fault in the part of network and communicating it to the NLC.
The number of detection modules, the distances between these modules, as well as the distance between the modules and the NLC, all put together, do not still enable us to establish a physical connection between the modules on the one hand, and between the modules and the NLC on the other hand. A wireless communication link must still be made with a general access point at the level of the NLC. The data processing system at the point of detection must then have a data treatment unit for analogue inputs/outputs, for digital inputs/outputs, and a device for wireless communication. It can then be done by ADSL MODEM, radio or GSM. The different possibilities offered for the implementation of the processing system include microprocessors, microcontrollers or programmable logic controller (PLC).
4.2. Implementation of the diagnostic system
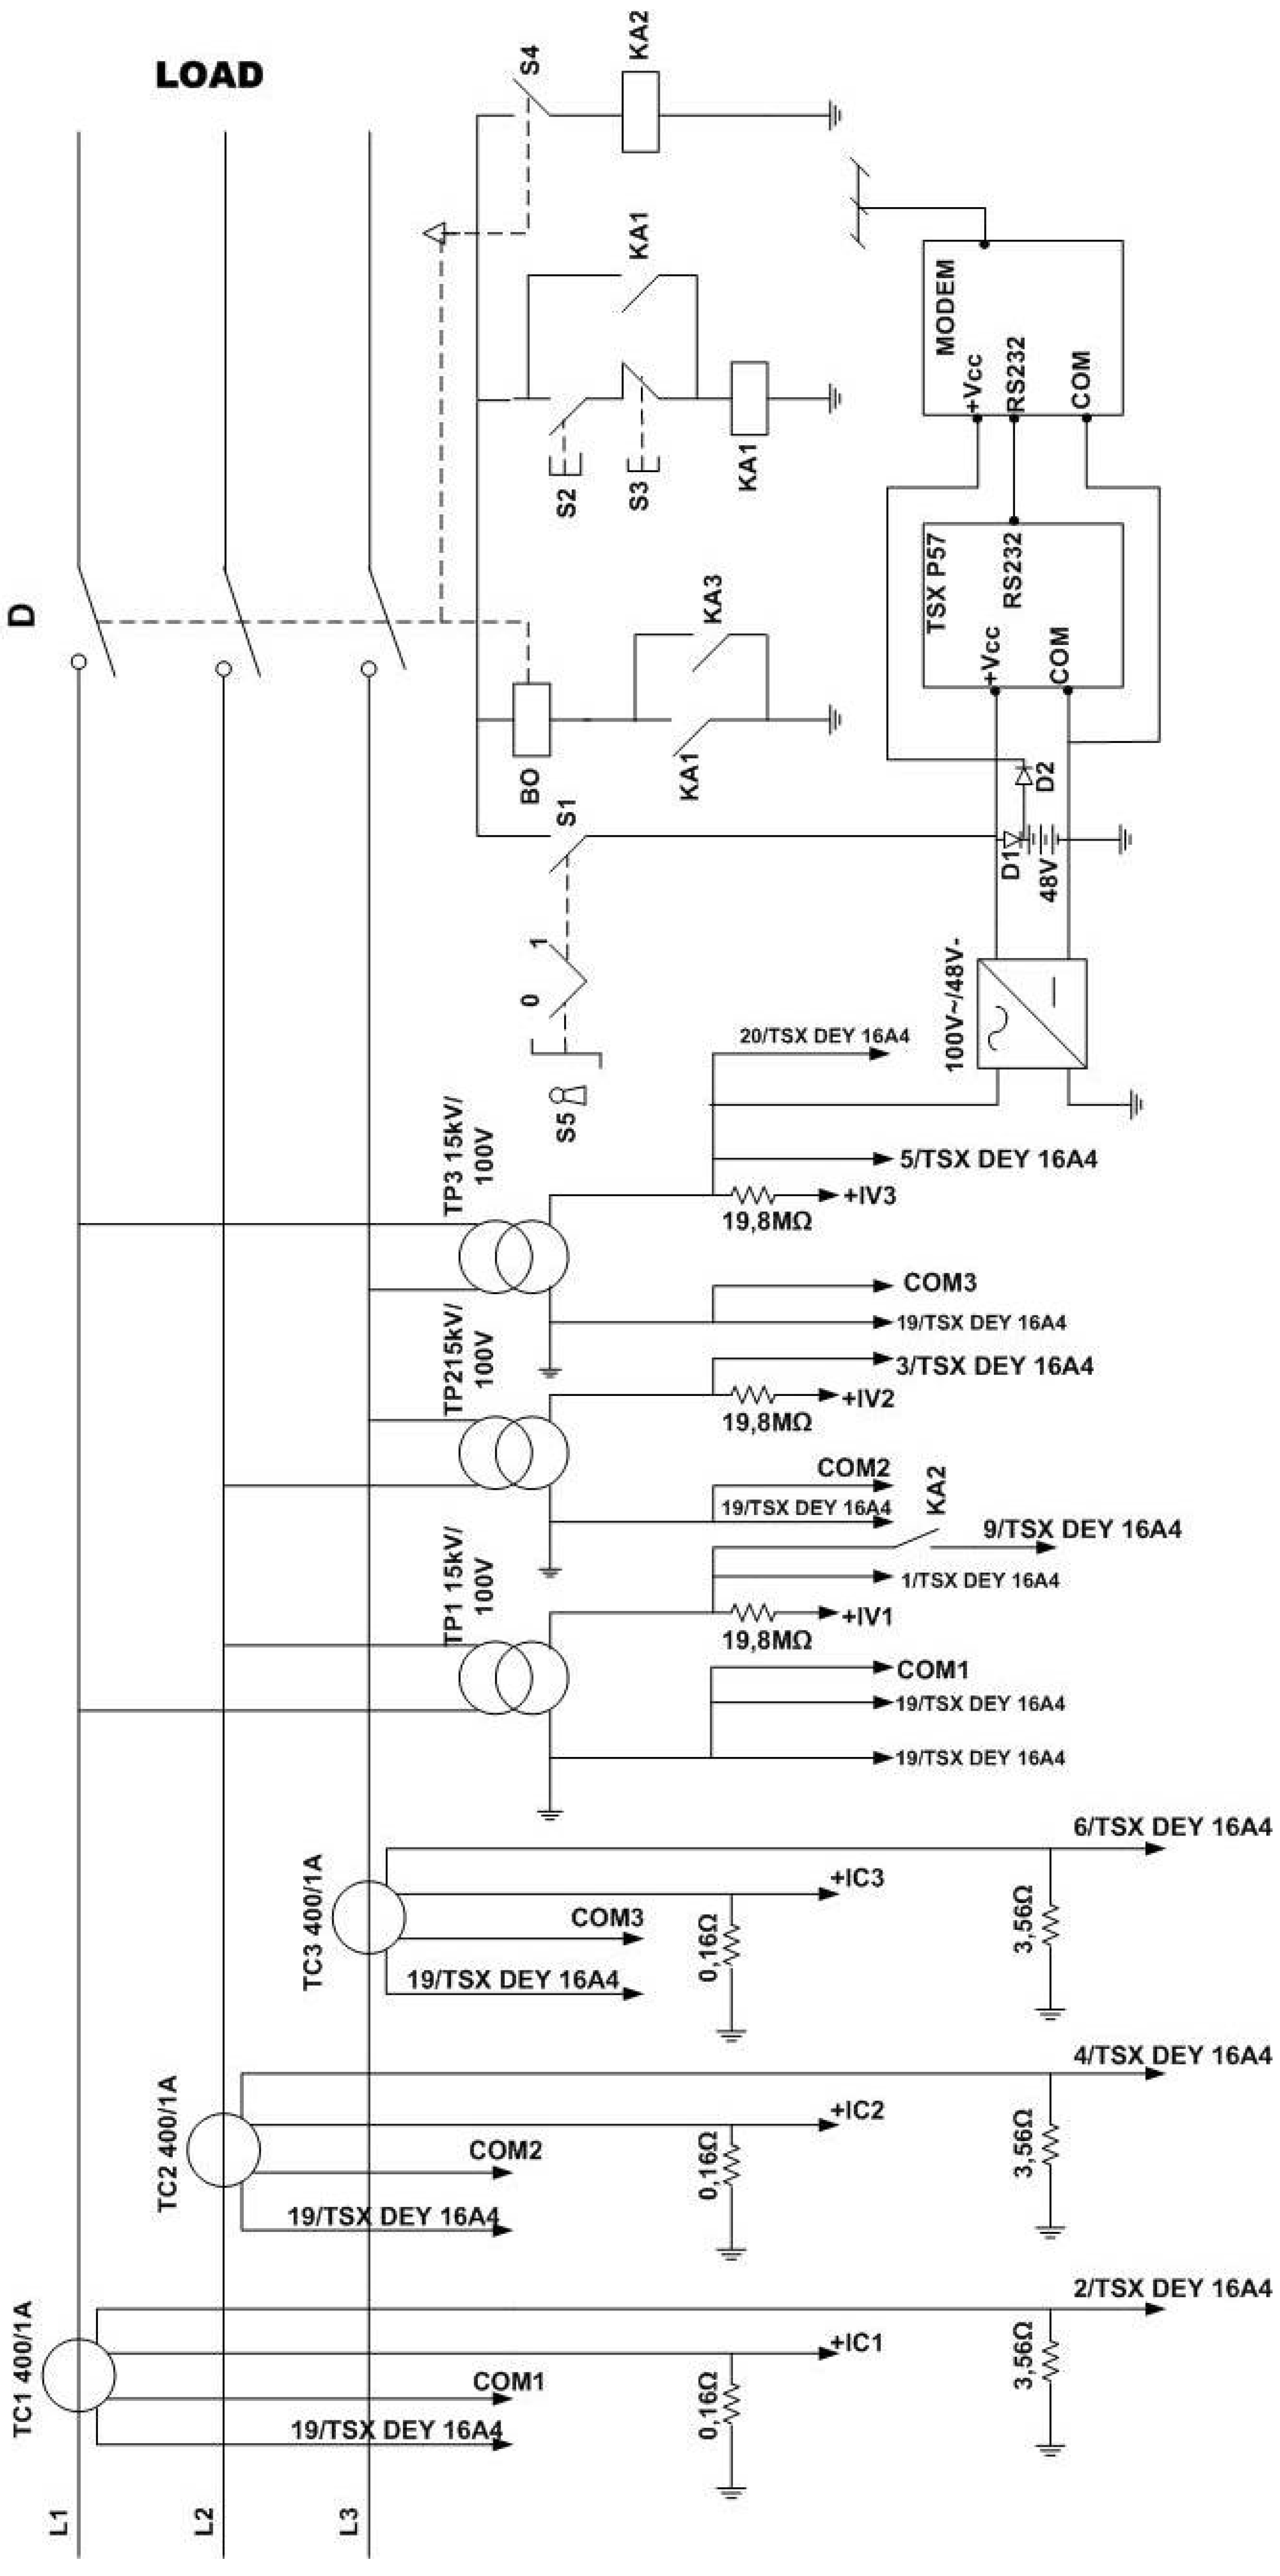
The diagnostic system was implemented using the TSX Premium programmable logic controller (TSX P57352) available in our laboratory. The processor module of this equipment authorizes a connection by modem via a RJ45 port and a RS232 port. For the collection of the electric input quantities, we used analogue input modules, while for the control of the actuators, we used output modules with DC. [
7,
8,
9]. All these elements enabled us to carry out the system diagnostic tests (
Figure A4 of the appendix). The PLC permanently scans the network data and calculates its operation parameters. When a fault is detected, the information on the said fault, its position and the type of fault are sent to the NLC. The operator at the NLC activates the circuit breaker before the fault, thereby disconnecting the section where the fault is found. If a module identifies a fault, all the modules which precede it should not be activated and all the modules surrounding the fault zone must be opened by the network supervisor, thereby isolating the faulty section permanently. The circuit breakers of unaffected areas with blackout are re-closed.
5. Proposals for the implementation of the system by AES-SONEL
For the system to be implemented by AES-SONEL, we have estimated the cost of a module at 10,770 €. This estimate is broken down as follows:
Table 2.
Estimate of the cost of a module.
Table 2.
Estimate of the cost of a module.
| N ° | Designation | Quantity | Complete price |
|---|
| 1 | PLC TSX P57 | 1 | 554 € |
| 2 | current transformer | 3 | 3,077 € |
| 3 | Voltage transformer | 3 | 3,077 € |
| 4 | MODEM | 1 | 1,536 € |
| 5 | Converter 110 V / 48 V DC | 1 | 385 € |
| 6 | Relay | 3 | 33 € |
| 7 | Other components | | 2,108 € |
| | TOTAL | | 10,770 € |
We are still waiting for this sum to be made available by AES-SONEL. When this happens, we will assemble the system and test it over a period of one year. During this period, we will periodically record data on the network and compare it to previously recorded values in order to evaluate the performance of the system.
6. Conclusions
From a preliminary analysis, we have highlighted the link between voltage and current during faults which usually occur in medium voltage distribution networks. These two parameters were used in setting-up a system for the diagnosis of faults. The results from the processing of such elements by a PLC have shown that it is possible to determine the state of the supervised zone and also the actions to take.
We have shown that it is possible to reduce the durations of power failures resulting from faults in the MV distribution network, by equipping the network with modules that can detect the presence of a fault, identify it, locate it and isolate the affected zone. The reduction of the losses is significant in terms of time. With every tripping of the circuit breaker, the network controller will have all the necessary information in real time.
The implantation of such detection modules is salutary for a company which produces and sells electric energy such as AES SONEL. However, the coordination of these modules is another aspect in the setting-up of an automatic network management system. There will inevitably be a problem of communication between the PLC placed in the network and the supervisory PC placed at the NLC, as well as the different protocols having to govern these exchanges. Thus, for a better performance, this aspect could be handled within the scope of another study.
