Proposed Strategies for Improving Poor Hygrothermal Conditions in Museum Exhibition Rooms and Their Impact on Energy Demand


1
Faculty of Energy and Environmental Engineering, The Silesian University of Technology, Konarskiego 20, 44-100 Gliwice, Poland
2
Faculty of Civil Engineering, The Silesian University of Technology, Akademicka 5, 44-100 Gliwice, Poland
*
Author to whom correspondence should be addressed.
Energies 2019, 12(4), 620; https://doi.org/10.3390/en12040620
Submission received: 22 January 2019
/
Revised: 9 February 2019
/
Accepted: 14 February 2019
/
Published: 15 February 2019
(This article belongs to the Special Issue Energy Efficiency in Plants and Buildings 2019)
Abstract
:In museums, poor microclimate conditions, especially large changes in relative humidity and temperature, can lead to serious deterioration of the exhibits. Properly designed heating, ventilation, and air conditioning (HVAC) systems for precise control of the air parameters are required. However, due to the financial restrictions of museums, complex air-conditioning systems are often not feasible. In this study, we tested and propose novel methods to reduce the short- and long-term fluctuations in the relative humidity in exhibition rooms of a Polish museum. The methods only include indoor temperature and ventilation airflow control strategies, without the use of (de)humidification equipment. The analysis is based on simulations using EnergyPlus software. A multi-zone thermal model of the museum building was validated and calibrated with measured data. A full calendar year was simulated for five control cases (including the current method used) and two internal heat gain schedules. The energy demand for heating and cooling for each case was calculated. The combination of temperature control and adequate ventilation using ambient airflow allows for dramatic improvement in the microclimate conditions. The proportion of the year when the instantaneous indoor relative humidity is ±5% from set point decreased from 85% to 20%. A significant effect was obtained over the summer months.
1. Introduction
A museum is a specific building where strict indoor climate control is required. If the microclimate is not properly controlled, the exhibits may be irreversibly degraded [1]. Relative humidity (RH) and temperature (T) are evident destruction factors. RH and T and mainly their fluctuations affect the museum exhibits [2,3,4]. Rapid temperature and relative humidity fluctuations cause stress in materials and, consequently, change their physical and chemical properties, which has been widely described in numerous studies [3,4,5,6,7,8]. The variable number of visitors, their concentration, lighting, and unstable external climate conditions can cause variable instantaneous heat and moisture gains, and directly affect the environmental parameters in museums [9,10,11].
For typical rooms, such as apartments and offices, the requirements for the quality of the indoor climate are precisely defined by appropriate standards [12,13]. In special purpose buildings such as museums, determining the required parameters of the indoor environment is often difficult and ambiguous. Often conflicts exist between the need for thermal comfort of visitors and staff and the requirements for proper conservation of cultural goods; typically, a rational compromise is used [14]. Often, this compromise is associated with limited equipment available to maintain appropriate environmental conditions. In the studies described in the literature, the European [15,16,17], U.S. [18], or the Italian [19,20,21] standards are the most popular methodologies. For example, the Italian standard UNI 10829: 1999 [20] states that an optimal temperature range is 19 to 24 °C for ethnographic collections and 19–24 °C for paintings, with a relative humidity between 45% and 60% for ethnographic collections and 40% and 55% for painting collections. The Joint Declaration of the International Institute for Conservation and the International Committees of ICOM (International Council of Museums) from 2014 recommends a temperature in the range of 16 to 25 °C and a relative humidity in the range of 40 to 60% [22]. The American Society of Heating Refrigeration and Air-conditioning Engineers (ASHRAE), instead of rigid values for relative humidity and temperature, proposed control classes of different required indoor conditions considering the existing risks for exhibits. This theory introduced the concept of "adaptive comfort" as a balance between conservation and comfort requirements. ASHRAE’s chapter 23 [18] on museums contains specifications for short- and long-term fluctuations as well as acceptable levels for both the indoor temperature and the relative humidity in the museum’s galleries or rooms. The set points for the relative humidity may differ from the standard value of 50% or the historical annual average, but for the best climate class, the short-term fluctuations should be limited to ±5% RH. Requirement for classes AA, A, and B are presented in Table 1. The European standard EN 15757 [17] defines the ranges and acceptable fluctuations of microclimatic parameters (relative humidity and temperature), developing upon the idea of "historical climate". The standard recommends maintaining microclimatic conditions without departing from the historical climate, if these conditions were considered satisfactory. The requirements concerning microclimate conditions in museum galleries, from the various guidelines, were summarized by Lucchi [23].
Once acceptable conditions have been selected, the means of achieving them must be determined. The proper design and operation of heating, ventilation, and air-conditioning (HVAC) systems is crucial [24,25,26]. If internal loads are small, then most HVAC systems can easily maintain designed microclimatic conditions. Due to the heavy construction of museum building and high thermal capacity, the heat load associated with external conditions change slowly. However, the changing flow of people can cause sudden and significant changes in the microclimate of the exhibition halls, so the reaction of the HVAC system must be quick and effective [27].
HVAC systems have to operate throughout the year and 24 hours a day [27,29]; therefore, appropriate techniques should be introduced to produce energy savings and to ensure good dynamic microclimatic control [4,30]. In recent years, many studies have been published on balancing energy and conservation needs [6,9,27,30,31,32,33,34,35,36,37]. Ascione et al. [9] and Kramer et al. [34] achieved energy savings of approximately 40% and 77%, respectively. Another study [32] assessed the impact of three levels of climate control on the annual energy demand at the Hermitage Amsterdam museum: (1) constant values (RH = 50% and T = 21 °C, no fluctuations), (2) class AA, and (3) class A. Compared to case (1), case (2) saved 63% and case (3) saved 49%. The relaxation of climate specifications also reduced the hourly fluctuation. Similar analyses were conducted by Kupczak et al. [35]. Research has also been published on balancing passive and active climate controls within museums [10,38,39,40].
Proper design and implementation of HVAC systems for new or existing museums would be ideal. However, financial and construction limitations do not allow the use of advanced and expanded HVAC systems, especially in historical buildings. In the case of buildings without an air conditioning system, localized air humidifiers or dehumidifiers are often used. This solution only allows the control of air humidity, without the possibility of temperature control (e.g., air temperature is only changed by radiator thermostatic valves). Humidifiers and dehumidifiers disrupt the local microclimate in the room. Even a full air conditioning system is not always able to maintain the required microclimatic parameters [32]. Higher heat and moisture gains cause the air conditioning system to work more intensively; striving to achieve a balance causes fluctuations in the air parameters. Seasonal adjustments are often introduced manually, potentially resulting in sudden temperature and relative humidity changes that may threaten the collection. Frequently acceptable ranges of temperature and relative humidity and acceptable fluctuations, e.g., seasonal changes, are ineffectively controlled [41]. In many cases, improving the control of the HVAC systems that are already installed is a good way to improve the quality of the microclimate in the museum’s rooms.
2. Research Aim
The aim of this study was to investigate strategies for simple HVAC system control to improve microclimate conditions and their impact on the energy demand of the building, using a single Polish museum as a case study. In many cases, including this one, museum budgets and the historical character of their buildings do not allow the use of extensive systems. Most museums in Poland are longstanding buildings, where the microclimate is maintained only by a simple central heating system based on water radiators and natural ventilation. Sometimes simple fan-coils or portable humidifiers are used.
Changing the air temperature causes a change in the relative humidity. This dependence is described by Equations (1) and (2) [42]:
where p is the water vapor partial pressure (Pa), ps is the saturation vapor pressure (Pa), and T is the air temperature (dry-bulb temperature in °C).
This paper presents various temperature control strategies within the ASHRAE standard [18] to reduce the short- and long-term fluctuations in relative humidity throughout the year. To obtain more stable RH in the exhibition galleries, in some cases, instantaneous ventilation (using outdoor airflow) is adjusted. As a result of mixing, the outdoor air stream at a temperature Tout, moisture content Xout, enthalpy hout with the indoor air steam of temperature Tin, moisture content Xin, and enthalpy hin, the air steam mixture (TM, XM, hM) is obtained, which can be described by Equation (3). The dependence between RH and X is described by Equation (4).
No additional humidification and dehumidification equipment was used. The energy demand for heating and cooling was calculated for each control case. Due to the internal heat and moisture gains having a significant impact on the changes in T and RH, the simulations were completed for two variants: a schedule of occupants and lighting.
3. Methods
Building performance simulation (BPS) was used for the study. The thermal model of the whole museum building was prepared in the integrated BPS tool, EnergyPlus (US Department of Energy, Washington, DC, USA) [43]. This permitted integrated calculations of the heat and moisture transfer inside the building, considering the HVAC systems and their control strategies.
3.1. Museum Selected for Research
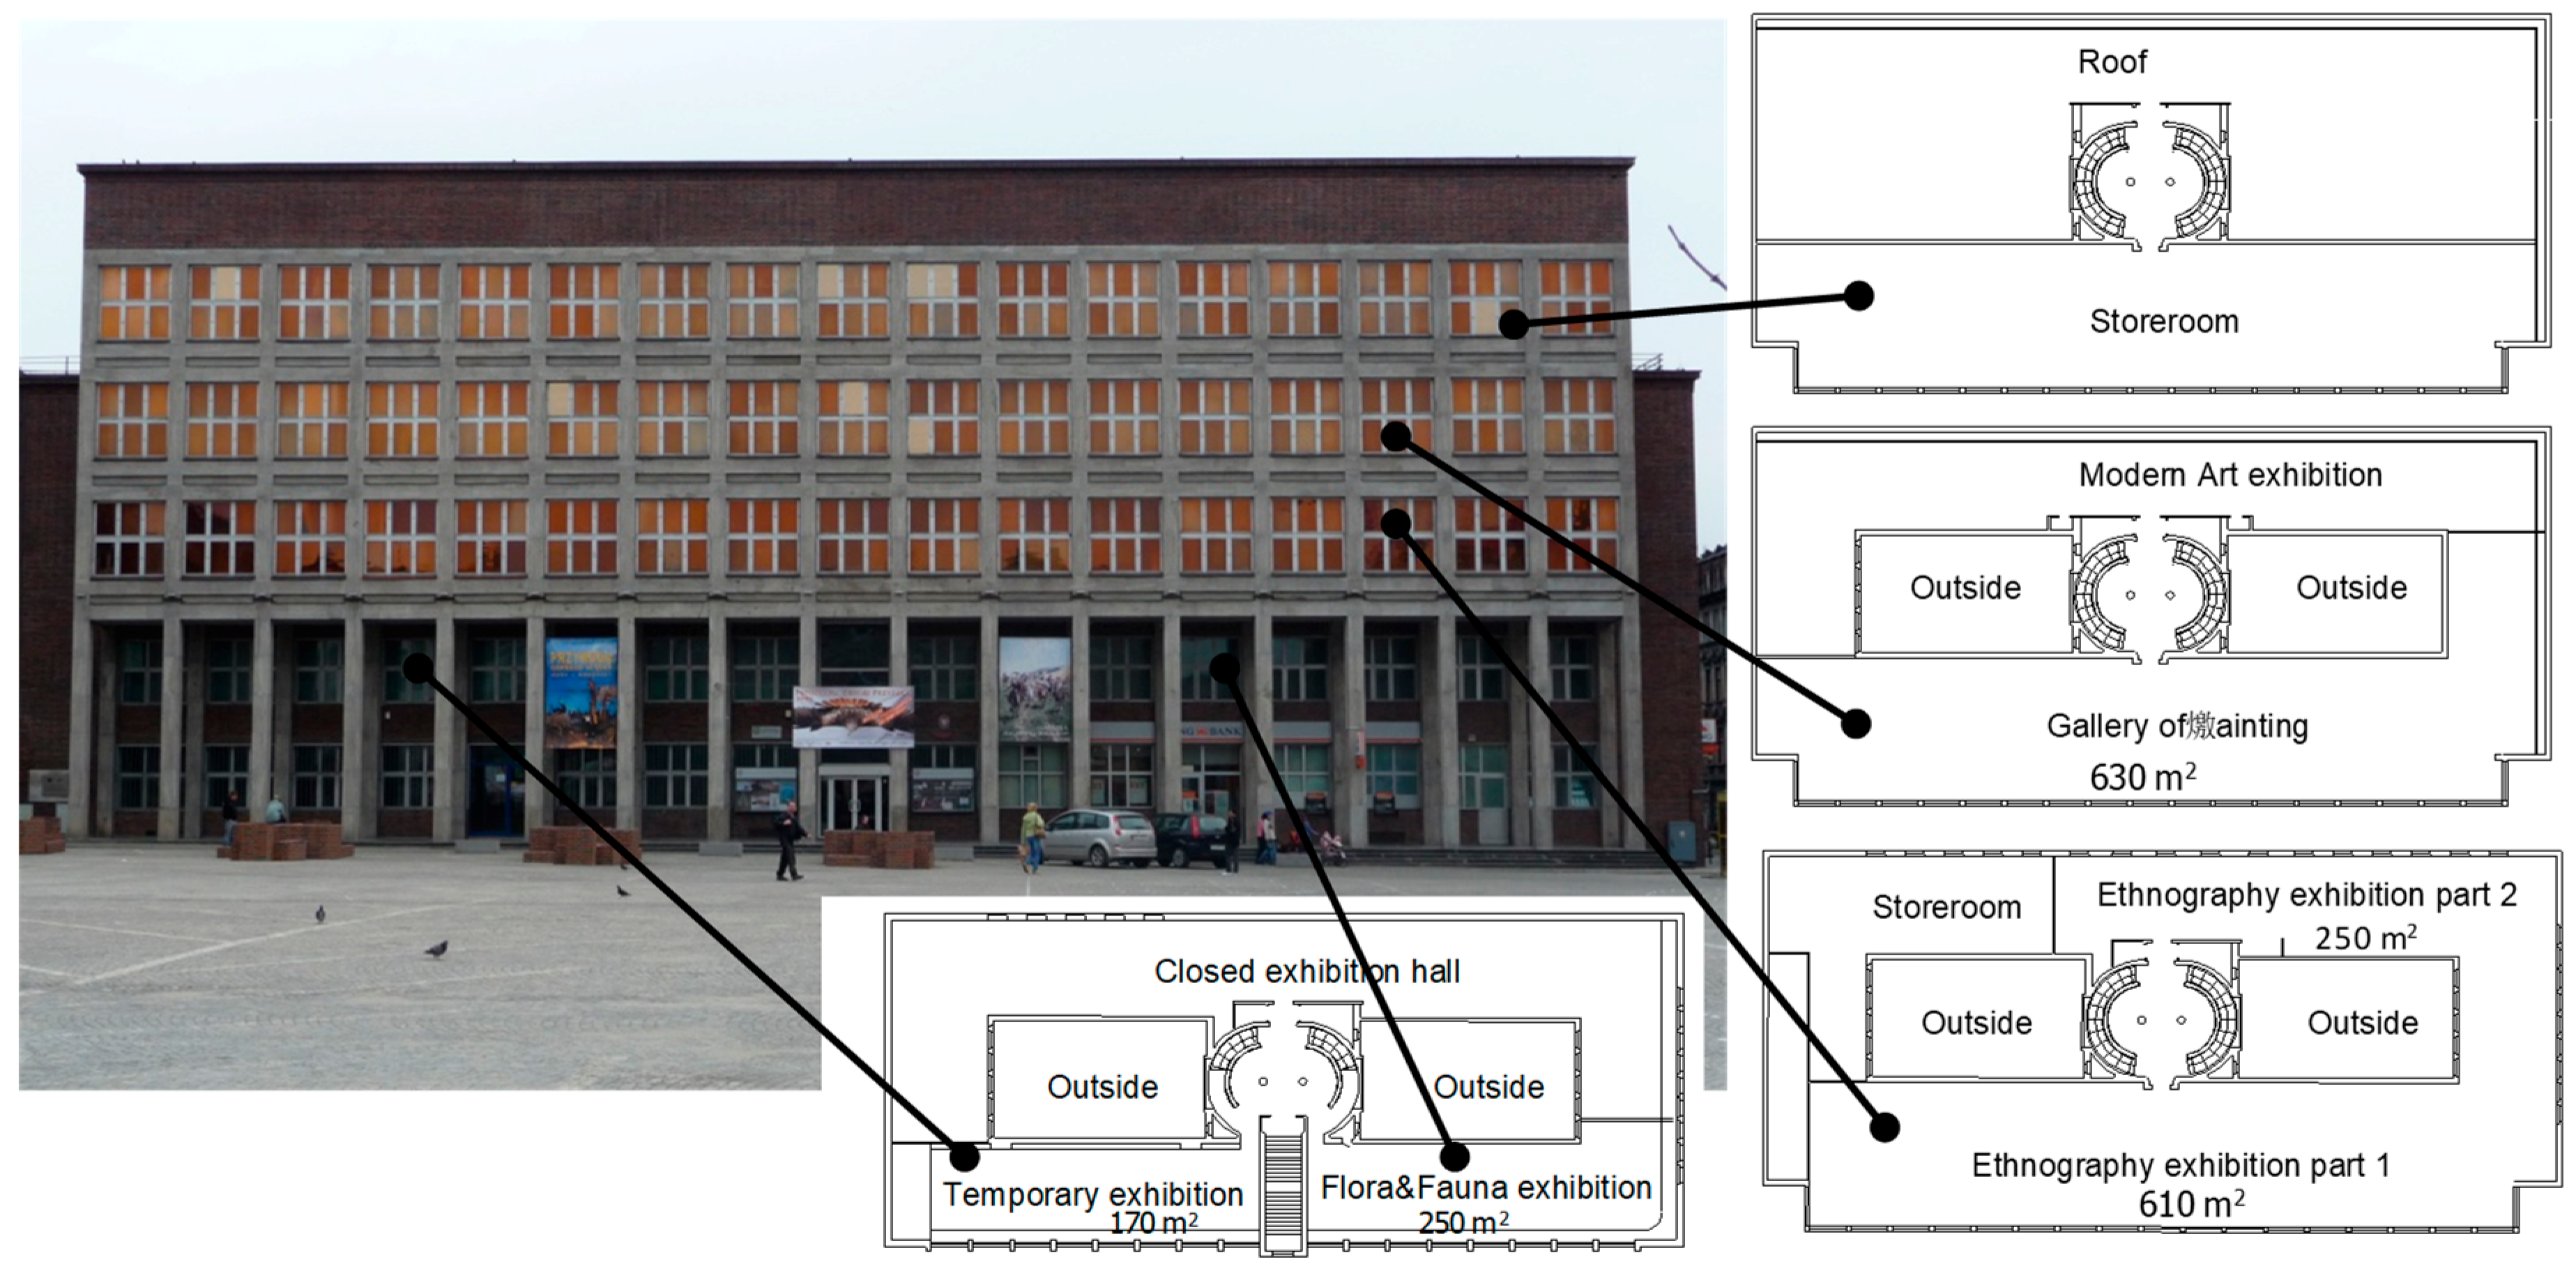
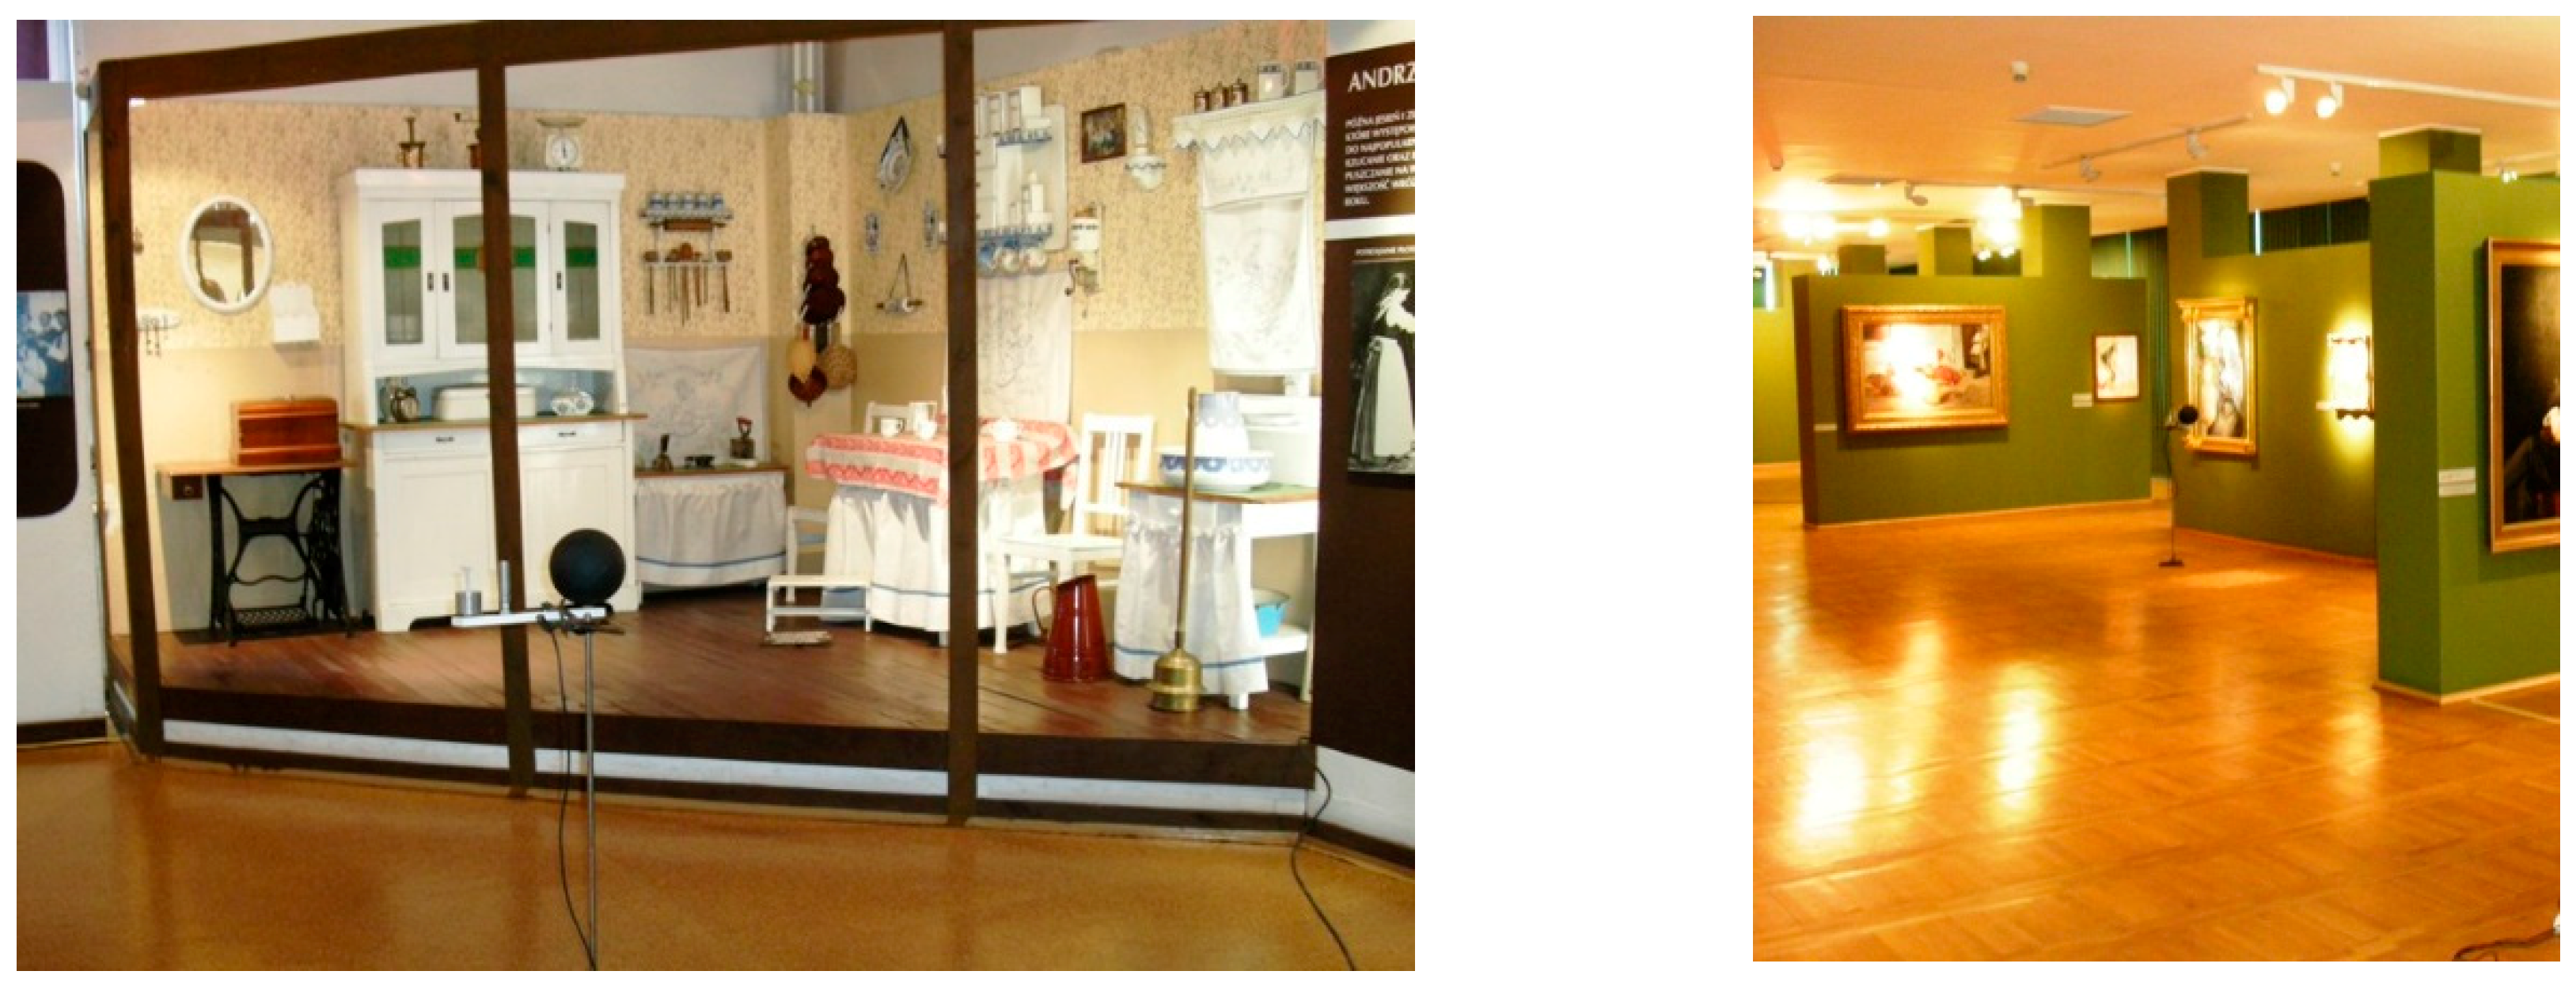
A building built for museum exhibition purposes in 1929–1930 was selected for this study (Figure 1). The museum is located in the Upper Silesia region of Poland. The museum collections are presented in five large exhibitions halls named Flora and Fauna, Ethnography, Gallery of Painting, Modern Art, and Temporary Exhibitions. In the Flora and Fauna hall, there are examples from forest environments, forest mammalian fur, and trunks of various trees. Ethnography includes clothes, furniture, and everyday objects (wood, porcelain, ceramics) from the 19th and 20th centuries, paintings, and books (Figure 2, left). This hall is divided to two parts. The Gallery of Painting presents 19th and 20th century Polish paintings (Figure 2, right). Table 2 summarizes the basic characteristics of the building.
In the exhibition halls, there are problems with maintaining stable temperature and relative humidity. Measurements on this museum showed [44,45] that the temperature in exhibition rooms change from 15–17 to 28–30 °C during the year. The relative humidity typically varied from 20% in the heating season to 65–75% during the summer period, but occasionally exceeded 80%. Even in the Gallery of Painting (equipped with a cooling system and air humidifier), large RH fluctuations were observed. For 57% of the year, the daily RH fluctuations were larger than ±5%. The low level of heating and cooling control and lack of heating and cooling in winter and summer were the highest observed fluctuations in the museum. The manually-controlled air humidifier did not work correctly. New methods for humidification and dehumidification are needed in this museum.
3.2. Model Description and Assumptions for Simulation
The thermal model contained 12 connected zones (exhibition halls, storerooms, and staircase) with a total volume of 14,476 m3. The walls, floors, and windows were modelled in accordance with the real construction of the building. The neighboring buildings that provide shade were also modelled. The airflow infiltrating into the zones (solely as natural ventilation) was calculated using CONTAM 2.4 software (National Institute of Standards and Technology, Gaithersburg, MD, USA) [46] and then imported into EnergyPlus (air change rates, in one-hour time step increments). In this model, all identified airflow paths were considered, i.e., infiltration through the external windows, doors cracks, and inter-zone airflows. More details were presented in Ferdyn-Grygierek, et al. [47]. Additional ventilation airflows, in the analysed cases, were modelled in EnergyPlus. Assumptions used for thermal simulation are summarized in Table 3 and Figure 3.
3.3. Model Validation
To check whether the simulation model had the same hygrothermal characteristics as the real building, model validation was completed. The calculated indoor temperature and relative humidity were compared with the measurement results for this museum [44,45]. We compared hourly T and RH values for the ethnography hall. This zone was chosen for a detailed analysis in this study (see Section 4). For model validation, the real weather data for the same measurement period were included.
Validation was performed for a three week summer period (from mid-July through to beginning of August). In winter, the heating system operates in the building and consequently, the validation for this period could not be performed (our simulation model did not include the HVAC system model). In the selected summer period, the number of visitors in the museum was very low. Therefore, the number of occupants in the validated model could be zero. This is the most uncertain input in the model. Validation (with a small time step) with the presence of occupants is very difficult given the high variability in the number of visitors during the day, and even within an hour. In the case of a small validation time step, such as one hour as in our study, a very accurate analysis of the instantaneous variability of visitors in individual exhibition halls would be needed. This was not possible given the lack of such accurate data. The presented three weeks allowed an assessment of whether the model reacts to changes in temperature and relative humidity similarly to the actual building. A comparison of the results is presented in Figure 4.
Measurement verification of the indoor temperature and relative humidity confirmed the results of the simulation were accurate and reliable. The relative difference for temperature during 90% of the presented period does not exceed ±5%. The difference between the simulated and measured relative humidity was less than ±5% for 73% of the time and less than ±10% for 97% of the time.
3.4. Model Cases
Four novel control cases were analysed. The proposed control algorithms can be implemented for typical and even very simple HVAC systems that are already installed in the museum. Only additional fans supplying outdoor air are needed in cases 3 and 4. The control strategies for temperature are in accordance with the ASHRAE standard [18]. All cases were simulated for two variants of internal heat gains (Table 3 and Figure 3):
- Base: actual thermal conditions, heating system works from October 1 to May 15t(temperature set point is 20 °C), no cooling;
- Case 1: the temperature is controlled to 21 ± 2 °C by a heating or cooling system throughout the whole year; the relative humidity is controlled by changing the temperature. If indoor RH differs from 50%, indoor T is reduced or increased by up to 2 °C (at a rate of 0.17 °C/h).
- Case 2: Like case 1, but the temperature can change by ±5 °C (at a rate of 0.17 °C/h).
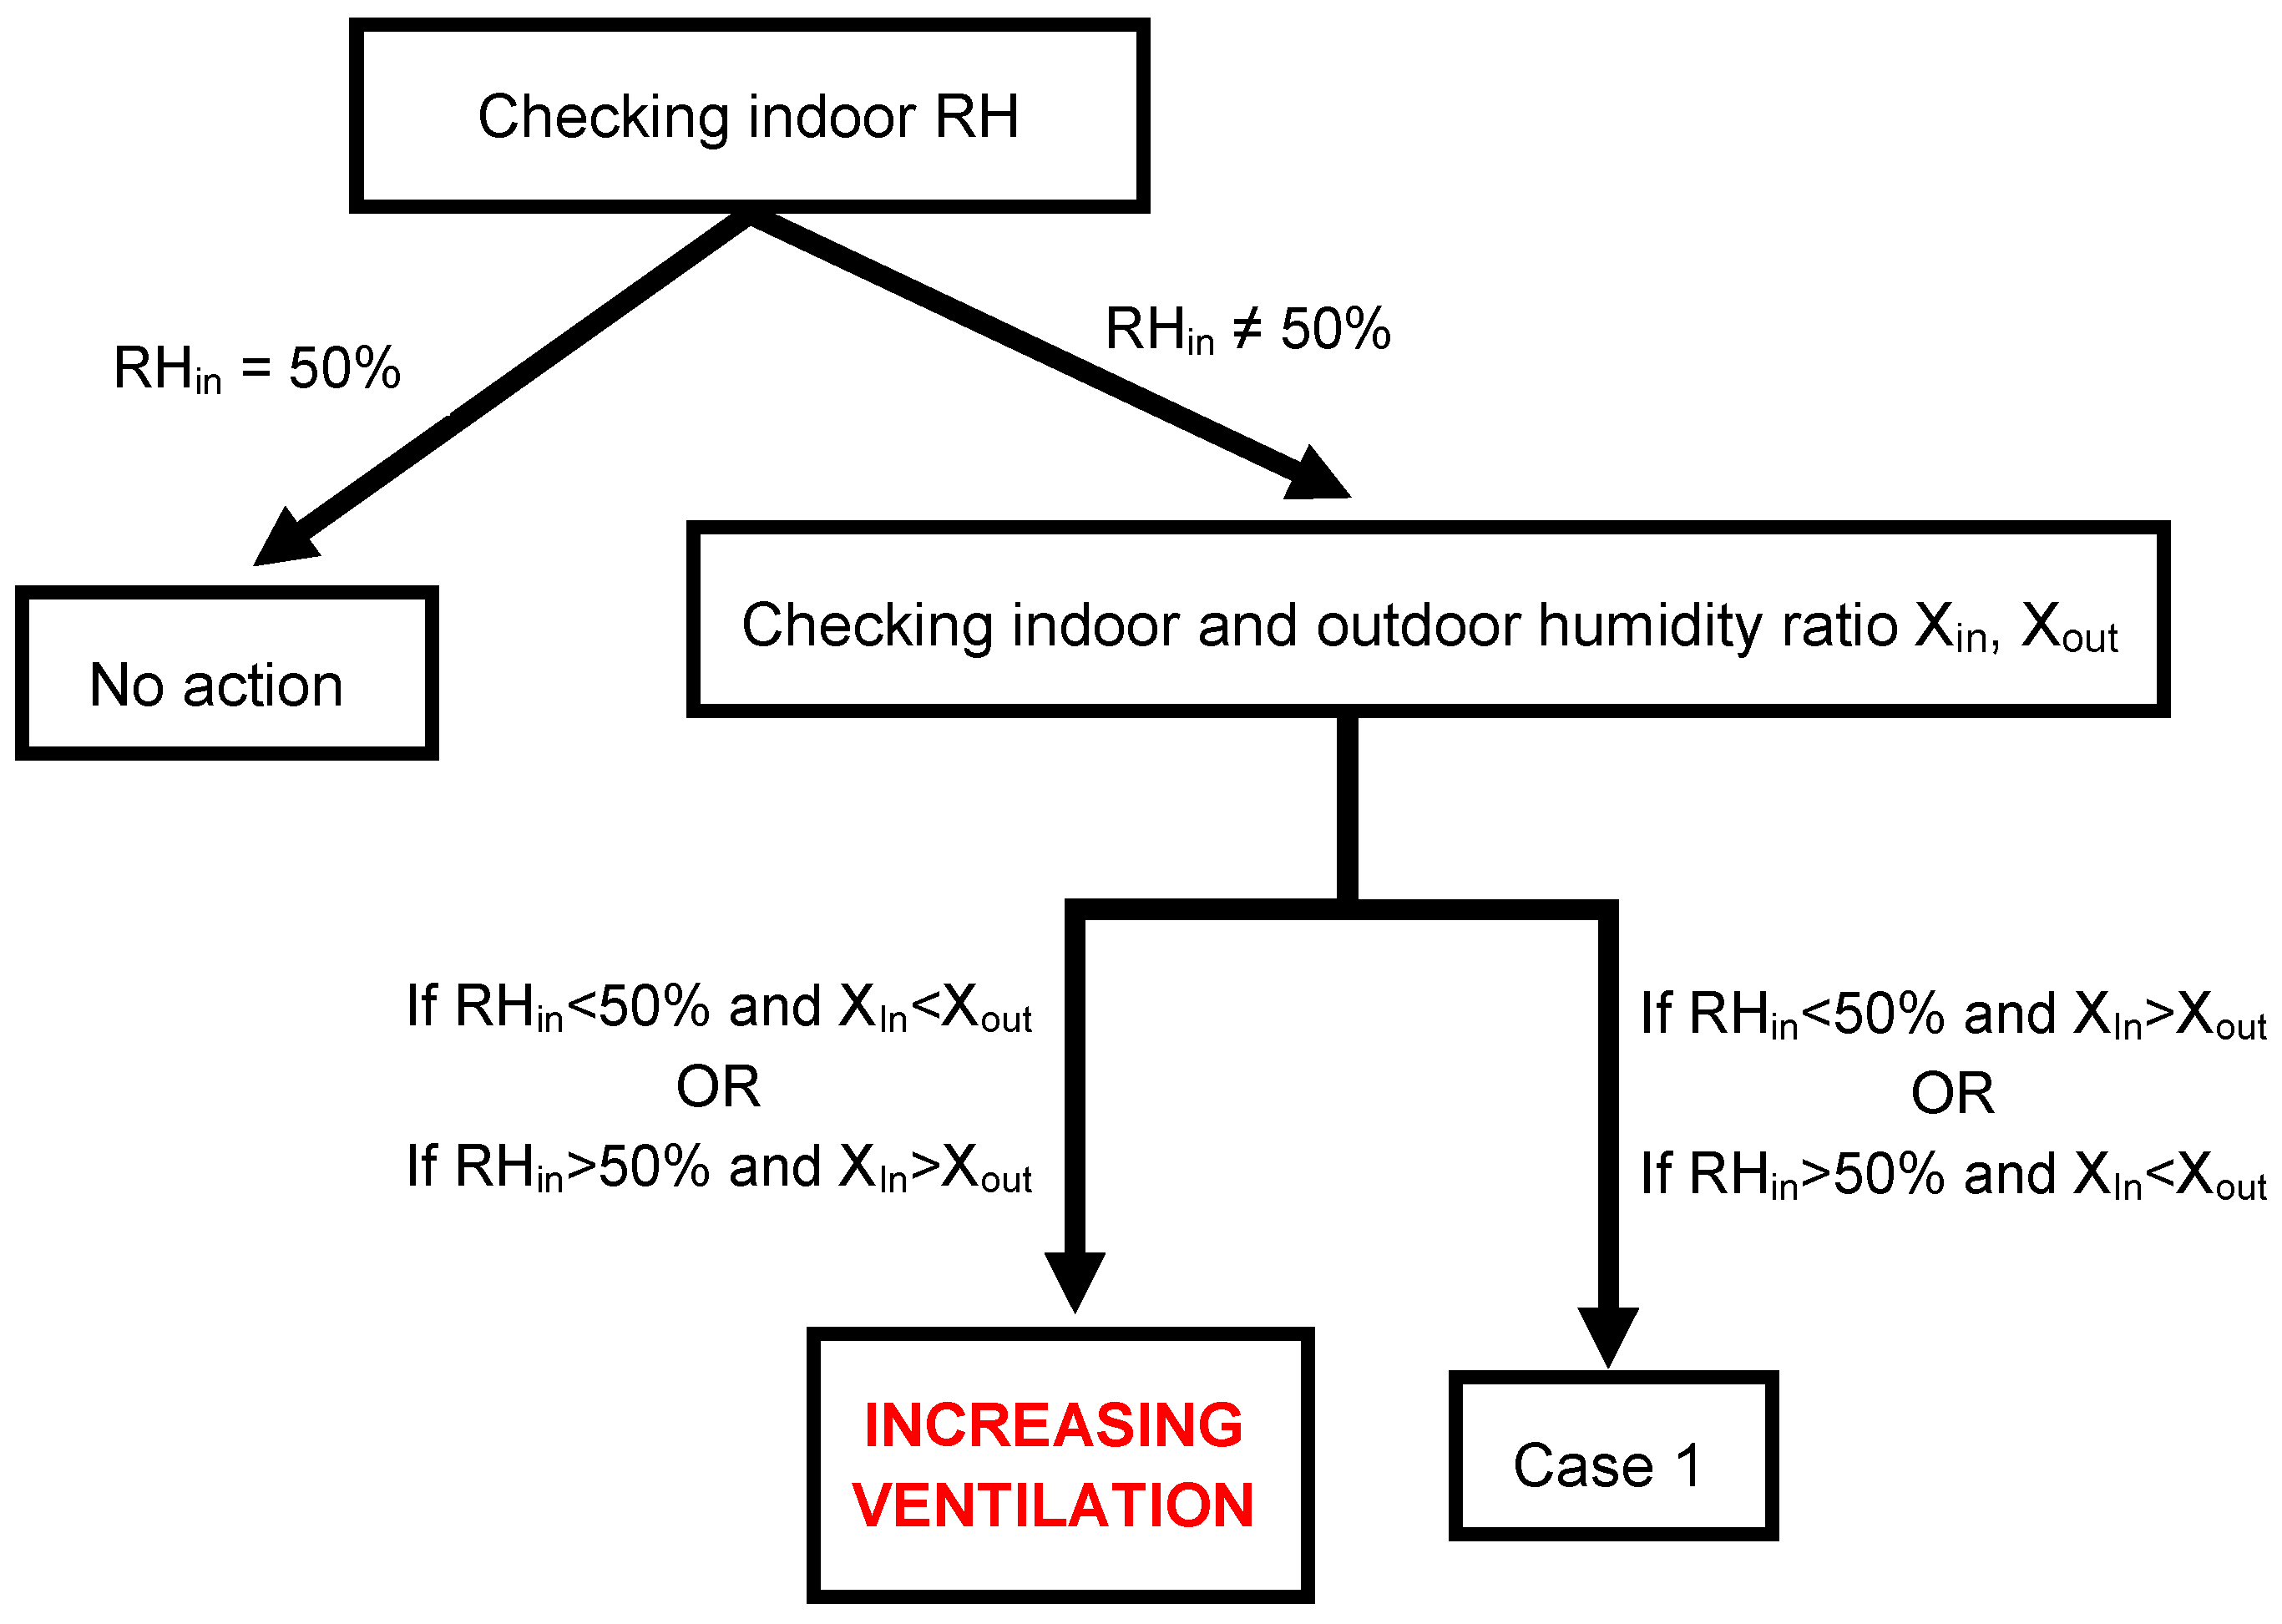
- Case 3: The temperature is controlled to 21 ± 2 °C by a heating or cooling system throughout the whole year and the relative humidity is controlled by changing the temperature or by changing the ventilation airflow. A hybrid natural/mechanical ventilation system is introduced. If necessary, the outdoor air fans are activated to supply additional airflow into the room. The control system algorithm is presented in Figure 5. The maximum supply airflow is 1100 m3/h (Air change rate is 0.5 h−1), to avoid local discomfort in winter. The Moliere curve was used to calculate the humidity ratio in the control algorithm.
- Case 4: Like case 3 but the relative humidity is set to 40% in winter and 60% in the summer. From May 1 to 31, the set point for RH is gradually increased from 40% to 60%, in November the reverse is applied. These periods were selected after analyzing the annual variation in the relative humidity in the base building.
As detailing the full HVAC system was not the major goal of this study, an ideal heating, ventilation, and air conditioning system was used to calculate the heating and cooling loads. The HVAC Manager in EnergyPlus ignored the actual HVAC system and instead calculated the design zone loads and air flow rates using an ideal zonal system [43].
4. Results
The proposed control strategies were implemented on the ethnography exhibition hall—part 1 (volume 2200 m3). Figure 6 and Figure 7 show the variability in the hourly values of the indoor relative humidity and temperature for a six-month period from the beginning of February until the end of July. This period includes the fully-heating months as well as the transitional period and the summer period. The performance index values (PI) [26,29,51] were also determined (Table 4 and Table 5). In this study, PI is the share of the year when the amplitude of the hourly values of indoor RH is less than ±5% or ±10% from the set point. The cold (winter) season is considered as the period beginning from October 1 and ending on May 15; the rest of the year is considered warm (summer).
For the base cases, the relative humidity was well below 50% in winter and well above 50% in summer. For more than 85% of the year, the RH exceeded the range of 50 ± 5%. In winter and the transitional period, none of the proposed systems produced stable relative humidity. In summer, the control strategies in cases 3 and 4 significantly improved the indoor conditions.
The control systems in cases 1 and 2 required only correct controller programming with both T and RH (then converted into humidity ratio) inputs. This methodology only slightly reduced RH fluctuations. For the year-round period, the periods with a RH amplitude higher than ±5% dropped to 77% for case 1 and to 64% (or 71% for less stable gains) for case 2. During the summer and winter periods, these times were similar but only for variant A, producing more stable internal heat gains. For variant B with less stable gains, controlling only the temperature did not produce such a good effect during the summer season. The length of the warm period with good microclimatic conditions was shorter by about half. However, an improved effect was produced with this variant over the winter period. The performance index for case 2 was higher than for case 1, but the temperature was maintained for most of the year in the extreme ranges: during the winter at 16 °C and during the summer at 26 °C. This result required activation of the heating system even in the summer period (Figure 8), and the cooling system was practically not used (for the adopted internal heat gains). In case 2, the room microclimate can only qualify class B in terms of temperature stabilization in accordance with the ASHRAE standard [18]. The internal heat gains were more unstable; therefore, case 2 is less effective. Case 1 produces approximately similar annual effects.
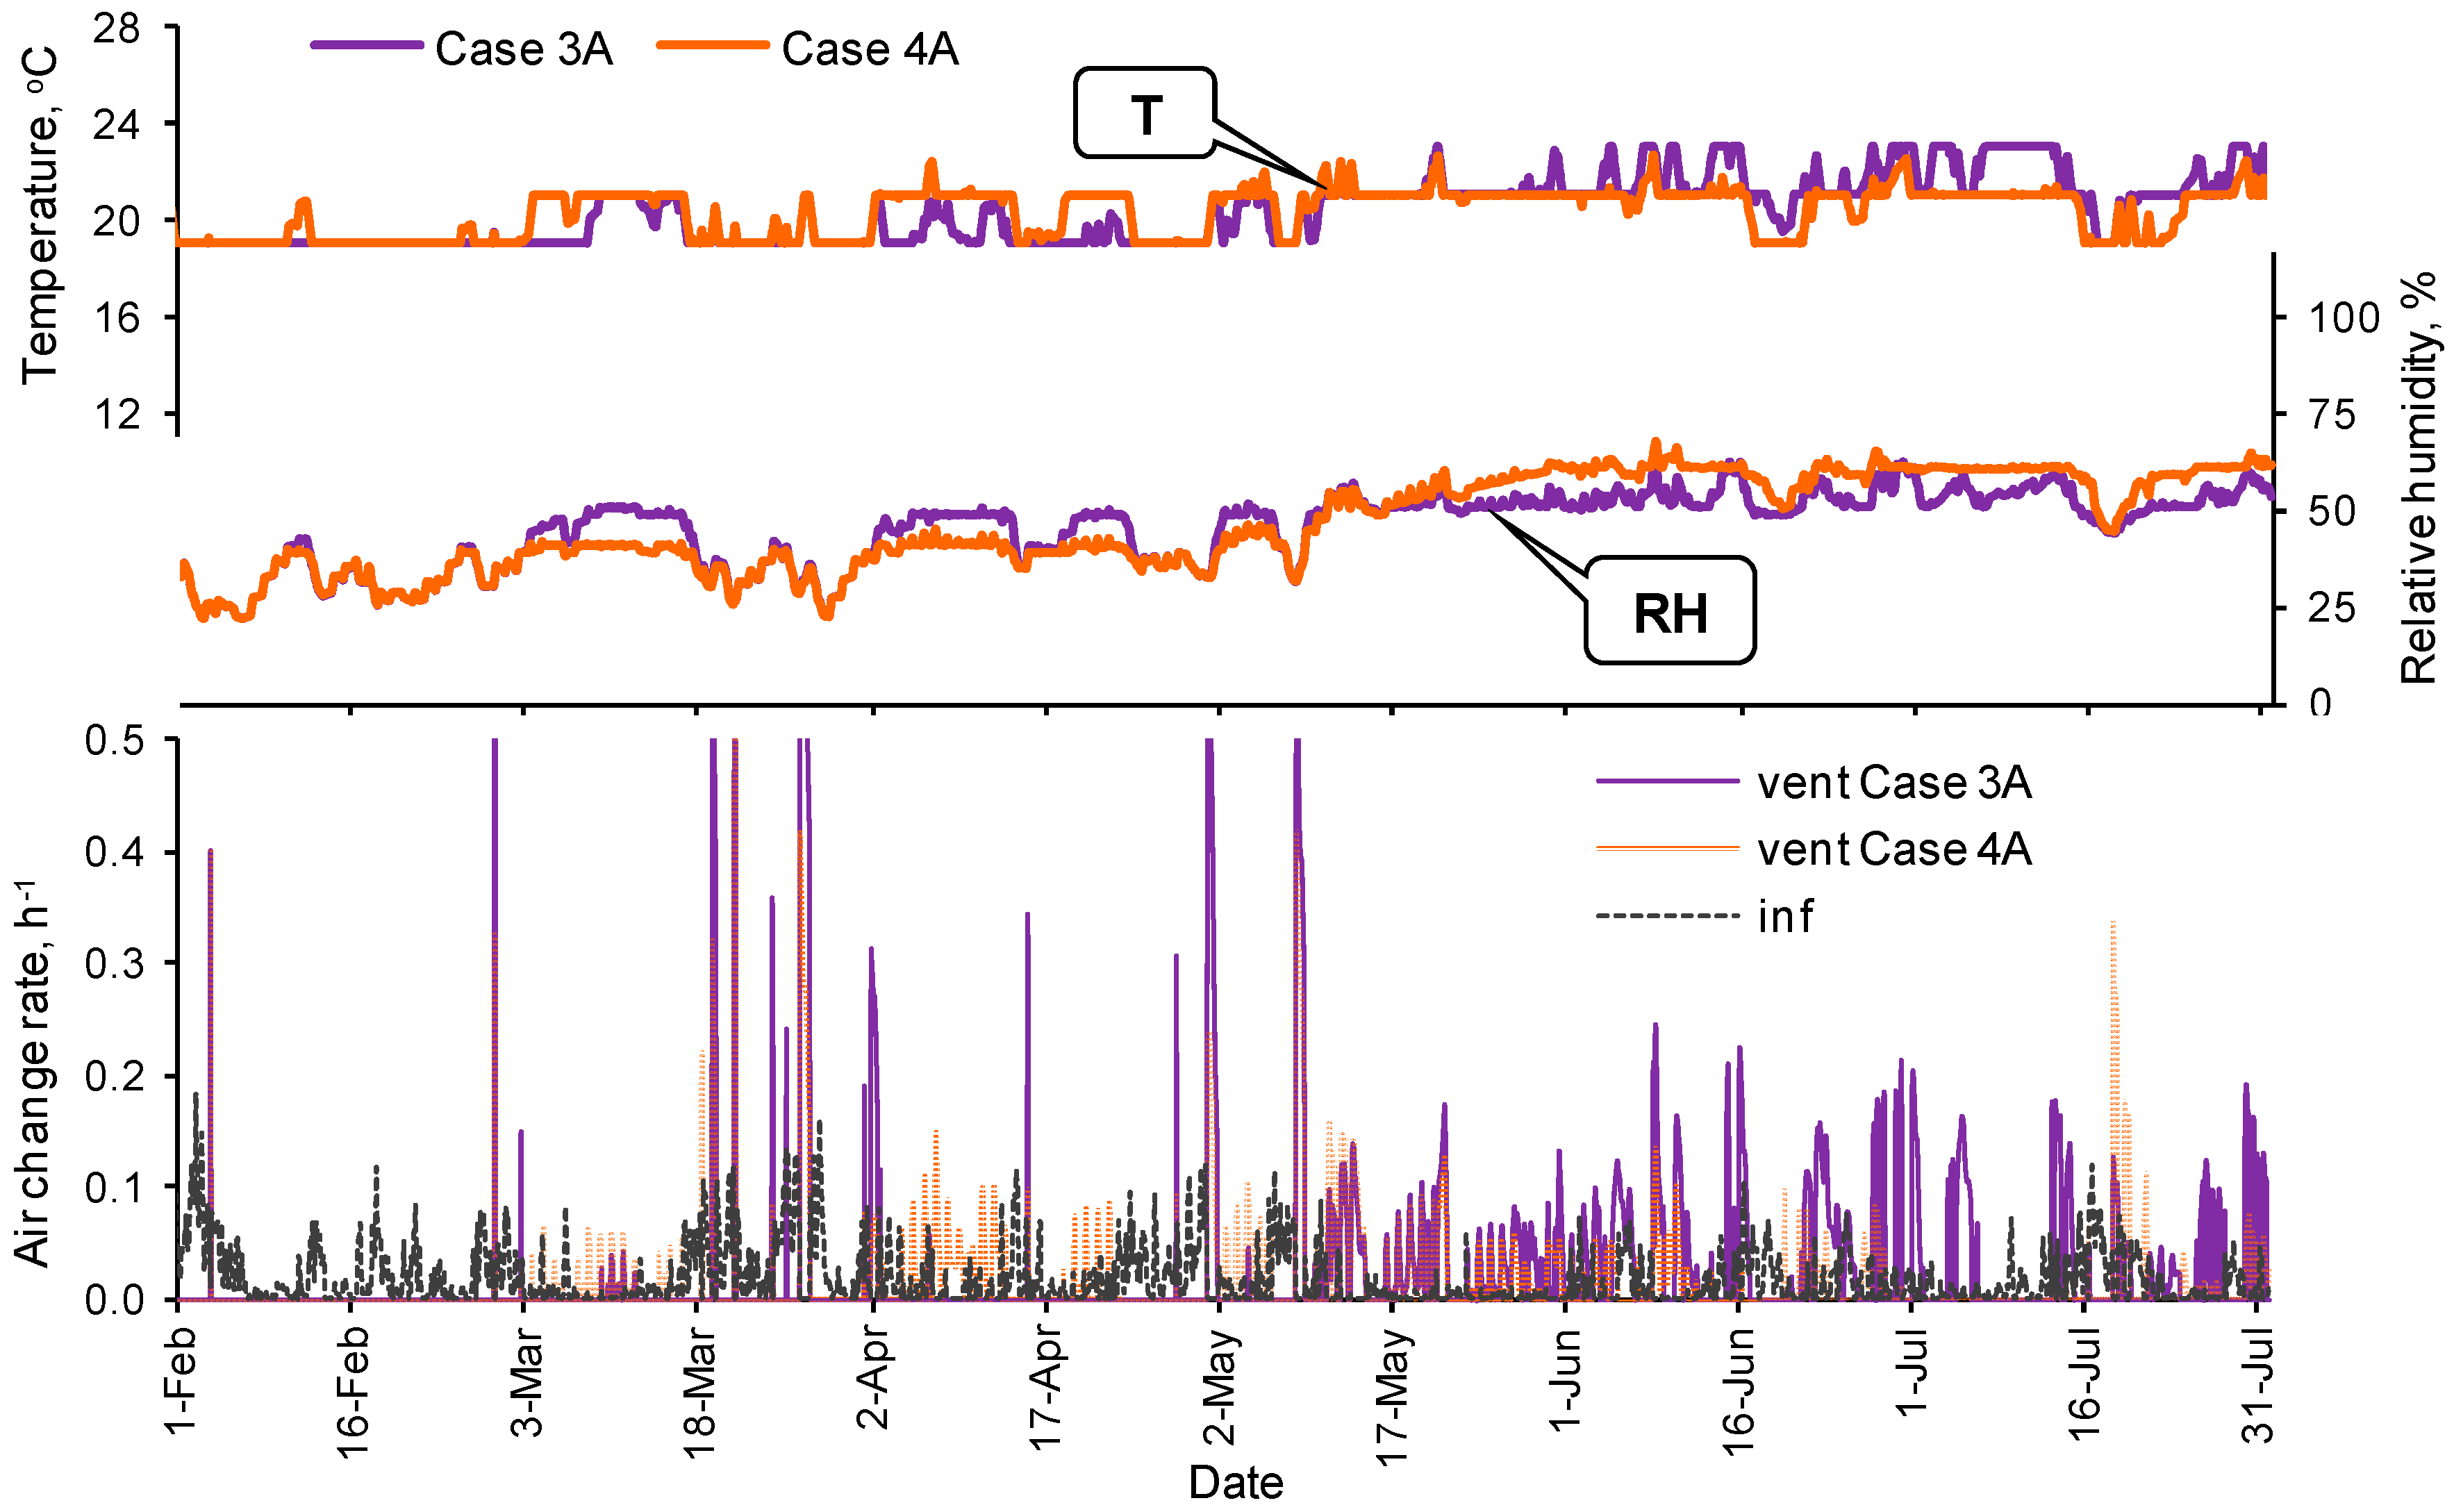
Case 3 allowed for the provision of good microclimate conditions for more than half a year. In winter, additional airflow in case 3 was rarely activated, so the period when relative humidity exceeded 50 ± 5% was still large and covered about half of the winter period (for variant B microclimate conditions were slightly better). In winter, the indoor RH was almost always too low, and the moisture content of the outdoor air was usually lower than inside. However, maintaining a flat relative humidity produces higher small fluctuations to ±10% according to Table 1. The time interval during which the amplitudes of the hourly RH values did not exceed ±10% was above 70% of the year (for both heat gain variants). In the summer, the additional ventilation airflow significantly reduced the period during which fluctuations exceeded the set point. The RH amplitude did not exceed ±5% for 70% (variant A) or 60% (variant B) of this season. Only for 10–14% of the time did the fluctuations exceed ±10%. The air change rate typically did not exceed 0.2 h–1 (Figure 7), so the airflow was less than 500 m3/h for much of the time. The fans were used for 2379 hours, which was 27% of the annual period in variant A with more stable heat gains and for 2645 hours, which was 30% of the year for the variant B.
Case 4 shows that, under moderate climate conditions, the variable seasonal adjustment in the system set point—down by 10% RH in the winter and up by 10% RH in the summer—is much more beneficial for maintaining the required microclimate. This occurred because in the cold (heating) period, the indoor relative humidity is usually lower than in the summer season. This is clearly visible in Figure 6 (base case). Category A, according to ASHRAE [18], also allows such a scenario but short fluctuations in relative humidity should not exceed ±5%. Relative to cases 1 and 3, conditions were significantly improved in case 4. The amplitude of the hourly relative humidity values exceeded the assumed set points for only about 20% of the year (on average –57 percentage points with respect to case 1 and –25 percentage points when compared to case 3). The use of regulated RH levels during the year and additional ventilation with the use of outdoor air produced good results. The fans operated for 1665 or 2524 hours, which was 19% or 29% of the year, for variants A and B, respectively.
The study has shown that for two adopted internal heat gains profiles, which are more or less stable, maintaining stable humidity conditions for most of the year is relatively easy. A significant effect was produced during the summer period. In the variant B (less stable internal heat gains), the required microclimate conditions were produced during the entire warm (summer) season.
Each of the proposed strategies affected the cooling and heating demand; however, the impact was not as significant as the influence on the quality of the microclimate (Table 6). The obtained heating demand values were rather high, from 98 to 135 kWh/m2 per year; however, the building is not retrofitted, which results in large heat losses in winter. This non-retrofitted characteristic defines the majority of existing museum buildings. A higher heat demand was calculated for cases 1 and 2 than in the base case, even though the indoor temperature for the base case was maintained at a higher level (20 °C) most of the winter season. For case 1, the indoor temperature was usually 19 °C and for the case 2, it was 16 °C, which resulted in lower instantaneous heating demand. However, in the base case, the heating system worked only for 62% of the year (the temperature was not maintained in the summer season). Maintaining the air temperature oscillating around 21°C throughout the whole year required heating of the room for most of the year. Regardless of the heat gains variant and the proposed control system, heating was activated for about 90% of the year or, in some cases, even more often. In the considered moderate microclimate, the share of the heat demand of the total energy demand was much higher than the demand for cooling. This was also highlighted in other publications [52]. However, the ratio of the heating demand and the cooling demand is strictly related to the climatic conditions [53].
In the museum building under consideration, the cooling demand was only 0.6–3.7% of the total demand. The cooling system worked only on the warmest days of the year. This system was activated most often in the case 4 (about 10% of the year), which resulted in the largest cooling demand. In turn, the most heat-consuming case was case 2, which resulted from the time of its operation, almost a whole year, even in the hottest periods. Paradoxically, for variant B with more unstable and greater instantaneous internal heat gains, a higher demand for heating was observed. In case 2, this demand was 13% higher. This is caused by different instantaneous variations in the indoor temperature and longer operation time of the heating system (in this case, by 132 h). In other cases, the differences were smaller.
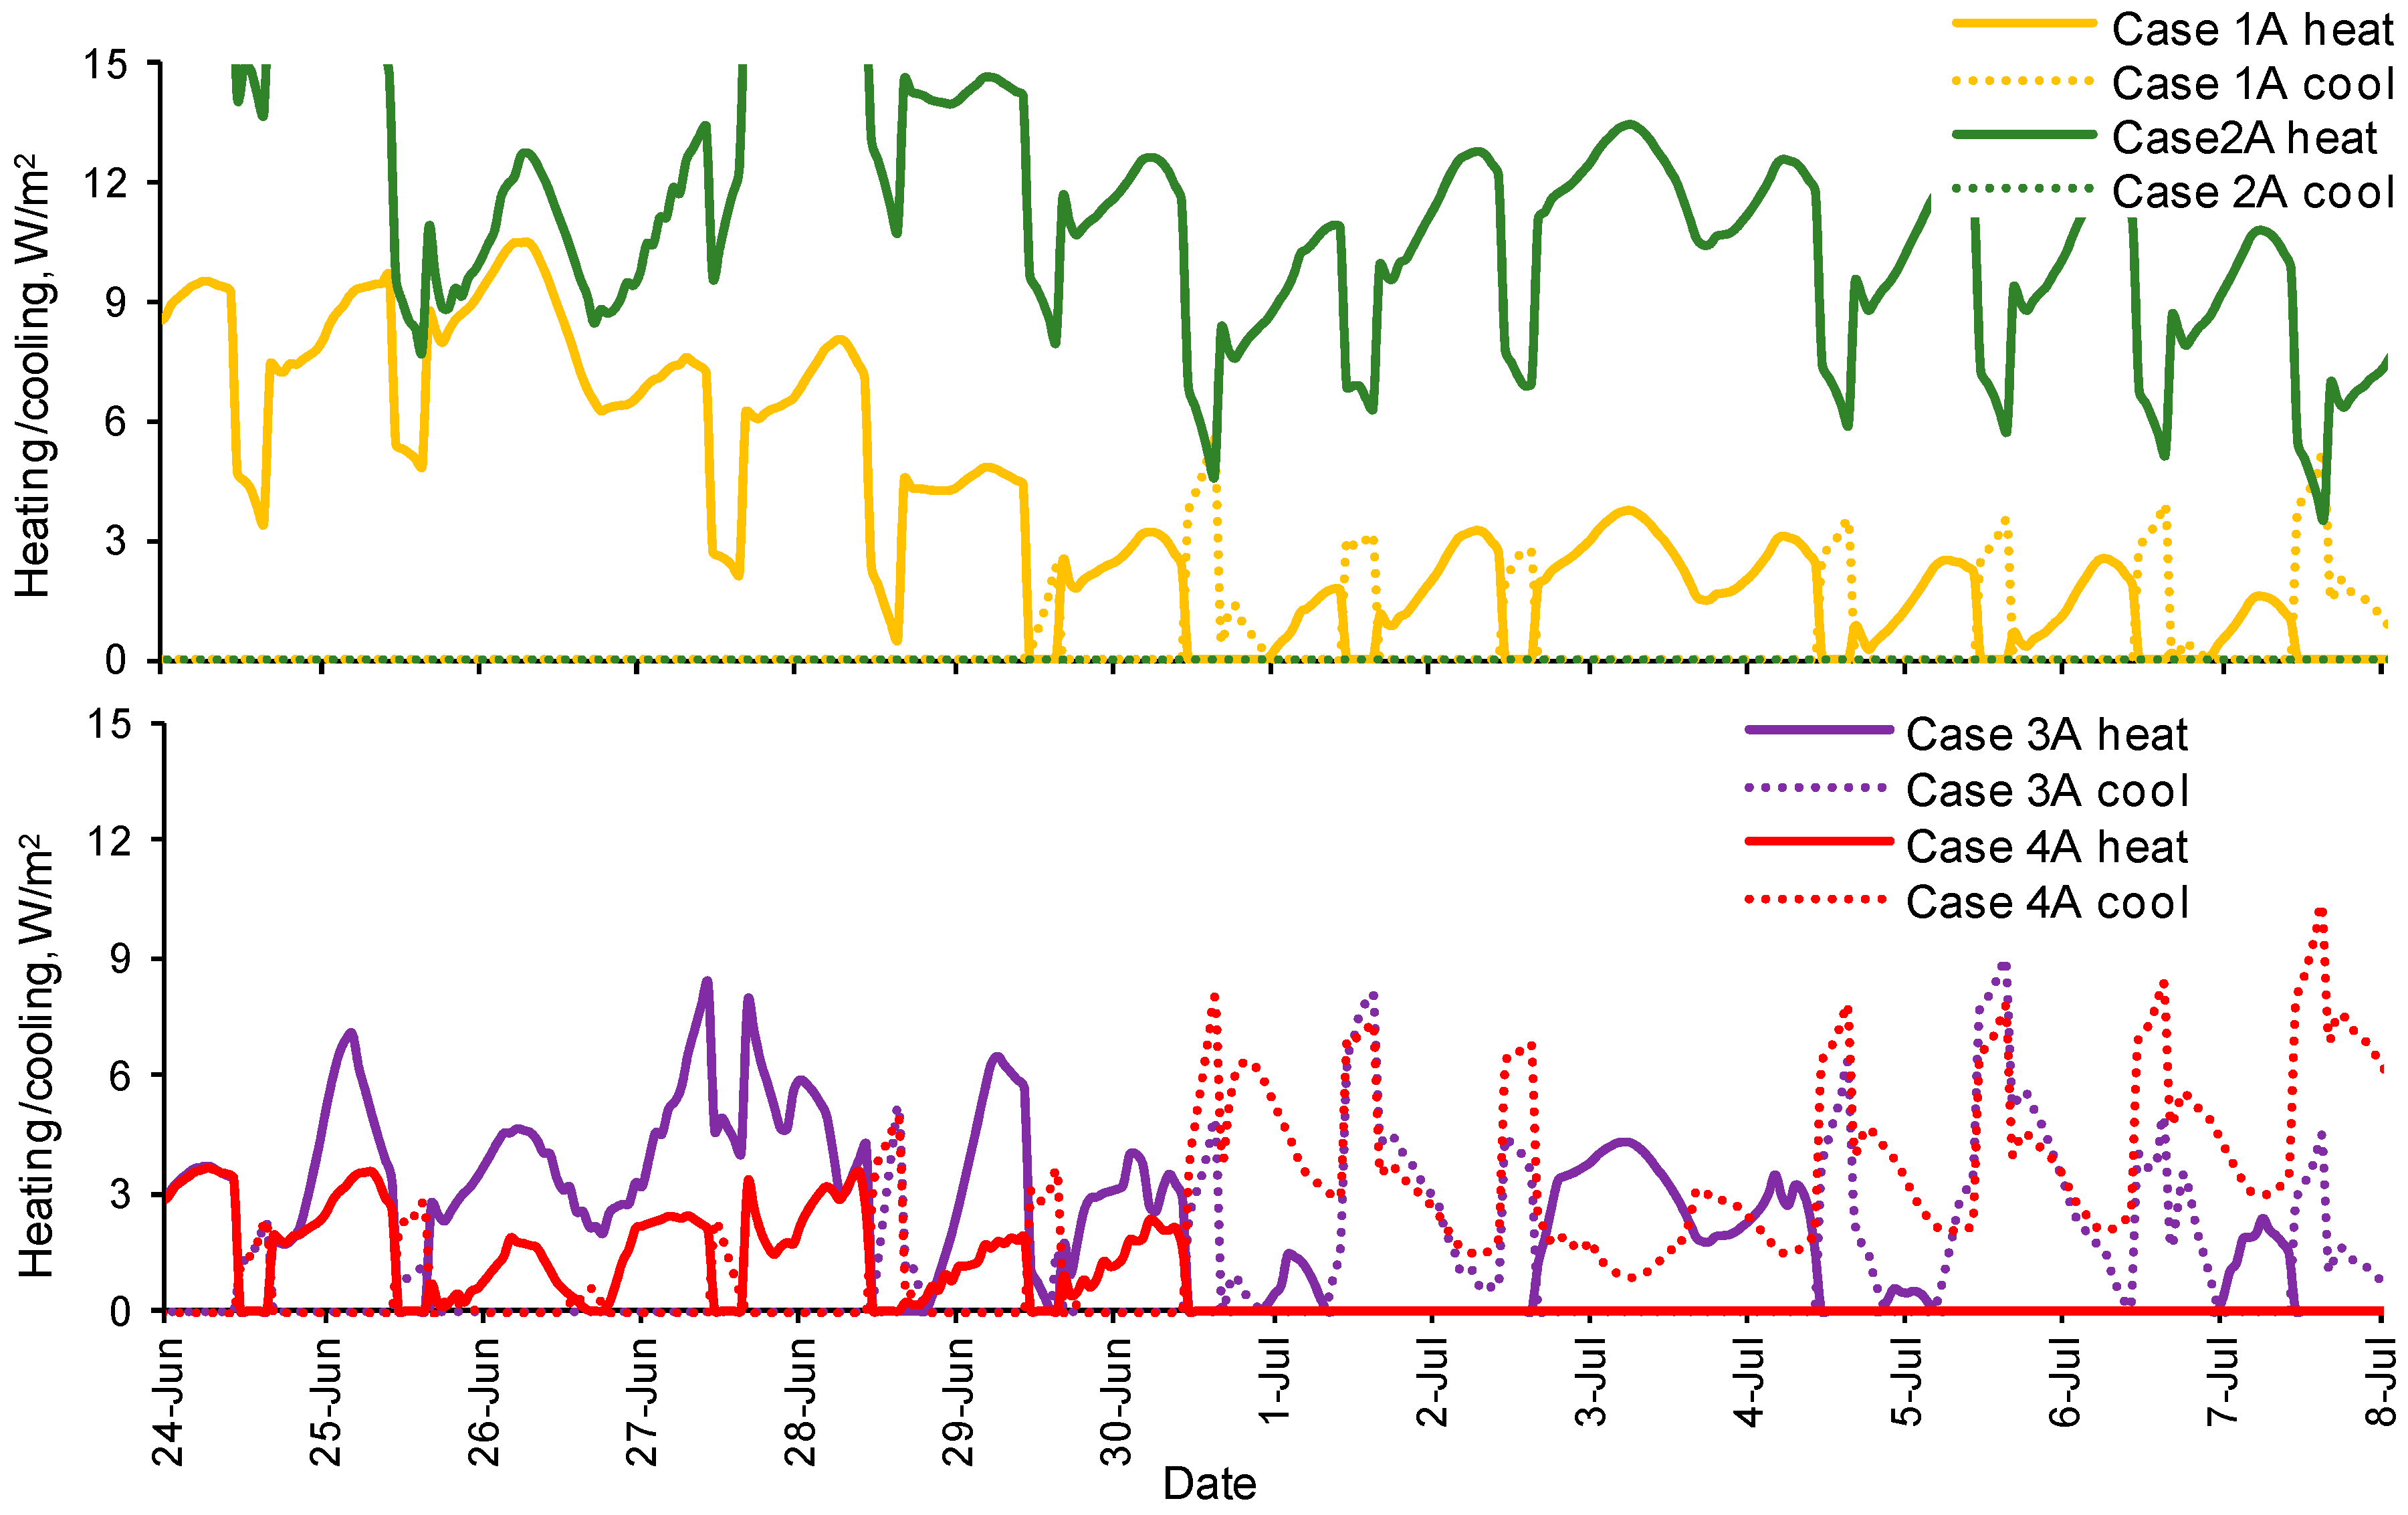
The proposed systems, with the use of additional ambient airflow, proved to be beneficial not only from the microclimate point of view but also for energy consumption (Table 6). Heat demand was lower for case 3B when compared to case 1B by almost 20%. A larger airflow provided more heat to the room, especially during the summer and transitional periods, which increased the heat gain in the heat balance of the room. Therefore, these systems required the delivery of the most cooling (the percentage increases are significant but the absolute values are small). This is clearly visible in Figure 8. The instantaneous heating demand in cases 3 and 4 is significantly lower than in cases 1 and 2; for the cooling demand, the situation is reversed. In all variants with additional airflow, the total energy demand for heating and cooling was lower compared to cases without this option.
Additional fans, however, require additional electricity. Assuming that there are two fans in the hall with a maximum capacity of 550 m3/h and a power of ~100 W, the annual energy consumption can be calculated as 0.55–0.88 kWh/m2. For comparison, the monthly electricity consumption for lighting is 0.50 kWh/m2 on average. So, annual energy consumption for fans is not more than 15% of the annual energy consumption for lighting.
In summary, the obtained effects are similar for the two adopted internal heat gains profiles. This means that, regardless of internal loads, the systems can be implemented in the analyzed museum. Due to the greater instantaneous internal heat and moisture gains, the fans operate more often.
5. Conclusions
Controlling only the indoor temperature slightly improves the microclimate conditions: the temperature falls into the required range, but the RH fluctuations exceed ±5% for more than 65% of the year. Lowering the temperature results in a relatively small increase in the low relative humidity during the heating season; however, daily RH fluctuations are at a similar level as in the case with constant temperature. In the variant with more stable internal heat gains, similar effects are achieved in all periods throughout the year. If the internal load changes more dynamically (larger instantaneous internal gains), the annual effect is slightly worse, whereas the effect in the winter is better but much worse in the summer.
The combination of temperature control and ventilation airflow control significantly improves the microclimate in the museum with a minimal additional investment cost—purchase and installation of fans only. For a significant part of the year, the exhibition hall meets the requirements of class A and class AA for about a half of the year according to the ASHRAE standard [18].
Strategies with additional ventilation had significantly greater impact on the microclimate over the summer period. In case 4 for more than 93% the period, RH fluctuations did not exceed ±5%. The proposed systems with additional ventilation are not sensitive to the number of visitors. Thus, the methods can be used for various occupancy conditions in the museum. The temperature controlling cases increase heating and cooling energy demand; however, in the analyzed variants of internal heat gains, this demand was increased by no more than 11%. The use of the proposed strategies requires heating of the museum premises for most of the year, and in some cases even on the hottest days. The cooling system rarely ran.
In cases with additional ventilation, the energy demand for the heating decreases and the energy demand for the cooling increases, which is caused by an increase in heat gains from ventilation in the heat balance of the room. The use of an additional fans in the exhibition hall results in a higher electricity consumption; however, the power demand for such fans is small. The more unstable the internal heat and moisture loads, the more frequently the fans work. However, calculations showed that the fans operate in total for no more than a one-third of the year. When hybrid ventilation is applied, additional de- or humidification devices are not needed. In winter, the installation of an additional humidifier should be considered.
We recommend a control system with seasonal adjustments in the RH set point: down 10% RH in winter and a 10% increase in RH in summer. It is better to allow smaller short-term RH fluctuations and introduce a variable relative humidity set point during the year (40% in winter and 60% in summer). With a constant RH set point (50%), the microclimate in the room met the requirements of class A for more 70% of the year with the use of hybrid ventilation, and for 37–51% of the year with only with natural ventilation. With a variable RH set point, compliance with class A was about 80% of the year. The proposed system assumes the purchase of fans by the museum and the configuration of the correct control algorithm basing on instantaneous T and RH measurements. We did not consider specific HVAC devices or their efficiency, which may be the subject of future research, especially since some recent studies [54] showed considerable variations in energy consumption depending on the HVAC efficiency.
Author Contributions
Literature review, study design, results analyzes, writing—original draft preparation J.F.-G.; model, validation, simulations, writing—review and editing, K.G.
Funding
This research received no external funding.
Acknowledgments
The work was supported by Polish Ministry of Science and Higher Education, within statutory research projects BK-220/RIE1/2019 and BK-207/RB-5/2018.
Conflicts of Interest
The authors declare no conflict of interest.
References
- Sciurpi, F.; Carletti, C.; Cellai, G.; Pierangioli, L. Environmental monitoring and microclimatic control strategies in “La Specola” museum of Florence. Energy Build. 2015, 95, 190–201. [Google Scholar] [CrossRef]
- Haiad, J.C.; Druzik, J.; Ayres, J.M.; Lau, H. Museum environmental requirements: A literature survey. ASHRAE Trans. 1990, 96, 112–121. [Google Scholar]
- Thomson, G. The Museum Environment, 2nd ed.; Butterworth-Heinemann: London, UK, 1986. [Google Scholar]
- Webb, A.L. Energy retrofits in historic and traditional buildings: A review of problems and methods. Renew. Sustain. Energy Rev. 2017, 77, 748–759. [Google Scholar] [CrossRef]
- Schito, E.; Testi, D. Integrated maps of risk assessment and minimization of multiple risks for artworks in museum environments based on microclimate control. Build. Environ. 2017, 123, 585–600. [Google Scholar] [CrossRef]
- Lucchi, E. Multidisciplinary risk-based analysis for supporting the decision making process on conservation, energy efficiency, and human comfort in museum buildings. J. Cult. Herit. 2016, 22, 1079–1089. [Google Scholar] [CrossRef]
- Gebhardt, C.; Konopka, D.; Börner, A.; Mäder, M.; Kaliske, M. Hygro-mechanical numerical investigations of a wooden panel painting from “Katharinenaltar” by Lucas Cranach the Elder. J. Cult. Herit. 2018, 29, 1–9. [Google Scholar] [CrossRef]
- Silva, H.E.; Henriques, F.M.A. Preventive conservation of historic buildings in temperate climates. The importance of a risk-based analysis on the decision-making process. Energy Build. 2015, 107, 26–36. [Google Scholar] [CrossRef]
- Ascione, F.; de Rossi, F.; Vanoli, G.P. Energy retrofit of historical buildings: Theoretical and experimental investigations for the modelling of reliable performance scenarios. Energy Build. 2011, 43, 1925–1936. [Google Scholar] [CrossRef]
- Bøhm, B.; Ryhl-Svendsen, M. Analysis of the thermal conditions in an unheated museum store in a temperate climate. On the thermal interaction of earth and store. Energy Build. 2011, 43, 3337–3342. [Google Scholar] [CrossRef]
- Camuffo, D.; Pagan, E.; Bernardi, A.; Becherini, F. The impact of heating, lighting and people in re-using historical buildings: A case study. J. Cult. Herit. 2004, 5, 409–416. [Google Scholar] [CrossRef]
- ASHRAE Standard 55–2017 Thermal Environmental Conditions for Human Occupancy; American Society of Heating, Refrigerating and Air Conditioning Engineers: Atlanta, GA, USA, 2017.
- EU Standard EN 15251:2007 Indoor Environmental Input Parameters for Design and Assessment of Energy Performance of Buildings Addressing Indoor Air Quality, Thermal Environment, Lighting and Acoustics; European Committee for Standardization: Brussels, Belgium, 2007.
- Lucchi, E. Simplified assessment method for environmental and energy quality in museum buildings. Energy Build. 2016, 117, 216–229. [Google Scholar] [CrossRef]
- EU Standard CEN TC 346 Standard, Conservation of Cultural Heritage; European Committee for Standardization: Brussels, Belgium, 2009–2014.
- EU Standard CEN CR 1752 Standard, Ventilation for Buildings—Design Criteria for the Indoor Environment; European Committee for Standardization: Brussels, Belgium, 1998.
- EU Standard EN 15757:2010 Conservation of Cultural Property—Specifications for Temperature and Relative Humidity to Limit Climate-induced Mechanical Damage in Organic Hygroscopic Materials; European Committee for Standardization: Brussels, Belgium, 2010.
- American Society of Heating, Refrigerating and Air Conditioning Engineers. ASHRAE Handbook—HVAC Applications. Chapter 23: Museums, Galleries, Archives, and Libraries, SI ed.; American Society of Heating, Refrigerating and Air-Conditioning Engineers: Atlanta, GA, USA, 2015. [Google Scholar]
- Italian Standard UNI 10586:1997 Documentation—Climatic Conditions to Document Storage of Graphic Documents and Characteristics of Lodging; Uni Ente Italiano Di Normazione: Rome, Italy, 1997. (In Italian)
- Italian Standard UNI 10829:1999 Works of Art of Historical Importance—Ambient Conditions or the Conservation—Measurement and Analysis; Uni Ente Italiano Di Normazione: Rome, Italy, 1999. (In Italian)
- Italian Standard UNI 10969:2002 Cultural Heritage—General Principles for the Choice and the Control of the Microclimate to Preserve Cultural Heritage in Indoor Environments; Uni Ente Italiano Di Normazione: Rome, Italy, 2002. (In Italian)
- International Institute of Conservation. IIC 2014. Joint IIC—ICOM CC Declaration on Environmental Guidelines. Available online: http://www.iiconservation.org/node/5168 (accessed on 10 January 2019).
- Lucchi, E. Review of preventive conservation in museum buildings. J. Cult. Herit. 2018, 29, 180–193. [Google Scholar] [CrossRef]
- Lamonaca, F.; Pizzuti, G.; Arcuri, N.; Palermo, A.M.; Morello, R. Monitoring of environmental parameters and pollution by fungal spores in the National Gallery of Cosenza: A case of study. Measurement 2014, 47, 1001–1007. [Google Scholar] [CrossRef]
- López-Aparicio, S.; Smolík, J.; Masková, L.; Soucková, M.; Grøntoft, T.; Ondrácková, L.; Stankiewicz, J. Relationship of indoor and outdoor air pollutants in a naturally ventilated historical building envelope. Build. Environ. 2011, 46, 1460–1468. [Google Scholar]
- Corgnati, S.P.; Fabi, V.; Filippi, M. A methodology for microclimatic quality evaluation in museums. Application to a temporary exhibit. Build. Environ. 2009, 44, 1253–1260. [Google Scholar] [CrossRef]
- Ascione, F.; Minichiello, F. Microclimatic control in the museum environment: Air diffusion performance. Int. J. Refrig. 2010, 33, 806–814. [Google Scholar] [CrossRef]
- Ferdyn-Grygierek, J.; Grygierek, K. HVAC control methods for drastically improved hygrothermal museum microclimates in warm season. Build. Environ. 2019, 149, 90–99. [Google Scholar] [CrossRef]
- Schijndel, A.W.M.; Schellen, H.L.; Wijffelaars, J.L.; van Zundert, K. Application of an integrated indoor climate, HVAC and showcase model for the indoor climate performance of a museum. Energy Build. 2008, 40, 647–653. [Google Scholar] [CrossRef]
- Ascione, F.; Bellia, L.; Capozzoli, A.; Minichiello, F. Energy saving strategies in air-conditioning for museums. Appl. Therm. Eng. 2009, 29, 676–686. [Google Scholar] [CrossRef]
- Sharif-Askari, H.; Abu-Hijleh, B. Review of museums’ indoor environment conditions studies and guidelines and their impact on the museums’ artifacts and energy consumption. Build. Environ. 2018, 143, 186–195. [Google Scholar] [CrossRef]
- Kramer, R.; Schellen, H.; van Schijndel, A. Impact of ASHRAE’s museum climate classes on energy consumption and indoor climate fluctuations: Full-scale measurements in museum Hermitage. Amsterdam. Energy Build. 2016, 130, 286–294. [Google Scholar] [CrossRef]
- Kramer, R.; van Schijndel, J.; Schellen, H. Dynamic setpoint control for museum indoor climate conditioning integrating collection and comfort requirements: Development and energy impact for Europe. Build. Environ. 2017, 118, 14–31. [Google Scholar] [CrossRef]
- Kramer, R.P.; Maas, M.P.E.; Martens, M.H.J.; van Schijndel, A.W.M.; Schellen, H.L. Energy conservation in museums using different setpoint strategies: A case study for a state-of-the-art museum using building simulations. Appl. Energy 2015, 158, 446–458. [Google Scholar] [CrossRef]
- Kupczak, A.; Sadłowska-Sałęga, A.; Krzemień, L.; Sobczyk, A.; Radoń, J.; Kozłowski, R. Impact of paper and wooden collections on humidity stability and energy consumption in museums and libraries. Energy Build. 2018, 158, 77–85. [Google Scholar] [CrossRef]
- Živković, V.; Džikić, V. Return to basics—Environmental management for museum collections and historic houses. Energy Build. 2015, 95, 116–123. [Google Scholar] [CrossRef]
- Muñoz-González, C.; León-Rodríguez, Á.; Suárez Medina, R.; Teeling, C. Hygrothermal performance of worship spaces: Preservation, comfort, and energy consumption. Sustainability 2018, 10, 3838. [Google Scholar] [CrossRef]
- Janssen, H.; Christensen, J.E. Hygrothermal optimisation of museum storage spaces. Energy Build. 2013, 56, 169–178. [Google Scholar] [CrossRef]
- Romano, F.; Colombo, L.P.M.; Gaudenzi, M.; Joppolo, C.M.; Romano, L.P. Passive control of microclimate in museum display cases: A lumped parameter model and experimental tests. J. Cult. Herit. 2015, 16, 413–418. [Google Scholar] [CrossRef]
- Rota, M.; Corgnati, S.P.; Di Corato, L. The museums in historical buildings: Energy and systems. The project of the Fondazione Musei Senesi. Energy Build. 2015, 95, 138–143. [Google Scholar] [CrossRef]
- Kramer, R.; van Schijndel, J.; Schellen, H. Dynamic setpoint calculation including collection and comfort requirements: Energy impact for museums in Southern Europe. Energy Procedia 2017, 133, 195–206. [Google Scholar] [CrossRef]
- Korotcenkov, G. Handbook of Humidity Measurement Methods: Materials and Technologies; Taylor & Francis Group, LLC: Abingdon, UK, 2018; Available online: https://www.routledgehandbooks.com/doi/10.1201/b22369-3 (accessed on 10 January 2019).
- Engineering Reference, EnergyPlus™ Version 8.7 Documentation; U.S. Department of Energy: Washington, DC, USA, 2016. Available online: https://energyplus.net/sites/all/modules/custom/nrel_custom/pdfs/ pdfs_v8.7.0/EngineeringReference.pdf (accessed on 12 February 2018).
- Ferdyn-Grygierek, J. Monitoring of indoor air parameters in large museum exhibition halls with and without air-conditioning systems. Build. Environ. 2016, 107, 113–126. [Google Scholar] [CrossRef]
- Ferdyn-Grygierek, J. Indoor environment quality in the museum building and its effect on heating and cooling demand. Energy Build. 2014, 85, 32–44. [Google Scholar] [CrossRef]
- Walton, W.G.N.; Dols, S. CONTAM 2.4 User Guide and Program Documentation; National Institute of Standards and Technology: Gaithersburg, MD, USA, 2005.
- Ferdyn-Grygierek, J.; Baranowski, A. Internal environment in the museum building—Assessment and improvement of air exchange and its impact on energy demand for heating. Energy Build. 2015, 92, 45–54. [Google Scholar] [CrossRef]
- Typical Meteorological and Statistical Climatic Data for the Energy Calculation of Buildings. Available online: https://www.miir.gov.pl/strony/zadania/budownictwo/charakterystyka-energetyczna-budynkow/dane-do-obliczen-energetycznych-budynkow-1/ (accessed on 10 January 2019).
- Ferdyn-Grygierek, J.; Lubina, P.; Kaczmarczyk, J. Analysis of visitors impact on the museum rooms microclimate. Healthy Buildings Europe 2017, Lublin, Poland, July 2–5. Available online: https://www.isiaq.org/docs/presentation/0136.pdf (accessed on 10 January 2019).
- American Society of Heating, Refrigerating and Air Conditioning Engineers. ASHRAE Handbook, Fundamentals, SI ed.; American Society of Heating, Refrigerating and Air Conditioning Engineers: Atlanta, GA, USA, 1997. [Google Scholar]
- Silva, H.E.; Henriques, F.M.A.; Henriques, T.A.S.; Coelho, G. A sequential process to assess and optimize the indoor climate in museums. Build. Environ. 2016, 104, 21–34. [Google Scholar] [CrossRef]
- Grygierek, K.; Ferdyn-Grygierek, J. Multi-objectives optimization of ventilation controller for passive cooling in residential buildings. Sensors 2018, 18, 1144. [Google Scholar] [CrossRef]
- Genco, A.; Viggiano, A.; Viscido, L.; Sellitto, G.; Magi, V. Numerical simulation of energy systems to control environment microclimate. Int. J. Heat Technol. 2016, 34, S545–S552. [Google Scholar] [CrossRef]
- De Tommasi, L.; Ridouane, H.; Giannakis, G.; Katsigarakis, K.; Lilis, G.N.; Rovas, D. Model-based comparative evaluation of building and district control-oriented energy retrofit scenarios. Buildings 2018, 8, 91. [Google Scholar] [CrossRef]
Figure 1.
The museum building view (west site) and the floor plans.

Figure 2.
Examples of museum exhibits in the ethnography hall (left) and the Gallery of Painting (right).
Figure 2.
Examples of museum exhibits in the ethnography hall (left) and the Gallery of Painting (right).

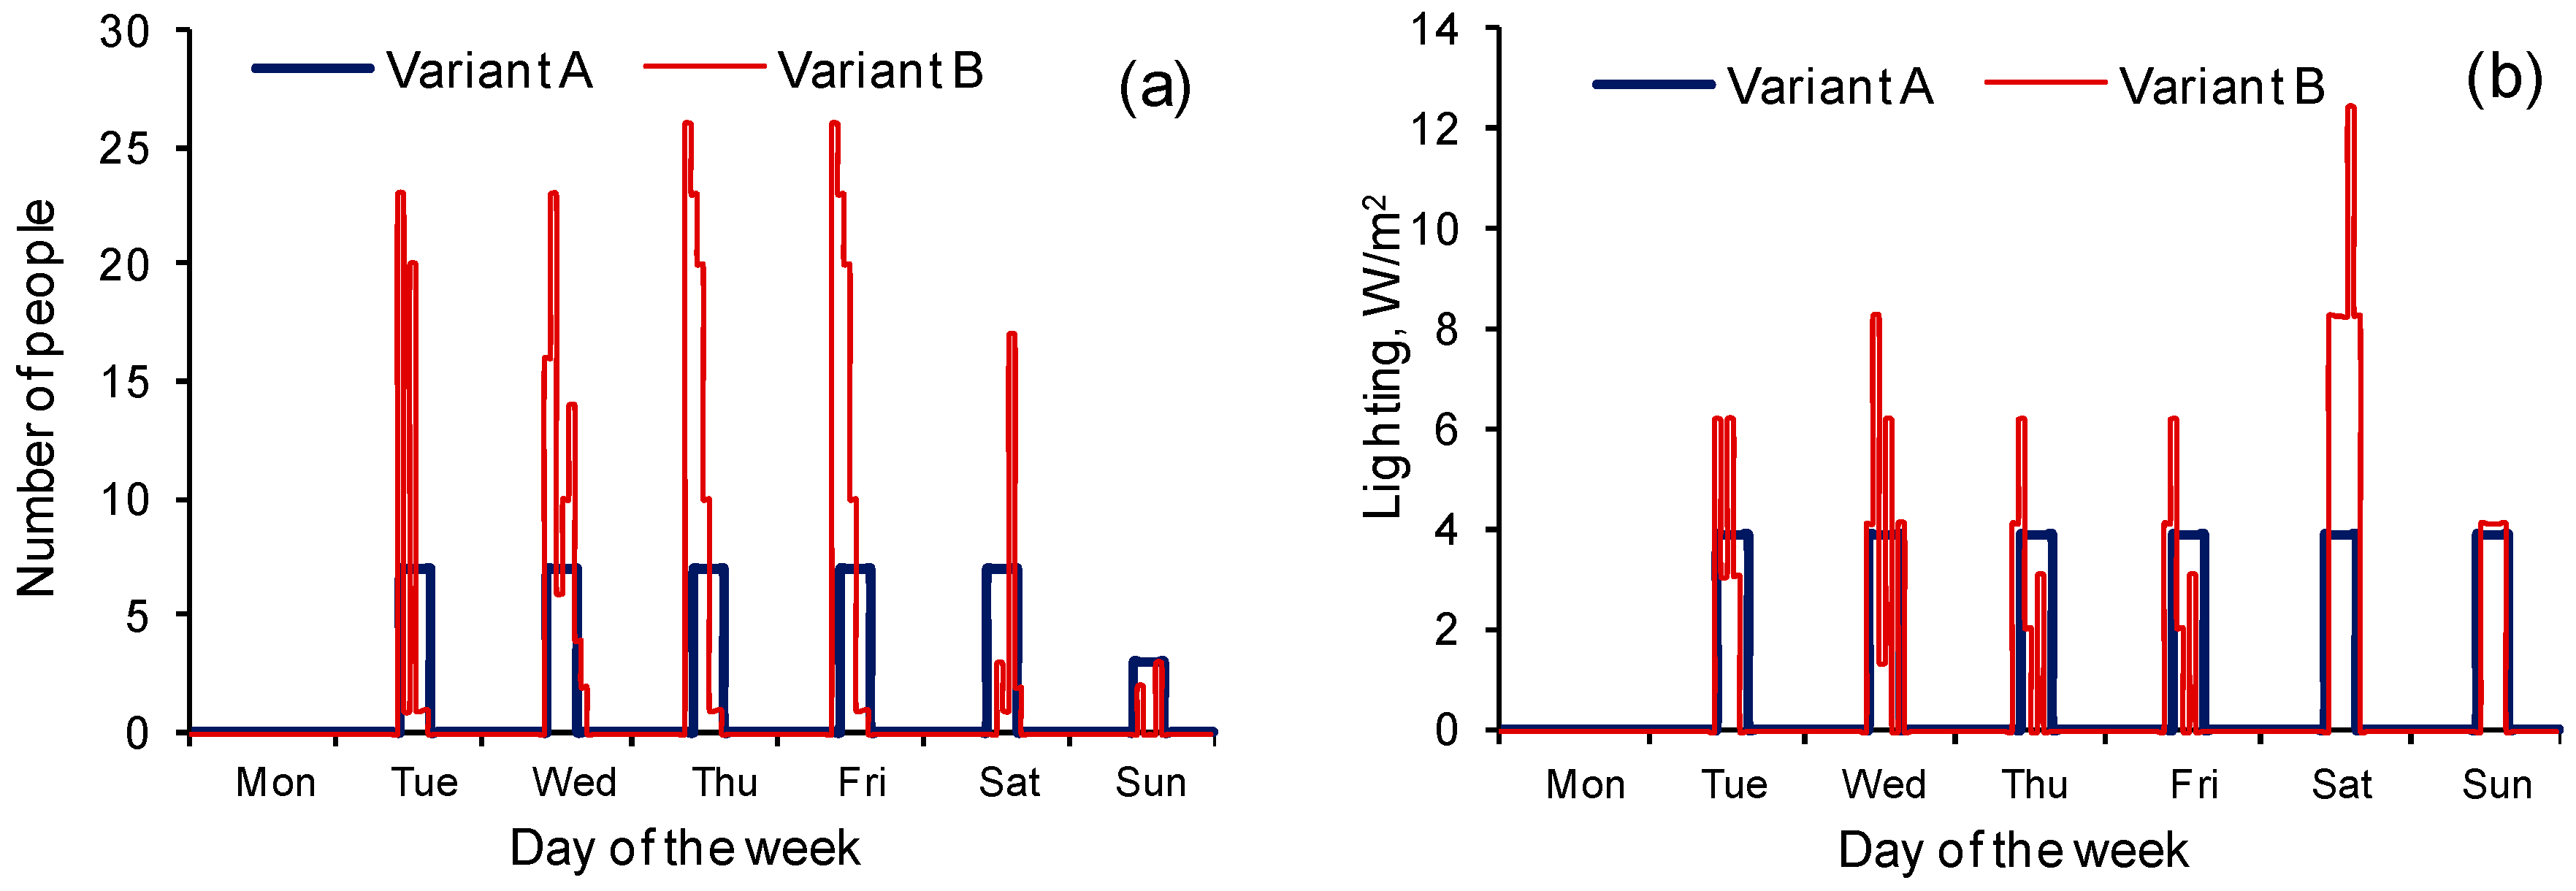
Figure 3.
Schedule of occupancy (a) and lighting (b) for simulation using the A or B variants of internal heat gains.
Figure 3.
Schedule of occupancy (a) and lighting (b) for simulation using the A or B variants of internal heat gains.

Figure 4.
Variation of the measured and calculated indoor T and RH over three summer weeks.
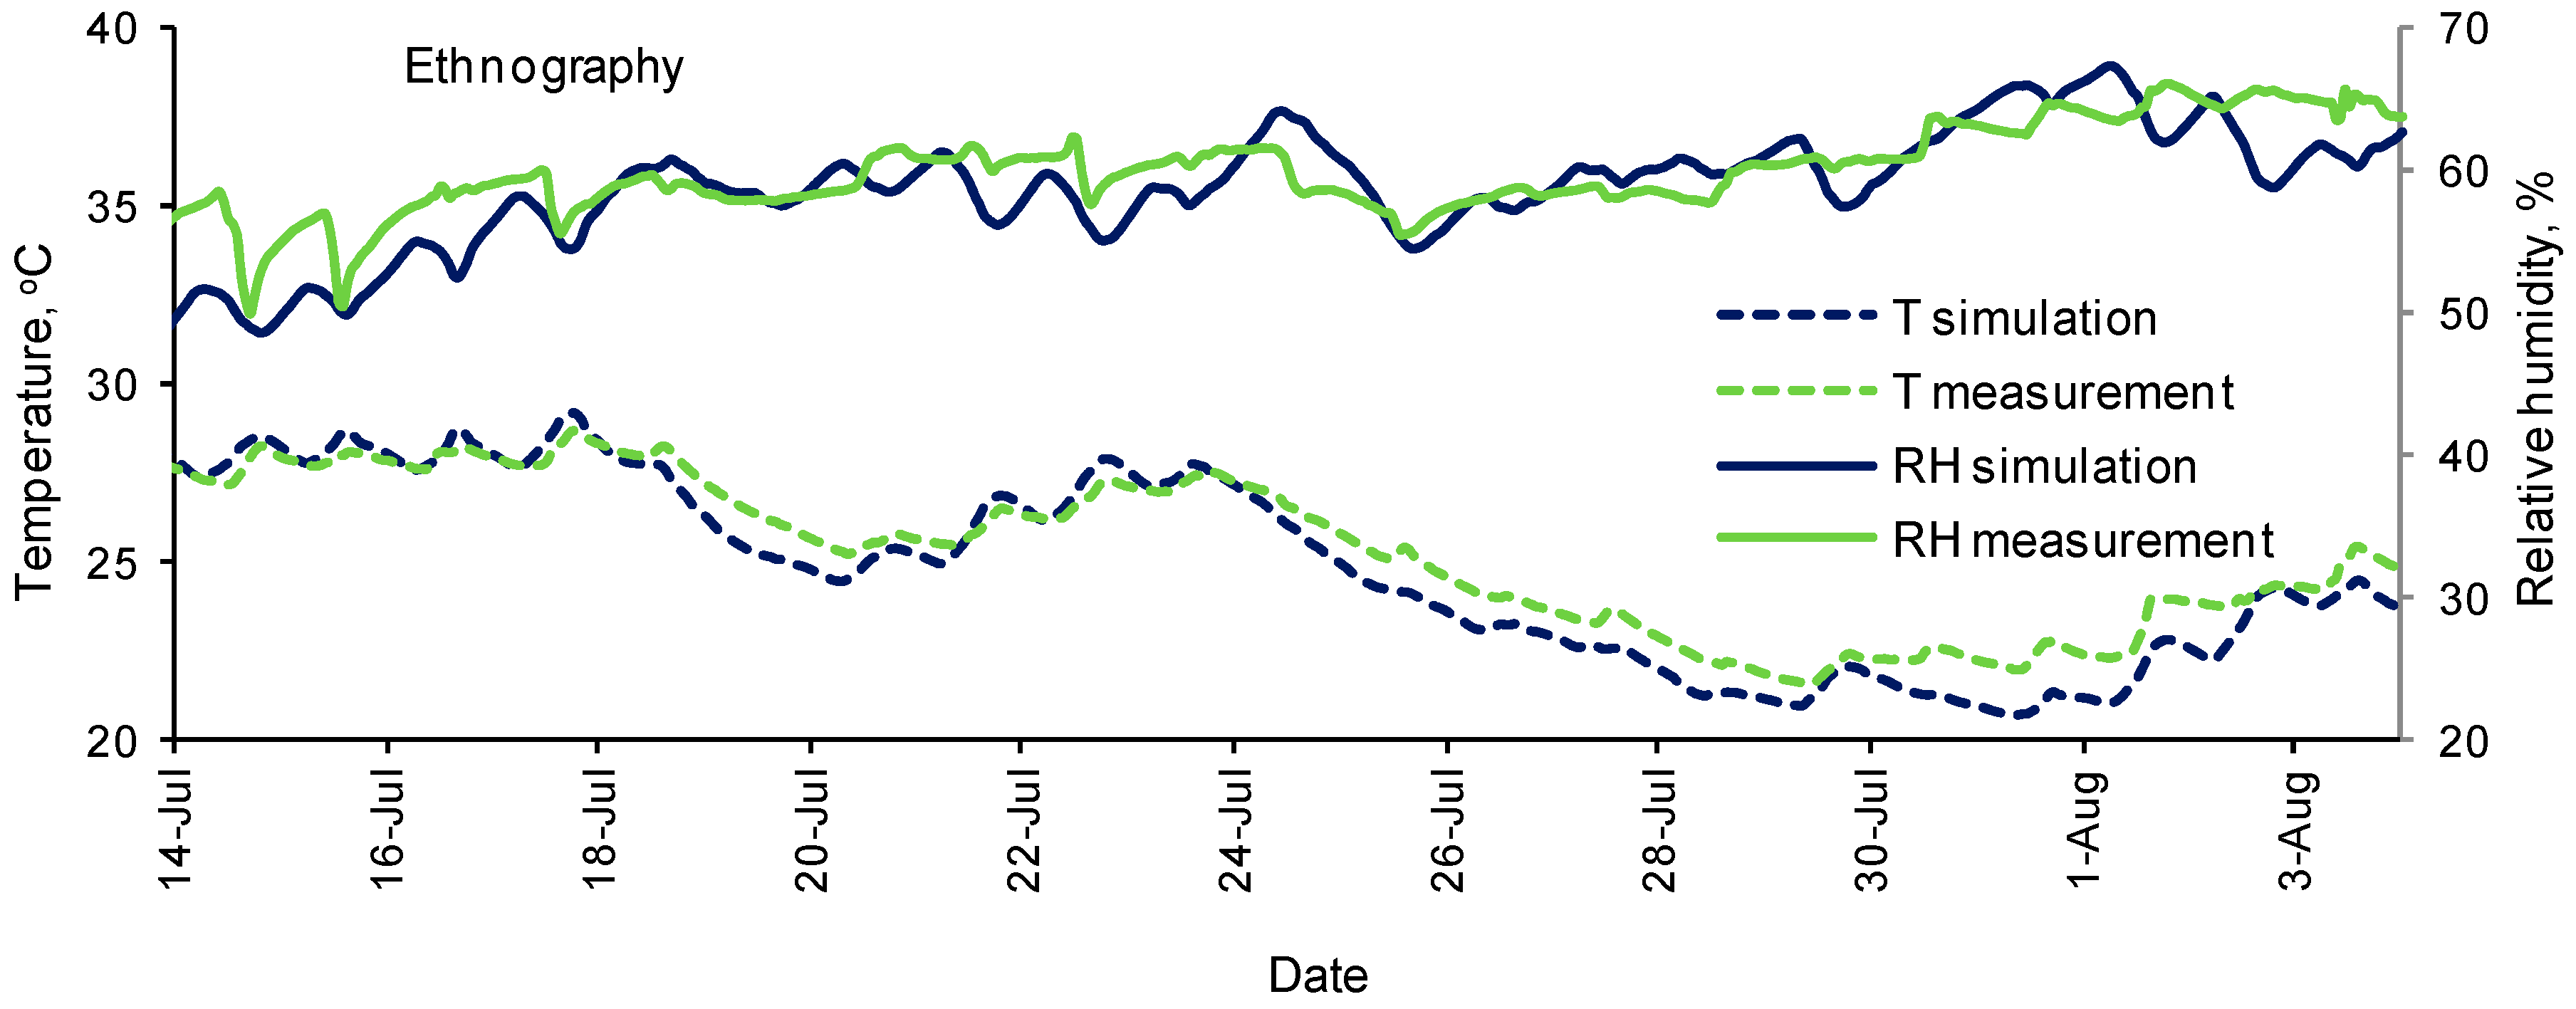
Figure 5.
Operation scheme for control of the relative humidity as explained in case 3.

Figure 6.
Variation in the indoor relative humidity and temperature in the ethnography hall for cases without additional ventilation for the period of February to July.
Figure 6.
Variation in the indoor relative humidity and temperature in the ethnography hall for cases without additional ventilation for the period of February to July.
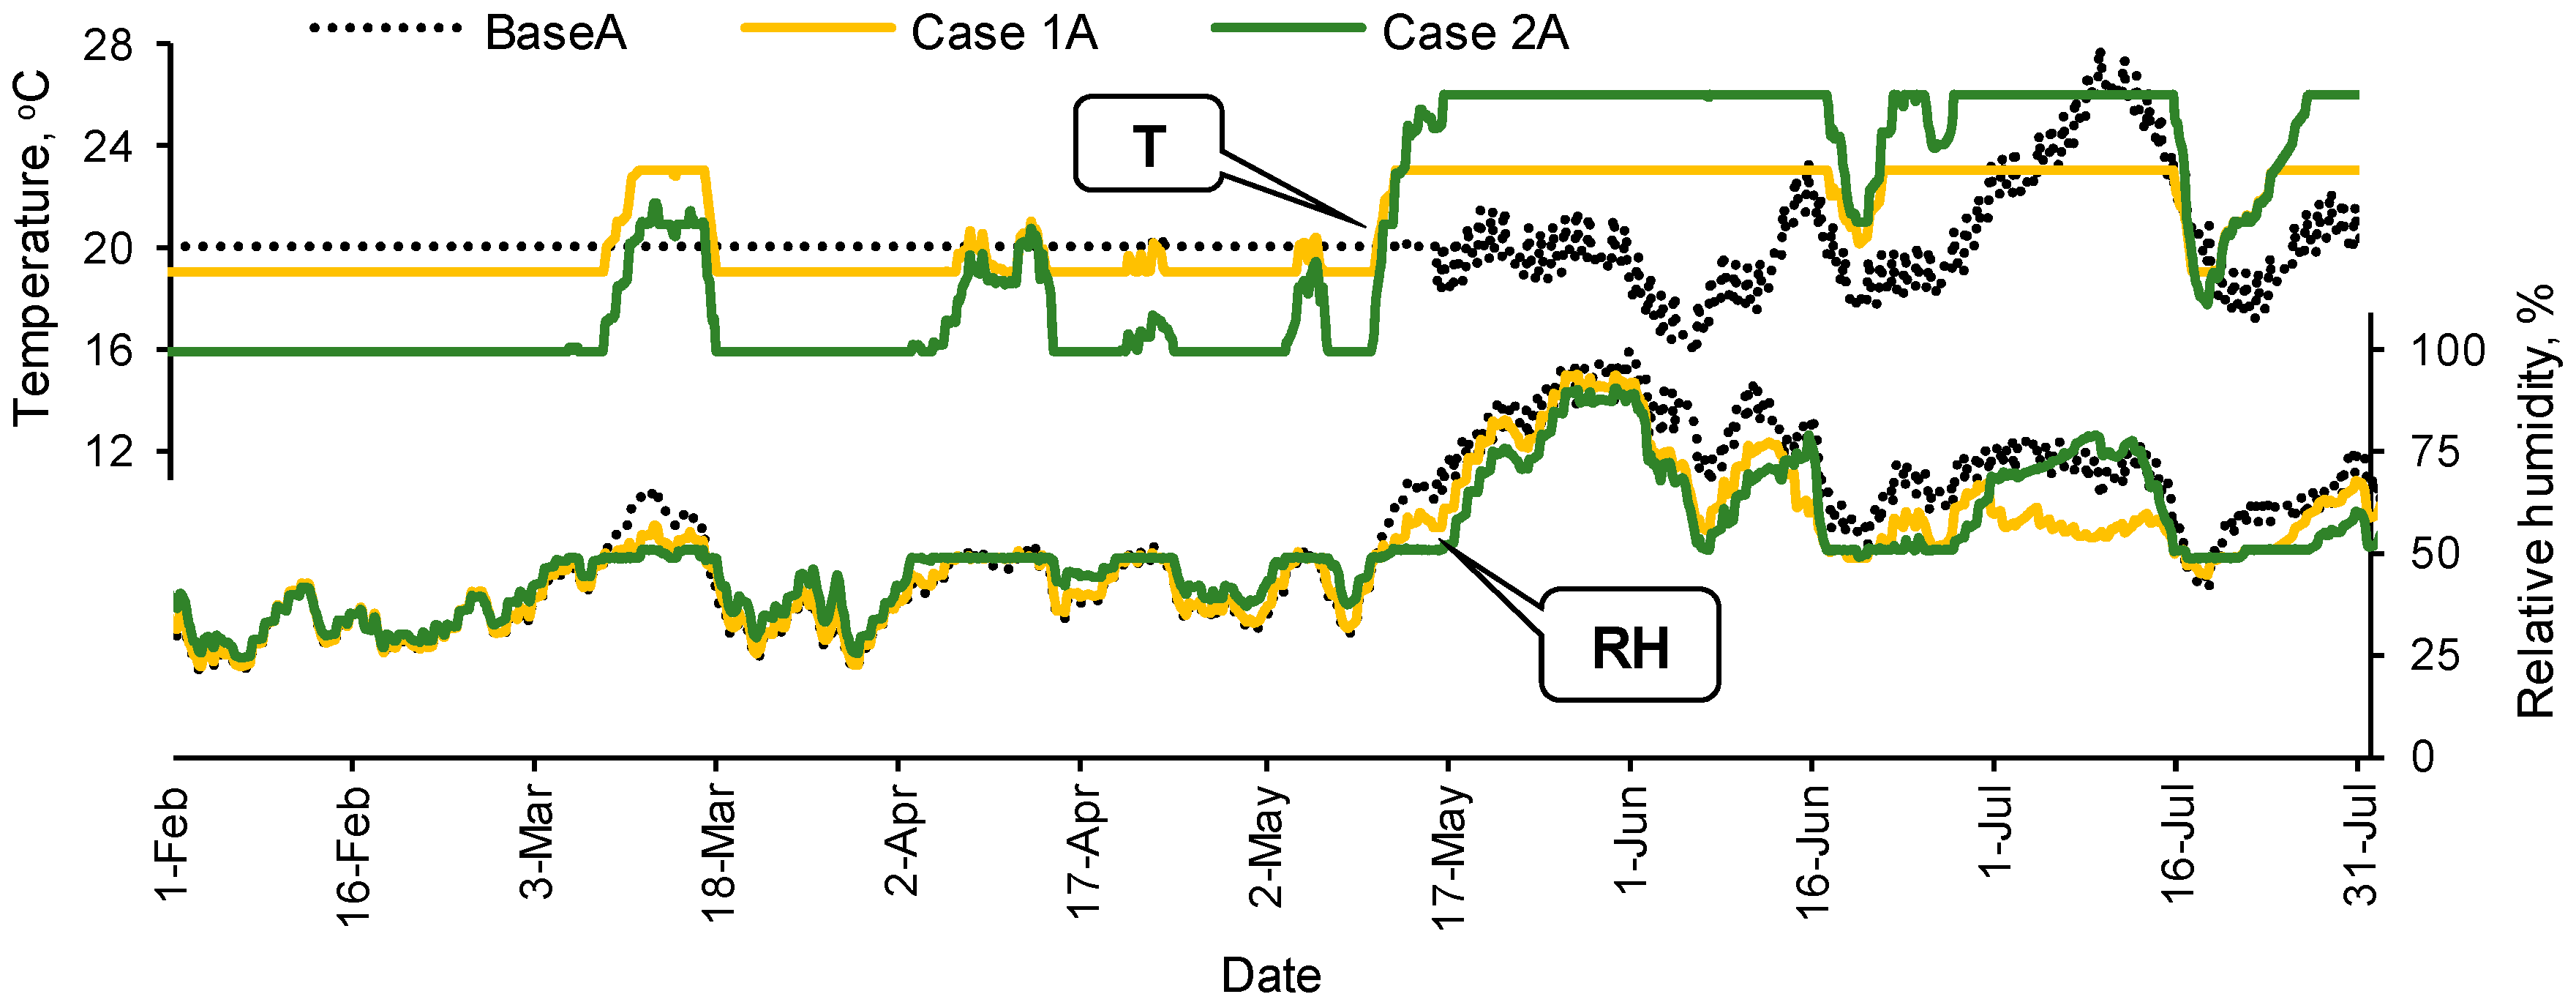
Figure 7.
Variation in the indoor relative humidity, temperature, and ventilation airflow in the ethnography hall for cases with additional ventilation over a period of February to July.
Figure 7.
Variation in the indoor relative humidity, temperature, and ventilation airflow in the ethnography hall for cases with additional ventilation over a period of February to July.

Figure 8.
Variation in the heating and cooling demand in the ethnography hall over two summer weeks.
Figure 8.
Variation in the heating and cooling demand in the ethnography hall over two summer weeks.


Table 1.
The temperature (T) and relative humidity (RH) specifications for collections according to The American Society of Heating Refrigeration and Air-conditioning Engineers (ASHRAE) standards (classes AA, A, and B), adopted from Ferdyn-Grygierek, et al. [28].
Table 1.
The temperature (T) and relative humidity (RH) specifications for collections according to The American Society of Heating Refrigeration and Air-conditioning Engineers (ASHRAE) standards (classes AA, A, and B), adopted from Ferdyn-Grygierek, et al. [28].
| Set Point | Maximum Fluctuations and Gradients in Controlled Spaces | ||
|---|---|---|---|
| Class | Short-Term Fluctuations | Long-Term (Seasonal) Fluctuations | |
| T = 15–25 °C; RH = 50% (or historic annual average) | AA | ±2 °C; ±5% RH | Up 5 °C, down 5 °C; RH no change |
| A | ±2 °C; ±5% RH | Up 5 °C, down 10 °C; Up 10% RH, down 10% RH | |
| ±2 °C; ±10% RH | Up 5 °C, down 10 °C; RH no change | ||
| B | ±5 °C; ±10% RH | Up 10 °C, but not above 30 °C; Up 10%, down 10% RH | |
Table 2.
Characteristics of the museum building.
| Feature | Value |
|---|---|
| Number of Museum Floors | 3 + 1 (attic) |
| Total Exhibition Area | 2320 m2 |
| Floor-to-Floor Height | 3.6 m |
| External Wall Construction | Concrete or solid brick, uninsulated |
| Windows Construction | Double-glazed, some with anti-reflective coating |
| Ventilation | Natural |
| Heating System | The whole building: central heating system with radiators partly equipped with thermostat valves. The Gallery of Painting and Modern Art halls: fan-coil system switched between cooling mode and heating mode (twice a year). The set point temperature is 20 °C. The heating season: from the turn of September and October to around mid-May. |
| Cooling System | Only present in the Gallery of Painting and Modern Art halls: fan-coils switched twice a year between cooling and heating modes. The set point temperature is 22 °C. |
| Humidification System | Only present in the Gallery of Painting: one autonomous manually controlled air humidifier, the set point RH is 40%. |
Table 3.
Input data to case study simulations.
| Component | Details |
|---|---|
| Simulation Time Step | 15 min |
| Simulation Period | From January to December |
| Climate Data | Standard climate for Katowice (Southern Poland) [48]: moderate climate with relatively cold winters (min −19 °C) and warm summers (max 31 °C). |
| Occupants | Adopted from measurement tallies of visitors to this museum [49] (on Monday the museum is closed to visitors): Variant A: average from the whole year observation, Figure 3; from July to August (holiday season), the number of people is reduced to 3. Variant B: detailed from one-week observation (Figure 3), the whole year has the same schedule. The total heat for one person (126 W) was assumed according to ASHRAE [50]. The sensible and latent heat gains were calculated in each time step depending on indoor temperature. |
| Lighting | Variant A: average value of 3.87 W/m2 during the whole year, activated during occupied hours. Variant B: the same during the whole year (Figure 3). |
Table 4.
The performance index for hourly values of the indoor relative humidity amplitude within ±5% from RH set point.
Table 4.
The performance index for hourly values of the indoor relative humidity amplitude within ±5% from RH set point.
| Case | Performance Index Value, % of Time | ||
|---|---|---|---|
| Whole Year | Cold Period | Warm Period | |
| Base A * | 11.7 | 17.6 | 1.8 |
| Case 1A | 23.5 | 25.2 | 20.7 |
| Case 2A | 36.3 | 36.8 | 35.6 |
| Case 3A | 53.8 | 43.9 | 70.0 |
| Case 4A | 78.4 | 68.0 | 93.9 |
| Base B * | 14.2 | 21.6 | 1.9 |
| Case 1B | 23.6 | 31.3 | 10.8 |
| Case 2B | 28.8 | 39.1 | 11.9 |
| Case 3B | 55.0 | 52.3 | 59.4 |
| Case 4B | 81.3 | 69.9 | 97.3 |
* 50% RH set point is assumed to calculation.
Table 5.
The performance index for hourly values of the indoor relative humidity amplitude within ±10% from the RH set point.
Table 5.
The performance index for hourly values of the indoor relative humidity amplitude within ±10% from the RH set point.
| Case | Performance Index Value, % of Time | ||
|---|---|---|---|
| Whole Year | Cold Period | Warm Period | |
| Base A * | 24.4 | 33.9 | 8.2 |
| Case 1A | 42.0 | 41.2 | 43.3 |
| Case 2A | 51.1 | 52.7 | 48.5 |
| Case 3A | 70.1 | 58.2 | 89.6 |
| Case 4A | 91.1 | 86.7 | 98.3 |
| Base B * | 24.4 | 37.2 | 3.3 |
| Case 1B | 37.4 | 44.1 | 26.3 |
| Case 2B | 41.4 | 52.6 | 23.0 |
| Case 3B | 72.8 | 65.0 | 85.7 |
| Case 4B | 93.7 | 90.4 | 98.7 |
* 50% RH set point is assumed to calculation.
Table 6.
Annual energy demand for heating and cooling.
| Case | Heating Demand (kWh/m2) | Relative Difference in Heating to Case 1 | Cooling Demand (kWh/m2) | Relative Difference in Cooling to Case 1 | Total Energy Demand (kWh/m2) | Relative Difference in Total Energy to Case 1 |
|---|---|---|---|---|---|---|
| Base A | 103.0 | - | - | - | 103.0 | - |
| Case 1A | 114.5 | - | 0.7 | - | 115.1 | - |
| Case 2A | 119.5 | 4.4% | 1.8 | 160.9% | 121.3 | 5.4% |
| Case 3A | 97.7 | −14.7% | 1.3 | 90.9% | 99.0 | −14.0% |
| Case 4A | 98.7 | −13.8% | 3.2 | 371.8% | 101.9 | −11.5% |
| Base B | 102.1 | - | - | - | 102.1 | - |
| Case 1B | 121.5 | - | 1.2 | - | 122.1 | - |
| Case 2B | 134.7 | 10.8% | 1.5 | 25.8% | 136.2 | 11.0% |
| Case 3B | 98.3 | −19.1% | 2.1 | 70.4% | 100.4 | −18.2% |
| Case 4B | 100.7 | −17.1% | 3.7 | 210.5% | 104.5 | −14.9% |
© 2019 by the authors. Licensee MDPI, Basel, Switzerland. This article is an open access article distributed under the terms and conditions of the Creative Commons Attribution (CC BY) license (http://creativecommons.org/licenses/by/4.0/).
Share and Cite
MDPI and ACS Style
Ferdyn-Grygierek, J.; Grygierek, K. Proposed Strategies for Improving Poor Hygrothermal Conditions in Museum Exhibition Rooms and Their Impact on Energy Demand. Energies 2019, 12, 620. https://doi.org/10.3390/en12040620
AMA Style
Ferdyn-Grygierek J, Grygierek K. Proposed Strategies for Improving Poor Hygrothermal Conditions in Museum Exhibition Rooms and Their Impact on Energy Demand. Energies. 2019; 12(4):620. https://doi.org/10.3390/en12040620
Chicago/Turabian StyleFerdyn-Grygierek, Joanna, and Krzysztof Grygierek. 2019. "Proposed Strategies for Improving Poor Hygrothermal Conditions in Museum Exhibition Rooms and Their Impact on Energy Demand" Energies 12, no. 4: 620. https://doi.org/10.3390/en12040620
Note that from the first issue of 2016, this journal uses article numbers instead of page numbers. See further details here.