Effects of Fuel Type and Operation Parameters on Combustion and NOx Emission of the Iron Ore Sintering Process


1
School of Metallurgy, Northeastern University, Shenyang 110819, China
2
Key Laboratory of Ecological Utilization of Multi-Metallic Mineral of Education Ministry, Northeastern University, Shenyang 110819, China
3
School of Metallurgical Engineering, Anhui University of Technology, Maanshan 243002, China
4
School of Material Science and Engineering, Chongqing University, Chongqing 400030, China
*
Author to whom correspondence should be addressed.
Energies 2019, 12(2), 213; https://doi.org/10.3390/en12020213
Submission received: 28 November 2018
/
Revised: 27 December 2018
/
Accepted: 6 January 2019
/
Published: 10 January 2019
Abstract
:A transient two-dimensional mathematical model is developed to study the influence of fuel type and operation parameters on combustion and NOx emission during the iron ore sintering process. The model was validated by comparing the model predictions with sintering pot test data. The predictions show reasonable agreement with the averaged values of the test data. In addition to the conventional sintering process, this model can also predict new processes such as flue gas recirculation, gas fuel injection, and fuel layered distribution. The simulation results show that the fuel NOx is the main part of the NOx emission during sintering, and thermal NOx forms a very little part. The produced NOx can be reduced not only by coke but also by CO around coke particles, with reduction proportions of 50% and 10%, respectively. Two types of coke A and B were compared. With Coke A as solid fuel and consumption of 3.8%, the NOx emission was 320 ppm. Increasing the replacement of Coke A with Coke B, the NOx emission was decreased, being decreased by 28.13% to 230 ppm with the replacement proportion of 50%. When only Coke B was used, the NOx emissions could be lowered by 53.13% to 150 ppm. Decreasing the particle size from 1.6 mm to 1.2 mm led the NOx emission to be increased by 10.93% from 320 ppm to 355 ppm. With Coke A as the only solid fuel, increasing the fuel ratio to 4.2% led the NOx emission to be increased by 9.38% to 350 ppm; increasing the oxygen content of inlet air from 21% to 30% led the NOx emission to be increased by 15.00% from 320 ppm to 368 ppm.
1. Introduction
Iron ore sinter constitutes up to 70–85% of the total ferrous burden in the blast furnace process, which remains the major source of iron production worldwide (1.2 billion tons in 2016). From the perspective of environmental protection, iron ore sintering is one of the main pollution sources in steelworks. Since the NOx, SOx, dust, and dioxins generated from sintering are about 50% of the total emissions of iron and steel enterprises, it is important to understand these in order to develop new energy-saving and environment-protecting sintering technologies for reducing pollution emissions. Although new technologies for reducing NOx emissions, such as biomass fuel [1], fuel gas injection [2], and flue gas recirculation [3,4], have been applied in some sintering plants, there is even greater potential for investigating the mechanism of NOx production and reduction. NOx emission can be affected by fuel properties and operation conditions during the iron ore sintering process [5].
Over the past few years, quite a few studies have focused on the NOx emission of iron ore sintering. Kasai et al. [6] investigated the effect of various types of solid fuel on NOx formation. In the early stage of combustion, the temperature of the coke surface was low, and the conversion ratio of coke-N was accelerated around the coke particles under the condition of high oxygen concentration, and the combustion of the coke particles was controlled by the chemical reaction. Zhou et al. [7] believed that the reaction between coke-N and oxygen would be impeded by the unmelted adhering layers, while the calcium ferrite generated during the coke combustion would flow away from the coke surface and decrease the NOx concentration without reducing the combustion rate. Mo et al. [8] studied the effect of biomass fuels on NOx emission: when using biomass fuels such as rice straw and charcoal to take the place of coke as sintering solid fuels, the NOx emission can be reduced by 20–30%. Pan et al. [9] researched the impact of coke ratio and moisture content on NOx emission. Zhao et al. [10] studied the influence of the fuel layered distribution on NOx emission.
Compared to experimental study, which has large operational costs and is quite time-consuming, numerical simulation is inexpensive for studying practical production and can obtain a more detailed explanation of the parameters concerned [11]. In recent years, most simulation models for sintering have focused on the combustion behavior and heat and mass transfer in the sinter bed [12,13,14,15,16,17]. In order to investigate the NOx formation/reduction behaviors of sintering, the calculation of a series of NOx formation/reduction mechanisms, i.e., the thermal NOx, prompt NOx, and fuel NOx mechanisms, is adopted [18]. Due to a large proportion of NOx originating from the fuel NOx mechanism, the fuel NOx mechanism is the most important among these mechanisms, and the fuel NOx mechanism is further divided into that NOx which is generated from volatile-N and that NOx which is generated from coke-N.
However, few studies have been published giving a numerical simulation of the iron ore sintering process with particular emphasis on the NOx production/reduction behaviors. Therefore, a simulation model of NOx formation/reduction in sintering needs to be further developed. In this current work, a comprehensive mathematical model is established to clarify the continuity, momentum, energy and species transport, and chemical reactions and uses FLUENT software combined with user-defined functions (UDFs) to predict a number of parameters such as bed temperature profile, flue gas composition, sintering time, and flame front speed. In order to evaluate the iron ore sintering process, characterization of the bed combustion is required. The Maximum Temperature (MaxT), Sintering Time (ST), and Flame Front Speed (FFS) are used for the interpretation of coke combustion characteristics. Particularly, the NOx formation/reduction behaviors of each of the four formation mechanisms were compared. Besides this, the differences in the NOx emission characteristics between Cokes A and B with different nitrogen contents are discussed. Moreover, the influence of operation parameters on coke combustion and NOx emission is investigated.
2. Mathematical Model
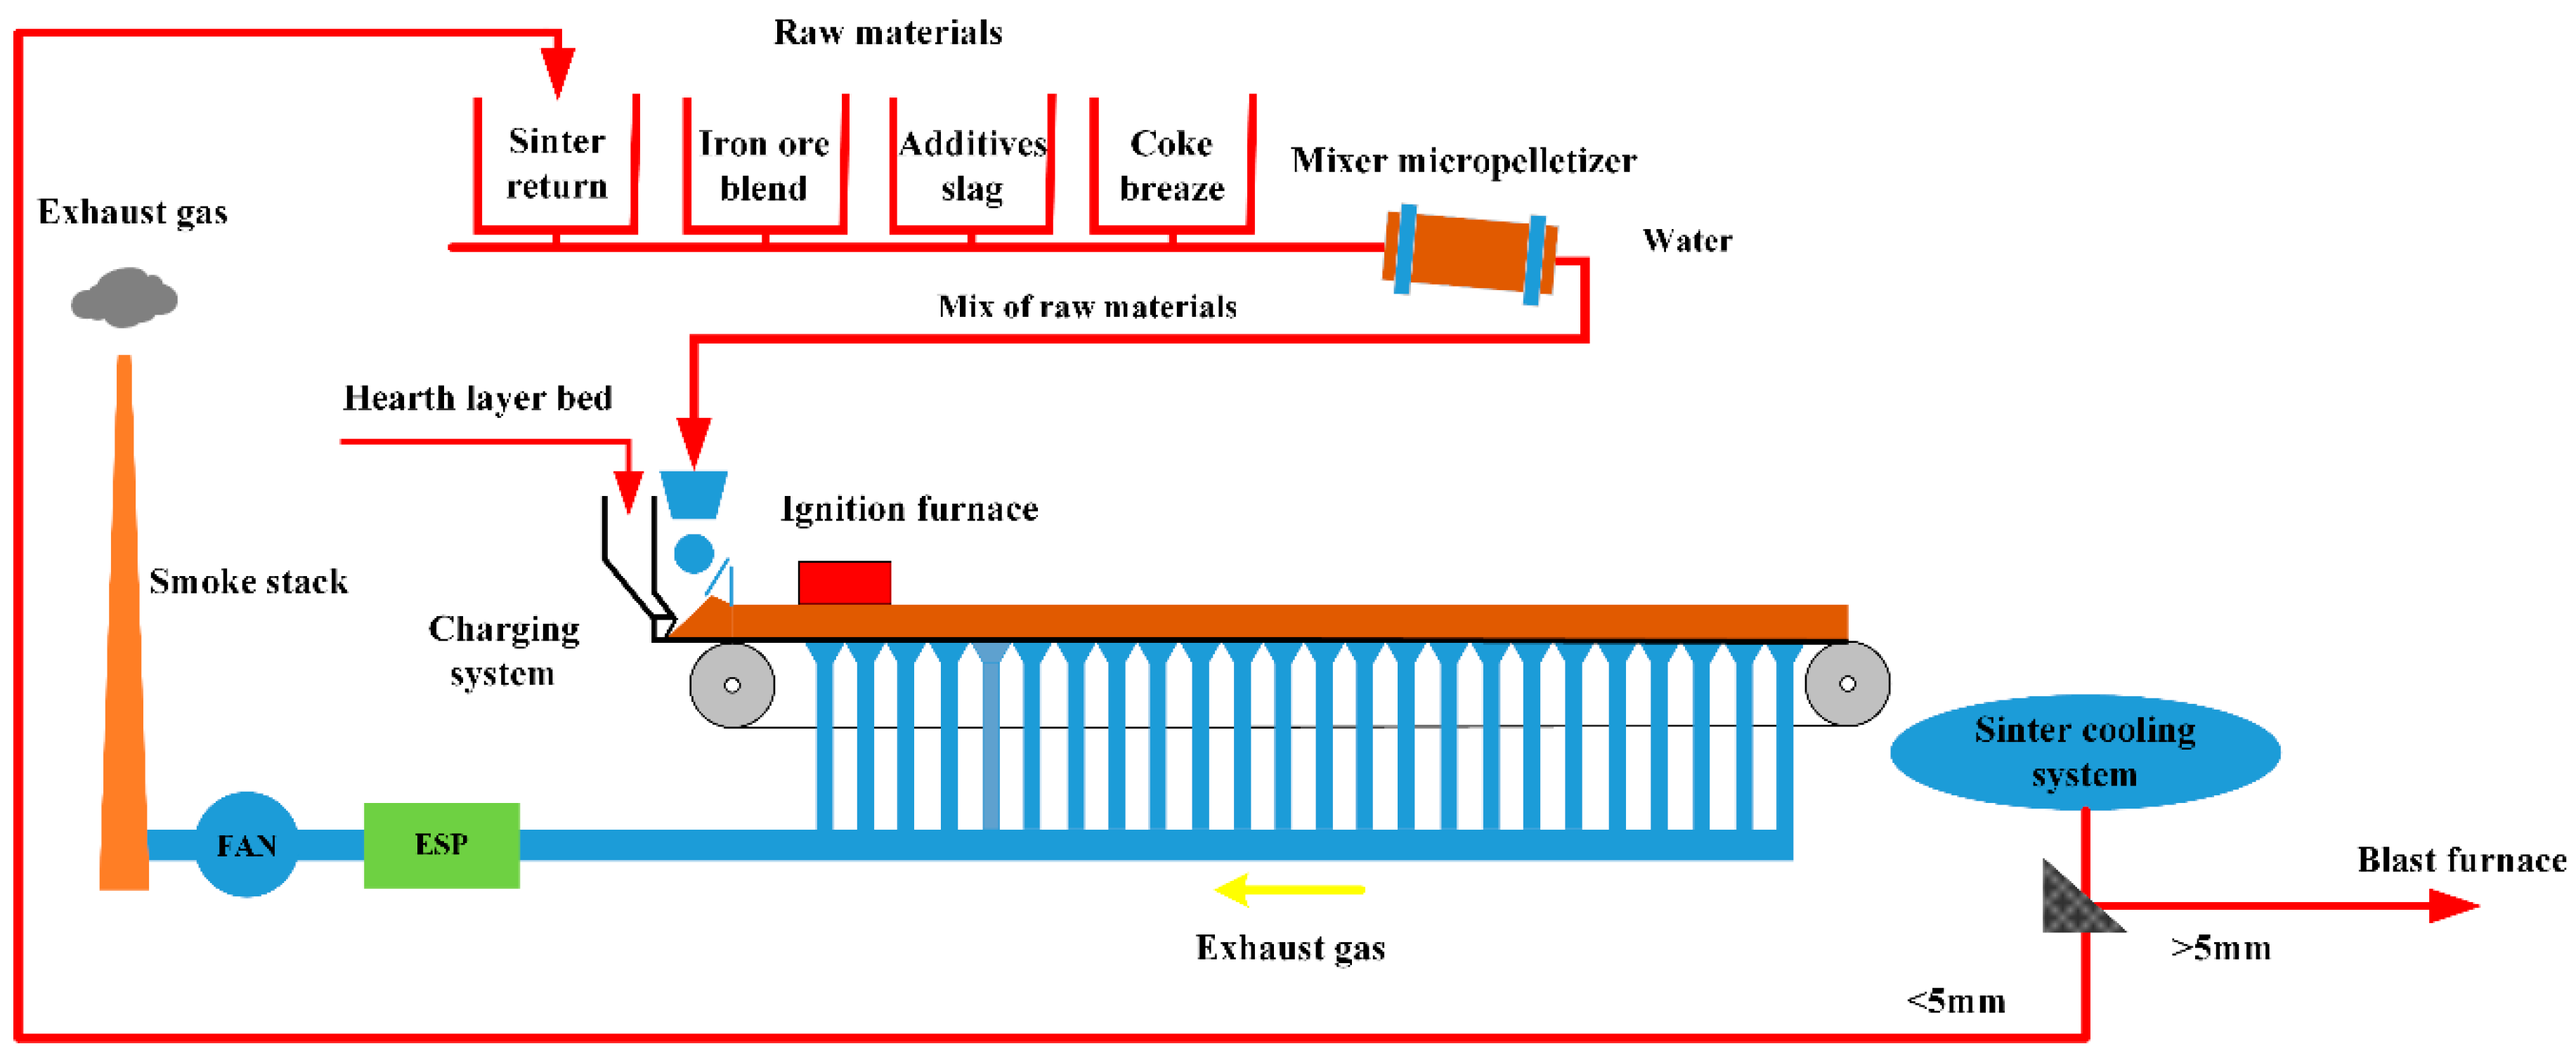
Figure 1 shows the iron ore sintering process. The raw materials of sintering consist of iron ore (sinter feed), coke particles or anthracite particles, limestone, other additives, and water. After the blending and granulating process, the raw material mixture together with returned sinter is consecutively charged into a bed of approximately 0.6 m. Air is drawn down and a flame front is allowed to propagate at 1200–1400 °C through the sintering bed [19]; then, a series of chemical reactions take place between iron ore, coke, limestone, and other minor components in the combustion zone under the high-temperature conditions. The raw material mixture is finally sintered [20].
2.1. Conservation Equations
The present model consists of equations of continuity, momentum conservation, heat conservation, and chemical species conservation for all phases, rate equations of chemical reactions, and phase changes.
2.1.1. Equations of the Gas Phase
(1) Continuity:
(2) Momentum conservation:
(3) Heat conservation:
(4) Chemical species conservation:
2.1.2. Equations of the Solid Phase
(1) Continuity:
(2) Heat conservation:
(3) Chemical species:
2.2. Model of Solid Fuel Combustion
2.2.1. Coke Combustion and Gasification
Oxygen was introduced into the sintering bed from the top layer of raw materials and through the combustion zone, and it reacts with the carbon contained in the coke to form carbon dioxide. The combustion reaction rate equation (Equation (8)) [21,22], which considers the ash layer diffusion and the resistances of the boundary film and chemical reaction, was used in this work:
where rc0 is the initial radius of coke granules (m); is the O2 mole concentration (mol/m3); nc is number of carbon granules per unit volume (1/m3); kf1 is the mass transfer coefficient of the gas boundary layer (m/s); kc1 is the coke combustion reaction rate constant (m/s); and De is the diffusion coefficient of oxygen (m/s).
The chemical reaction rate constant kc1 can be evaluated using the following equation proposed by Muchi et al. [23].
The coke gasification reaction, i.e., the solution loss reaction, occurs substantially after all oxygen has depleted. It is necessary to consider this chemical reaction under high-temperature conditions. The overall reaction rate of the coke gasification reaction is shown in Equation (11) [21,24]:
where is the CO2 mole concentration (mol/m3); kf2 is the mass transfer coefficient of the gas boundary layer (m/s); kc2 is the coke gasification reaction rate constant (m3/kg·s); rc is the instantaneous radius of coke granules (m); and Ef2 is the effectiveness factor of coke and carbon dioxide.
The effectiveness factor Ef2 can be calculated for an irreversible first-order reaction by Equation (12) in terms of the Thiele modulus m as defined below [25]:
where Ds2 is estimated from
The coke gasification reaction rate constant kc2 can be determined using the following equation proposed by Muchi et al. [23].
2.2.2. Gaseous Combustion
2.3. Model of NOx Formation
Since the NOx released from atmospheric coke combustion is mainly NO, and the concentrations of NO2 and N2O are very low [18], only the formation of NO was considered in this study. Before performing the NO prediction, a converged solution of the combustion flow field was calculated. In order to calculate the concentration of NO in sintering, the four main types of NO formation/reduction mechanisms, i.e., the fuel NO mechanism originating from coke particles, the thermal NO mechanism, the NO reduction by coke particles, and the NO reduction by CO, were considered.
2.3.1. NO Production Originating from Fuel
Coke and anthracite are both solid fuels containing volatile matter and are commonly used in sintering. Fuel-N is a very crucial source of NOx emissions and generally contains 0.3–2% N by weight. The main purpose of this work was to investigate NOx emissions from coke combustion in practical production, so it was assumed that all N in coke comes from coke-N. In the formation process of fuel NOx, we only consider the conversion of coke-N to NOx, but ignore the conversion of volatile-N to NOx [11]. For the calculation of NO formation from coke combustion, the following formula has been given in previous works [18,26] and was employed in the present model:
where η is the coke burn-out rate in the chemical reaction of coke combustion (%); YN is the mass fraction of N in coke (wt %); and ψ is the conversion rate of coke-N to NO (−), for which the value of 0.75 was used in the present model [27].
2.3.2. Thermal NO Formation
A series of temperature-dependent chemical reactions which are known as extended Zeldovich mechanisms determine the thermal NO formation, and the formation of thermal NO could be estimated using this model. The overall reaction rate of thermal NO formation reactions is given by Equation (19) [5,11].
Since the forward chemical reactions of the Zeldovich mechanisms play a leading role in coke combustion, when the NO concentration is low, Equation (19) can be simplified into Equation (20) [11].
Assuming that oxygen atoms are in equilibrium with oxygen, Equation (20) can be further simplified into Equation (21).
According to experimental results of the apparent rate constant by Zeldovich, Equation (21) can be transformed into Equation (22) [11]. Because sintering generally has a strong oxidizing atmosphere, Equation (22) was used to estimate the thermal NOx.
2.3.3. NO Reduction by Coke Particles
NO reduction by coke has been studied by many investigators [18,28,29,30] who have shown that it has an obvious influence on NO formation during the pulverized coal combustion process. Chen’s study [31] showed that the chemical reaction between NO and a single carbon site results in the production of chemisorbed oxygen and the release of N2. De Soete [32] presented a similar NO reduction mechanism to Chen where two adjacent carbon sites were involved. Therefore, the following mechanism with the release of chemisorbed oxygen and N2 was used in the present work, and the reaction rate of NO reduction by coke is given by Equation (23):
where kNO,C is the chemical reaction rate constant (kg/m3·s); PNO is the partial pressure of nitrogen oxide (Pa); Sc is the internal surface area of the coke particles (m2); and η is an effectiveness factor (−).
2.3.4. NO Reduction by CO
2.4. Other Models and Thermo-Physical Properties
In addition to coke combustion and NOx formation/reduction models, the main physio-chemical phenomena and mathematical model are summarized in Table 1. Changes in physical parameters including specific heat capacity, density, diffusion coefficient, viscosity, and thermal conductivity are considered in the present work [12,21,34,35]. The empirical formulae for the thermo-physical parameters are shown in Table 2.
2.5. Solution of the Model
2.5.1. Initial and Boundary Conditions
The model formulation presented by Equations (1)–(7) was completed with the initial and boundary conditions listed in Table 3.
Aa a 2D model, the heat loss at the wall of the sintering pot is considered as a series of inner wall convection, wall conduction, and outside convection. The heat loss fluxes of the gas and solid phases, Qg-w and Qs-w, are given by Equation (26) and Equation (27), respectively [39].
2.5.2. Numerical Methods
By employing the strategy of FLUENT software combined with user-defined functions (UDFs), the conservation equations of continuity, momentum, energy, and species for the gas and solid phases were solved by adopting the finite volume method. Changes in continuity, momentum, energy, and species were defined as source terms in conservation equations, and initial and boundary conditions were set by the corresponding macros of FLUENT software. The SIMPLE algorithm was used to couple the continuity, momentum, energy, and species equations, and the second-order upwind scheme was used to discretized all of the convective terms in the differential equations. The numerical convergence was defined as residuals of the order of 10−6 for energy equations and residuals of the order of 10−3 for other equations.
3. Results and Discussion
Numerical simulations were performed to study the effect of fuel type and operation parameters on coke combustion and NOx emissions. Table 4 summarizes the operation parameters of various cases and the base case.
3.1. Model Validation
The experimental data from Won Yang [13] were used to validate the present mathematical model. The main parameters used in this study are shown in Table 3. The simulated results were compared with the measured results, as represented in Figure 2.
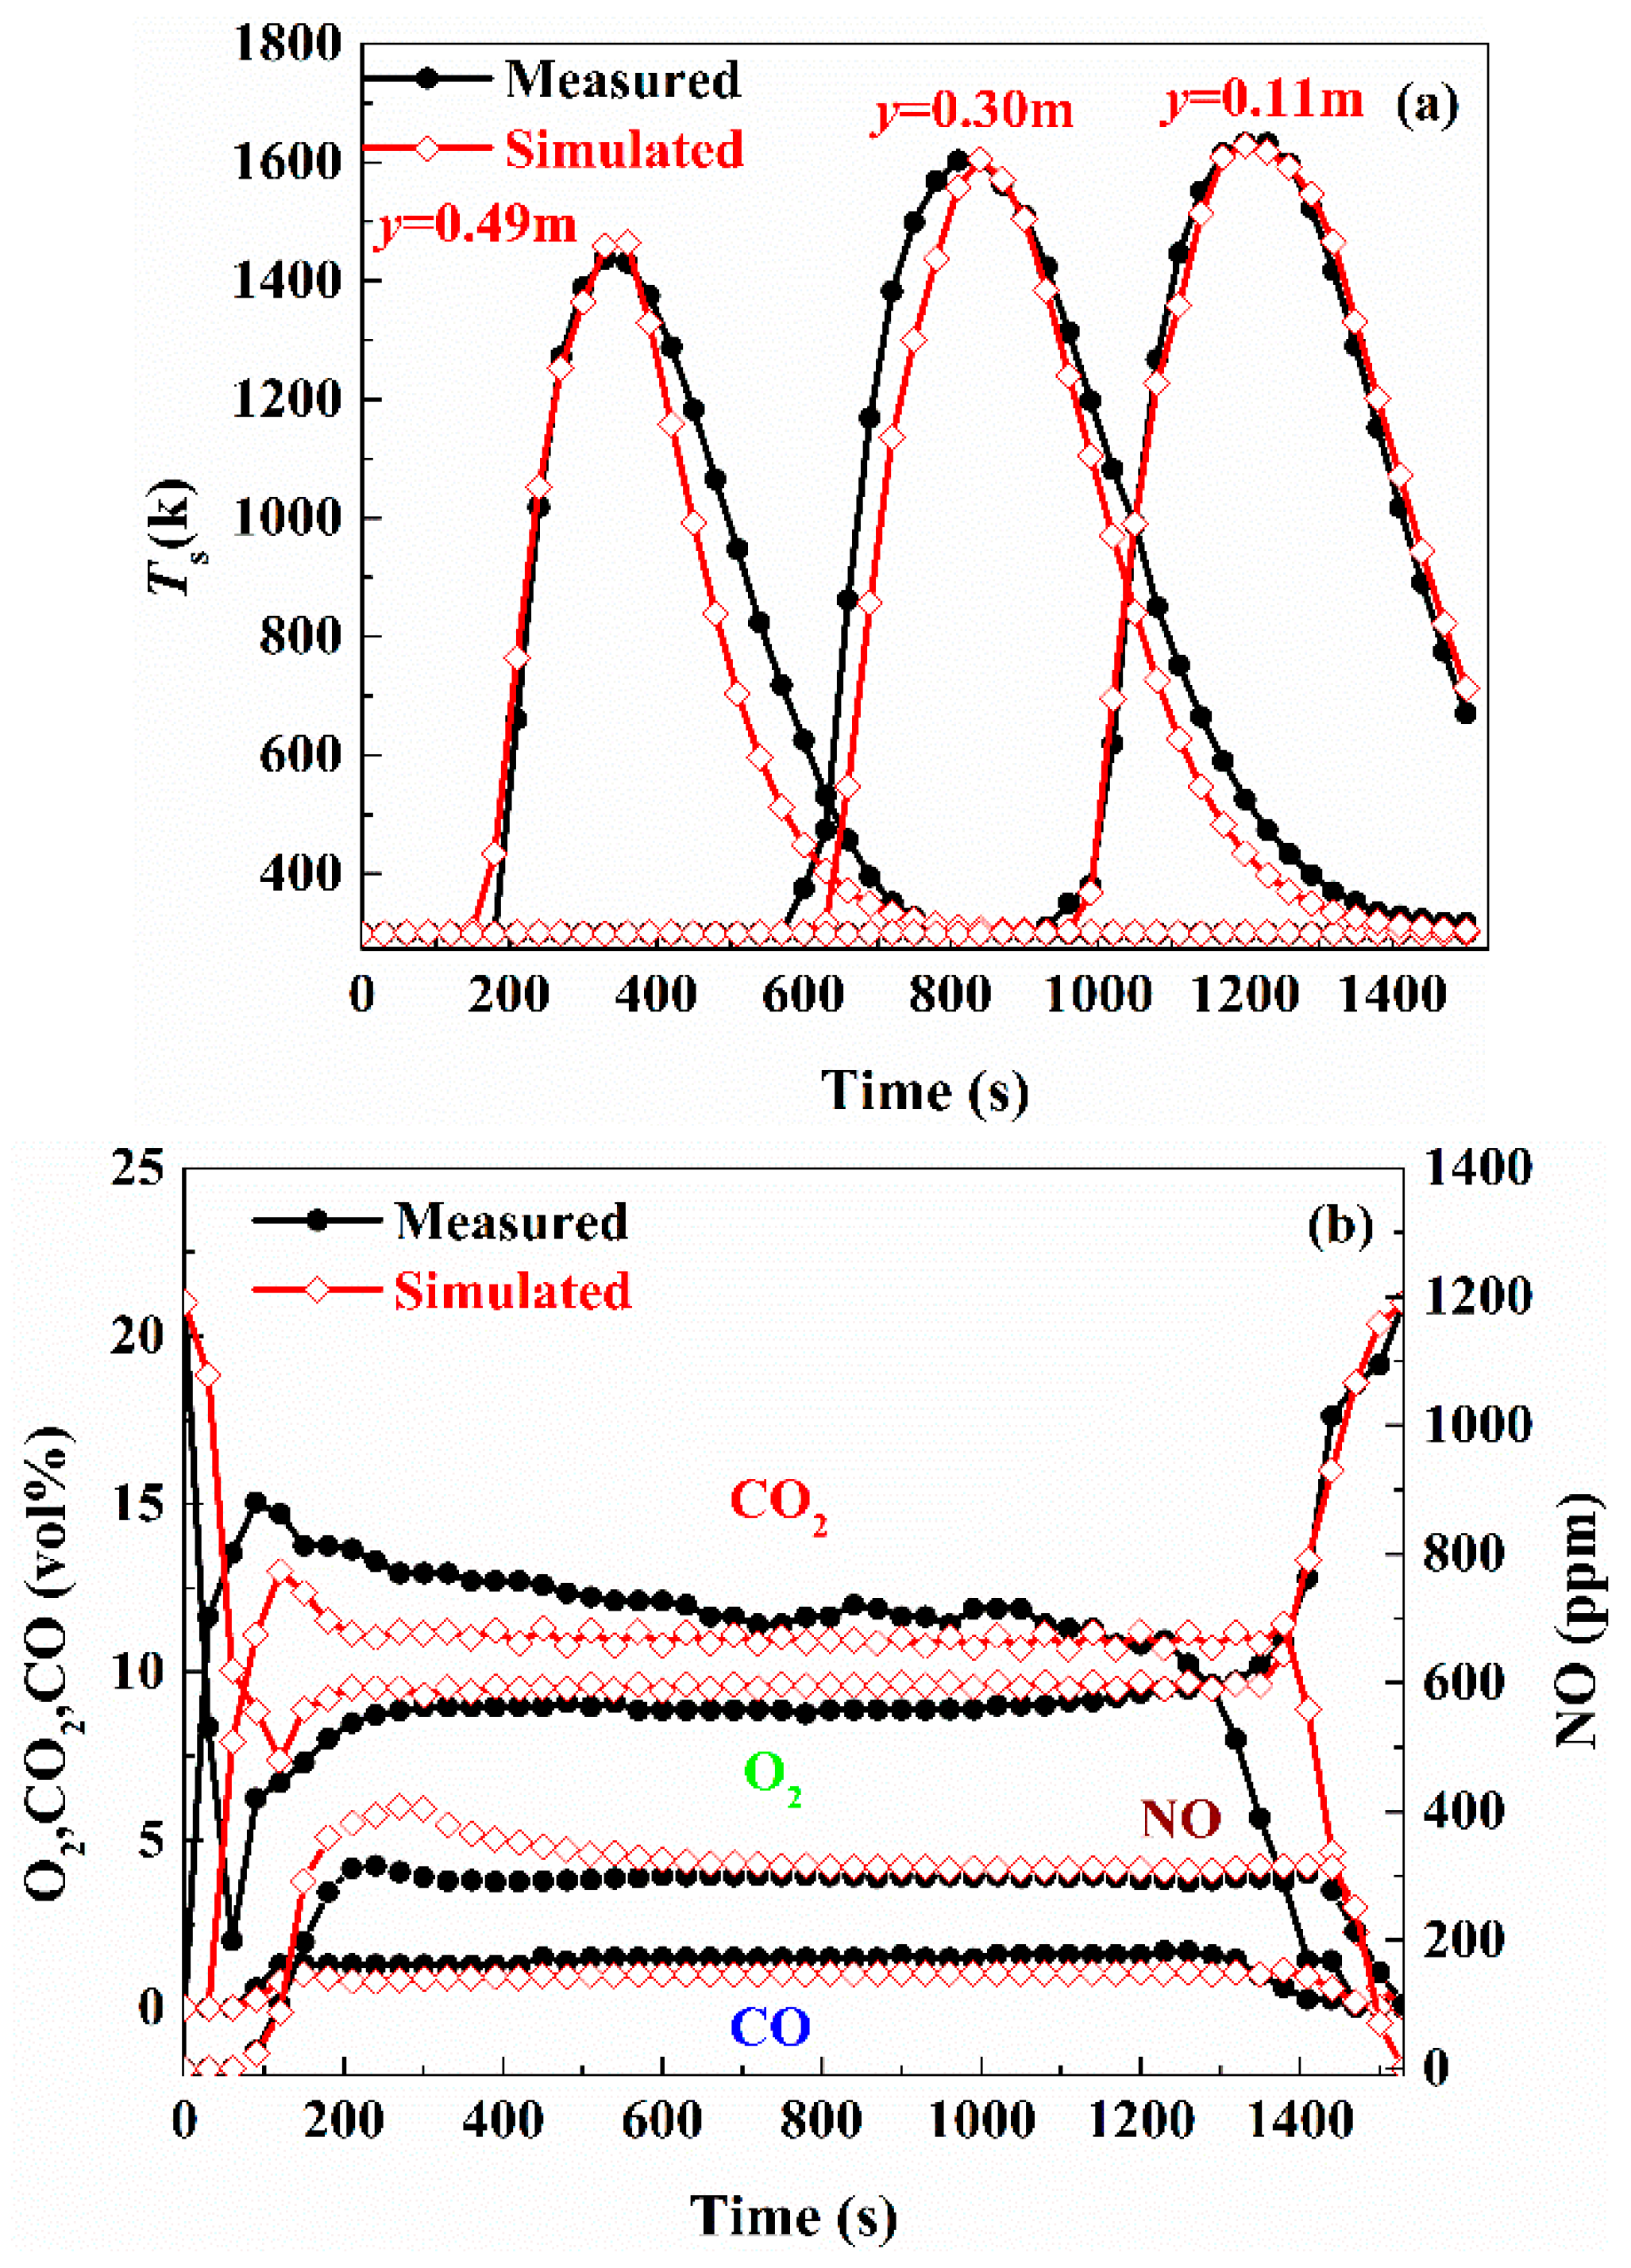
Figure 2a shows that the simulated results for MaxT and duration at the high-temperature zone of the sintering bed are in good agreement with the experimental data. However, the time of temperature increase in the simulation case shows a slight deviation from the measured values at some locations. The reason for the deviation may be that the shrinkage rate model of the sintering bed is simplified in this paper, and it is believed that shrinkage of the sintering bed only occurs in the melting and solidification stage, while, in fact, the shrinkage rate of sintering bed is also affected by limestone decomposition and coke combustion [35].
Figure 2b shows the gas species of O2, CO2, CO, and NO. Those gas compositions are the main combustion reactants and products in the sintering process. It is observed that the concentration levels of them remain constant after ignition and show relatively good agreement with the experimental ones, though there is a little deviation in, for example, CO2 and CO concentrations. The reason for this difference may be underestimation of the coke combustion rate.
To be specific, in this study, the average size of coke particles was adopted. However, in practical production, the coke combustion rate is obviously suppressed with increasing coke particle size due to the decrease of Assa. In that case, fine pulverized coke particles can burn out quickly when the temperature reaches a high level, while large particles, particularly at the bottom part of the sintering bed, might continue to burn. Also, large coke particle combustion is affected by O2 diffusion, especially in high-temperature regions. Therefore, the O2 concentration can be restored to normal (21 vol %) in the vicinity of the burning point after the large coke particles are completely burned out [35].
Table 5 shows a comparison of base case parameters between the simulated results and measured results. It is observed that the predicted MaxT is well in agreement with the measured data at the location of y = 0.11 m, i.e., the lower bed. However, the corresponding error increases obviously at the locations of y = 0.30 m and 0.49 m, i.e., the middle and upper beds, where it increases significantly to ~3%. The reason for this is that the temperature difference is not significant between the two points in sinter pot experiments, whereas it is noted that the temperature difference is close to the simulated results. These similar reasons and their influences have been discussed in the literature [35,40]. In addition, the FFS (flame front speed) is also verified through the experimental data: the result shows that the measured results were consistent with the results of the simulation.
3.2. Quantification of NOx Formation and Reduction for Overall NOx Emission
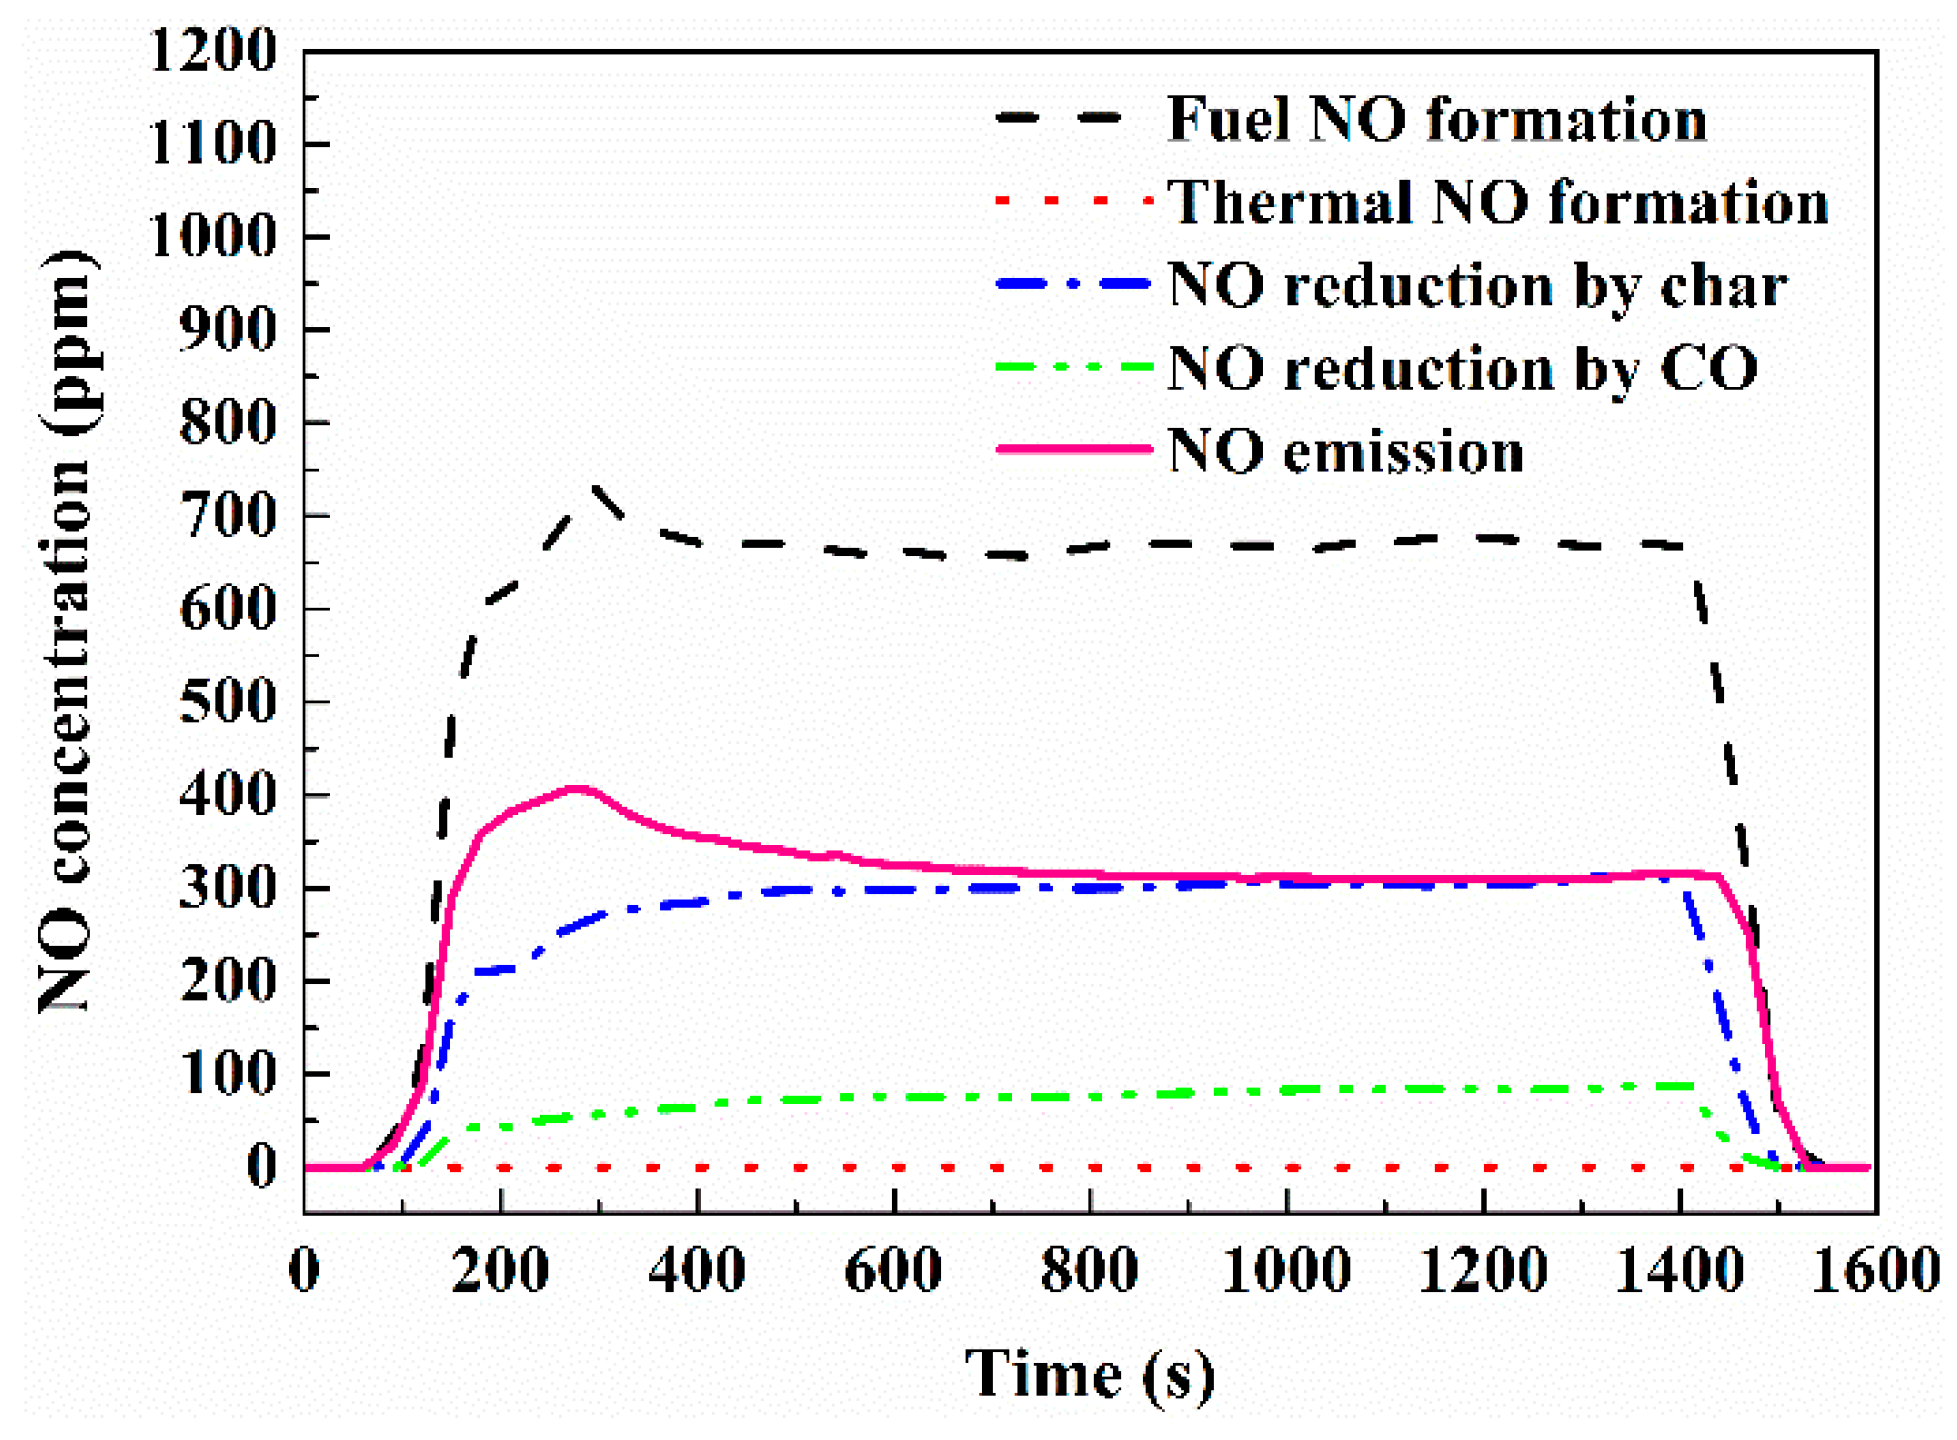
The rates of NOx formation and reduction by each mechanism along the axis of the sintering pot for the base case are shown in Figure 3. It can be seen that at y = 0.49 m, the generation rate of fuel NOx is the highest, followed by the coke reduction rate of NO, then the CO reduction rate of NO, and finally the generation rate of thermal NO. As the combustion zone moves downward, due to heat storage, the temperature of the lower material layer gradually increases, so the rates of NO formation and reduction by the different mechanisms tend to increase. On the one hand, the contribution of the formation of thermal NO to overall NO formation is very little. On the other hand, the contribution of fuel NO formation is very large compared with those of the other NO formation and reduction mechanisms. This is the reason why fuel-type NO has a significant impact on the formation of NO in sintering.
In order to quantify the contribution from NO formation and reduction to the overall NOx emission, four different NO formation and reduction mechanisms were considered in the base case. The ignition period and burnt-through period were both too short compared with the whole sintering process [11], so only the NOx emission in the steady state of the sintering is discussed.
In Figure 4, the reduction extent of NO by coke can be obtained by comparing the total formation of NO without any reduction reactions and the NO emission considering the reduction only by coke. It can be seen that the NO generated from fuel NO is approximately 670 ppm, and the NO emission is about 370 ppm when the reduction of NO by coke is considered; therefore, about 50% NO is reduced by coke.
Meanwhile, the reduction extent of NO by CO can be obtained by comparing the total formation of NO without reduction and the NO emission considering the reduction only by CO. It can be seen that the total formation of NO is about 670 ppm and the NO emission is approximately 600 ppm when the reduction of NO is only by CO, so about 10% NO is reduced by CO.
This is consistent with the results of previous work [11]; therefore, the reduction of NO by coke and CO is an indispensable part of the NO formation and reduction mechanisms.
3.3. Effect of Fuel Type
The solid fuel combustion is very complicated in sintering, and the type of fuel has a significant influence on NOx generation [5]. Different types of coke have big differences in nitrogen content. Using coke with a low nitrogen content can reduce NOx emissions and environmental pollution, but high-grade coke with high fixed carbon and low nitrogen is more expensive. The compositions and heating values of Coke A and Coke B are shown in Table 6.
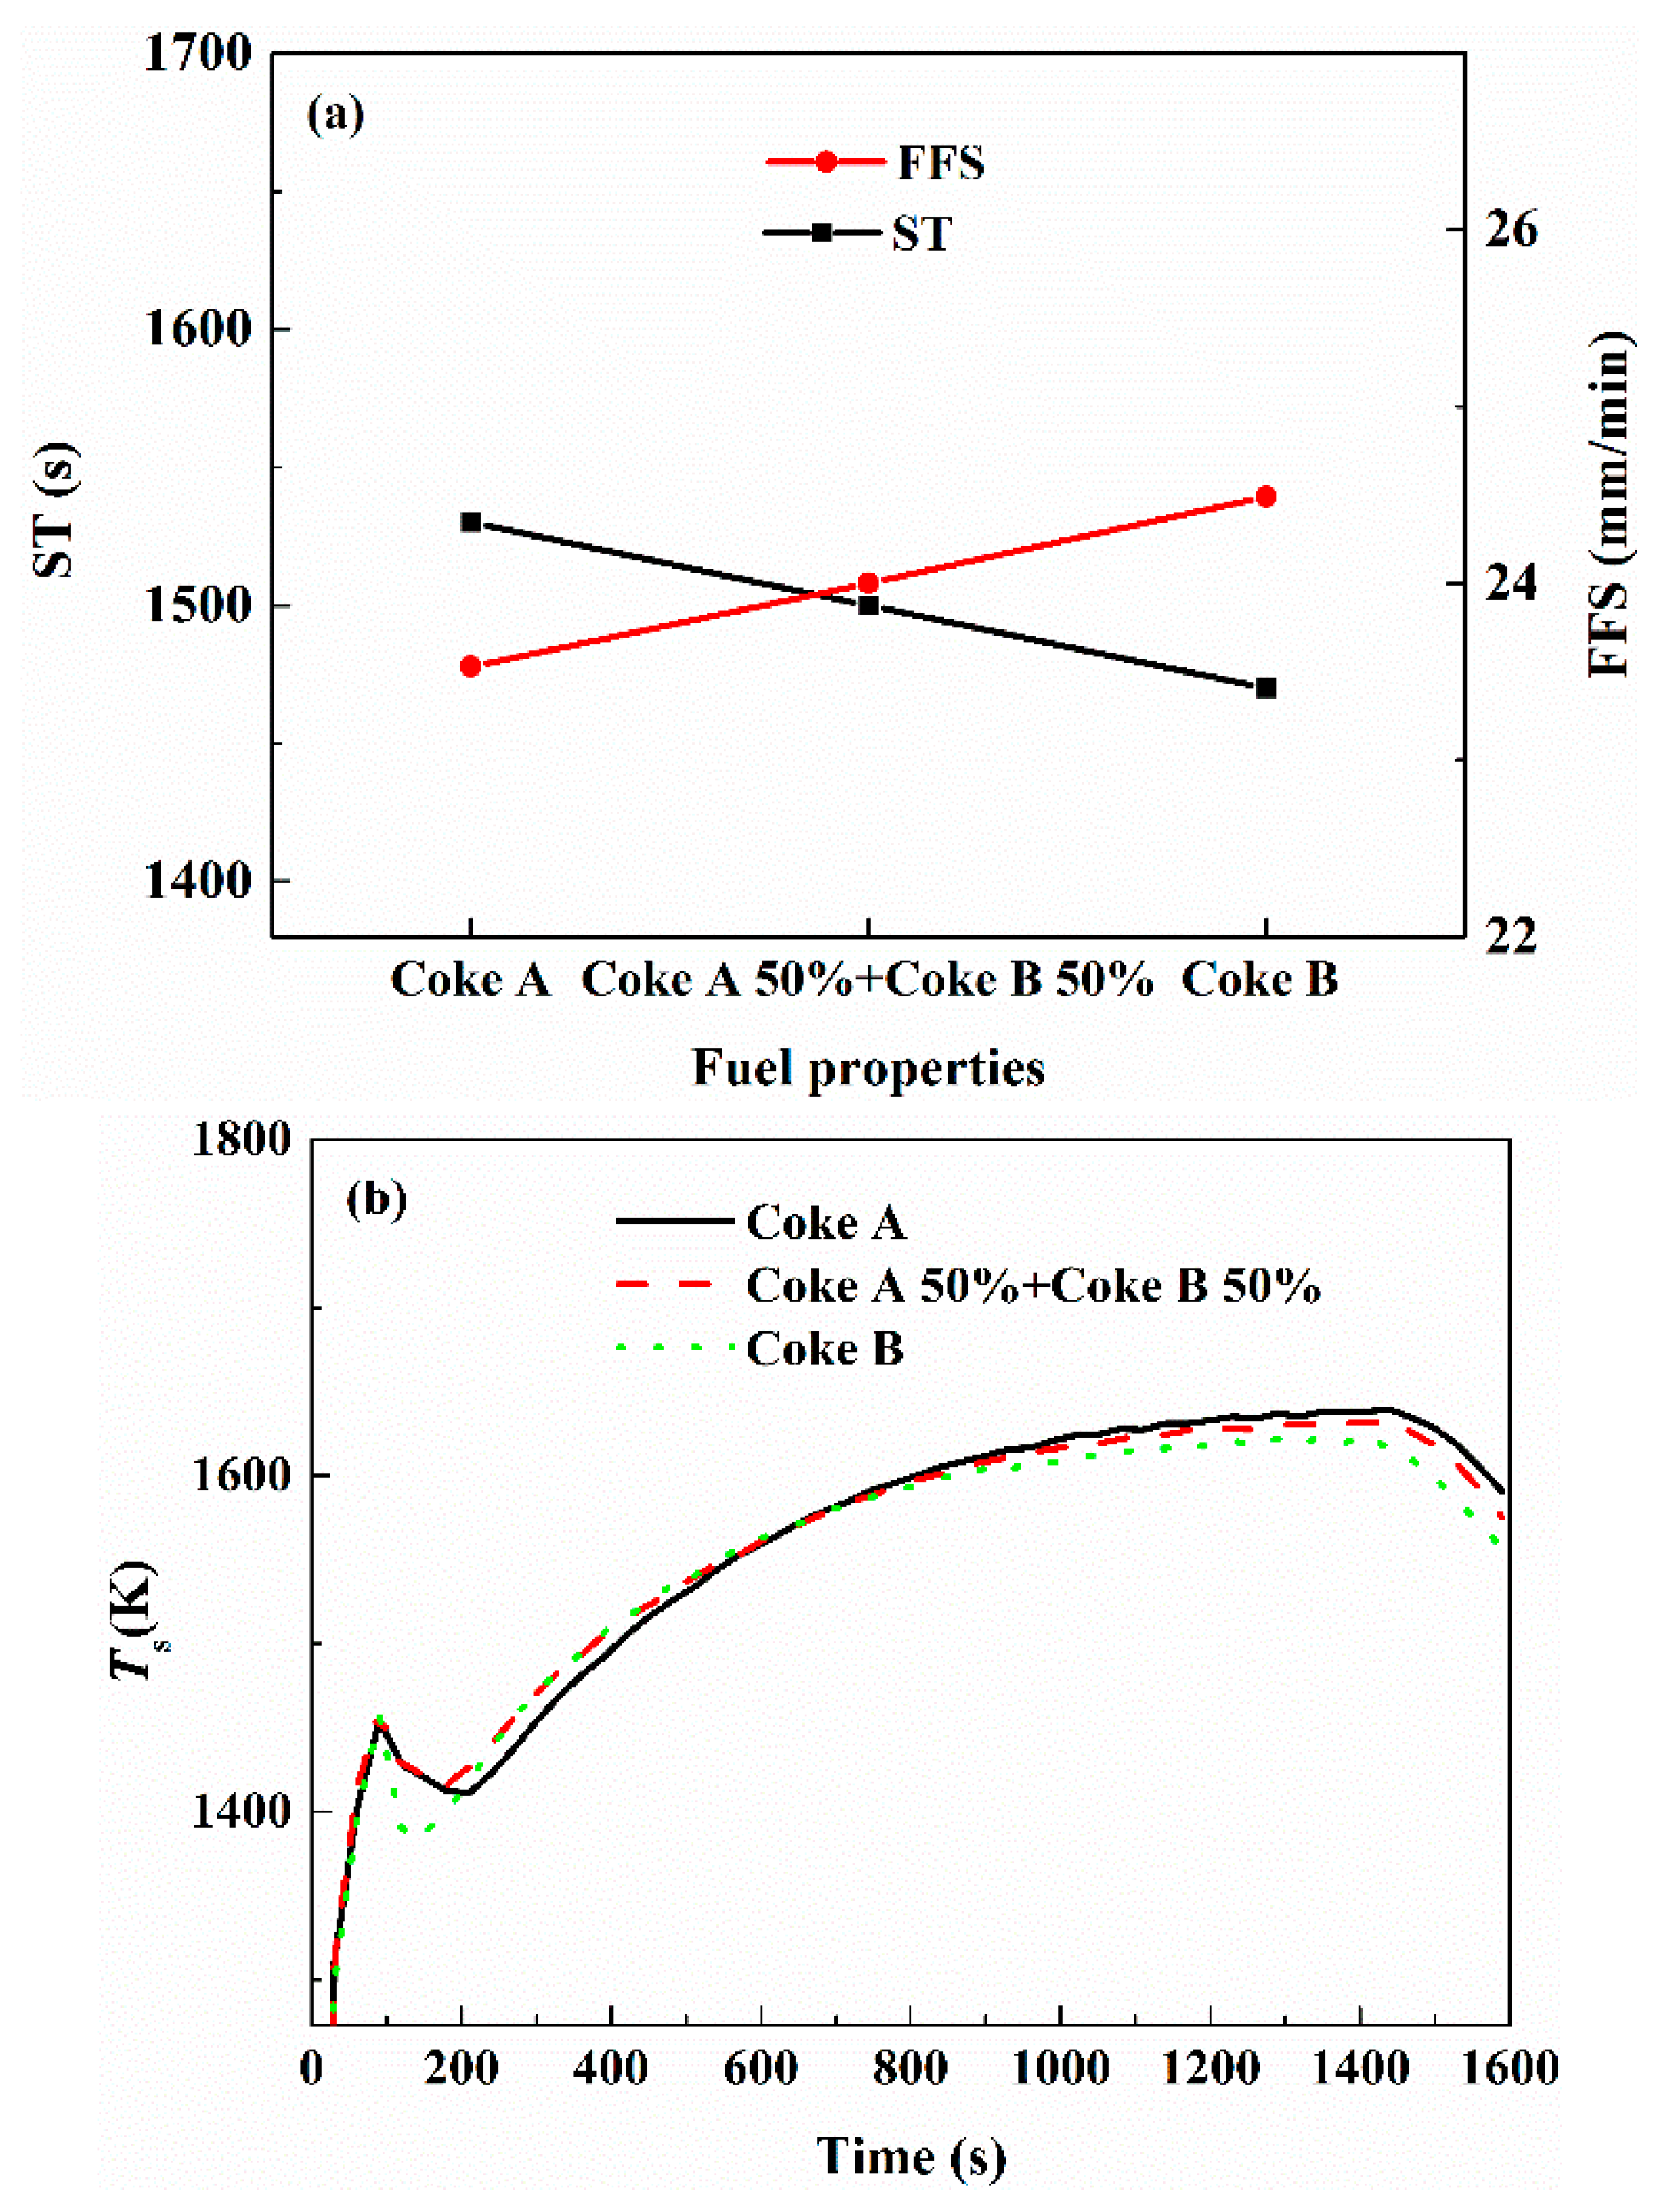
Figure 5a shows the effect of fuel type on FFS (Flame Front Speed) and ST (Sintering Time). As the ratio of Coke A to Coke B decreases, the FFS increases and the ST decreases. Under the premise of a certain solid fuel consumption, using Coke A only as the solid fuel, the FFS is 23.53 mm/min and the ST is 1530 s. Using 50% Coke A and 50% Coke B as the solid fuel, the FFS is 24 mm/min and the ST is 1500 s. Using Coke B only as the solid fuel, the FFS is 24.49 mm/min and the ST is 1470 s. The reason for this is that Coke B has a slightly higher fixed carbon content than Coke A.
In Figure 5b, MaxT (Maximum Temperature) rises in the upper bed layer during the period of ignition, decreases slightly at the end of ignition, and then rises up gradually. MaxT rises up to 1616.0 K until the burning-through point and then begins to decline. Because Coke A and Coke B are close to each other in fixed carbon content and heating value, MaxT differs little.
Figure 6a shows that the NOx emission level decreases with increasing use of Coke B and decreasing use of Coke A. The NOx emission level is 320 ppm in flue gas when 100% Coke A is used. It decreases to by 28.13% 230 ppm when 50% Coke A and 50% Coke B is used. It decreases to by 53.13% 150 ppm in the case of 100% Coke B.
Figure 6b shows that when only Coke A is used as the solid fuel, the O2 concentration is 9.93% in the flue gas. When using 50% Coke A and 50% Coke B, the O2 concentration is 9.65%. When using only Coke B, the O2 concentration is 9.48%. The NOx emission level is decreased with increasing proportion of Coke B, which is mainly attributed to the mechanism of NOx generation and reduction in solid fuel. Coke B has higher fixed carbon and lower nitrogen contents than Coke A. Increasing the proportion of Coke B will promote the burning rate of solid fuel per unit volume, so the oxidation of fuel N increases. As there is the reduction of NOx by coke and CO at the same time, the final NOx emission is reduced as the result of the lower total nitrogen content in the solid fuel.
3.4. Effect of Operation Parameters
The coke particle size determines its specific surface area and influences its combustion rate. For coke with small particle size, the combustion rate and NOx reduction are increased due to the large surface area. The effect of coke particle size on coke combustion and NOx emission was simulated with initial coke sizes of 1.6 mm, 1.4 mm, and 1.2 mm (base case, Case 2, and Case 3, respectively).
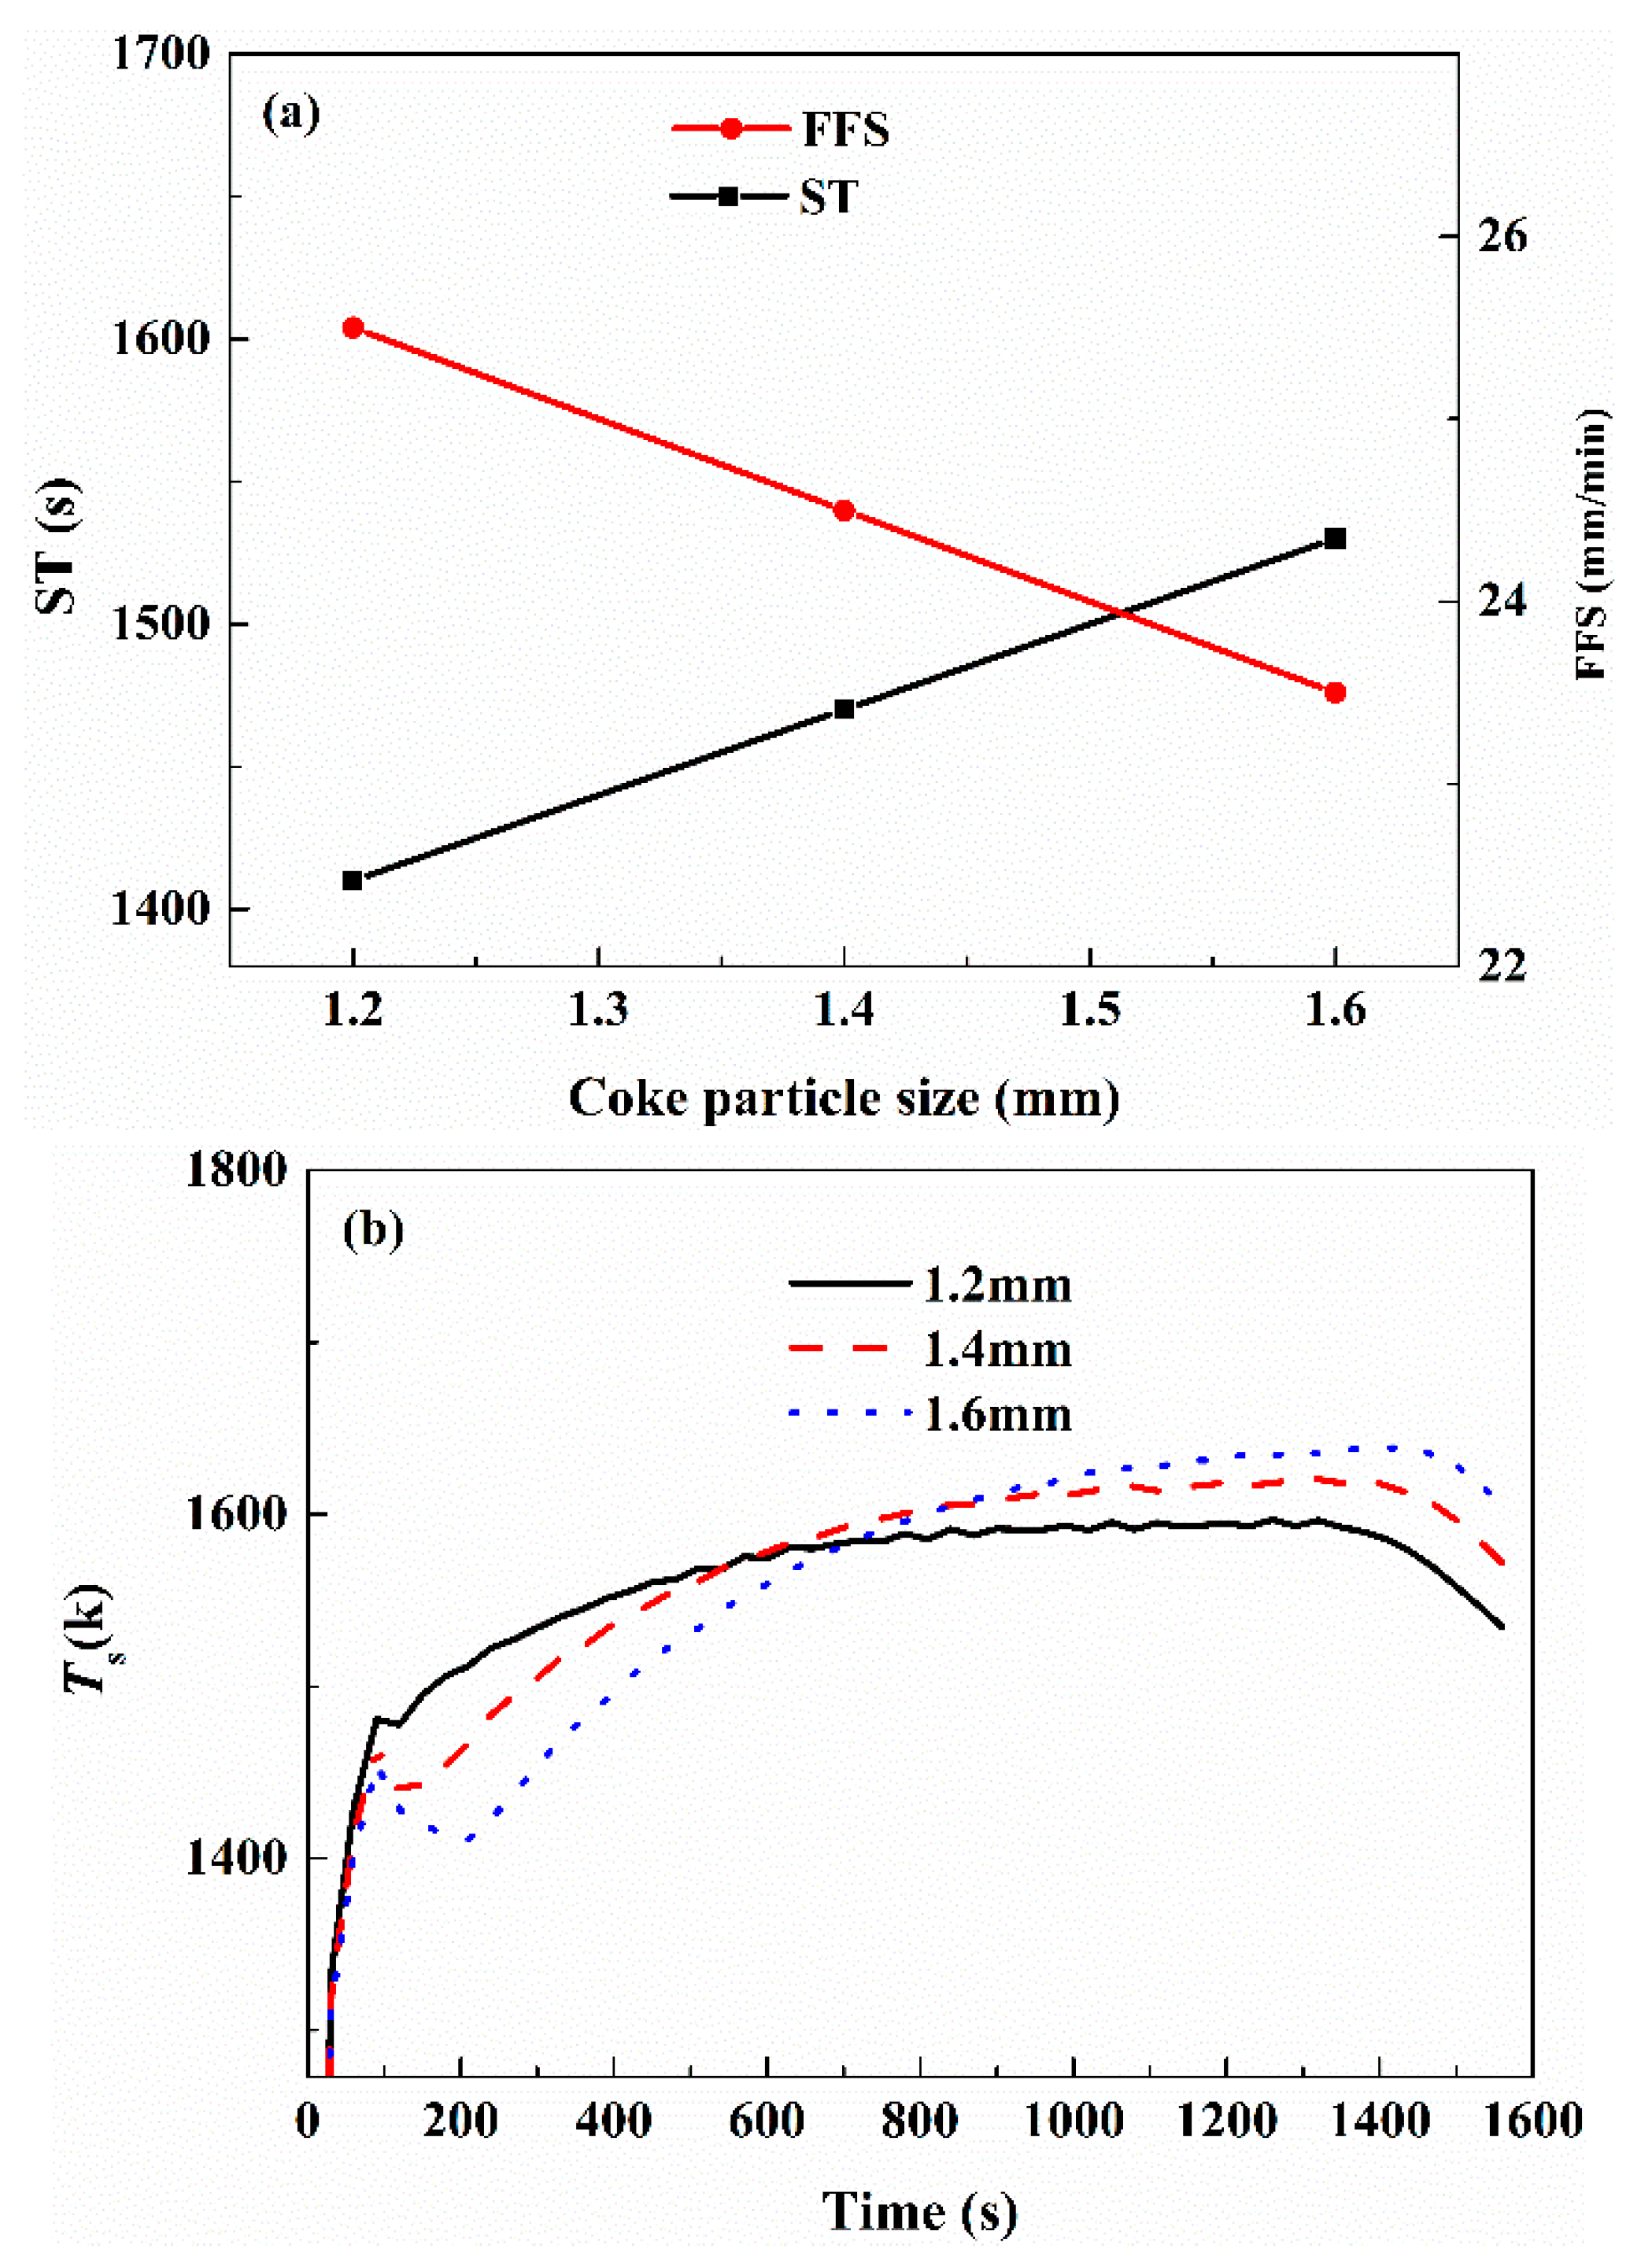
Figure 7a shows the simulation results of ST (sintering time) and FFS (flame front speed) for the different coke particle sizes. As the coke particle size decreases from 1.6 mm to 1.2 mm, the ST decreases from 1530 s to 1410 s, and the FFS increases from 23.5 mm/min to 25.5 mm/min. This indicates that the coke combustion rate is increased and the coke particle burn-out time gets shorter with decreasing coke particle size.
Figure 7b shows the variation of MaxT for various coke particle sizes. Taking 1.6 mm coke particles as an example, in the initial stage of the sintering, under the negative pressure at the bottom of the sintering bed, when cold air flows into the sintering bed from the upper part after the ignition, MaxT first decreases and then increases. When the coke particle size decreases, MaxT increases first and then decreases during the projected time frame. It can be seen in Figure 7b that MaxT with 1.6 mm coke particles declines more than that with 1.4 mm coke particles and 1.2 mm coke particles at the end of ignition. This is because the combustion rate of 1.6 mm coke particles is lower than that of 1.4 mm coke particles. When the coke particle size decreases from 1.6 mm to 1.2 mm, the Assa (specific surface area) of the coke particles increases, so the combustion rate of the coke particles increases.
In Figure 8a, as coke particle size decreases, the NOx emission level increases gradually. When the coke size is reduced from 1.6 mm to 1.2 mm, the NOx emission level increases by 10.93% from 320 ppm to 355 ppm. Therefore, when the coke particle size is 1.2 mm, the NOx emission level is the highest. For small coke particles, the oxygen and combustion product could easily diffuse through the thinner formed ash layer and its combustion rate is controlled by kinetic conditions, whereas larger coke particles tend to be controlled by mass transfer [11].
In Figure 8b, as the coke particle size decreases, the O2 concentration in the flue gas gradually decreases. When the coke size is reduced from 1.6 mm to 1.2 mm, the oxygen concentration in the flue gas decreases from 10.0% to 9.0%.
Therefore, reducing the coke particle size will increase the coke particle combustion rate.
The coke ratio is one of the important operation parameters that influences coke combustion and NOx emission. For a lower coke ratio, the combustion rate and NOx reduction are reduced due to the decrease in coke quantity. In order to investigate the coke ratio effect on coke combustion and NOx emission, simulations were carried out for coke ratios of 3.8%, 4.0%, and 4.2% (base case, Case 4, and Case 5).
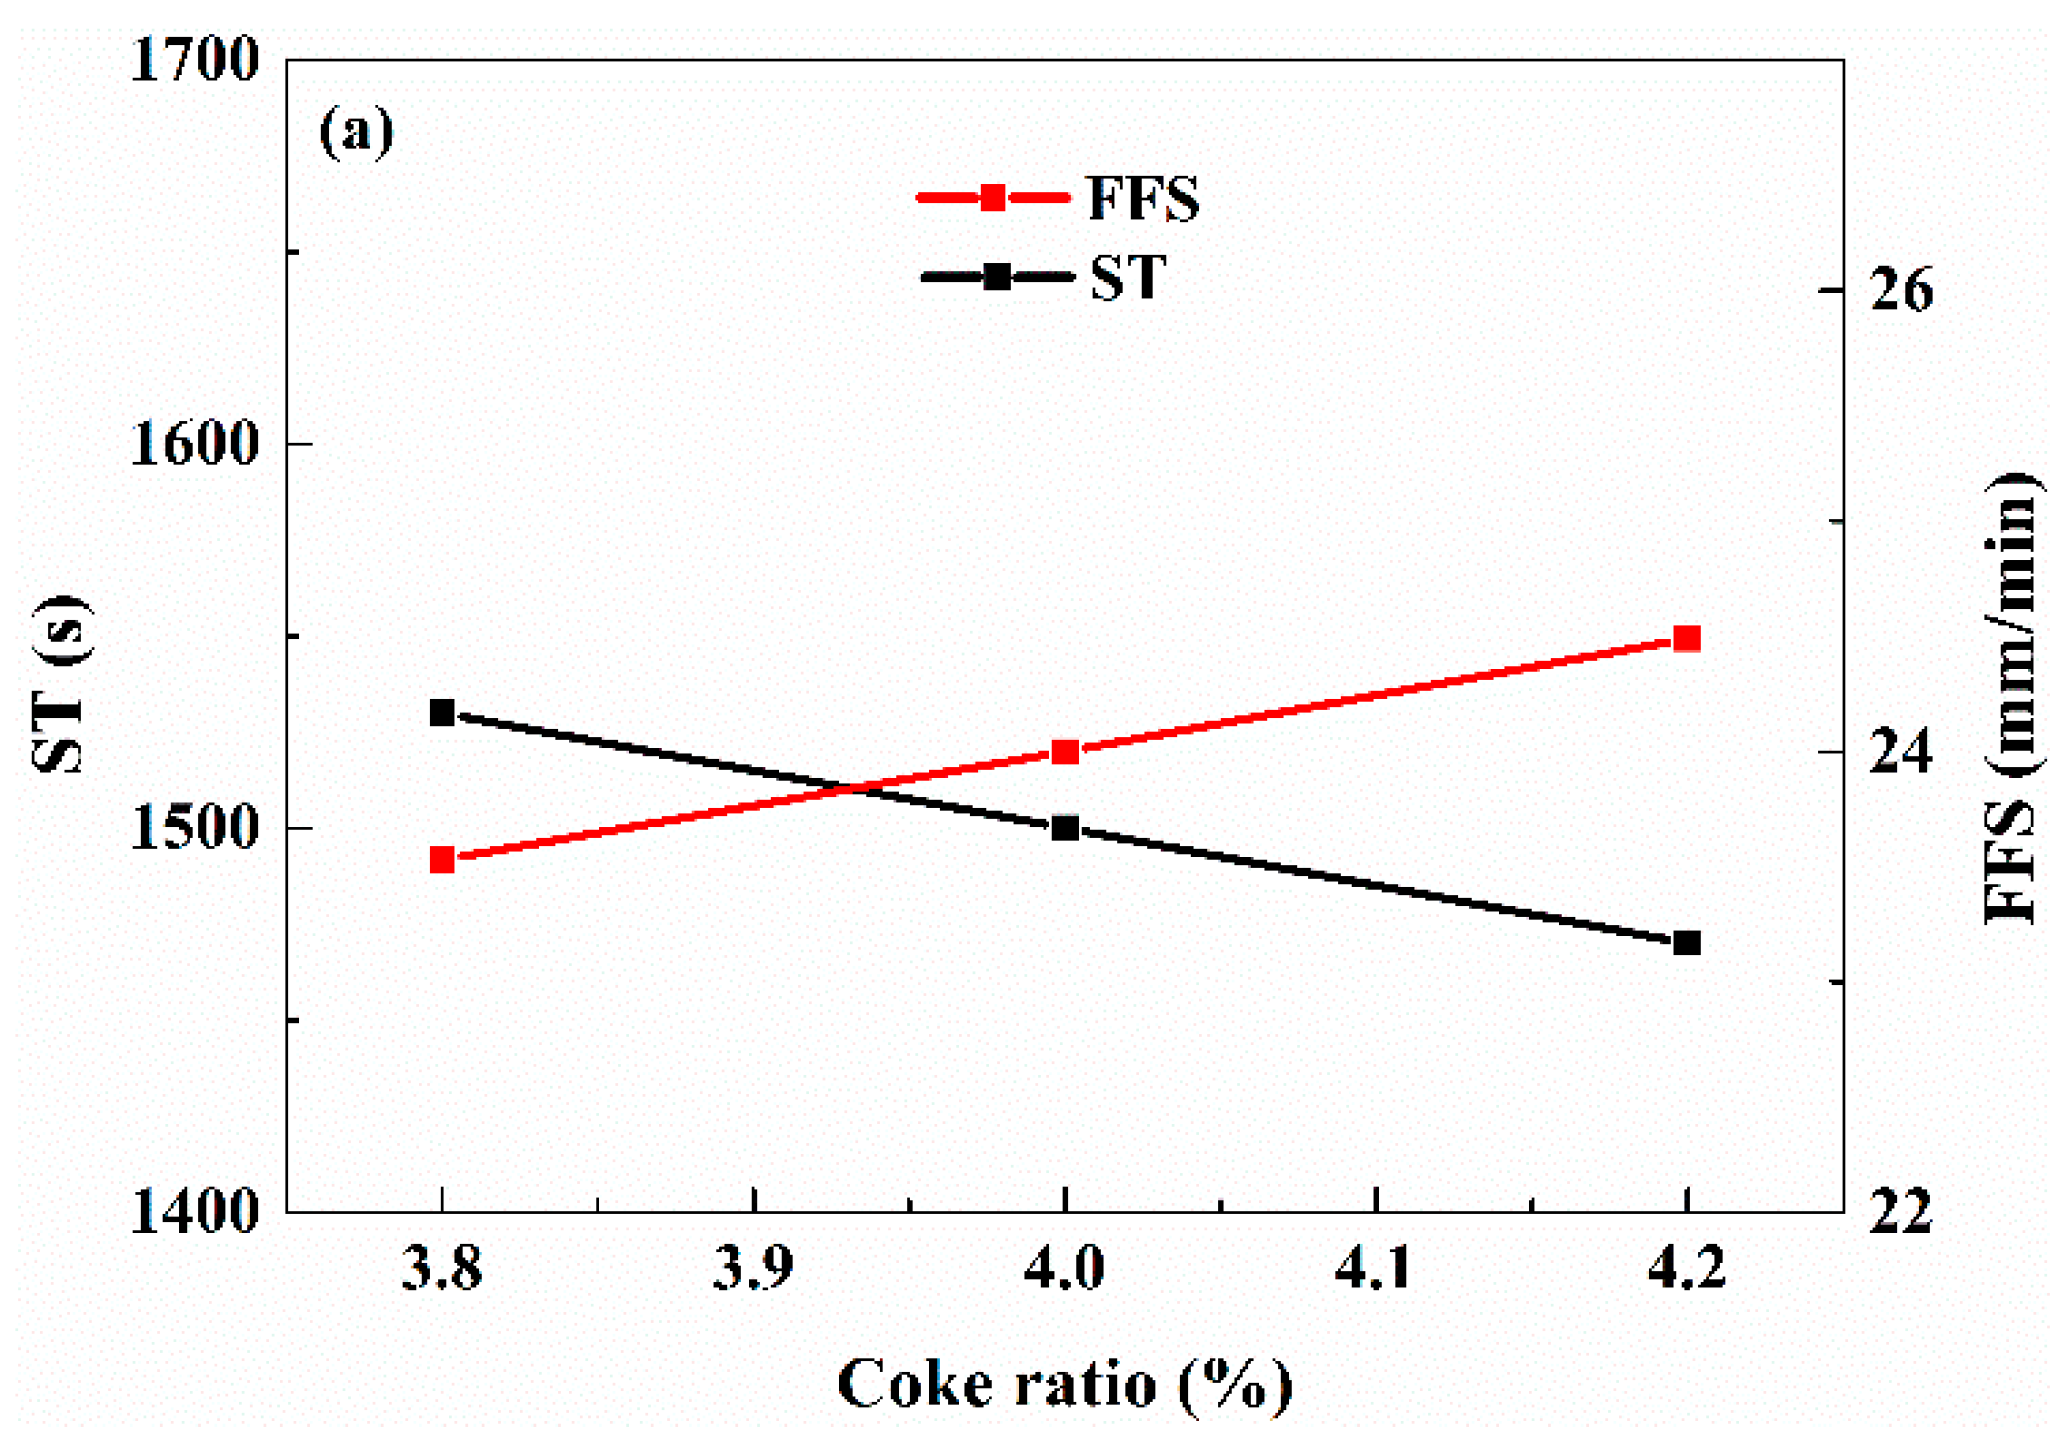
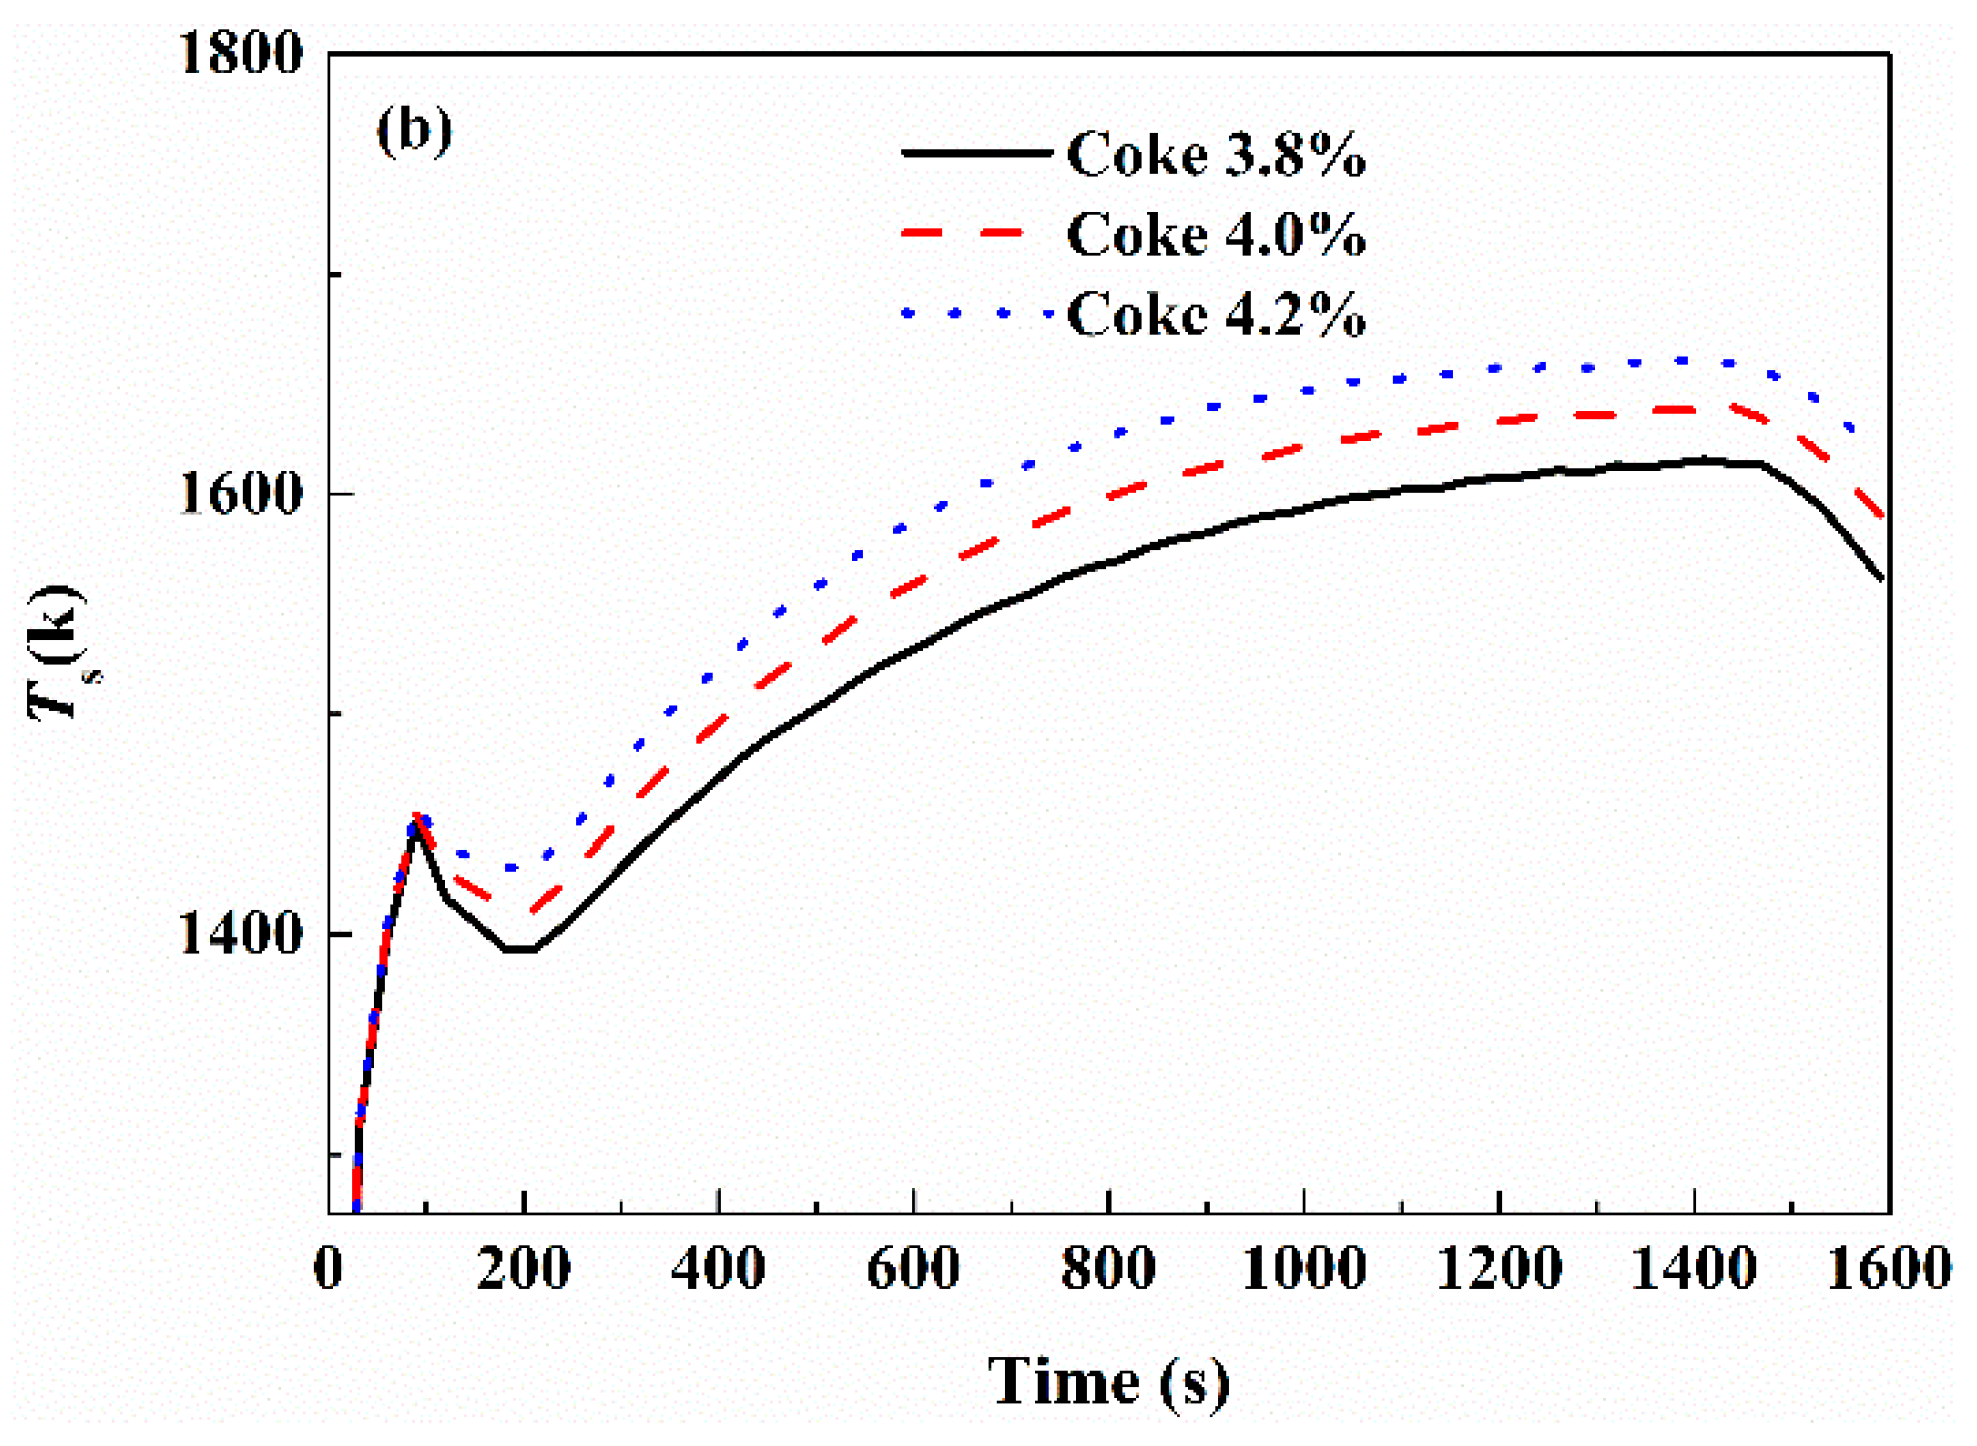
Figure 9a shows that with increasing coke ratio, the FFS increases from 23.53 mm/min to 24.49 mm/min, and the ST decreases from 1530 s to 1470 s. With increasing coke ratio, the total combustion rate increases, so the FFS increases and the ST becomes shorter.
As shown in Figure 9b, when the coke ratio is increased, MaxT increases during the projected time frame. The reason for this is that the coke combustion rate increases as well as the heat transfer of the gas phase. Meanwhile, the combustion rate of coke at a high temperature is limited by oxygen diffusion: the higher the coke ratio, the longer the duration in the high-temperature zone of the sintered material layer until the coke is completely consumed [41].
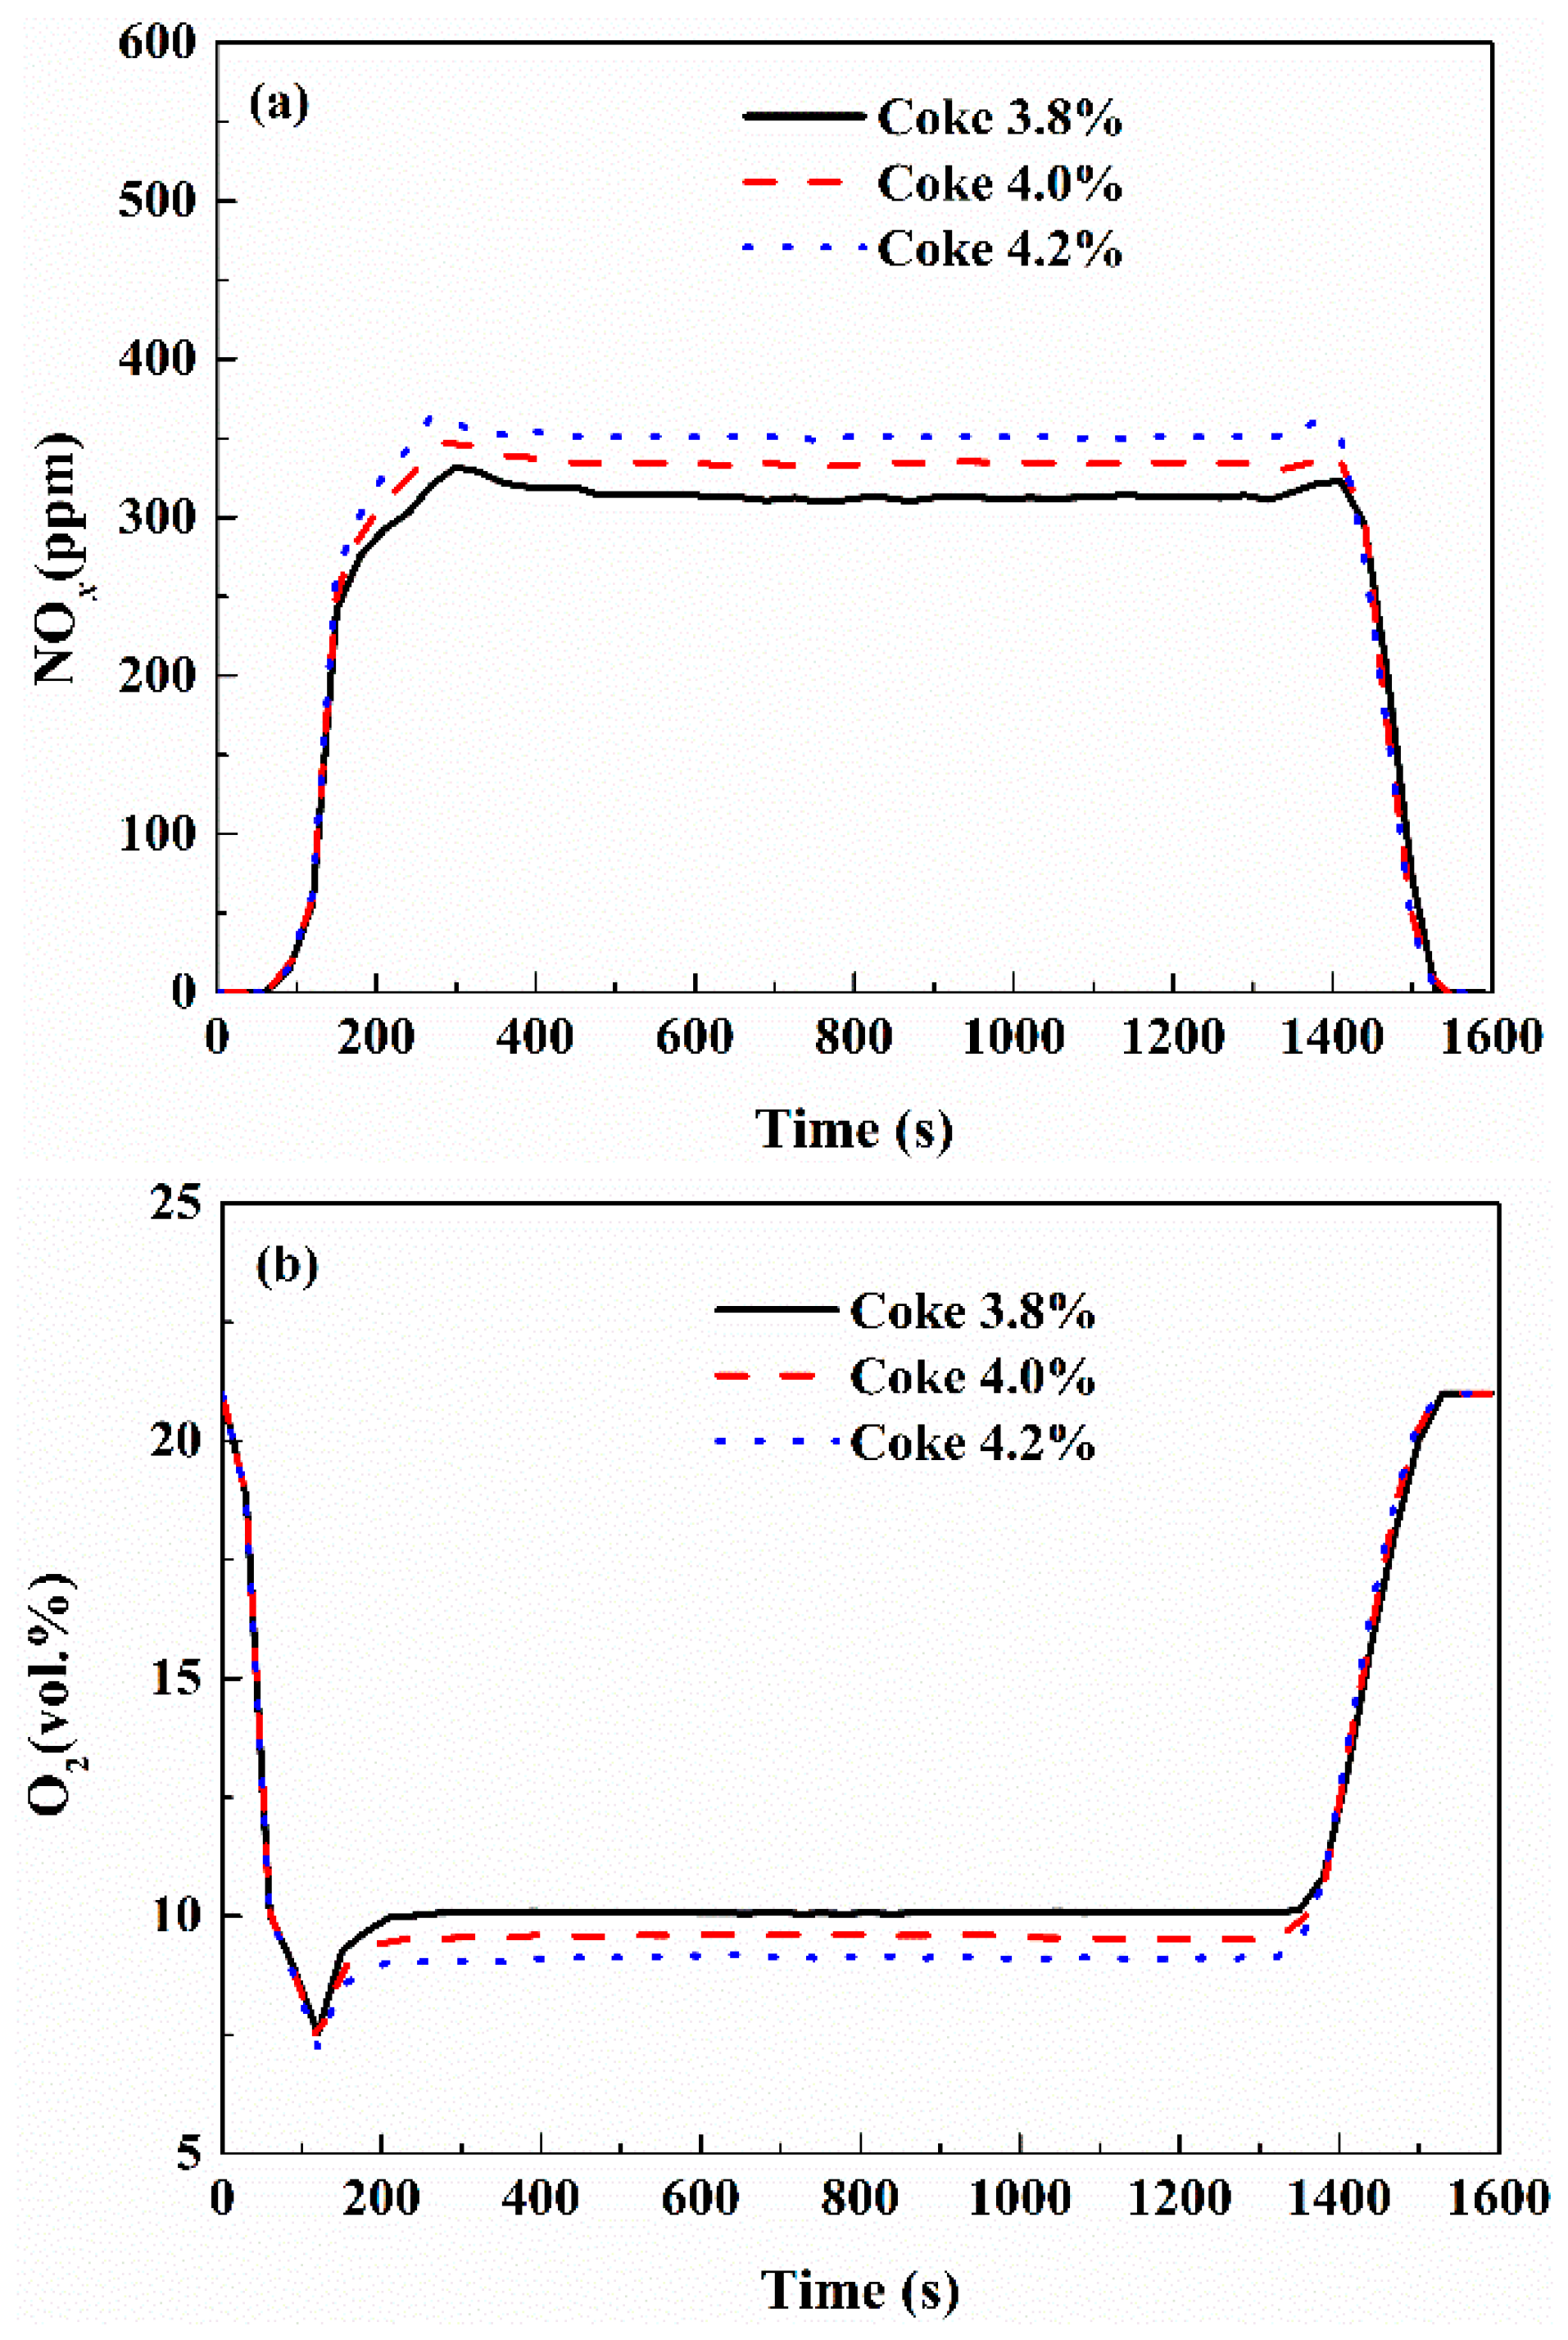
Figure 10 shows that the NOx emission level is increased and the O2 concentration in the flue gas is decreased with increasing coke content. The NOx emission level is 320 ppm during the steady sintering state, increases by 4.38% to 334 ppm for a 4.0% coke ratio, then increases by 9.38% to 350 ppm for a 4.2% coke ratio. Increasing coke ratio will significantly increase the bed temperature and coke combustion rate and generate much more NOx. The resulting increase in the coke combustion rate will have the effect of decreasing the oxygen content in the flue gas, and more oxygen is consumed with increasing coke ratio, resulting in a reducing atmosphere which promotes NOx reduction by coke combined with CO. Some studies have reported that more than 90% of the N comes from the fuel [17,42]. Therefore, reducing the use of high-nitrogen-containing fuel can significantly decrease NOx emissions.
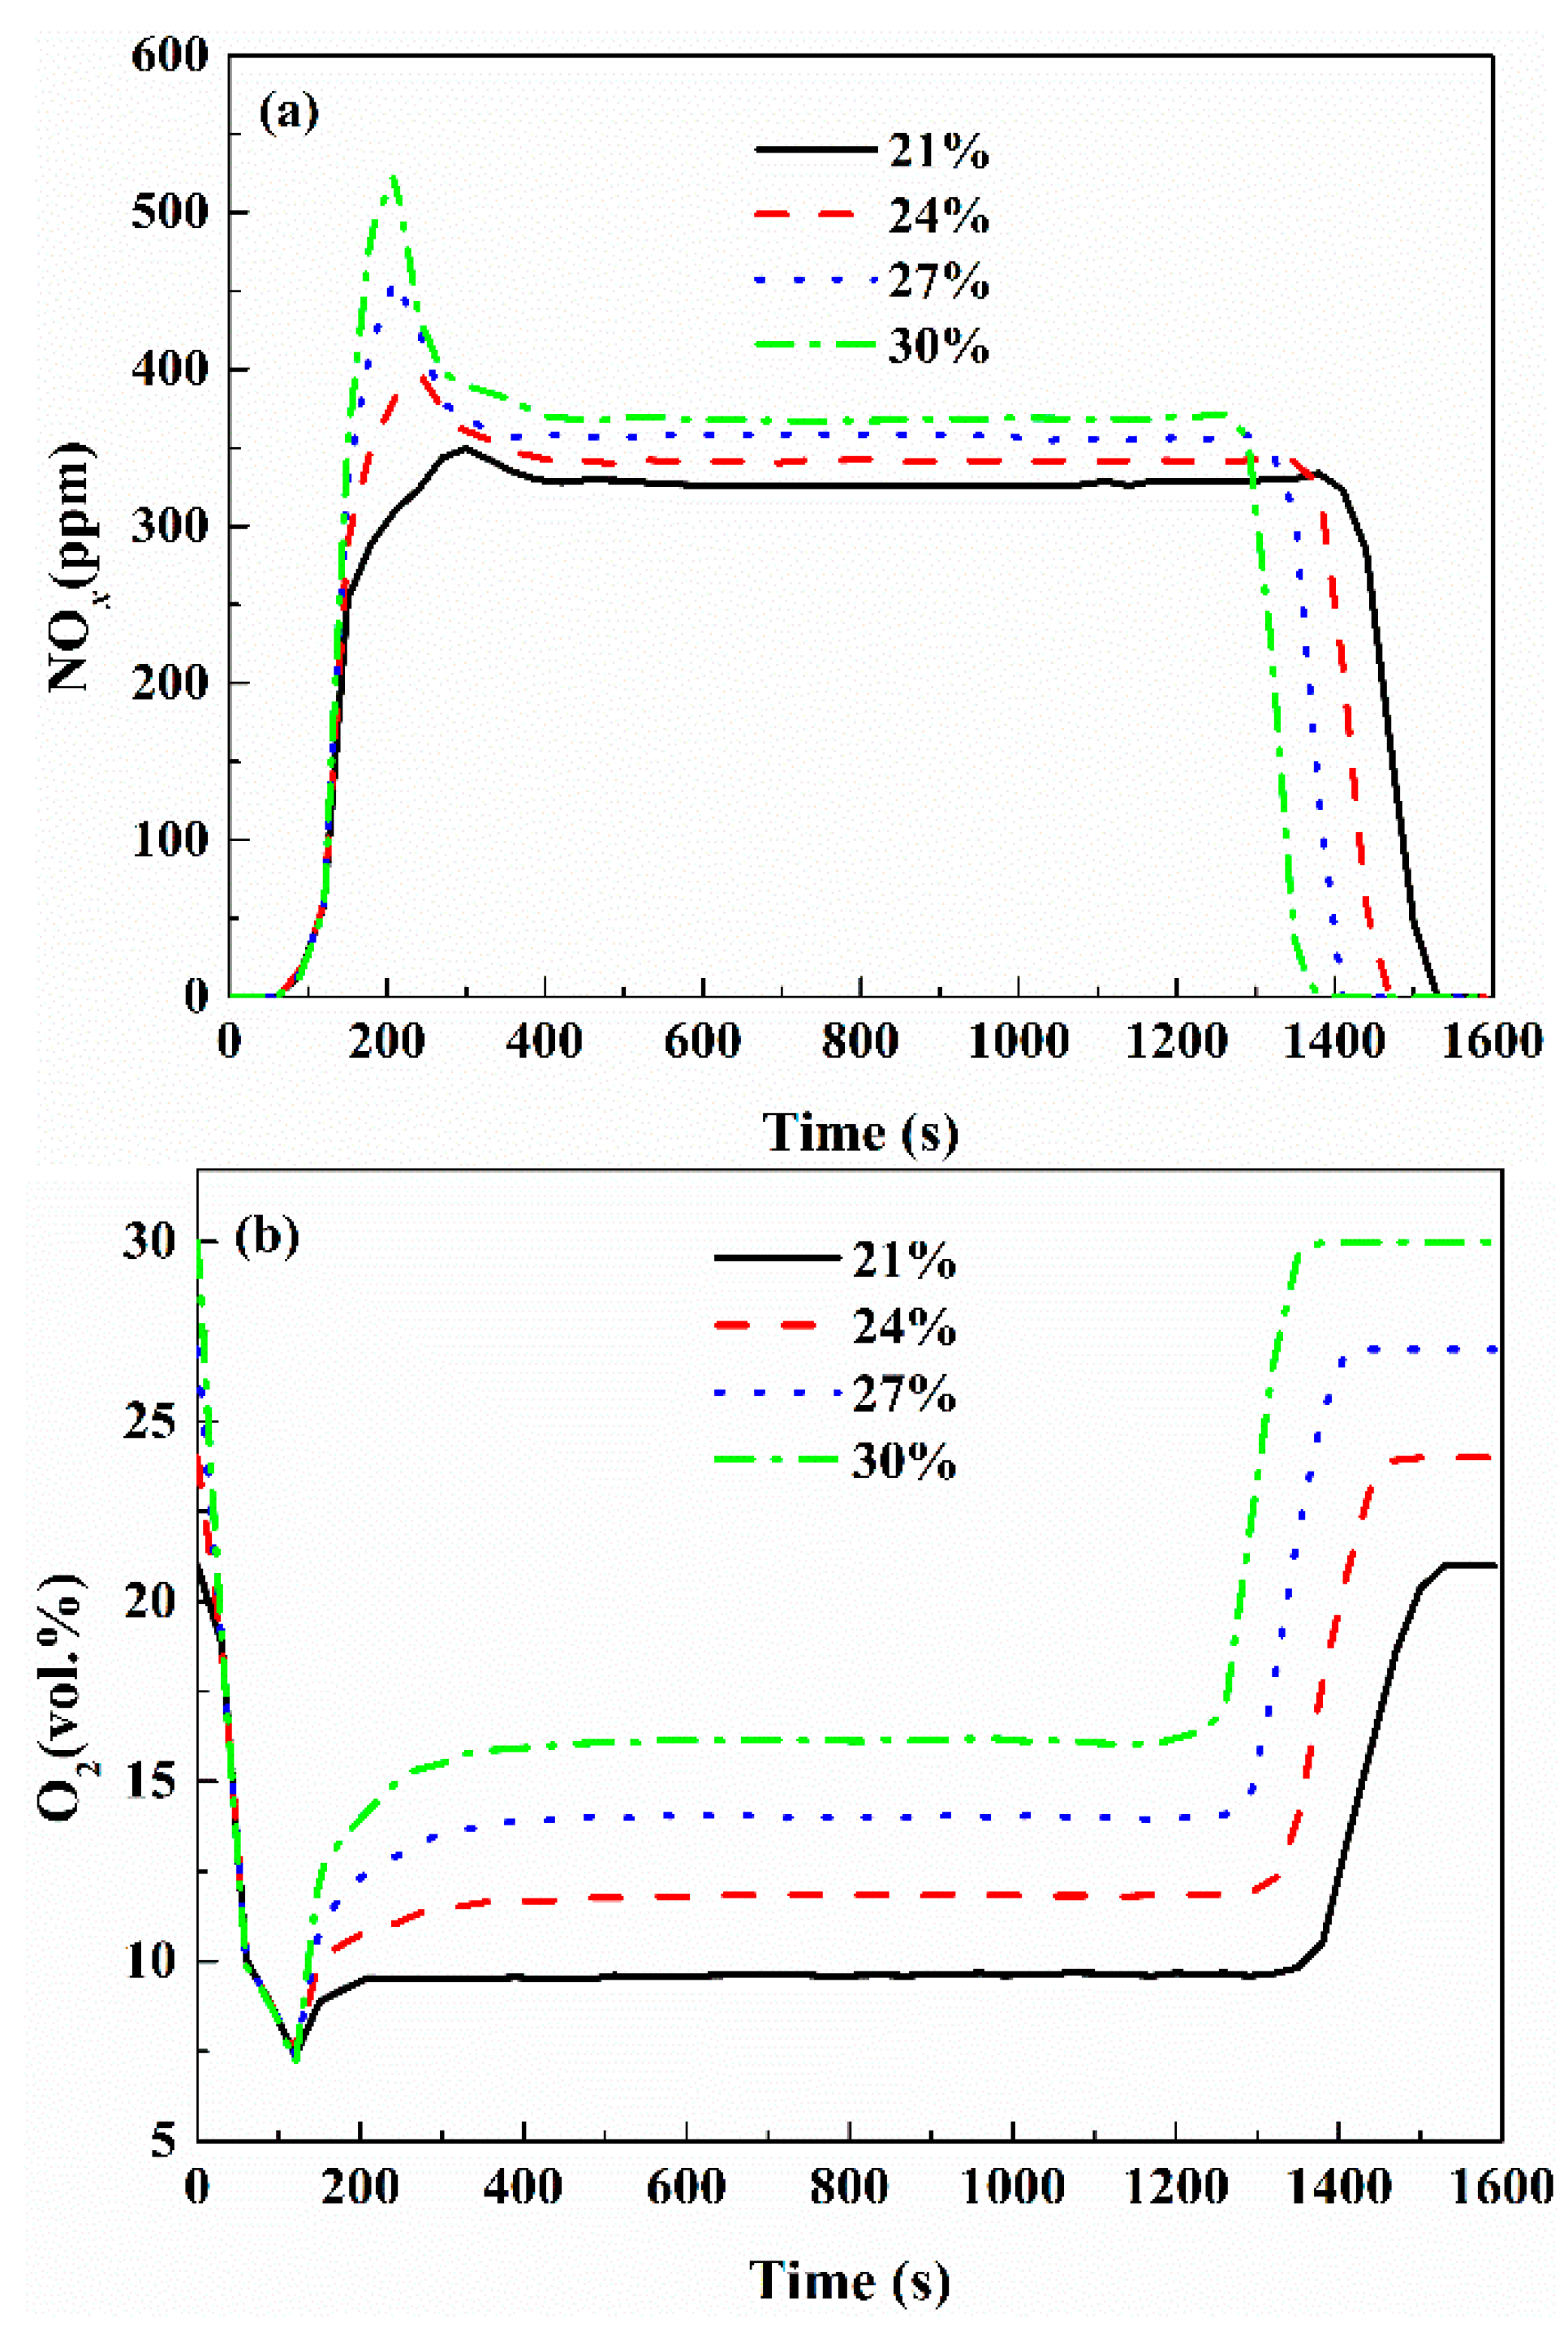
To investigate the effect of the air O2 concentration on coke combustion and NOx emission, simulations were conducted for O2 concentrations of 21.0%, 24.0%, 27.0%, and 30.0% (base case, Case 6, Case 7, and Case 8).
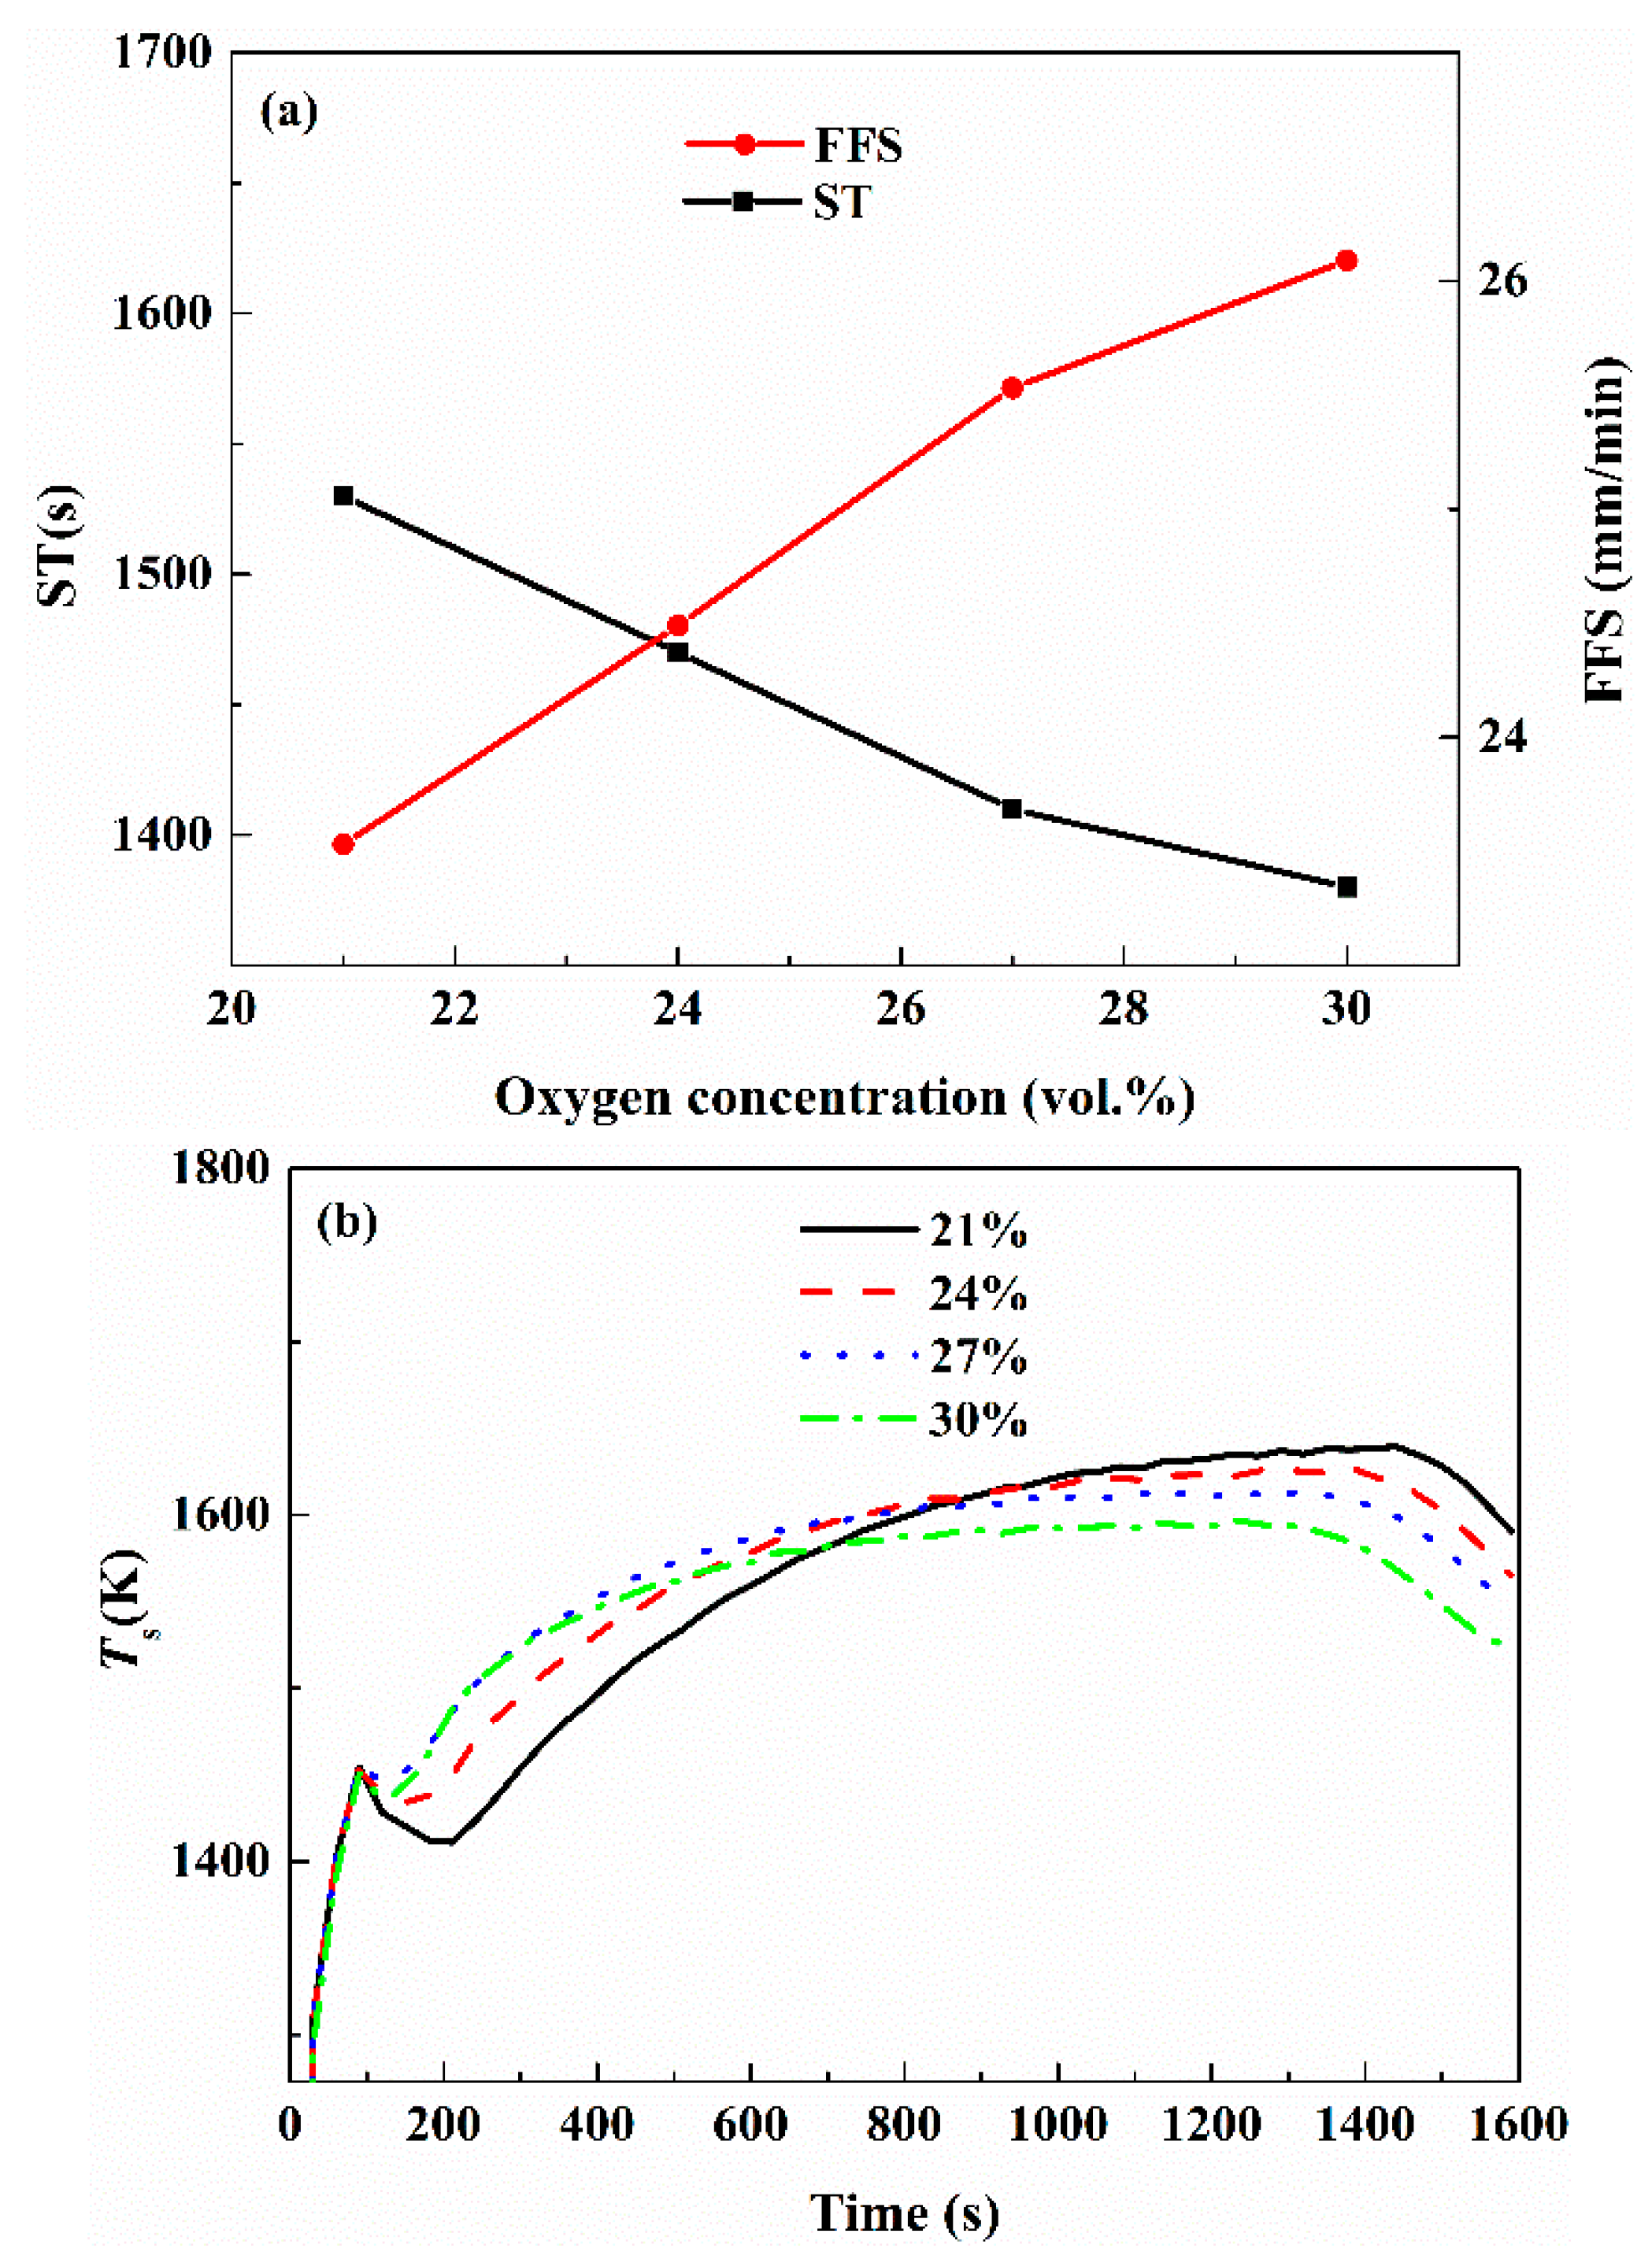
Figure 11a shows the FFS and ST values for various oxygen concentrations. With the O2 concentration increasing from 21.0% to 30.0%, the ST is reduced from 1530 s to 1380 s, and the FFS is increased from 23.53 mm/min to 26.09 mm/min. The reason for this is that the coke combustion rate of the coke particles increases and the burn-out time of the coke particles decreases with increasing oxygen concentration.
Figure 11b shows the variation in MaxT for various O2 concentrations. In the early stage of iron ore sintering, MaxT increases with increasing O2 concentration. The reason for this is that the moving of the combustion zone lags behind that of the heat wave, and the total rate of the coke combustion process depends on the moving speed of the combustion zone. With increasing O2 concentration, the moving speed of the combustion zone gets closer to that of heat wave, and the maximum temperature rises. In the later stage of sintering, with increasing O2 concentration, the MaxT of the sintering bed decreases gradually. The reason for this is that the combustion zone moves faster than the heat wave, resulting in a drop in the maximum temperature.
In Figure 12a, when the O2 concentration is increased from 21.0% to 30.0%, the NOx emission increases by 15.00% from 320 ppm to 368 ppm. The reason for this is that a higher O2 concentration can accelerate the combustion rate of the coke and increase the bed temperature. In Figure 12b, when the O2 concentration in the inlet air is increased from 21.0% to 30.0%, the O2 concentration in the flue gas increases from 9.0% to 16.0%. Increasing the O2 concentration will increase the coke combustion rate and coke consumption rate, thus increasing the conversion rate of coke-N to NOx.
4. Conclusions
(1) A transient two-dimensional mathematical model was developed to study the influence of fuel type and operation parameters on combustion and NOx emissions during the iron ore sintering process. The model was validated by comparing the model predictions with sintering pot test data. In addition to the conventional sintering process, this model is also capable of predicting properties of new processes such as flue gas recirculation, gas fuel injection, fuel layered distribution, etc.; this will be carried out in future works.
(2) Fuel NOx is the main source of NOx emission in sintering, although coke reduction of NOx accounts for about 50% of the total NOx formation, and CO reduction accounts for about 10% of the total NOx formation.
(3) The type of fuel has a great influence on NOx generation. When the solid fuel ratio was 3.8%, using only Coke A as solid fuel, the NOx emission was 320 ppm. With increasing proportion of Coke B, the NOx emission was decreased. When using Coke B instead of Coke A, the NOx emission can be reduced by 53.13%.
(4) The study of different coke particle sizes shows that the combustion rate can be accelerated by reducing the particle size. Decreasing the particle size from 1.6 mm to 1.2 mm leads the NOx emission level to be increased by 10.93% from 320 ppm to 355 ppm.
(5) A higher coke ratio in raw materials results in an increase of MaxT, implying that combustion is apparently better sustained for a higher fuel ratio in this condition, resulting in much more NOx generation. With Coke A as the only solid fuel, increasing the fuel ratio from 3.8% to 4.2% leads the NOx emissions to be increased by 9.38% from 320 to 350 ppm.
(6) O2 enrichment of induced air increases the coke combustion rate and bed temperature, as well as the NOx emission level. Increasing the oxygen concentration of inlet air from 21% to 30% leads NOx emissions to be increased by 15.00% from 320 ppm to 368 ppm.
Author Contributions
Conceptualization, W.N. and Z.Z..; Methodology, W.N. and Z.Z.; Software, W.N. and Z.Z.; Validation, W.N.; Writing, W.N.; Review & Editing, H.L., Z.Y., and Z.Z.; Supervision, Z.Z. and H.L.; Project Administration, Z.Z. and H.L.
Funding
This work was financially supported by National Key R&D Program of China (No. 2017YFB0603800 & 2017YFB0603802) and Liaoning Province Doctor Start Fund Funding Project (No. 20161002).
Conflicts of Interest
The authors declare no conflict of interest.
Nomenclature
| Assa | specific surface area, m2/m3 |
| C | inertial resistance coefficient, - |
| Ci | molar concentration, kmol/m3 |
| Cp,g, Cp,s | specific heat capacity of the gas and solid phases, J/(kg·K) |
| Di,m, Dk | effective diffusion coefficient of the ith gaseous species and diffusion coefficient of the kth gaseous species in the bulk gas, m2/s |
| dp | hydraulic diameter of particles in a material layer, m |
| Hs | carrying enthalpy of gas produced by gas–solid reaction, J/(m3·s) |
| hg-w | heat convection coefficients for the gas–wall interface, W/(m2·K) |
| hs-w | heat convection coefficients for the solid–wall interface, W/(m2·K) |
| hair | heat convection coefficients for the outside pot wall, W/(m2·K) |
| K | permeability, - |
| Ks,eff | effective thermal conductivity of solid phase, W/(m·K) |
| kg,eff | effective thermal conductivity of gas phase, W/(m·K) |
| Mi,g, Mi,s | mass of i from the homogeneous gas reactions and the gas–solid heterogeneous reaction, kg/kmol |
| P | phase pressure, Pa |
| Qs,g | heat of gas–solid heterogeneous reaction into the gas phase, J/(m3·s) |
| Qs,s | heat of gas–solid heterogeneous reaction into the solid phase, J/(m3·s) |
| Qs,ms | melting and solidification heat, J/(m3·s) |
| Qg | heat of homogeneous combustion reactions in gas phase, J/(m3·s) |
| Qconv | heat of gas–solid convection, J/(m3·s) |
| R | gas constant, J/(mol·K) |
| Ri | reaction rate of the ith species, kmol/(m3·s) |
| Ss | mass transfer between gas and solid as a result of heterogeneous gas–solid reaction, kg/(m3∙s) |
| Sg | mass transfer of homogeneous gas reaction, kg/(m3·s) |
| Si | source term of momentum equation, kg/(m2·s2) |
| Ts, Tg | solid and gas temperature, K |
| Tair | environment temperature around the sintering pot, K |
| Ui,g | superficial velocity, m/s |
| xj | spatial coordinates, m |
| Yi,g, Yi,s | mass fraction of the ith gaseous species and mass fraction of the ith solid species, - |
| ε | sintering bed porosity, - |
| μg | dynamic coefficient of viscosity, Pa·s |
| ρg, ρs | gas and solid densities, kg/m3 |
| ρb | sintering bed density, kg/m3 |
| δw | thickness of the sintering pot wall, m |
| λw | thermal conductivity of the sintering pot wall, W/(m2·K) |
References
- Kawaguchi, T.; Hara, M. Utilization of Biomass for Iron Ore Sintering. ISIJ Int. 2013, 53, 1599–1606. [Google Scholar] [CrossRef] [Green Version]
- Cheng, Z.; Wang, J.; Wei, S.; Guo, Z.; Yang, J.; Wang, Q. Optimization of gaseous fuel injection for saving energy consumption and improving imbalance of heat distribution in iron ore sintering. Appl. Energy 2017, 207, 230–242. [Google Scholar] [CrossRef]
- Yu, Z.; Fan, X.; Gan, M.; Chen, X.; Lv, W. NOx Reduction in the Iron Ore Sintering Process with Flue Gas Recirculation. JOM 2017, 69, 1570–1574. [Google Scholar] [CrossRef]
- Yanguang, C.; Zhancheng, G.; Gensheng, F. NOx reduction by coupling combustion with recycling flue gas in iron ore sintering process. Int. J. Miner. Metall. Mater. 2011, 18, 390–396. [Google Scholar]
- Cen, K.F.; Yao, Q. Advanced Combustion; Zhejiang University Press: Hangzhou, China, 2002. [Google Scholar]
- Kasai, E.; Wu, S.; Sugiyama, T.; Inaba, S.; Omori, Y. Combustion rate and NO emission during combustion of coke granules in packed beds. Tetsu Hagane 1992, 78, 1005–1012. [Google Scholar] [CrossRef]
- Zhou, H.; Cheng, M.; Zhou, M.; Liu, Z.; Liu, R.; Cen, K. Influence of sintering parameters of different sintering layers on NOx emission in iron ore sintering process. Appl. Therm. Eng. 2016, 94, 786–798. [Google Scholar] [CrossRef]
- Mo, C.-L.; Teo, C.-S.; Hamilton, I.; Morrison, J. Admixing Hydrocarbons in Raw Mix to Reduce NOx Emission in Iron Ore Sintering Process. ISIJ Int. 1997, 37, 350–357. [Google Scholar] [CrossRef]
- Pan, J. Theoretical and Process Studies of the Abatement of Flue Gas Emissions during Iron Ore Sintering; Central South University of Technology: Changsha, China, 2007. [Google Scholar]
- Zhou, H.; Liu, Z.; Cheng, M.; Zhou, M.; Liu, R. Influence of Coke Combustion on NOx Emission during Iron Ore Sintering. Energy Fuels 2015, 29, 974–984. [Google Scholar] [CrossRef]
- Zhou, H.; Zhou, M.; Liu, Z.; Cheng, M.; Chen, J. Modeling NOx emission of coke combustion in iron ore sintering process and its experimental validation. Fuel 2016, 179, 322–331. [Google Scholar] [CrossRef]
- Zhou, H.; Zhao, J.P.; Loo, C.E.; Ellis, B.G.; Cen, K.F. Numerical Modeling of the Iron Ore Sintering Process. ISIJ Int. 2012, 52, 1550–1558. [Google Scholar] [CrossRef] [Green Version]
- Yang, W.; Ryu, C.; Choi, S.; Choi, E.; Lee, D.; Huh, W. Modeling of Combustion and Heat Transfer in an Iron Ore Sintering Bed with Considerations of Multiple Solid Phases. ISIJ Int. 2004, 44, 492–499. [Google Scholar] [CrossRef] [Green Version]
- De Castro, J.A.; Nogami, H.; Yagi, J.-I. Three-dimensional Multiphase Mathematical Modeling of the Blast Furnace Based on the Multifluid Model. ISIJ Int. 2002, 42, 44–52. [Google Scholar] [CrossRef]
- Zhang, B.; Zhou, J.; Li, M. Prediction of sinter yield and strength in iron ore sintering process by numerical simulation. Appl. Therm. Eng. 2018, 131, 70–79. [Google Scholar] [CrossRef]
- Young, R.W. Dynamic mathematical model of sintering process. Ironmak. Steelmak. 1977, 6, 321–328. [Google Scholar]
- Pahlevaninezhad, M.; Davazdah Emami, M.; Panjepour, M. The effects of kinetic parameters on combustion characteristics in a sintering bed. Energy 2014, 73, 160–176. [Google Scholar] [CrossRef]
- Hashimoto, N.; Watanabe, H.; Kurose, R.; Shirai, H. Effect of different fuel NO models on the prediction of NO formation/reduction characteristics in a pulverized coal combustion field. Energy 2017, 118, 47–59. [Google Scholar] [CrossRef]
- Oyama, N.; Iwami, Y.; Yamamoto, T.; Machida, S.; Higuchi, T.; Sato, H.; Sato, M.; Takeda, K.; Watanabe, Y.; Shimizu, M.; et al. Development of Secondary-fuel Injection Technology for Energy Reduction in the Iron Ore Sintering Process. ISIJ Int. 2011, 51, 913–921. [Google Scholar] [CrossRef] [Green Version]
- Zhang, Y.P.; Zhang, J.L.; Zhang, C.; Wang, Y.Z.; Liu, Z.J.; Wang, G.W.; Ma, F.T.; Zhao, Z.X. Modelling and visual verification of combustion zone transfer in ultra-thick bed sintering process. Ironmak. Steelmak. 2016, 44, 304–310. [Google Scholar] [CrossRef]
- Nath, N.K.; Mitra, K. Mathematical Modeling and Optimization of Two-Layer Sintering Process for Sinter Quality and Fuel Efficiency Using Genetic Algorithm. Mater. Manuf. Process. 2005, 20, 335–349. [Google Scholar] [CrossRef]
- Ohno, K.I.; Noda, K.; Nishioka, K.; Maeda, T.; Shimizu, M. Effect of Coke Combustion Rate Equation on Numerical Simulation of Temperature Distribution in Iron Ore Sintering Process. ISIJ Int. 2013, 53, 1642–1647. [Google Scholar] [CrossRef] [Green Version]
- Muchi, I. Theoretical Analysis on the Operation of Sintering. Tetsu Hagane 1970, 56, 371–381. [Google Scholar] [CrossRef]
- Zhang, J.; Guo, X.-M. Model of iron ore sintering based on melt and mineral formation. J. Iron Steel Res. Int. 2015, 22, 288–296. [Google Scholar] [CrossRef]
- Junichiro, Y. Blast Furnace Phenomena and Modelling; Elsevier Applied Science Publishers LTD: London, UK; New York, NY, USA, 1982. [Google Scholar]
- Lockwood, F.C.; Romo-Millares, C.A. Mathematical modelling of fuel-NO emissions from PF burners. J. Inst. Energy 1992, 65, 144–152. [Google Scholar]
- Nelson, P.F.; Nancarrow, P.C.; Bus, J.; Prokopiuk, A. Fractional conversion of char N to no in an entrained flow reactor. Proc. Combust. Inst. 2002, 29, 2267–2274. [Google Scholar] [CrossRef]
- Song, Y.H.; Beér, J.M.; Sarofim, A.F. Reduction of Nitric Oxide by Coal Char at Temperatures of 1250–1750 K. Combust. Sci. Technol. 1981, 25, 237–240. [Google Scholar] [CrossRef]
- Levy, J.M.; Chan, L.K.; Sarofim, A.F.; Beér, J.M. NO/Char Reactions at Pulverized Coal Flame Conditions. Symp. (Int.) Combust. 1981, 18, 111–120. [Google Scholar] [CrossRef]
- Garijo, E.G.A.; Jensen, A.D.; Glarborg, P. Kinetic study of NO reduction over Biomass char under dynamic conditions. Energy Fuels 2003, 17, 1429–1436. [Google Scholar] [CrossRef]
- Chan, L.K.; Sarofim, A.F.; Beér, J.M. Kinetics of the NO-carbon reaction at fluidized bed combustor conditions. Combust. Flame 1983, 52, 37–45. [Google Scholar] [CrossRef]
- De Soete, G.G.; Croiset, E.; Richard, J.R. Heterogeneous formation of nitrous oxide from char-bound nitrogen. Combust. Flame 1999, 117, 140–154. [Google Scholar] [CrossRef]
- Schönenbeck, C.; Gadiou, R.; Schwartz, D. A kinetic study of the high temperature NO–char reaction. Fuel 2004, 83, 443–450. [Google Scholar] [CrossRef]
- Mitra, N.K.; Mitra, K. Optimisation of suction pressure for iron ore sintering by genetic algorithm. Ironmak. Steelmak. 2004, 31, 199–206. [Google Scholar]
- Wang, G.; Wen, Z.; Lou, G.; Dou, R.; Li, X.; Liu, X.; Su, F. Mathematical modeling and combustion characteristic evaluation of a flue gas recirculation iron ore sintering process. Int. J. Heat Mass Transf. 2016, 97, 964–974. [Google Scholar] [CrossRef]
- Zhao, J.P.; Loo, C.E.; Dukino, R.D. Modelling fuel combustion in iron ore sintering. Combust. Flame 2015, 162, 1019–1034. [Google Scholar] [CrossRef]
- Pahlevaninezhad, M.; Emami, M.D.; Panjepour, M. Identifying major zones of an iron ore sintering bed. Appl. Math. Model. 2016, 40, 8475–8492. [Google Scholar] [CrossRef]
- Ramos, M.V.; Kasai, E.; Kano, J.; Nakamura, T. Numerical Simulation Model of the Iron Ore Sintering Process Directly Describing the Agglomeration Phenomenon of Granules in the Packed Bed. ISIJ Int. 2000, 40, 448–454. [Google Scholar] [CrossRef]
- Zhao, J.; Loo, C.E.; Zhou, H.; Yuan, J.; Li, X.; Zhu, Y.; Yang, G. Modelling and analysis of the combustion behaviour of granulated fuel particles in iron ore sintering. Combust. Flame 2018, 189, 257–274. [Google Scholar] [CrossRef]
- Wang, G.; Wen, Z.; Lou, G.; Dou, R.; Li, X.; Liu, X.; Su, F. Mathematical modeling of and parametric studies on flue gas recirculation iron ore sintering. Appl. Therm. Eng. 2016, 102, 648–660. [Google Scholar] [CrossRef]
- Yang, W.; Choi, S.; Choi, E.S.; Ri, D.W.; Kim, S. Combustion characteristics in an iron ore sintering bed-evaluation of fuel substitution. Combust. Flame 2006, 145, 447–463. [Google Scholar] [CrossRef]
- Morioka, K.; Inaba, S.; Shimizu, M.; Ano, K.; Sugiyama, T. Primary Application of the “In-Bed-deNOx” Process Using Ca-Fe Oxides in Iron Ore Sintering Machines. ISIJ Int. 2000, 40, 280–285. [Google Scholar] [CrossRef]
Figure 1.
Iron ore sintering process.

Figure 2.
Comparison between the measured data and simulation results of 3.8% coke: (a) Temperature profiles of solid material; (b) combustion gas compositions.
Figure 2.
Comparison between the measured data and simulation results of 3.8% coke: (a) Temperature profiles of solid material; (b) combustion gas compositions.

Figure 3.
The NO formation/reduction rate on the central axis of the sintering bed (base case).
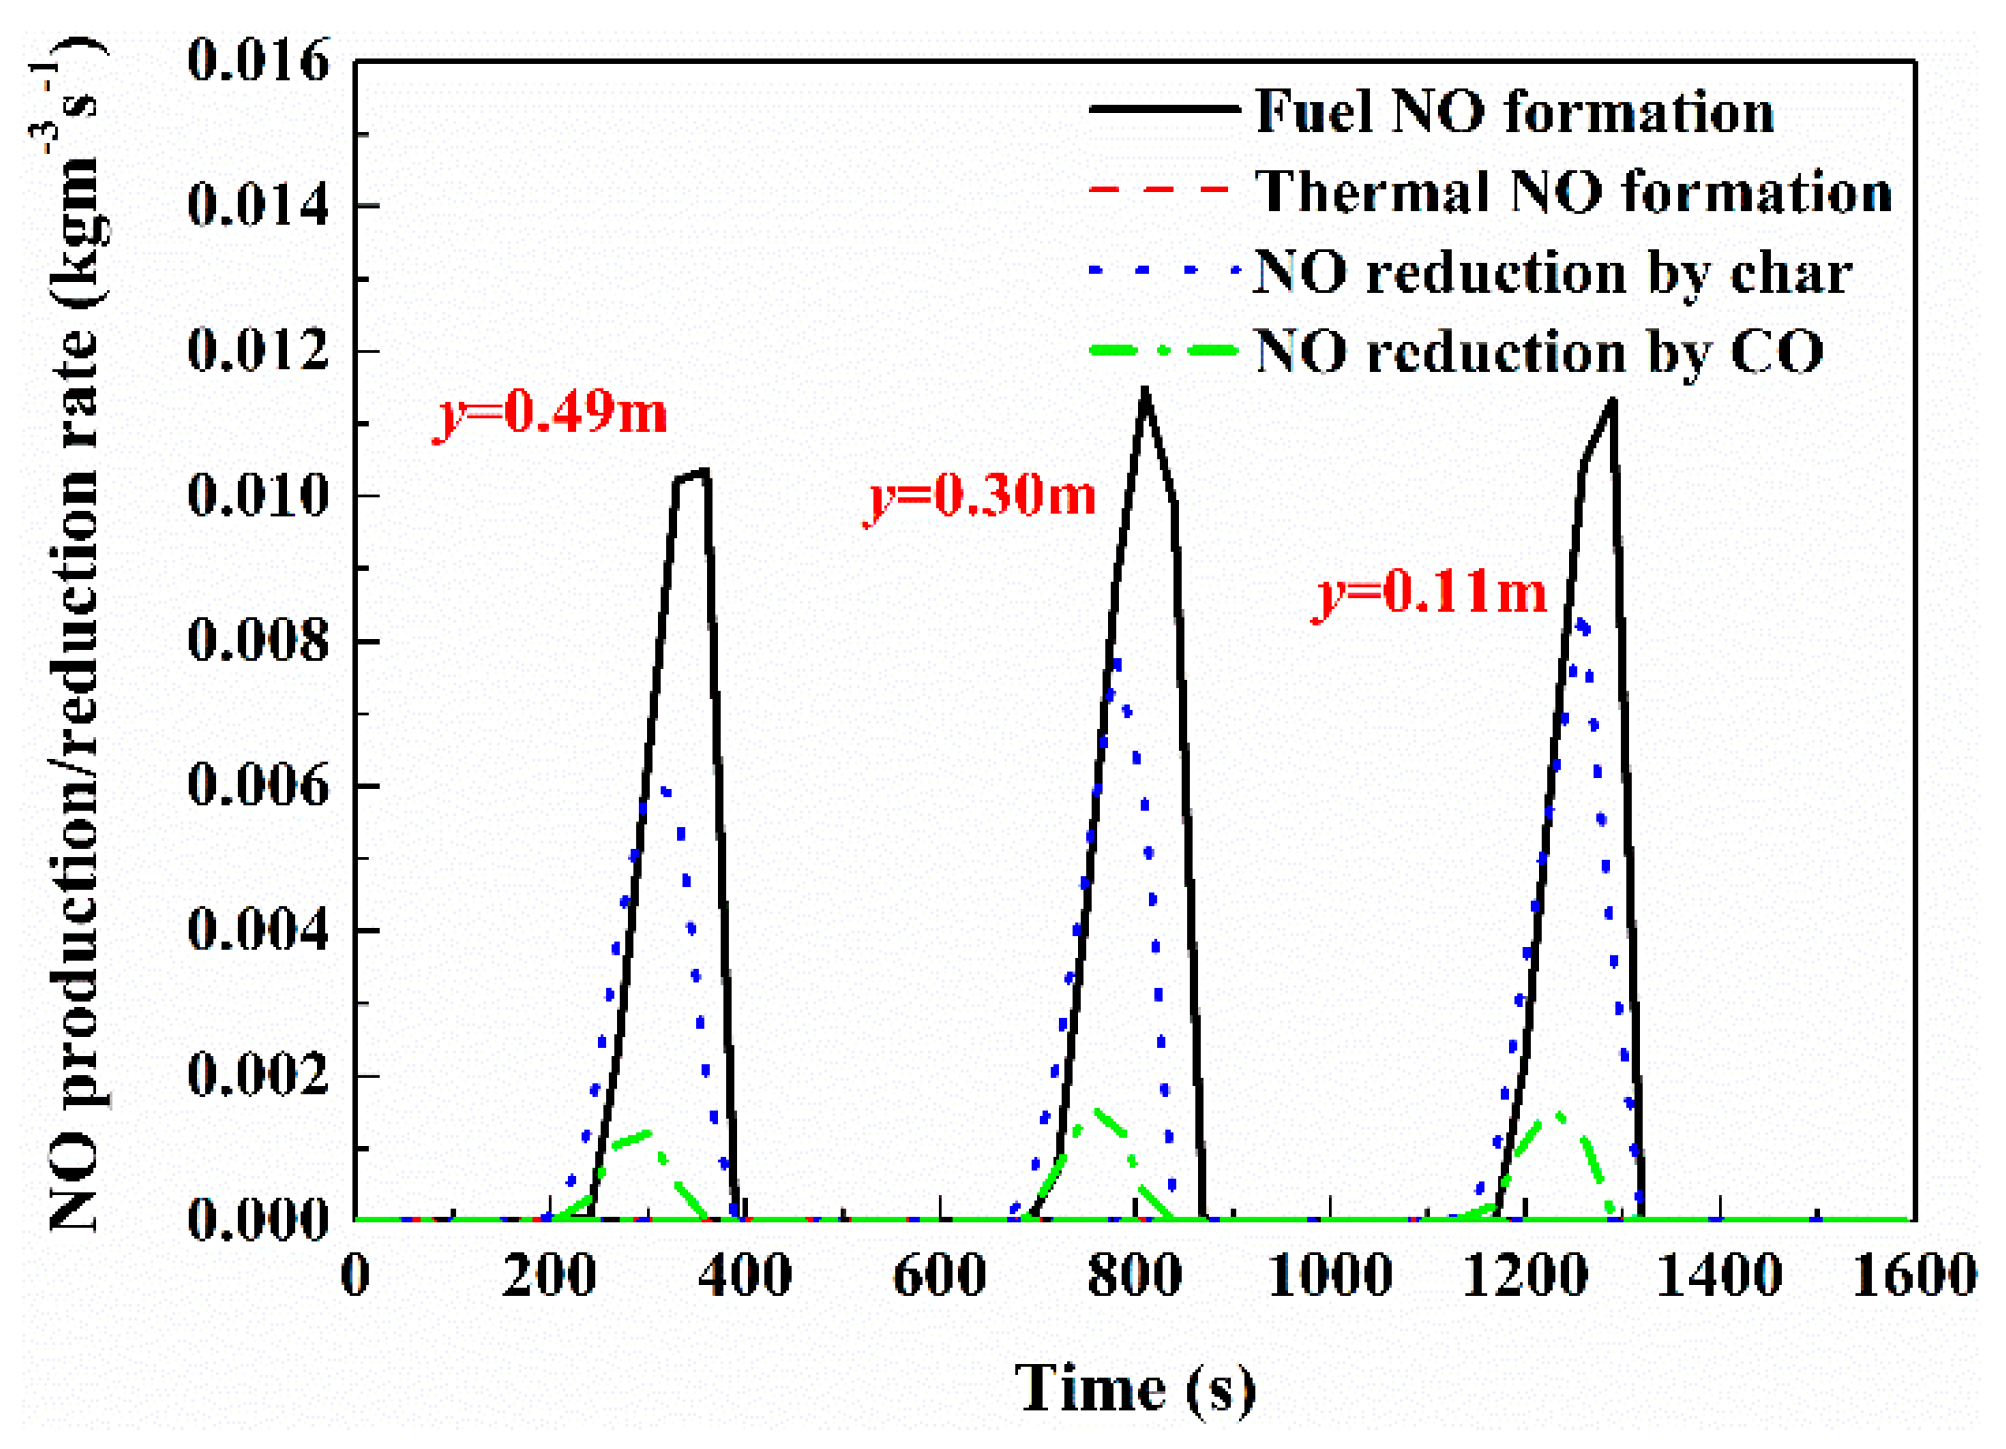
Figure 4.
Quantification of NO formation and reduction for overall NO emission (base case).

Figure 5.
FFS and Sintering Time (ST) (a) and MaxT (b) with different fuel types.

Figure 6.
NOx emissions (a) and O2 content in flue gas (b) with different fuel types.
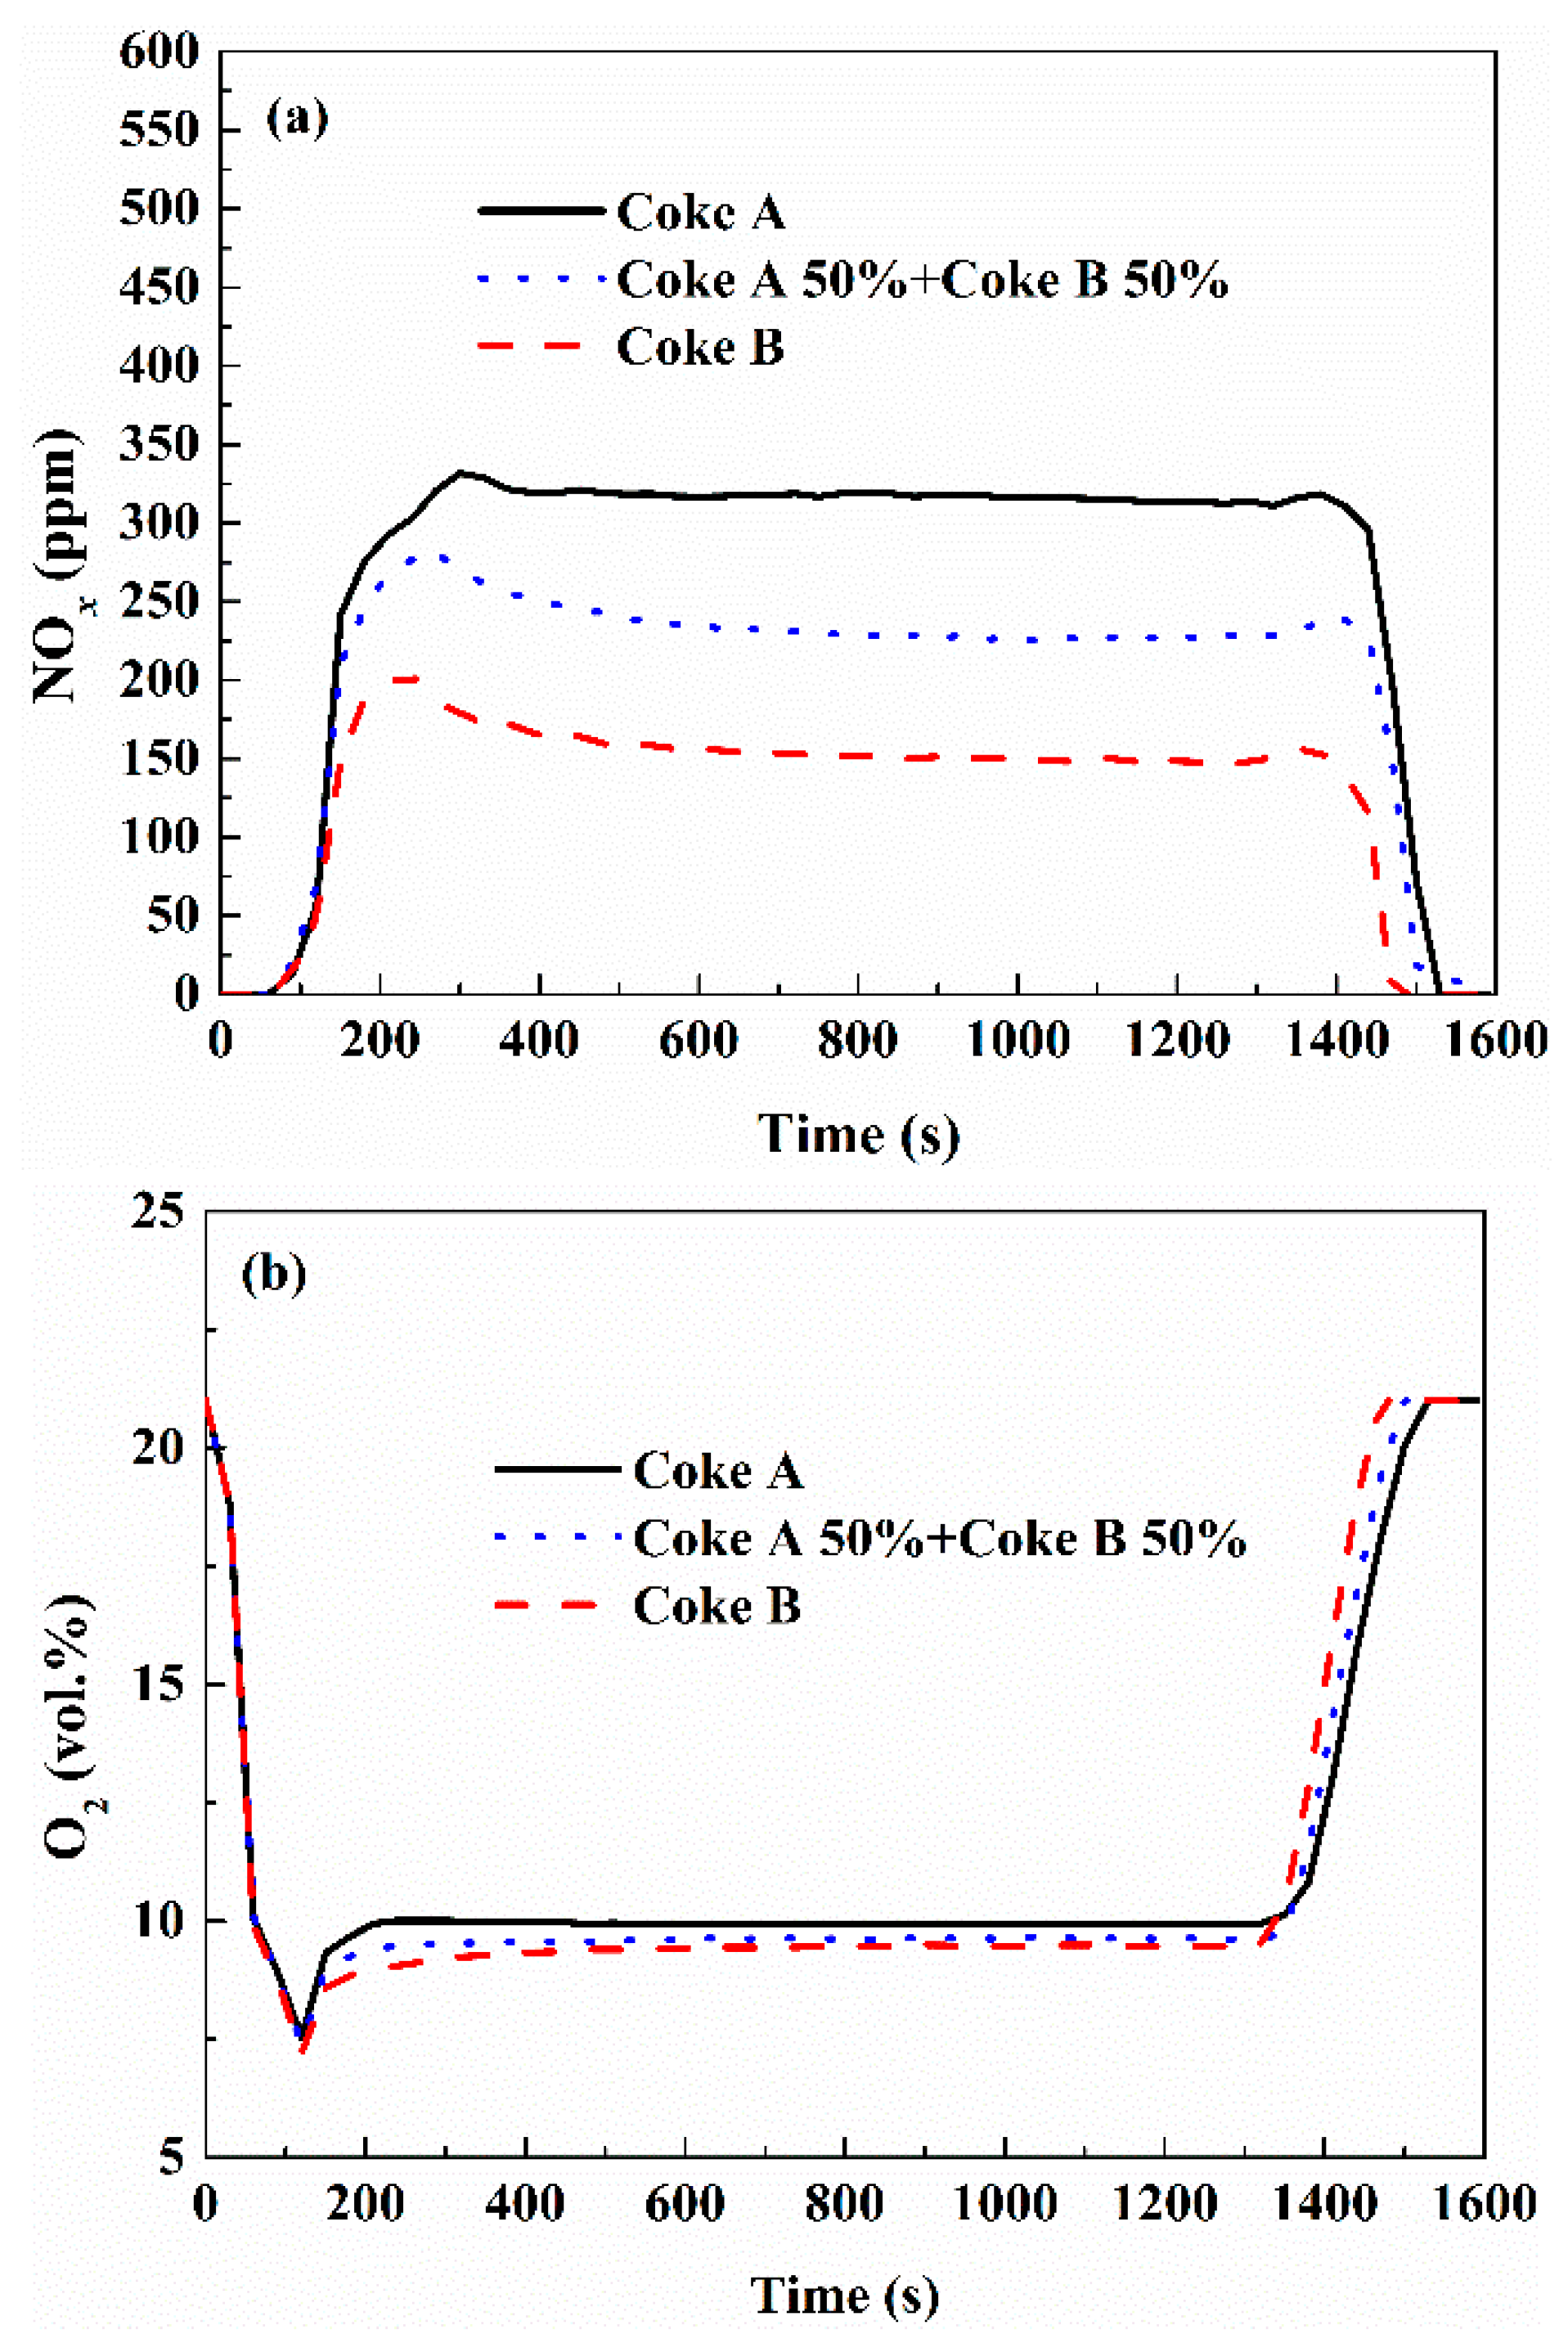
Figure 7.
FFS and ST (a) and MaxT (b) with different coke particle sizes.

Figure 8.
NO emissions (a) and O2 content (b) of flue gas with different coke particle sizes.
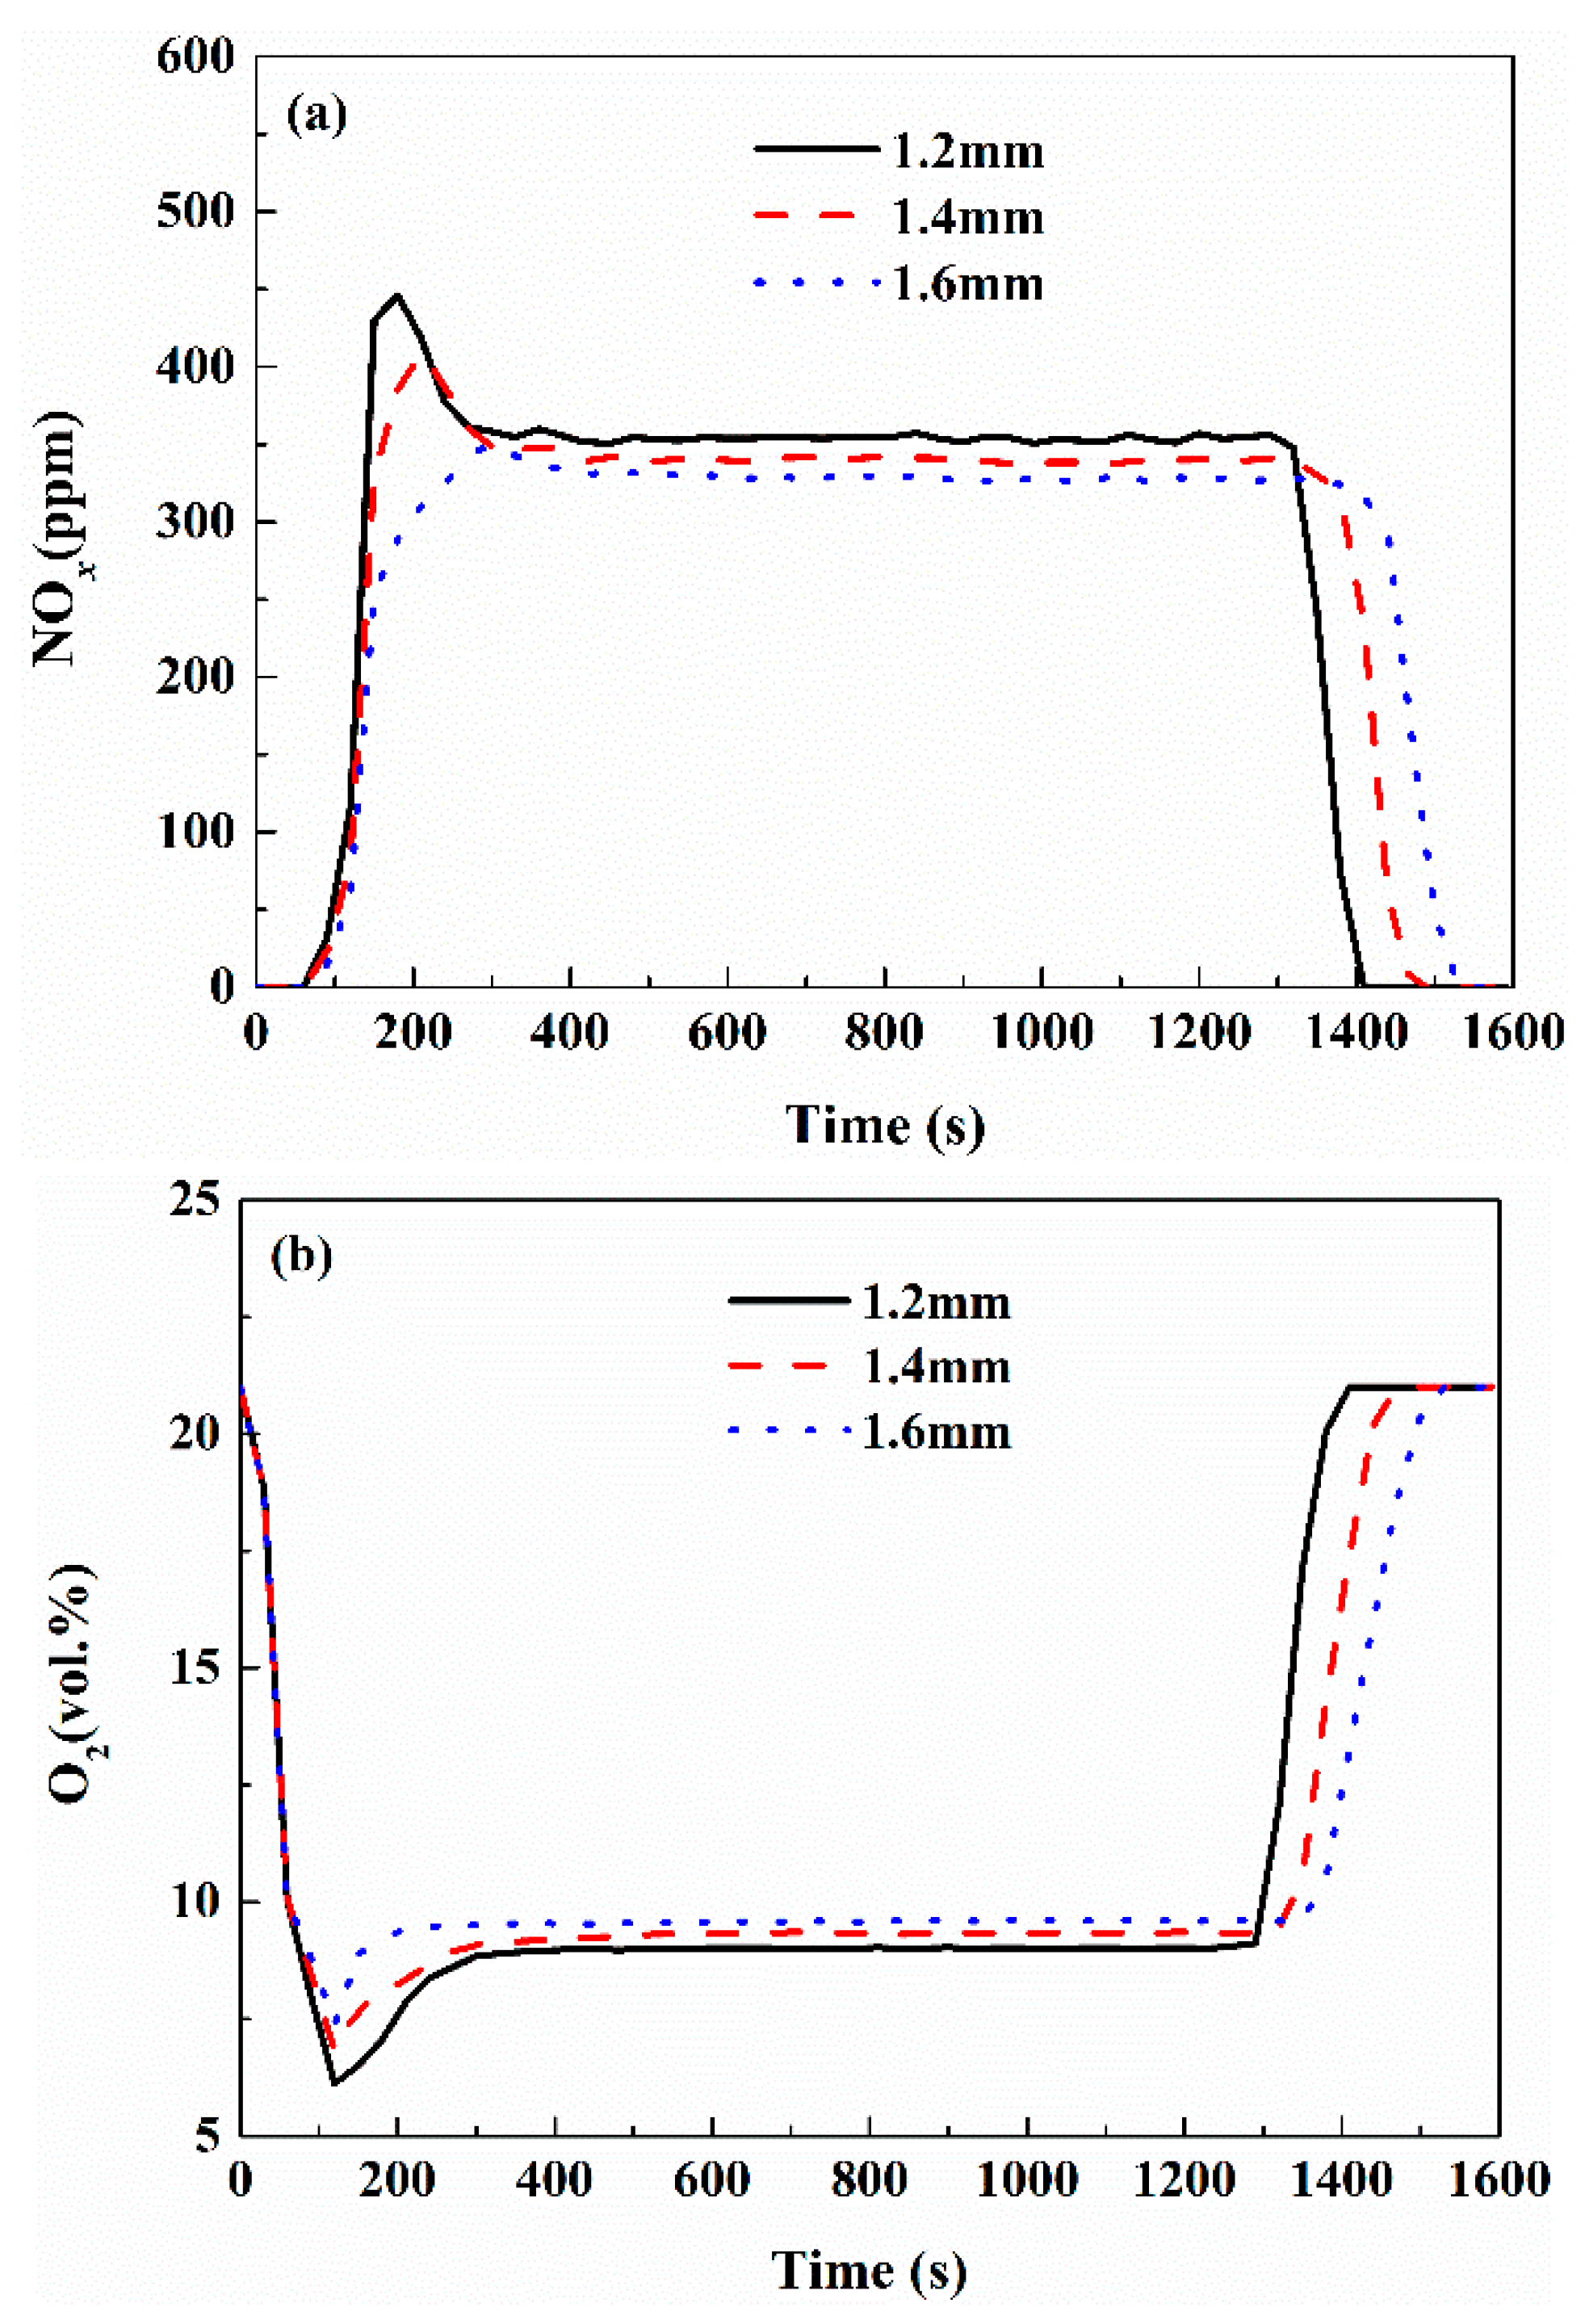
Figure 9.
FFS and ST (a) and MaxT (b) with different coke ratios.

Figure 10.
NO emissions (a) and O2 contents (b) of flue gas with different coke ratios.
Figure 11.
FFS and ST (a) and MaxT (b) with different oxygen concentrations.
Figure 12.
NOx emissions (a) and flue gas O2 content (b) with different oxygen concentrations of air.
Figure 12.
NOx emissions (a) and flue gas O2 content (b) with different oxygen concentrations of air.

Table 1.
Summary of mathematical models used in the present simulation.
| Physio-Chemical Phenomena | Source of Mathematical Model |
|---|---|
| Convection heat transfer | Zhou Hao [12] |
| Conduction and radiation | Zhou Hao [12] |
| Melting and solidification | Young [16] |
| Geometric changes | Wang Gan [35] |
| Limestone calcination | Zhao Jiapei [36] |
| Reduction and oxidation of iron oxides | Pahlevaninezhad [37] |
| Water evaporation | Maximiano [38] |
Table 2.
Empirical formulae of thermo-physical parameters.
| Parameters | Gas Phase | Solid Phase |
|---|---|---|
| Heat capacities | ||
| Density | ||
| Diffusion coefficient | ||
| Viscosity | ||
| Thermal conductivity |
Table 3.
Boundary and initial conditions.
| Parameters | Value | Parameters | Value |
|---|---|---|---|
| Ignition time (s) | 90 | Iron ore (%) | 83.2 |
| Gas inlet velocity during ignition (m/s) | 4 | Limestone (%) | 13.0 |
| Gas inlet velocity after ignition (m/s) | 0.43 | Coke (%) | 3.8 |
| Negative pressure during ignition (Pa) | −10,000 | Moisture (%) | 7.0 |
| Negative pressure after ignition (Pa) | −15,000 | Coke diameters (m) | 0.0016 |
| Initial temperature of solid (K) | 300 | Dolomite diameters (m) | 0.0016 |
| Initial temperature of gas (K) | 300 | Limestone diameters (m) | 0.0016 |
| Ignition temperature (K) | 1400 | Iron ore diameters (m) | 0.0032 |
| Initial porosity of the bed | 0.4 | Average diameter of particles (m) | 0.0032 |
Table 4.
Operational parameters for simulated scenarios.
| Case | Coke A (%mass) | Coke B (%mass) | Grain Diameter (m) | Oxygen Concentration (vol %) |
|---|---|---|---|---|
| Base case | 3.8 | 0 | 0.0016 | 21.0 |
| Case 0 | 1.9 | 1.9 | 0.0016 | 21.0 |
| Case 1 | 0 | 3.8 | 0.0016 | 21.0 |
| Case 2 | 3.8 | 0 | 0.0014 | 21.0 |
| Case 3 | 3.8 | 0 | 0.0012 | 21.0 |
| Case 4 | 4.0 | 0 | 0.0016 | 21.0 |
| Case 5 | 4.2 | 0 | 0.0016 | 21.0 |
| Case 6 | 3.8 | 0 | 0.0016 | 24.0 |
| Case 7 | 3.8 | 0 | 0.0016 | 27.0 |
| Case 8 | 3.8 | 0 | 0.0016 | 30.0 |
Table 5.
Comparison between the simulated and measured results.
| Typical Parameter | MaxT (K) y = 0.49 m | MaxT (K) y = 0.30 m | MaxT (K) y = 0.11 m | FFS (mm/min) |
|---|---|---|---|---|
| Simulated | 1457.58 | 1603.09 | 1632.04 | 23.50 |
| Measured | 1437.44 | 1558.37 | 1628.90 | 23.53 |
| Error (%) | 1.40 | 2.87 | 0.192 | 0.127 |
Table 6.
Element and proximate analysis of coke.
| Elemental Analysis (%) | Proximate Analysis (%, Dry Base) | ||||||||
|---|---|---|---|---|---|---|---|---|---|
| C | H | O | N | S | Volatile | Fixed Carbon | Ash | Heating Value (kJ/kg) | |
| Coke A | 86.04 | 1.34 | 10.85 | 1.55 | 0.21 | 2.99 | 81.69 | 15.32 | 25,993.72 |
| Coke B | 87.86 | 0.63 | 9.42 | 0.56 | 0.54 | 2.26 | 83.75 | 13.99 | 26,345.75 |
© 2019 by the authors. Licensee MDPI, Basel, Switzerland. This article is an open access article distributed under the terms and conditions of the Creative Commons Attribution (CC BY) license (http://creativecommons.org/licenses/by/4.0/).
Share and Cite
MDPI and ACS Style
Ni, W.; Li, H.; Zhang, Y.; Zou, Z. Effects of Fuel Type and Operation Parameters on Combustion and NOx Emission of the Iron Ore Sintering Process. Energies 2019, 12, 213. https://doi.org/10.3390/en12020213
AMA Style
Ni W, Li H, Zhang Y, Zou Z. Effects of Fuel Type and Operation Parameters on Combustion and NOx Emission of the Iron Ore Sintering Process. Energies. 2019; 12(2):213. https://doi.org/10.3390/en12020213
Chicago/Turabian StyleNi, Wenjie, Haifeng Li, Yingyi Zhang, and Zongshu Zou. 2019. "Effects of Fuel Type and Operation Parameters on Combustion and NOx Emission of the Iron Ore Sintering Process" Energies 12, no. 2: 213. https://doi.org/10.3390/en12020213
Note that from the first issue of 2016, this journal uses article numbers instead of page numbers. See further details here.