Design of Power Supply Package for Electricity Sales Companies Considering User Side Energy Storage Configuration


1
Electrical Engineering Department, North China Electric Power University, PO Box 17, 619 Yonghuabei Street, Baoding 071003, China
2
Technical and Economic Consultation Center for Electric Power Construction in China Electricity Council, Beijing 100032, China
*
Author to whom correspondence should be addressed.
Energies 2019, 12(17), 3219; https://doi.org/10.3390/en12173219
Submission received: 3 July 2019
/
Revised: 18 August 2019
/
Accepted: 18 August 2019
/
Published: 21 August 2019
(This article belongs to the Special Issue Energy Markets and Economics Ⅱ)
Abstract
:With the deepening of the reform of the power system, electricity sales companies are required to explore new business models and provide multi-faceted marketing programs for users. At the same time, with the reduction of energy storage (ES) costs and the gradual maturity of technology, user side ES, especially Battery ES, has become an effective means for enhancing users’ power supply reliability and reducing electricity bills. Battery ES, as the standby power supply, has a vast user side application. The configuration of ES can help users to ameliorate power quality and reduce electricity cost. It is a critical strategy for electricity sales companies to improve their competitiveness as well. Firstly, this paper analyzes the user side ES and introduces the user side ES development status and relevant policies. Then, we establish an ES configuration optimization model based on the cost–benefit system. To determine the optimal ES capacity of the system’s storage capacity, non-dominated sorting genetic algorithm with elite strategy (NSGA-II) is used as the method solving model. Finally, according to the cost-effectiveness of ES and the period of a contract signed by users, a price package with ES configuration is designed for users to choose.
1. Introduction
In March 2015, the State Council of CPC(the Communist Party of China) Central Committee adopted the Several Opinions on Further Deepening the Reform of China Electric Power System (Zhongfa (2015) Document #9) [1] to further enhance operational efficiency and break up monopoly in the power market. The central document signified the launch of new electricity market reforms in China. By the end of 2017, China’s power trading institutions were finished, and the market competition mechanism in the power-selling market was initially formed [2,3]. In September 2018, domestic electricity market in Guangdong Province, China began the first test run.
As the principal part of the electricity retail market, the electricity sales company purchases electricity and sells it to the end-users for profit. After the announcement of the new power reform plan, a large number of electricity sales companies flooded into the power market, the market competition of electricity sales increased. Due to the fact that power users can choose and replace power suppliers, electricity sales companies must explore new business models to foster customers’ loyalty and satisfaction. In addition to price concessions, diversified value-added services have become a major tool for electricity sales companies [4]. Value-added services can take many forms and will have broader prospects for development [5].
Energy storage (ES) is such a productive technology for space-time distribution of electric energy that is developing rapidly. Since its small size, fast response speed and low terrain requirements, electrochemical ES is widely used in the user side ES system [6]. Applications of electrochemical ES have many categories, like lithium batteries, sodium-sulfur batteries and liquid sulfur batteries. It is commercially viable thanks to its excellent performance [7]. In the last couple of years, ES materials technology has also made breakthroughs. Brian Huskinson of Harvard University has developed a non-metallic liquid-flow battery based on benzoquinone [8]. The cost is as low as 27 US dollars/(kWh), almost one-third of that of vanadium batteries, which shows economic promise. John Goodenough, a professor at the University of Texas in Austin, and his team of engineers have developed a new type of lithium-ion battery [9]. The Lithium-glass battery, which not only triples the energy density of lithium ions, but also recharges quickly in a few minutes, with a rechargeable cycle of more than several thousand times. In addition to breakthroughs in ES materials technology, ES control technology has also made promising progress. In [10], the authors designed a novel control strategy for a hybrid energy storage system (HESS). This strategy balanced power surges with the cooperation of batteries and supercapacitors, which overcame the slow response of battery system. In [11], an energy-based (EB) control method to control the converter of a battery ES system was proposed. The case simulation results demonstrate that the method has better tracking and anti-disturbance performance compared with the classic PI (Proportional-Integral) method.
On the scale of ES applications, China’s electrochemical ES maintained a strong momentum of development [12]. At the 9th China International ES Conference, the ES Application Branch released the ES Industry Application Research Report in 2019. It shows that, by the end of 2018, the cumulative installed power of electrochemical ES in China increased by 146% from a year ago to 1033.7 MW, and the cumulative installed capacity, increased by 127% from a year ago to 3103 MWh. In addition, the installed capacity of user side ES was up to 1583.0 MWh, accounting for 51.0% of the total installed capacity. According to the statistics of the China ES Network (ESCN), there were 103 new electrochemical ES projects within 2018. The user side ES project of Jiangsu Taojing Co., Ltd. was designed with a scale of 0.75 MW/6 MWh. It covers approximately 120 square meters, adopted centralized container construction, which possesses ES capacity of about 219,000 kWh annually. The Conghua Wanli Tire ES Project (lead-carbon battery 6 MW/36 MWh), built by Guangzhou Power Supply Bureau, covers approximately 120 square meters with a maximum power of 6 MW. It can provide 36 MWh of reserve power with a millisecond response and saves nearly one million in electricity costs per year for Wanli tires. Due to the maturity of ES technology and the reduction of cost, user side ES will be applied.
Given that literature [13] introduces the battery selection criteria for ES power stations, this paper in view of the user side, deals with user side ES and makes up for that literature about battery selection. According to the statistics of ES projects, the commonly used ES batteries are divided into lead-acid batteries, ternary lithium batteries, lithium iron phosphate batteries, etc. Literature [14] has pointed out that the lead-acid battery has a problem of low energy density, and [15] quantified the problem of poor thermal stability of ternary lithium batteries. In contrast, lithium iron phosphate batteries are suitable for ES on the user side due to their safety and environmental protection [16]. ES has multiple business operational modes. Literature [17] compared the cost–benefit of user side ES and several other ES business operations models. In this paper, the sales company acts as the investor of the user side ES to cut costs. The sales companies sign the electricity contract with the user, considering the ES configuration to set the electricity price.
The main contributions of this paper can be summarized as follows.
- (1)
- Incorporating ES configuration, this paper proposes a novel business model as a value-added service into retail electricity contracts. All that mattered is that power customers and electricity sales companies can be benefit from the innovative business model. For customers, the business model helps them to improve power supply reliability while reducing electricity bills. For electricity sales companies, the business model helps them to cultivate customer loyalty to enhance their competitiveness in the retail market. In addition, the model reduces the power supply costs of electricity sales companies by load shifting.
- (2)
- This paper creates a charging model of ES surcharge. The electricity sales companies add the ES cost to the electricity bill by additional electricity charges. Not only does it reduce the pressure of the user’s initial investment, but it can also promote signing long-term power purchase contracts with each other.
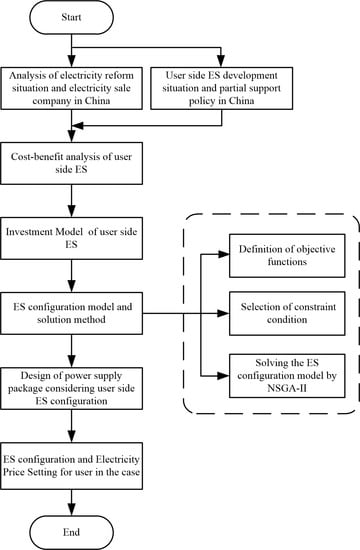
The remainder of the paper is organized as follows: in the introduction, this paper mainly analyses the general situation and introduces the development status of user side ES. Section 2 adds supporting policies in China. Then Section 3 analyzes the cost–benefit and investment mode of the ES system. In Section 4, we establish an optimal allocation model of ES capacity, which balances the interests between users and electricity sales companies. Then, a solution process for the model was given based on the non-dominated sorting genetic algorithm with elite strategy (NSGA-II) to search for the optimal ES capacity for the user side. Finally, according to the duration of the electricity sales contract, we design a power supply with energy storage configuration package for users to choose.
2. Development of User Side ES in China
According to the mode of ES, it can be divided into three types: mechanical, electromagnetic and electrochemical [18,19]. Mechanical ES includes pumped storage, compressed air storage and flywheel storage; Electromagnetic ES includes superconducting, supercapacitor and high energy density capacitor; Electrochemical ES includes battery ES such as lead-acid, nickel-hydrogen, nickel-cadmium, lithium-ion, sodium-sulfur and liquid flow.
The ES on the user side mainly refers to the ES system that can be stored, converted and released in the vicinity of the users [20]. Taking the user’s requirements for the ES system’s floor space, response time and investment cost into account, electrochemical ES is the dominant form of ES on the user side.
As an essential part of ES technology, electrochemical ES is widely used due to its high energy density, short response period and long life [21]. According to the incomplete statistics of the national ES project library, the installed capacity of China’s newly-invested electrochemical ES projects in 2018 was about 650 MW. By the end of December 2018, the cumulative installed capacity of China’s electrochemical ES project was 1039.8 MW [22].
In recent years, the government has launched many national energy policies, because of these ES will be one of the critical areas of research and development. These policies encourage the development of user side ES and provide distinct application paths [23] in China. Some policies for the development of ES on the user side in China are shown in Table 1.
User side ES has a rapid development with technical support and policy encouragement, but some users may be deterred from ES, as the early involvement is too high. If electricity sales companies consider the enormous economic potential of user side investment and the need to enhance their competitiveness, they can form a new mode of ES for user side investment by cooperating with the power users.
3. ES System Cost–Benefit Analysis
3.1. ES Investment Cost Analysis
The annual cost of ES system C mainly includes the cost of the ES battery CB and the cost of the ES converter CT and the cost of system’s operation and maintenance CM, as shown in Equation (1).
The calculation equations of CB and CT are as follows.
where QB is the capacity of ES, IB is the unit cost of an ES battery, PT is the power of ES converter, IT is the unit cost of ES converter, r is the discount rate and N is the system service life.
3.2. Benefits of ES
Electricity sales companies design and invest in user side ES, which can reduce the user’s electricity charge and the capacity charge, guarantee the reliability of power supply and reduce the economic loss caused by power outage [27,28,29]. The main benefits of user side ES are as follows.
(1) Reduce users electricity expenditure
An ES system can discharge during a peak period of electricity price, and charge from the power grid during a low period of electricity price. This can reduce the electricity expenditure of users. This part of annual revenue B1 is the main revenue of user side ES. It can be expressed as follows:
where Q(t)+ and Q(t)− are the charging capacity and discharging capacity of the ES system during the period t, ρt is the real-time electricity price in the t period and n is the annual number of days of ES.
For large and medium-sized industrial users with special distribution transformer power supply, they also need to pay a certain amount of electricity according the peak load. After installing the ES system, users can reduce the peak load, thereby reduce the monthly capacity charges. This part of annual earnings B2 can be expressed as follows:
where PT is the power of an ES system and ρm is the unit capacity price that users need to pay monthly.
(2) Improve user power supply reliability
According to the research in the literature [30], the interruption of power supply in the power grid will bring huge losses to users, and the application of standby power supply can save losses to a certain extent. Distributing a certain capacity in the ES system as a standby power supply for users can ensure continuous power of important loads when there is a power outage. This can improve the reliability of service in total (RS-1) for important loads of industrial users and avoid further expansion of power outage accident losses.
(3) Ameliorate load curve of users
For electricity sales companies, there is no essential difference between selling more electricity and reducing electricity costs to profit. The electricity sales companies will increase the purchase cost if the peak–valley difference of user load is enormous. Investing in user side storage can ameliorate the curve of user load, thereby reducing the electricity purchasing cost of electricity sales companies.
For users, the direct economic benefit of additional storage is B = B1 + B2. That means two methods can reduce the electricity charges, by paying through peak and valley price arbitrage, another trick is by reducing capacity electricity charges.
3.3. Analysis of Investment Mode of ES
Considering the high one-time cost of ES, it is difficult for power users to invest ES independently. The company doing the purchase and sale of electricity has the capital and technical strength to invest in user side ES professionally. To reduce the pressure of investing in ES, we adopt the contract energy management mode [31] as the ES investment method. This can also enhance the loyalty of customers to the electricity sales company.
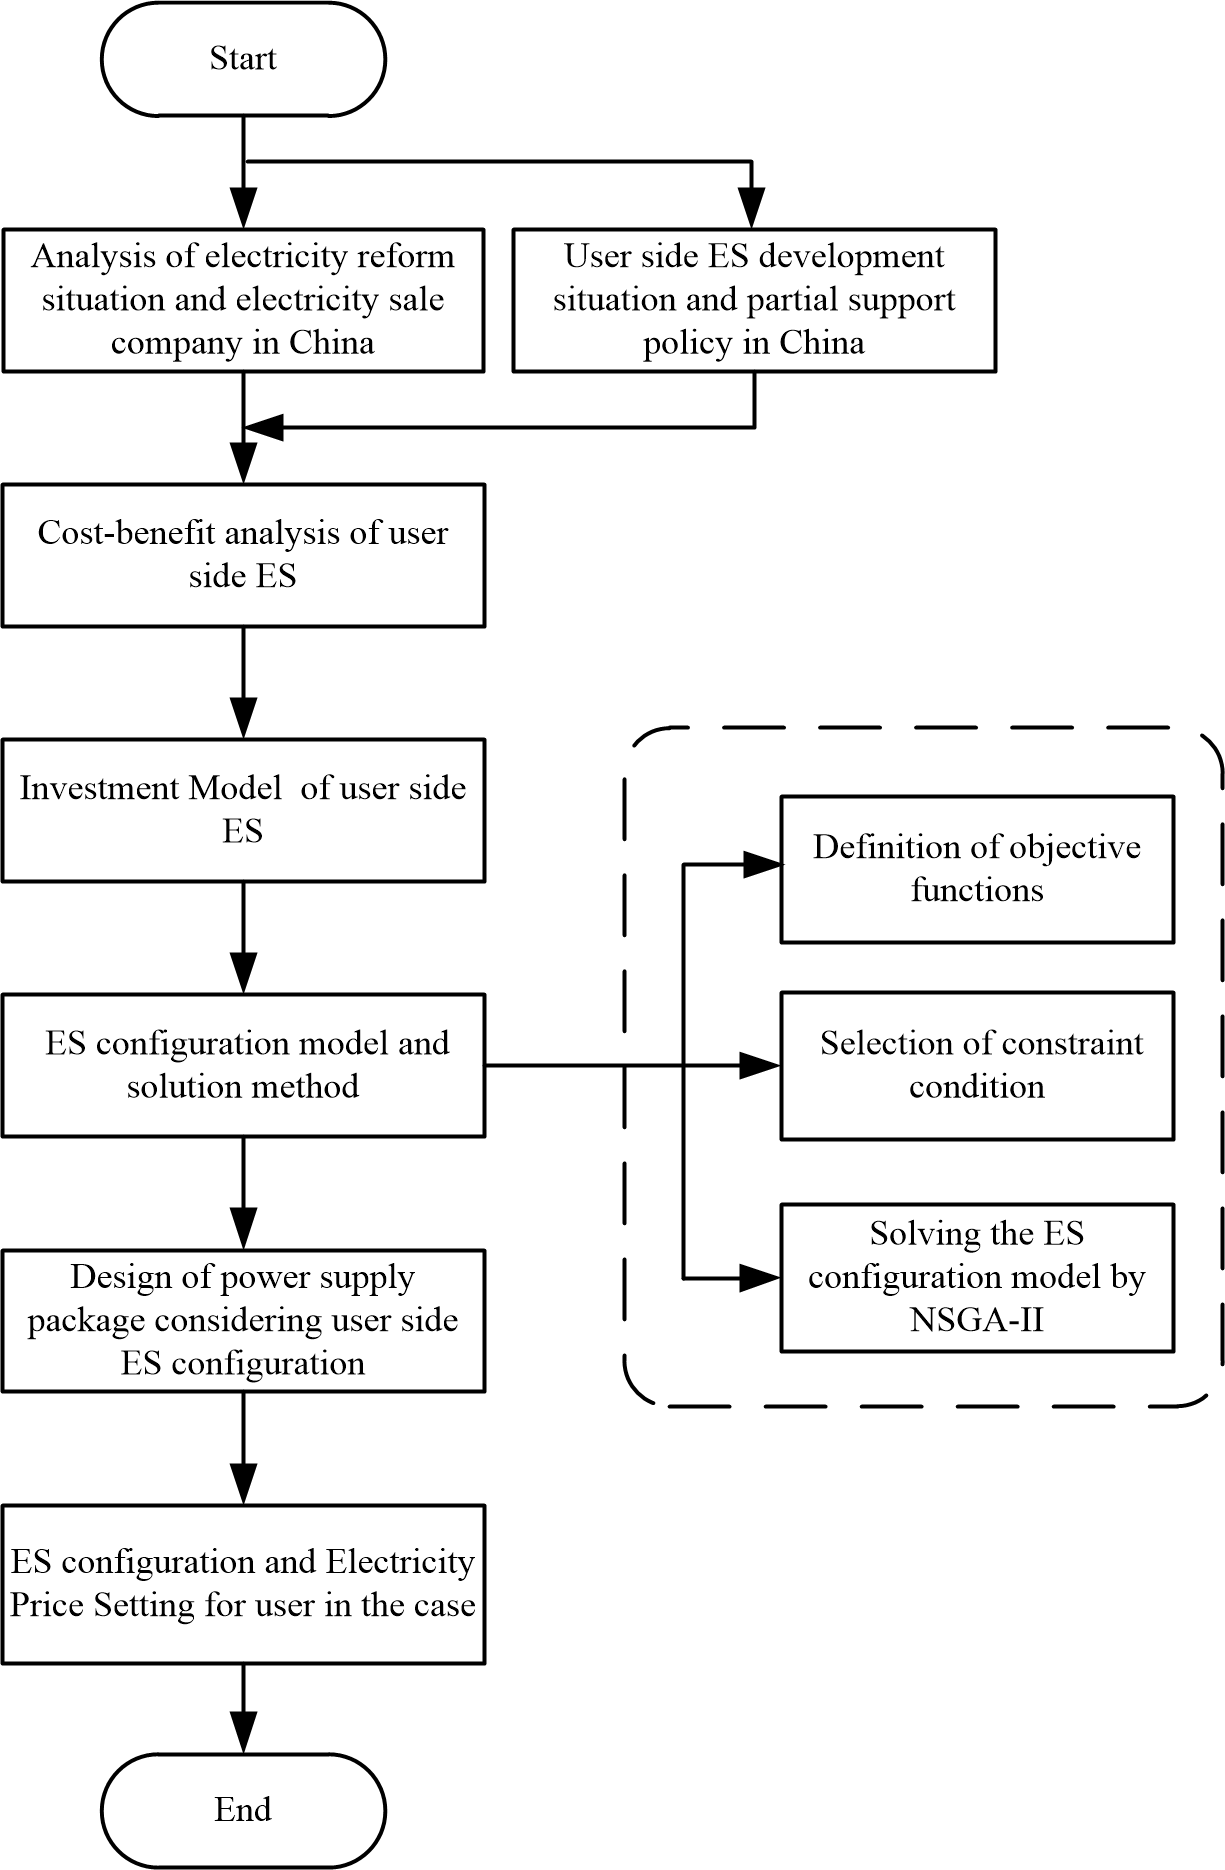
In the contract energy management mode, the electricity sales company provides users with a full range of services including ES design, equipment procurement, installation and commissioning, and maintenance. Users only need to provide the venue and other related auxiliary work. During the contract period, the customer’s electricity cost saved by the ES operation is used as the source of income for both parties. The sales company recovers the ES investment cost, and the user obtains the residual income. After the expiration of the contract, the user obtains the ownership and management rights of the ES system and enjoys the ES income exclusively. The result of the installation of ES is compared with that of not having ES installed in Figure 1.
4. ES Configuration Model and Solution Method
4.1. Objective Function
According to the analysis of ES by the electricity sales company, an ES capacity optimization configuration model is established. Considering the interests of both the electricity sales company and the power user, the optimization objectives are as follows:
- (1)
- Maximum annual income
- (2)
- Minimum user load volatility
The load volatility f(PB(t)) is the objective function for characterizing the load peak-to-valley difference of the user, and PB(t) is the charge–discharge power of the ES system at period t. The mathematical expression of the objective function f(PB(t)) is shown in Equation (8).
where PL(t) is the load of the user at time t, and Pave is the average load of the user in T time after the installation of the ES system. When PB(t) > 0, the ES system discharges, when PB(t) < 0, the ES system is charged, if PB(t) = 0, then the ES system is neither charged nor discharged. T is the evaluation period.
4.2. Constraint Condition
4.2.1. Energy Constraint
To ensure the reliability of power supply for users’ important loads and gain some benefits from that electricity generation while the electricity price is high and electricity storage while the electricity price is low. The capacity of ES includes content from two aspects, one is the reserve capacity QRE for the power supply of essential equipment, and the other is the adjustable capacity QAD for peak and valley power consumption adjustment.
where QRE is the ES capacity configured for the reliability of power supply, and QAD is the ES capacity configured to adjust the user’s peak and valley power consumption. QRE.min is the minimum ES capacity required according to the situation of users.
where PRE(t) is the load power of the essential equipment, and T is the time required for the power failure recovery.
4.2.2. Power Constraint
When configuring an ES converter, the power requirements of important loads need to be considered.
where PC is the configured ES converter power, PB.max and PL.max are the maximum load power of the important load and the maximum power of the factory load supplied.
4.2.3. Peak Load Shifting Constraint
4.2.4. Preventing Peak-to-Valley Inversion Constraints
The proper capacity of ES can effectively reduce the load volatility of the user. However, when the ES is higher than a certain capacity, the peak-to-valley difference of the user load may be reversed, and the load volatility is further increased. In order to prevent the peak-to-valley difference inversion problem, the ES capacity has the following constraints.
where F0 is the load volatility when the user is not configured with ES, and Q0 is the peak–valley difference inverted critical ES capacity.
4.2.5. Battery Performance Constraints
Considering that the energy of the ES battery has an upper limit SOCmax and a lower power limit SOCmin, when the ES system is actually operating, the state of charge SOC(t) has the following constraints:
4.3. Model Solving
In the optimization model, it is necessary to consider the economic benefits and the reliability of the power supply need. Furthermore, the storage battery type, the ES system capacity and the ES system power are optimized and selected.
The traditional multi-objective optimization methods mainly transform the multi-objective optimization problem into one target optimization problem and then solve it using mathematical planning tools. The traditional optimizations currently available include a weighted sum method, ε-constraint method, maximum and minimum decision making method, etc. The main disadvantages of conventional optimization algorithms are as follows.
- (1)
- They can only find the optimal local solution of the optimization problem;
- (2)
- The result of the solution is strongly dependent on the initial value.
Modern heuristic algorithms are more prominent in solving multi-objective optimization problems. Among them, based on the non-dominated sorting genetic algorithm (NSGA), NSGA-II has become a popular multi-objective genetic algorithm [32] by Srinivas and Deb. The algorithm has the following characteristics.
- (1)
- Fast non-dominated sorting algorithm. On the one hand, it reduces the complexity of the calculation. On the other hand, it combines the parent population and the offspring population. It can select excellent individuals from the combined population to improve the reliability of selection.
- (2)
- Introducing an elite strategy. It can reduce the rate of abandonment of elite individuals in the evolutionary process, thereby improving the accuracy of the optimization results.
- (3)
- Taken congestion and congestion comparison operators. There is no need to specify shared parameters manually. Not only can the diversity of the population be ensured, but individuals can also diffuse from the quasi-Pareto domain to the Pareto domain.
Due to the characteristics of the algorithm itself, NSGA-II has a better advantage in solving multi-objective problems than other meta-heuristic algorithms [33]. Firstly, the computational complexity is reduced significantly. Secondly, the algorithm has an optimal reservation mechanism. Thus we do not need to add additional parameters. Finally, the algorithm has higher efficiency with the convergence and stability of the algorithm being better. Therefore, NSGA-II is chosen as the solution method of the ES configuration model in this paper.
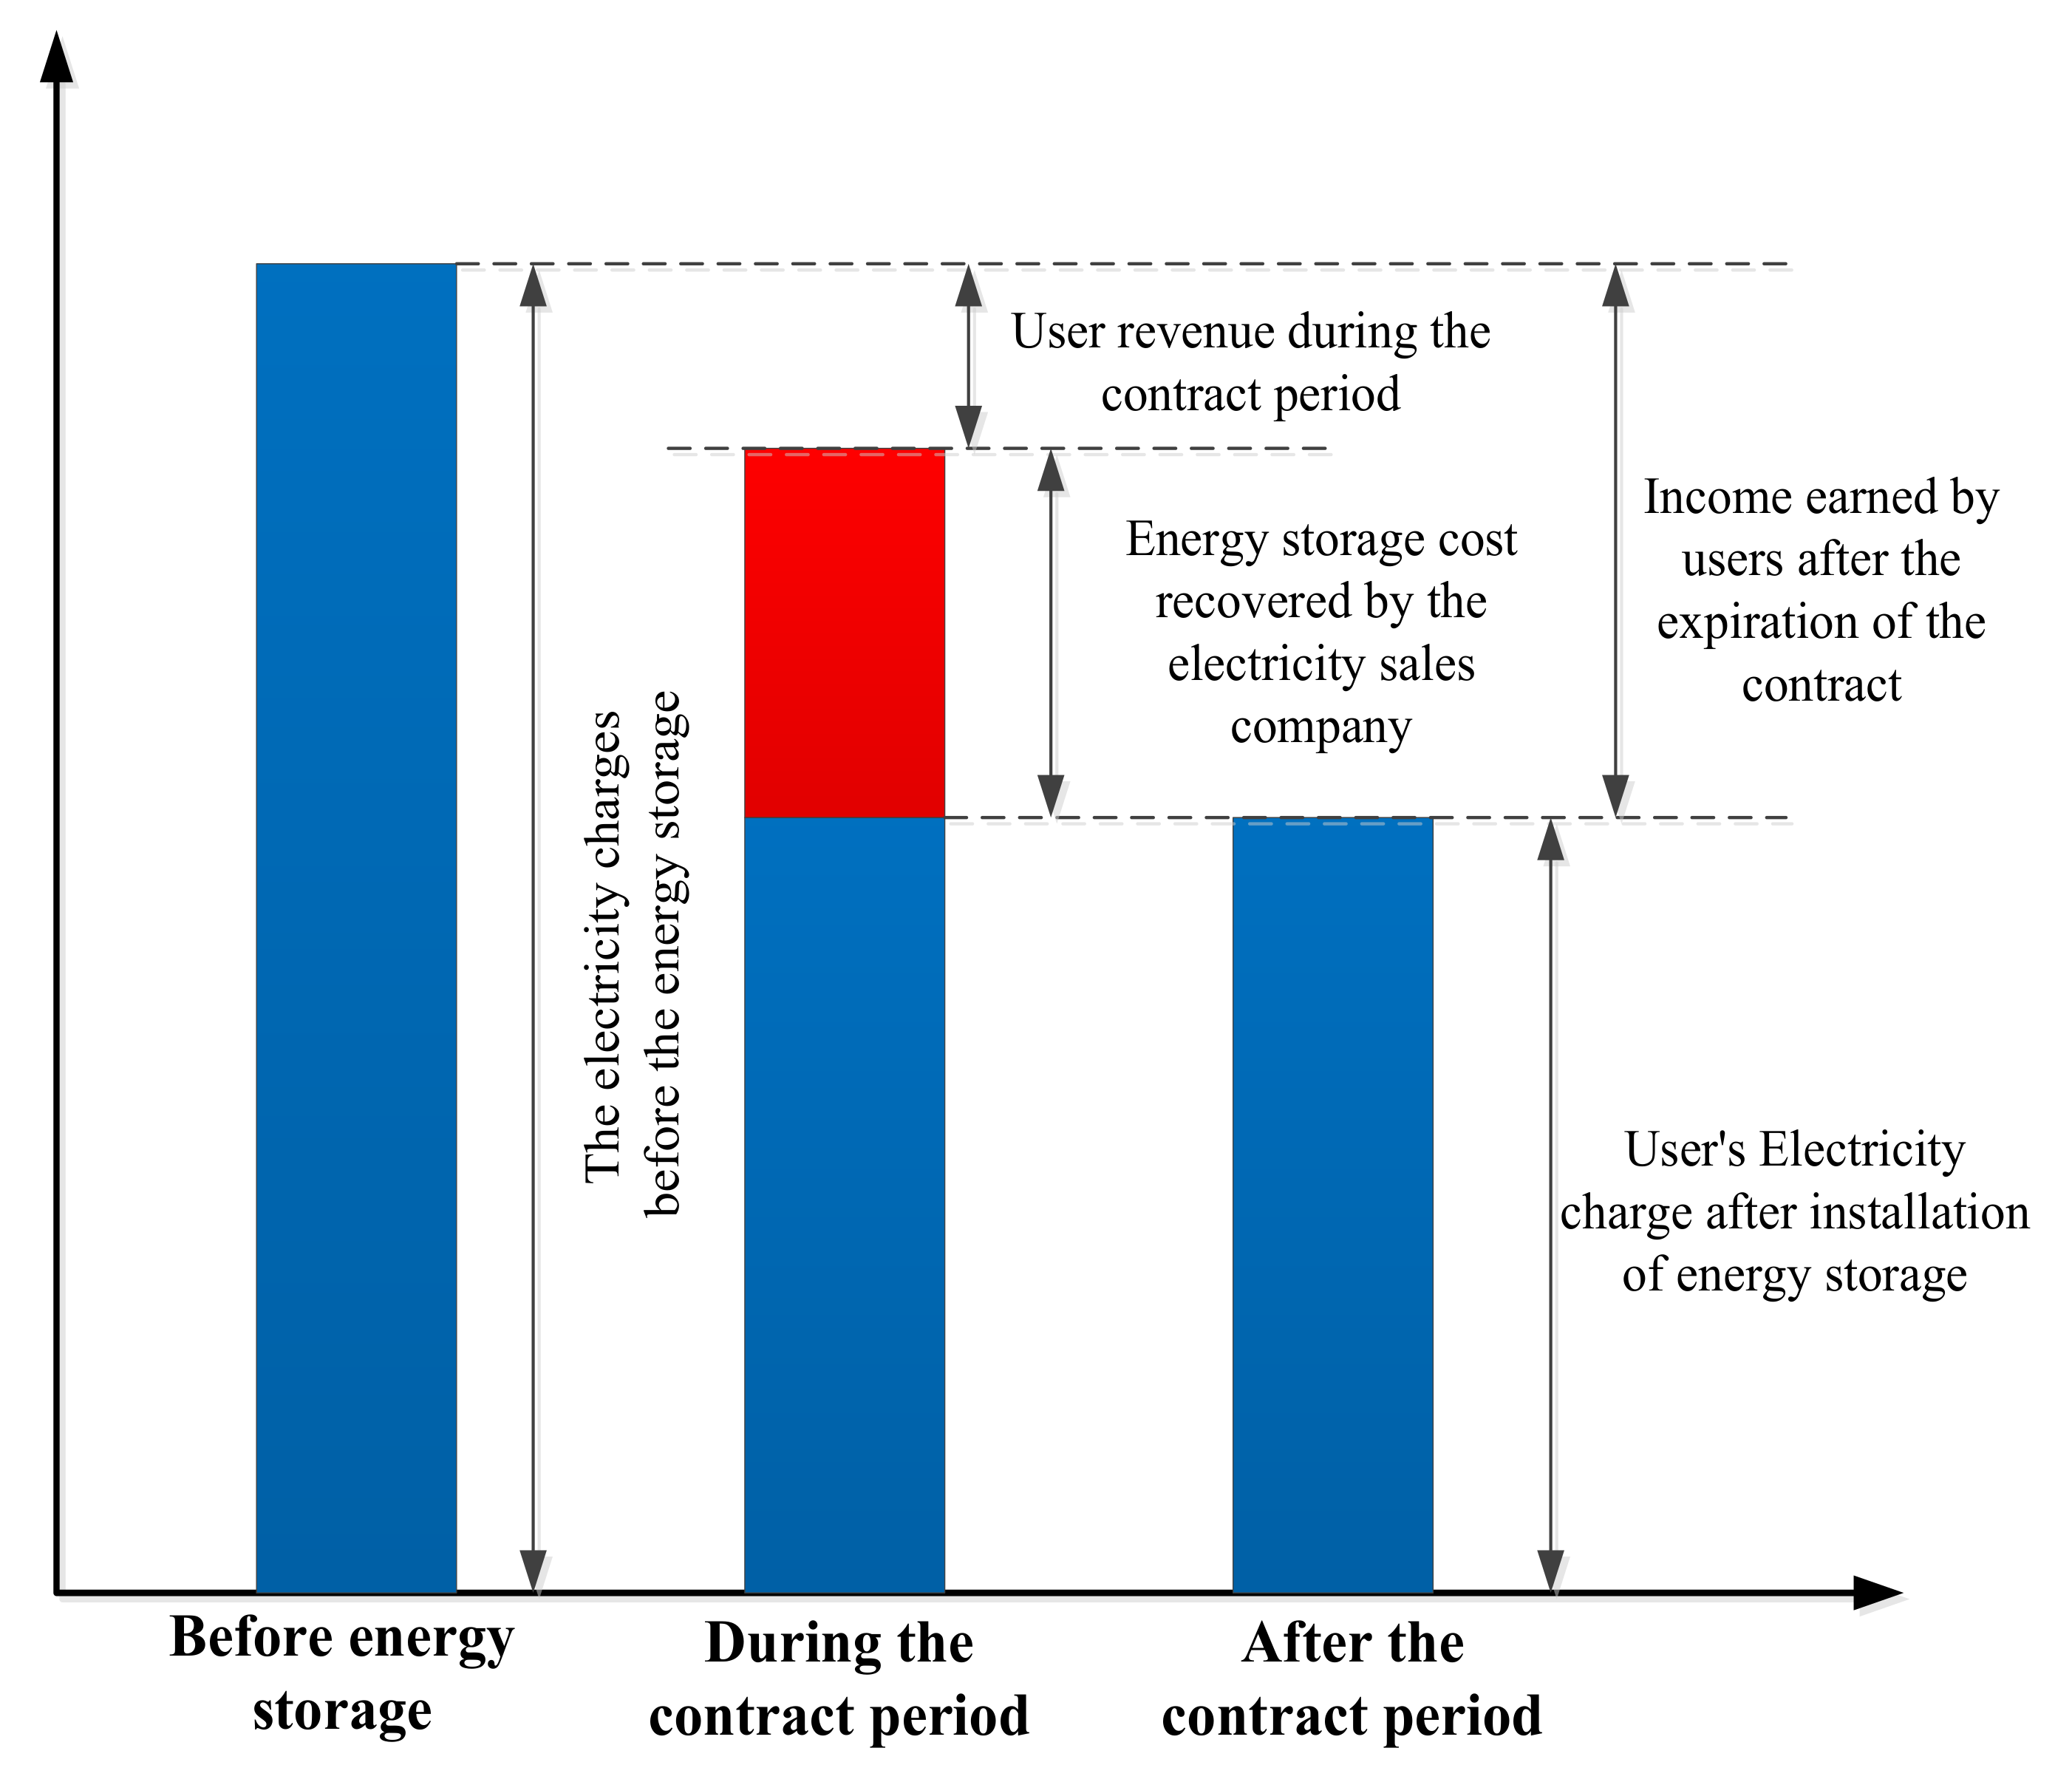
The solution process for solving the optimal configuration of the ES system using NSGA-II is shown in Figure 2.
5. Electricity Storage Price Setting
The power sales company installs an ES system for users to improve the reliability of power supply and obtain a part of the revenue from peak–valley electricity price arbitrage.
According to the discussion on the ES investment model in Section 2 and Section 3, the electricity sales company will recover the ES investment cost during the contract period. To reduce the financial pressure on the user’s one-time cost investment, they add the ES cost to the contract in the form of additional electricity charges. After the contract period, the electricity price returns to normal levels.
The electricity purchase price ρ set by the electricity sales company is as follows:
where ρ0 is the electricity purchase price before the ES system investment, ρa is the additional electricity price of the ES investment and ρa is expressed by Equation (16).
where C is the average annual investment cost of the ES system during the contract period, Q is the annual average electricity consumption of the users during the contract period, r is the discount rate and n is the contractual life of the electricity purchase.
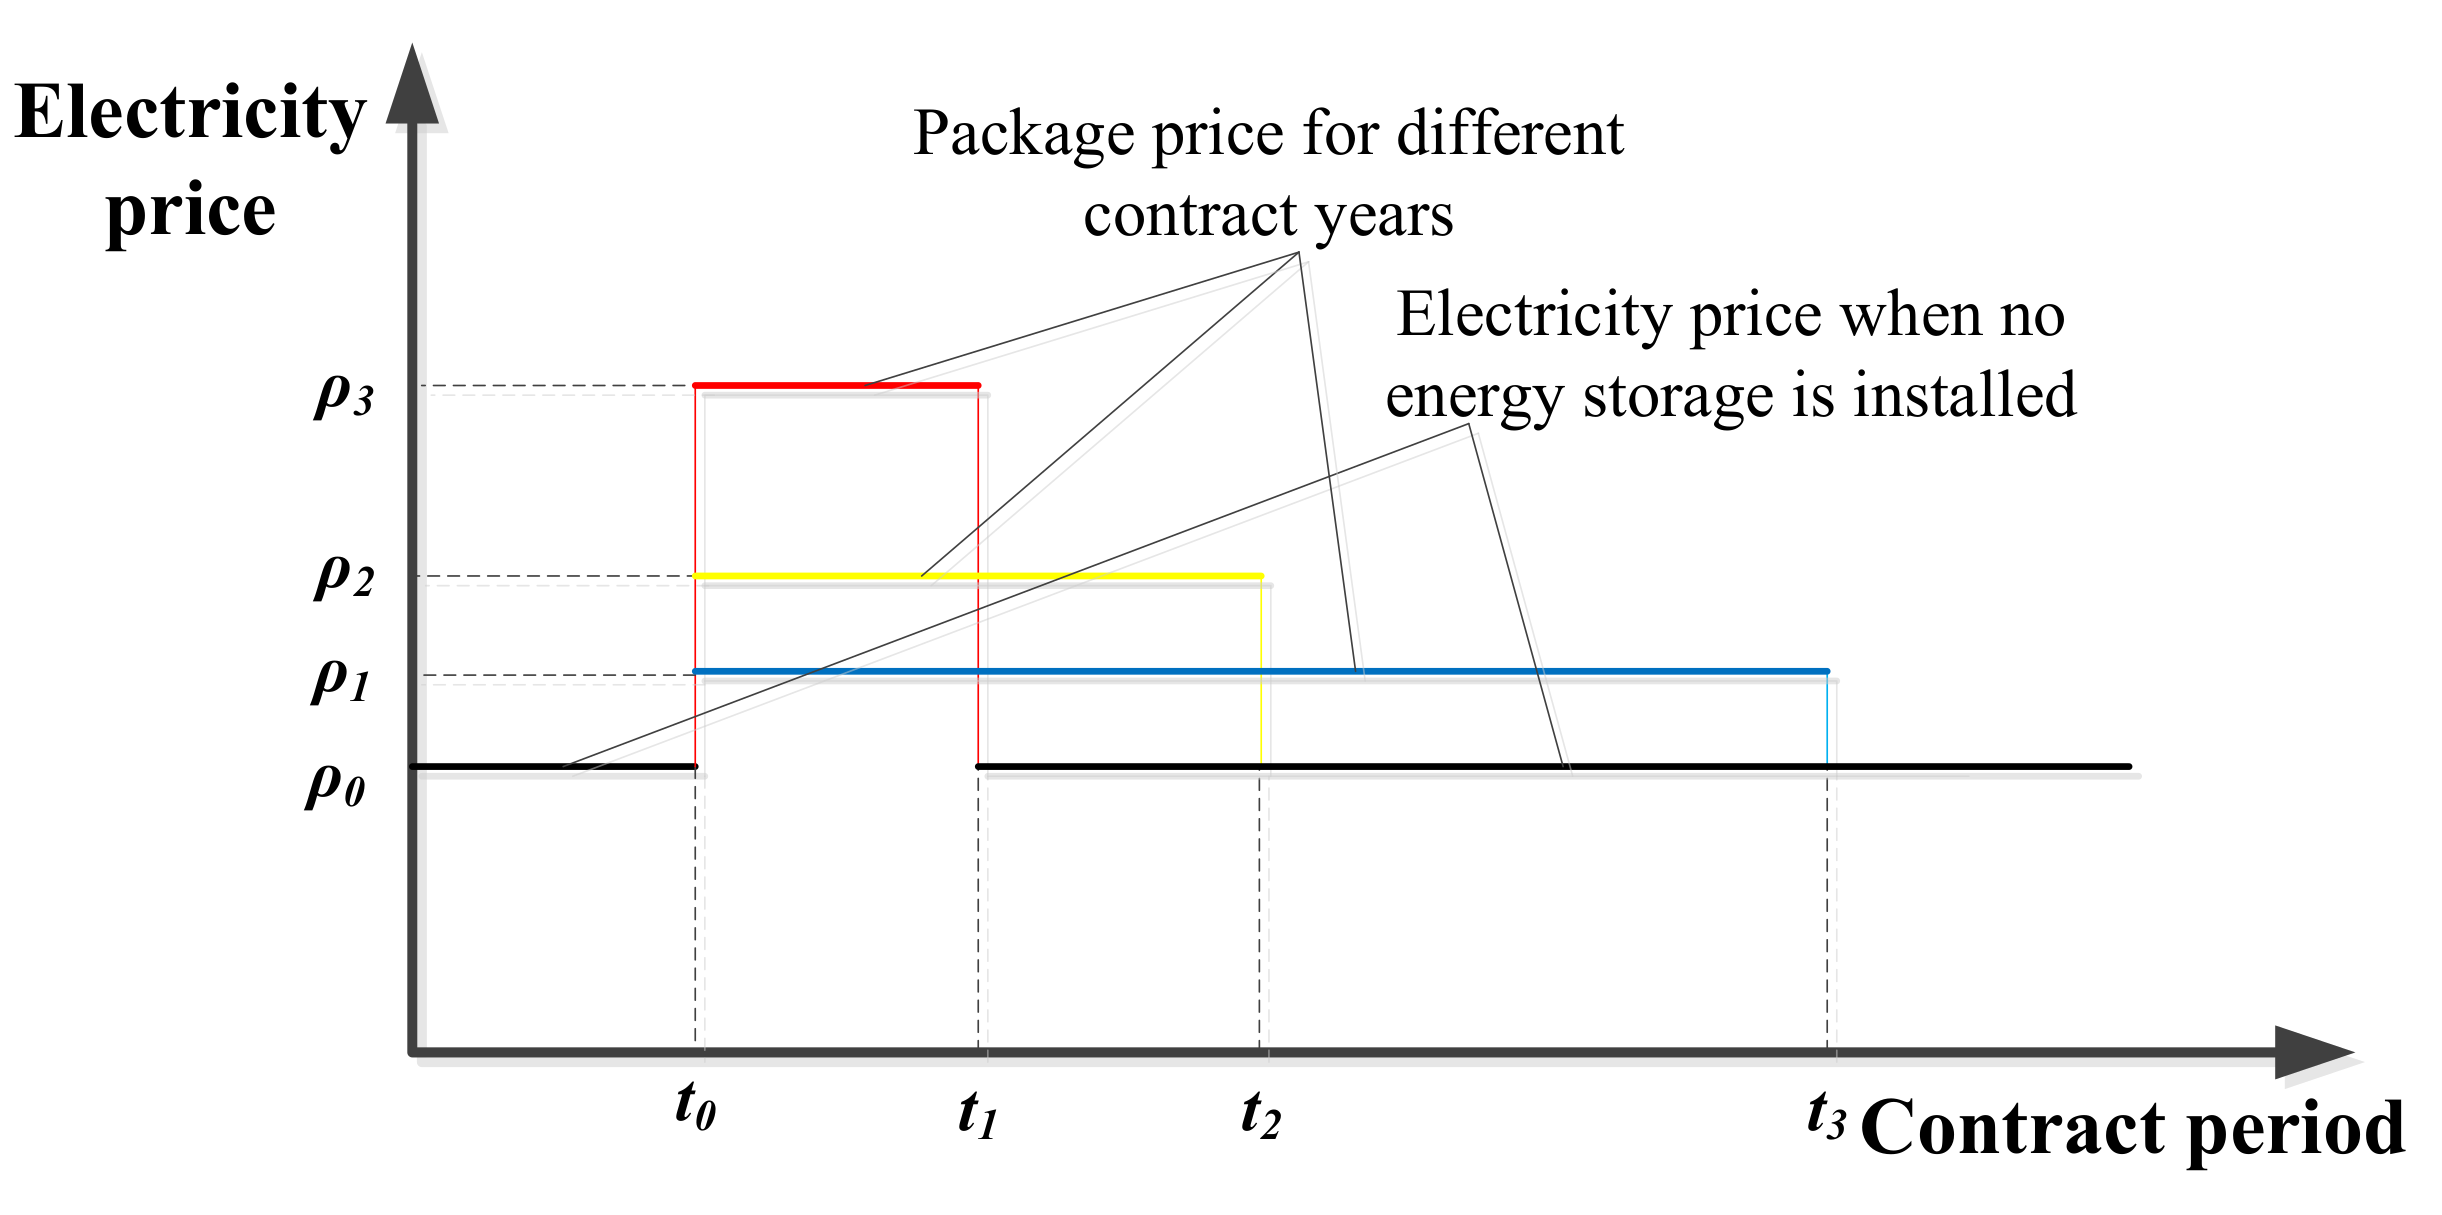
The electricity price chart of the power supply package under the different contract periods is shown in Figure 3.
6. Case Analysis
The case selected in this paper is an electronic equipment company in Guangdong Province, which produces PCB (printed circuit board) products such as soft board, soft-hard bonding board, multilayer printed circuit boards, backplane, packaging substrate and so on. It is a typical electronic enterprise in Guangdong. Before signing the contract with the electricity sales company, the company did not add equipment for power supply. The time-of-use tariff policy of industry and commerce in Guangdong is relatively complete, and the price gap between peak and valley is huge. So there is a massive space for ES arbitrage, which meets the requirement of the electricity sales company to install an ES system for the user.
6.1. Brief Introduction to the Case
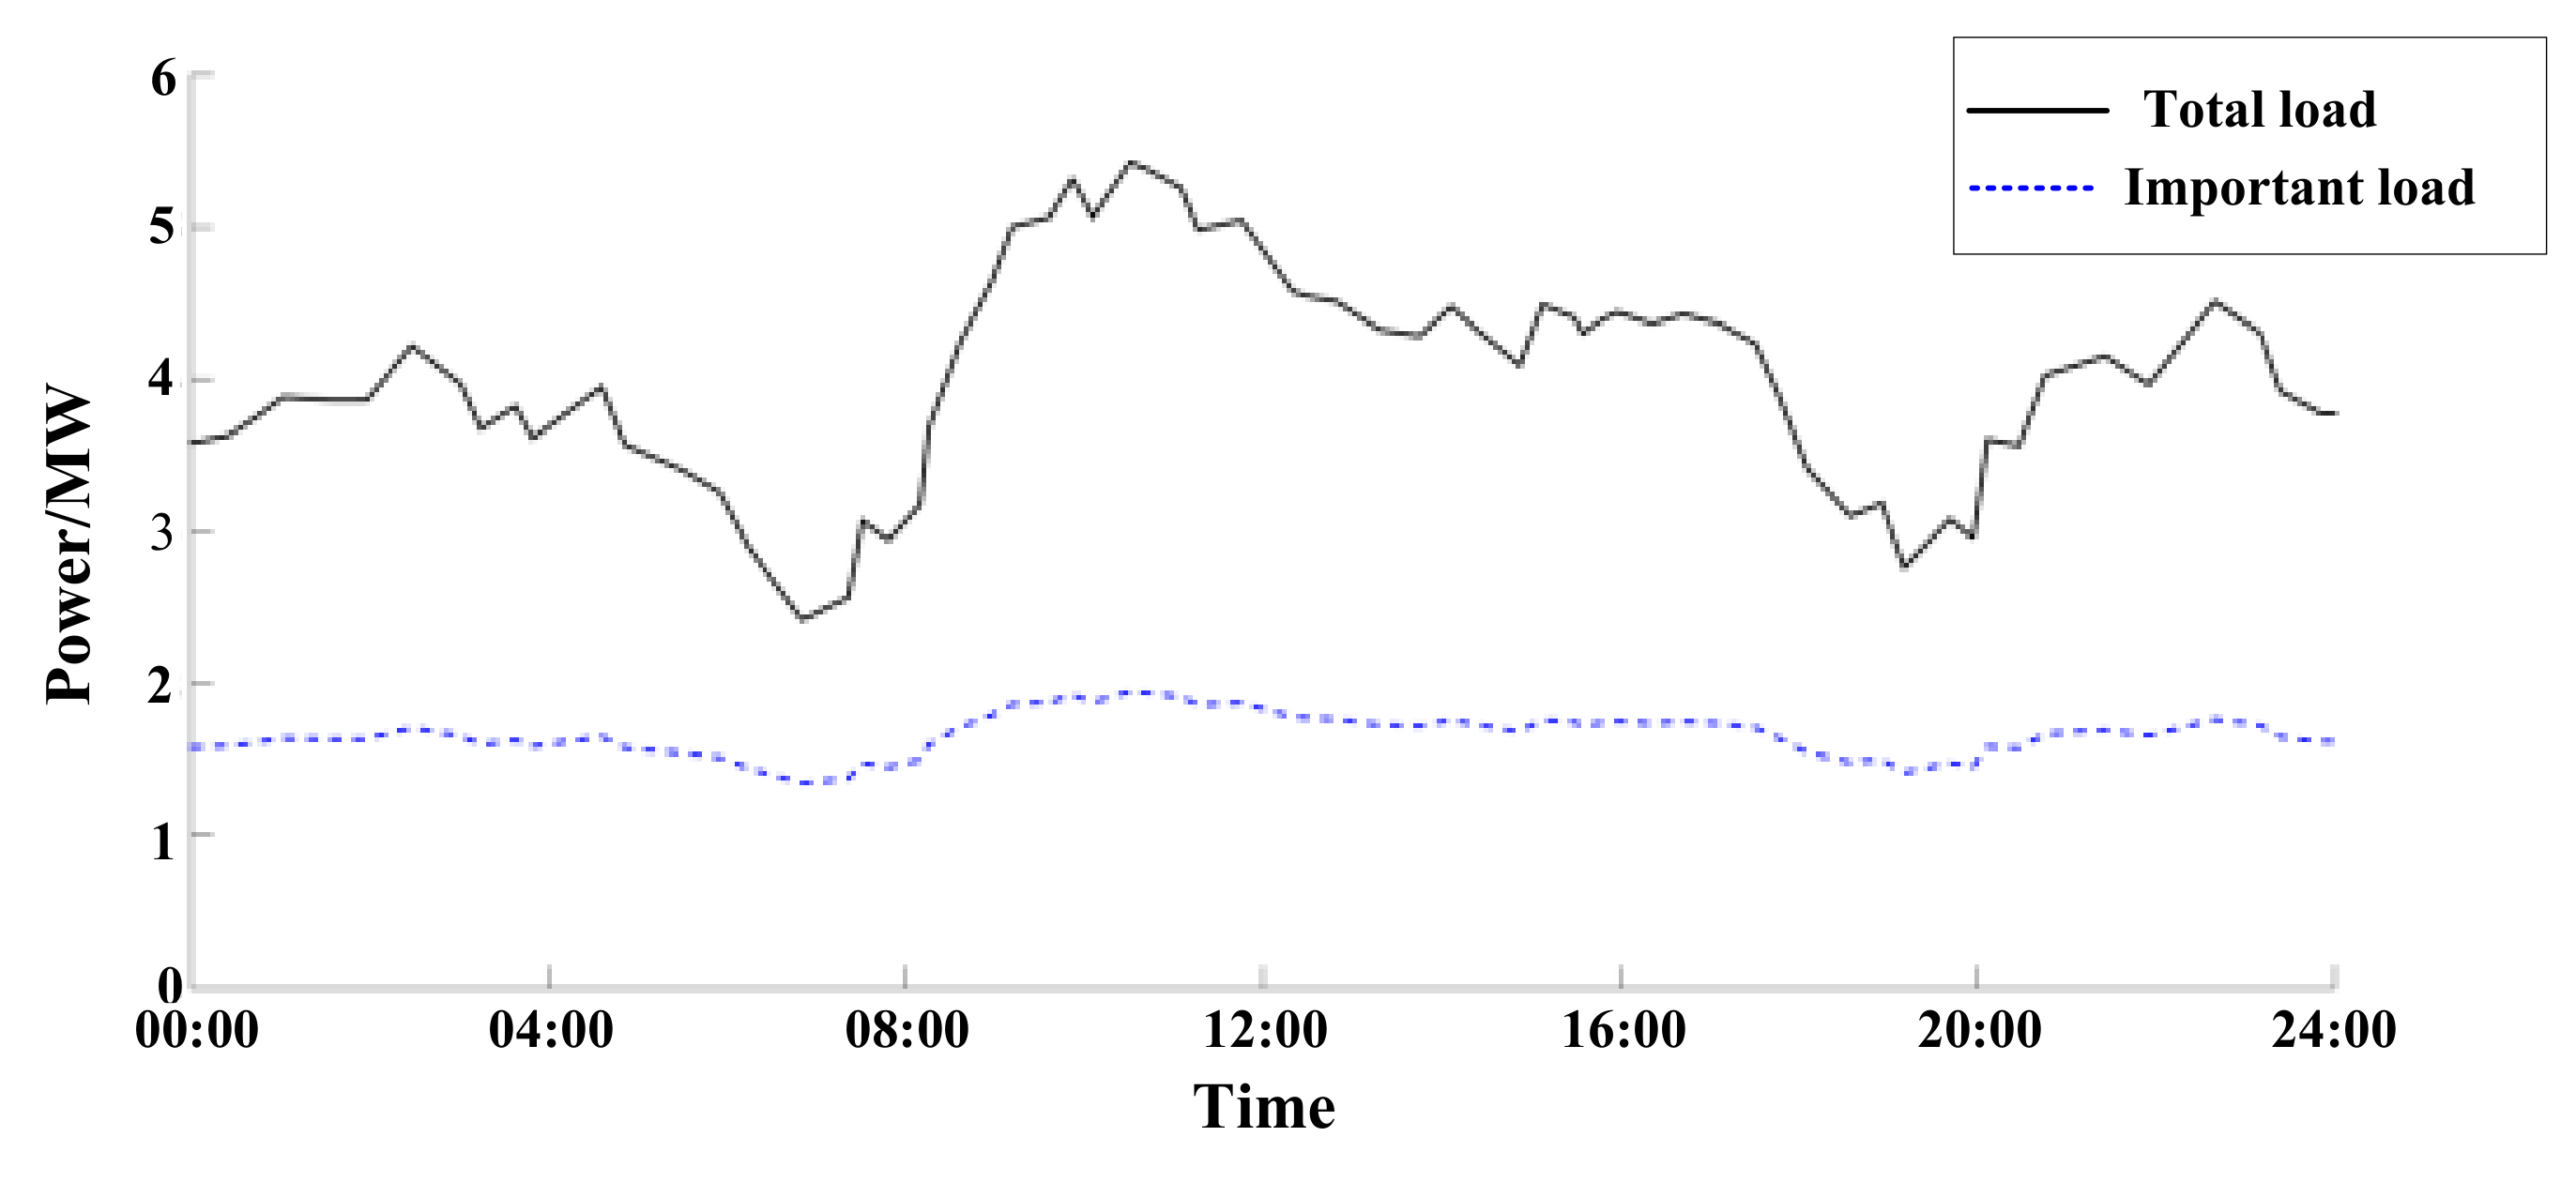
The company has two distribution transformers with a single capacity of 3150 kVA and 4000 kVA, and a rated voltage of 10/0.4 kV. The maximum operating power of important loads is 2000 kW. It is stipulated that the standby power supply should be able to ensure the normal operation of these important loads for 0.6 h. The user’s daily load curve is shown in Figure 4.
It can be obtained from the daily load curve that the user peak load is 5.4 MW, the valley load is 2.9 MW, the peak-to-valley difference is 2.5 MW and the load fluctuation rate is 0.894.
Among them, the price period of each electricity price is divided as shown in Table 3.
6.2. ES Capacity Configuration
6.2.1. Spare Capacity QRE and Power Configuration
In this case, the maximum operating power of the user’s important loads is 2000 kW. The backup power supply is required to provide 0.6 h of off-grid power supply. So it can be obtained that the ES spare capacity is QRE = 1200 kWh.
According to the above analysis, the power of the ES converter should meet the minimum power requirement of the important loads, that is, not less than 2000 kW. At the same time, considering that the user peak-to-valley difference is 2.5 MW, the ES converter is configured to 2000 kW, which can completely meet the needs of user.
6.2.2. Adjustable Capacity QAD Configuration
According to the above analysis, the configuration of QAD needs to consider the ES gain and the peak clipping effect comprehensively. The NSGA-II intelligent algorithm is used to optimize the selection, and the optimal configuration capacity is obtained.
Lithium iron phosphate batteries [35] are widely employed equipment due to their high safety, long life and environmental protection. In this paper, the electricity sales company configures the ES system with a lithium iron phosphate battery as the main component.
According to the average unit price of ES in the latest market, the average cost of a lithium iron phosphate battery is 1.2–1.8 yuan/Wh, and the average rate of an ES converter is 0.8–1.2 yuan/W. The storage battery maintenance cost is considered to be 1% of the total cost of the ES system. The depth of discharge (DOD) of the ES battery is 90%. At this time, the life of the ES battery is about 3000 cycles.
In combination with the company’s local electricity tariff policy and typical daily load curve, the ES system is scheduled to be charged every day from 0:00 to 08:00 and discharged at 09:00 to 12:00 and 19:00 to 22:00.
The company runs 300 days a year, and the evaluation period is 10 years. In combination with battery life, there is no need to replace the battery during the evaluation period. The battery cost is 1.5 yuan/Wh; the ES converter price is 1.0 Yuan/ W; the discount rate is 3.24%.
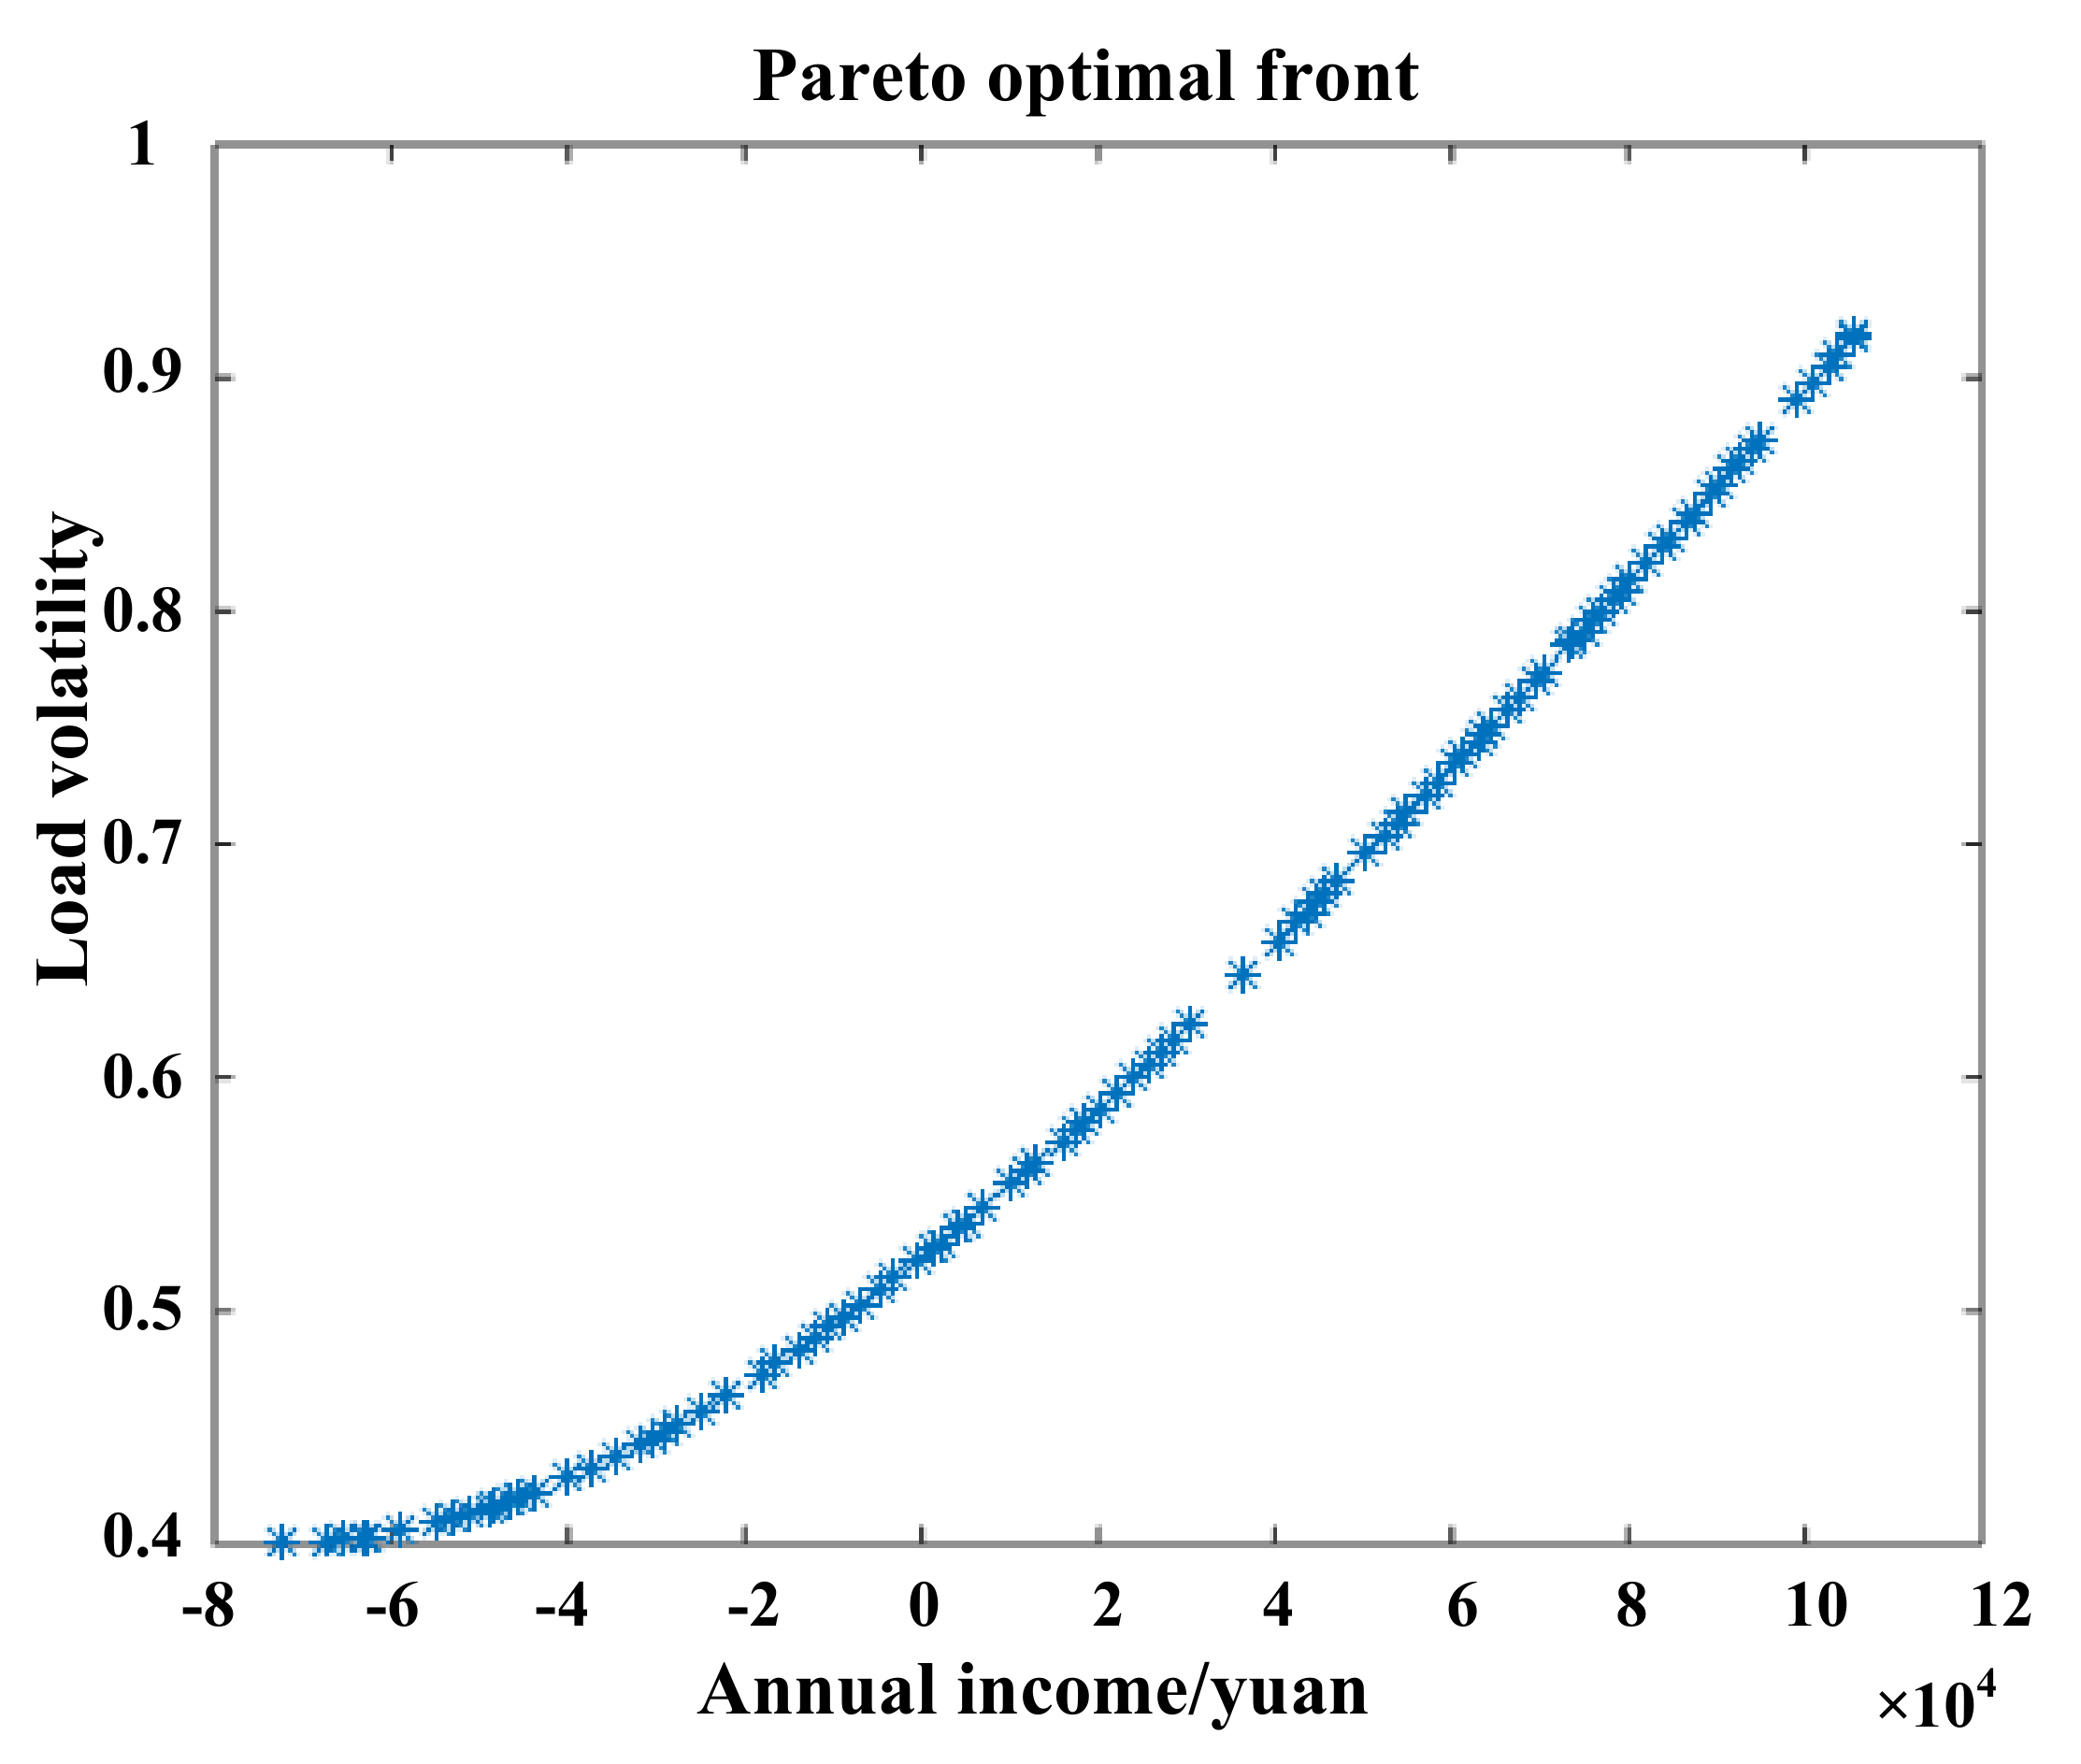
According to the ES capacity optimization configuration model proposed in this paper, the model is solved by NSGA-II, and the obtained Pareto frontier is shown in Figure 5.
The annual revenue of ES is increased as the capacity of the configuration increases. The volatility of the load is not a simple positive correlation with the ES capacity. A certain capacity of ES can cut the peaks and fill the valley to reduce the fluctuation of the load curve. Along with the continued increase of the ES capacity, the peak-to-valley difference of the load curve will increase.
According to the analysis of the curve in Figure 5, to ensure that the ES system can be profitable, the QAD is higher than 6.89 MWh. At the same time, to make sure the user load volatility is lower than the level before the installation of ES, the QAD needs to be lower than 10.31 MWh.
6.3. Improved Power Supply Reliability
According to the user’s electricity consumption statistics over the years, the RS-1 of the important loads of the company is 99.818% before the installation of the ES system. After the installation of ES, the RS-1 of the users can be evaluated by the following equation.
where Ke0 is the RS-1 before the installation of the ES system, is the time when the ES system fails during the evaluation period and Te is the evaluation period.
According to the failure time statistics of the ES system during Te, the RS-1 of the power supply is increased to 99.996% after the installation of the ES system, which effectively guarantees the power supply of important loads.
The installation of ES improved the RS-1 of the user significantly, which reduces the impact of power outages on the user’s equipment and production. Thereby the loss of user will be reduced.
6.4. Electricity Sales Package of the Electricity Sales Company
After discussion and analysis in Section 3.2, the final ES capacity is 9.8 MWh, and the average electricity price is 0.75 Yuan/kWh before installing the ES system. According to the survey, the average annual electricity consumption of this user is 28,800 MWh.
Taking the contractual period of 5 years as an example, before installing the ES system, the electricity price is ρ0 = 0.75 Yuan/kWh. Annual electricity consumption is Q = 28,800 MWh, and contract length is n = 5 years. Bringing the data into Equation (15), the user’s ES investment additional electricity price is ρa = 0.13 Yuan / kWh, and then the electricity price of the power supply package with ES configuration is ρ = 0.88 Yuan / kWh.
Similarly, the electricity price of the power supply package is set for different contract years, and the electricity price data in Table 4 is obtained.
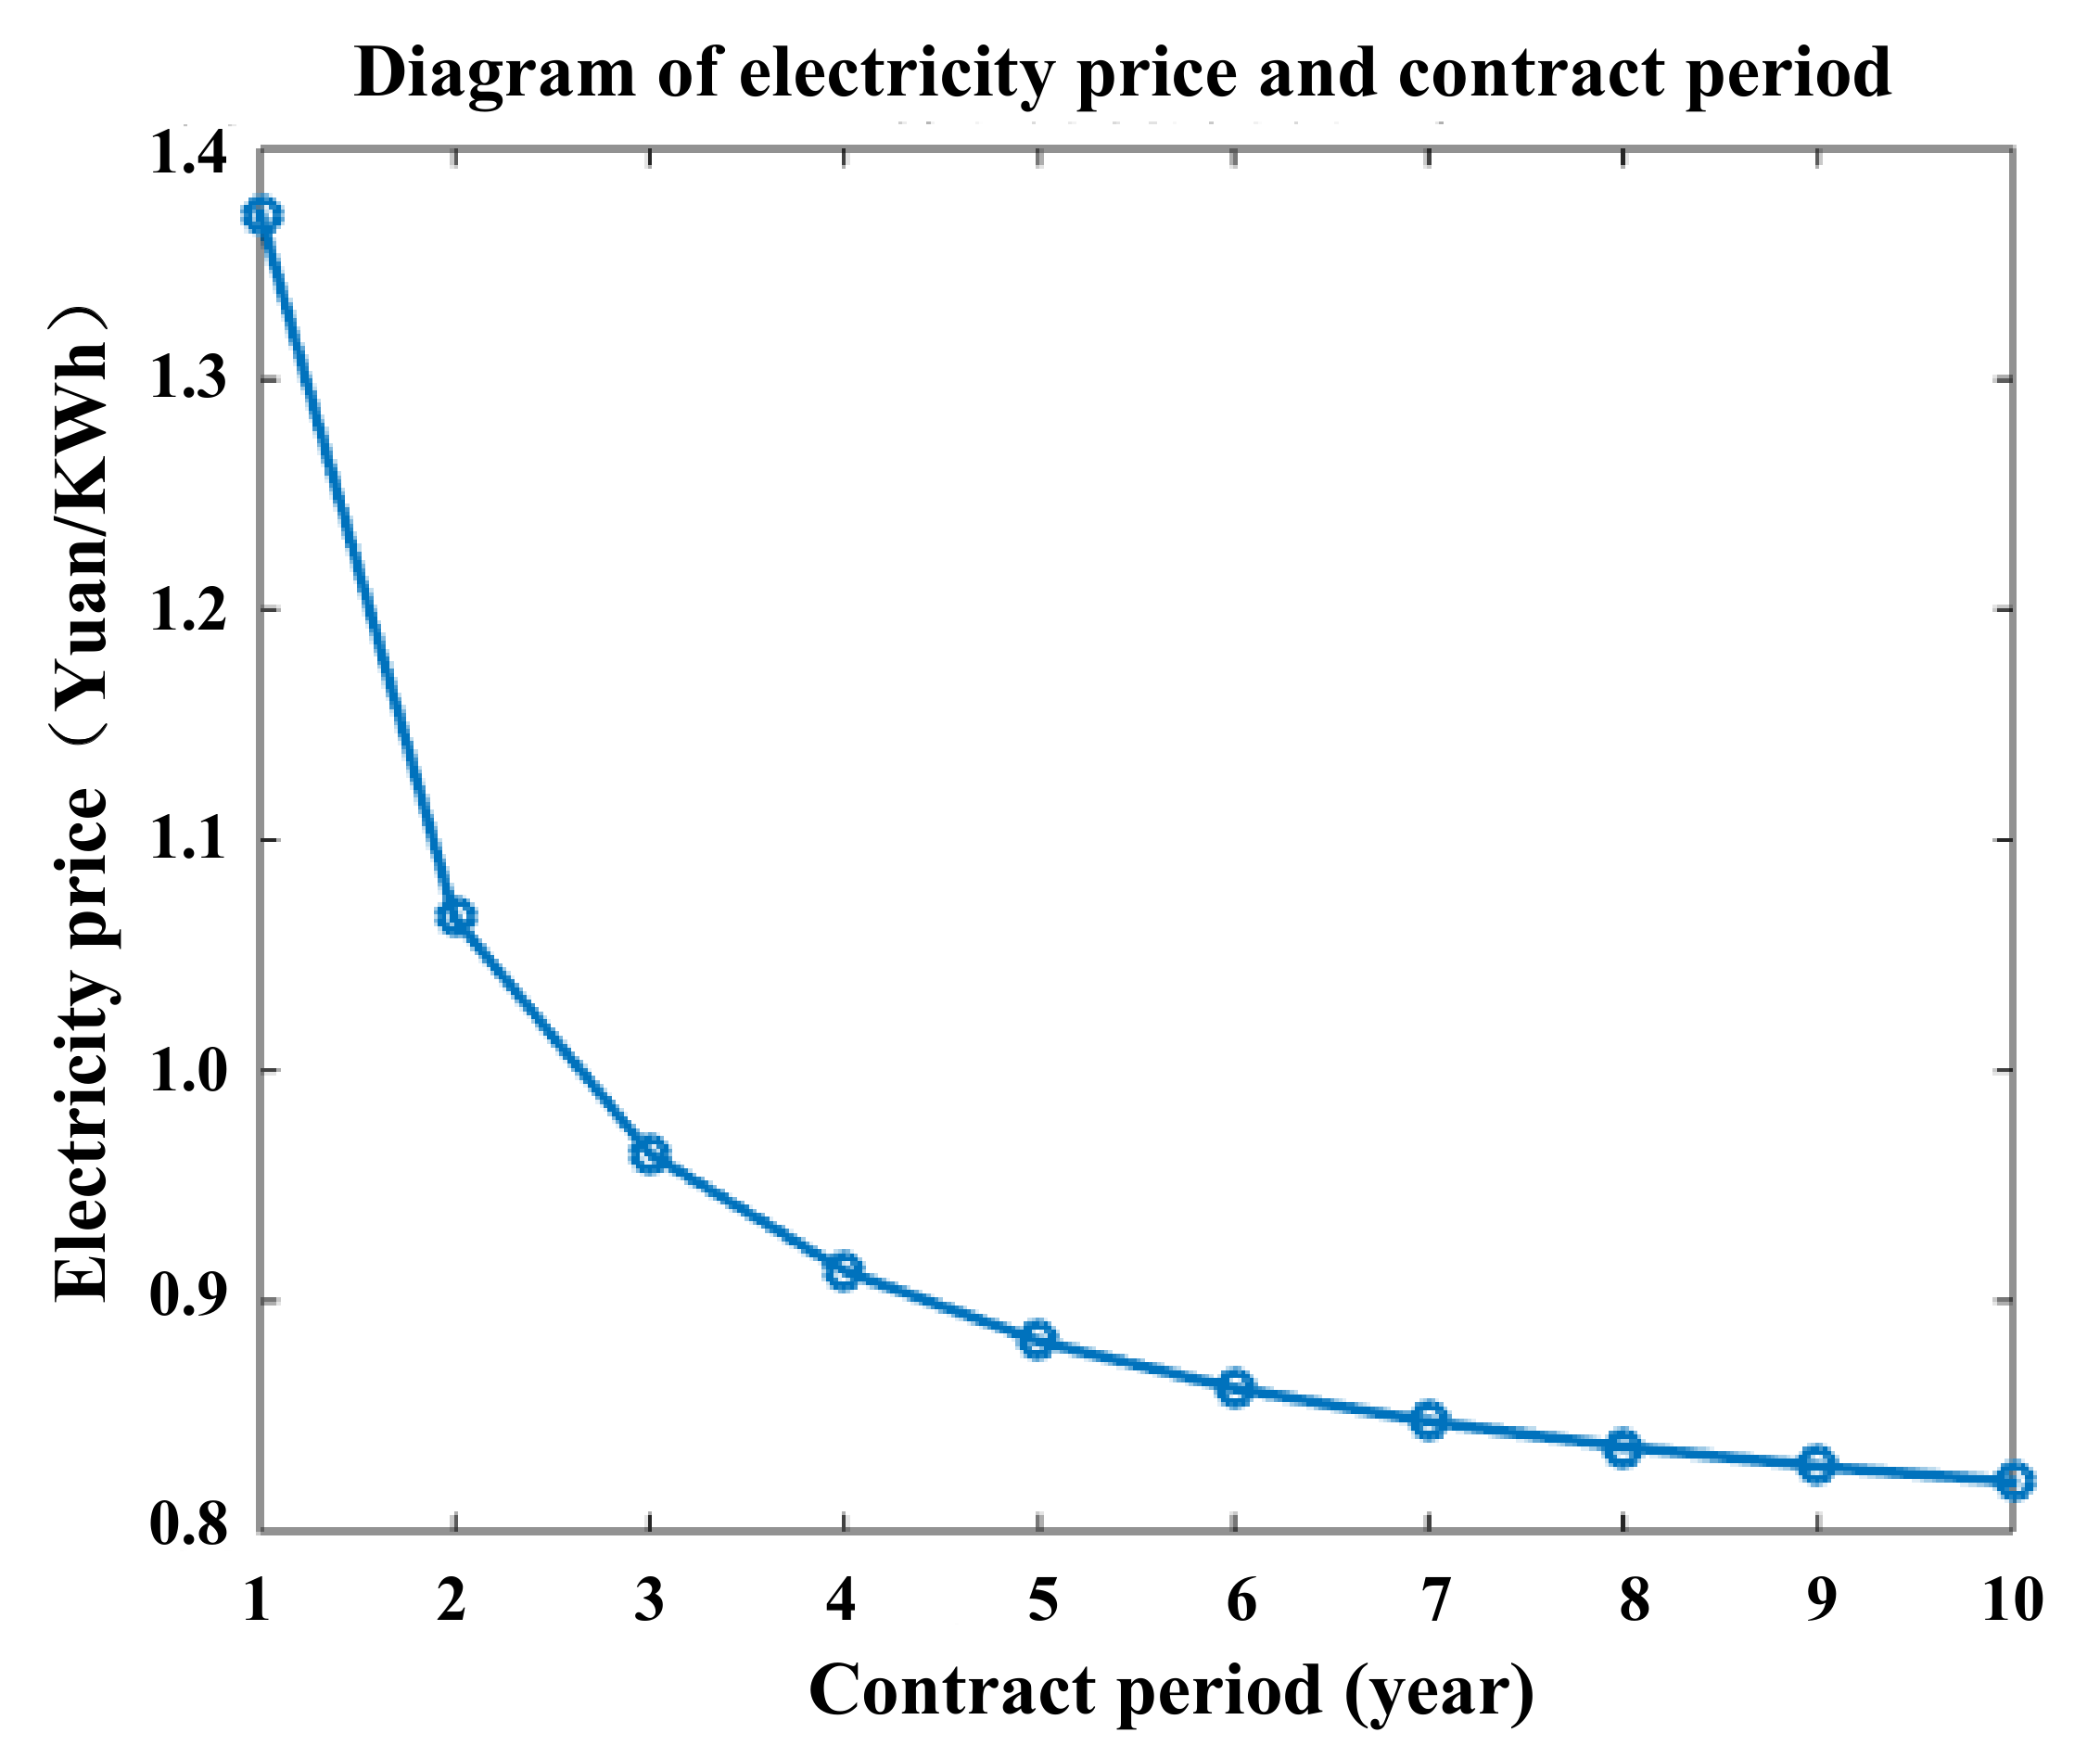
According to the electricity price data of different contract years in Table 4, the relationship between the package electricity price and the contract period is shown in Figure 6.
It can be seen from Figure 6 that during the life of the ES system, the user’s power supply price decreases with the increase of the power purchase contract period, and the electricity price fluctuates to 0.81–1.37 yuan/kWh. Electricity sales companies gain loyalty with large users and enhance their competitiveness in the electricity market.
7. Conclusions
Given the improvement of the competitiveness of electricity sales companies under the new power reform situation, this paper provides users with electricity price packages with ES configuration considering the power supply reliability requirements of users. In this paper, the ES of the required configuration is of two categories: spare capacity and adjustable capacity. The base is reserve spare capacity used for ensuring the off-grid operation of the user’s important loads. For an effective remedy, we built a model that established the maximum ES revenue and the minimum user load volatility. It is called the adjustable capacity configuration optimization model and aims to obtain the flexible capacity. Finally, the electricity price for users is customized based on the cost, the expenditure in the ES and the period of the contract signed for the purchase and sale of electricity. The following conclusions can be drawn from the case study users’ ES allocation and the price of packages.
- (1)
- A novel business model incorporating ES configuration as a value-added service into retail electricity contracts is proposed in this paper. In the case study, it was confirmed that the user side ES plays a significant role in improving power supply reliability and reducing electricity expenses.
- (2)
- The NSGA-II is used to optimize the configuration of the ES capacity on the user side in this paper. Combined with the case study, the optimized ES can reduce the user’s electricity bill and reduce the user load fluctuation.
- (3)
- This study models the charging system that allocates the ES configuration cost to the user’s electricity bill. In this model, it can not only reduce the pressure on users to invest in ES, but also promote the signing of long-term power supply contracts between users and electricity sales companies. The latter can enhance the competitiveness of electricity sales companies as well.
Author Contributions
Methodology, Q.M. and Y.G.; Software, Y.Y.; Data Curation, H.L. and Q.M.; Writing—Original Draft Preparation, Q.M.; Writing—Review and Editing, Y.G. and H.L.
Funding
This research was funded by The National Natural Science Foundation of China grant number 51607068 and The Fundamental Research Funds for the Central Universities grant number No. 2017MS090, No. 2018MS082.
Conflicts of Interest
The authors declare no conflict of interest
Abbreviations
| ES | Energy storage |
| ESCN | The statistics of China ES network |
| HESS | hybrid energy storage system |
| EB | energy-based |
| NSGA | The non-dominated sorting genetic algorithm |
| NSGA-II | The non-dominated sorting genetic algorithm with elite strategy |
| RS-1 | The reliability of service in total |
| DOD | The depth of discharge |
Notations
| CB | The cost of the ES battery |
| CT | The cost of the ES converter |
| CM | The cost of the system’s operation and maintenance |
| r | The discount rate |
| QRE | The reserve capacity |
| QAD | The adjustable capacity |
References
- Central Committee of the Communist Party of China. Some Opinions on Further Deepening the Reform of the Electric Power System [2015] No. 9 [A]; Beijing, The State Department: Beijing, China, 2015.
- Cheng, C.; Luo, B.; Miao, S.; Wu, X. Mid-Term Electricity Market Clearing Price Forecasting with Sparse Data: A Case in Newly-Reformed Yunnan Electricity Market. Energies 2016, 9, 804. [Google Scholar] [CrossRef]
- Xu, P.; Tao, X. Cooperative game of electricity retailers in China’s spot electricity market. Energy 2017, 145, 152–170. [Google Scholar]
- Xiao, X.Y.; Ma, Y.Q.; Mo, W.X.; Chen, W.; Xu, Z. Premium Power Based Value-added Service Model for Power Supply Company Under the Opening Electricity Retail Side. J. Electr. Power Sci. Technol. 2016, 31, 4–10. [Google Scholar]
- Chen, H.U.; Songhuai, D.U.; Juan, S.U.; Guangyi, T.O.N.G.; Mengzhen, W.A.N.G. Preliminary research of trading approach and management modes of Chinese electricity retail companies under new electricity market reform. Power Syst. Technol. 2016, 40, 3293–3299. [Google Scholar]
- Weng, G.M.; Li, C.Y.V.; Chan, K.Y. Three-electrolyte electrochemical energy storage systems using both anion-and cation-exchange membranes as separators. Energy 2019, 167, 1011–1018. [Google Scholar] [CrossRef]
- Yao, Y.; Zhang, P.; Chen, S. Aggregating Large-Scale Generalized Energy Storages to Participate in Energy Market and Regulation Market. Energies 2019, 12, 1024. [Google Scholar] [CrossRef]
- Nawar, S.; Huskinson, B.; Aziz, M. Benzoquinone-hydroquinone couple for flow battery. MRS Proc. 2013, 1491, mrsf12-1491-c08-09. [Google Scholar] [CrossRef]
- Yuan, L.X.; Wang, Z.H.; Zhang, W.X.; Hu, X.L.; Chen, J.T.; Huang, Y.H.; Goodenough, J.B. Development and challenges of LiFePO4 cathode material for lithium-ion batteries. Energy Environ. Sci. 2011, 4, 269–284. [Google Scholar] [CrossRef]
- Kollimalla, S.K.; Mishra, M.K.; Narasamma, N.L. Design and Analysis of Novel Control Strategy for Battery and Supercapacitor Storage System. IEEE Trans. Sustain. Energy 2014, 5, 1137–1144. [Google Scholar] [CrossRef]
- Hou, R.; Nguyen, T.T.; Kim, H.M.; Song, H.; Qu, Y. An Energy-Based Control Strategy for Battery, Energy Storage Systems: A Case Study on Microgrid Applications. Energies 2017, 10, 215. [Google Scholar] [CrossRef]
- Xu, Y.; Lang, T. Optimal Operation and Economic Value of Energy Storage at Consumer Locations. IEEE Trans. Autom. Control 2017, 62, 792–807. [Google Scholar] [CrossRef]
- Yang, B.; Yi, J.; Wan, Y. Research on battery selection of large-scale energy storage power stations in Beijing. Energy Conserv. 2018, 37, 20–24. [Google Scholar]
- Büngeler, J.; Cattaneo, E.; Riegel, B.; Sauer, D.U. Advantages in energy efficiency of flooded lead-acid batteries when using partial state of charge operation. J. Power Sources 2018, 375, 53–58. [Google Scholar] [CrossRef]
- Sun, L.; Zhen, Y.; Zhou, L.; Li, X.; Zhou, P. Experimental study on over discharge induced internal short circuit of NCM batteries. Chin. J. Power Sources 2018, 42, 1454–1457. [Google Scholar]
- Mei, C.; Zhao, W. Application safety analysis and system design of lithium iron phosphate battery in substation. Electr. Eng. 2019, 20, 70–73. [Google Scholar]
- Yang, J.; Huang, Y.; Fei, F.; Guo, M.; Pang, A. Research of economic benefits of energy storage technique under different business operational modes. Electr. Eng. 2018, 19, 80–84. [Google Scholar]
- Song, D.; Ma, X. Discussion on Commercial Application of Energy Storage Technology. Shanghai Energy Conserv. 2019, 2019, 116–119. [Google Scholar]
- Li, R.; Zhang, X.; Xu, Y.; Sun, W.; Zhou, X.; Guo, C.; Chen, H. Research on Optimal Configuration of hybrid Energy Storage capacity for wind-solar generation system. Energy Storage Sci. Technol. 2019, 8, 512–522. [Google Scholar]
- Ding, Y.; Xu, Q.; Lv, Y.; Li, L. Optimal Configuration of User-side Energy Storage Considering Power Demand Management. Power Syst. Technol. 2019, 3, 1179–1186. [Google Scholar]
- Li, Z.; Zhang, J.W.; Yu, L.G.; Zhang, J.W. Electrospun porous nanofibers for electrochemical energy storage. J. Mater. Sci. 2017, 52, 6173–6195. [Google Scholar] [CrossRef]
- Zheng, J. Energy Storage Industry Strategy Research. Machinery 2018, 56, 1–8. [Google Scholar]
- Zhang, J. Policy Helps Energy Storage to Achieve Commercial Development. Sino Glob. Energy 2018, 23, 80–85. [Google Scholar]
- Guidance on Promoting Energy Storage Technology and Industrial Development. Available online: http://www.ndrc.gov.cn/gzdt/201710/t20171011_863348.html (accessed on 22 September 2017).
- Notice on Piloting Market-Based Trading of Distributed Power Generation. Available online: http://zfxxgk.nea.gov.cn/auto87/201711/t20171113_3055.htm (accessed on 31 October 2017).
- Opinions on Innovation and Improvement of the Price Mechanism for Promoting Green Development. Available online: http://www.gov.cn/xinwen/2018-07/02/content_5302737.htm (accessed on 21 June 2018).
- Liu, Z.; Zhang, Z.; Yang, B.; Wang, Z.; Qi, F. Evaluation of Great Blackout Social Comprehensive Loss of Power Grid. Power Syst. Technol. 2017, 41, 2928–2940. [Google Scholar]
- Kapila, S.; Oni, A.O.; Kumar, A. Development of techno-economic models for large-scale energy storage systems. Energy 2017, 140, 656–672. [Google Scholar] [CrossRef]
- Gao, C. User Side Energy Storage System Input and Output Analysis. Appl. Energy Technol. 2017, 1, 28–30. [Google Scholar] [CrossRef]
- Ma, X.; Zhou, C.; Liu, Y.; Wang, L.; Guo, X.; Yu, Z. Business Mode and Economic Analysis of User-Side Battery Energy Storage System in Industrial Parks. South. Power Syst. Technol. 2018, 12, 44–51. [Google Scholar]
- Shen, H. Research on Investment Decision-making of Energy-saving Benefit-sharing Contract Energy Management Project. Value Eng. 2018, 37, 60–61. [Google Scholar]
- Deb, K.; Pratap, A.; Agarwal, S.; Meyarivan, T.A.M.T. A fast and elitist multiobjective genetic algorithm: NSGA-II. IEEE Trans. Evol. Comput. 2002, 6, 182–197. [Google Scholar] [CrossRef] [Green Version]
- Tomoiagă, B.; Chindriş, M.; Sumper, A.; Sudria-Andreu, A.; Villafafila-Robles, R. Pareto Optimal Reconfiguration of Power Distribution Systems Using a Genetic Algorithm Based on NSGA-II. Energies 2013, 6, 1439–1455. [Google Scholar] [CrossRef] [Green Version]
- Dongguan Electricity Price List. Available online: http://drc.gd.gov.cn/spjg/content/post_846130.html (accessed on 26 July 2010).
- Marom, R.; Amalraj, S.F.; Leifer, N.; Jacob, D.; Aurbach, D. A review of advanced and practical lithium battery materials. J. Mater. Chem. 2011, 21, 9938–9954. [Google Scholar] [CrossRef]
Figure 1.
Schematic diagram of benefits before and after the installation of ES.

Figure 2.
ES system optimization configuration solution process.

Figure 3.
Schematic diagram of electricity supply price for different contract years.

Figure 4.
User’s typical daily load curve.

Figure 5.
User’s load volatility–annual income relationship diagram.

Figure 6.
User’s purchase electricity price–contract period relationship diagram.


Table 1.
Partial support policy of user side energy storage (ES) in China.
| Policy Name | Content Focus |
|---|---|
| Guidance on promoting energy storage technology and industrial development [24]. | (1) The construction of distributed ES systems on the user side are encouraged, ES configuration by electricity sales companies with distribution network management rights and qualified residential users is supported in China. (2) ES is allowed to participate in electricity trading through the market-oriented way in China. |
| Notice on piloting market-based trading of distributed power generation [25]. | Distributed power generation projects to install ES facilities to improve power supply flexibility and stability are encouraged in China. |
| Opinions on innovation and improvement of the price mechanism for promoting green development [26]. | Market participants to sign trading contracts that include peak, valley and flat time prices and electricity are encouraged in China. |
Table 2.
Step price list in a certain area of Guangdong.
| Electricity Price Category | Flat Section Price | Valley Price | Peak Price | |
|---|---|---|---|---|
| Basic electricity price | Transformer capacity (Yuan/kVA.month) | 23.00 | ||
| Maximum demand (Yuan/kW.month) | 32.00 | |||
| Electricity price (Cent/kWh) | 60.84 | 30.42 | 100.39 | |
Table 3.
Step price list in a certain area of Guangdong.
| Time Division | Time Range |
|---|---|
| Peak | 09:00–12:00; 19:00–22:00 |
| Valley | 00:00–08:00 |
| Flat section | 08:00–09:00; 12:00–19:00; 22:00–24:00 |
Table 4.
Package price of different contract periods.
| Contract Period (Years) | 1 | 2 | 3 | 4 | 5 |
| Electricity Price (Yuan/kWh) | 1.37 | 1.07 | 0.96 | 0.91 | 0.88 |
| Contract Period (Years) | 6 | 7 | 8 | 9 | 10 |
| Electricity Price (Yuan/kWh) | 0.86 | 0.84 | 0.83 | 0.82 | 0.81 |
© 2019 by the authors. Licensee MDPI, Basel, Switzerland. This article is an open access article distributed under the terms and conditions of the Creative Commons Attribution (CC BY) license (http://creativecommons.org/licenses/by/4.0/).
Share and Cite
MDPI and ACS Style
Mu, Q.; Gao, Y.; Yang, Y.; Liang, H. Design of Power Supply Package for Electricity Sales Companies Considering User Side Energy Storage Configuration. Energies 2019, 12, 3219. https://doi.org/10.3390/en12173219
AMA Style
Mu Q, Gao Y, Yang Y, Liang H. Design of Power Supply Package for Electricity Sales Companies Considering User Side Energy Storage Configuration. Energies. 2019; 12(17):3219. https://doi.org/10.3390/en12173219
Chicago/Turabian StyleMu, Qitian, Yajing Gao, Yongchun Yang, and Haifeng Liang. 2019. "Design of Power Supply Package for Electricity Sales Companies Considering User Side Energy Storage Configuration" Energies 12, no. 17: 3219. https://doi.org/10.3390/en12173219
Note that from the first issue of 2016, this journal uses article numbers instead of page numbers. See further details here.