Influence Factors on Carbon Monoxide Accumulation in Biomass Pellet Storage
by
 , , and
José Ignacio Arranz
 ,
,
María Teresa Miranda
*,
Irene Montero
,
Sergio Nogales
 and
and
Francisco José Sepúlveda
Department of Mechanical, Energy and Materials Engineering, School of Industrial Engineering, Avda. Elvas s/n, 06006 Badajoz, Spain
*
Author to whom correspondence should be addressed.
Energies 2019, 12(12), 2323; https://doi.org/10.3390/en12122323
Submission received: 3 May 2019
/
Revised: 11 June 2019
/
Accepted: 13 June 2019
/
Published: 18 June 2019
(This article belongs to the Section B: Energy and Environment)
Abstract
:During biomass storage, some gases can be produced and reach dangerous levels to human health. Among them, carbon monoxide is especially worrying, due to its potentially lethal effects and its contribution to the greenhouse effect. High levels of this gas could be reached, depending on many factors, such as unsuitable ventilation in storage areas or raw material characteristics. The aim of this research study was to assess the levels of CO produced during pellet storage at a laboratory scale, depending on the ventilation conditions (changing the amount of sample and frequency), the pellet characteristics (eucalyptus and cork residue pellets), and variables that influence CO levels. A greater number of pellets (when not ventilated) increased CO levels and discontinuous ventilation did not reduce these levels once the space was isolated again. Cork samples provoked higher CO emissions, possibly due to its higher fat content and surface area, which promotes the interaction between air and fatty acids (that is, the auto-oxidation of the samples and the subsequent release of CO). Consequently, continuous and good ventilation is required, especially until CO production from wood auto-oxidation is complete.
1. Introduction
Most studies about gas emissions in solid biofuels are focused on their combustion, concerning both environmental and health issues. Therefore, greenhouse gases produced during biomass combustion and pyrolysis have been widely studied [1,2,3,4,5,6]. However, pollutants can be released by other means, not only by thermal degradation. Some gases, although at lower levels, are also off-gassed during their storage as a result of chemical and/or biological processes, such as auto-oxidation of fatty acids [7,8,9,10,11]. Among them, carbon monoxide (CO) should be taken into account due to its harmful characteristics to users and workers that carry out maintenance tasks [6]. As a matter of fact, certain fatal accidents due to CO inhalation have been reported in maintenance workers [8].
CO is an odorless and colorless gas (which makes it unnoticeable) that is produced in the combustion process, and also in the decomposition of organic matter, which is a common mechanism during wood storage [12]. The health risks related to its inhalation are well-known [7]. CO replaces oxygen, joining hemoglobin. This replacement drastically reduces the oxygen supply to vital organs, with the subsequent fatal effects [13,14]. Knowing that CO is produced during wood storage, the existing studies show that CO generation in wood pellets is possibly due to spontaneous auto-oxidation of fatty acids in the wood [15].
Experimental data shows that even small quantities of stored pellets are enough to generate lethal levels of CO in confined spaces, even though oxygen levels were normal [8]. Huang et al. connected gas emission during storage with certain variables, such as the oxygen quantity, headspace [16], temperature, and relative humidity [17]. In these cases, the influence of these parameters was important to assess and control CO levels. Other authors have studied several kinetic models to predict gas emissions during pellet storage [18] or shipping [19,20] and their possible connection with certain variables in order to thoroughly understand the formation of this compound and avoid its accumulation in confined spaces. Although CO does not contribute directly to the greenhouse effect, it is important from an environmental point of view as it has an influence on OH radicals and its amount affects, indirectly, to the formation of other greenhouse gases, such as methane and the tropospheric ozone.
Most studies about CO generation during pellet storage (aforementioned) have been carried out with commercial products (coniferous woody pellets, mainly), and, therefore, the analysis of other raw materials could be interesting.
Eucalyptus wood is abundant in the southwest of the Iberian Peninsula. It is estimated that there is about 71,000 ha of this kind of tree in the region of Extremadura (Spain) [21], but it is less and less used due to the low activity of the paper industry in this area. Because of that, the use of eucalyptus wood is becoming more important for densified solid biofuel production. Similarly, waste from cork (biomass from forest industry) is increasingly used for energy purposes, either to produce pellets or directly as biofuel in industrial boilers for water heating or steam generation [22]. However, there are no studies about CO generation during the storage of these by-products.
In this research work, CO emissions off-gassing from stored pellets made of cork and eucalyptus were analyzed, assessing different influence factors (especially ventilation conditions).
2. Materials and Methods
2.1. Pellet Manufacture and Its Characterization
2.1.1. Pelletizing
In order to carry out this study, two different pellets were manufactured. The raw materials were eucalyptus waste obtained after pruning and cork powder waste from local cork industries, both from the Extremadura region (Spain).
Once collected, the samples were carried to the laboratory and stored at room temperature in air-permeable textile silos to prevent fermentation and degradation. Afterward, the particle size of both materials was homogenized by grinding, using a hammer refiner (CIP Line SG 40, 5.5 kW, Vezza D’Alba, Italy). The mesh size used was 5 mm.
The materials were pelletized by using a pelletizer with a rotative flat die (Kovo Novak, MGL 200, 8.5 kW, Citonice, Czech Republic), with a pelletizing capacity of 75 kg·h−1 for this type of pellets. The flat horizontal die has 6 mm diameter holes. The rollers rotate around their longitudinal axis on top of the flat die’s surface, generating high pressure in the raw material and forcing it through the holes, making its compaction possible and the pellets are obtained, reaching temperatures around 70–80 °C (similar in both kinds of pellets). The resulting pellets were similar in size and cooled down in a cooling drum. The surplus product (dust) returned to the feeding hopper. These pellets were cooled to room temperature.
2.1.2. Proximate Analysis and Ultimate Analysis
2.2. Sample Pellet Storage
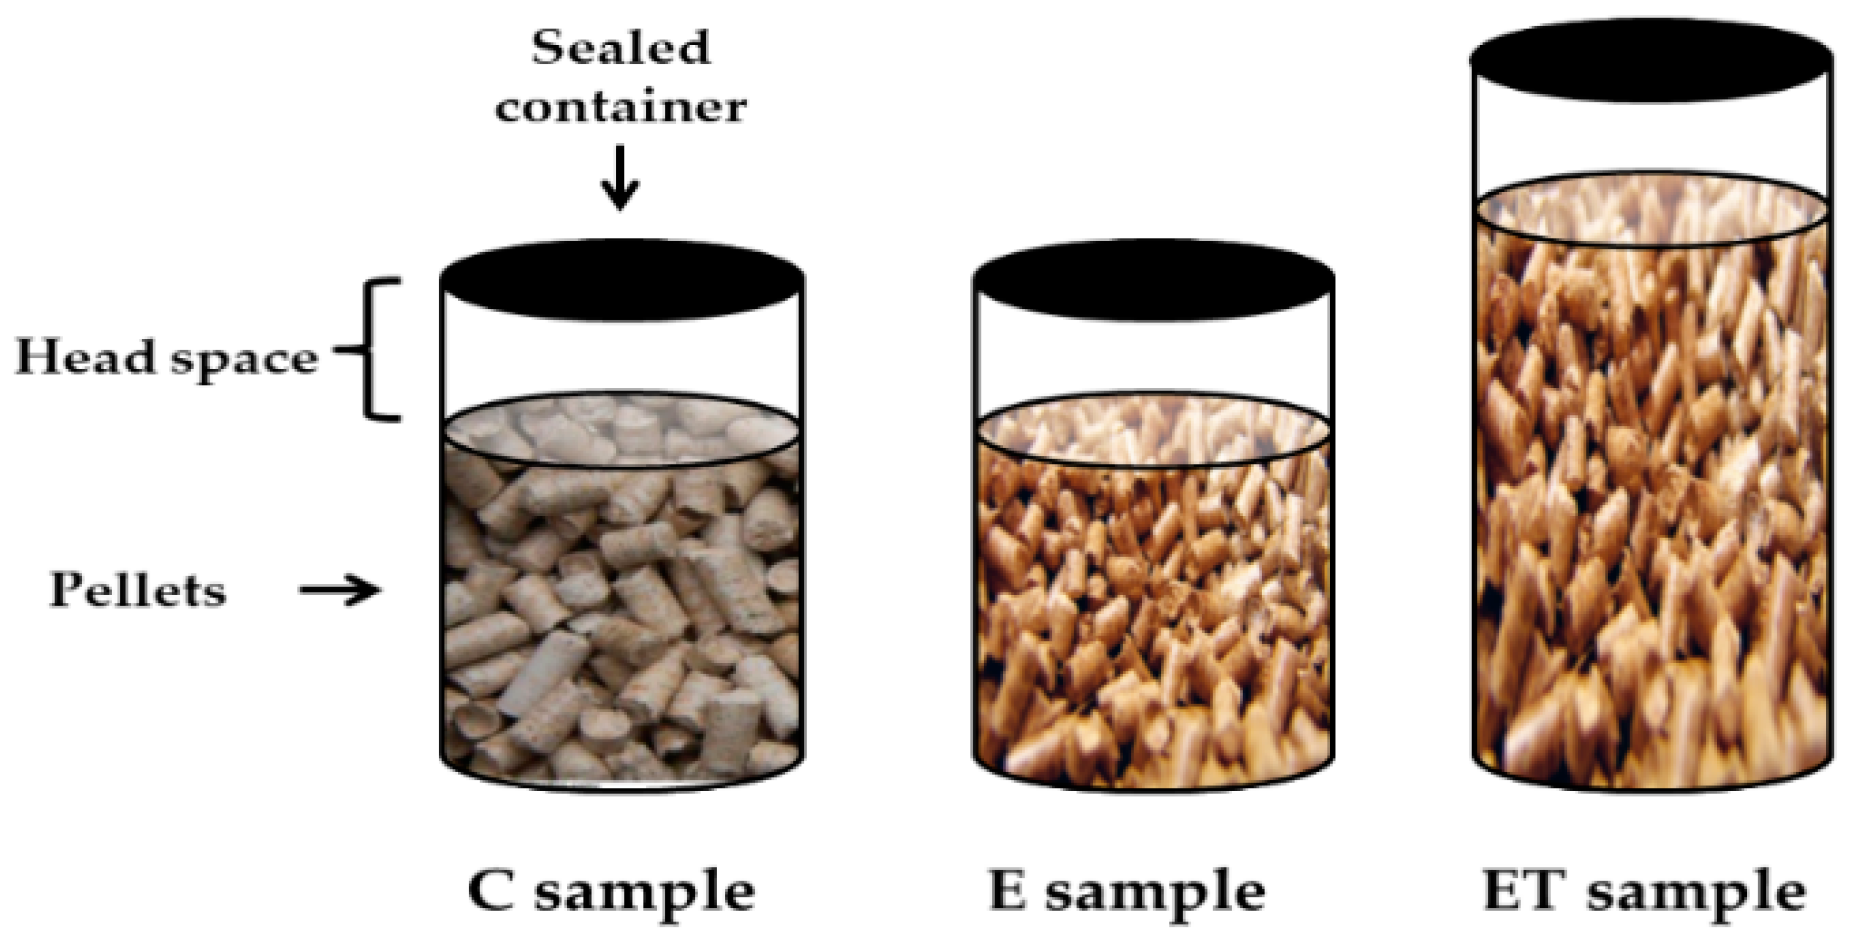
After their manufacture, the pellets were stored (at room temperature: 23–25 °C, approximately) in sealed containers of different capacity, obtaining three kinds of samples. The headspace was the same in all cases (500 mL). Thus, the three types of samples were the following (see Figure 1 and Table 2):
- E: Eucalyptus pellets in 1-L containers;
- ET: In order to check the influence of sample quantity, the same eucalyptus pellets were stored in 2-L containers, keeping the same headspace.
- C: Cork powder pellets in 1-L containers. This different kind of pellet was selected to study the influence of raw materials on CO generation (comparing to the E samples).
2.3. Fat Content
As stated previously, some studies showed that CO generation was due to auto-oxidation of fatty acids contained in the raw material. In order to assess this fact, the fat content in both by-products was analyzed, both for the powder of these samples and the pellets obtained. The analysis was as follows: 50 g of sample (powder or pellet) was dissolved in 200 mL of hexane. The organic matter of the samples, including fatty acids, dissolves in hexane. Once the hexane was filtered and removed, the amount of fat in the sample was obtained using Equation (1):
with Mr being the residual mass obtained (expressed in grams) and M being the initial mass of the sample before extraction (in grams).
This test was performed three times for each sample. There were no significant changes between each test. The arithmetic mean is shown.
2.4. CO Determination
For the selected samples, the CO concentration was measured for each container with a Testo 350 XL gas analyzer (SE&Co.KGaA, Lenzkirch, Germany). This equipment consisted of a control unit and a testing machine. The connection between them was through plug-in connections. For CO measurements, a probe with an IR sensor was used, with a range of 0–10,000 ppm and a resolution of 1 ppm. The equipment has a suction pump that works with flow rates between 0.5 and 1 L·min−1. Each measurement lasted 10 min, extracting air from the headspace of each sample. The results, showing the maximum CO levels, were expressed in ppm.
2.5. Ventilation Experiments
Concerning different ventilation regimes, two different experiments for each kind of sample were performed (see Table 3):
- CO evolution without air renewal in an airtight container (Experiment 1). One single measurement was carried out for each sample, removing this sample after that.
- CO evolution with air renewal (Experiment 2). One single sample from each kind of material was selected when CO generation was stabilized (that is, 185 h after manufacture) in airtight conditions. Then several air renewals were done, measuring CO levels after sealing the same sample for 72 h.
2.6. Occupational Exposure Limits Standards.
There are limit values for occupational exposure for CO that should be avoided. Some of them are shown in Table 4.
Once the maximum values for CO were obtained, they were compared with these limits.
2.7. Scanning Electron Microscopy
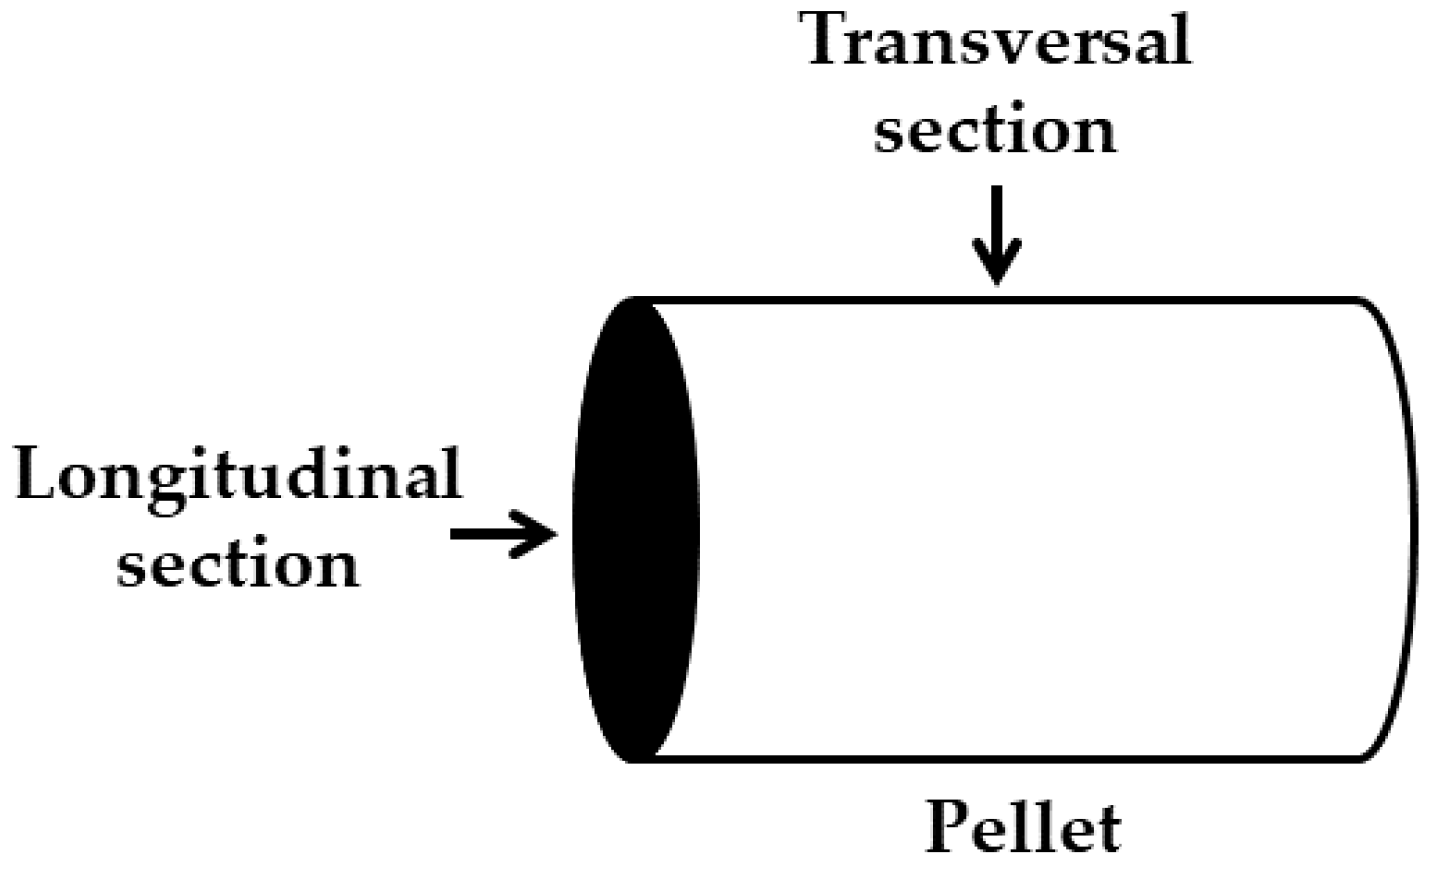
In order to assess, qualitatively, the area that was really exposed to air, microscopic digital photography was taken for the eucalyptus and cork waste pellets. The images of the pellets were obtained by scanning electron microscopy (SEM), using a Hitachi FE-SEM S-4800II microscope (Tokyo, Japan). Two different kinds of pictures were obtained: One from the transversal section and the other from the longitudinal section, as it can be seen in Figure 2.
3. Results and Discussion
3.1. Proximate and Ultimate Analysis
The main characteristics of the eucalyptus and cork pellets are shown in Table 5. The pellets were stored at room temperature, as explained in Section 2.1.1.
The main characteristics of the two by-products obtained were similar to the results found in the literature for eucalyptus [35,36] and cork wastes [37]. In this research work, the moisture levels were low, especially for the cork pellets. The ash content was slightly high in both cases. This could be due to the fact that the eucalyptus bark was not removed and the cork wastes included the external part, which contains more impurities than the inner part.
The carbon percentage was higher in the cork waste (51.00%) than in the eucalyptus pellets (44.40%). This fact could be important when it comes to CO generation. The N and S levels were low in both cases, so polluting emissions derived from these elements were avoided. It should be pointed out that both durability and bulk density was higher in the cork pellets than in eucalyptus, implying higher quality of the former.
3.2. Fat Content
Table 6 shows the results of fat content for the analyzed samples (both powder and pellet).
The fat content was much higher in the case of the cork waste, especially for the powder. This could imply, therefore, a higher amount of fatty acid for these samples, compared to eucalyptus.
On the other hand, other factors such as moisture content, temperature and the fatty acid profile of each kind of wood could have an influence on the process. Then, the higher concentration of fatty acid in the raw material could influence the whole CO process, depending on its chemical structure and auto-oxidation kinetics. It was observed that the fat content of the pelleted products was lower than the original residues in both cases. This was due to two factors: On the one hand, to the loss of light volatiles caused by the temperature rise in the pelletizing process, and on the other hand, to less effectiveness in the extraction process executed in the experiment, due to the reduction of hexane penetration.
3.3. CO Concentration
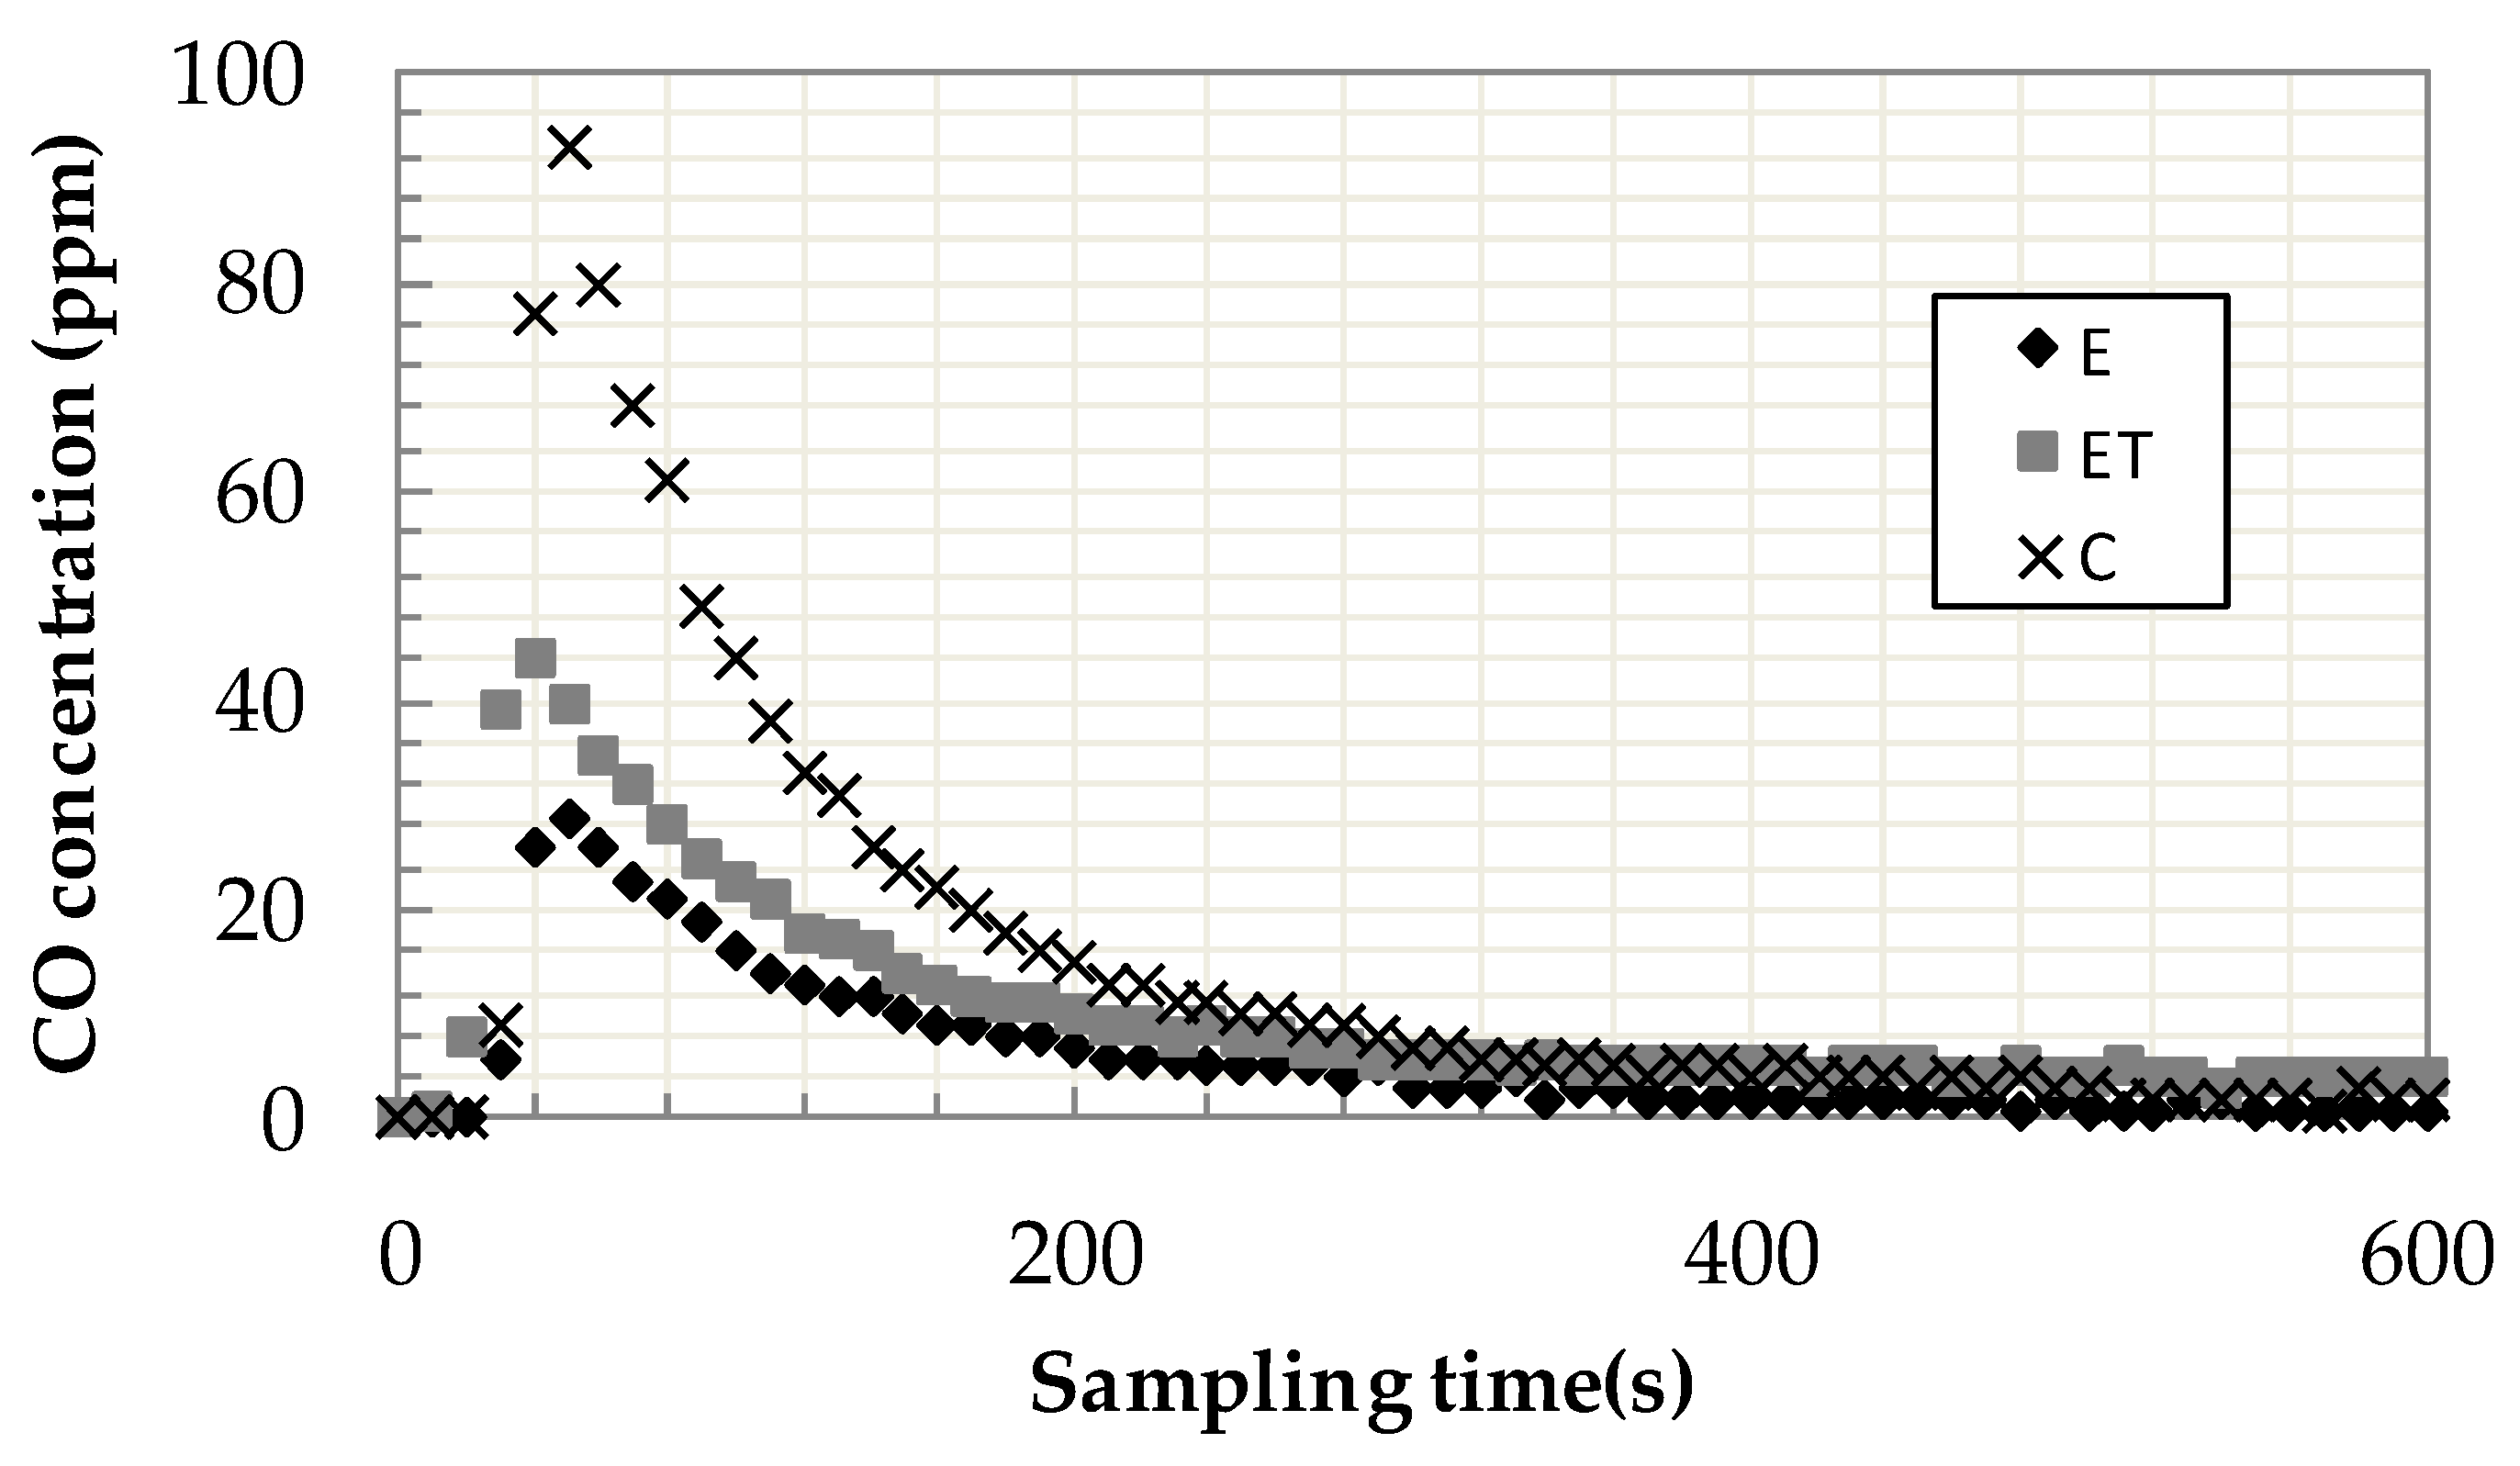
The results are shown in the following Figures. Figure 3 shows CO concentration for each sample during the sample collection (in experiment 1), to determine the maximum CO levels for each headspace in the sample. The sampling time refers to the time that the probe was within the vessels during the measurement.
In the case of the E samples, Figure 3 shows that the CO concentration increased up to a maximum (in this case at 29 ppm, after 45 h of storage without air renewal) from which it decreased to negligible values. This was due to the measurement system. The CO concentration was diluted due to the air entrance in the container when sampling (avoiding as much as possible this fact). This was the reason why different containers were chosen to measure the rest of the sealed samples, as it was a destructive detection system and the samples could not be reused.
3.3.1. CO Concentration without Air Renewal
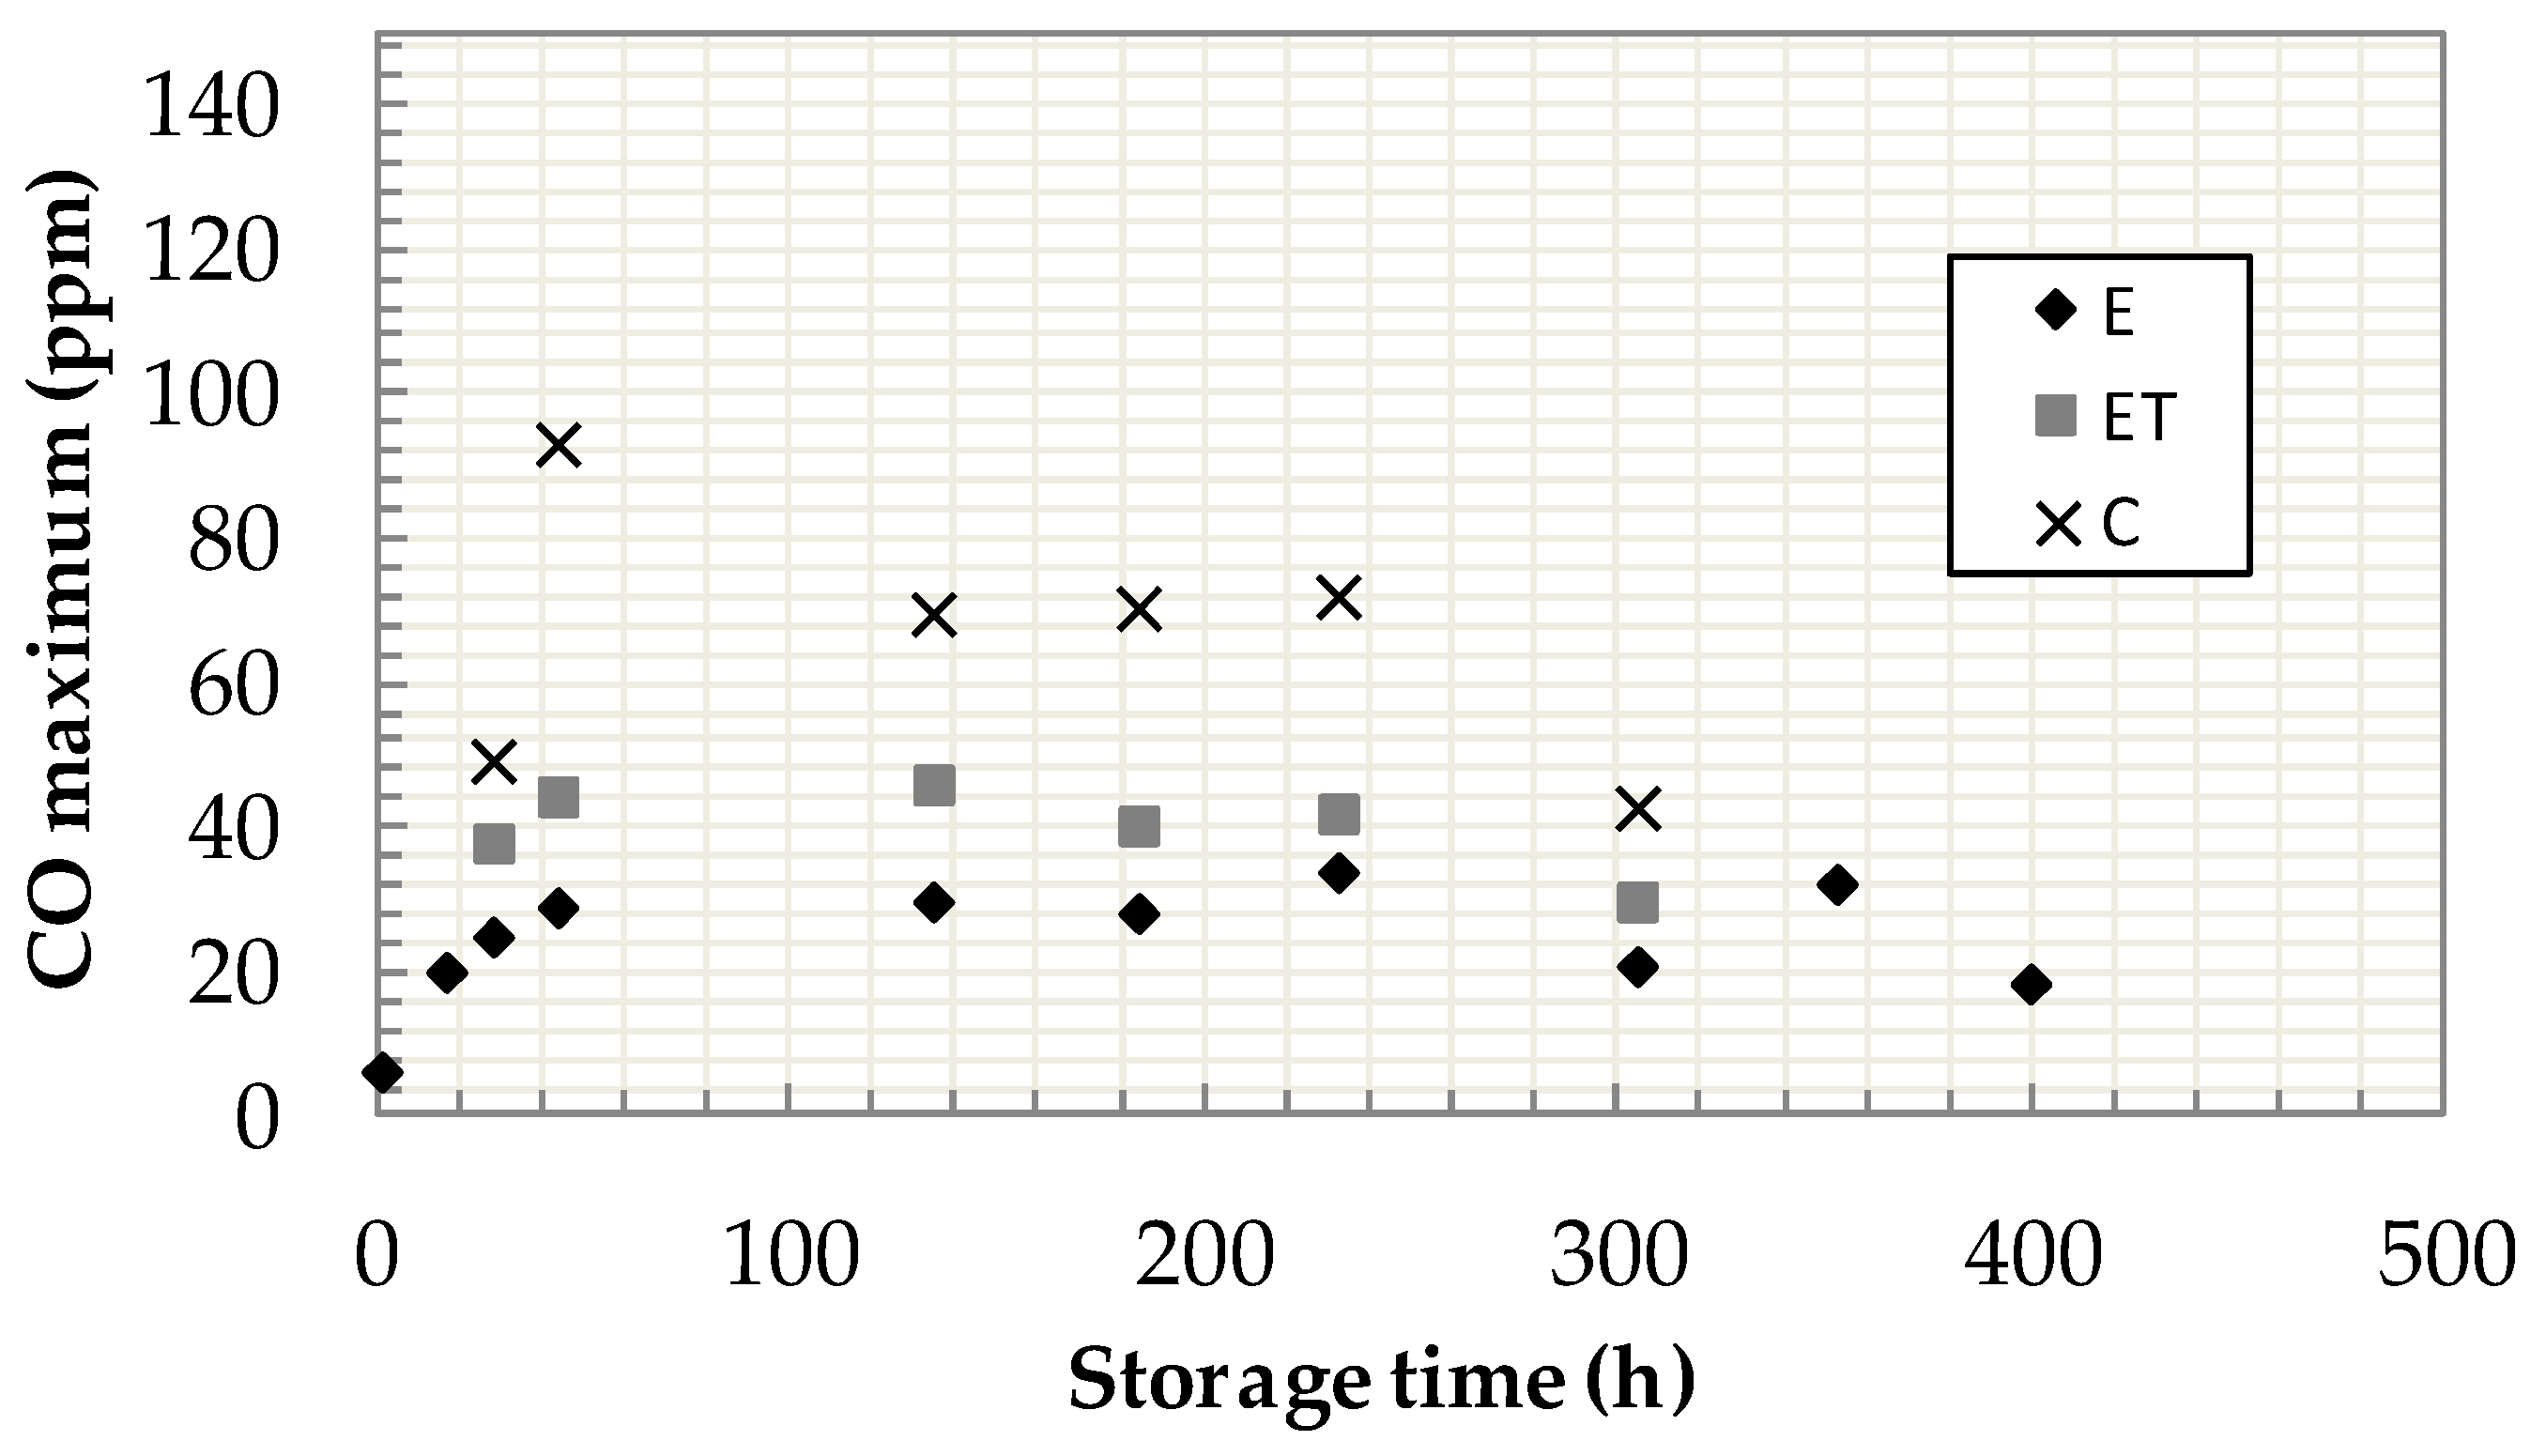
Figure 4 shows the maximum CO levels over time, in non-ventilation conditions for each sample (experiment 1).
In the case of the E samples, it could be observed that, at the initial storage stages, the CO concentration was low, but increased considerably as the storage was longer. Thus, a stable value was reached after 185 h. Some authors have pointed out the important role of temperature in CO emissions during storage. Although the pellet samples were stored at room temperature, they reached high temperatures in the manufacturing process. Therefore, a certain amount of light volatiles, including fats, was released. This fact could explain the initial and significant rise in CO [38,39]. After 185 h, the CO concentration decreased slowly. The same behavior, at similar times, was observed by other authors [38]. This could be due to the fact that the stored pellets decomposed their organic matter and were not able to generate more CO, possibly on account of oxygen depletion.
3.3.2. CO Concentration with Air Renewal
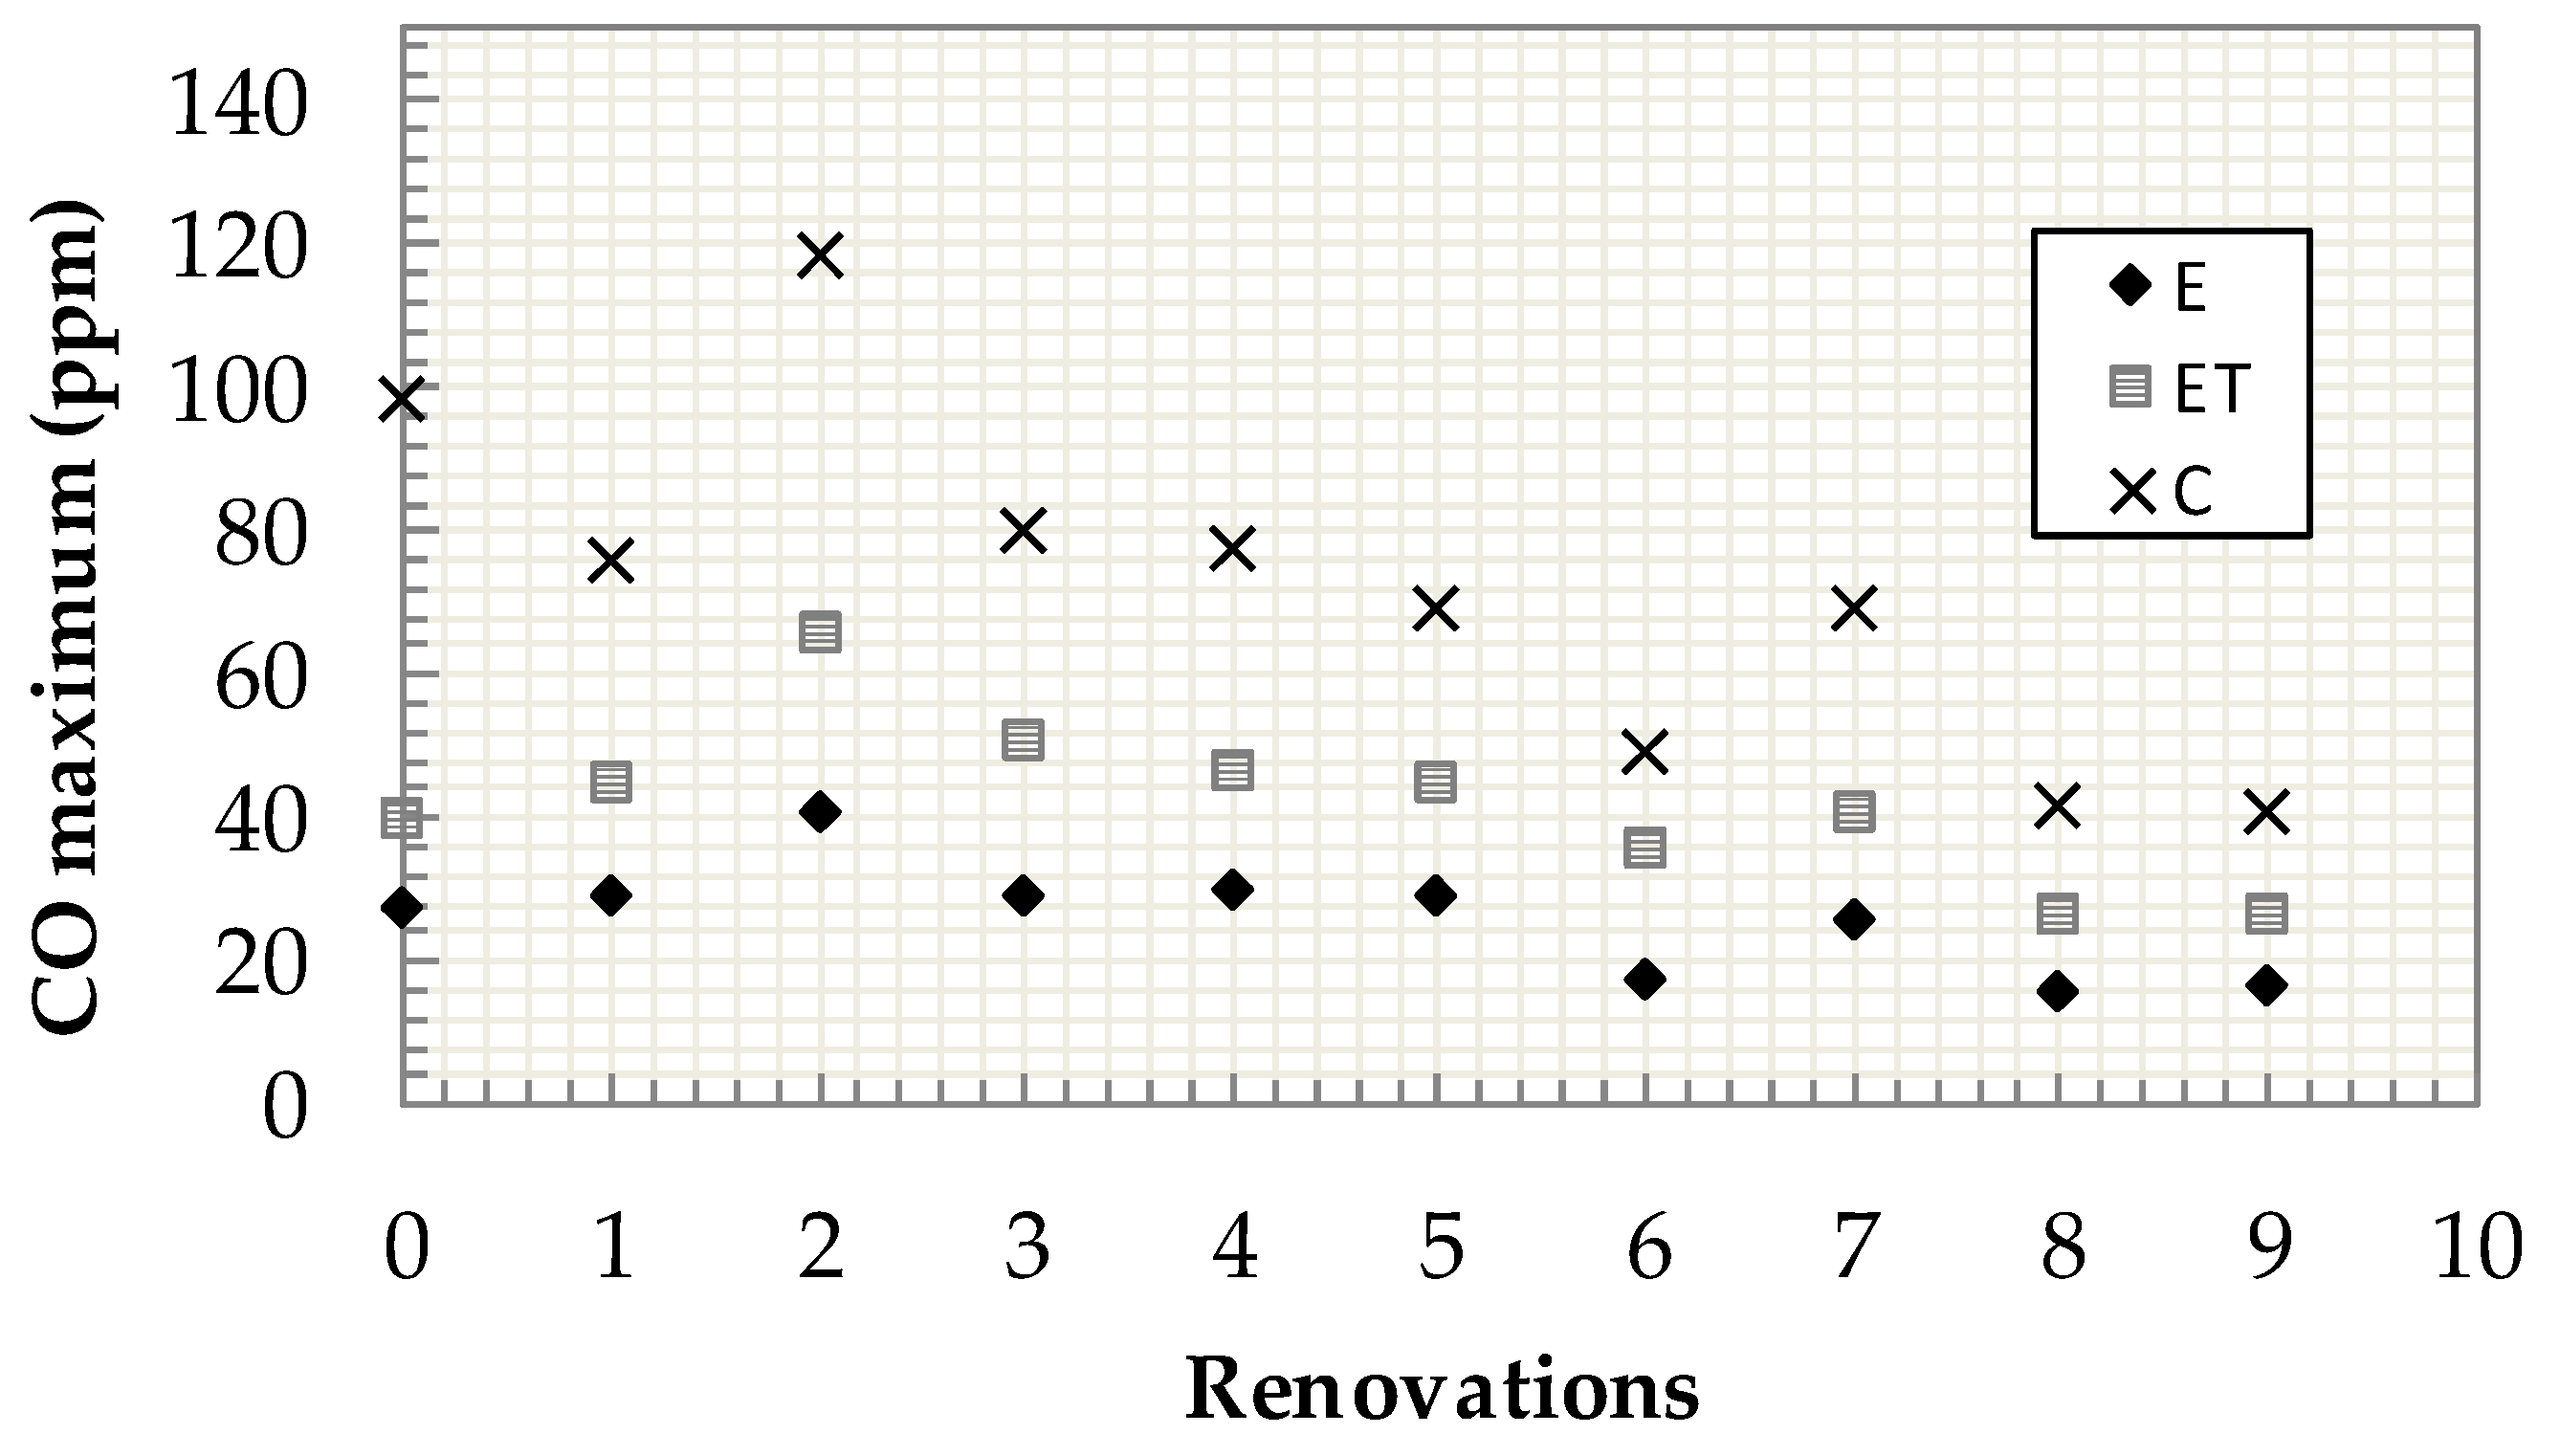
Figure 5 shows the maximum CO levels after 72 h, for each sample and its corresponding air renewal (experiment 2).
It could be observed that the trend of CO maximums was similar to the case of the sealed containers. Nevertheless, the values for air renewal were slightly higher. Therefore, air renewal could imply higher CO generation, possibly due to the oxygen supply to auto-oxidation of fatty acids. When ventilation took place, the exhausted atmosphere in the sealed containers could renew air and oxygen, making the CO generation more intense.
For the ET samples (2-L containers for the eucalyptus pellets), the same headspace volume was obtained with a greater number of pellets (that is, the free-volume/mass ratio was reduced). It can be observed that the profiles and trends were similar to the E samples, but the emissions were approximately 45% higher. It could be considered, therefore, that higher amounts of pellets, even though with the same headspace (that is, the free space between the pellets and the top of the container), will generate higher CO concentrations. This could be explained by the fact that auto-oxidation of fatty acids is a balanced reaction and addition of excess reagent tends to shift the reaction balance to the right, that is, to generate more products.
Regarding the cork samples, a similar trend was observed for the eucalyptus sample regarding the CO concentration, as could be observed in the 1-L containers. However, the CO generation was higher. Thus, the raw material composition, especially with regard to fatty acids, could play an important role when it comes to auto-oxidation and the subsequent CO emission during storage [40]. In this case, the drop in CO generation versus storage time was higher than for the eucalyptus samples, where this decrease was more gradual. In the case of the cork pellets, there seemed to be more intensive CO generation at initial stages, completing the auto-oxidation process in shorter periods compared to eucalyptus pellets. The higher fat content (and possibly the fatty acid content) of cork, compared to eucalyptus, could explain this fact [41,42,43].
3.4. Limit Value for Occupational Exposure
The values obtained exceeded, in any case, the 20 ppm limit, but not 30 ppm in all cases. Consequently, the workers that should carry out maintenance tasks on an ongoing basis in storage silos of pellets that are similar to those studied in this research work must wear some kind of respiratory protection.
The 100 ppm limit was exceeded only in one of the experiments with the cork waste pellets and air renewal. Therefore, maintenance workers performing tasks in storage silos for short periods of time must pay attention.
3.5. Scanning Electron Microscopy
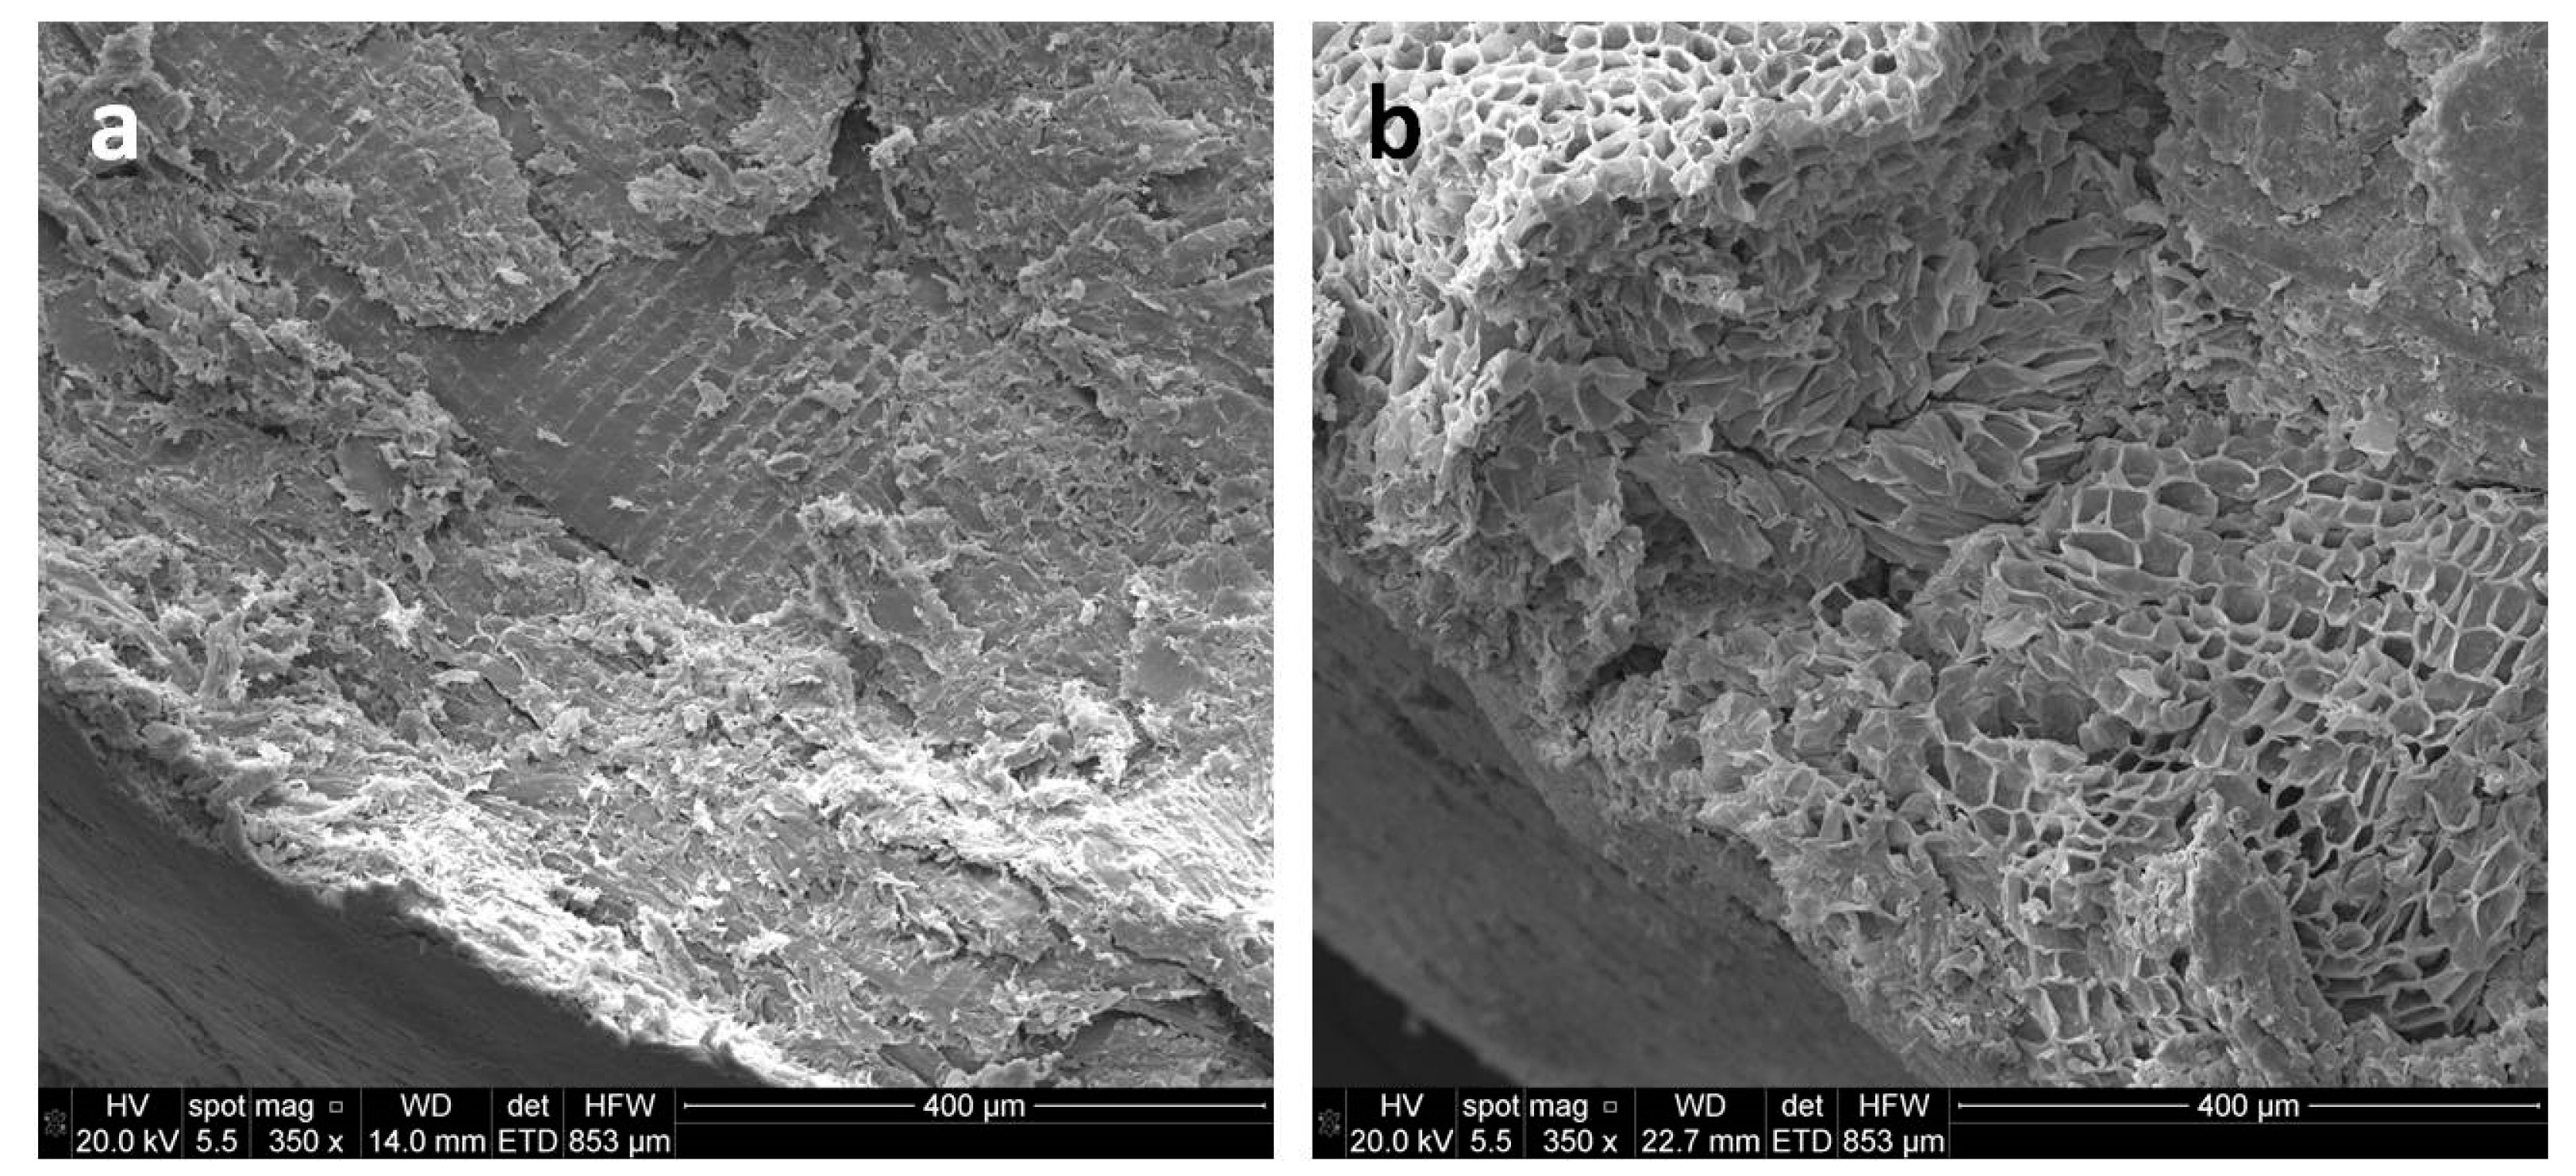
Figure 6 and Figure 7 show SEM images for the transversal and longitudinal sections (see Figure 2) of the eucalyptus (a) and cork (b) wastes, respectively. The SEM images showed that the surface of the eucalyptus pellets was less rough than the surface of cork pellets. In Figure 6, for the transversal section, clear differences can be observed. In the case of cork (Figure 6b) some cell structures were perceived. This implies that the exposed surface was higher, promoting auto-oxidation.
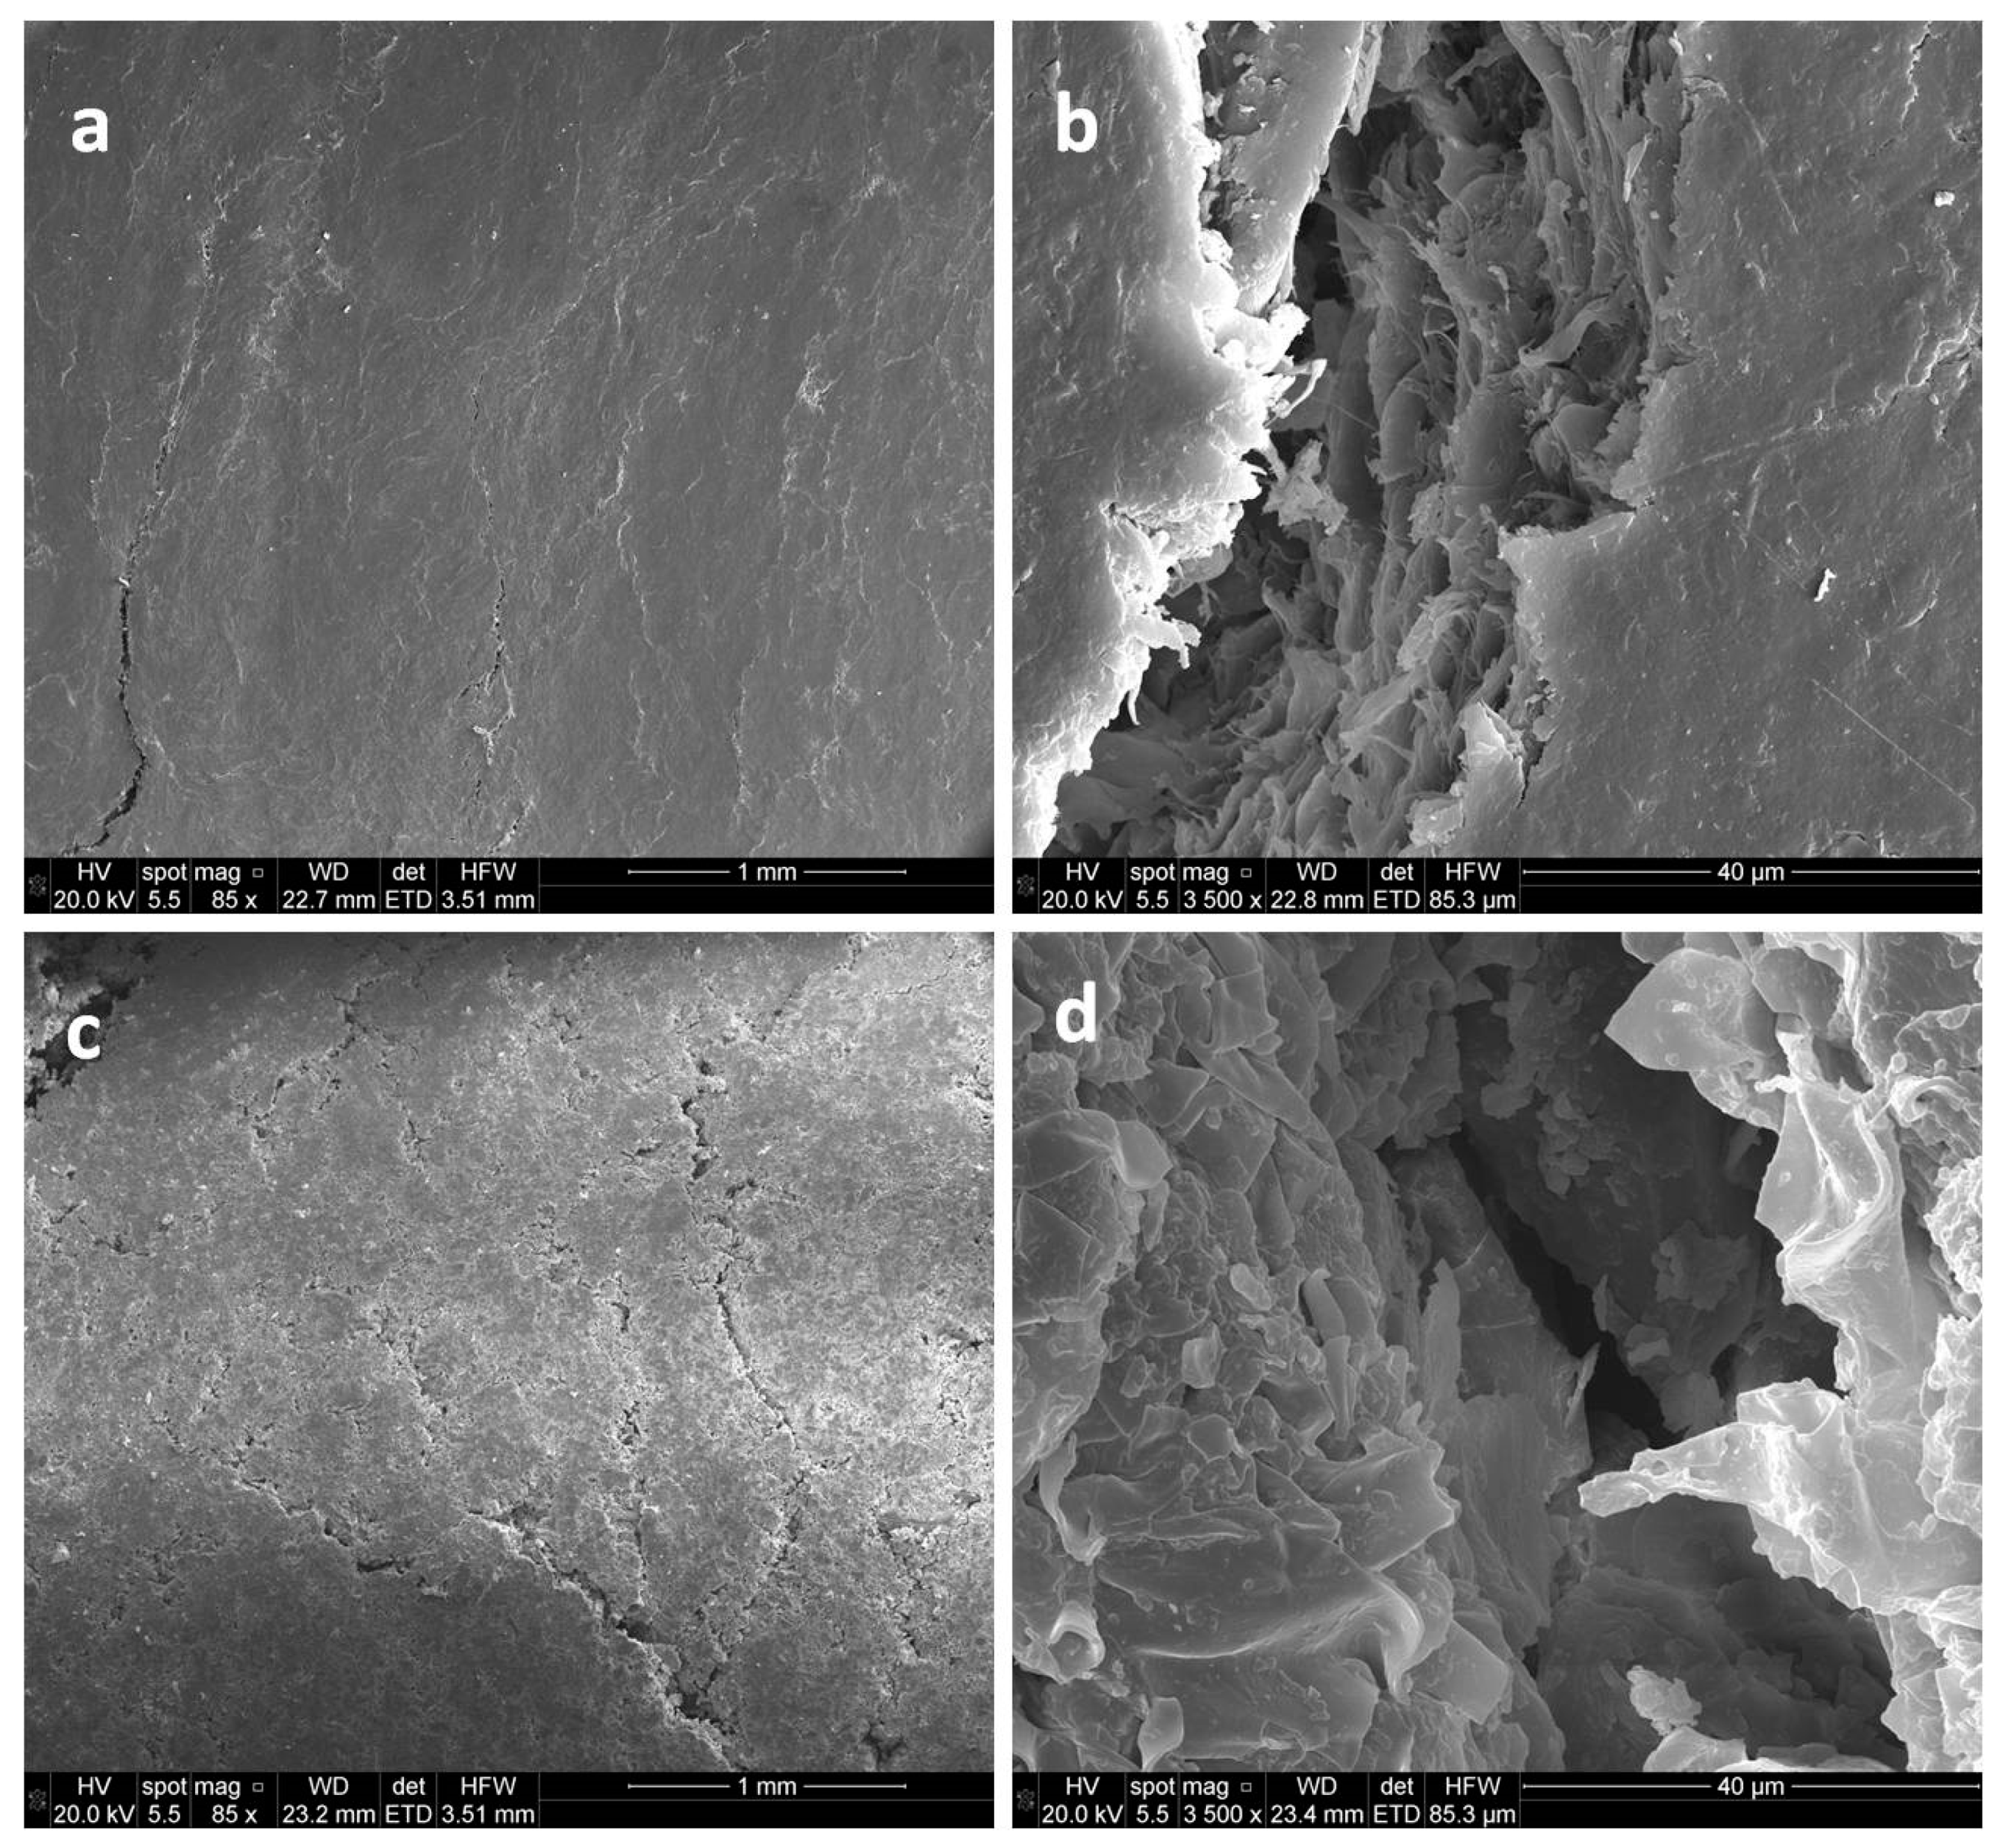
In Figure 7, the longitudinal section of pellets can be observed. The eucalyptus pellets (Figure 7a,b) presented fewer and more superficial crevices compared to cork pellets (Figure 7c,d). This fact could contribute to the higher surface area in contact with air for the cork pellets.
In such a way, and taking into account that auto-oxidation of fatty acids in wood depends on the availability of fatty and oxygen, the surface area could play an important role in CO production. The higher the surface area is, the more available the fatty acid is. Therefore, oxygen could interact more actively with wood and, subsequently, with its fatty acids. This could explain the higher CO emissions for the cork pellets in the same experimental conditions.
3.6. General Considerations
The surface could play an important role when it comes to CO generation as, according to the literature, CO levels in storage containers are strongly dependent on some physical properties such as bulk density and porosity [36].
Finally, it was proved that continuous ventilation is highly advisable to avoid high CO concentrations. The CO emissions decreased once ventilation took place, allowing the completion of auto-oxidation. This way, the initial storage stages are especially dangerous, and extremely careful ventilation is needed. Indeed, pre-cooling after pellet manufacture is highly advisable, to avoid an increase in CO levels due to high temperatures during pellet storage. However, auto-oxidation is a long process and safety measurements, such as CO detectors and continuous air renewal, are recommended during the whole storage.
In any case, in order to guarantee the optimum pellet quality, several factors such as humidity or temperature should be taken into account, especially to avoid moisture accumulation, which could worsen the pellet quality.
4. Conclusions
In this study, the influence of different factors related to CO emissions off-gassing from stored pellets was analyzed. The main findings of this study were the following:
- The different raw materials implied different CO emissions. In this case, the cork waste generated, under the same conditions, higher CO emissions than the eucalyptus pellets. This could be possibly due to its fatty acid distribution and its higher porosity, which makes the interaction of oxygen with fatty acids in wood easier, promoting its auto-oxidation. The concentration of elemental C (total) is also important because it is higher in cork waste samples.
- The amount of stored biomass to air quantity ratio was crucial to CO emissions. Higher amounts of the pellets, despite presenting the same headspace, produced higher CO emissions.
- According to the data, ventilation is highly advisable during pellet storage, especially at initial stages and up until auto-oxidation of wood is complete. During this stage, failure in ventilation could imply a dramatic increase in CO levels, even with lethal effects. However, the air flow to guarantee ventilation in confined spaces should be mild in order to avoid moisture in pellets, which could worsen their quality for energy use. Depending on the climate, different actions could be carried out to avoid this problem.
- The CO values obtained in this study exceed the legal exposure limits according to several regulations. Therefore, workers that carry out maintenance tasks in silos with similar raw materials should take protective measures.
- To sum up, continuous ventilation is highly advisable during pellet storage according to the findings in this study. Single initial ventilation was not enough and should be avoided. Ventilation ensured that CO was removed, but once the samples were isolated, its generation continued (decreasing its levels slightly for each consecutive air renewal). Therefore, auto-oxidation is a long process. This fact should be taken into account when designing ventilation equipment.
Author Contributions
All the authors contributed to the experimental design and the analysis of the results. J.I.A., F.J.S. and I.M. carried out the pelletizing test, whereas S.N., T.M. performed the CO emission tests.
Funding
This research was funded by Junta de Extremadura, grant number GR18137 and IB18083.
Acknowledgments
The authors would like to thank the Junta de Extremadura for its support through the aid for research groups (GR18137) and for the support of research, development and innovation projects in the Extremadura Region (IB18083). The authors also thank to technical and human support provided by Facility of Analysis and Characterization of Solids and Surfaces of SAIUEx (financed by UEx, Junta de Extremadura, MICINN, FEDER and FSE) for their assistance to work with SEM.
Conflicts of Interest
The authors declare no conflicts of interest.
References
- Gudka, B.; Jones, J.M.; Lea-Langton, A.R.; Williams, A.; Saddawi, A. A review of the mitigation of deposition and emission problems during biomass combustion through washing pre-treatment. J. Energy Inst. 2016, 89, 159–171. [Google Scholar] [CrossRef]
- Park, S.S.; Yu, J. Chemical and light absorption properties of humic-like substances from biomass burning emissions under controlled combustion experiments. Atmos. Environ. 2016, 136, 114–122. [Google Scholar] [CrossRef]
- Kijo-Kleczkowska, A.; Sroda, K.; Kosowska-Golachowska, M.; Musiał, T.; Wolski, K. Combustion of pelleted sewage sludge with reference to coal and biomass. Fuel 2016, 170, 141–160. [Google Scholar] [CrossRef]
- Mitchell, E.J.S.; Lea-Langton, A.R.; Jones, J.M.; Williams, A.; Layden, P.; Johnson, R. The impact of fuel properties on the emissions from the combustion of biomass and other solid fuels in a fixed bed domestic stove. Fuel Process. Technol. 2016, 142, 115–123. [Google Scholar] [CrossRef]
- Miranda, T.; Román, S.; Montero, I.; Nogales-Delgado, S.; Arranz, J.I.; Rojas, C.V.; González, J.F. Study of the emissions and kinetic parameters during combustion of grape pomace: Dilution as an effective way to reduce pollution. Fuel Process. Technol. 2012, 103, 160–165. [Google Scholar] [CrossRef]
- Bartington, S.E.; Bakolis, I.; Devakumar, D.; Kurmi, O.P.; Gulliver, J.; Chaube, G.; Manandhar, D.S.; Saville, N.M.; Costello, A.; Osrin, D.; et al. Patterns of domestic exposure to carbon monoxide and particulate matter in households using biomass fuel in Janakpur, Nepal. Environ. Pollut. 2017, 220, 38–45. [Google Scholar] [CrossRef] [PubMed]
- Alakoski, E.; Jämsén, M.; Agar, D.; Tampio, E.; Wihersaari, M. From wood pellets to wood chips, risks of degradation and emisions from the storage of woody biomass. Renew. Sustain. Energy Rev. 2016, 54, 376–383. [Google Scholar] [CrossRef]
- Gauthier, S.; Grass, H.; Lory, M.; Krämer, T.; Thali, M.; Bartsch, C. Lethal carbon monoxide poisoning in wood pellet storerooms—two cases and a review of the literature. Ann. Occup. Hyg. 2012, 56, 755–763. [Google Scholar]
- Jämsén, M.; Agar, D.; Alakoski, E.; Tampio, E.; Vihersaari, M. Measurement methodology for greenhouse gas emissions from storage of forest chips—A review. Renew. Sustain. Energy Rev. 2015, 51, 1617–1623. [Google Scholar] [CrossRef]
- Wihersaari, M. Evaluation of greenhouse gas emission risks from storage of wood residue. Biomass Bioenergy 2005, 28, 444–453. [Google Scholar] [CrossRef]
- Krigstin, S.; Wetzel, S. A review of mechanisms responsible for changes to stored woody biomass fuels. Fuel 2016, 175, 75–86. [Google Scholar] [CrossRef]
- Curci, M.J. Procurement, Process and Storage Techniques for Controlling Off-Gassing and Pellet Temperatures; Indeck Energy Biofuel Center: Buffalo Grove, IL, USA, 2010. [Google Scholar]
- Cho, C.; Chiu, N.; Ho, C.; Peng, C. Carbon monoxide poisoning in children. Pediatr. Neonatol. 2008, 49, 121–125. [Google Scholar] [CrossRef]
- Raub, J.A. Health effects of exposure to ambient carbon monoxide. Chemosph. Global Change Sci. 1999, 1, 331–351. [Google Scholar] [CrossRef]
- Kuang, X.; Shankar, T.J.; Bi, X.T.; Sokhansanj, S.; Lim, C.J.; Melin, S. Characterization and kinetics study of off-gas emission from stored wood pellets. Ann. Occup. Hyg. 2008, 52, 675–683. [Google Scholar] [PubMed]
- Kuang, X.; Shankar, T.J.; Sokhansanj, S.; Lim, C.J.; Bi, X.T.; Melin, S. Effects of headspace volume ratio and oxygen level on off-gas emissions from stored wood pellets. Ann. Occup. Hyg. 2009, 53, 807–813. [Google Scholar] [PubMed]
- Kuang, X.; Shankar, T.J.; Bi, X.T.; Lim, C.J.; Sokhansanj, S.; Melin, S. Rate and peak concentrations of off-gas emissions in stored wood pellets—Sensitivities to temperature, relative humidity and headspace volume. Ann. Occup. Hyg. 2009, 53, 789–796. [Google Scholar]
- Fan, C.; Bi, X.T. Development of off-gas emission kinetics for stored wood pellets. Ann. Occup. Hyg. 2013, 57, 115–124. [Google Scholar]
- Pa, A.; Bi, X.T. Modelling of off-gas emissions from wood pellets during marine transportation. Ann. Occup. Hyg. 2010, 54, 833–841. [Google Scholar]
- Svedberg, U.; Petrini, C.; Johanson, G. Oxygen depletion and formation of toxic gases following sea transportation of logs and wood chips. Ann. Occup. Hyg. 2009, 53, 779–787. [Google Scholar]
- Pulido, F.; Sanz, R.; Abel, D.; Ezquerra, J.; Gil, A.; González, G.; Hernández, A.; Moreno, G.; Pérez, J.J.; Vázquez, F.M.; et al. Los Bosques en Extremadura. Evolución, Ecología y Conservación; Consejería de Industria, Energía y Medio Ambiente, Junta de Extremadura: Mérida, Spain, 2007; Available online: http://extremambiente.juntaex.es/pdf/LibroBosquesWeb.pdf (accessed on 11 February 2019).
- Montero, I.; Miranda, M.T.; Sepúlveda, F.J.; Arranz, J.I.; Trinidad, M.J.; Rojas, C.V. Analysis of pelletizing of wastes from cork industry. Dyna Energía Sosten. 2014, 3, 13. [Google Scholar]
- AEN/CTN 164—Biocombustibles sólidos. UNE-EN Standards; AENOR: Madrid (Spain). Available online: https://www.une.org/encuentra-tu-norma/comites-tecnicos-de-normalizacion/comite?c=CTN%20164 (accessed on 11 February 2019).
- UNE-EN ISO 18134-2:2017. Solid Biofuels: Determination of Moisture Content—Oven Dry Method—Part 2: Total Moisture—Simplified Method; AENOR: Madrid, Spain, 2017. [Google Scholar]
- UNE-EN ISO 18123:2016. Solid Biofuels: Determination of the Content of Volatile Matter; AENOR: Madrid, Spain, 2016. [Google Scholar]
- UNE-EN ISO 18122:2016. Solid Biofuels: Determination of Ash Content; AENOR: Madrid, Spain, 2016. [Google Scholar]
- UNE-EN ISO 16948:2015. Solid Biofuels: Determination of Total Content of Carbon, Hydrogen and Nitrogen; AENOR: Madrid, Spain, 2015. [Google Scholar]
- UNE-EN ISO 16994:2017. Solid Biofuels: Determination of Total Content of Sulfur and Chlorine; AENOR: Madrid, Spain, 2017. [Google Scholar]
- UNE-EN ISO 18125:2018. Solid Biofuels: Determination of Calorific Value; AENOR: Madrid, Spain, 2018. [Google Scholar]
- UNE-EN ISO 17831-1:2016. Determination of Mechanical Durability of Pellets and Briquettes; Part 1: Pellets; AENOR: Madrid, Spain, 2016. [Google Scholar]
- UNE-EN ISO 17828:2016. Solid Biofuels: Determination of Bulk Density; AENOR: Madrid, Spain, 2016. [Google Scholar]
- Instituto Nacional de Seguridad, Salud y Bienestar en el Trabajo (INSSBT), O.A., M.P. Límites de exposición profesional para agentes químicos en España 2018; INSSBT: Madrid, Spain, 2018; Available online: https://www.insst.es/InshtWeb/Contenidos/Documentacion/LEP%20_VALORES%20LIMITE/Valores%20limite/Limites2018/Limites2018.pdf (accessed on 28 March 2019).
- Threshold Limit Values (TLV); ACGIH: Cincinnati, OH, USA, 2015; Available online: http://dl.mozh.org/up/acgih-2015.pdf (accessed on 18 February 2019).
- MAK—Und BAT-Werte-Liste 2018: MaximaleArbeitsplatzkonzentrationen und BiologischeArbeitsstofftoleranzwerte. Available online: https://onlinelibrary.wiley.com/doi/10.1002/9783527818402 (accessed on 29 March 2019).
- Arteaga-Pérez, L.E.; Grandón, H.; Flores, M.; Segura, C.; Kelley, S.S. Steam torrefaction of Eucalyptus globulus for producing black pellets: A pilot-scale experience. Biores. Technol. 2017, 238, 194–204. [Google Scholar] [CrossRef] [PubMed]
- Sette, C.R., Jr.; Hansted, A.L.S.; Novaes, E.; Fonseca e Lima, P.A.; Rodrigues, A.C.; de Souza Santos, D.R.; Yamaji, F.M. Energy enhancement of the eucalyptus bark by briquette production. Ind. Crops Prod. 2018, 122, 209–213. [Google Scholar] [CrossRef]
- Nunes, L.J.R.; Matias, J.C.O.; Catalão, J.P.S. Energy recovery from cork industrial waste: Production and characterisation of cork pellets. Fuel 2013, 113, 24–30. [Google Scholar] [CrossRef]
- He, X.; Lau, A.K.; Sokhansanj, S.; Lim, C.J.; Bi, X.T.; Melin, S. Dry matter losses in combination with gaseous emissions during the storage of forest residues. Fuel 2012, 95, 662–664. [Google Scholar] [CrossRef]
- Lehtikangas, P. Storage effects on pelletised sawdust, logging residues and bark. Biomass Bioenergy 2000, 19, 287–293. [Google Scholar] [CrossRef]
- Tumuluru, J.S.; Lim, C.J.; Bi, X.T.; Kuang, X.; Melin, S.; Yazdanpanah, F.; Sokhansanj, S. Analysis on storage off-gas emissions from woody, herbaceous and torrefied biomass. Energies 2015, 8, 1745–1759. [Google Scholar] [CrossRef]
- Mota, G.S.; Sartori, C.J.; Ferreira, J.; Miranda, I.; Quilhó, T.; Mori, F.A.; Pereira, H. Cellular structure and chemical composition of cork from Plathymenia reticulata occurring in the Brazilian Cerrado. Ind. Crops Prod. 2016, 90, 65–75. [Google Scholar] [CrossRef]
- Domingues, R.M.A.; Sousa, G.D.A.; Freire, C.S.R.; Silvestre, A.J.D.; Pascoal Neto, C. Eucalyptus globulus biomass residues from pulping industry as a source of high value tripterpenic compounds. Ind. Crops Prod. 2010, 31, 65–70. [Google Scholar] [CrossRef]
- Castro, A.R.; Guimaraes, M.; Oliveira, J.V.; Pereira, M.A. Production of added value bacterial lipids through valorisation of hydrocarbon-contaminated cork waste. Sci. Total Environ. 2017, 605–606, 677–682. [Google Scholar] [CrossRef]
Figure 1.
Samples in containers used for tests.
Figure 2.
Transversal and longitudinal sections of the samples.

Figure 3.
CO concentration (ppm) vs. sampling time (s), in a sampling example (after 45 h) (experiment 1).
Figure 3.
CO concentration (ppm) vs. sampling time (s), in a sampling example (after 45 h) (experiment 1).

Figure 4.
Maximum CO levels (ppm) vs. storage time (h) (experiment 1).

Figure 5.
Maximum CO levels after 72 h (ppm) vs. renovations (experiment 2).

Figure 6.
SEM images for transversal section of eucalyptus (a) and cork (b) wastes.

Figure 7.
SEM images for longitudinal section of eucalyptus (a,b) and cork (c,d) wastes (b,d, focusing on a fissure).
Figure 7.
SEM images for longitudinal section of eucalyptus (a,b) and cork (c,d) wastes (b,d, focusing on a fissure).


Table 1.
UNE-EN ISO Standard.
| Parameter | UNE-EN ISO Standard |
|---|---|
| Moisture (%) (wb) | 18134-2 [24] |
| Volatile matter (%) (db) | 18123 [25] |
| Fixed carbon (%) (db) | -- |
| Ash (%) (db) | 18122 [26] |
| C (%) (db) | 16948 [27] |
| H (%) (db) | 16948 [27] |
| N (%) (db) | 16948 [27] |
| S (%) (db) | 16994 [28] |
| HHV * (kcal·kg−1) (db) | 18125 [29] |
| Durability (%) | 17831-1 [30] |
| Bulk density (kg·m−3) | 17828 [31] |
* High Heating Value
Table 2.
Sample features.
| E | ET | C | |
|---|---|---|---|
| Origin | Eucalyptus Waste | Eucalyptus Waste | Cork Waste |
| Approximate weight (g) | 300 | 750 | 350 |
| Head space volume (mL) | 500 | 500 | 500 |
| Container volume (mL) | 1000 | 2000 | 1000 |
Table 3.
Experimental design (summary).
| Sample | Sampling Time | |
|---|---|---|
| Experiment 1 (CO evolution without air renewal) | One single measurement after x hours from manufacture. After that, the sample is removed. | 2, 18, 29, 45, 135, 185, 233, 305, 353, 400, 800 and 848 h after pellet manufacture |
| Experiment 2 (CO evolution with air renewal) | One measurement on the same sample for each air renewal (9 in all), renewing air after each CO measurement and sealing the sample again. | 72 h after each renewal, doing 9 air renewals. |
Table 4.
Occupational exposure limits standards.
| Time Exposure | CO Limit | |
|---|---|---|
| INSSBT (Spain) [32] | 8h (continuously) | 20 ppm |
| 15 min | 100 ppm | |
| ACGIH (USA) [33] | 8h (continuously) | 25 ppm |
| DFG (Germany) [34] | 8h (continuously) | 30 ppm |
Table 5.
Characteristics of the pellets that were analyzed.
| Parameter | Eucalyptus Waste | Cork Waste |
|---|---|---|
| Moisture (%) (wb) | 11.88 | 5.53 |
| Volatile matter (%) (db) | 78.26 | 76.41 |
| Fixed carbon (%) (db) | 20.51 | 19.77 |
| Ash (%) (db) | 1.23 | 3.82 |
| C (%) (db) | 44.40 | 51.00 |
| H (%) (db) | 6.40 | 6.26 |
| N (%) (db) | 0.261 | 0.442 |
| S (%) (db) | 0.044 | 0.043 |
| HHV (kcal·kg−1) (db) | 4637.13 | 5185.52 |
| Durability (%) | 93.06 | 98.44 |
| Bulk density (kg·m−3) | 538.00 | 656.83 |
Table 6.
Fat content.
| Raw Material | Appearance | Fat (%) |
|---|---|---|
| Eucalyptus | Pellet | 0.09 |
| Powder | 0.12 | |
| Cork residue | Pellet | 0.27 |
| Powder | 0.41 |
© 2019 by the authors. Licensee MDPI, Basel, Switzerland. This article is an open access article distributed under the terms and conditions of the Creative Commons Attribution (CC BY) license (http://creativecommons.org/licenses/by/4.0/).
Share and Cite
MDPI and ACS Style
Arranz, J.I.; Miranda, M.T.; Montero, I.; Nogales, S.; Sepúlveda, F.J. Influence Factors on Carbon Monoxide Accumulation in Biomass Pellet Storage. Energies 2019, 12, 2323. https://doi.org/10.3390/en12122323
AMA Style
Arranz JI, Miranda MT, Montero I, Nogales S, Sepúlveda FJ. Influence Factors on Carbon Monoxide Accumulation in Biomass Pellet Storage. Energies. 2019; 12(12):2323. https://doi.org/10.3390/en12122323
Chicago/Turabian StyleArranz, José Ignacio, María Teresa Miranda, Irene Montero, Sergio Nogales, and Francisco José Sepúlveda. 2019. "Influence Factors on Carbon Monoxide Accumulation in Biomass Pellet Storage" Energies 12, no. 12: 2323. https://doi.org/10.3390/en12122323
Note that from the first issue of 2016, this journal uses article numbers instead of page numbers. See further details here.