The Possible Role of Modular Nuclear Reactors in District Heating: Case Helsinki Region


1
Fortum, Keilalahdentie 2-4, 02150 Espoo, Finland
2
Department of Mechanical Engineering, Aalto University, 02150 Espoo, Finland
*
Author to whom correspondence should be addressed.
Energies 2019, 12(11), 2195; https://doi.org/10.3390/en12112195
Submission received: 29 April 2019
/
Revised: 25 May 2019
/
Accepted: 2 June 2019
/
Published: 10 June 2019
(This article belongs to the Special Issue Climate Changes and Energy Markets)
Abstract
:To answer the challenges presented by climate change, all aspects of our energy systems have to carry out a rapid transition towards decarbonisation. This is especially true for the European heating sector that still relies heavily on fossil fuels. District heating systems have been traditionally praised for their efficiency, but replacing old fossil fuel based combined heat and power (CHP) plants is an ongoing challenge, and also the sustainability of biomass as a large-scale option can be considered questionable. Small modular nuclear reactors are one of the potential sources of future CO2-free district heat production. We evaluate the suitability and cost-effectiveness of these plants for district heating through literature review and scenario modelling. The technical aspects of small modular reactors seem promising but there is still a significant amount of uncertainty around both their costs and deployability. The scenario modelling assesses the investment in 300 MWdh of new district heating capacity in the Helsinki Metropolitan area in 2030 either as a CHP plant or as a heat-only boiler. The results indicate that a modular nuclear heat-only boiler could be profitable, while profitable investment in a modular nuclear CHP plant relies heavily on future electricity market price levels.
1. Introduction
Alongside most Nordic countries, Finland has set ambitious climate goals. Most recently, the government introduced legislation to ban the use of coal for energy production by 2029 [1]. These goals are also further fortified by the decisions of individual cities as the latest strategy of Helsinki, for example, includes the goal of achieving carbon neutrality by 2035 [2]. However, achieving these goals is not a simple task. The Helsinki Metropolitan area has been struggling, especially with potential sources of heat production. In all Finnish cities, District Heating (DH) with large Combined Heat and Power (CHP) plants, combined with heat-only boilers (HOB’s) for peak-load use, is the prevailing technology. Finland is one of the Western countries where DH is used the most. Currently, DH has 46% market share of all heating in Finland and in large cities DH with CHP is the dominating technology with a share of 80% or more [3]. Finnish CHP technology uses fuels with an exceptional overall efficiency. For example, a coal-fired CHP plant typically has an electrical efficiency of about 30% and heat efficiency of about 60%, yielding a total efficiency of 90%. However, DH still relies heavily on fossil fuels and peat, which is a domestic fuel with a CO2 emission coefficient slightly more than that of coal. In the Helsinki region, CHP plants use either coal or natural gas as fuel. In Helsinki coal-fired power plants, also minor fractions of biomass have been recently introduced.
The cities in the area, Helsinki, Espoo and Vantaa, are most likely trying to fill the hole left by the eventual decommissioning of fossil fuel fired plants with biomass, but recent motions put forward in multiple city councils have called for an evaluation of the potential of small modular reactors (SMR) as a source of district heating [4,5]. This study, based on the M.Sc thesis of Värri [6], attempts to look into the assumptions under which SMRs would be a valid choice for energy production in the chosen market beyond the year 2030. The results are not meant to be taken as final due to the high amount of uncertainty surrounding most of the data, including the hypothetical combined market case used, but to be considered as a preliminary overlook of SMR’s economic potential and possible role in the DH system.
SMRs have been brought up in DH discussions mainly for their ability to provide CO2 free energy at a scale smaller than traditional nuclear power plants (NPP), but the new plant designs can also provide increased safety through passive systems, possibilities for reduced costs and higher quality fabrication through factory based manufacturing and other possible advantages [7]. While these advantages are significant, there are still a number of issues to be solved before large scale deployment can be considered including licensing considerations and emergency planning zone sizes [8]. These are considered solvable issues in this study, as the focus is on the techno-economical assessment.
Finland is a viable location for early SMR deployment, considering that the country has historically been positive towards nuclear and is currently finishing a new NPP in Olkiluoto and is in the early stages of a new build at Hanhikivi [9,10]. The country also has a long history with DH networks and the share of DH of the total heating is presumed to stay at 75–85% of the overall heat demand in the Metropolitan area, as indicated for instance by the Nordic Energy Technology Perspectives 2016 (NETP16) [11]. The large physical infrastructures of DH networks also generally result in local monopolies in Finland, where both the distribution and production is owned and controlled by the same company [12]. This brings forth some additional considerations regarding the addition of a nuclear SMR into an existing network, as the investor would most likely need to be an existing operator in the region.
It is important to note that Finland does not exist in isolation and larger trends in energy affect the future of heat production in the country as well. When considering the potential deployment of SMRs for DH in Finland, the most significant trends are: transformation towards more distributed electricity supply with enhanced transmission capacity both inside the Nordics and towards Europe, and a steep increase in wind generation and electrification of heating. All three are also intertwined with each other. Wind power investment cost is forecast to drop significantly and in combination with the target shares of renewables, there are many estimates that wind generation will increase manifold by 2030 to cover 30% of the overall Nordic electricity generation [11,13,14]. A share this large of intermittent generation from wind could not be integrated directly into the current electricity system, but would require the system to be fitted with greater amounts of flexible supply- and demand-side resources [15,16]. The large share of hydro power in the Nordics provides a backdrop for this growth but the system will also require balancing through demand response, storage and wider electricity trade. The electrification of heating could potentially provide opportunities for both demand response and storage through heat pump utilization and heat storages. The NETP16 forecasts that electricity based heating will start growing significantly between 2025 and 2030 and could, based on the reports assumptions and different scenarios, cover between 30% to 50% of the DH demand in 2050 with most of the remainder being covered by biomass and waste. In the backdrop, the transmission capacity between Nordic countries is expected to grow by 11.2 GW and by around 14 GW between Nordics and Europe [11]. The electricity prices and temporal variations used in this analysis are based on Reference [11].
Biomass and combustion of Municipal Solid Waste (MSW) are widely proposed options for the decarbonisation of heating systems and DH in Europe. Utilisation of MSW as fuel in DH has expanded in many European city regions (see, e.g., Reference [17]). This has led to significant increases in both MSW imports in the Baltic sea region and raised questions regarding the sustainability of these transports and the diversion of resources away from recycling [18]. The sustainable amount of biomass use in relation to the requirements of the latest IPCC report [19], in turn, is currently a hot topic of expert and policy-making debate in Finland, as increased use of biomass is planned for new pulp and paper production plants and both for transportation biofuel and power plant use. There is thus a concrete threat that the forest carbon sink may decrease significantly from the current level [3].
In Europe, heating still relies heavily on fossil fuels [20]. The most common fuels in individual heating in the European Union (EU) are natural gas and light fuel oil and buildings are a huge CO2 emissions source in the EU with 634 MtonCO2-eq. in 2015 [20,21]. District heating is very common in many countries of Northern and Eastern Europe, and the prevailing fuels are coal and natural gas. In light of the recent IPCC report on 1.5 °C warming [19], there is an urgent need to transform global energy systems into carbon neutrality. Thus, the analysis performed in this study has relevant and timely indications for all city regions where heating is predominantly based on fossil fuels.
2. Materials and Methods
2.1. Modular Nuclear Plant Considered in the Study
The plant considered as a representative SMR here is the NuScale SMR, a 160 MWt, 50 MWe integral pressurized water reactor (IPWR) design. A single NuScale reactor module consists of the reactor core, two steam generators and the reactor pressure vessel (RPV) inside a high strength steel containment vessel featuring a cooling system based fully on natural circulation. A standard plant would consist of 12 modules submerged in a common below grade reactor pool with each module having its own dedicated turbine generator. The choice of SMR was primarily motivated by the availability of public data and the plant considered here for DH production features 2 to 3 modules either as a heat-only boiler (HOB) or as a combined heat and power (CHP) plant [22].
2.2. Market and Investment Analysis
The market and investment analysis is performed primarily using two separate models, which were created in the Excel environment: The DH system analysis model and the investment model. The basic evaluation of district heating systems is performed using an hourly model that is based on the plant data, capacity available and the cost of electricity, runs a script to fulfil the assigned heat demand at the lowest cost possible for an hour at a time over a single year. The model is fairly limited as it considers production forms a single block instead of multiple plants and ignores issues such as start-up costs and minimum loads but is used here for the basic evaluation of full load hours (FLH) and production costs.
Hourly heat production cost calculations for different plants are presented in Equations (1)–(3). All of the data except the efficiencies are inserted as €/MWh. The equations only take into account the variable costs of heat generation. In CHP plants, the electricity produced is presumed to be sold at the current market price, the fuel taxation is only applied to the heat production and the O&M costs are based on the electricity production. In the case of heat pumps, the heat used is presumed to be from a free and unused source. Currently, heat pumps of Helsinki region DH networks use wastewater or data center cooling as a heat source [23].
For HOBs:
For CHP plants:
For heat pumps and electric boilers:
where
| CH(t) | Total hourly variable cost of heat production |
| PO&MV | Variable O&M costs of production |
| PF | Price of fuel |
| PCO2 | Price of CO2 emissions |
| PT | Transmission costs of electricity |
| PE(t) | Hourly price of electricity |
| TF | Fuel taxes |
| TE | Electricity taxes |
| ηH | Heat production efficiency |
| ηE | Electricity production efficiency |
The investment model is divided further into two separate models provided by Fortum to evaluate the levelized costs of heat and electricity (LCOH/LCOE) and the net present values (NPV) and internal rates of return (IRR) for HOB and CHP plants. The first investment model calculates the data for a HOB plant whereas the second model evaluates the additional investment from HOB to a CHP plant. The model is built around the principle that a new plant is first and foremost built to produce a certain amount of heat. The models requires basic data of both the technical and economic aspects of the plants considered. The HOB data is used directly while the CHP data is modified to represent an additional investment instead of a new plant. Generally speaking this process means subtracting the HOB values for fuel consumption, capital costs and fixed O&M from the CHP equivalents. The variable O&M costs were also re-evaluated for the CHP plants based on their HOB counterparts. This was done using Equation (4):
where O&MCHPA is the modified variable O&M price, O&MCHP and O&MHOB are the original equivalent values for the respective plants and ηH and ηE are the heat and electricity efficiencies for CHP plants. In the case of the MSW CHP, the fixed O&M costs were also included in the variable O&M for a HOB based on the presumption that both plants would be run for 8000 h a year.
To calculate the cash flows, the models also need yearly data for heat, electricity and CO2 prices, fuel costs, tax and inflation rates as well as ramp-up rates for investments and production. Based on this data, the model calculates the yearly cash flows that have been adjusted for inflation. All the monetary data used is in 2015 euros, or adjusted to 2015 euros using the presumed inflation rate of Finland, which is expected to grow steadily from the level of −0.2% in 2015 to the rate of 2% in 2020 where it will stay [24]. Exchange rates from pounds and dollars to euros were based on rough approximations from values over time from the European Central bank with values of $/€ = 0.9 and £/€ = 1.15 used [25]. The presumed ramp-up rates of capital costs are presented in Appendix A Table A1 while the production is presumed to be 95% of the plants average yearly production on the first year of the plants completion and 100% in the following years. The depreciation time is presumed to be the lifetime of the plant up to 30 years. The yearly cash flow calculations follow Equations (5)–(7).
where
| EBIT | Earning before interests and taxes (€) |
| FCF | Free cash flow (€) |
| EE/H | Electricity or heat produced (MWh) |
| PE/H | Price of electricity or heat (€/MWh) |
| PO&MV | Variable O&M costs (€/MWh) |
| CF | Fuel consumption (MWh) |
| PV | Price of fuel (€/MWh) |
| TV | Tax rate on fuel (€/MWh) |
| PCO2 | Price of CO2 emissions |
| TF | Fixed taxes (€) |
| PO&MF | Fixed O&M (€) |
| i | inflation rate (%) |
| D | Depreciation (€) |
| TC | Corporate tax rate (%) |
| I | Investment split over the years according to the capital cost ramp-up (€) |
| iC | inflation rate at the start of construction (%) |
| tD | Depreciation time (a) |
The NPV-, IRR- and LCOE/LCOH-values are calculated based on the free cash flows over the lifetime of the plant using the appropriate excel functions and by utilizing the solver function. The formula for NPV (modified from [26]) is
where r is the weighted average cost of capital (WACC) and n is the combined construction and utilization period of the power plant. Presumed base values of 5% WACC for HOBs and 6.5% for CHP are used. As a modification of this formula, IRR is the rate of return that would set the NPV of the investment as zero.
LCOE and LCOH provide a base metric for evaluating the cost of energy produced over the lifetime of the plant. Generally the LCOE/LCOH can be calculated using Equation (9):
where Ci represents the yearly costs and Ei is the yearly energy produced [27]. In the model used in this study, similar to the IRR calculations, the LCOE and LCOH are calculated by setting the NPV of the project to 0 by running a solver based script that sets PE/H in Equation (5) so that Equation (8) results in a NPV of 0.
3. Energy System Data and Considerations
3.1. Plant Data
LCOE/LCOH or any other data-analysis and benchmarking tool that aims to forecast developments over the lifetime of a power plant, especially a nuclear one, is highly susceptible to the accuracy of the basic assumptions made in the analysis [27]. The plant data used here is mostly from the Technology Data catalogues by the Danish Energy Agency and Energinet.dk [28,29]. The data has been, in some cases, modified based on other sources or due to internal discussions at Fortum in an attempt to find more realistic assumptions as some of the original data required fairly dramatic scaling. The basic data for heat only plants is presented in Table 1 and the data for CHP and power plants in Table 2. As a general note, the efficiencies gained from the sources are fairly high, which is explained by the use of flue gas condensation as well as the use of lower heating values in most cases.
The fairly high heat production of 300 MW for the plants was selected due to the issue of scaling 160 MWt NuScale modules from a HOB to a CHP plant while keeping the size in line with the other possible options. While not most likely extending towards 300 MW, it is possible that the trend to replace older CHP plants with larger HOBs could continue. With the low electricity prices in recent years, actors like Helen in Helsinki have decided to replace their coal based CHP plants with biomass-based HOBs as the additional investments towards a new CHP plant would not be sustainable [31]. This has also been estimated by, for example, Helin et al. [32,33].
While CHP investments might seem unlikely at the moment, it should be noted that there are some potential future advantages that might play a part in making the investments viable again. Combined with heat storage, CHP could play a large part in facilitating a higher amount of intermittent renewables by providing additional balancing power to the system as the heat storage could free the production from following the heat demand. While heat pumps are also often referred to as a part of the potential answer to power system balancing through demand-side management, maintaining CHP plants in their current role instead of investing in heat pumps in areas connected to the DH network would be preferable for minimizing CO2 emissions [34,35].
While the HOB data is presented for all of the options, only pellet and gas fired HOBs are considered an investment in their own right as the rest function as the basis for the additional CHP investment. Both plants could be considered fairly well understood technology with gas being the more flexible option [28,29].
In the case of CHP plants, all of the options noted in Table 2 are considered. The natural gas combined cycle gas turbine (CCGT) is cost effective from investment perspective and is extremely flexible when considering its ability to ramp production up and down making it ideal for a system with a high amount of intermittent generation. In comparison, the woodchip plants are less likely to be used for balancing power mostly due to the higher investment costs. Both biomass fired options also need to take into account the lower energy density of the fuel and its effects on the siting of the plant. As noted by Madlener and Vögtli in their study, the logistical opportunities presented by different sites considered play a major part in the investment decisions of a biomass plant [28,29,36].
MSW CHP plants differ from the others as they are primarily built for waste treatment and the energy produced is mainly a useful side stream. As waste treatment facilities, they do not pay for the waste but receive it at a gate fee resulting in a negative price for the fuel. Due to these factors in combination with the rest of the plant’s cost structure, high capital and O&M cost and the requirements of the extensive flue gas and combustion residue treatment systems, the plants are preferably run as pure baseload plants [29].
As a point of comparison, heat pumps, electrical boilers and wind turbines are also considered as alternatives to the large scale plants. The learning rate achieved by both on- and offshore wind has been bringing the cost of wind based production down significantly and the growth will most likely continue. Heat pumps and electrical boilers are also fairly often considered an option for the demand side management of electricity. Main considerations for these include the sources of heat for heat pumps while the wider deployment of electrical boilers is mostly dependent on the development of the electricity market as the price of production is almost fully based on the price of electricity [28].
Finally, the SMR is considered as both a CHP plant and an HOB. The data on the NuScale SMR used in this thesis is mostly based on data from NuScale itself while utilizing some of the same assumptions as VTT and the British Techno-Economic Assessments in their SMR studies. The data given by NuScale is for a full 12 module plant, so the price for a single module was presumed to be 1/12th of the full plant price referred up to 30%. The HOB plants costs were further modified by removing the turbine island and balance of the plant from the cost summary while assuming that the CHP would cost the same as a normal plant. The O&M costs are from the values for SMR CHP O&M in the British TEA reports scaled to also fit HOBs based on the presumed heat and power efficiencies with the fixed O&M costs presumed to be 120 £/kW/a in 2030. The efficiencies are purely estimates based on the presumption that a single 160 MWt module can produce either 150 MW of heat in HOB use or 100 MW of heat and 30 MW of electricity in CHP use giving us an overall efficiency of 93.8% for HOB and 81.25% for CHP. The scaling from HOB to CHP is then done by presuming a two module HOB plant producing 300 MWh as a base. The additional investment towards CHP is then comprised of one additional 160 MWt reactor module and the turbine island and the balance of the plant for all of the modules [37,38,39].
As presumable for a technology that has yet to been applied, these cost evaluations include high levels of uncertainty. NuScale’s original cost distribution for a 12 module plant is shown in Table 3. Simply dividing the costs and adding a premium is a fairly large simplification, especially with components like the reactor pool that is both most likely a large part of the nuclear island’s cost and unlikely to be directly scalable. The same considerations most likely apply to multiple other items on the list as well. It is also important to note that these costs do not include owners costs, such as licensing [37,40].
The TEA reports series also discuss the credibility of the reactor vendor’s estimates assuming a 54% increase in costs in First-of-a-kind (FOAK) plants based on their nature as non-standard civil engineering projects. At the same time, the reports also note that FOAK installations could potentially achieve up to 20% cost reductions if the project fully utilizes advanced design, manufacturing and construction techniques and processes. The use of these could also potentially drive the costs of NOAK plants down rapidly compared to traditional large nuclear plants with expected learning rates ranging between 5% to 10% [40]. This is also partly supported by studies on the cost escalation of LNPPs as Rangel and Lévêque’s study on the French nuclear plants found that neither experience nor capacity increases had positive results on the cost of LNPPs. Instead the largest advantages in both costs and safety were found from standardization [41].
As the SMR’s investment cost is high compared to the other options, the cost of capital plays a large part in the actual realized cost of energy production. The TEA reports evaluate the cost of capital for a FOAK SMR to be at the same level as large nuclear, 8.9%. SMRs could potentially be more attractive to investors based on the smaller upfront capital requirements and lower construction risk and NOAK plants could potentially get closer to the WACCs of other production forms [40]. Based on this the WACC for NuScale was set at 8%.
The role of SMRs as baseload production is fairly certain. As an investment heavy plant, both as an HOB and a CHP option, achieving a low cost of heat and electricity is fully based on gaining enough full load hours (FLHs). Still, as mentioned earlier, load following might be critical in the future and also economical through heat storage. NuScale has not given a detailed description of the load following capabilities but the design fulfils EPRI’s specifications for load following. The load following itself is performed either by adjusting the reactor power output for longer time scale maneuverability or by utilizing the turbine bypass for more rapid adjustment [42].
Based on NuScale’s assessment that their plant’s construction will take 51 months with a 28.5 month critical path, the presumption is made that a HOB would take 4 years to build while a CHP plant would take an additional year [37].
3.2. Fuel, Electricity and ETS Price Trends
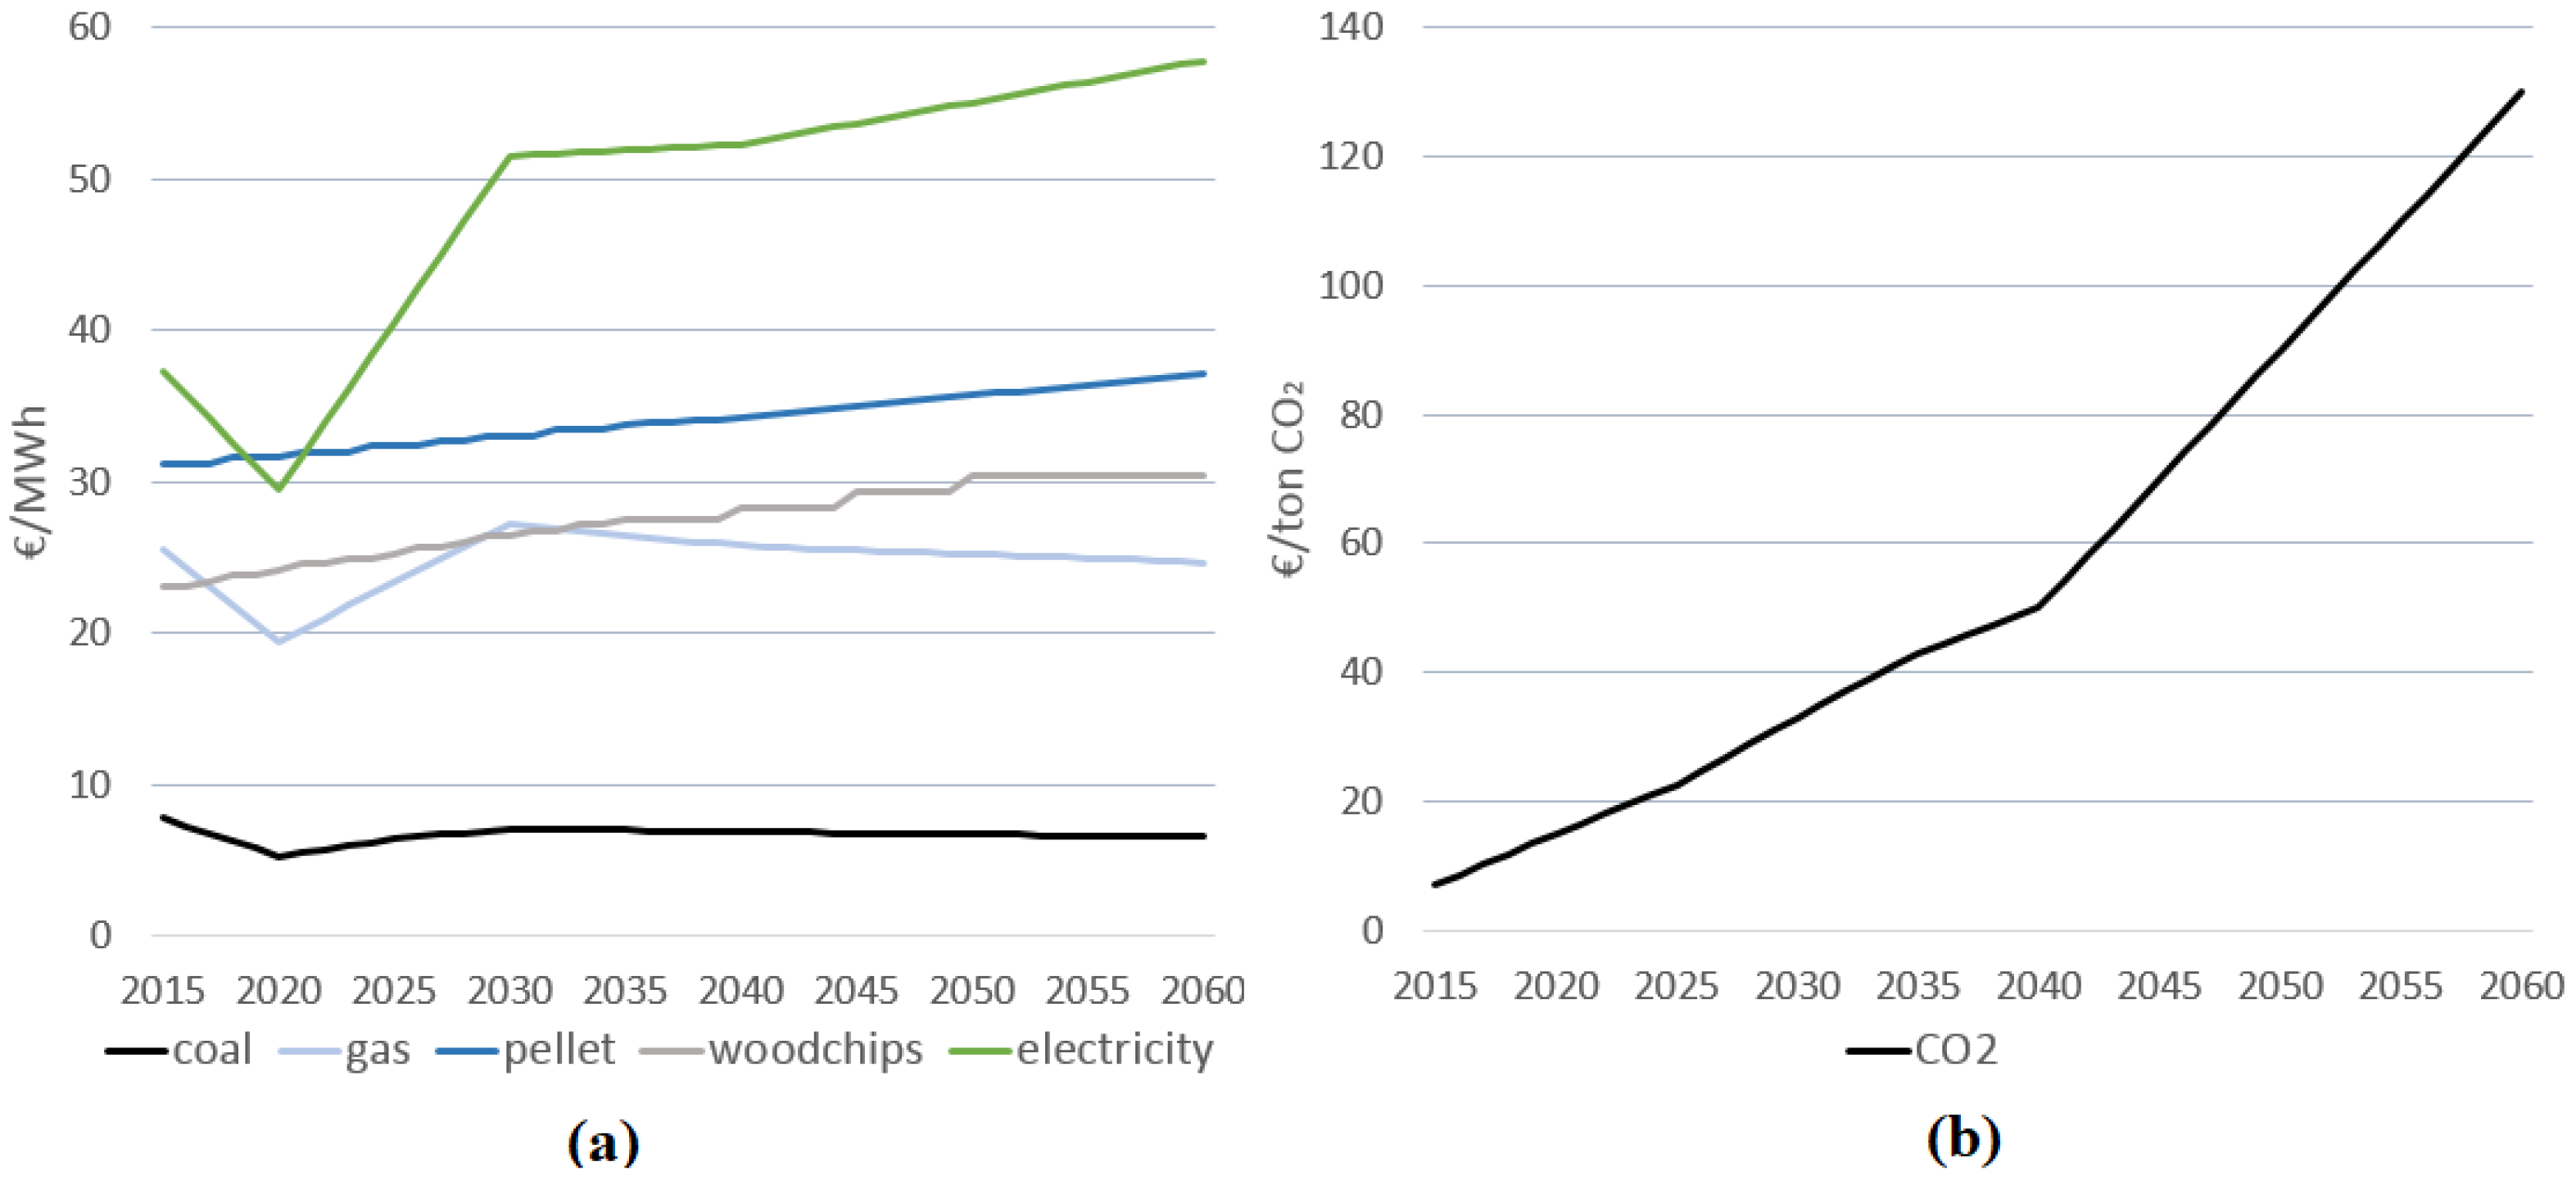
Fuel data for this study was compiled mostly from NETP16 and was modified based on other sources. The fuel costs in the relevant studies were generally given until the year 2050. In cases where they were required further, the assumption was made that the costs would develop until 2060 at the same rate they did between 2040–2050 and then stagnate. The main price developments for fuel, electricity and CO2 are shown in Figure 1 with the coal, gas and electricity pricing taken from the NETP16 and the biomass and CO2 pricing taken from a Danish study and an EU reference scenario, respectively, as the pricings in the NETP16 were deemed unrealistic [11,43,44].
The primary driver behind most of the price changes is the rising emission price curve. The EU emission trading scheme (ETS) could be seen as the most important tool available for the EU and the first-best policy instrument to steer choices regarding energy sources. Yet, as Gawel et al. note, the ETS has been criticized for being filled with loopholes and for not addressing politically challenging issues properly. Even so, the EU reference scenario 2016 for energy presumes that the ETS will start to function as visible in Figure 1. The carbon price is translated to coal and gas prices using rates of 0.341 tCO2/MWh for coal and 0.202 tCO2/MWh for gas [44,45,46].
Changing the CO2 pricing decreases the applicability of the rest of the NETP16 electricity and fossil fuel data as the major changes in these can be traced to the steep rise of CO2 price in the report. The spike starting in 2020 in the NETP16 CO2 both brings down the market demand of the fossil fuels and increases the price of existing electricity production. The rise in electricity pricing could also be traced partly to the increasing interlinking between the Nordics and Europe. As the share of fossil fuels shrink, biomass will be partly replacing them and will see an increase in price [11,43]. Even this rise is fairly questionable due to the possibility that energy use of wood could begin to replace higher end wood processing routes if the price reaches a high enough point.
The gate fee for municipal solid waste was determined to remain at a level of 30 €/MWh as public sources tended to have high levels of variance. The nuclear fuel price was also determined partly through internal discussions at Fortum with a base price for 4.95% U235 enriched UO2 taken from market data with prices ranging from 755 to 980 $/kg [47]. Presuming manufacturing costs between 400 and 500 $/kg, burnup for NuScale to be between 30 and 50 MWd/kg and 10% additional costs for fuel disposal, a conservative fuel price estimate of 2.05 €/MWh was used [22,48,49].
3.3. Considerations on the Sustainability of Biomass and MSW as Large-Scale Options for DH
Fuel choices for future district heating should not be considered strictly based on pricing, as there are multiple other factors with significant effects on the overall sustainability of the system. The status of biomass as a carbon neutral energy source has been an important part in expanding its share of energy generation, but this might be compromised as the use of biomass further expands. If the use of biomass and the share of biofuels in transportation increase as presumed in the NETP16, the sustainability of the fuel should be taken under close consideration. This will depend on the area examined but as noted in the scenario study by Heinonen et al., for example, increasing the cutting drain of Finnish forests from the current level of around 60 million m3 per year would result in a decrease of carbon balance with the maximum sustainable limit reached at a level of 73 million m3 per year [50]. Recent official estimates imply that the forest carbon sink may decrease from the current level of −26 MtonCO2eq to −4.2 MtonCO2eq in 2030 and cause a net carbon emission close to Finnish anthropogenic carbon dioxide emissions [3].
While the local resources for wood fuels might be limited, it should be noted that trading and shipping biomass based fuels has been a common occurrence in the Baltic Sea area since the 1990s, with most of the imports currently coming from Russia and the Baltic states. In the case of woodchips, it should also be noted that the import is limited by the narrow price margins that lead to them only being viable for coastal plants [51,52,53].
Similar to the biomass based fuels, the sourcing of MSW can also become complicated. For example, the waste CHP plant of 117 MWt in Vantaa already sources the waste from about 1.5 million people living in and around the Helsinki metropolitan area [54,55]. At the same time, the proliferation of waste-to-energy technology has also led to MSW imports becoming common around the Baltic sea, while the dependency on waste incineration has also raised questions of its sustainability. Overcapacity of plants compared to waste resources can lead to environmentally unjustifiable transport distances and the diversion of resources from recycling efforts [18].
3.4. The System
The Helsinki Metropolitan area scenario is built around the hypothetical base concept that the DH networks of Helsinki, Espoo and Vantaa would be more fully integrated by 2030. The base heat demand and production used here is based on the NETP16 Helsinki 4DS heat production distribution that utilizes a similar approach to the Metropolitan area. Based loosely on the current CHP and HOB plants in use, a baseline of different production forms for 2030 was formed utilizing the hourly heat demand and production model to emulate the 4DS production distribution. This is shown in Table 4 along with the base data used [11].
The current generation distribution is taken from the district heating statistics in Finland from 2016 with the additions of the new Salmisaari and Kivenlahti pellet HOBs and 2 heat pumps in Esplanadi [56,57,58,59]. The NETP16 scenario still uses coal but the decision by the Finnish government to ban the use of coal was taken into account here and the 600 MW of coal CHP was replaced with the addition of 200 MW of pellet HOBs, 350 MW of woodchip CHP and 50 MW of heat pumps [1]. This baseline is not necessarily representative of the full system as the peak load capacity, for example, was fulfilled by adding extra gas HOB capacity to the system [11].
The heat demand was compiled using a heating degree day value of 17 °C, the heat demand from the NETP16 and the hourly temperature data from the Kaisaniemi weather station from 2017 compiled by the Finnish Meteorological Institute. The hourly variations are shown in Figure 2 [60]. The base heat demand was set at a fairly conservative 300 MW based on scaling by population from the 80 MW baseload presumed by VTT for Espoo [38]. The electricity price series is gained similarly by scaling the hourly 2017 Finnish price series from Nord Pool directly higher to fit the presumed electricity price series for Finland in 2030 from NETP16. The price series is presented in Figure 3 [61]. The electricity price series is also scaled up directly using the price difference between 2030 and the target year when considering years beyond 2030. Due to the fairly minor changes in heat demand in the NETP16 between 2030 and 2050, the series is presumed to stay even over time. These are, once again, rough approximations but are used here to gain a basic idea of the potential development of the heating markets [11].
The price of district heating is expected to stay at the level of 80 €/MWh which is fairly close to the current rate charged by the companies in the Helsinki metropolitan region [62]. The estimated share of the network costs was presumed to be 10 to 15 €/MWh [63]. This, in addition to the 24% VAT placed on the heat sold would result in a realized heat price of around 47.5 €/MWh for the plants.
The tax rates used in the scenario mainly presume that the current levels of taxation would continue. The fuel tax for gas in CHP use is 13.7 €/MWh and 19.9 €/MWh for HOBs. The same values for coal are 18.2 €/MWh and 28.8 €/MWh. Electricity tax applied to its use for powering heat pumps and electrical boilers is presumed to stay at the level of 22.53 €/MWh while the transmissions costs are expected to stay around 30 €/MWh based on a rough evaluation of the rates of Caruna. The corporate tax rate is presumed to stay at 20% after 2015 [64,65,66,67].
4. Results
4.1. Scenario Runs
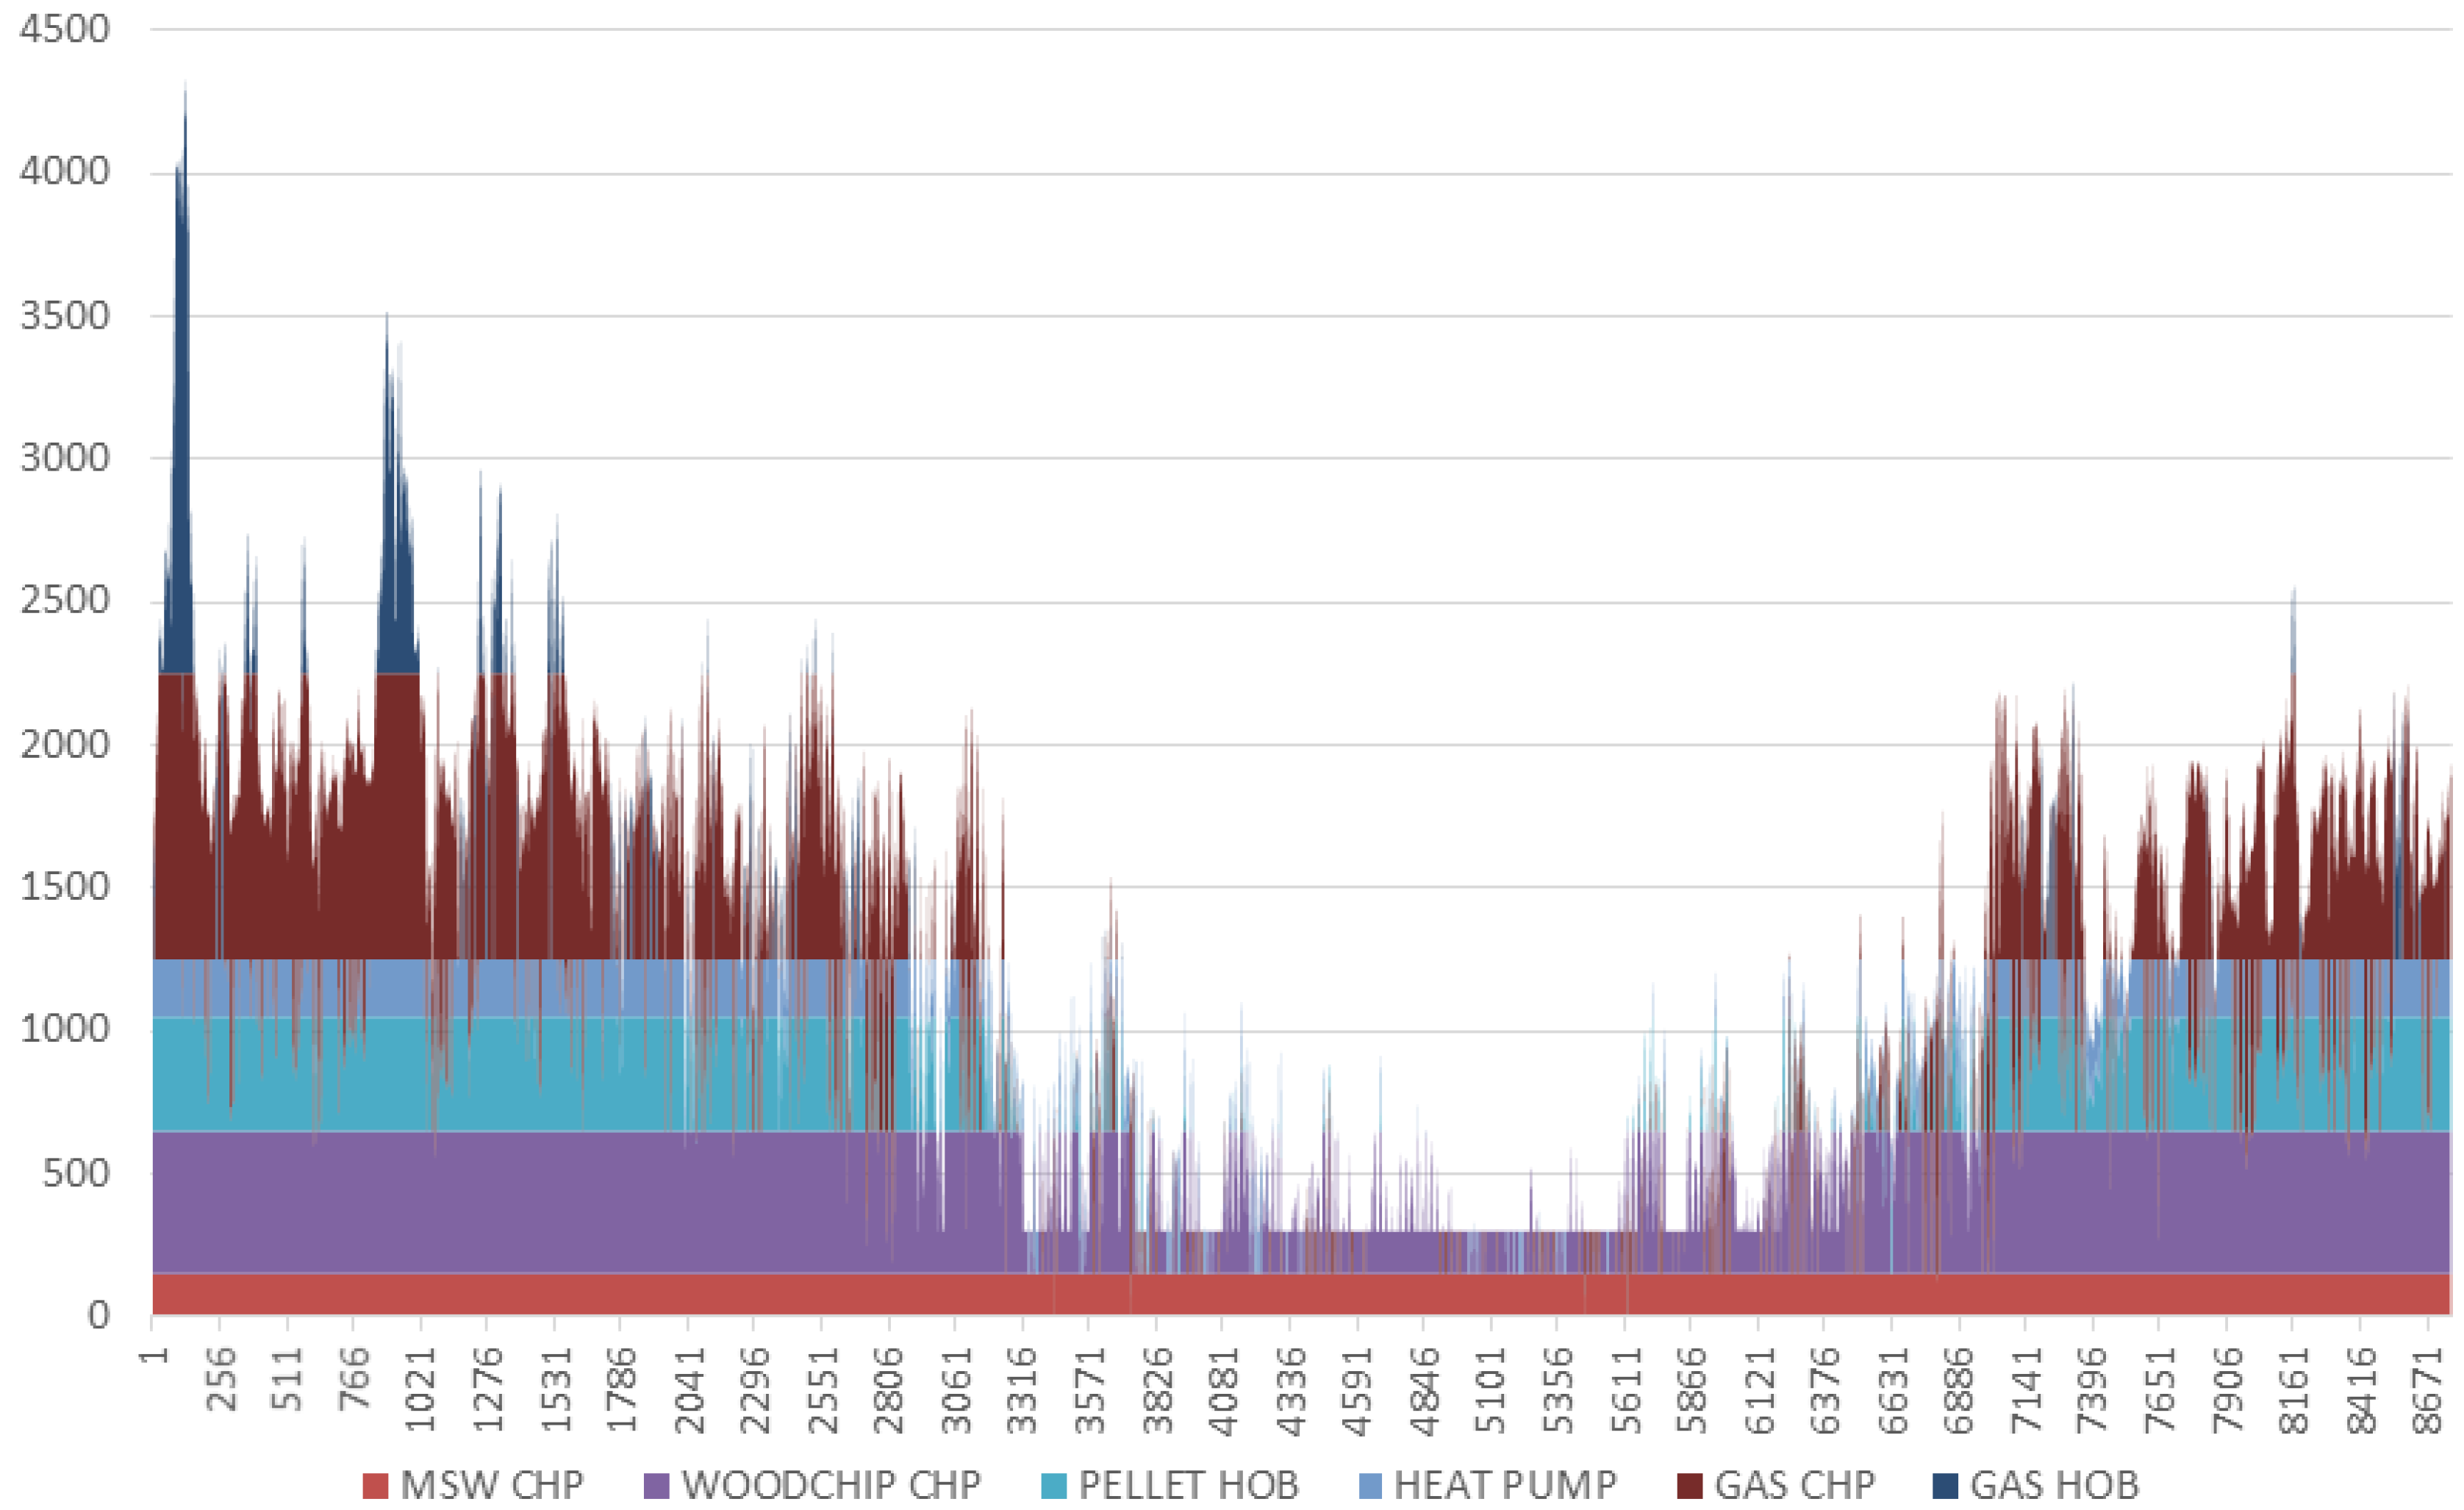
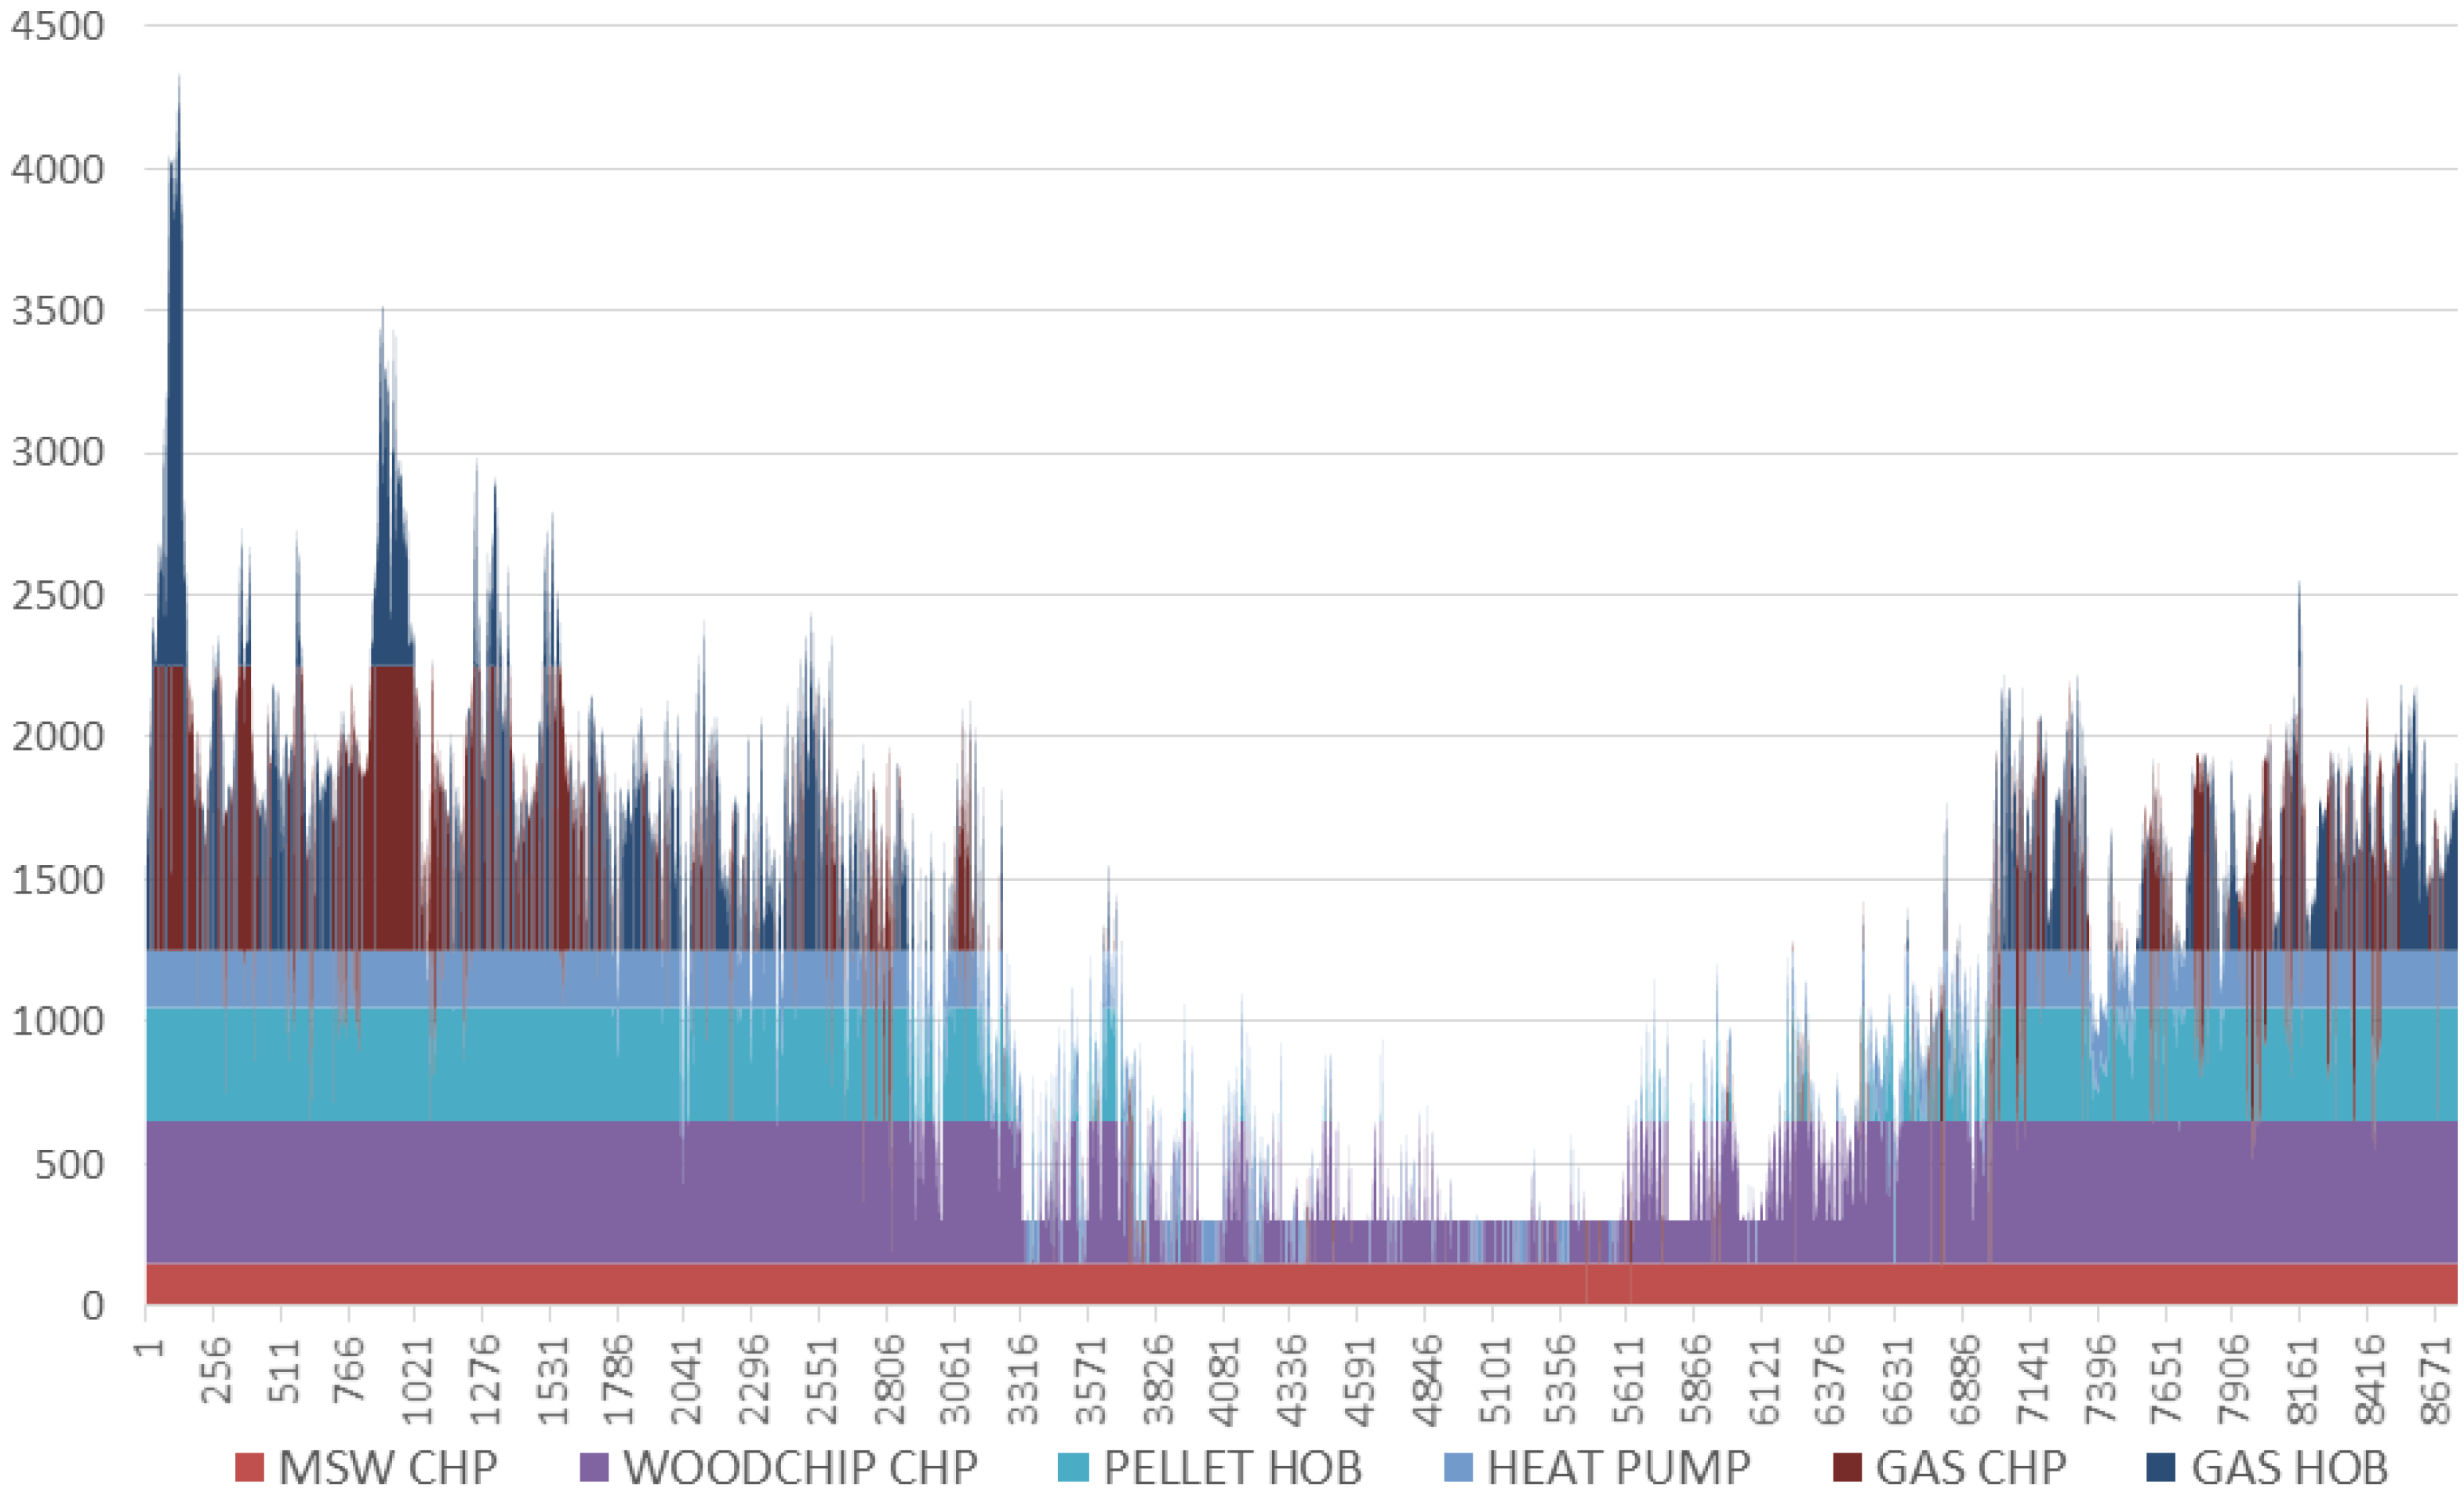
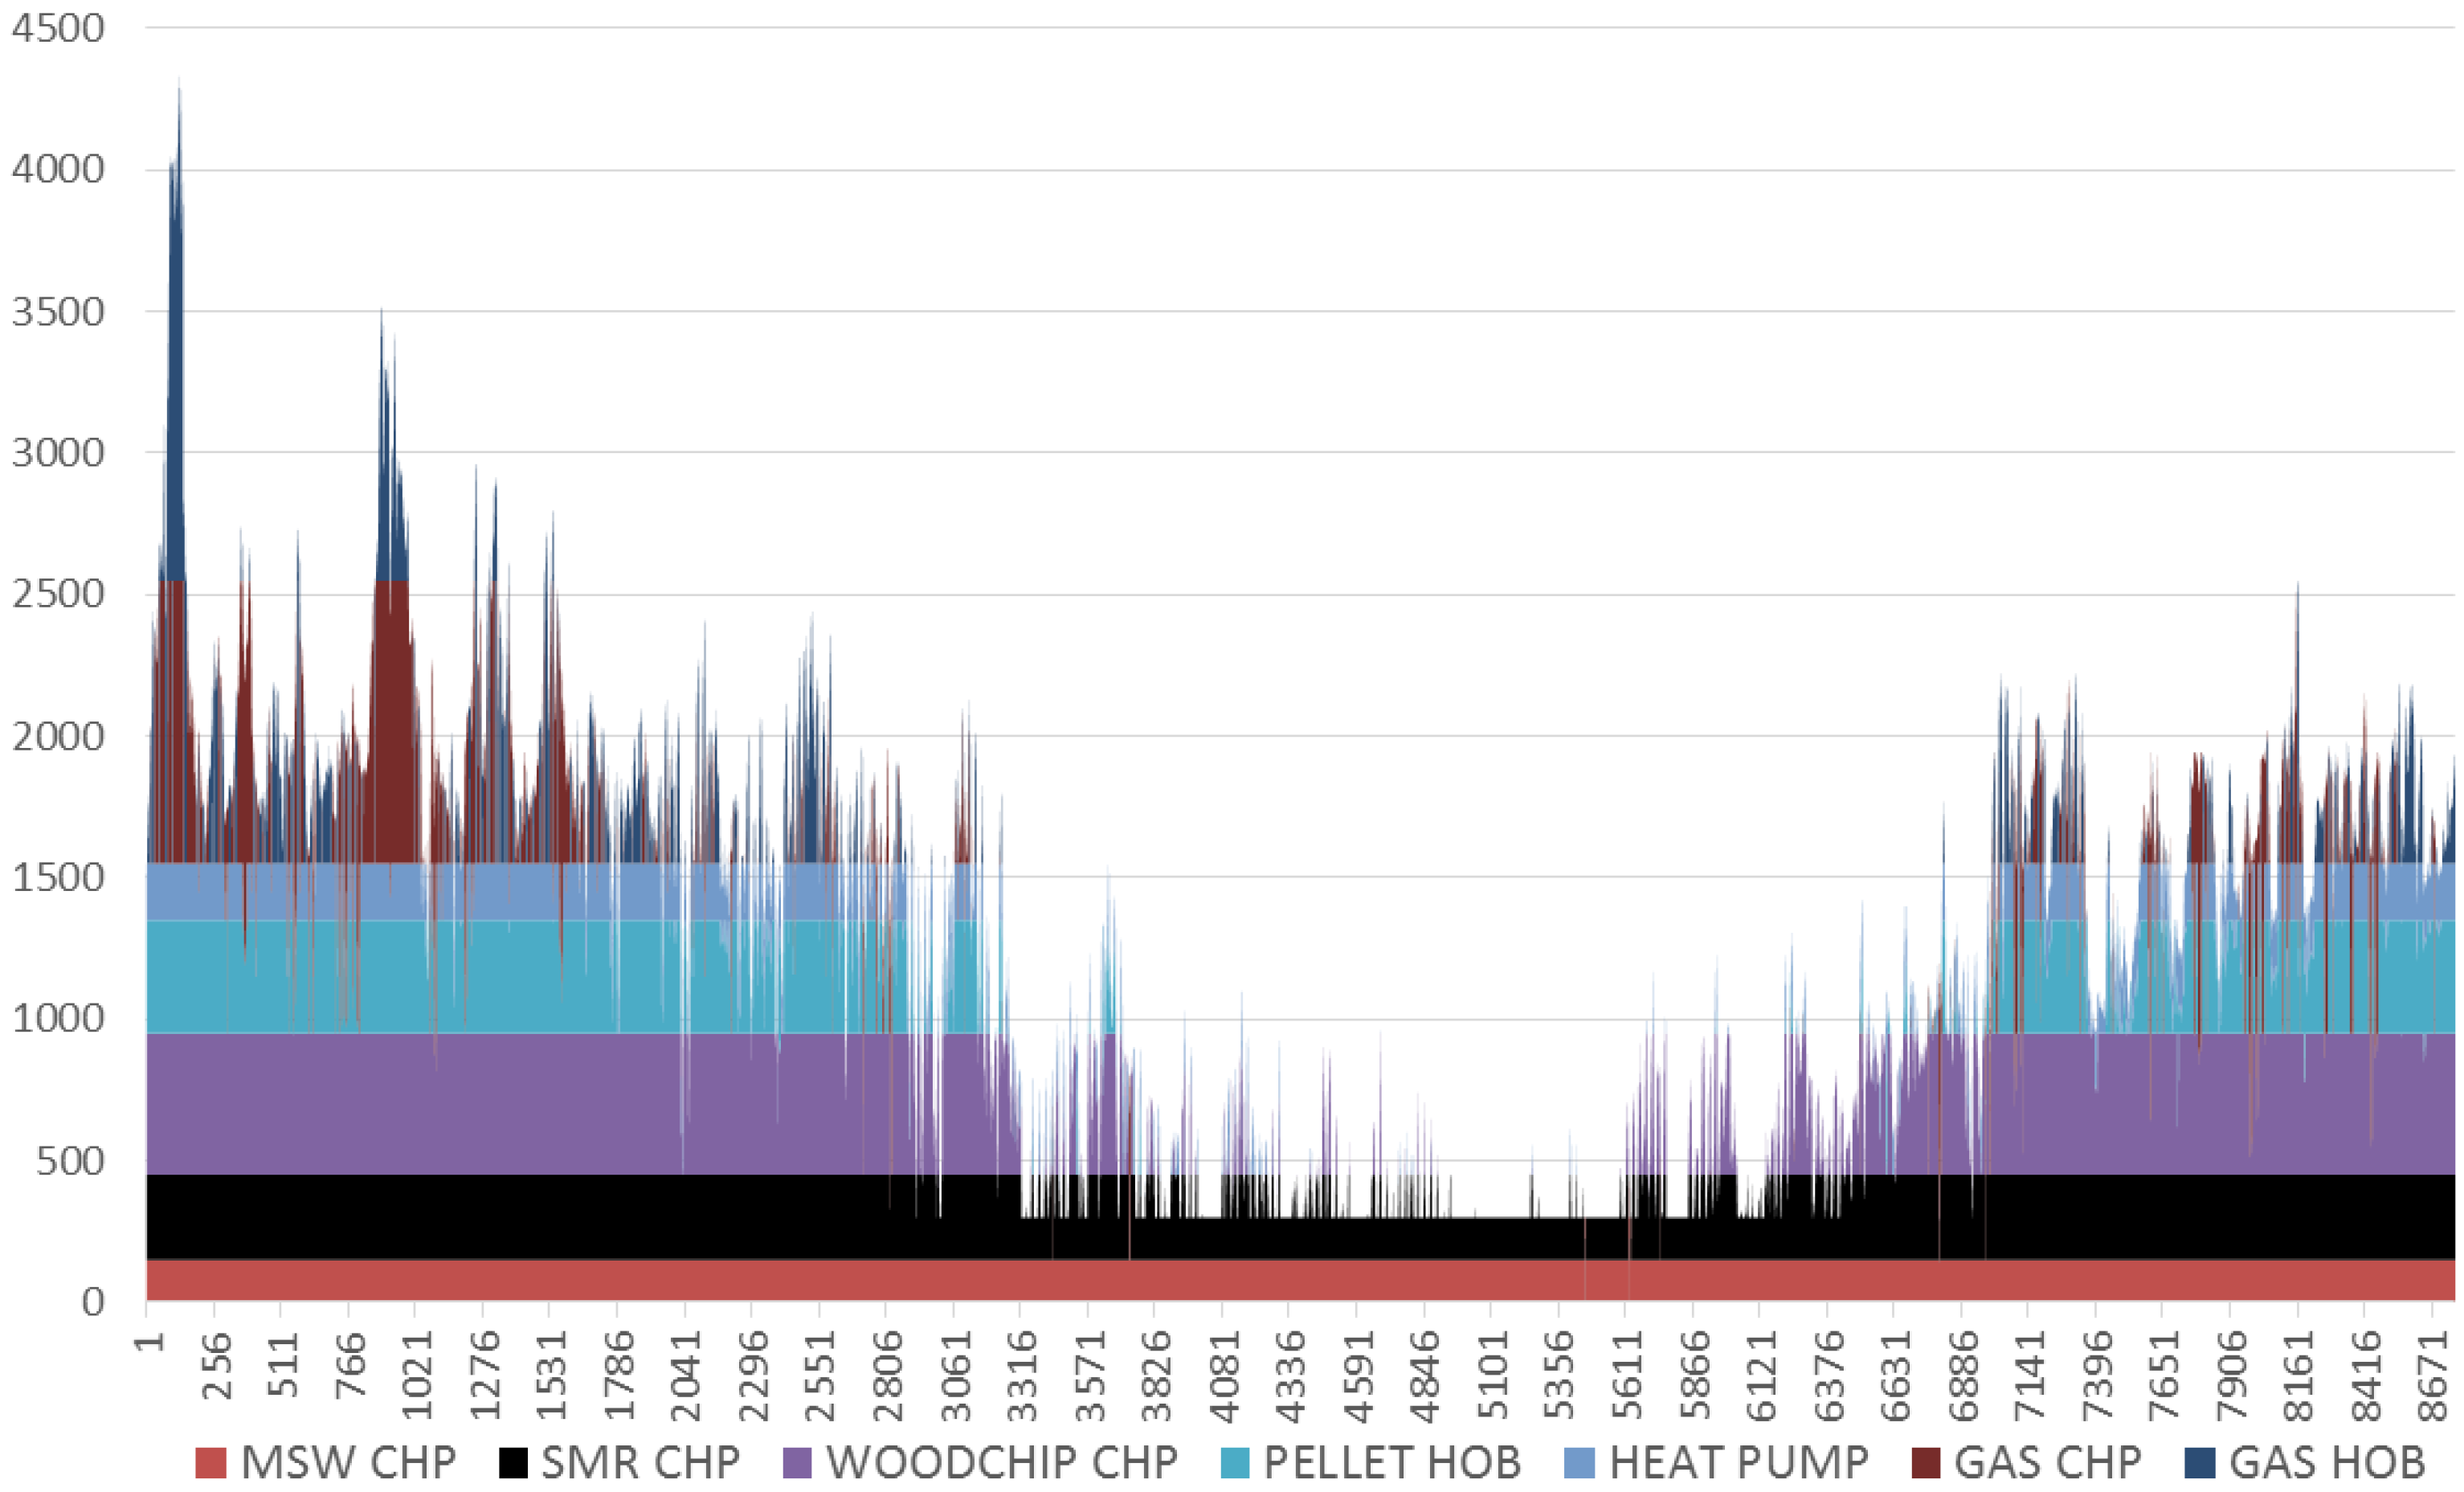
The production distributions presented in Figure 4 and Figure 5 for base scenario runs without SMRs do not necessarily contain any surprises. The limits of the model are first highlighted here as, for example, the start-up costs would mean that firing up gas CHPs would be more unified and the MSW CHP would be taken down for maintenance during the summer. These are taken into account when evaluating the FLHs for the investment model. The only major change between 2030 and 2050, is the distribution of production between gas CHP and HOBs. As the gas CHP is heavily biased towards electricity production and the rising CO2 prices bring the cost of gas based production up significantly, the HOB production is cheaper during hours of lower electricity pricing.
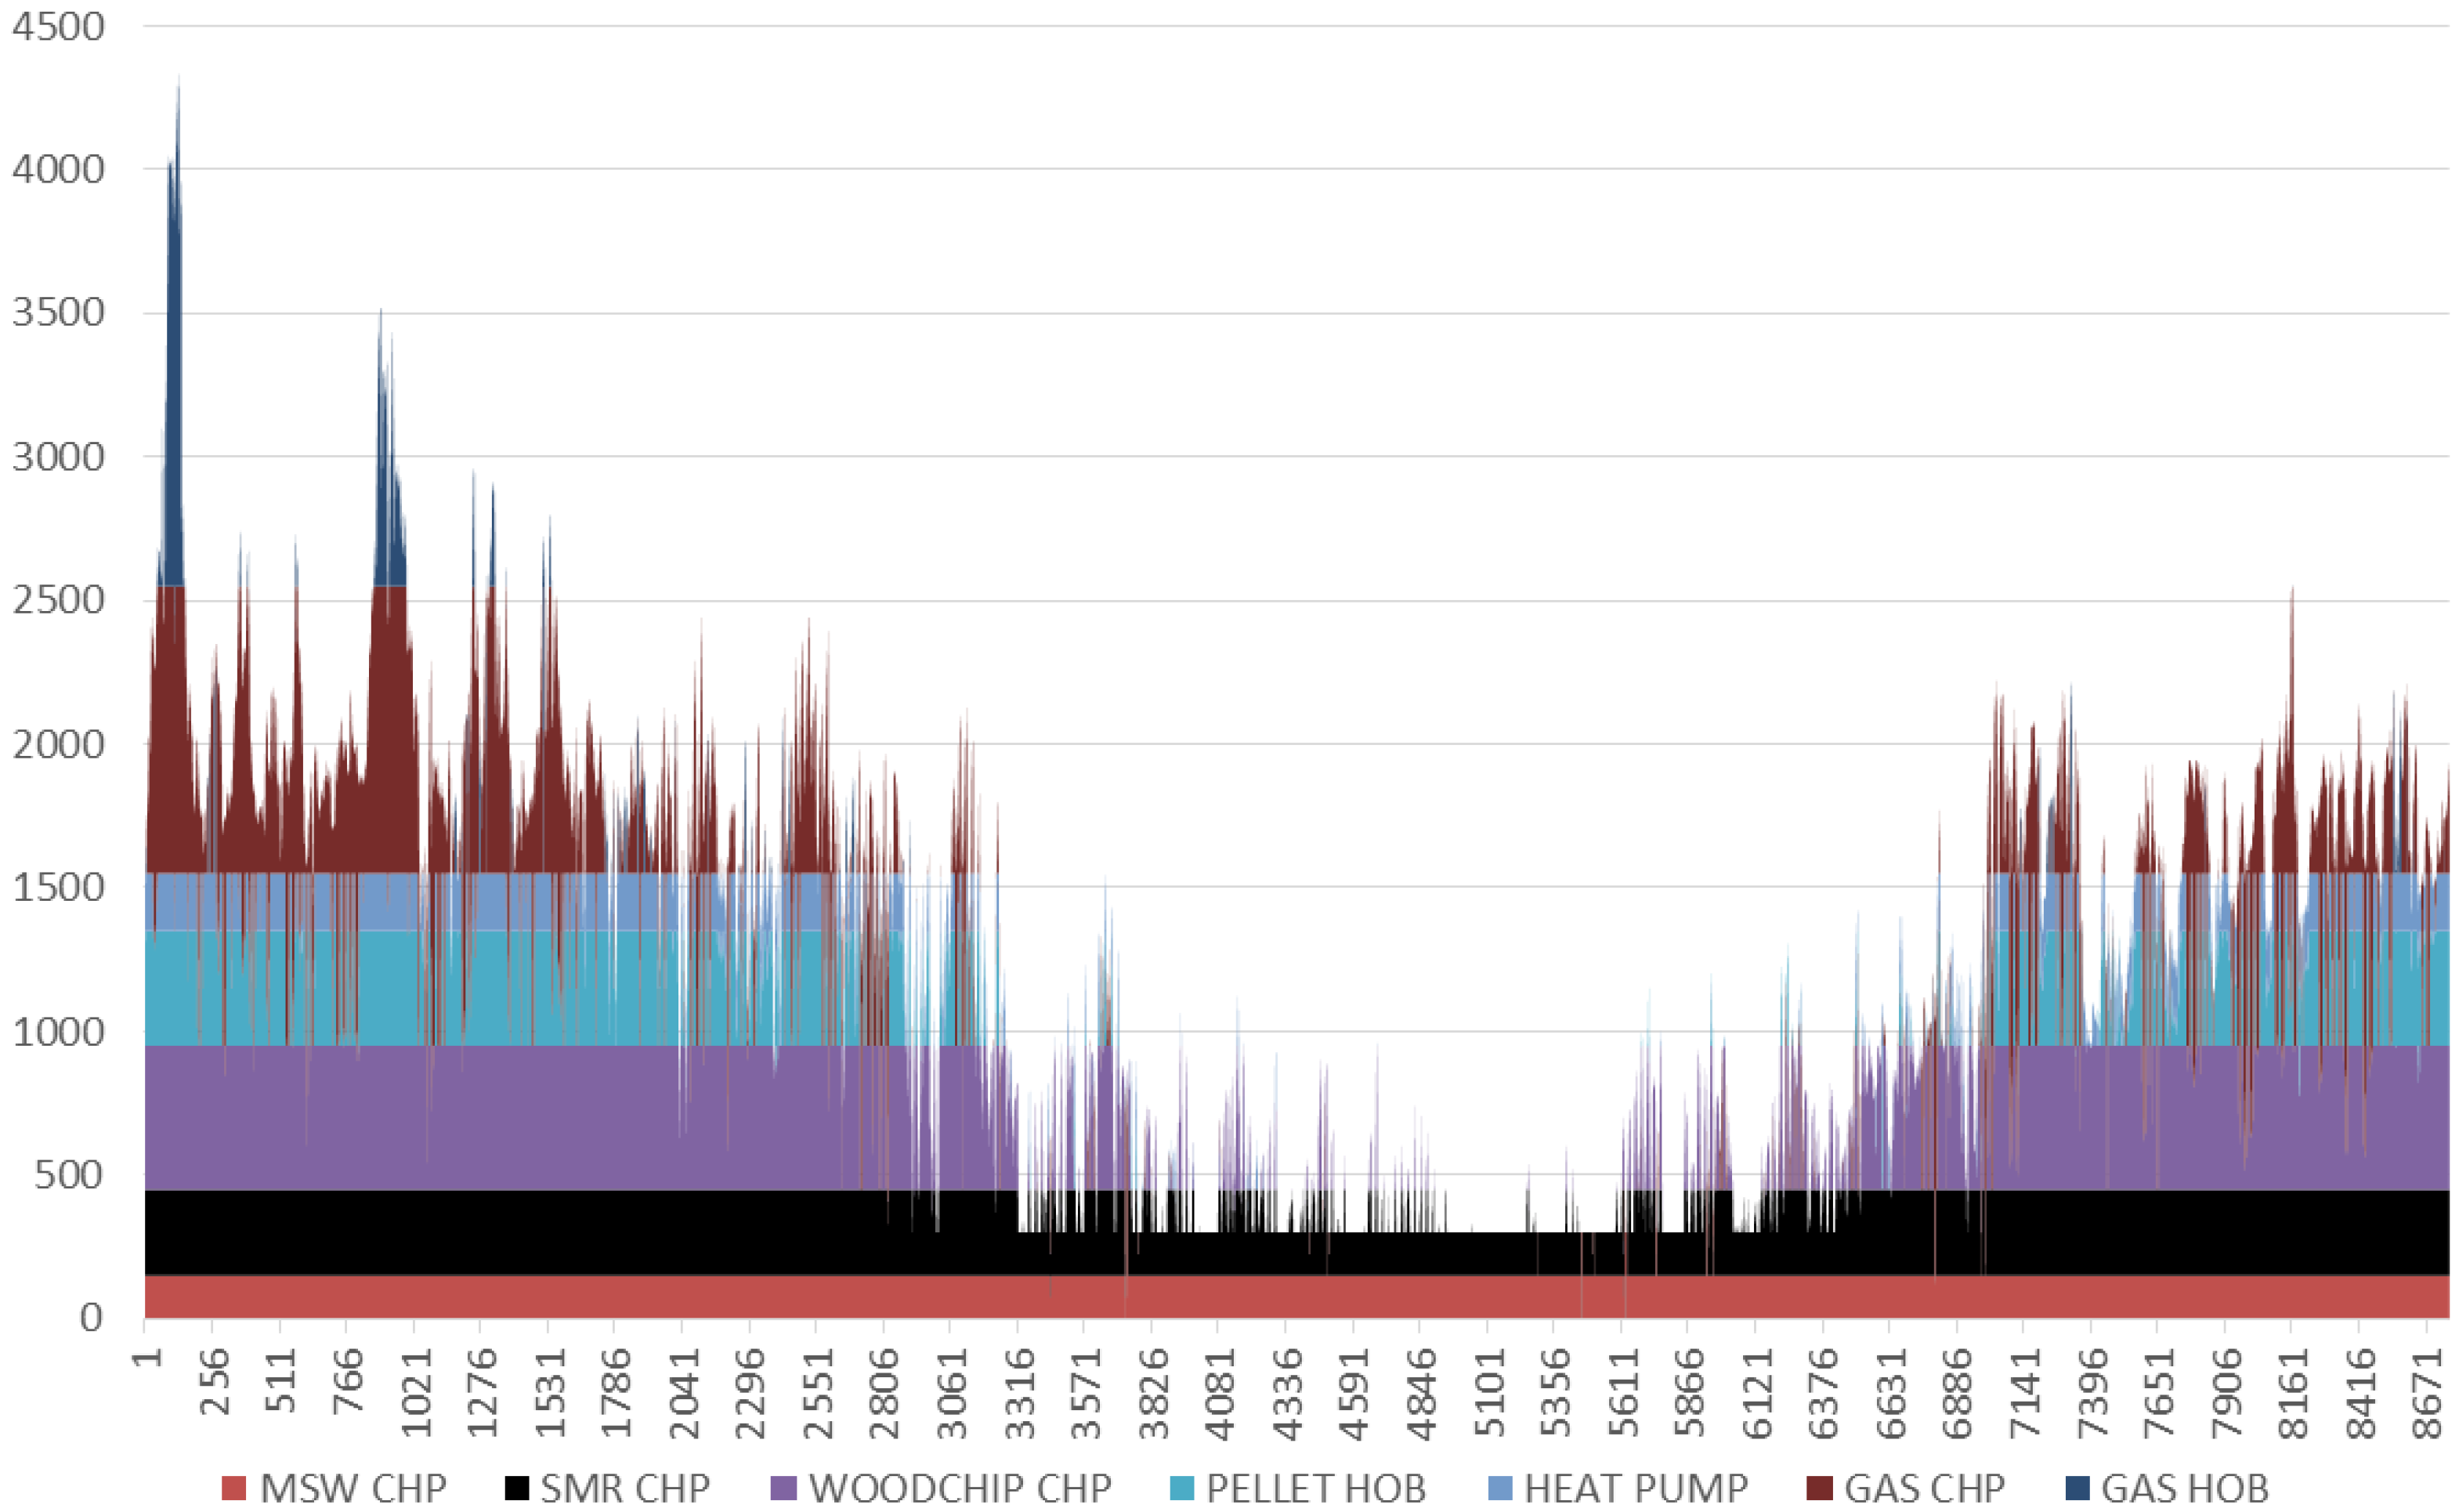
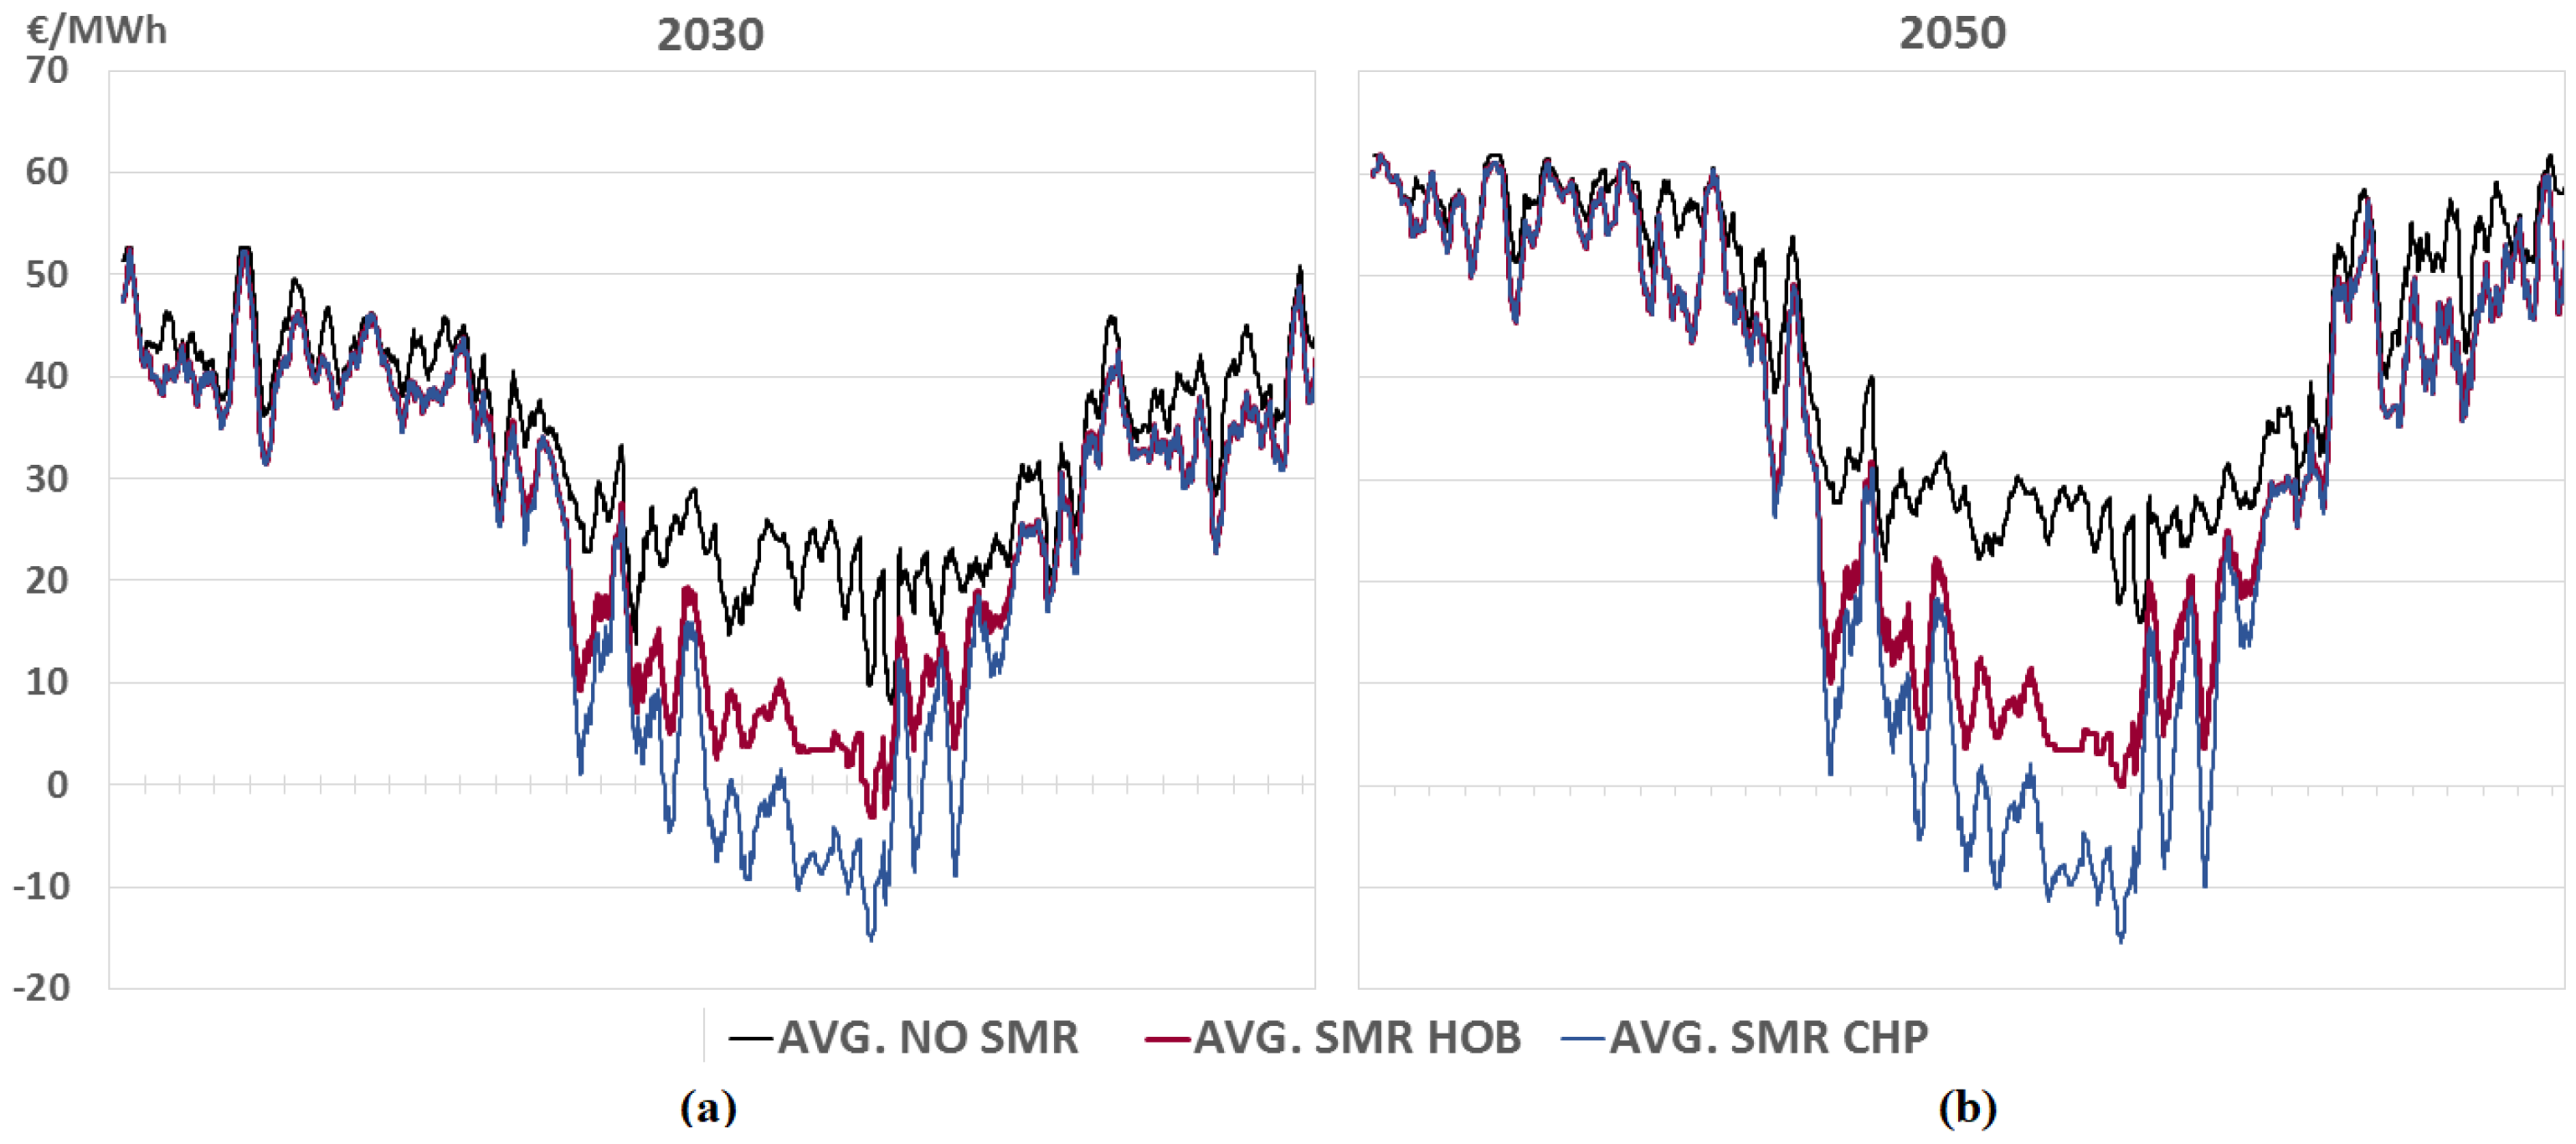
The addition of 300 MW of SMR heat production into the production mix is presented in Figure 6 and Figure 7. While the figures were built based on SMR CHP, the results for running an SMR HOB instead of a CHP plant do not necessarily differ significantly. Unsurprisingly, the addition of the SMR mostly drives the gas production fully into peak load role. As the production costs of gas fired plants play an important part in the formation of the overall cost level of DH production, the addition of SMR production brings this down significantly. The effects are better visualized in Figure 8 and Figure 9 based on the variable costs gained from Equations (1)–(3). Figure 8 showcases the yearly marginal cost distribution in 2030 and 2050 clarified by taking a moving average of the values using a period of 100 h. The addition of an SMR plant mostly brings the marginal cost down during the low demand hours as during the 3000 highest cost hours, the addition of either of the SMR options brings the cost down just 6% in 2030 and 2% in 2050 on average.
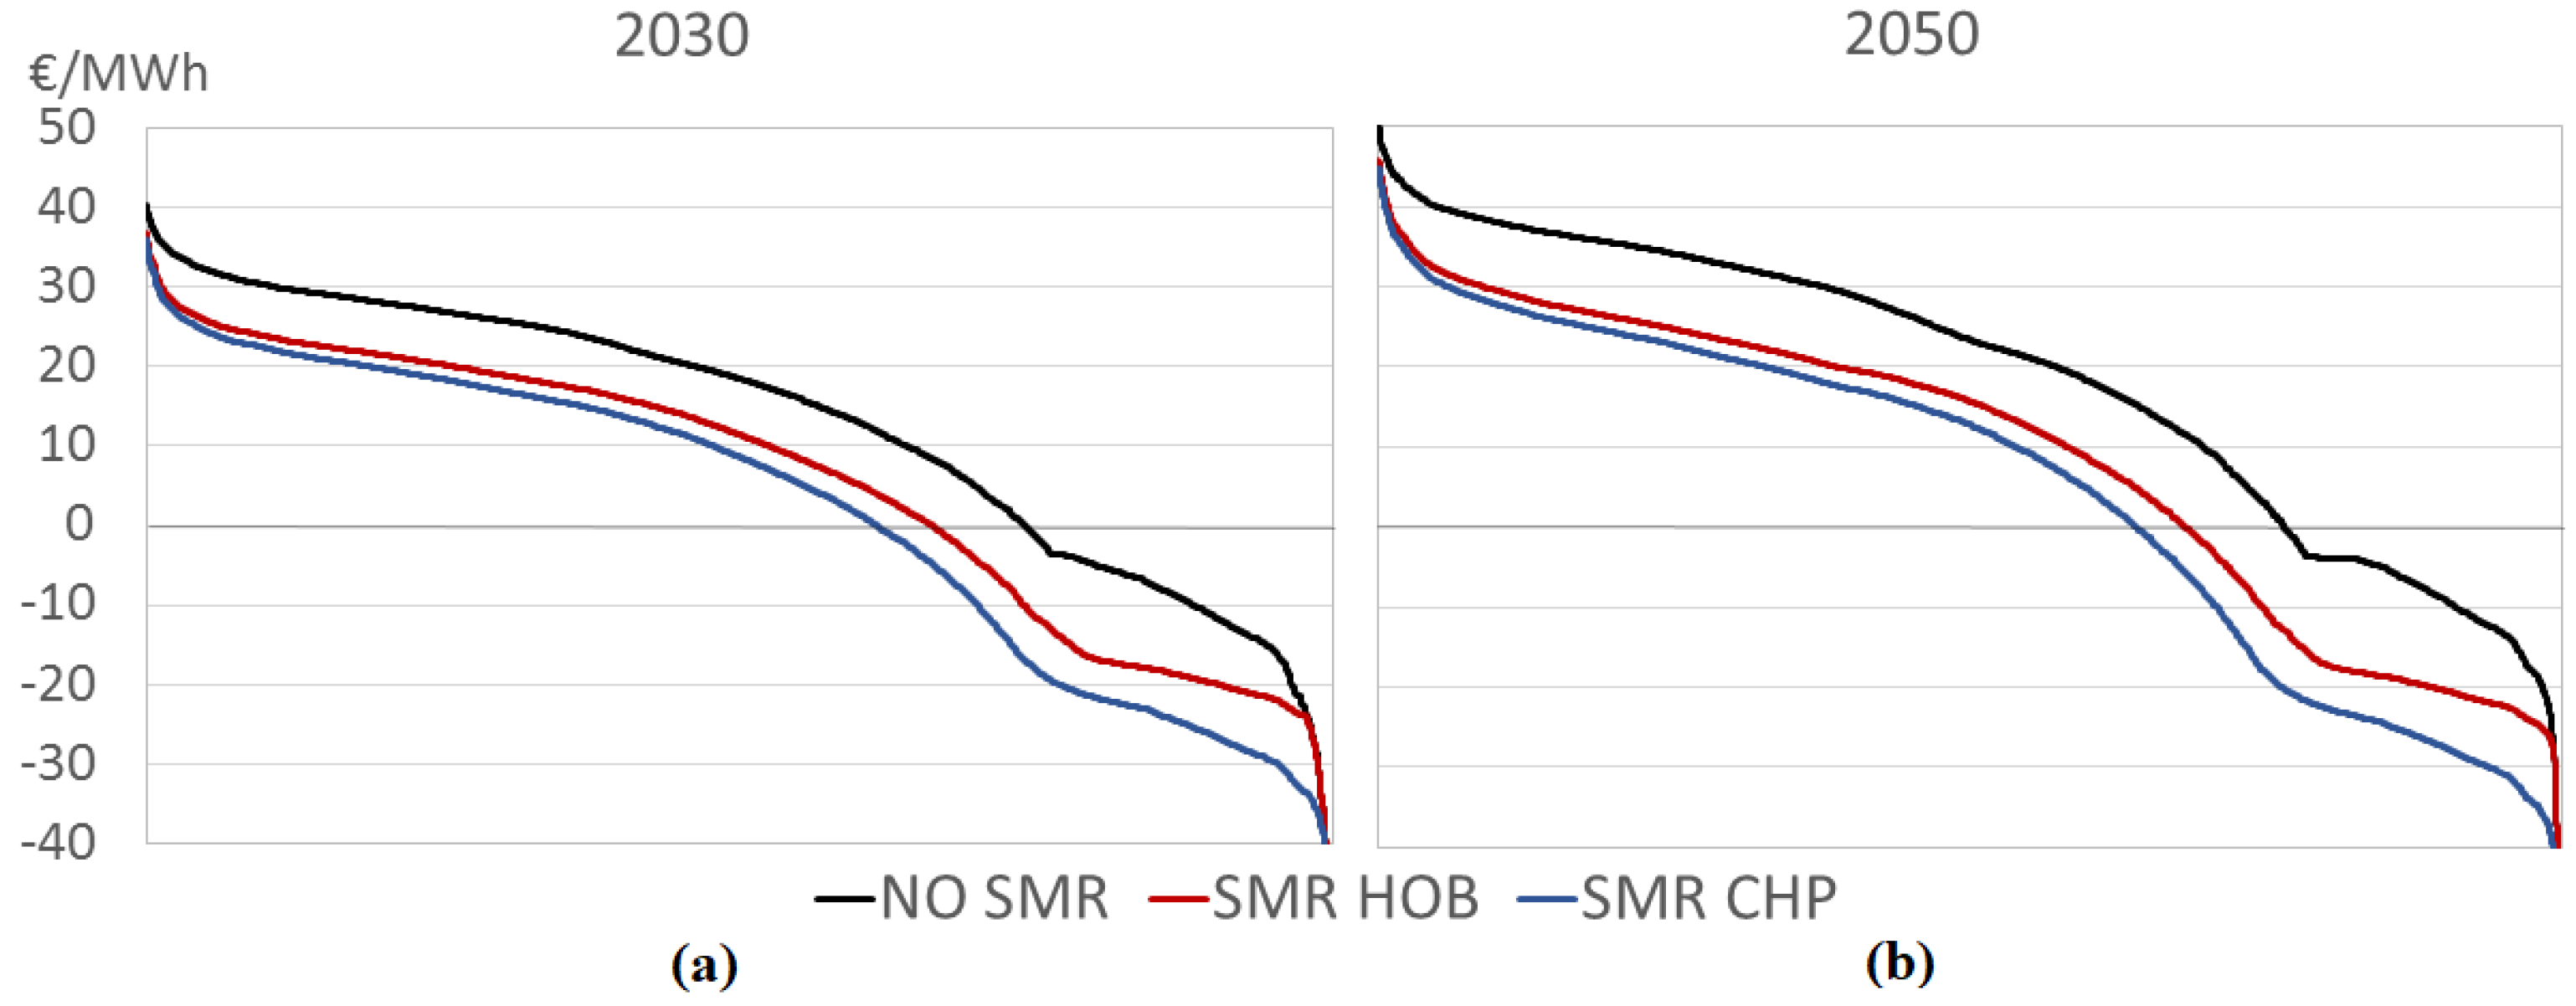
Even if the effect of the SMR investment on the marginal cost is limited, it would still bring the overall cost of DH production down. Figure 9 presents the averaged and sorted cost series gained by adding together the total realized production cost divided by the amount produced for each hour of the year, with some of the lowest values cut for the sake of clarity. If the period of time surveyed is again the 3000 highest cost hours, the SMR HOB investment would bring the average cost of production down by 23% in 2030 and 24% in 2050. The SMR CHP would bring the cost down 29% in both years compared to the base scenario.
4.2. Investment Evaluation
To assess the investment potential of the different production forms, the FLH counts were evaluated based on the hourly heat demand model. These are better presented in Table 5. The base presumption is that a new plant would be the most efficient of its kind and have the priority in the start-up order. While the MSW CHP runs for full hours in the scenario, the plant data presumes about 93% availability for it [29]. Generally the presumption is that through the planned outage of the existing MSW CHP, all of the plants considered for the baseload production, SMR HOB/CHP, woodchip CHP and MSW CHP, would most likely reach FLH counts close to 8000. Even though nuclear is generally characterized by long outage periods for refueling and maintenance, the NuScale plant can be refuelled one module at a time meaning that it should always be able to produce 150 or 200 MW depending on the choice between HOB and CHP plant.
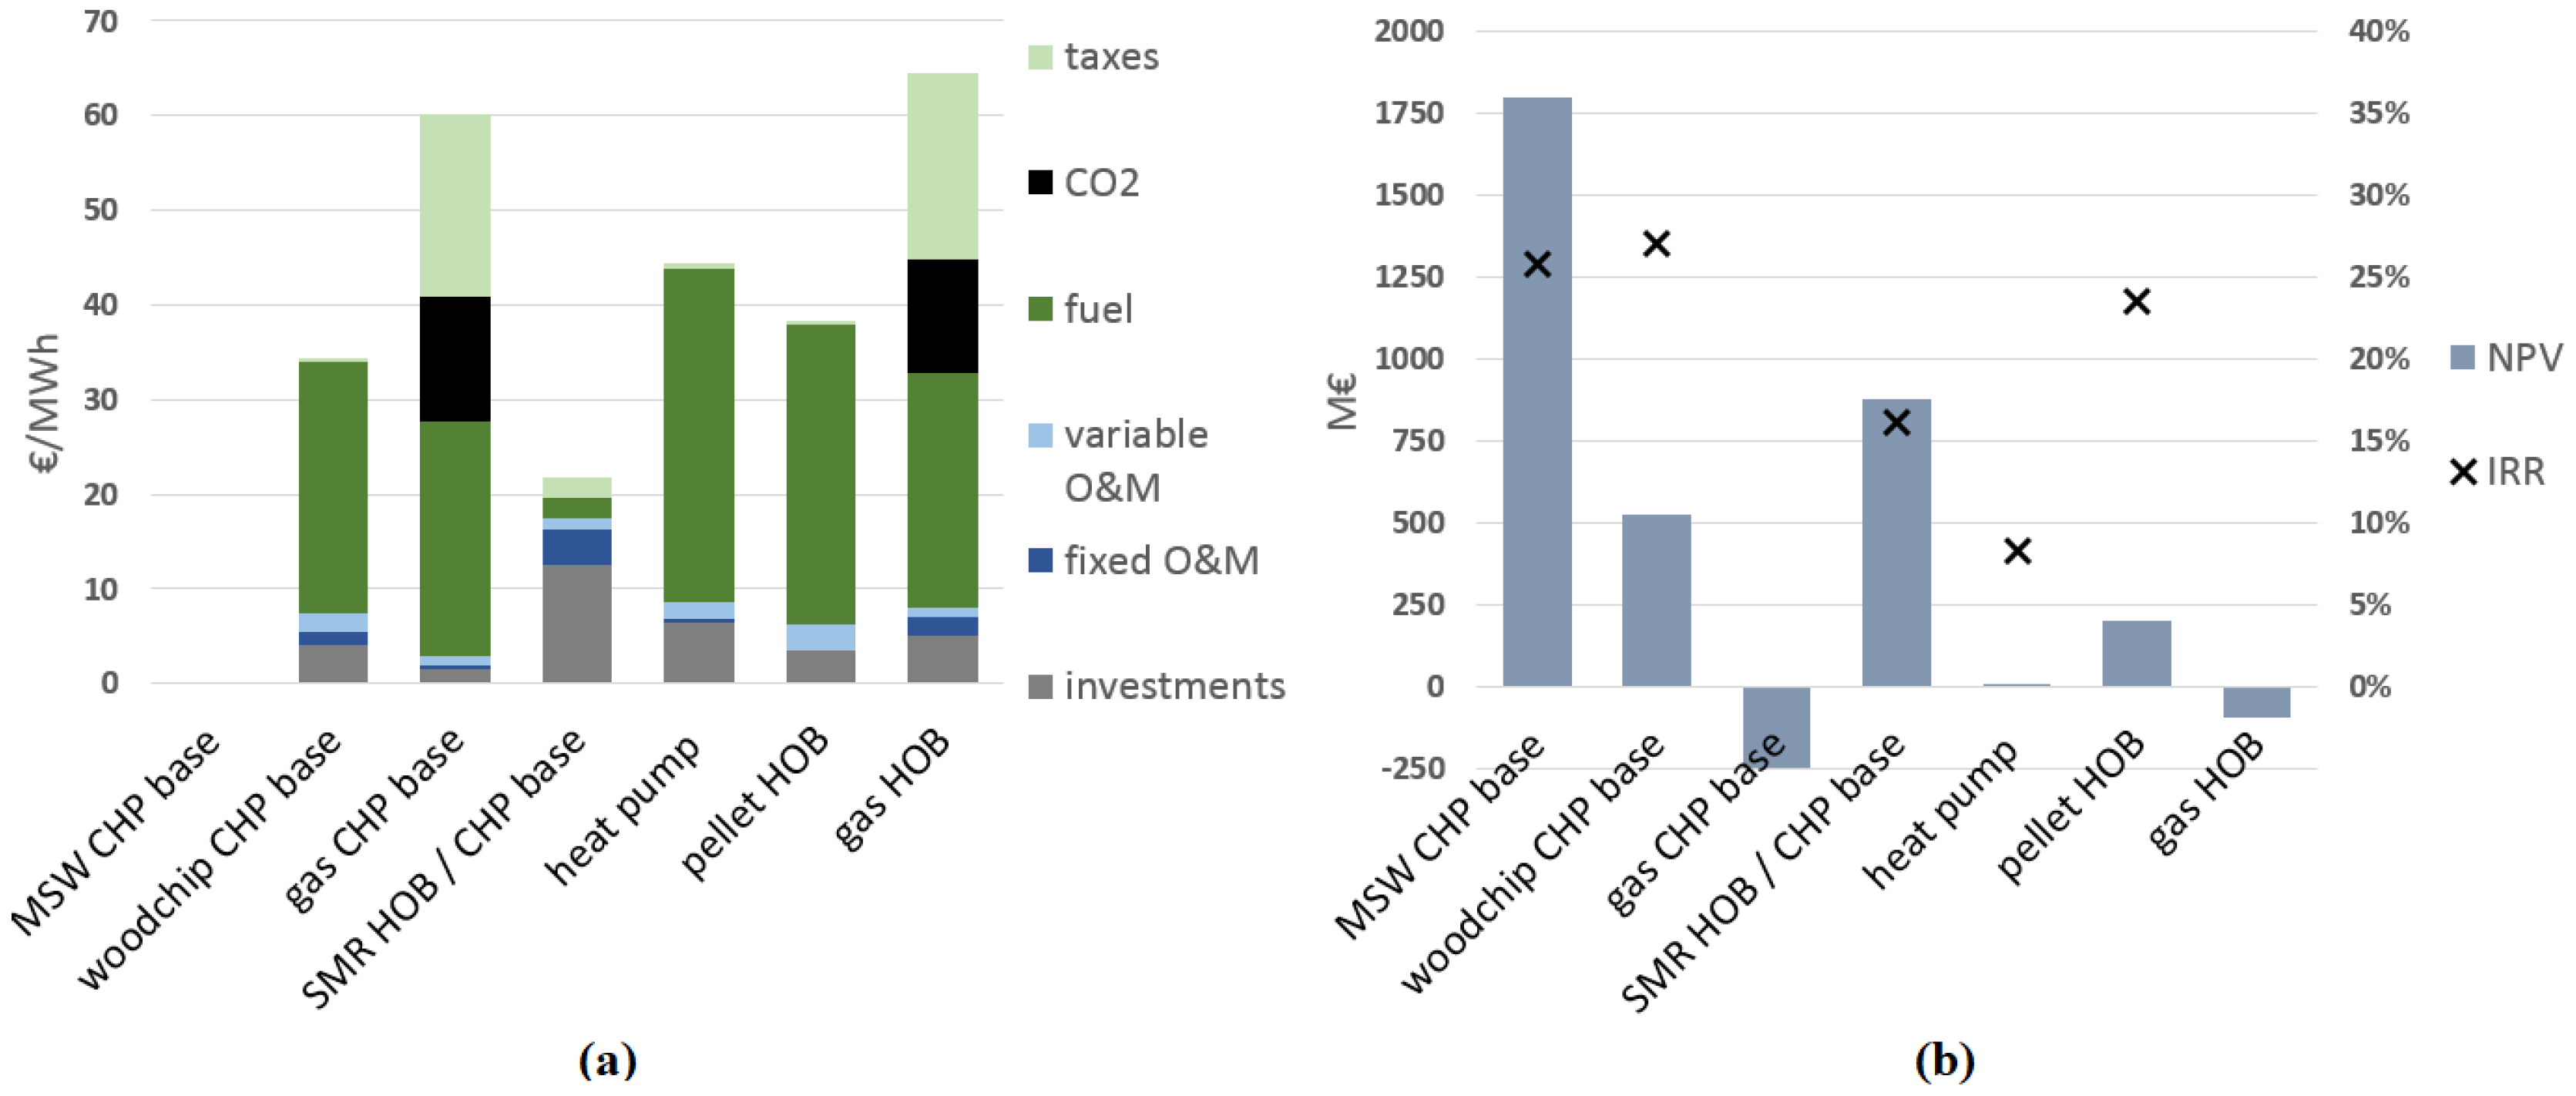
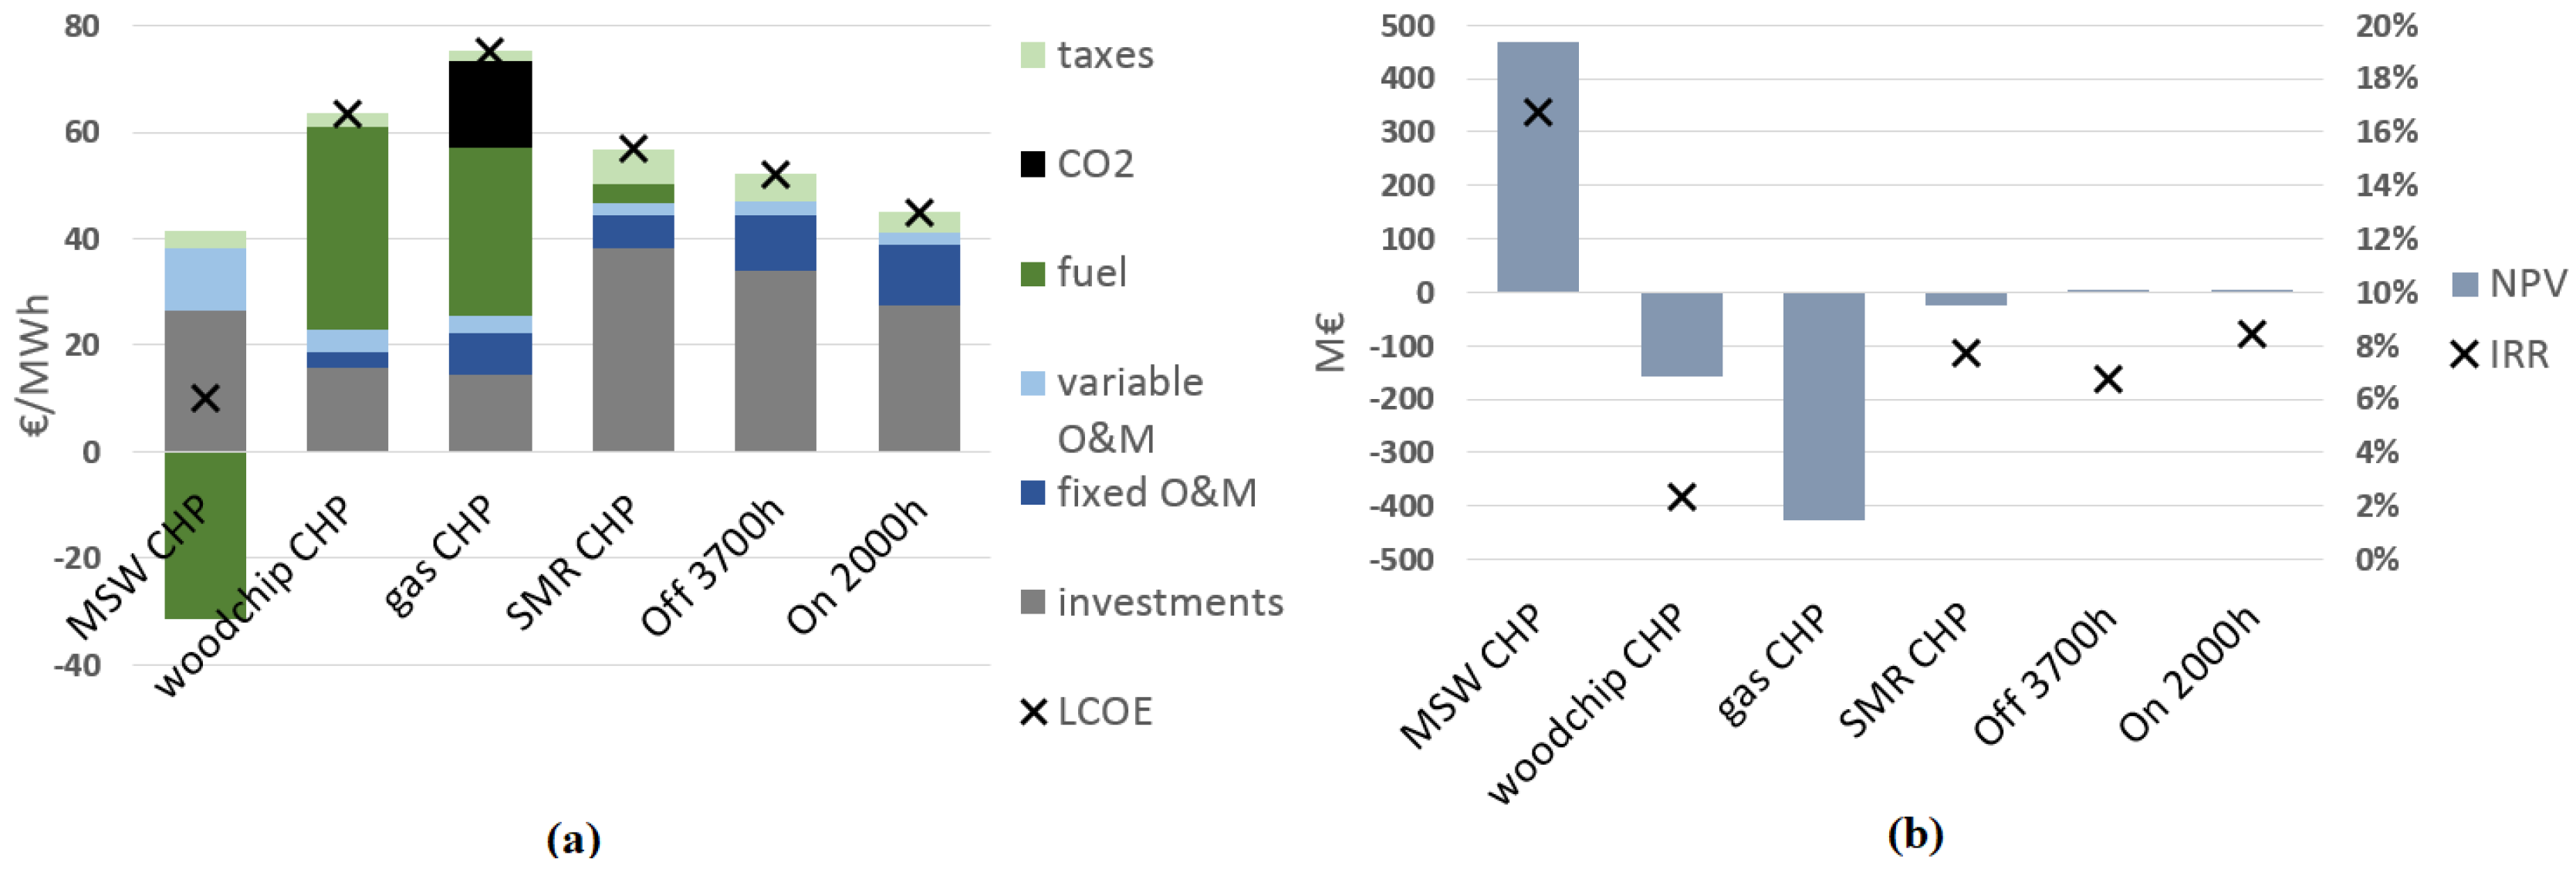
Running the investment models based on these hour counts results in the data showcased in Figure 10 and Figure 11. Generally, the IRRs and NPVs for heat production here seem high. The presumed realized heat price of 47.5 €/MWh for the plants is fairly high and this is the prime reason for this effect, while the high efficiencies facilitated by the flue gas condensation also play their part. The high IRRs gained from the model could also be correct but due to the monopolistic nature of the market they would also cannibalize the profits of the old plants and thus, would not actually be realized as investments. Unsurprisingly the MSW CHP and SMR options enjoy the highest NPVs, as the plants enjoy cost effective production costs while they are huge investments. MSW’s non-existent LCOH in the model is explained by the heat revenue and the negative fuel cost which overpower most of the costs related to both investment and operation. Gas based production is driven fully out of the list of valid options, mostly by the rising CO2 costs and taxation.
The situation is different for the additional investments towards CHP production, as the only option with a positive NPV is the MSW CHP. The SMR CHP is extremely close to a positive value but apart from the MSW CHP, the additional investments all lose to wind power. The effect of the higher WACC for SMRs still shows here, as the nuclear CHP does actually have a higher IRR than the offshore wind and slightly less than the onshore wind. The objective riskiness of both SMR and offshore wind investments will most likely play a large part in the actual financing opportunities for both plants and determine which would be a more valid choice. While the CHP plants do not necessarily look like opportune investment choices, the overall IRRs of the plants presented in Table 6 show that if considered as a full investment, they are still valid options. These were calculated by summing the yearly FCFs gained from Equation (6) for the HOB base and the additional CHP investment for each fuel type before calculating the IRR/NPV using Equation (8). Still as noted earlier, the possibly inflated numbers for the heat plants might have the same effect here as well. It’s also important to note that while wind power enjoys a low LCOE and good IRR here, the simplified calculations behind these do not fully take into account all of the factors regarding the investment in generation that cannot be dispatched when necessary. The actual values for the wind turbines might be more debatable depending on how the generation is split between highly valued peak hours and hours of low demand and price. As Joskow notes, LCOE for intermittent generation is a heavily flawed numeric that ignores multiple factors and the actual costs can be much higher [68].
4.3. Sensitivity Analysis of the SMR Plant
Due to the high amount of uncertainty in the SMR values even compared to the other data, a basic sensitivity analysis was performed on the HOB and the additional investment towards a CHP plant. The analysis was performed by adjusting the following listed values by ±20% compared to the base values.
- Full load hours (FLH)
- Capital expenditure (CAPEX)
- Weighted average cost of capital (WACC)
- Total O&M including both fixed and variable O&M costs
- Heat or electricity price depending on the plant
- Fuel price
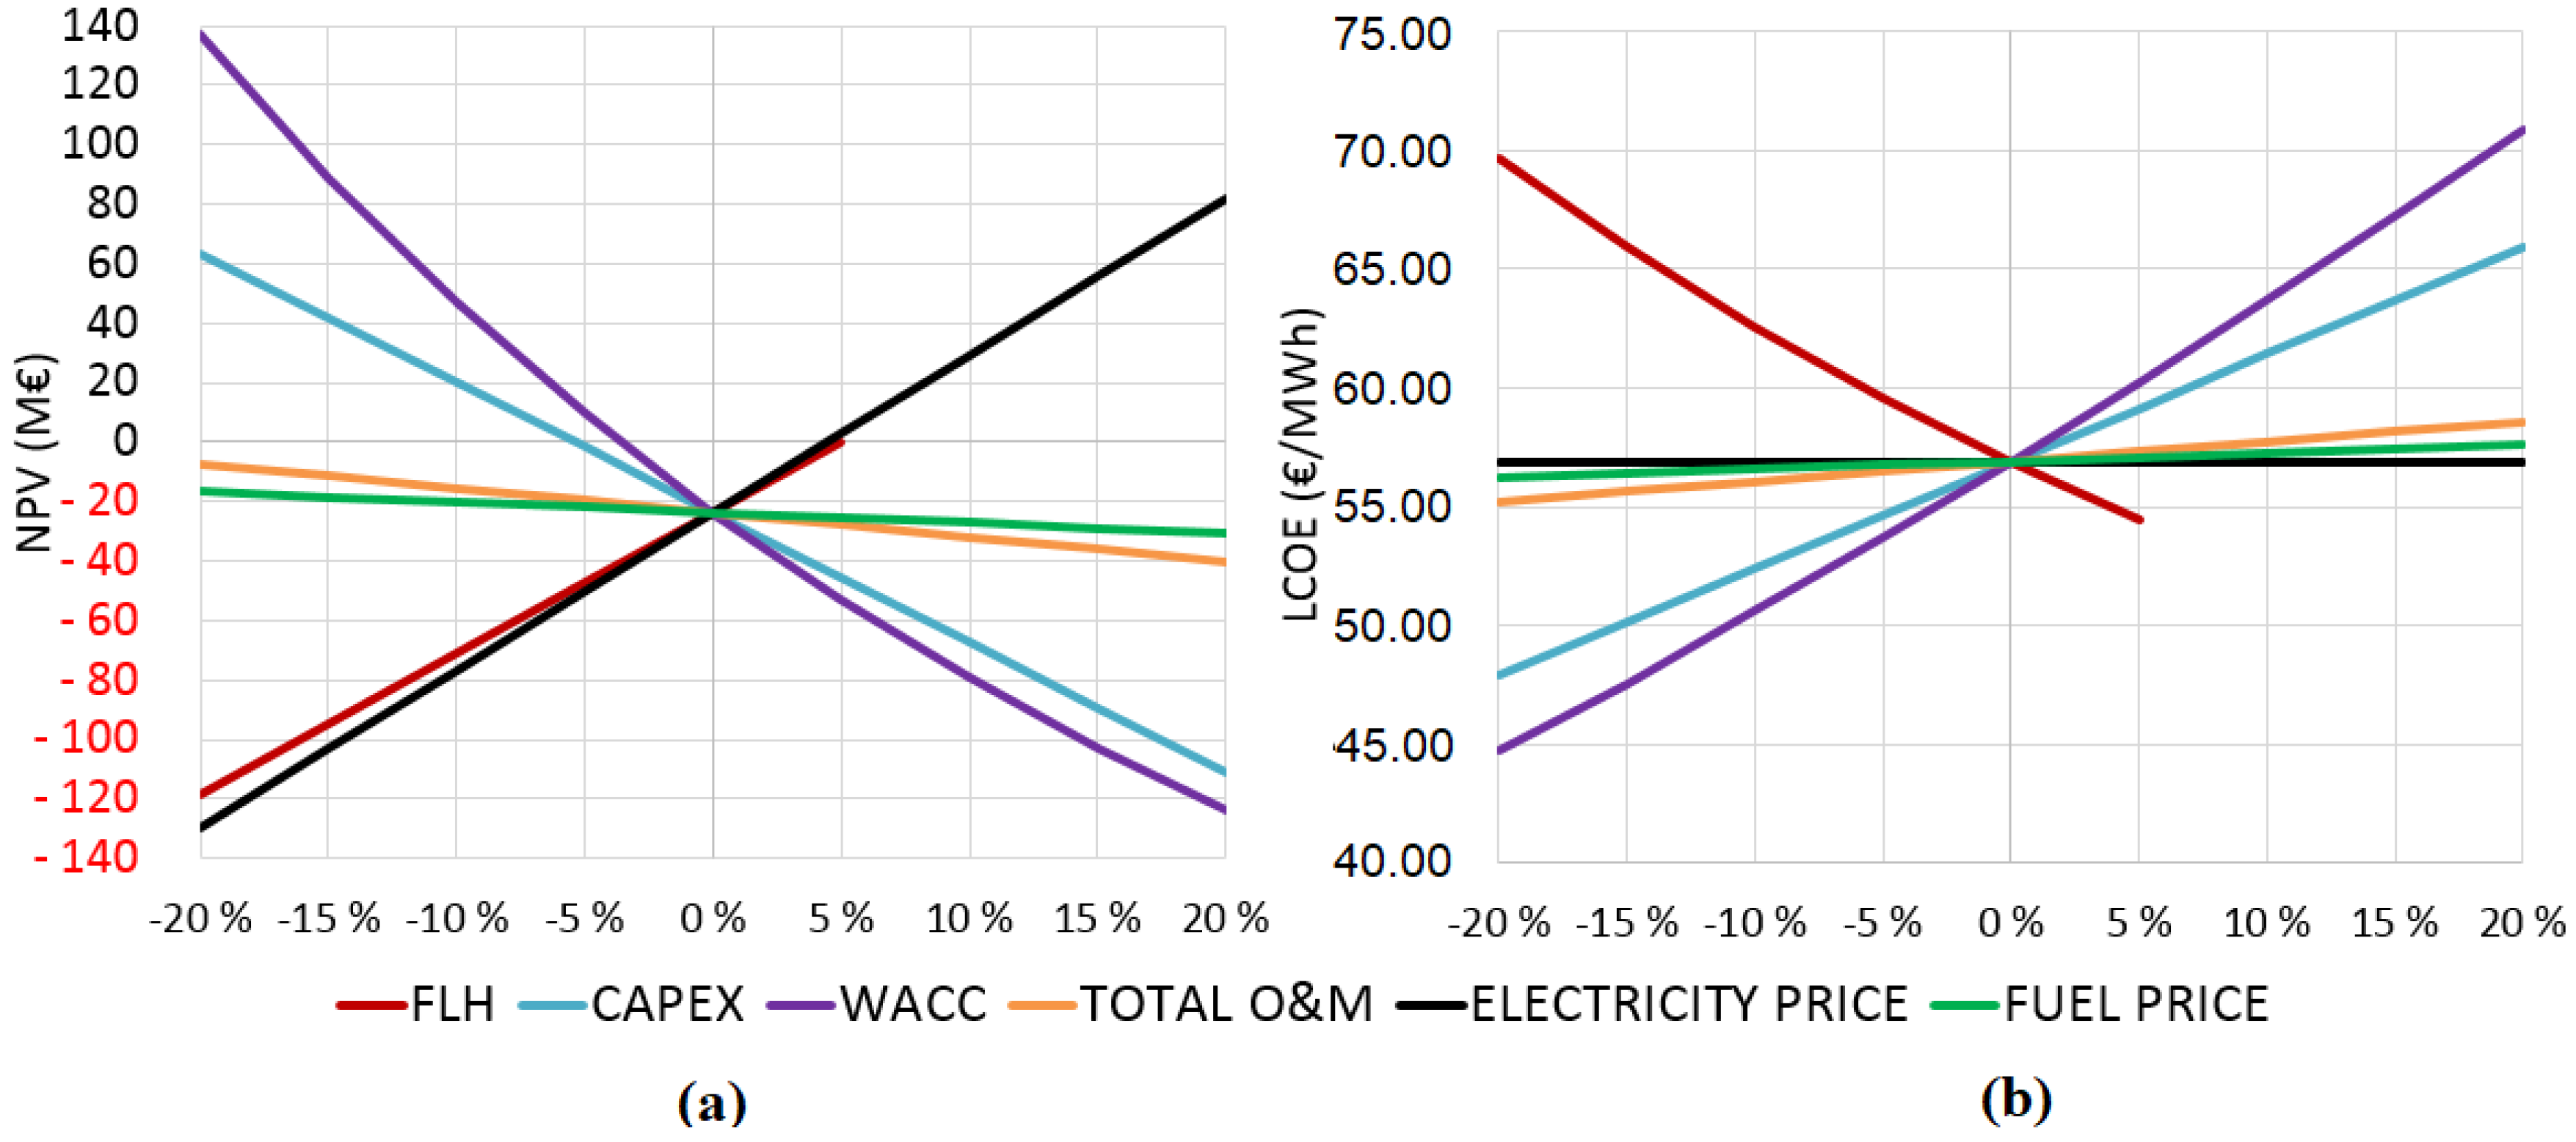
The results are displayed in Figure 12 and Figure 13. As presumable, adjusting the O&M costs and the fuel prices at this level do not necessarily affect the plants in a significant manner. The capital cost of the investments is significant, more so on the CHP side as the size of the investment compared to the amount of production achieved is larger. Generally speaking the common basis of the plants means that the figures are similar, but all of the factors are amplified in their effect on the CHP side compared to the HOB and the additional investment is considerably more vulnerable to any changes to the base presumptions. The truly significant factors are the full load hours, price achieved from the sales of the production and the cost of capital. The role of the SMR as a baseload plant is critical, as even rather minor changes to the number of hours achieved will have a significant effect on the profitability of the plant.
Still, perhaps the most worrying factor is the effect of the WACC on the profitability of the plants. The WACC used by the TEA reports-8.9%—would be equal to an increase of about 11% on the figures from the base value of 8% used in the scenario. The overall range displayed here for WACC is between 6.4% and 9.6%. The success of the FOAK plants as proof that the plants can be built and that they function as planned is crucial if the goal is to keep the cost of capital down for potential further (NOAK) plants. The 8% was used here as a presumption of the level the WACC would reach in a NOAK plant but once again, the development of this is difficult to predict. While the effect of the WACC is not linear and decreases with additional growth, the financing of the plant will most likely remain one of the most critical factors in the decision to invest in a new plant. This is not necessarily surprising, as the SMR plants still share a similar relationship between investment and operating costs to large nuclear. As noted by Roques et al. the capital intensive nuclear generation is extremely dependent on the discount rate [69].
It should also be noted that the presumed efficiency for the CHP plant was a conservative assumption and fairly low compared to most other CHP options. In the case that the realized efficiency for electricity production is higher, the plant’s NPV and LCOE would most likely move towards more preferable values along most of the factors analyzed here.
5. Discussion
As the scenario analysis contains a fair amount of uncertainty, the most important takeaways from it are rather general ideas. The SMR HOB and CHP both have potential as baseload plants. This is especially true when considering which plants they primarily run against. While biomass and especially waste might seem like attractive options, both should be looked at through the lens of fuel supply and its sustainability. If considering the fuel sourcing for both and additionally the siting for biomass, both must be considered quite limited in their capacity for expansion. In this case, the question starts to move away from “What is the cheapest way to produce heat sustainably?” towards “What options for sustainable heat production are there left?”.
In this discussion, based on the scenario runs, the SMR option is rather strong. Compared to, for example, the pellet HOBs and heat pumps that the companies Helen and Fortum have invested in the greater Helsinki region, heat produced by SMR HOB is cheaper based on its LCOH and its NPV and IRR values seem comparatively strong. Similarly to the currently existing situation, the trend of investments towards HOBs instead of CHP plants also seems to continue. While the investments would overall be profitable, the additional investments compared to just building a HOB do not necessarily justify themselves. This is especially true if wind power’s learning rate stays at its presumed level and its LCOE continues to drop. The continued build-up of wind power might still also result in a resurgence of CHP, if there is enough monetary value given to the ability to support the power system when it suffers from the negative effects of high amounts of intermittent generation. The SMR CHP is already very close to profitability at the WACC of 8% and if it could realize additional profits through load following and heat storage, it would most likely be a more viable option. Still as noted in the sensitivity analysis, the FLH amount is critical to the profitability of the SMR CHP and if the increased amount of wind power drives other production out of the market, the CHP investment starts to look undesirable.
Even if the sustainability of expanding the use of biomass might be questionable, the option should be assessed. The main comparisons are between SMR and pellet HOBs and SMR and woodchip CHP plants. Between the HOBs, the pellet option has some significant advantages. While the SMR LCOH is lower, the pellet HOB has significantly lower initial investment costs and a higher IRR. The same point of lower initial investment also applies to the woodchip CHP. It should also not be ignored that the SMR is built with a lifetime of 60 years in mind. While this has some advantages in the form of overall longevity, it also leaves the plants profitability more vulnerable to changes unforeseeable at the point of the investment decision. In comparison, the woodchip CHP has a lifespan of 30 years, while a pellet HOB would need to be replaced after 20 years. Also, while still vulnerable to changes over time, any life and depreciation time of over 7 years for an SMR HOB in the investment model does still produce a positive NPV. This brings the credibility of the values used to question, but functions as a starting point to note that the plant does not require its full lifetime to become profitable.
While gas production was mostly driven out in this scenario by taxation and CO2 pricing, there are still cases where this might not necessarily be certain. The CO2 and gas prices can change beyond assumptions used here, while the plants are still cheap and extremely maneuverable. If one of SMR CHPs’ selling points is its load following capacity, it could also face competition in this field from peaking gas plants. Gas HOBs might also still continue to see investments to fulfil the peak load demand as they are among the lowest cost plants with regard to investment cost. The secondary option for this would be electrical boilers, which could fulfil similar ramping role.
Similar to the electrical boilers, heat pump profitability is also dependent on the relation between the heat and electricity pricing. While most likely profitable, the expansion of the capacity is also limited by the amount of heat sources available close to the network. It should also be noted that district cooling is also an opportunity for heat pumps that was ignored here and would most likely increase their profitability.
Between the SMR HOB and CHP plant, the HOB seems like the more stable investment. If built, the plant would most likely provide stable baseload at a low cost over its lifetime, if the network it is connected to has a high enough base heat demand. A city the size of Helsinki, even without the full metropolitan area, would most likely be able to support a module or two. The CHP plant is a more complicated matter. While the electricity price is presumed to rise here, estimating in detail the level and volatility of the electricity price series with the presumed high levels of wind power is outside of the scope of this work.
The uncertainty of the base data still permeates most of the results presented here. The sensitivity analysis performed provides an initial view of what kind of effect various developments to the plant data could have. While the NPV and IRR values for the HOB presented here might seem somewhat unrealistic, the profitability and the affordability of the production seem to be fairly stable even under changes to some primary values. For the additional investment towards a CHP plant, the situation is almost reversed as the already unprofitable plants NPV does decrease in a noteworthy manner with even minor changes. For both plants, the financing of the plant will be critical and 2030 as a starting point might seem early as the plants will need to prove themselves to be both financially and technically competitive for the cost of capital to drop down to suitable levels.
6. Conclusions
It might still be too early to definitively answer the main question of this work: Under which assumptions would SMRs be financially appealing for DH production? Nevertheless, the initial results gained here do seem promising for any DH network with a large enough base heat demand that cannot be directly supplied alone by MSW incineration plants and where stringent CO2 emission reduction targets are pursued. The SMR technology itself seems suitable for district heating. The small scale means that a single module can fit into a fairly small DH network. At the same time, the modular nature of SMRs also means that the plants can be built for a variety of production configurations. At the moment, producing only heat seems like the better choice from the return on investment point of view, but this will rely heavily on the future development of both the electricity and heating markets. The recent increase in power rating of 20% for the NuScale SMR without an increase in the capital costs means that even though the numbers used here contain a fair amount of uncertainty, the acceptable margin of error has grown significantly when considering the credibility and accuracy of the results. If the financing costs can be kept down and generating the full baseload by MSW and/or biomass is not possible or sustainable, SMRs could be a recommendable future option for sustainable heat production.
It would also be important to have this foresight in the development of national legislation: currently, Finnish nuclear licensing legislation is aimed at individual large nuclear generation units, whereas the introduction of small modular reactors into commercial use might need a change of legislation to allow the licensing of common reactor designs instead of heavy and time-consuming full licensing procedure of each individual unit. This development would also most likely require heavier international co-operation between authorities to utilize common guidelines for licensing to truly achieve unified reactor-fleets that can utilize the economies of scale on a wider scale.
Author Contributions
K.V. is the main author of this work. He created the analysis and calculation tool used, did the data and literature search, analysed the results and wrote the majority of manuscript. S.S. wrote minor parts of the manuscript, participated in the literature search and commented extensively the work and manuscript.
Funding
No external funding was received for this work. Aalto university covers the publication costs.
Conflicts of Interest
The authors declare no conflict of interest. This work is a part of Konsta Värris M.Sc. and D.Sc. studies. The work is based on public data sources and all data used is reported in this manuscript or in the references given.
Abbreviations
The following abbreviations are used in this manuscript:
| 4DS | The Nordic 4 °C Scenario |
| CAPEX | Capital Expenditure |
| CCGT | Combined Cycle Gas Turbine |
| CHP | Combined Heat and Power |
| ETS | Emissions Trading System |
| EU | European Union |
| FLH | Full Load Hours |
| FOAK | First of a Kind |
| HOB | Heat-Only Boiler |
| IPWR | Integral Pressurized Water Reactor |
| IRR | Internal Rate of Return |
| LCOE | Levelized Cost of Electricity |
| LCOH | Levelized Cost of Heat |
| LNPP | Large Nuclear Power Plant |
| MSW | Municipal Solid Waste |
| NETP16 | Nordic Energy Technology Perspectives 2016 |
| NOAK | Nth of a Kind |
| NPP | Nuclear Power Plant |
| NPV | Net Present Value |
| O&M | Operations & Maintenance |
| PWR | Pressurized Water Reactor |
| RPV | Reactor Pressure Vessel |
| SMR | Small Modular Reactor |
| TEA | Techno-Economic Assessment |
| WACC | Weighted Average Cost of Capital |
Appendix A

Table A1.
The presumed ramp-up of the capital costs of new power plants towards their completion in year t.
Table A1.
The presumed ramp-up of the capital costs of new power plants towards their completion in year t.
| Plant Type | Production Type | Construction Time (years) | t-5 | t-4 | t-3 | t-2 | t-1 | t |
|---|---|---|---|---|---|---|---|---|
| MSW | CHP | 3 | 0% | 0% | 40% | 45% | 15% | 0% |
| HOB | 3 | 0% | 0% | 20% | 35% | 35% | 10% | |
| Woodchips | CHP | 5 | 15% | 25% | 25% | 20% | 15% | 0% |
| HOB | 1 | 0% | 0% | 0% | 0% | 90% | 10% | |
| Pellet | CHP | 5 | 15% | 25% | 25% | 20% | 15% | 0% |
| HOB | 1 | 0% | 0% | 0% | 0% | 90% | 10% | |
| Gas | CHP | 3 | 0% | 0% | 40% | 45% | 15% | 0% |
| HOB | 1 | 0% | 0% | 0% | 0% | 90% | 10% | |
| Coal | CHP | 5 | 15% | 25% | 25% | 20% | 15% | 0% |
| HOB | 1 | 0% | 0% | 0% | 0% | 90% | 10% | |
| Nuclear | CHP | 5 | 40% | 22% | 18% | 10% | 10% | 0% |
| HOB | 4 | 0% | 40% | 25% | 20% | 10% | 5% | |
| Heat pumps | HOB | 1 | 0% | 0% | 0% | 0% | 90% | 10% |
| Electrical boiler | HOB | 1 | 0% | 0% | 0% | 0% | 90% | 10% |
| Offshore wind | Power | 3 | 0% | 0% | 40% | 45% | 15% | 0% |
| Onshore wind | Power | 2 | 0% | 0% | 0% | 20% | 80% | 0% |
References
- Ministery of Economic Affairs and Employment. Minister Tiilikainen: Finland to Ban Coal in 2029—Incentives Package for Faster Phase-Out. Available online: http://tem.fi/en/article/-/asset_publisher/ministeri-tiilikainen-kivihiilen-kielto-2029-kannustepaketti-nopeille-luopujille (accessed on 9 May 2018).
- City Of Helsinki. Climate Protection. Available online: https://www.hel.fi/helsinki/en/housing/environmental/programmes/climate-action/ (accessed on 4 January 2018).
- Ministry of the Environment and Statistics Finland. Finland’s Seventh National Communication under the United Nations Framework Convention on Climate Change. 2017. Available online: https://www.stat.fi/static/media/uploads/tup/khkinv/VII_Climate_Change_16102017.pdf (accessed on 8 April 2019).
- Juuti, P. Valtuustoaloite Helsingissä: Pienet ydinreaktorit jauhamaan kaukolämpöä koteihin [Council Motion in Helsinki: SMRs to Provide District Heating for Homes]. Yle 2017. Available online: https://yle.fi/uutiset/3-9931079 (accessed on 8 January 2018).
- Espoon kaupunki. Valtuusto—Pöytäkirja 11.12.2017/Pykälä 112 [Council—Minutes of Meeting 11.12.2017/Section 112]. 2017. Available online: http://espooprodfi.oncloudos.com/cgi/DREQUEST.PHP?page=meetingitemid=2017430599-12 (accessed on 8 January 2018).
- Värri, K. Market Potential of Small Modular Nuclear Reactors in District Heating. Master’s Thesis, Aalto University, Espoo, Finland, 2018. [Google Scholar]
- World Nuclear Association. Small Nuclear Power Reactors. Available online: http://www.world-nuclear.org/information-library/nuclear-fuel-cycle/nuclear-power-reactors/small-nuclear-power-reactors.aspx (accessed on 13 December 2017).
- Subki, M.H. Small Modular Reactors—Update on International Technology Development Activities. In Proceedings of the 13th INPRO Dialogue Forum on Legal and Institutional Issues in the Global Deployment of SMRs, Vienna, Austria, 18–21 October 2016. [Google Scholar]
- TVO. Laitostoimittaja ilmoittaa, että OL3 EPR:n säännöllinen sähköntuotanto alkaa toukokuussa 2019 [Plant Supplier Informs that OL3 EPR will Begin Routine Power Production in May 2019]. 2017. Available online: http://www.tvo.fi/news/1917 (accessed on 8 January 2018).
- Fennovoima. Hanhikivi 1—Timeline. Available online: https://www.fennovoima.fi/en/hanhikivi-1-project/timeline (accessed on 8 January 2018).
- International Energy Agency/Nordic Energy Research. Nordic Energy Technology Perspectives 2016; IEA: Paris, France, 2016. [Google Scholar]
- Linden, M.; Peltola-Ojala, P. The deregulation effects of Finnish electricity markets on district heating prices. Energy Econ. 2010, 32, 1191–1198. [Google Scholar] [CrossRef]
- Zakeri, B.; Rinne, S.; Syri, S. Wind integration into energy systems with a high share of nuclear power—What are the compromises? Energies 2015, 8, 2493–2527. [Google Scholar] [CrossRef]
- Entso-E. Regional Investment Plan 2017. Available online: https://docstore.entsoe.eu/Documents/TYNDP%20documents/TYNDP2018/rgip_BS_Full.pdf (accessed on 8 April 2019).
- Olkkonen, V.; Rinne, S.; Hast, A.; Syri, S. Benefits of DSM measures in the future Finnish energy system. Energy 2017, 137, 729–738. [Google Scholar] [CrossRef]
- Olkkonen, V.; Ekström, J.; Hast, A.; Syri, S. Utilising demand response in the future Finnish energy system with increased shares of baseload nuclear power and variable renewable energy. Energy 2018, 164, 204–217. [Google Scholar] [CrossRef]
- Hast, A.; Syri, S.; Lekavičius, V.; Galinis, A. District heating in cities as a part of low-carbon energy system. Energy 2018, 152, 627–639. [Google Scholar] [CrossRef]
- Malinauskaite, J.; Jouhara, H.; Czajczýnska, D.; Stanchev, P.; Katsou, E.; Rostkowski, P.; Thorne, R.; Colón, J.; Ponsá, S.; Al-Mansour, F.; et al. Municipal solid waste management and waste-to-energy in the context of a circular economy and energy recycling in Europe. Energy 2017, 141, 2013–2044. [Google Scholar] [CrossRef]
- IPCC. Global Warming of 1.5 °C. An IPCC Special Report on the Impacts of Global Warming of 1.5 °C above Pre-Industrial Levels and Related Global Greenhouse Gas Emission Pathways, in the Context of Strengthening the Global Response to the Threat of Climate Change, Sustainable Development, and Efforts to Eradicate Poverty. 2018. Available online: https://www.ipcc.ch/sr15/ (accessed on 23 May 2019).
- Council, E. Infographic—Non-ETS Emissions by Sector. 2018. Available online: https://www.consilium.europa.eu/en/infographics/non-ets-emissions-by-sector/ (accessed on 8 April 2019).
- Connolly, D.; Lund, H.; Mathiesen, B.; Werner, S.; Möller, B.; Persson, U.; Boermans, T.; Trier, D.; Østergaard, P.; Nielsen, S. Heat Roadmap Europe: Combining district heating with heat savings to decarbonise the EU energy system. Energy Policy 2014, 65, 475–489. [Google Scholar] [CrossRef]
- IAEA. NuScale Power Modular and Scalable Reactor; IAEA: Vienna, Austria, 2013. [Google Scholar]
- Wahlroos, M.; Pärssinen, M.; Manner, J.; Syri, S. Utilizing data center waste heat in district heating—Impacts on energy efficiency and prospects for low-temperature district heating networks. Energy 2017, 140, 1228–1238. [Google Scholar] [CrossRef]
- Eurostat. Harmonized Index of Consumer Prices—Monthly Data. Available online: http://appsso.eurostat.ec.europa.eu/nui/show.do?dataset=prc_hicp_manr&lang=en (accessed on 2 May 2018).
- European Central Bank. Euro Foreign Exchange Reference Rates. Available online: https://www.ecb.europa.eu/stats/policy_and_exchange_rates/euro_reference_exchange_rates/html/index.en.html (accessed on 11 April 2018).
- Osborne, M.J. A resolution to the NPV-IRR debate? Q. Rev. Econ. Financ. 2010, 50, 234–239. [Google Scholar] [CrossRef]
- Branker, K.; Pathak, M.; Pearce, J. A review of solar photovoltaic levelized cost of electricity. Renew. Sustain. Energy Rev. 2011, 15, 4470–4482. [Google Scholar] [CrossRef] [Green Version]
- Energinet.dk, Danish Energy Agency. Technology Data for Energy Plants August 2016—Update June, October and November 2017; Energinet.dk, Danish Energy Agency: København, Denmark, 2017.
- Energinet.dk, Danish Energy Agency. Technology Data for Energy Plants—Generation of Electricity and District Heating, Energy Storage and Energy Carrier Generation and Conversion; Energinet.dk, Danish Energy Agency: København, Denmark, 2015.
- Lehtomäki, J. Biomassaa käyttävien yhteistuotantolaitosten investointien kannattavuuden edellytykset ja ohjausmekanismit [Prerequisites and Needed Policy Mechanisms for Feasibility of Biomass-Fired Combined Heat and Power Plant]. Master’s Thesis, Aalto University, Espoo, Finland, 2017. [Google Scholar]
- Lundén, K. “Tänä päivänä ei Suomeen kannata rakentaa sähkön ja lämmön yhteistuotantoa“ [“Building CHP in Finland Today Does not Pay off”]”. Talouselämä 2015. Available online: https://www.talouselama.fi/uutiset/tana-paivana-ei-suomeen-kannata-rakentaa-sahkon-ja-lammon-yhteistuotantoa/eee6a323-2dc1-3071-9195-bfd34924d6e1 (accessed on 9 Aril 2018).
- Helin, K.; Zakeri, B.; Syri, S. Is District Heating Combined Heat and Power at Risk in the Nordic Area?—An Electricity Market Perspective. Energies 2018, 11, 1256. [Google Scholar] [CrossRef]
- Helin, K.; Jääskeläinen, J.; Syri, S. Energy Security Impacts of Decreasing CHP Capacity in Finland. In Proceedings of the 2018 15th International Conference on the European Energy Market (EEM), Lodz, Poland, 27–29 June 2018; pp. 1–5. [Google Scholar] [CrossRef]
- Rinne, S.; Syri, S. The possibilities of combined heat and power production balancing large amounts of wind power in Finland. Energy 2015, 82, 1034–1046. [Google Scholar] [CrossRef]
- Rinne, S.; Syri, S. Heat pumps versus combined heat and power production as CO2 reduction measures in Finland. Energy 2013, 57, 308–318. [Google Scholar] [CrossRef]
- Madlener, R.; Vögtli, S. Diffusion of bioenergy in urban areas: A socio-economic analysis of the Swiss wood-fired cogeneration plant in Basel. Biomass Bioenergy 2008, 32, 815–828. [Google Scholar] [CrossRef]
- Surina, J. NuScale Plant Market Competitiveness & Financeability. 2015. Available online: https://newsroom.nuscalepower.com/sites/nuscalepower.newshq.businesswire.com/files/press_release/additional/Jay_Surina_-_NuScale_Financial_Breakout_Session_0.pdf (accessed on 23 May 2019).
- Tulkki, V.; Pursiheimo, E.; Lindroos, T.J. District Heat with Small Modular Reactors (SMR). 2017. Available online: http://www.vtt.fi/inf/julkaisut/muut/2017/OA-District-heat-with-Small.pdf (accessed on 24 April 2018).
- Energy Technologies Institute. DECC Small Modular Reactor Techno-Economic Assessment—Project 2 Report. Technical Report; 2016. Available online: https://assets.publishing.service.gov.uk/government/uploads/system/uploads/attachment_data/file/665198/TEA_Project_2_Summary_Report_-_Systems_Optimisation_Modelling_SMRs.pdf (accessed on 24 April 2018).
- Rubio, G.; Tricot, A. SMR Techno-Economic Assessment—Project 1: Comprehensive Analysis and Assessment. Technical Report. Atkins; 2016. Available online: https://assets.publishing.service.gov.uk/government/uploads/system/uploads/attachment_data/file/665197/TEA_Project_1_Vol_1_-_Comprehensive_Analysis_and_Assessment_SMRs.pdf (accessed on 24 April 2018).
- Rangel, L.E.; Lévêque, F. Revisiting the Cost Escalation Curse of Nuclear Power: New Lessons from the French Experience. 2012. hal-00780566. Available online: https://hal-mines-paristech.archives-ouvertes.fr/file/index/docid/780566/filename/I3WP_12-ME-08.pdf (accessed on 23 May 2019).
- Ingersoll, D.; Colbert, C.; Houghton, Z.; Snuggerud, R.; Gaston, J.; Empey, M. Can nuclear power and renewables be friends? In Proceedings of the ICAPP, Nice, France, 3–6 May 2015; pp. 3–6. [Google Scholar]
- Ea Energy Analyses. Analysis of Biomass Prices—Future Danish Prices for Straw, Wood Chips and Wood Pellets “Final Report”. 2013. Available online: http://www.ea-energianalyse.dk/reports/1280_analysis_of_biomass_prices.pdf (accessed on 11 April 2018).
- Capros, P.; De Vita, A.; Tasios, N.; Siskos, P.; Kannavou, M.; Petropoulos, A.; Evangelopoulou, S.; Zampara, M.; Papadopoulos, D.; Nakos, C.; et al. EU Reference Scenario 2016-Energy, transport and GHG Emissions Trends to 2050; European Commission Directorate—General for Energy, Directorate—General for Climate Action and Directorate—General for Mobility and Transport: European Commission: Luxembourg, 2016. [Google Scholar]
- Gawel, E.; Strunz, S.; Lehmann, P. A public choice view on the climate and energy policy mix in the EU—How do the emissions trading scheme and support for renewable energies interact? Energy Policy 2014, 64, 175–182. [Google Scholar] [CrossRef]
- IPCC. 2006 IPCC Guidelines for National Greenhouse Gas Inventories—Volume 2—Energy—Chapter 2—Stationary Combustion. Available online: http://www.ipcc-nggip.iges.or.jp/public/2006gl/pdf/2_Volume2/V2_2_Ch2_Stationary_Combustion.pdf (accessed on 11 April 2018).
- TradeTech. Market Review. Nuclear Rev. 2017, 592, 6–8. [Google Scholar]
- World Nuclear Association. The Economics of Nuclear Power. Available online: http://www.world-nuclear.org/information-library/economic-aspects/economics-of-nuclear-power.aspx (accessed on 12 December 2017).
- IAEA. Status Report 106—NuScale Power Modular and Scalable Reactor (NuScale); IAEA: Vienna, Austria, 2011. [Google Scholar]
- Heinonen, T.; Pukkala, T.; Mehtätalo, L.; Asikainen, A.; Kangas, J.; Peltola, H. Scenario analyses for the effects of harvesting intensity on development of forest resources, timber supply, carbon balance and biodiversity of Finnish forestry. For Policy Econ. 2017, 80, 80–98. [Google Scholar] [CrossRef] [Green Version]
- Ranta, T.; Karhunen, A.; Laihanen, M. Factors behind the development of forest chips use and pricing in Finland. Biomass Bioenergy 2017, 98, 243–251. [Google Scholar] [CrossRef]
- Olsson, O.; Hillring, B. The wood fuel market in Denmark—Price development, market efficiency and internationalization. Energy 2014, 78, 141–148. [Google Scholar] [CrossRef]
- Thrän, D.; Peetz, D.; Schaubach, K.; Backéus, S.; Benedetti, L.; Bruce, L.; Global Wood Pellet Industry and Trade Study 2017. IEA Bioenergy Task 40. 2017. Available online: http://task40.ieabioenergy.com/wp-content/uploads/2013/09/IEA-Wood-Pellet-Study_final-2017-06.pdf (accessed on 18 April 2018).
- Yle. 1,5 miljoonan suomalaisen sekajätepussit kipataan valtavaan bunkkeriin—voiton käärivät vantaalaiset [The Municipal Waste from 1,5 Million Finns Are Thrown into a Huge Bunker—Profits Are Enjoyed by Those Living in Vantaa]. 2017. Available online: https://yle.fi/uutiset/3-9573508 (accessed on 17 April 2018).
- Energia, V. Vantaan Jätevoimala [The Waste CHP Plant of Vantaa]. Available online: http://www.jatehuoltoyhdistys.fi/ladattavat_tiedostot/JHP12_Kalle_Patomeri.pdf (accessed on 17 April 2018).
- Finnish Energy. Kaukolämpötilasto [District Heating Statistics]. Available online: https://energia.fi/ajankohtaista_ja_materiaalipankki/materiaalipankki/kaukolampotilasto.htmlmaterial-view (accessed on 4 May 2018).
- Helen. Isot lämpöpumput saapuvat Helsinkiin [Large Heat Pumps Arrive to Helsinki]. Available online: https://www.helen.fi/uutiset/2017/lampopumput/ (accessed on 4 May 2018).
- Helen. Pelletti syttyi Suomen suurimmassa pellettikattilassa [Pellet Combusts in the Largest Pellet Boiler in Finland]. Available online: https://www.helen.fi/uutiset/2017/pelletti-syttyi-pellettikattilassa/ (accessed on 4 May 2018).
- Fortum. Puhtaampaa lämpöä puupelleteillä [Cleaner Heat With Wood Pellets]. Available online: https://asiakkaalle.fortum.fi/koti-asuminen/pelletit-puhtaampaa-lampoa/ (accessed on 4 May 2018).
- Institute, F.M. Finnish Meteorological Institute—Download Observations. Available online: http://en.ilmatieteenlaitos.fi/download-observations!/ (accessed on 27 April 2018).
- Nordpool. Historical Market Data. Available online: https://www.nordpoolgroup.com/historical-market-data/ (accessed on 4 January 2018).
- Finnish Energy. Kaukolämmön hintatilasto [Price Statistics of District Heating]. Available online: https://energia.fi/ajankohtaista_ja_materiaalipankki/materiaalipankki/kaukolammon_hintatilasto.htmlmaterial-view (accessed on 2 May 2018).
- Persson, U.; Werner, S. Heat distribution and the future competitiveness of district heating. Appl. Energy 2011, 88, 568–576. [Google Scholar] [CrossRef]
- Tax Administration. Sähkön ja eräiden polttoaineiden verotaulukot [Tax Rates on Electricity and Certain Fuels]. Available online: https://www.vero.fi/yritykset-ja-yhteisot/tietoa-yritysverotuksesta/valmisteverotus/valmisteverolajit/sahko_ja_eraat_polttoaineet/sahkon_ja_eraiden_polttoaineiden_verota/ (accessed on 2 May 2018).
- Tax Administration. Energiaverotusohje 2016 [Energy Tax Guide 2016]. Available online: https://www.vero.fi/syventavat-vero-ohjeet/ohje-hakusivu/56228/energiaverotusohje_201/ (accessed on 2 May 2018).
- Caruna. Verkkopalveluhinnasto [Transmission Grid Service Catalogue]. Available online: https://caruna-cms-prod.s3-eu-west-1.amazonaws.com/verkkopalveluhinnasto_1.3.2017_caruna_espoo_oy.pdf?zpLpozmPsbbFEknqgxrSOi2cYeZ0M_pR (accessed on 2 May 2018).
- Tax Administration. Tuloverotus—osakeyhtiö ja osuuskunta [Income Taxation—Corporation and Cooperative]. Available online: https://www.vero.fi/yritykset-ja-yhteisot/tietoa-yritysverotuksesta/tuloverotus/osakeyhtio-ja-osuuskunta/ (accessed on 2 May 2018).
- Joskow, P.L. Comparing the Costs of Intermittent and Dispatchable Electricity Generating Technologies. Am. Econ. Rev. 2011, 101, 238–241. [Google Scholar] [CrossRef]
- Roques, F.A.; Nuttall, W.J.; Newbery, D.M. Using Probabilistic Analysis to Value Power Generation Investments under Uncertainty. 2006. Available online: https://www.eprg.group.cam.ac.uk/wp-content/uploads/2014/01/eprg0619.pdf (accessed on 23 May 2019).


Figure 4.
The modelled district heat production distribution in 2030 in MW.

Figure 5.
The modelled district heat production distribution in 2050 in MW.

Figure 6.
The modelled district heat production distribution with small modular reactor (SMR) CHP in 2030 in MW.
Figure 6.
The modelled district heat production distribution with small modular reactor (SMR) CHP in 2030 in MW.

Figure 7.
The modelled district heat production distribution with SMR CHP in 2050 in MW.

Figure 8.
The marginal cost of district heat production over a year in 2030 (a) and 2050 (b) using a 100 h moving average.
Figure 8.
The marginal cost of district heat production over a year in 2030 (a) and 2050 (b) using a 100 h moving average.

Figure 9.
The sorted average hourly production costs over a year in 2030 (a) and 2050 (b).

Figure 10.
The LCOH breakdown (a) and the NPV and IRR (b) of HOBs and the HOB bases for CHP plants.

Figure 11.
The LCOE breakdown (a) and the NPV and IRR (b) of the additional CHP investments considered with wind power values for reference.
Figure 11.
The LCOE breakdown (a) and the NPV and IRR (b) of the additional CHP investments considered with wind power values for reference.

Figure 12.
The NPV (a) and the LCOH (b) values from the sensitivity analysis performed on the SMR HOB.
Figure 12.
The NPV (a) and the LCOH (b) values from the sensitivity analysis performed on the SMR HOB.

Figure 13.
The NPV (a) and the LCOE (b) values from the sensitivity analysis performed on the additional investment towards a SMR CHP plant.
Figure 13.
The NPV (a) and the LCOE (b) values from the sensitivity analysis performed on the additional investment towards a SMR CHP plant.

| Plant Type | MSW | Woodchip | Pellet | Natural Gas | NuScale SMR | Heat Pump | Electrical Boiler |
|---|---|---|---|---|---|---|---|
| heat capacity (MWdh) | 300 | 300 | 300 | 300 | 300 | 20 | 20 |
| efficiencydh | 97.6% | 108.0% | 108.0% | 104.0% | 93.8% | 380.0% | 99.0% |
| lifetime (a) | 20 | 20 | 20 | 25 | 60 | 25 | 25 |
| capex (EUR/MWdh) | 1,595,000 2 | 500,000 | 250,000 | 90,000 2 | 1,506,667 | 590,000 | 60,000 |
| variable O&M (EUR/MWhdh) | 5.40 | 1.85 1 | 2.70 | 1.00 | 1.26 | 1.70 | 0.50 |
| fixed O&M (EUR/MWdh/a) | 53,000 | 11,600 1 | 0 | 1900 | 30,000 | 2000 | 1020 |
1 Adjusted according to [30]. 2 Adjusted based on internal discussions and public plant data.
| Plant Type | MSW | Woodchip | Natural Gas | NuScale SMR | Offshore Wind | Onshore Wind |
|---|---|---|---|---|---|---|
| heat capacity (MWdh) | 300 | 300 | 300 | 300 | 0 | 0 |
| power capacity (MWe) | 110 | 145 | 391 | 90 | 12 | 4 |
| total efficiency | 97.00% | 95.00% | 90.0% 2 | 81.3% | 100.00% | 100.00% |
| lifetime (a) | 20 | 30 | 25 | 60 | 30 | 30 |
| capex (€/MWe) | 7,000,000 | 3,000,000 1 | 800,000 | 9,408,750 | 1,990,000 | 910,000 |
| variable O&M (€/MWhe) | 45.15 | 8.06 1 | 4.20 | 6.33 | 2.70 | 2.30 |
| fixed O&M (€/MWe/a) | 0 | 45,556 1 | 27,800 | 150,000 | 37,800 | 22,300 |
1 Adjusted according to [30]. 2 Adjusted based on internal discussions and public plant data.
Table 3.
12-module NuScale plants overnight cost distribution [37].
Table 3.
12-module NuScale plants overnight cost distribution [37].
| Item | M€ |
|---|---|
| Power Modules (FOAK cost plus Fee, Transportation, & Site assembly) | 763 |
| Home Office Engineering and Support | 130 |
| Site Infrastructure | 54 |
| Nuclear Island (RXB, RWB, MCR) | 484 |
| Turbine island( 2 Buildings with 6 turbines each) | 315 |
| Balance of Plant (annex, cooling towers etc.) | 203 |
| Distributables (Temp. Buildings, Field Staff, Const. Eguip., etc.) | 491 |
| Other Costs | 167 |
| Total overnight price | 2606 |
Table 4.
The realized district heating (DH) production mix in the Helsinki Metropolitan area in 2018 and the approximate mixes and production amounts for 2030 [11].
Table 4.
The realized district heating (DH) production mix in the Helsinki Metropolitan area in 2018 and the approximate mixes and production amounts for 2030 [11].
| Year | 2018 | 2030 | ||
|---|---|---|---|---|
| NETP16 | Model | |||
| Plant Type | Plants (MW) | Production (TWh) | Plants (MW) | Production (TWh) |
| Coal | 3.15 | 0.00 | ||
| HOB | 420 | 0 | 0.00 | |
| CHP | 1036 | 0 | 0.00 | |
| Gas | 4.04 | 3.56 | ||
| HOB | 1965 | 2500 | 0.41 | |
| CHP | 970 | 1000 | 3.15 | |
| Oil | 0.00 | 0.00 | ||
| HOB | 1326 | 0 | 0.00 | |
| CHP | 0 | 0 | 0.00 | |
| Biomass | 2.54 | |||
| Pellet | 1.80 | |||
| HOB | 170 | 400 | 1.80 | |
| CHP | 0 | 0 | 0.00 | |
| Woodchip | 3.44 | |||
| HOB | 0 | 0 | 0.00 | |
| CHP | 0 | 500 | 3.44 | |
| Waste | 1.50 | 1.31 | ||
| HOB | 0 | 0 | 0.00 | |
| CHP | 120 | 150 | 1.31 | |
| Electricity | 0.07 | 0.00 | ||
| 0 | 50 | 0.00 | ||
| Heat pumps | 0.03 | 0.89 | ||
| 152 | 200 | 0.89 | ||
| TOTAL | 6094.00 | 11.32 | 4800 | 11.00 |
Table 5.
The full load hours from the two scenarios and general evaluations for the investment model based on these.
Table 5.
The full load hours from the two scenarios and general evaluations for the investment model based on these.
| Production | Plant Size | SMR | Base Case | ||||||
|---|---|---|---|---|---|---|---|---|---|
| Plant Type | Type | (MWdh) | Full Load Hours | Full Load Hours | Evaluation | ||||
| 2030 | 2040 | 2050 | 2030 | 2040 | 2050 | ||||
| Waste | CHP | 150 | 8750 | 8750 | 8755 | 8750 | 8750 | 8760 | 8000 |
| Woodchip | CHP | 300 | 6000 | 5980 | 6070 | 7360 | 7280 | 7460 | 8000 |
| Pellet | HOB | 300 | 3790 | 3860 | 4360 | 4680 | 4760 | 5170 | 4700 |
| Gas | HOB | 300 | 370 | 430 | 1540 | 650 | 750 | 2310 | 1000 |
| CHP | 300 | 3420 | 3260 | 1790 | 4650 | 4450 | 2410 | 3500 | |
| SMR | CHP/HOB | 300 | 7790 | 7780 | 7810 | 0 | 0 | 0 | 8000 |
| Heat pumps | 20 | 3920 | 4330 | 4900 | 4670 | 5160 | 5843 | 5200 | |
Table 6.
The total IRRs for CHP plants.
| Plant Type | MSW | Woodchip | Gas | SMR |
|---|---|---|---|---|
| IRR | 21.97% | 11.59% | - | 11.93% |
© 2019 by the authors. Licensee MDPI, Basel, Switzerland. This article is an open access article distributed under the terms and conditions of the Creative Commons Attribution (CC BY) license (http://creativecommons.org/licenses/by/4.0/).
Share and Cite
MDPI and ACS Style
Värri, K.; Syri, S. The Possible Role of Modular Nuclear Reactors in District Heating: Case Helsinki Region. Energies 2019, 12, 2195. https://doi.org/10.3390/en12112195
AMA Style
Värri K, Syri S. The Possible Role of Modular Nuclear Reactors in District Heating: Case Helsinki Region. Energies. 2019; 12(11):2195. https://doi.org/10.3390/en12112195
Chicago/Turabian StyleVärri, Konsta, and Sanna Syri. 2019. "The Possible Role of Modular Nuclear Reactors in District Heating: Case Helsinki Region" Energies 12, no. 11: 2195. https://doi.org/10.3390/en12112195
Note that from the first issue of 2016, this journal uses article numbers instead of page numbers. See further details here.