Article

Research on Location and Capacity Optimization Method for Electric Vehicle Charging Stations Considering User’s Comprehensive Satisfaction

1
School of Economics and Management, North China Electric Power University, Beijing 102206, China
2
Beijing Key Laboratory of New Energy and Low-Carbon Development, North China Electric Power University, Beijing 102206, China
*
Author to whom correspondence should be addressed.
Energies 2019, 12(10), 1915; https://doi.org/10.3390/en12101915
Submission received: 29 April 2019 / Revised: 14 May 2019 / Accepted: 16 May 2019 / Published: 19 May 2019

Abstract

:
The development of electric vehicles has significant value for the sustainable utilization of energy resources. However, the unreasonable construction of charging stations causes problems such as low user satisfaction, waste of land resources, unstable power systems, and so on. Reasonable planning of the location and capacity of charging stations is of great significance to users, investors and power grids. This paper synthetically considers three indicators of user satisfaction: charging convenience, charging cost and charging time. Considering the load and charging requirements, the model of electric vehicle charging station location and volume is established, and the model based on artificial immune algorithm is used to optimize the solution. An empirical analysis was conducted based on a typical regional survey. The research results show that increasing the density of charging stations, lowering the charging price and shortening the charging time can effectively improve user satisfaction. The constructed site and capacity selection optimization solving model can scientifically guide charging station resource allocation under the constraints of the optimal user comprehensive satisfaction target, improve the capacity of scientific planning and resource allocation of regional electric vehicle charging stations, and support the large-scale promotion and application of electric vehicles.

1. Introduction

With the prominent problem of sustainable development and utilization of fossil energy, the environmental and development problems caused by the greenhouse effect are becoming more and more serious. Countries around the world are actively fulfilling their energy conservation and emission reduction commitments. China joined the Paris Climate Change Agreement on 3 September 2016. The Chinese government has actively taken various measures to optimize energy environment management and resources. As a type of transportation with less energy consumption and less pollution, electric vehicles are supported by the Chinese government’s policy subsidies, and they are more and more attractive to consumers. The trend of global and Chinese electric vehicle ownership in the past five years [1,2] is shown in Figure 1.
As can be seen from the above chart, the number of electric vehicles in the world has increased rapidly in the past five years. China is one of the representatives. It can be calculated that the annual average growth rate of electric vehicles in China in the past five years is 126.62%, and the number of electric vehicles in China has increased sharply. At present, the proportion of electric vehicles and charging piles in China is relatively low. According to the international standard, the proportion of electric vehicles and charging piles is at least 1.5:1 or higher. The number of charging piles is far from meeting the needs of the current market. Due to the inadequate configuration of China’s electric vehicle charging infrastructure and uneven distribution among regions, the problems of long charging time and high charging cost are exacerbated, which reduces the enthusiasm of users to purchase electric vehicles. This phenomenon is particularly evident in large cities and has gradually become a key factor constraining the development of China’s electric vehicle industry. In addition, due to the large footprint and high load of the electric vehicle charging station, it has a certain impact on the rational use of land resources and the safe and stable operation of the power grid.
Therefore, in order for the municipal department to make a reasonable charging station plan, it is necessary to conduct an in-depth study on the location and capacity model of the electric vehicle charging station to achieve the purpose of promoting the development of regional electric vehicles. From the user’s point of view, this paper first reviews the existing research results of scholars in related fields, and then establishes a model of location, capacity and resource optimization allocation of regional charging stations under the constraints of comprehensive user satisfaction, and validates it with an example. The accuracy and efficiency of the proposed model method are high, which can support the large-scale popularization and application of electric vehicles and the improvement of customer satisfaction.

2. Literature Review

At present, scholars’ research on the location and capacity problem of electric vehicle charging stations mainly starts from the charging behavior analysis of electric vehicle users, the selection of electric vehicle charging station location and constant volume optimization algorithm, and the cost-benefit evaluation on electric vehicle charging stations.
The charging behavior of electric vehicle users is uncertain, which makes the charging station charging demand uncertain. By adopting the mathematical statistics method, it is possible to mine the regularity of the user’s charging behavior and the charging station charging demand. Based on the hydrodynamic traffic model and M/M/s queuing theory, Sungwoo Bae et al. established a time and space distribution model to characterize charging demand of charging stations [3]. Wu F. et al. think that the difficulty of charging station location planning lies in the uncertainty of charging demand [4]. Yagcitekin et al. combined queuing theory with AHP (analytic hierarchy process) to establish a mathematical model [5]. Pan Yinji et al. introduced the Markov decision-making process based on the travel chain theory. User charging behavior was analyzed as a Markov decision-making set, and compared with the traditional Monte Carlo method [6].
With the development of computer programming language and artificial intelligence algorithms, the accuracy and efficiency of the optimization solution for the location problem of electric vehicle charging stations are greatly improved. Shi Q S et al. use the fuzzy C-means clustering method to determine the optimal location of charging station [7]. Previous research [8,9] has improved the particle swarm optimization algorithm based on the establishment of the model. One study [8] uses the quantum behavior particle swarm optimization algorithm (QPSO), and another [9] optimizes the particle swarm optimization algorithm based on the chaotic simulated annealing idea. In order to maximize the coverage of charging stations, Jin WT et al. proposed a hybrid integer non-linear model and solved it by a simple heuristic algorithm based on equilibrium [10]. The genetic algorithm is a heuristic optimization algorithm widely used in the field of artificial intelligence. On the location problem for charging stations, Dong J et al. proposed an activity-based assessment method to analyze the impact of public charging infrastructure construction on increasing driving mileage [11]; Chen S et al. set up an optimization model with minimum investment cost and transportation cost as objective function, considering the constraints of capacity, coverage and charging convenience [12]; He F et al. modeled the initial charging state of batteries and the car owner’s preference for power consumption uncertainty [13], all of which are solved by the genetic algorithm. Efthymiou D et al. proposed that the charging station location problem can be solved by linear programming, multi-objective optimization and genetic algorithm [14].
Many scholars have done a lot of work on research on the factors affecting the location and capacity of charging stations. He S Y et al. made a case study on the location selection of Beijing Public Charging Station in China, and analyzed the system and space restrictions in the construction of charging station [15]. Tang M et al. established the non-deterministic polynomial (NP) model, solved it by agent-based optimization simulation algorithm, and used ANOVA (analysis of variance) to simulate and analyze the factors affecting location and capacity [16].
Research on the cost-benefit analysis for charging stations, Chen G, and so on established a cost-benefit assessment model for the power station from the perspective of the whole life cycle [17]. Wolbertus R et al. put forward a pricing strategy to improve the efficiency of charging station in view of the phenomenon that car owners occupy charging spaces when they are not charging [18]. Previous research [19,20] has taken the cost of the charging station as the objective function. One study [19] took the sum of the construction costs, operation costs and charging costs as the total cost, considered the minimization of the total cost, considered the service radius, the charging station capacity and other constraints, and used hybrid-based particle swarm optimization to solve the problem. In [20], construction cost and equipment cost are used as construction costs, and the established model can significantly reduce construction costs.
Combining the relevant research results, it is concluded that the research on the location and capacity of charging stations can first establish a multi-objective programming model, considering the constraints of cost, convenience, coverage, and so on, then establish the optimal solution model based on artificial intelligence algorithms with high precision and efficiency. This study can provide scientific guidance for charging station planning.

3. Model Building

The electric vehicle charging station location and capacity model established in this paper, considering the user’s self-charging demand, considers the layout of the charging station for the coverage of electric vehicles in the planning area, taking into account the capital cost and time cost of user charging. Based on this, a user satisfaction function is established. Through the investigation of the user’s willingness to consume, the weight coefficient of each sub-goal was determined, and the safe operation of the regional distribution network can be guaranteed as a constraint condition. Based on the artificial immune algorithm, three single targets were solved to determine the upper and lower limits of the three indicators. The reduced half-Γ distribution function in the fuzzy membership theory can achieve the normalization of the sub-objects.
The technical route studied in this paper is shown in Figure 2.

3.1. Objective Function

3.1.1. User Charging Convenience

In this paper, the empty driving distance Dr is used as an indicator to measure the convenience of user charging. The empty driving distance refers to the distance traveled by the user from the charging demand point to the nearest charging station. This distance is the distance traveled by the user, and can be effectively shortened by reasonable charging station layout planning. Define the empty driving distance Dr (km):
D r = D 1 D 2
where Dr is the empty driving distance; D1 is the driving distance from the departure place to the destination when there is charging demand; D2 is the driving distance from the departure place to the destination when there is no charging demand.

3.1.2. User Charging Cost

In this paper, the charging price P is used as an indicator to measure the user’s charging cost, and a method for reasonably determining the charging price interval [Pmin, Pmax] is proposed.
The investor’s minimum price Pmin is the lower limit of the charging price range. This paper uses a cost-benefit comparison analysis method to determine the lowest price based on indicators such as net present value, internal rate of return, and payback period. Take the net present value method as an example:
N P V = t = 1 n ( C I t C O t ) i c t
among them:
CIt is the cash inflow of each year, which is related to the annual electricity sales and electricity price; COt is the cash outflow of each year; ic is the benchmark rate of return.
When net present value (NPV) is equal to 0, it indicates that the revenue level of the charging station can just reach the psychological expectation of the investor, and the charging service price at this time is the lower limit of the charging price interval.
The upper limit Pmax of the charging cost acceptable to the user is analyzed by the electric vehicle’s substitution effect on the fuel vehicle. Pmax is the price at which the charging cost is equal to the fuel cost.

3.1.3. User Charging Time

In this paper, the stay time Ws(min) is used as an indicator to measure the user’s charging time, including waiting for charging time and accepting charging service time.
The process by which electric vehicle users arrive at the charging station one after another can be considered as a Poisson process, and the probability distribution of the time between events in the Poisson process is subject to a negative exponential distribution.
In this paper, the M/M/c model in queuing theory is used to solve the waiting time and service time. M/M/c indicates that the successive arrival intervals obey the negative exponential distribution, the service time obeys the negative exponential distribution, and the model contains c parallel service desks.
The basic quantitative indicators involved in solving queuing theory problems include:
(1)
Ls, refers to the total number of customers in the system;
(2)
Lq, refers to the number of customers waiting for service in the system;
(3)
Ws, refers to the length of stay of a customer in the system;
(4)
Wq, which refers to the time a customer waits in line in the system.
Let the arrival law obey the Poisson process with the parameter λ, and the service time obeys the negative exponential distribution with the parameter μ, that is, the average number of customers arriving per unit time is λ, and the customer arrival time interval is 1 λ , the average service rate is μ, and the average service time is 1 μ . The following relationships are met between the above four indicators:
{ ( 1 ) L s = λ W s ( 2 ) L q = λ W q ( 3 ) W s = W q + 1 μ ( 4 ) L s = L q + λ μ
The parameter of the Poisson process is λ, that is, the average number of electric vehicles arriving at the charging station per hour is λ; the parameter of the negative exponential distribution is μ, that is, the charging time of each charger is μ; and the charging station has c Parallel service desk. From the M/M/c queuing theory model:
Service intensity: ρ = λ c μ . When ρ 1 , there will be a queuing phenomenon, and all users in the system can be served in a certain period of time; when ρ > 1, the queue will be infinitely long. Then the average queue length:
L q = ( λ μ ) c ρ c ! ( 1 ρ ) 2 P 0
among them,
P 0 = [ k = 0 c 1 1 k ! ( λ μ ) k + 1 c ! 1 1 ρ ( λ μ ) c ] 1
Duration of stay:
W s = L s λ = L q λ + 1 μ

3.2. Restrictions

The access to the electric vehicle charging station is a heavy load for the grid. During the peak hours of users’ electricity consumption, large-scale charging of electric vehicles makes the power grid fluctuate greatly. At the same time, the construction of the charging station must ensure that the charging needs are fully met. Therefore, this paper proposes the following constraints:
(1) Charging station capacity constraint:
i = 1 n S i S m a x , i = 1 , 2 , 3
In the formula, Smax is the maximum charging demand in the planning area, that is, the charging station in the planning area should be able to meet the charging demand of all electric vehicles.
(2) Current constraint:
P r s = P c + P 0
The power flow equation is used as the equality constraint, that is, the active power balance:
In the formula, Prs is the active power of the line rs leading to the charging station i, Pc is the load of the charging station i, P0 other loads of access line rs. This formula indicates that the output of the electric vehicle charging station should be consistent with the user’s charging requirements.

3.3. Objective Function Fuzzification

In this optimization problem, the objective functions of empty driving distance, charging price and charging time are contradictory. In this paper, the optimal solution of each sub-object is solved first, and then the sub-objects are fuzzified by the optimal solution and the upper limit acceptable to the user. The membership function is determined, and then the solution with the largest membership function is obtained. This solution is the optimal solution for the multi-objective optimization problem. In comparison, this paper selects the reduced half Γ distribution function. For the above three suboptimal targets, the membership function is:
u ( F k ) = { 1 , F k < F m i n F m a x F k F m a x F m i n , F m i n < F k < F m a x 0 , F k > F m a x
where Fk is the three objective functions, Fmin is the lower bound of the three objective functions, and Fmax is the upper limit acceptable to the user.
Then the multi-objective optimization problem is transformed into a single-objective optimization problem:
max ( u ) , s . t . { u u ( D r ) u u ( P ) u u ( W s ) i = 1 n S i S m a x P r s = P c + P 0

3.4. Optimization of Location and Constant Volume Based on Artificial Immune Algorithm

The artificial immune algorithm (IA) is a stochastic optimization algorithm developed on the basis of the genetic algorithm (GA). It not only retains the optimization characteristics of the genetic algorithm, but also ensures fast convergence to the global optimal solution because each iteration is carried out on the memory unit.
The antigen of the immune algorithm corresponds to the optimization problem, and the antibody corresponds to a feasible solution to the optimization problem. The promotion and inhibition of the production of antibodies embodies the natural regulatory function of the immune response.
The flow chart of immune algorithm is shown in Figure 3.
In the immune algorithm, the affinity between the antibody and the antigen and the concentration between the antibodies are two important indicators that affect the convergence rate and avoid convergence to the local mean point.
(1) Antigen recognition
In an immune algorithm, an antigen is a combination of an objective function and a constraint of an optimization problem.
(2) Initial antibody production
According to the mathematical model of the problem to be solved, a set of initial feasible solutions is obtained.
(3) Affinity calculation
Defining the affinity between antibody v and antigen u a x v u for:
a x v u = 1 1 + o p t v u
where o p t v u is the binding degree of antibody v and antigen u, indicating the approximation degree between the feasible solution and the optimal solution.
Defining the affinity between antibody v and antibody w a y v w for:
a y v w = 1 1 + E ( 2 )
where E(2) represents the information entropy between v and w, indicating the difference in gene sequences at different positions of the antibody, thereby obtaining the diversity criteria of the individual system.
(4) Memory cell differentiation
The antibody with the greatest affinity for the antigen will be added to the memory cell, and the newly produced antibody will replace the memory cell and its maximum affinity.
(5) Promotion and inhibition of antibody production
High-affinity antibodies are promoted, and high-concentration antibodies are inhibited.
(6) Group update
Two antibodies were selected using roulette according to the different antibody and antigen affinity. The two antibodies are then mutated according to a certain probability of mutation, then crossed to obtain a new antibody, and the operation is repeated multiple times.
(7) Termination condition
The algorithm terminates if the determined optimal solution satisfies a certain termination condition.

4. Empirical Analysis

4.1. Study Scenario and Model Assumptions

This paper investigates a representative 6km×6km urban planning area in Beijing for empirical analysis. It is proposed to select some nodes at these nodes to build charging stations of different capacities to obtain the results of site selection and capacity reduction that maximize the overall satisfaction of users in the planning area. Through investigation, some regional characteristic parameters and electric vehicle performance parameters are obtained, and reasonable assumptions are made for the remaining necessary parameters.
(1) Regional traffic characteristics
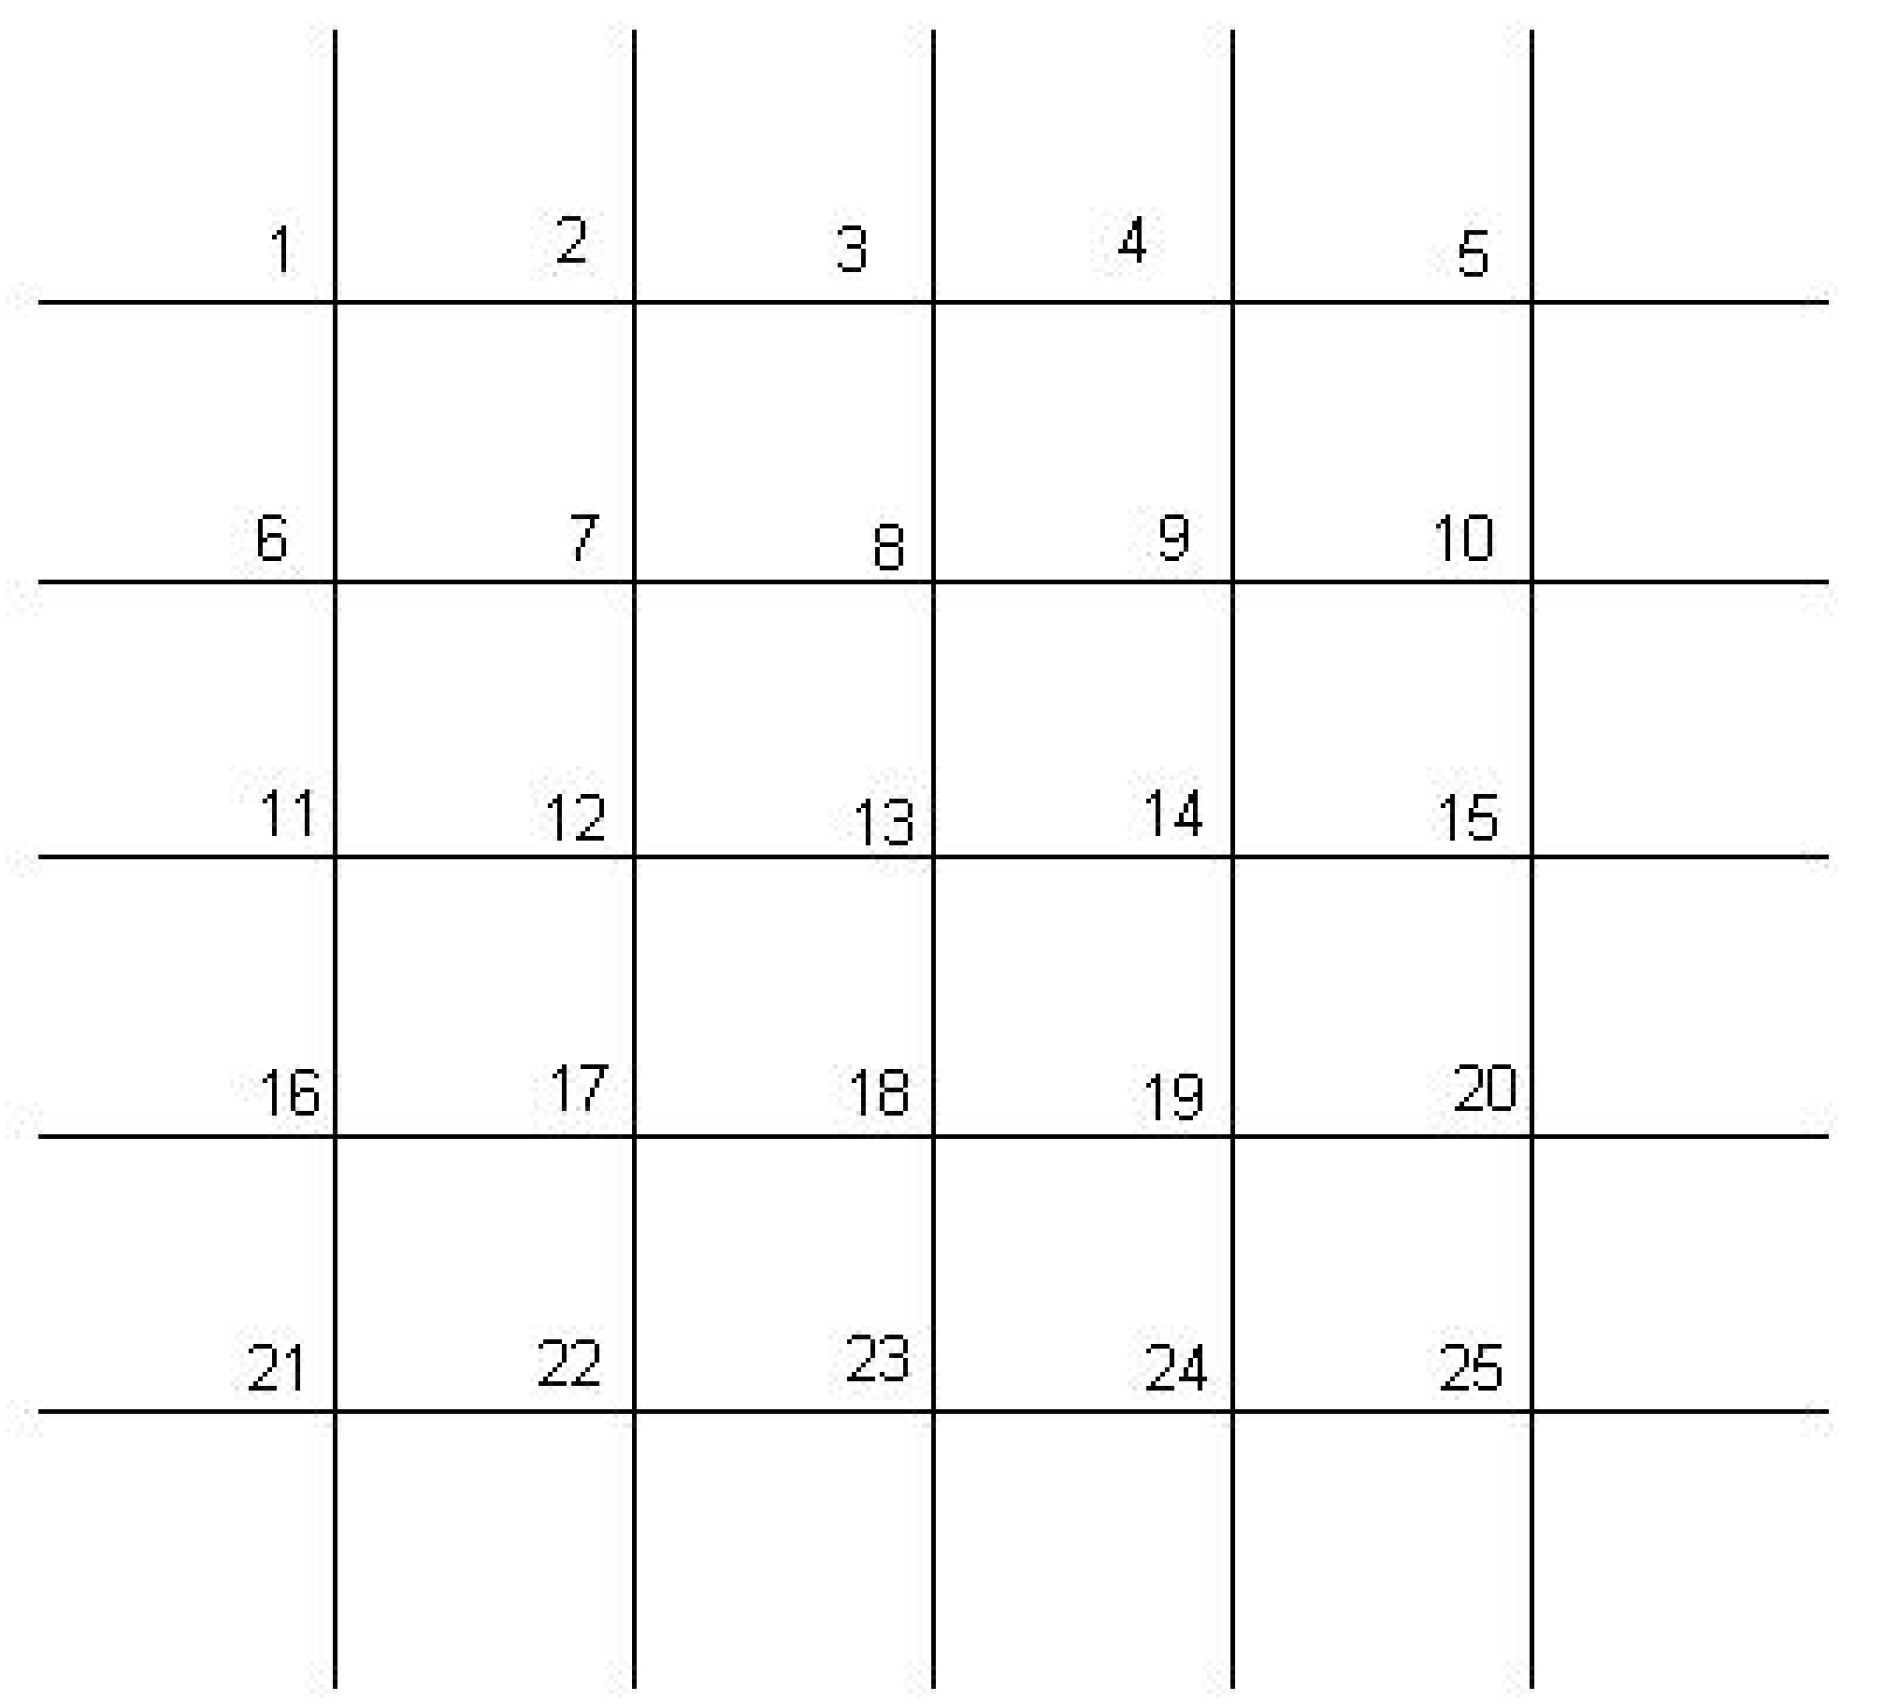
According to the survey of a certain area in Beijing, reasonable assumptions are made according to the appropriate proportion considering income, area and people’s awareness of environmental protection and energy conservation. There are 25 traffic nodes in the planning area, and the number of electric vehicles is 2000. The traffic network of the planning area is shown in Figure 4.
(2) Electric vehicle related parameters
The average annual mileage of electric vehicles is 10,000 km. The performance parameters are shown in Table 2.
(3) Charging station related parameters
The charging devices installed in the charging station are all fast charging and charging devices, and the power of a single charging device is 80 kW. The charging station cost parameters are shown in Table 3.
(4) User charging behavior assumption
Electric vehicles are evenly distributed in this planning area. According to a travel statistics of the US Department of Transportation for household vehicles in the United States [21], it is assumed that the arrival time of the electric vehicle obeys the Poisson distribution with the parameter 12.23, ie λ = 12.23. If the charging time of the charger is 30 min, then μ = 2, that is, each charging device can provide charging service for 2 electric vehicles per hour.
(5) Construction plan selection
Four alternatives are available: non-construction of charging stations and installation of 8, 9 and 10 charging devices. The corresponding antibody codes are 0, 1, 2, and 3, respectively. The capacities of the corresponding charging stations of 8 sets, 9 sets and 10 sets are 640 kW, 720 kW and 800 kW respectively.

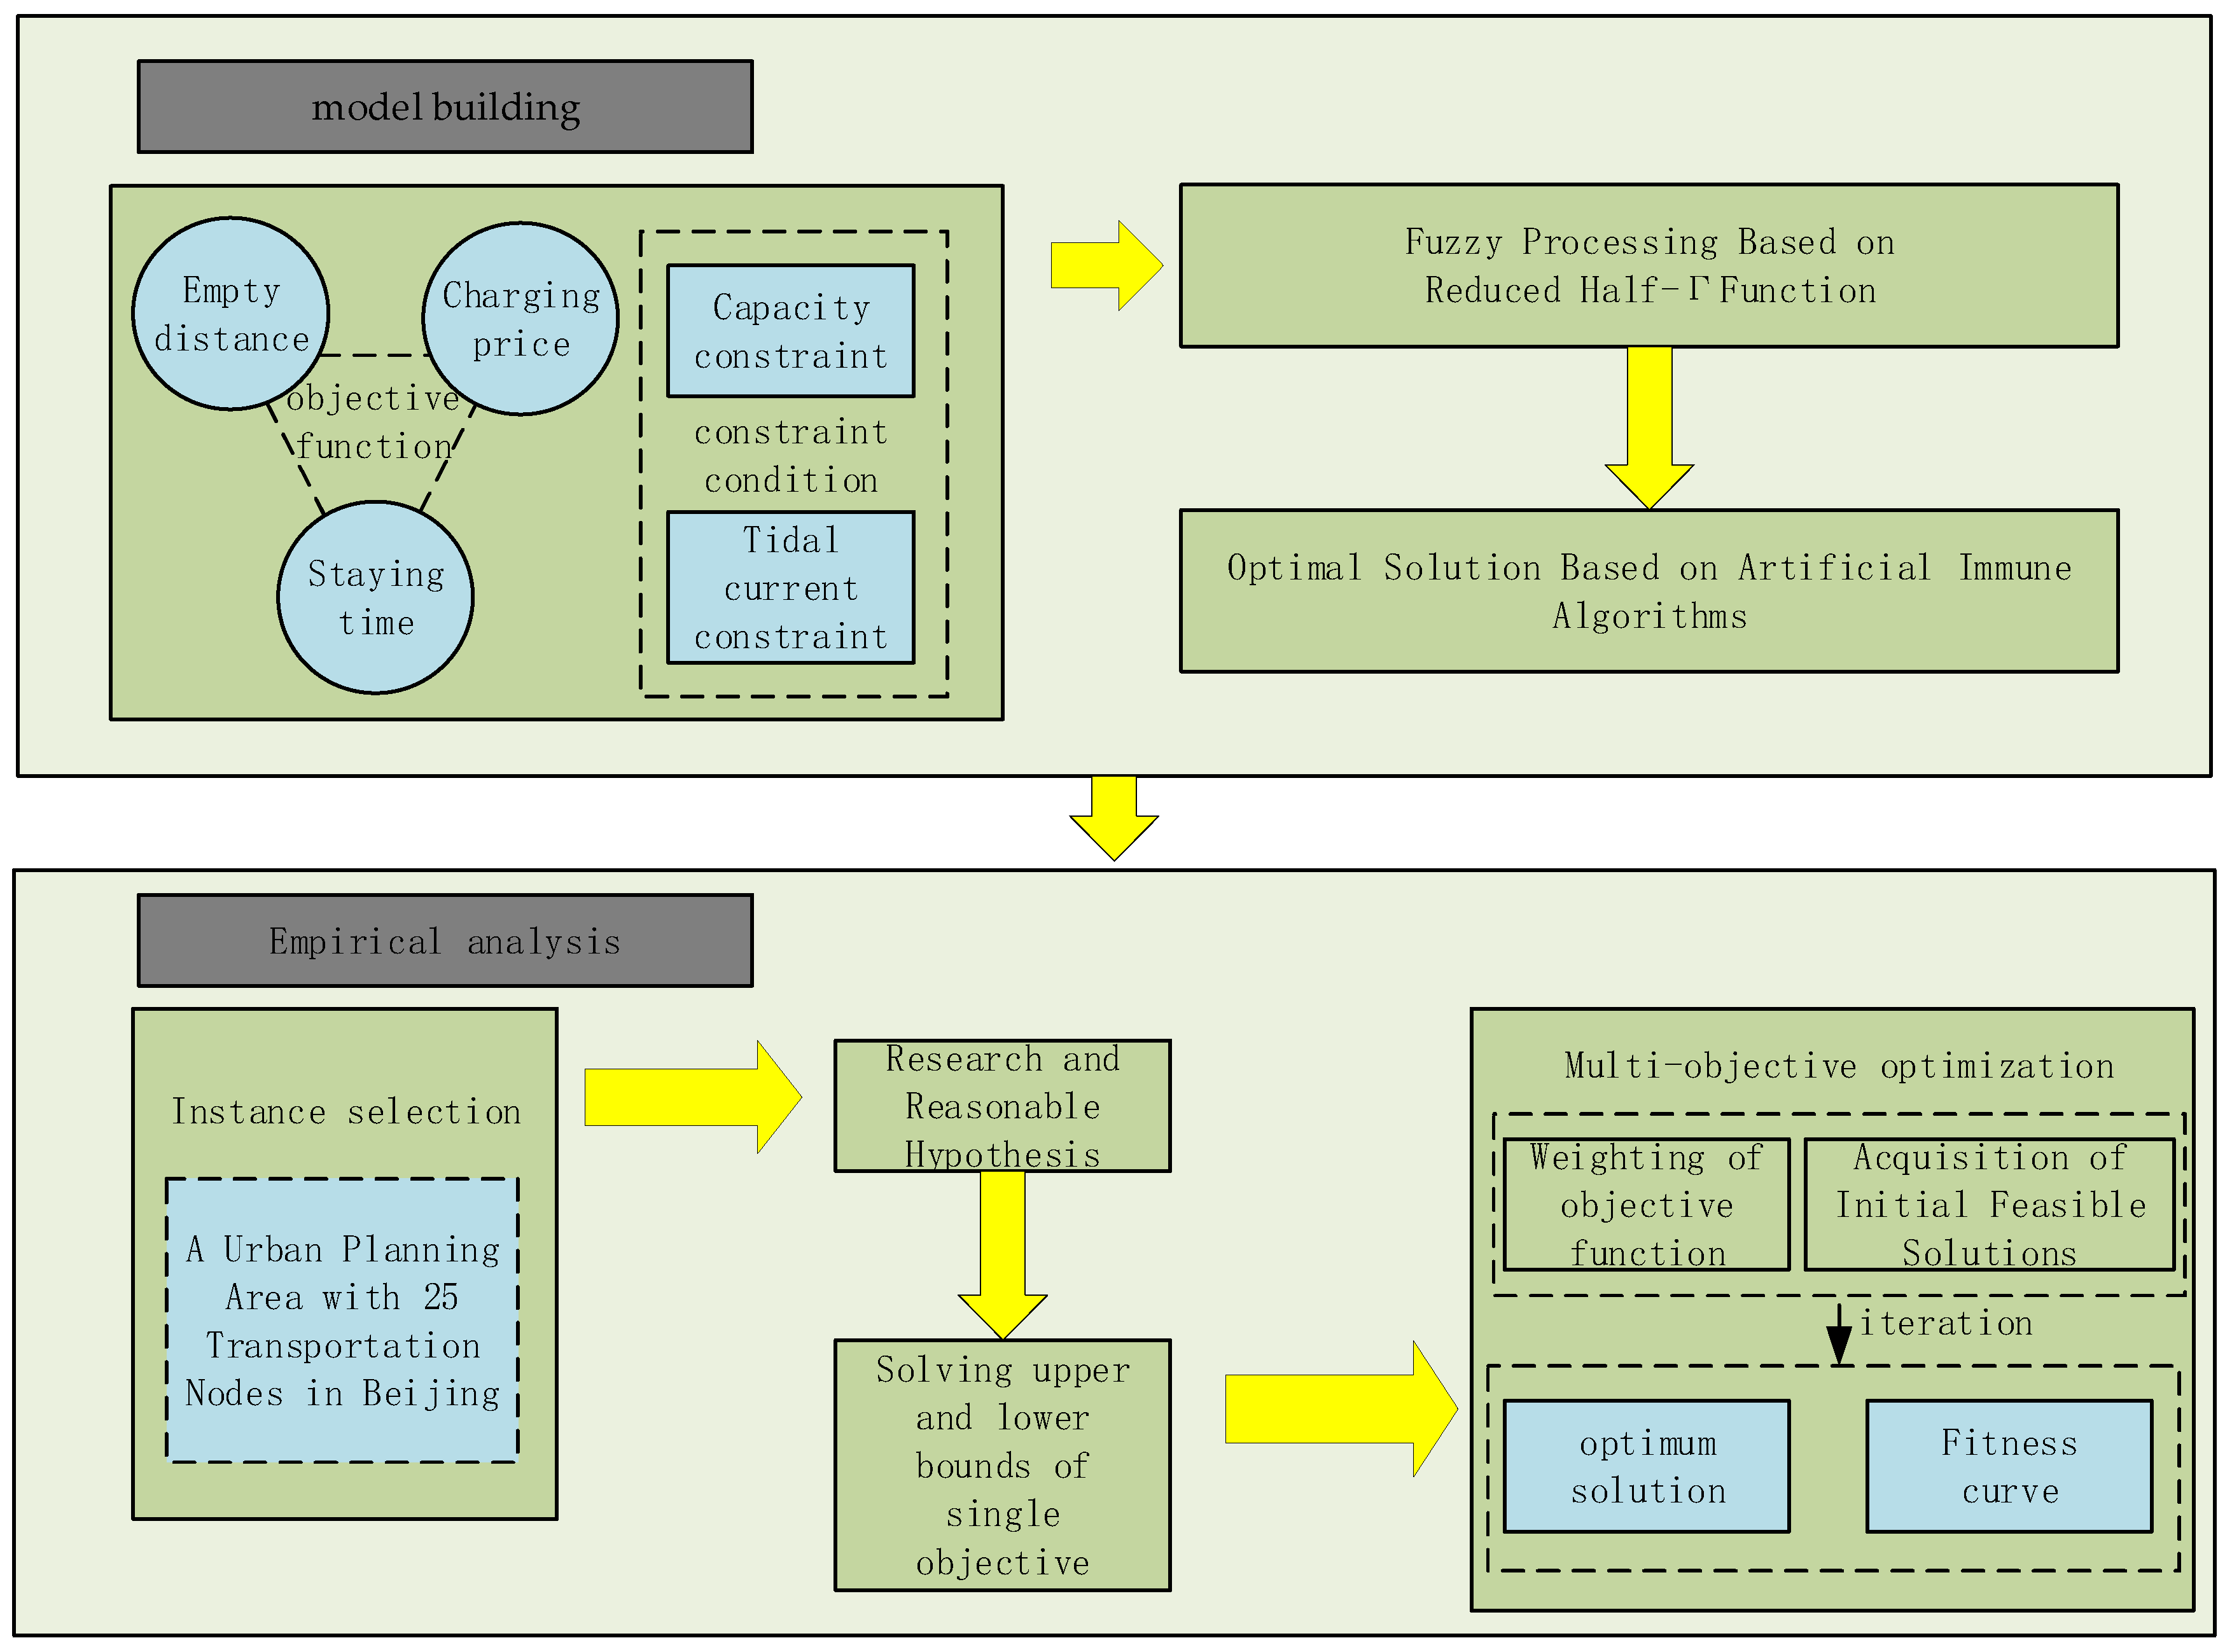
4.2. Single Target Upper and Lower Limit Solution

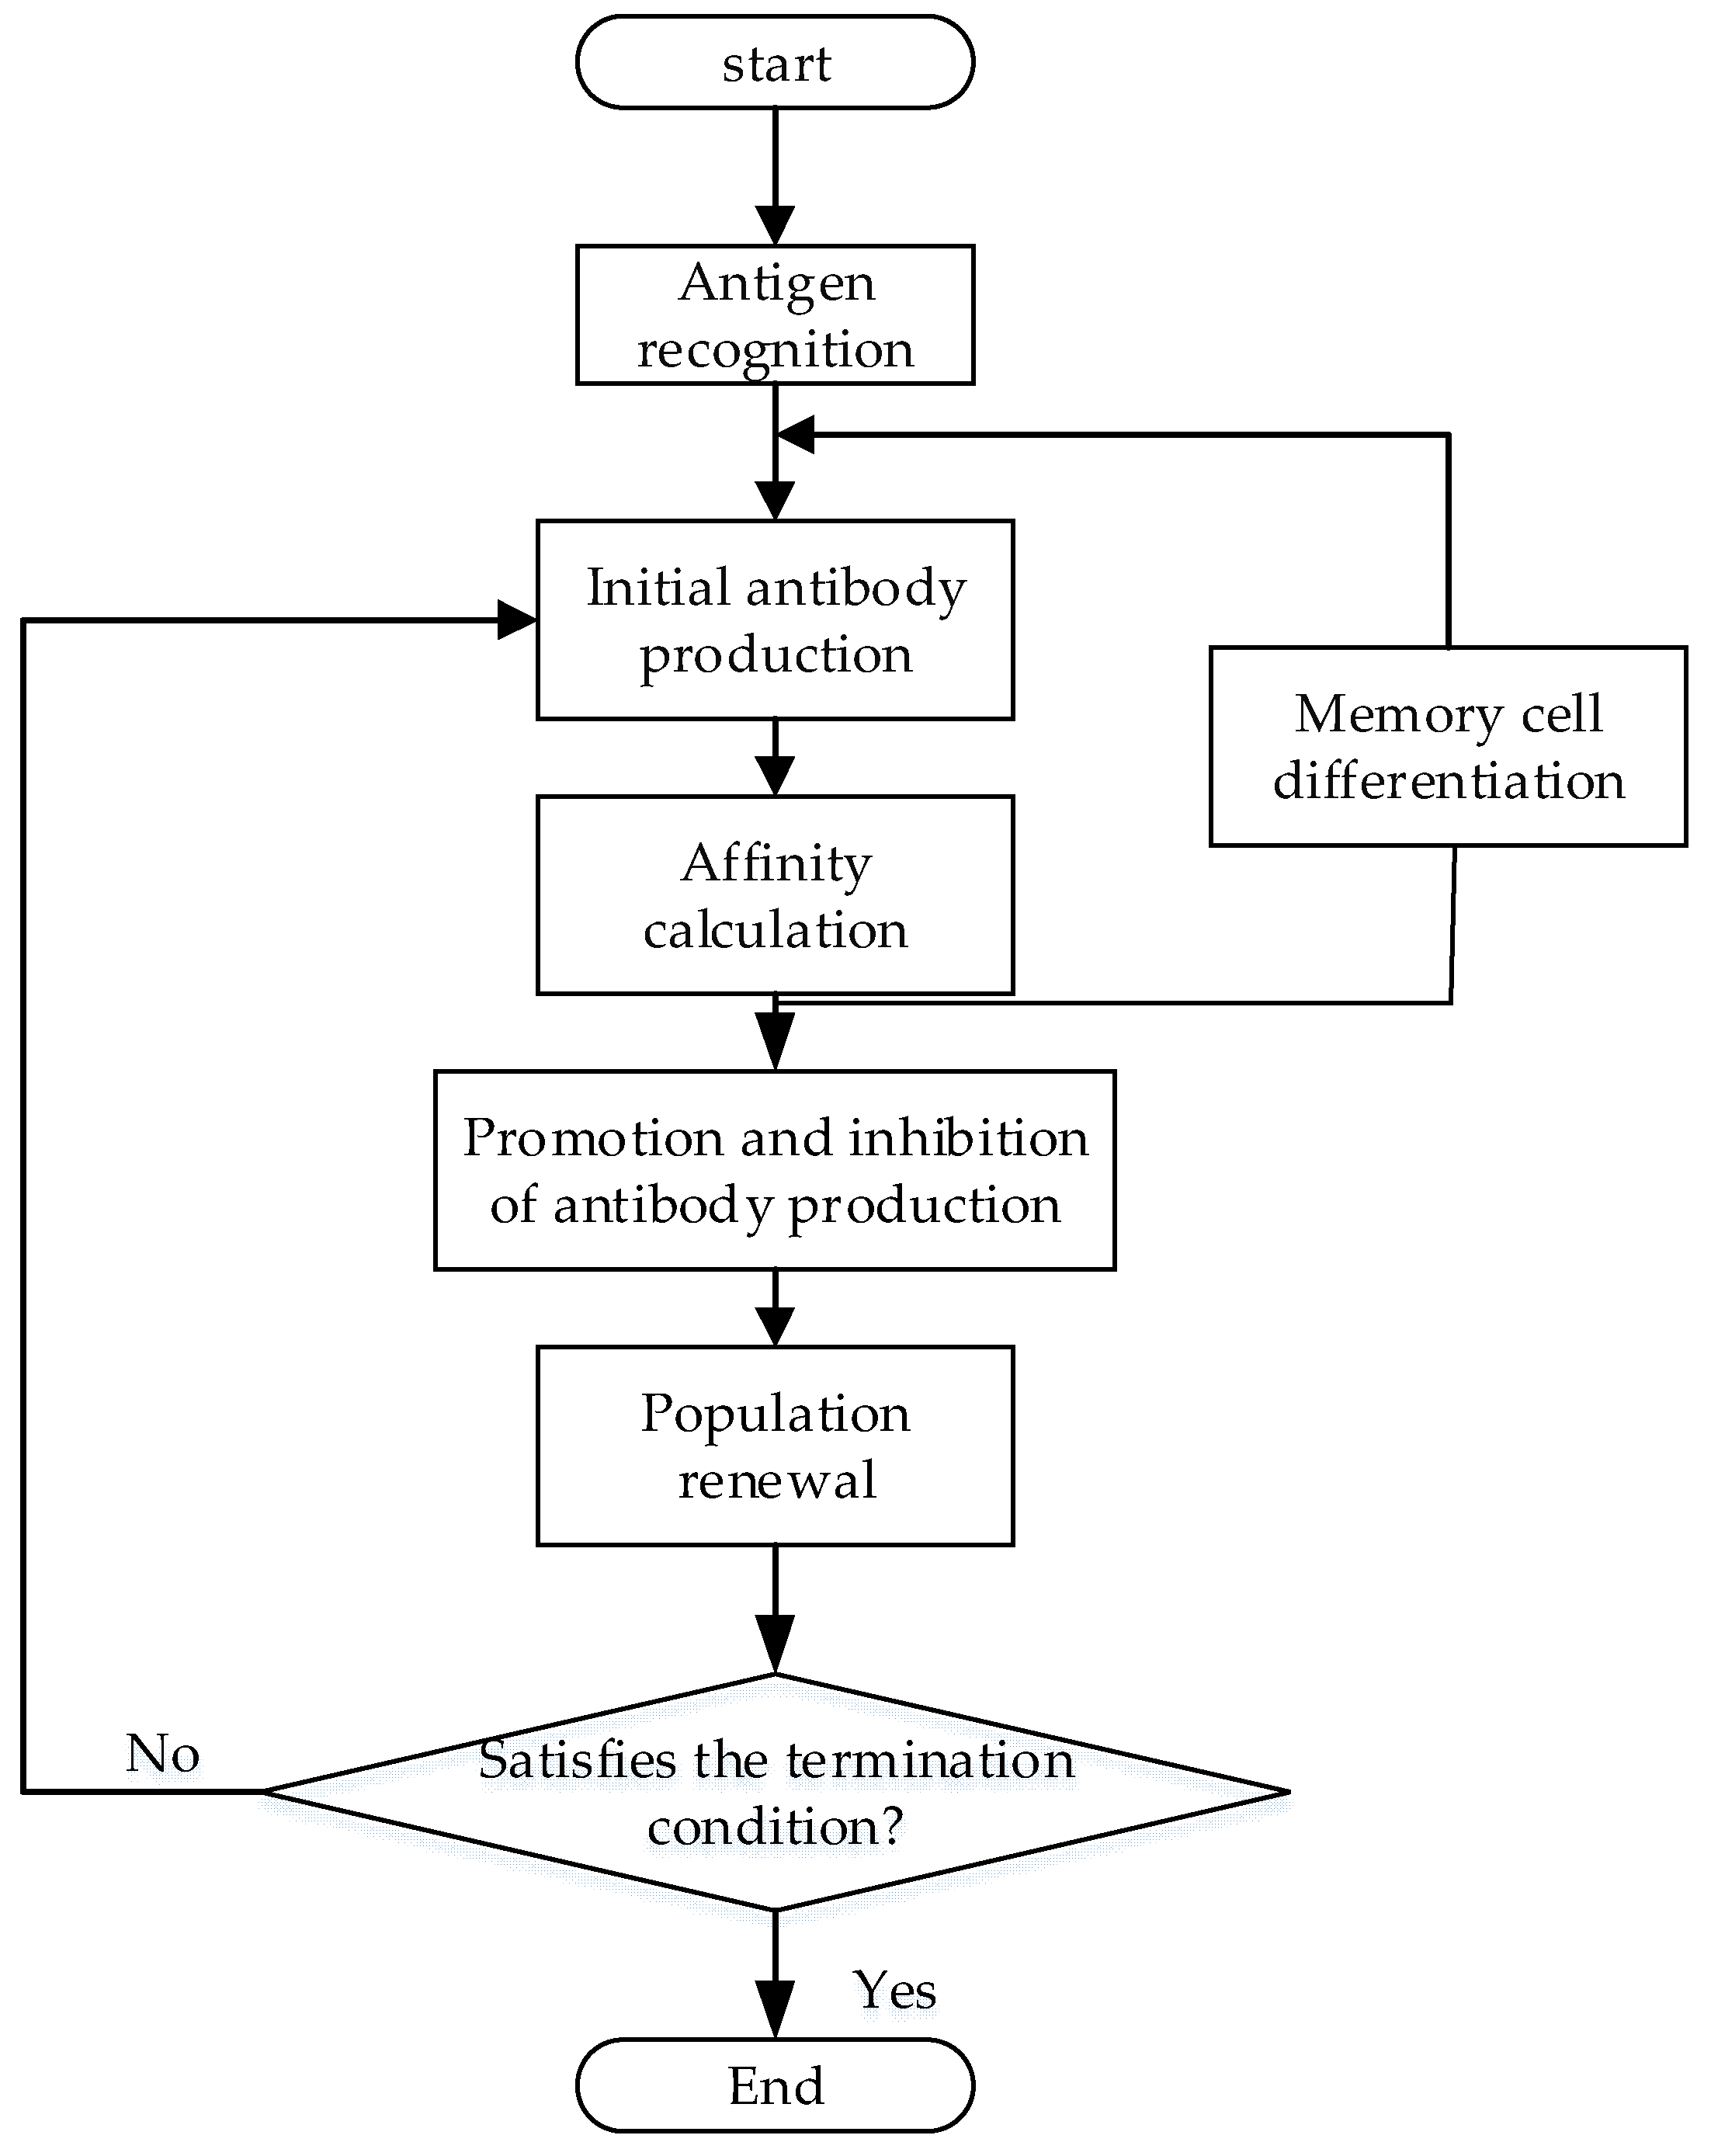
This paper establishes a model of solution based on artificial immune algorithm. Let the population size be 100 and the antibody length be 25, representing 25 alternative sites for building a charging station. The value of each location is randomly generated from 0, 1, 2, and 3, as shown in Table 4.
When solving by artificial immune algorithm, a group of initial solutions are generated randomly by MATLAB software, and the quality of these initial solutions is low. Then, the algorithm is iterated based on the initial solution. The clonal mutation operation in single-objective solution is carried out according to the requirement of solution quality. The three satisfaction indexes are compared in multi-objective solution, and the index with lower satisfaction is selected to carry out the clonal mutation operation corresponding to the index.
(1) Empty driving distance
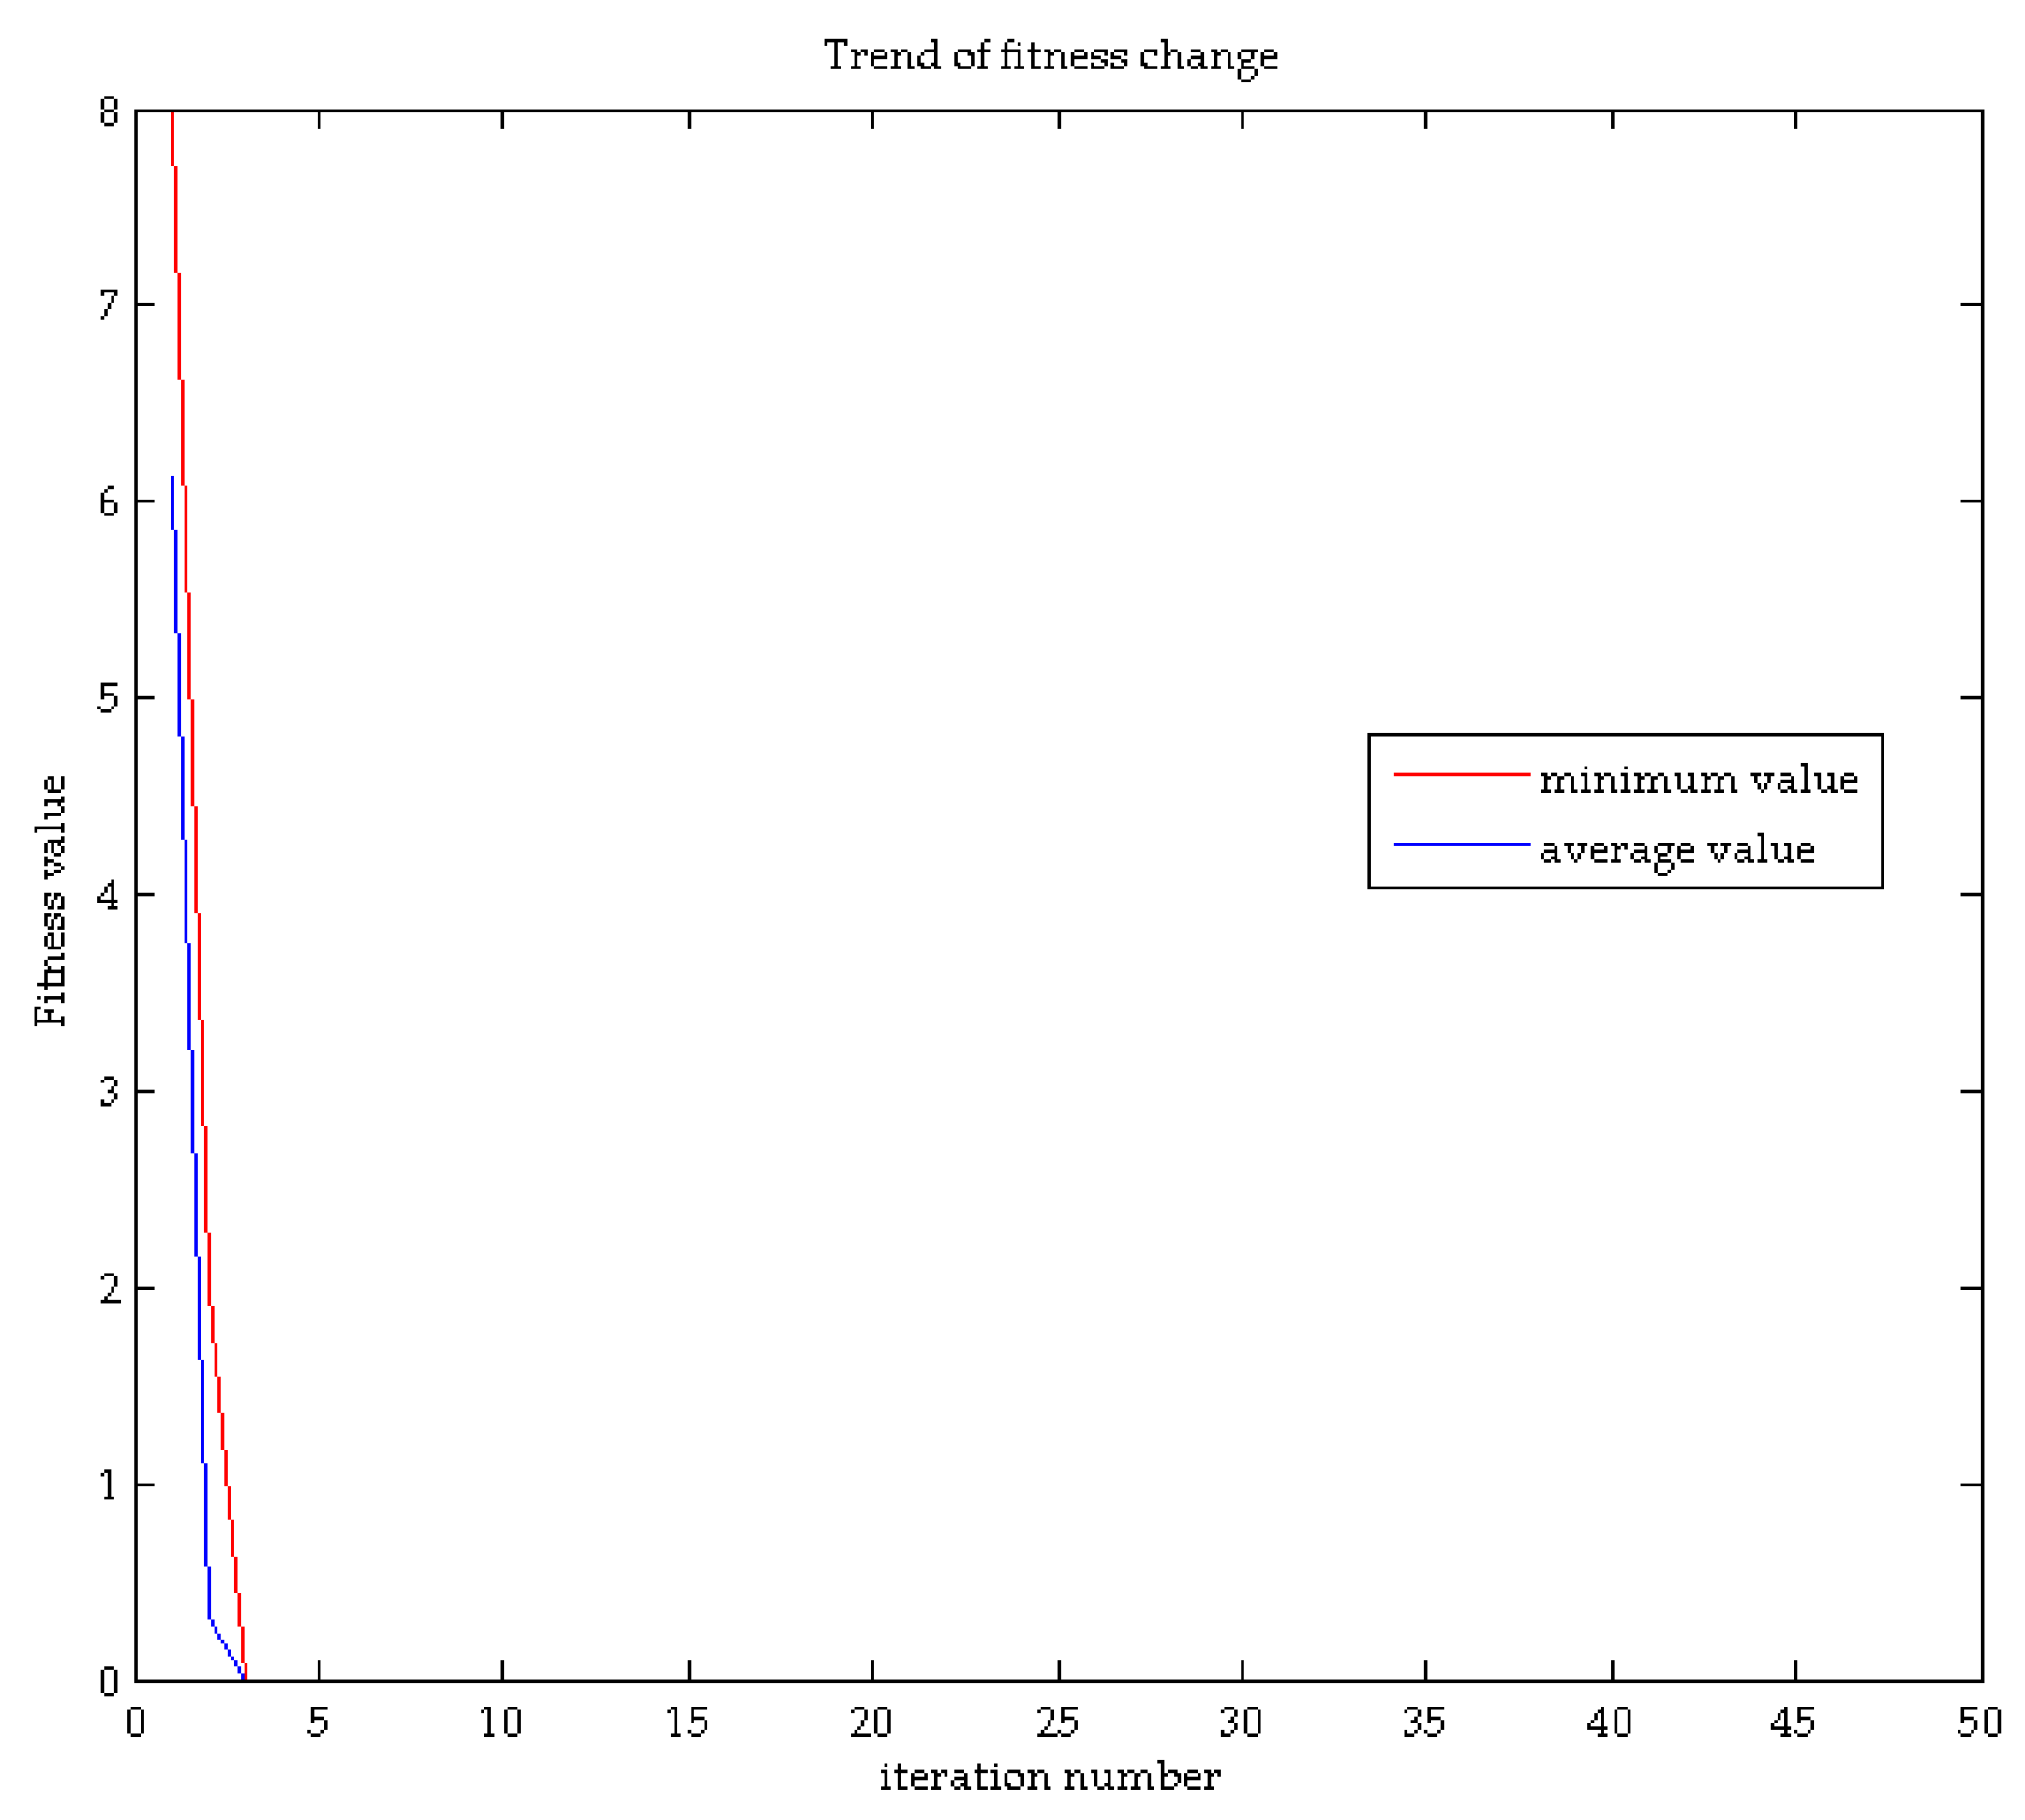
Fifty generations are iterated by immune algorithm. From the first generation population 1, the initial empty driving distance is 8. Fifty excellent antibodies were selected for cloning and mutation in each generation, and the fitness trend curve was obtained as shown in Figure 5.
The optimal solution first appeared in the 3rd generation, and the empty driving distance was 0, that is, all charging stations were built in 25 traffic nodes.
For this single target, it is optimal to build a charging station at all 25 nodes, but the cost of building a charging station will be greatly increased, the charging price will be high, and the overall satisfaction of the user will be low.
(2) Charging price
At present, the fuel consumption of a fuel vehicle with a displacement of 1.5 L is 6 L per 100 km, and the planned annual average oil price is 7 yuan/L. According to the substitution effect of electric vehicles on fuel vehicles, the highest charging price Pmax acceptable to users is 2.8 yuan/(kW·h).
The infrastructure cost, distribution cost, and annual operating cost corresponding to the installation of 8, 9, and 10 charging devices at the road node i are shown in Table 5.
The annual charging demand Q1 of electric vehicles in this area is 3,000,000 kW·h.
Consider a limit case where electricity can be supplied annually when only one charging station is built in the area and the charging station is equipped with 8 charging devices:
Q 2 ( kW h ) = 640 kW × 24 h × 365 d = 5606400 kW h > Q 1 ( kW h )
Therefore, the construction of the charging station can meet the user’s charging needs.
The present value of the total cost of building a charging station in the area is C1 million. To discount the charging fee charged by the charging station each year, it should satisfy:
C 1 ( 10,000 yuan ) < 300 P min × ( 1 + 10 % ) 20 1 10 % × ( 1 + 10 % ) 20 = 2554.07 P min ( 10,000 yuan ) .
After the iterative 100 generations by the immune algorithm, the minimum curve is optimal in the 3rd generation, and the average curve is optimal in the 4th generation. The trend of fitness change is shown in Figure 6.
The optimal solution is to build a charging station at any of the 25 nodes. The charging station is equipped with 8 charging devices, that is, the capacity is 640 kW. At this time, the present value of construction cost and operating cost is the smallest, and the final charging price is the lowest. The value is also the smallest. The present value of construction cost and operating cost is 564.33 million yuan, and the lower limit of charging price Pmin is 0.19 yuan/(kW·h).
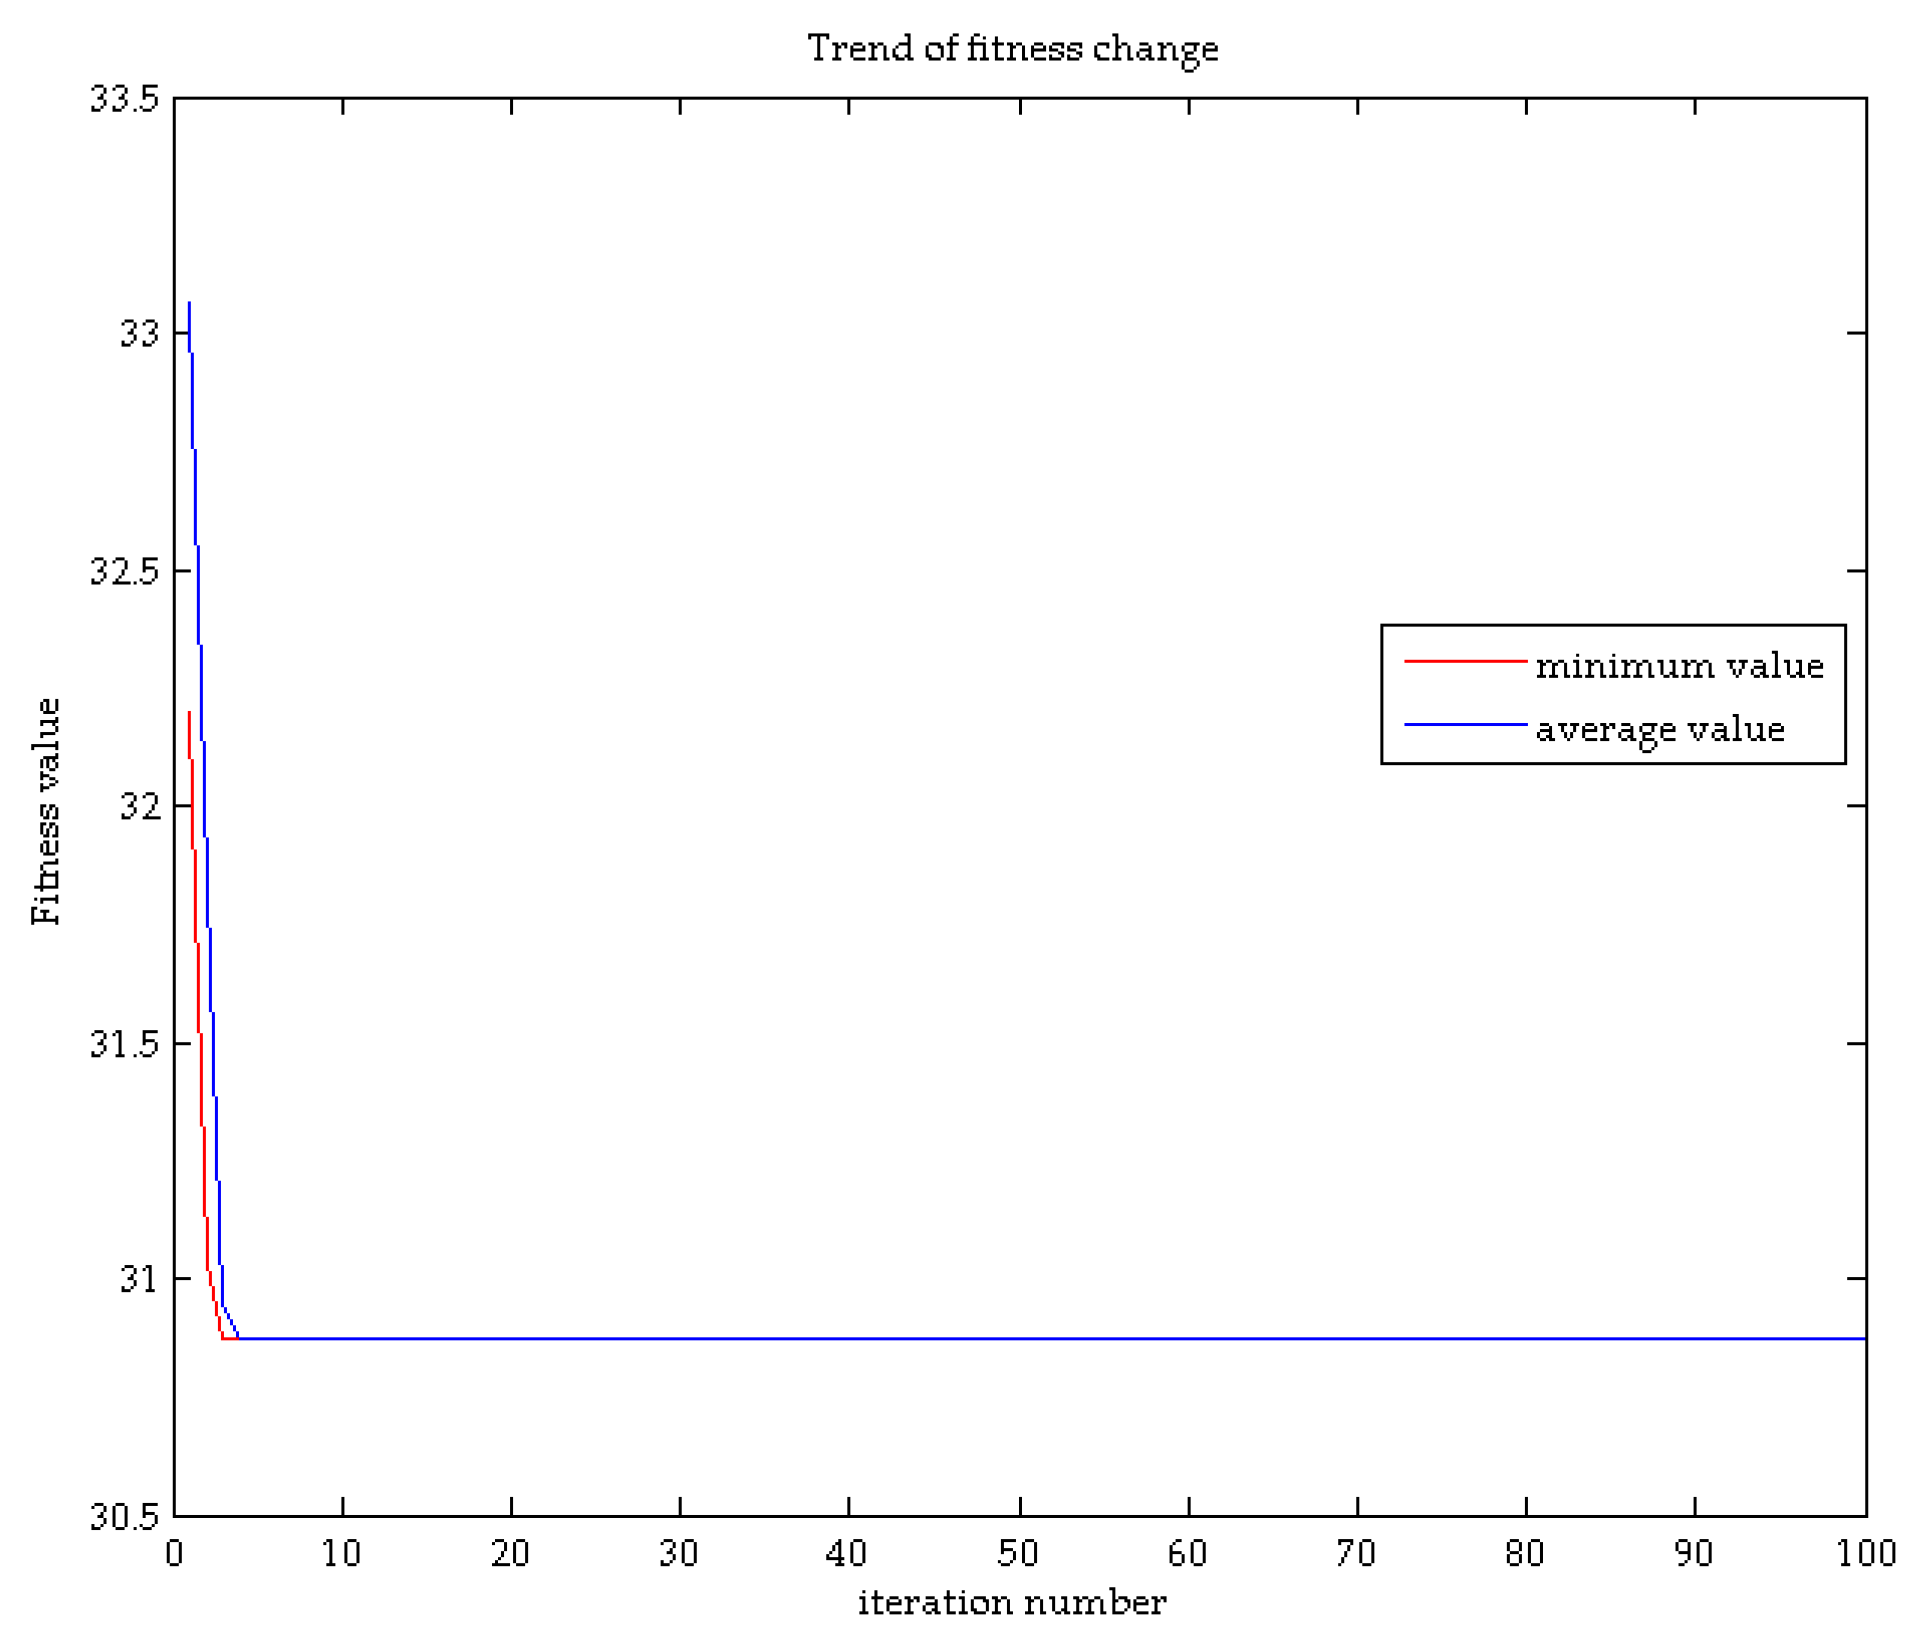
(3) Charging time
A charging station of a different capacity is constructed at the 25 nodes, and whether the average value of the charging time is the minimum is a condition for measuring the merits of the solution.
According to the hypothesis, λ = 12.23 and μ = 2. The parameters of queuing theory M/M/c model can be calculated as shown in Table 6.
Therefore, in the case of installing 8, 9, or 10 charging devices, the user charging time is 36.12 min, 32.22 min, and 30.87 min, respectively.
After 100 generations optimized by immune algorithm, the optimal solution of the minimum value first appeared in the 3rd generation, and the optimal solution of the average value appeared in the 4th generation first. The trend curve of fitness change is shown in Figure 7.
The optimal solution is to build a charging station with 10 charging devices in all 25 nodes. The charging station has a capacity of 800 kW, and the charging time corresponding to each node is 30.87 min, and the average charging time is 30.87 min.

4.3. Multi-Objective Optimization

The relationship between each sub-objective optimal solution and multi-objective optimal solution is fuzzy. Based on fuzzy modeling and maximizing satisfaction index, the multi-objective programming problem is transformed into single-objective nonlinear programming problem. After blurring, each target can be normalized to avoid the incompatibility of the original objective function.
The upper and lower limits of each single target are calculated as shown in Table 7.
In this paper, the membership function of the reduced half-Γ distribution is selected, and the user satisfaction is u, and the satisfaction under each single target is u(Fk). According to the results of the questionnaire, the weights of the three single targets are respectively 0.25, 0.5 and 0.25, then:
u = 0.25 u ( F 1 ) + 0.5 u ( F 2 ) + 0.25 u ( F 2 )
The u was used as the objective function to solve the problem based on the artificial immune algorithm, which was iterated 1000 times. In each generation, 0.25u(F1), 0.5u(F2) and 0.25u(
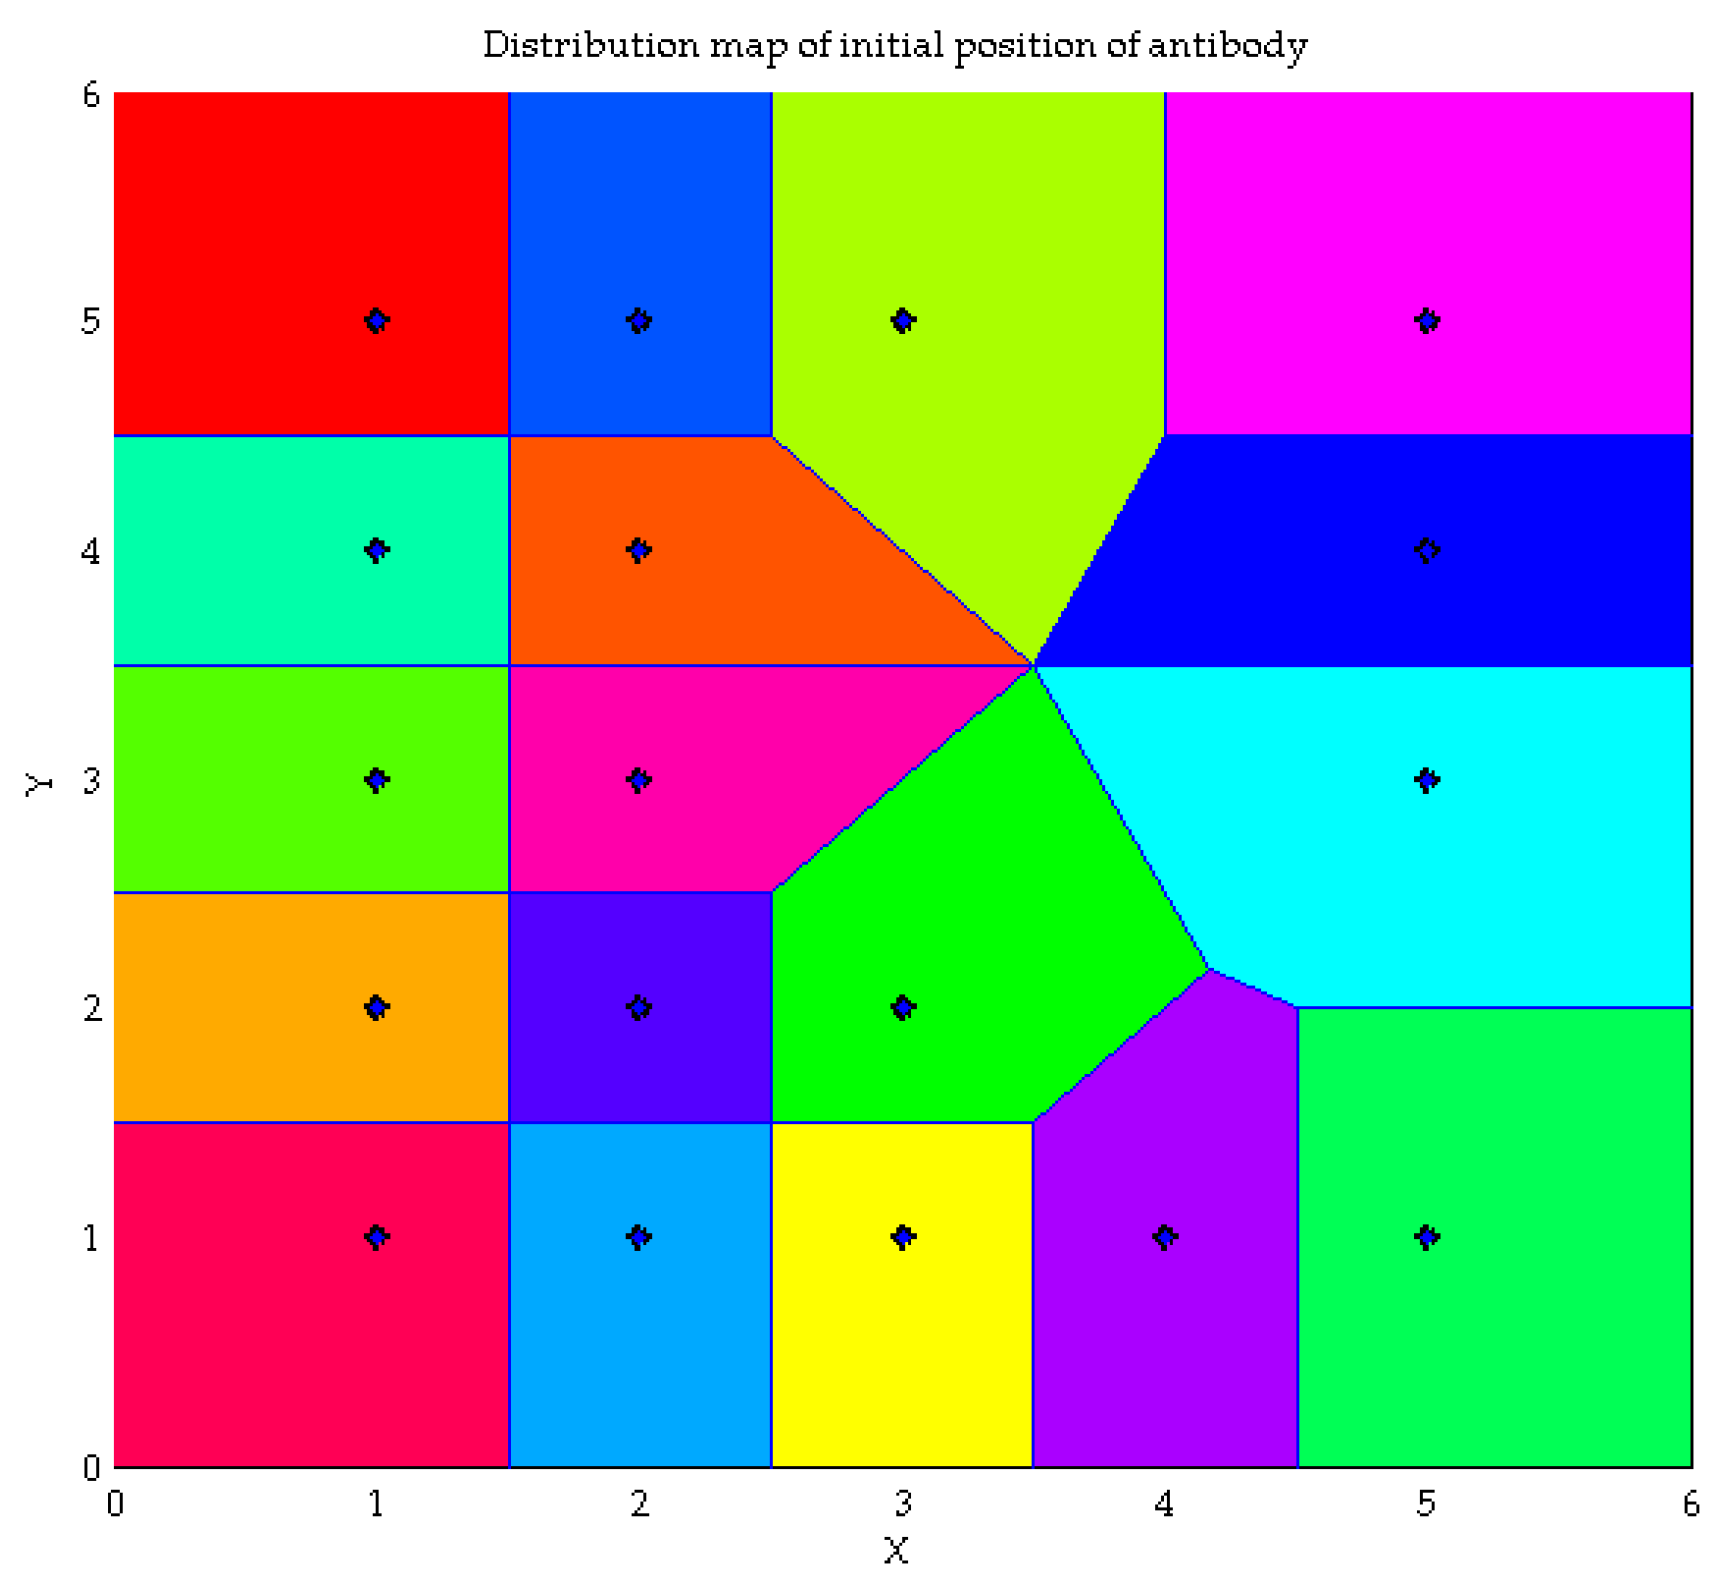
F3) were compared, and the smallest values of the three were selected for different mutation operations to achieve the increase of satisfaction under this goal. Using the first individual of the first generation group as the initial position of the antibody, the distribution of the initial position of the antibody was drawn by Voronoi diagram as shown in Figure 8.
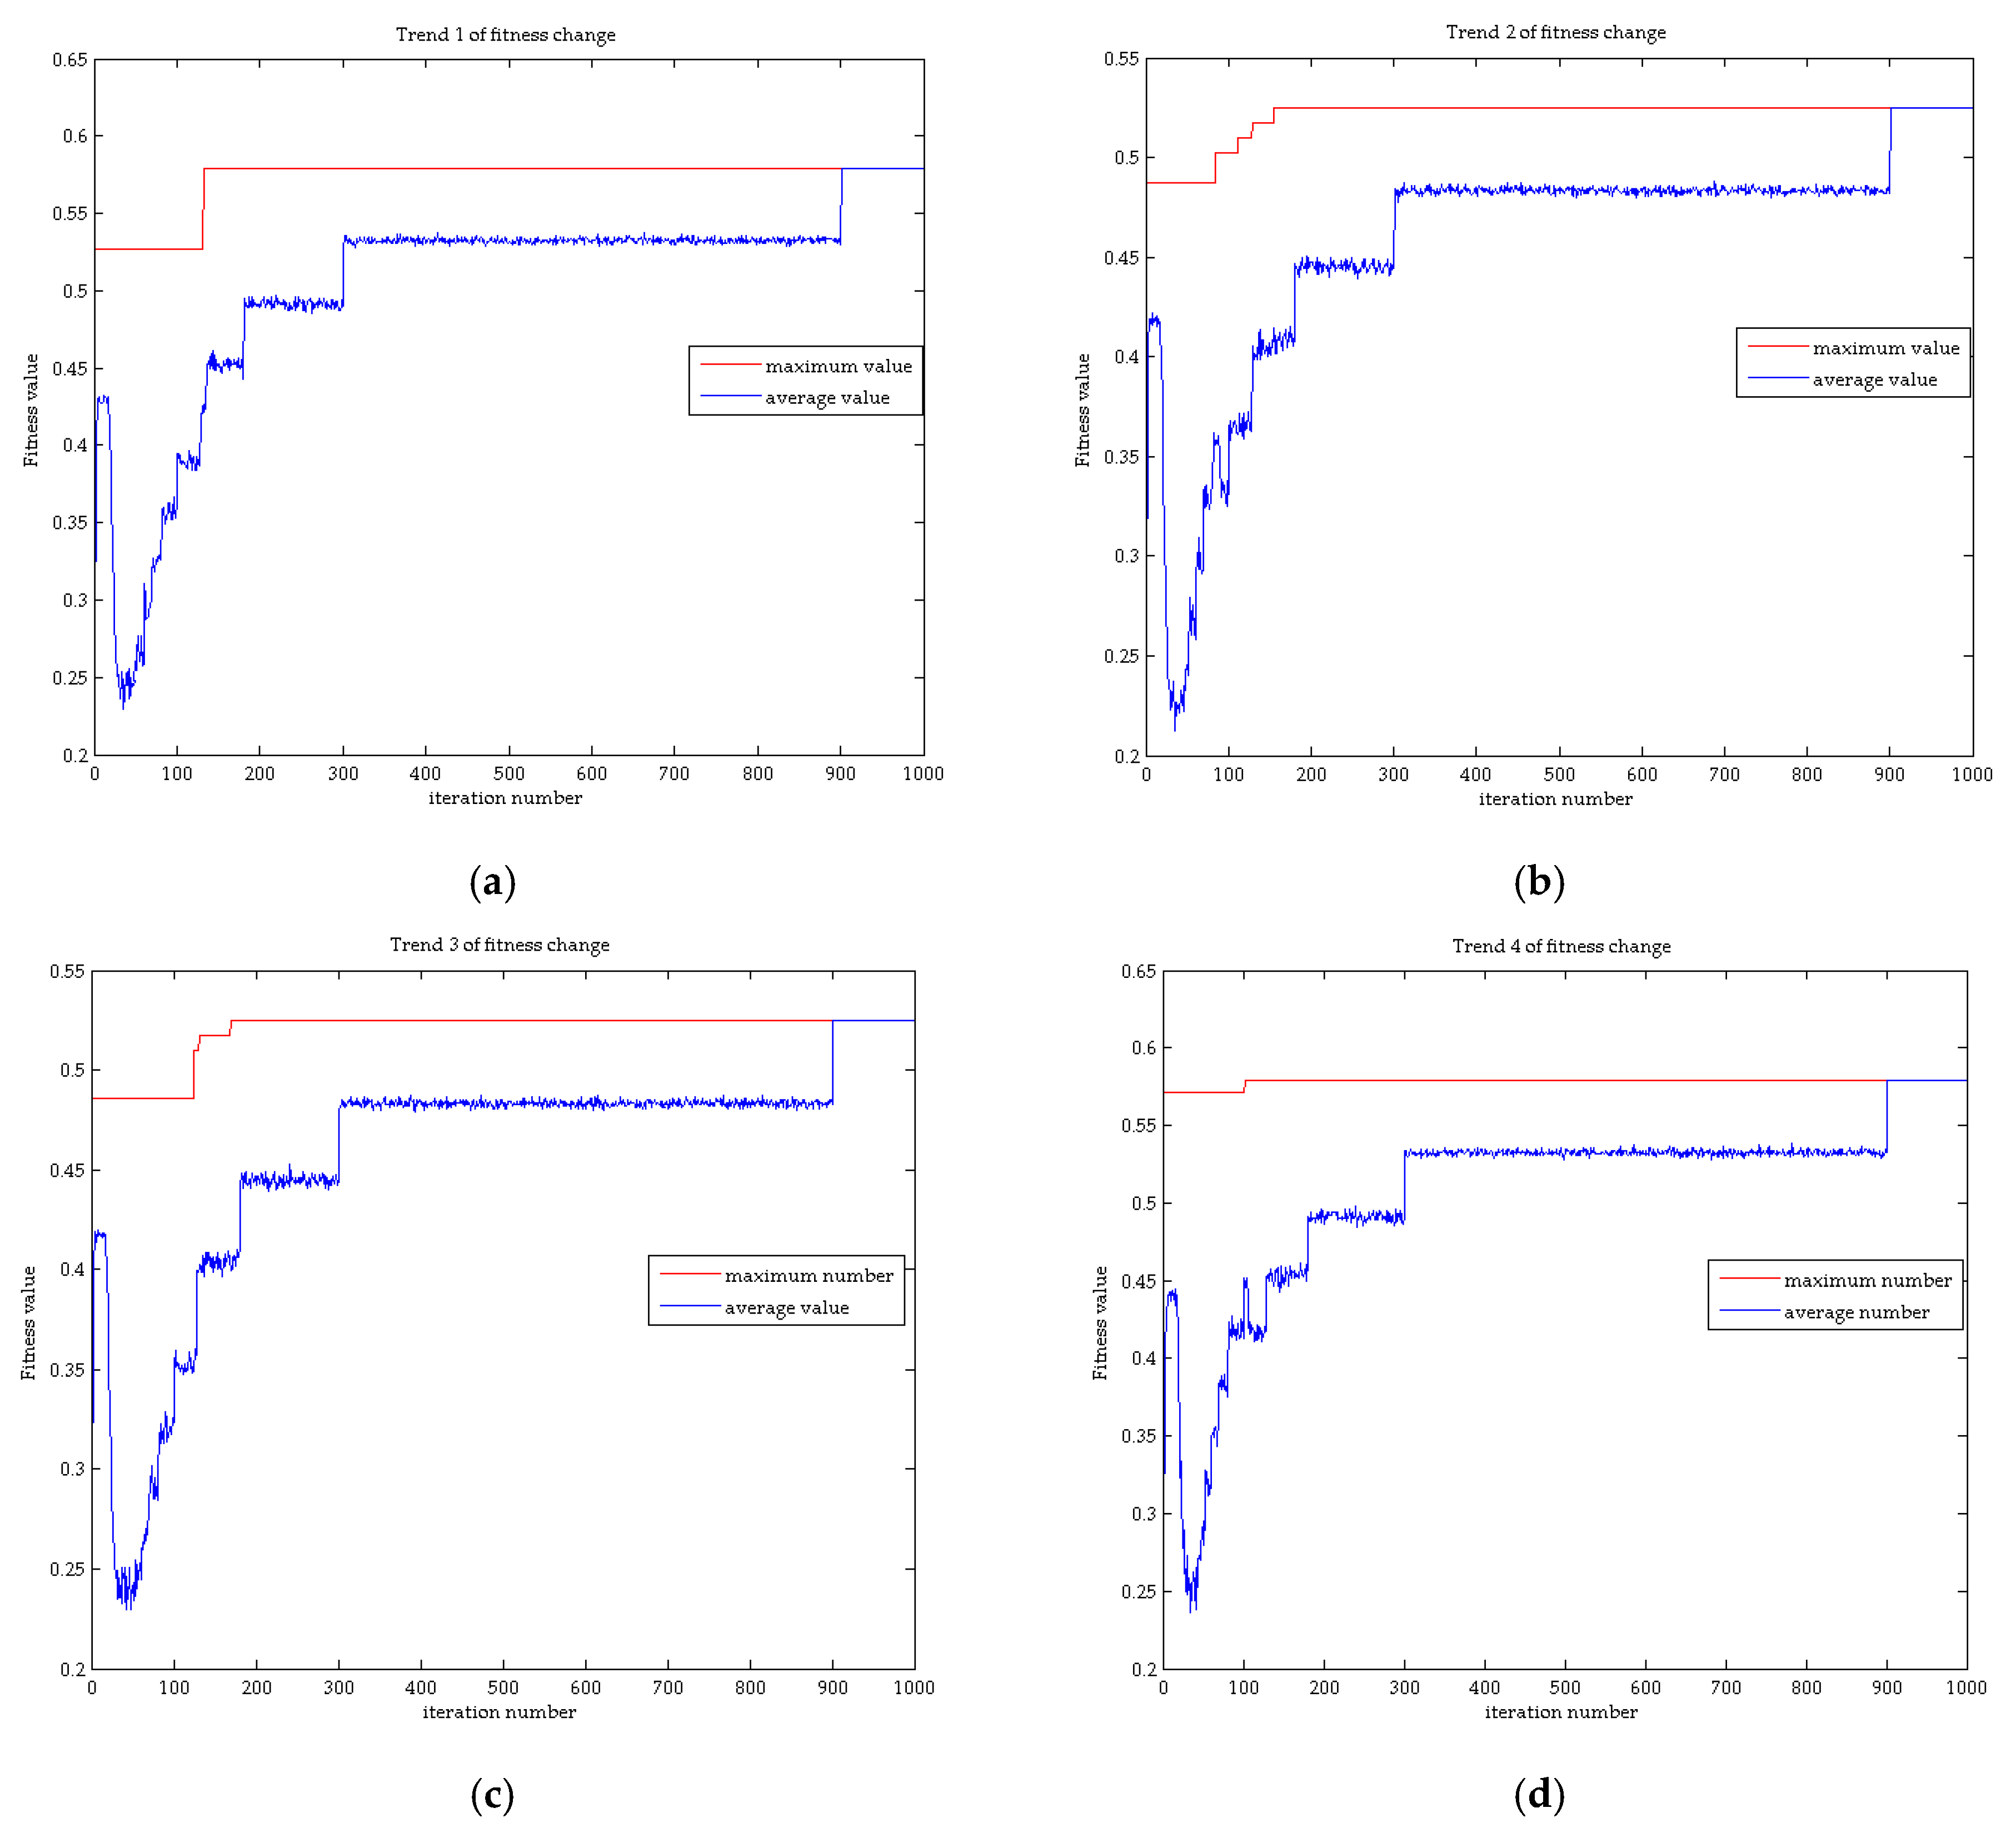
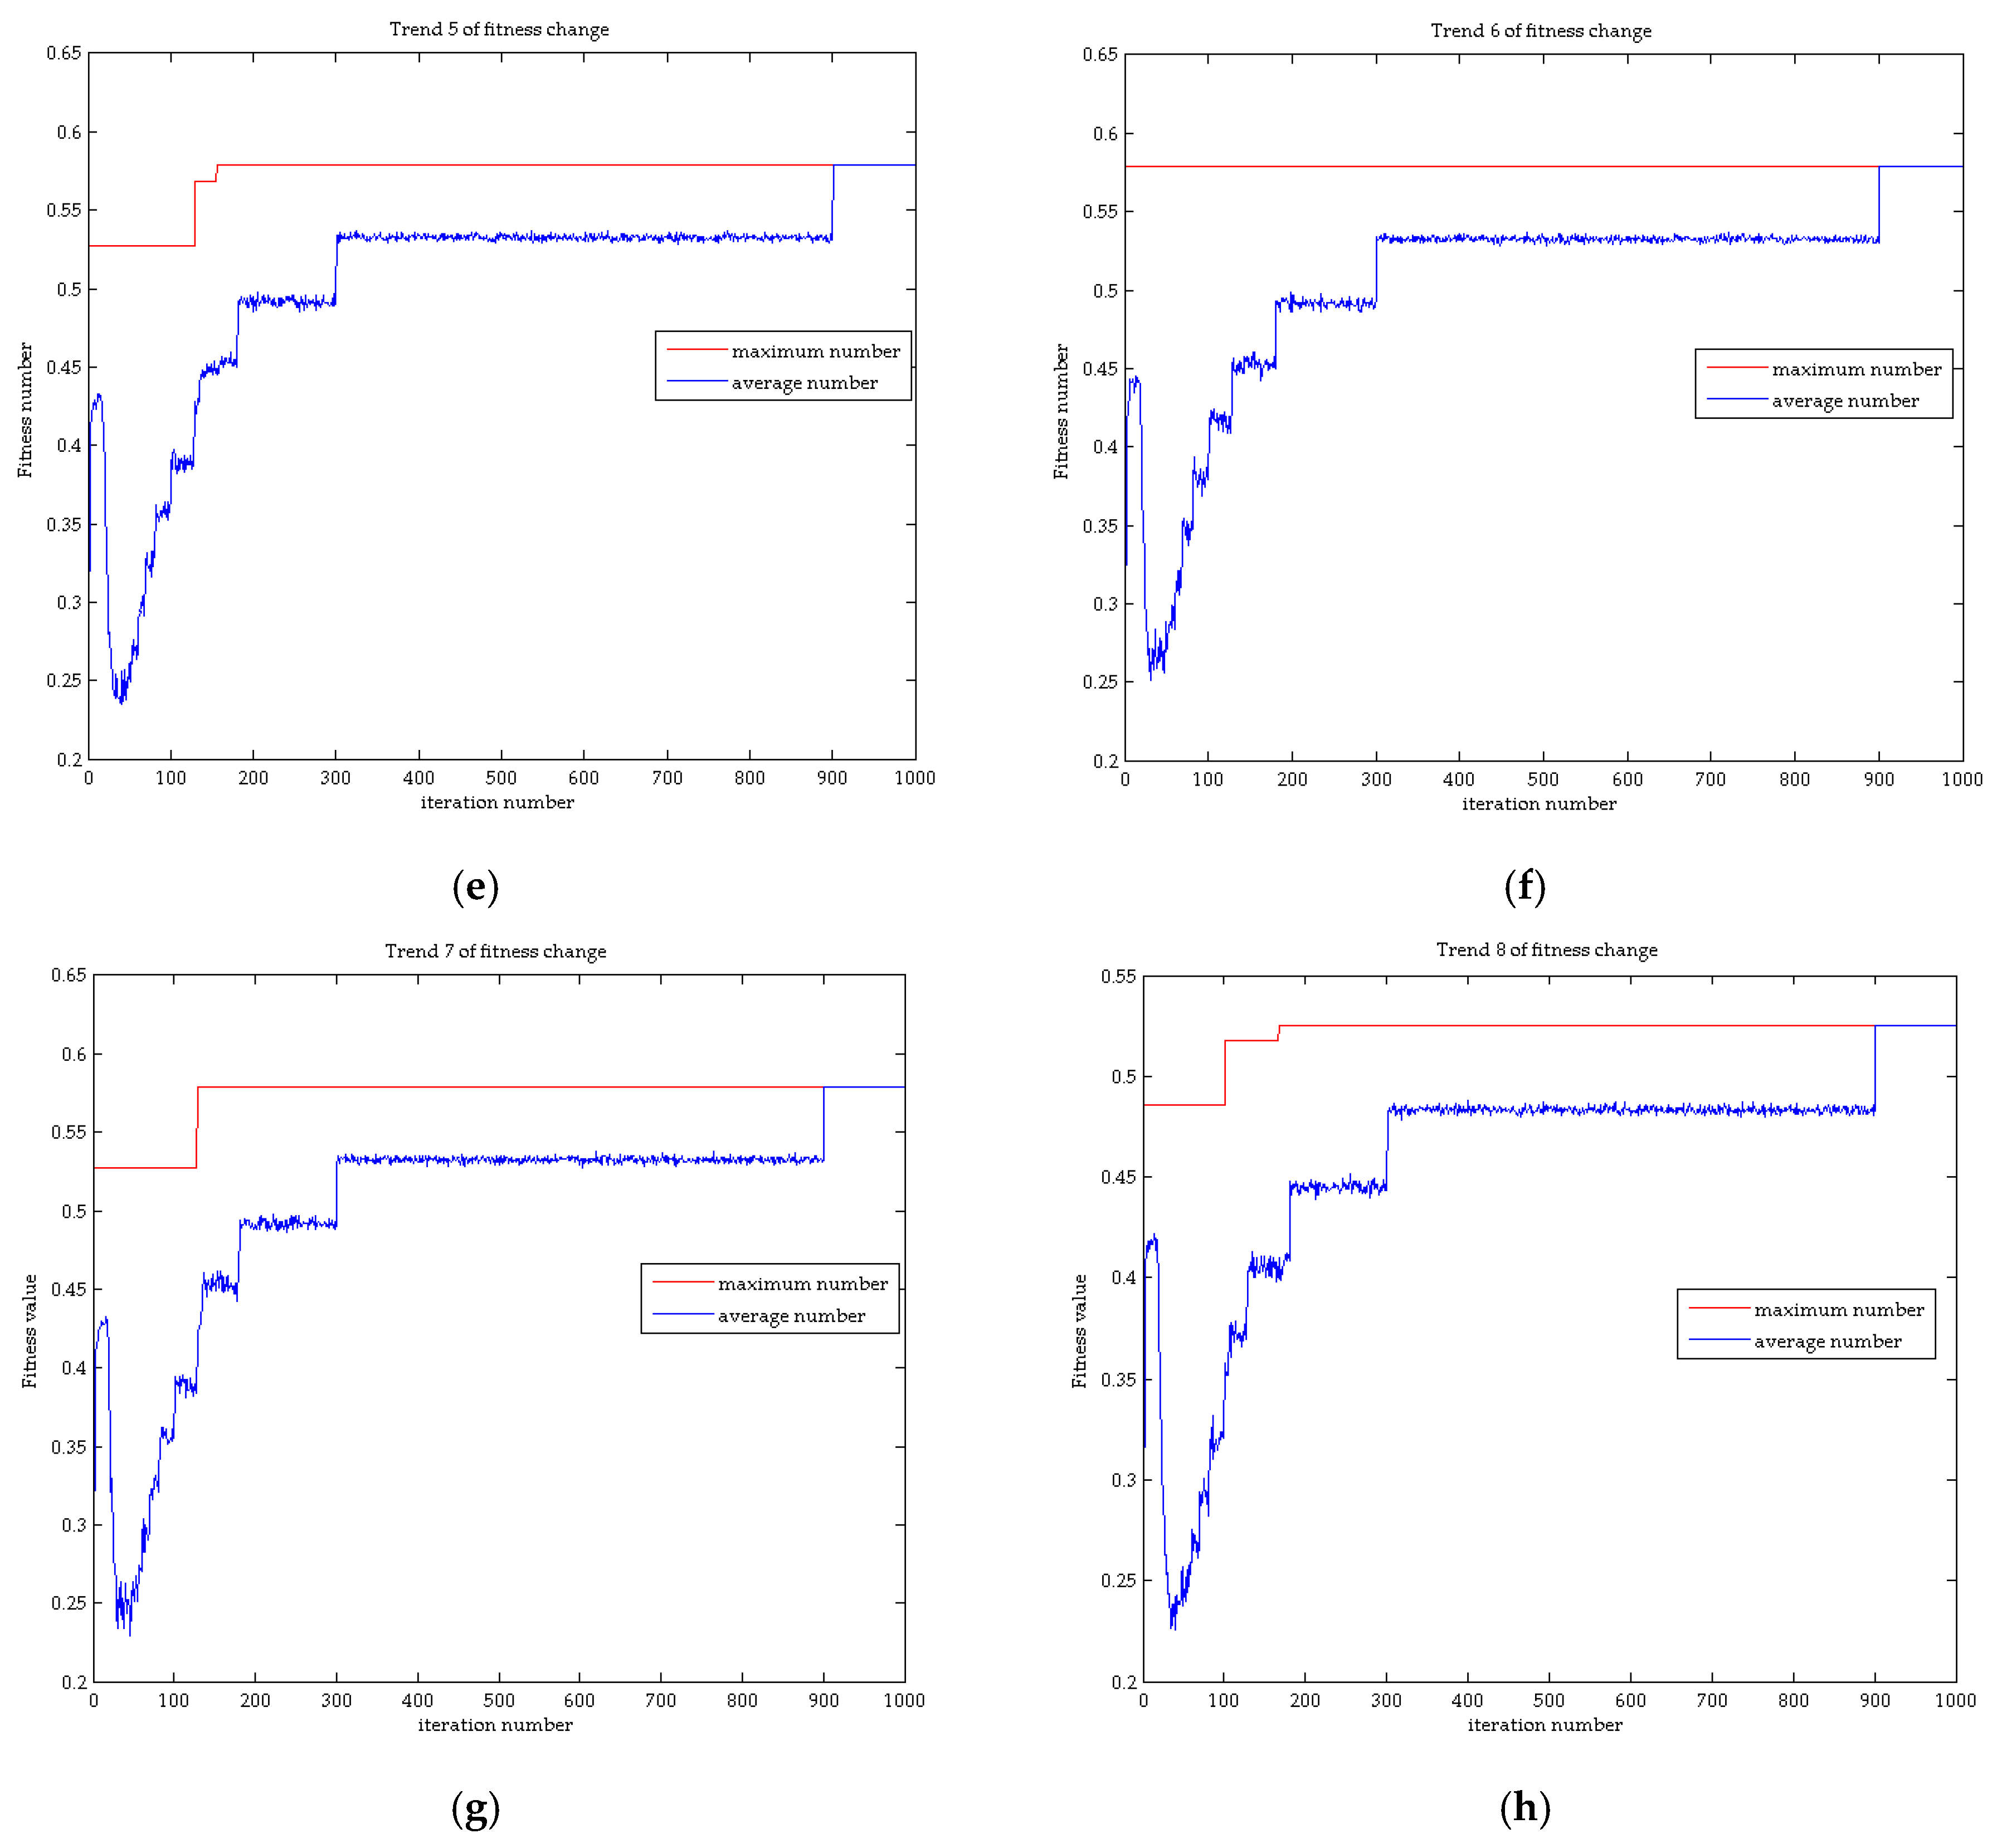
The above variation operations were repeated in each generation. The program was run many times, and eight representative cases were selected. The maximum and average values of each generation’s comprehensive satisfaction were taken as function values to make the fitness change trend curve as shown in Figure 9.
The artificial immune system has the characteristics of global optimization, and the system will find the optimal solution of the current generation in each generation. By comparing the above eight cases, it can be seen that the final user satisfaction was the largest in the first, fourth, sixth and seventh cases, and the maximum satisfaction value was 0.5787. Taking the first case as an example, the maximum value of overall satisfaction was 0.5269 in the first generation, and it rose to the maximum in the 120th generation. The comprehensive satisfaction average curve had short-term fluctuations in the early stage of optimization, and then it gradually increased. At around 900 generations, the average value of the fitness value coincided with the maximum value curve and no longer fluctuated. It shows that the average value was equal to the maximum value at this time, the immune population all reached the optimal solution, and there was a unique optimal solution in the population. The initial value of the user’s overall satisfaction average was 0.2498, and the final value was 0.5787.
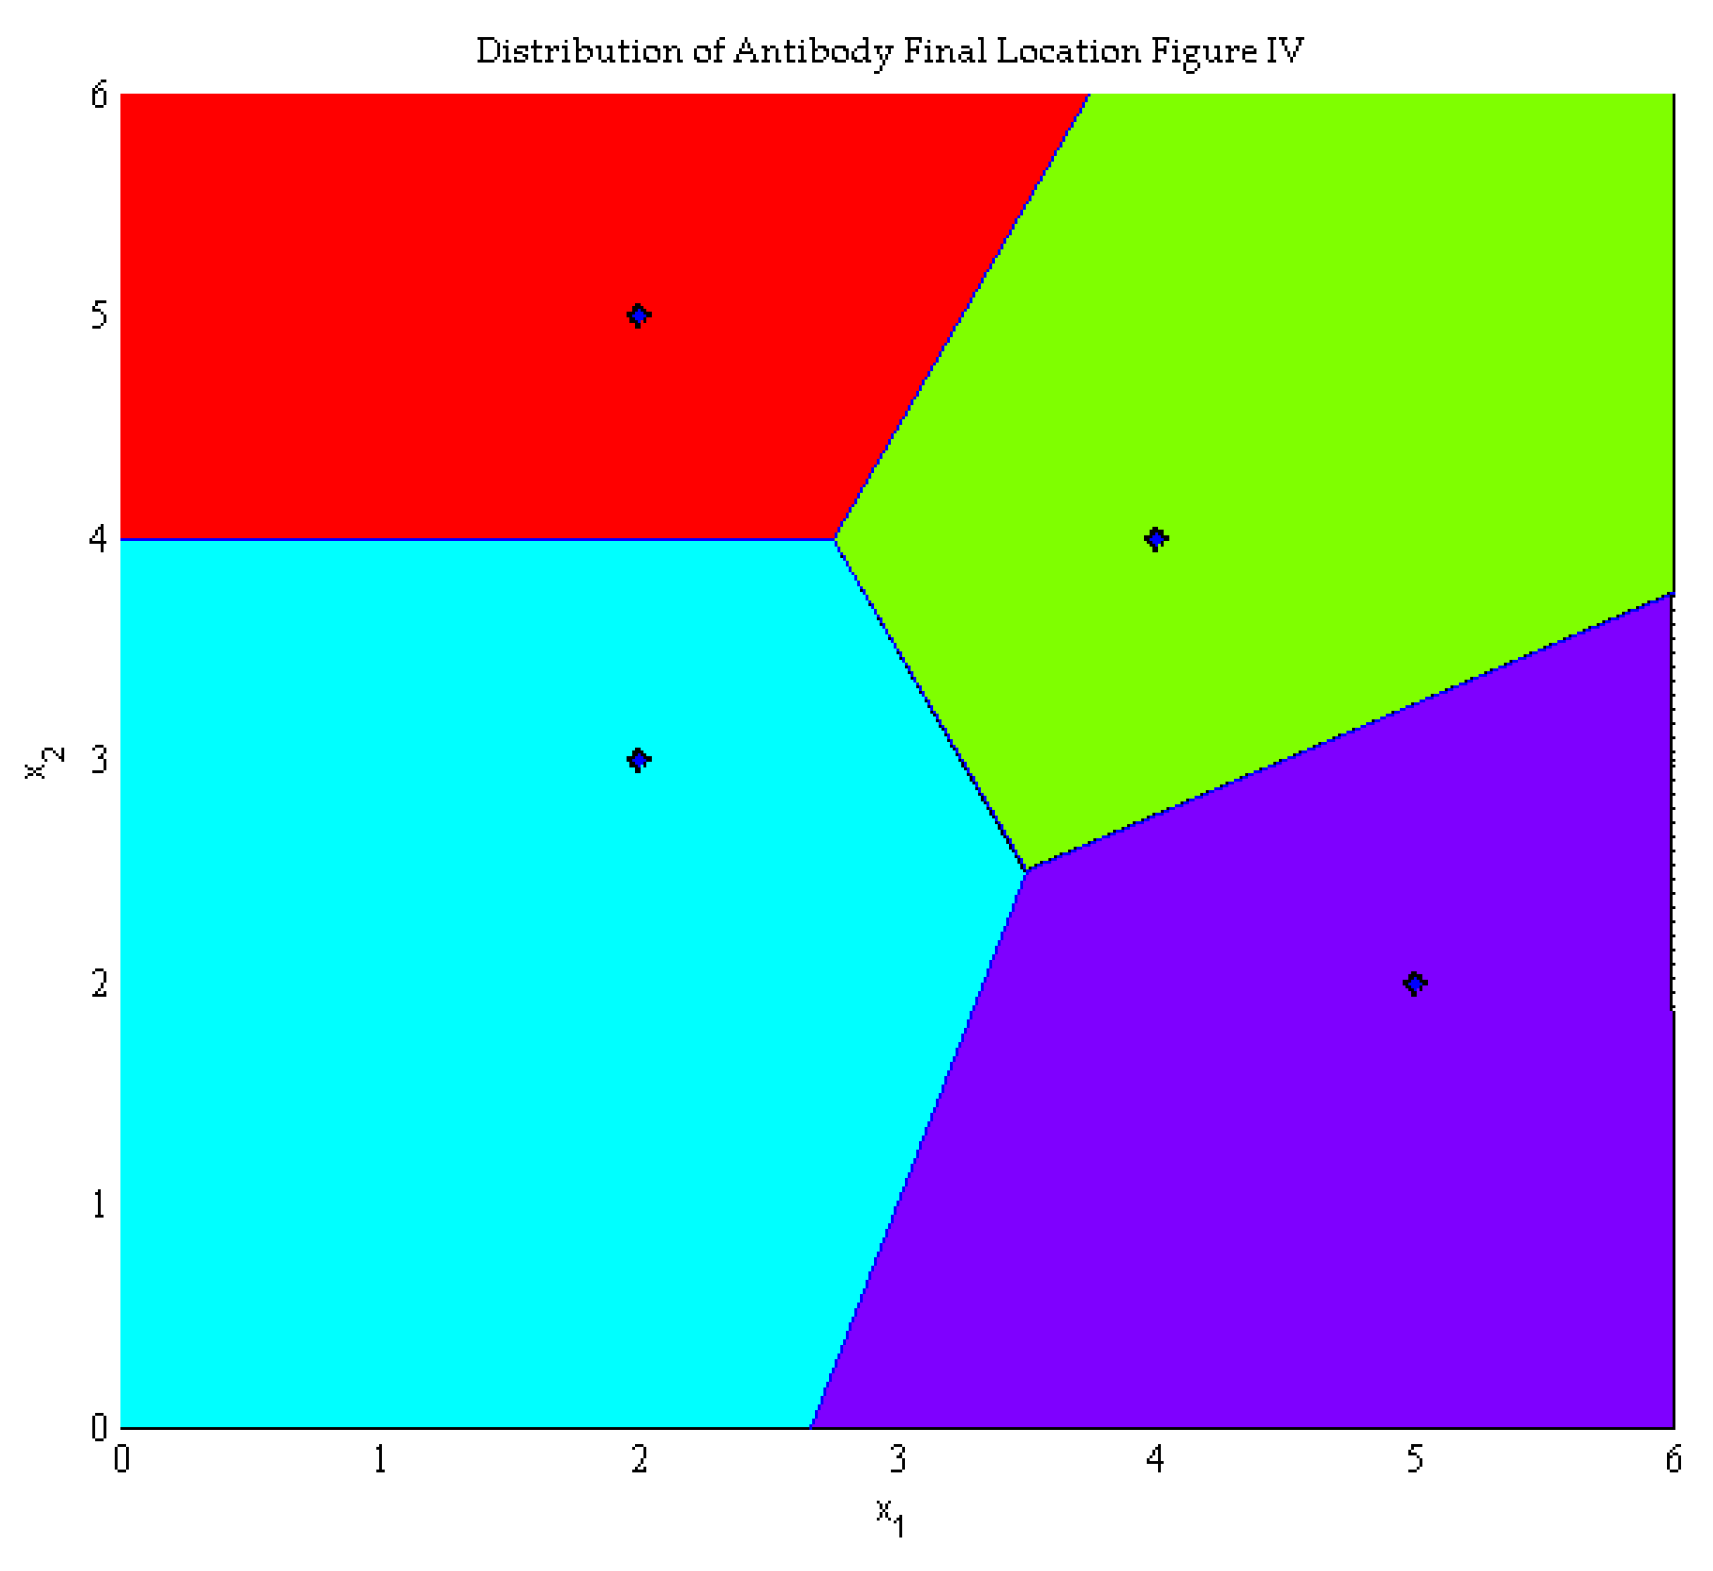
Take the fourth case as an example, taking any individual in the 1000th generation group as the final position of the antibody, and using a Voronoi diagram to draw the final position distribution of the antibody as shown in Figure 10.
The final position profile of the antibody indicates that the optimal construction location of the electric vehicle charging station is at the blue star point in the figure. The best individuals are shown in Table 8.
That is, the optimal solution is to build an electric vehicle charging station with 10 charging devices in each of (2, 5), (4, 4), (2, 3) (5, 2), each station has a capacity of 800 kW. The service area of each charging station is the partition where the charging station is located in the final location map of the antibody.
The satisfaction of each sub-goal corresponding to the optimal solution is:
{ u ( F 1 ) = 0 u ( F 2 ) = 0.6573 u ( F 3 ) = 1.0000
The sub-goals corresponding to the optimal solution are:
{ Average total empty distance D r = 56 km Minimum charge price P min = 1.1 ( yuan / kW h ) Charging time W s = 30.87 min

5. Conclusions

With the continuous expansion of the development scale of electric vehicles, the location and capacity of charging stations have an important impact on the optimal allocation of urban resources. Considering the comprehensive satisfaction of the user side and the comprehensive constraints of the grid side, the research will continue to deepen, providing theoretical reference and practical guidance for improving the scientific planning and optimal resource allocation of electric vehicles. By considering the user’s charging convenience, user charging cost and user charging time, this paper establishes the user’s comprehensive satisfaction function, and studies the problem of charging station location and capacity. Through the simulation calculation of a planning area, the main conclusions are drawn:
The model established in this paper, by introducing the fuzzy membership degree theory into the multi-objective optimization problem, reduces the dimension of the problem and transforms it into a single-objective optimization problem. Optimized by the immune algorithm, the computational efficiency can be improved. This paper comprehensively considers various factors affecting user satisfaction, and models charging convenience, charging cost and charging time, and establishes a model under the premise of ensuring the safety and stability of the grid and the sufficient capacity of the charging facility. In this study, immune algorithm is used to solve the optimal allocation problem, which can provide methodological guidance for the location and capacity of electric vehicles in areas with scarce land resources, high population density and large number of electric vehicles ownership, so as to improve the capacity of electric vehicles charging station resource allocation and the level of users’ comprehensive satisfaction.

Author Contributions

Conceptualization, X.-b.C.; data curation, H.Z.; formal analysis, X.-b.C.; methodology, H.Z.; validation, X.-b.C.; writing—original draft, X.-b.C. and H.Z.; writing—review & editing, T.Y. and J.-p.L.

Funding

This research was funded by the National Natural Science Foundation of China (NSFC), grant number 71501071 and Beijing Social Science Fund, grant number 16YJC064.The APC was funded by the Fundamental Research Funds for the Central Universities.

Acknowledgments

This study is supported by the National Natural Science Foundation of China (NSFC) (71501071), Beijing Social Science Fund (16YJC064) and the Fundamental Research Funds for the Central Universities (2017MS059, 2018ZD14).

Conflicts of Interest

The authors declare no conflict of interest.

References

  1. Ministry of Public Security of the People’s Republic of China. Available online: http://www.mps.gov.cn/n2254098/n4904352/c6354939/content.html (accessed on 13 May 2019).
  2. China Industrial Information Network. Available online: http://www.chyxx.com/industry/201806/648847.html (accessed on 13 May 2019).
  3. Bae, S.; Kwasinski, A. Spatial and Temporal Model of Electric Vehicle Charging Demand. IEEE Trans. Smart Grid 2012, 3, 394–403. [Google Scholar] [CrossRef]
  4. Wu, F.; Sioshansi, R. A stochastic flow-capturing model to optimize the location of fast-charging stations with uncertain electric vehicle flows. Transp. Res. Part D-Transp. Environ. 2017, 53, 354–376. [Google Scholar] [CrossRef]
  5. Yagcitekin, B.; Uzunoglu, M.; Karakas, A. A new deployment method for electric vehicle charging infrastructure. Turk. J. Electr. Eng. Comput. Sci. 2016, 24, 1292–1305. [Google Scholar] [CrossRef]
  6. Pan, Y.; Qiu, X.; Wu, J.; Xiao, J. Analysis of charging behavior of electric vehicles based on Markov decision process. Electr. Power Constr. 2018, 39, 129–137. [Google Scholar] [CrossRef]
  7. Shi, Q.; Zheng, X. Electric Vehicle Charging Stations Optimal Location Based on Fuzzy C-means Clustering. In Mechatronics Engineering, Computing and Information Technology; Xu, X.D., Li, B., Lu, Q.M., Yan, X.Y., Li, J.L., Eds.; Trans Tech Publications Ltd.: Stafa-Zurich, Switerland, 2014; Volume 556–562, pp. 3972–3975. [Google Scholar]
  8. Xia, F.; Wang, Z.; Peng, D.; Li, Z.; Luo, Z.; Yuan, B. Location Model Research of Charging Station for Electric Vehicle Based on Users’ Benefit. In Advanced Computational Methods in Energy, Power, Electric Vehicles, and Their Integration; Li, K., Xue, Y., Cui, S., Niu, Q., Yang, Z., Luk, P., Eds.; Springer: Singapore, 2017; Volume 763, pp. 351–361. [Google Scholar]
  9. Ai, X.; Li, Y.; Wang, K.; Hu, J. Location and Constant Volume of Electric Vehicle Charging Station Based on Chaotic Simulated Annealing Particle Swarm Optimization Algorithm. Power Autom. Equip. 2018, 38, 9–14. [Google Scholar] [CrossRef]
  10. Jing, W.; An, K.; Ramezani, M.; Kim, I. Location Design of Electric Vehicle Charging Facilities: A Path-Distance Constrained Stochastic User Equilibrium Approach. J. Adv. Transp. 2017. [Google Scholar] [CrossRef]
  11. Dong, J.; Liu, C.; Lin, Z. Charging infrastructure planning for promoting battery electric vehicles: An activity-based approach using multiday travel data. Transp. Res. Part C-Emerg. Technol. 2014, 38, 44–55. [Google Scholar] [CrossRef]
  12. Chen, S.; Shi, Y.; Chen, X.; Qi, F. Optimal Location of Electric Vehicle Charging Stations Using Genetic Algorithm. In Proceedings of the 2015 17th Asia-Pacific Network Operations and Management Symposium (APNOMS), Busan, Korea, 19–21 August 2015. [Google Scholar]
  13. Efthymiou, D.; Chrysostomou, K.; Morfoulaki, M.; Aifantopoulou, G. Electric vehicles charging infrastructure location: A genetic algorithm approach. Eur. Transp. Res. Rev. 2017, 9. [Google Scholar] [CrossRef]
  14. He, F.; Yin, Y.; Zhou, J. Deploying public charging stations for electric vehicles on urban road networks. Transp. Res. Part C-Emerg. Technol. 2015, 60, 227–240. [Google Scholar] [CrossRef]
  15. He, S.Y.; Kuo, Y.-H.; Wu, D. Incorporating institutional and spatial factors in the selection of the optimal locations of public electric vehicle charging facilities: A case study of Beijing, China. Transp. Res. Part C-Emerg. Technol. 2016, 67, 131–148. [Google Scholar] [CrossRef]
  16. Tang, M.; Gong, D.; Liu, S.; Lu, X. Finding key factors affecting the locations of electric vehicle charging stations: A simulation and Anova approach. Int. J. Simul. Model. 2017, 16, 541–554. [Google Scholar] [CrossRef]
  17. Chen, G.; Qu, D.; Hu, X.; Zhang, H.; Hu, Z.; Wang, K. Cost-benefit evaluation of electric vehicle charging and replacing station based on full life cycle analysis. Electr. Power Constr. 2016, 37, 30–37. [Google Scholar] [CrossRef]
  18. Wolbertus, R.; Gerzon, B. Improving Electric Vehicle Charging Station Efficiency through Pricing. J. Adv. Transp. 2018. [Google Scholar] [CrossRef]
  19. Tang, Z.; Guo, C.; Hou, P.; Fan, Y.; Jia, D. Optimal Planning of Electric Vehicle Charging Stations Location Based on Hybrid Particle Swarm Optimization. Appl. Energy Technol. 2013, 724–725, 1355–1360. [Google Scholar] [CrossRef]
  20. Li, K.; Wang, S. Electric Vehicle Charging Station Deployment for Minimizing Construction Cost. In Proceedings of the International Conference on Big Data Analytics and Knowledge Discovery, Dawak 2017, Lyon, France, 28–31 August 2017; Bellatreche, L., Chakravarthy, S., Eds.; Springer: Cham, Switzerland, 2017; Volume 10440, pp. 471–485. [Google Scholar]
  21. Federal High Way Administration. US Department of Transportation [EB/OL]. [2014-10-05]. Available online: http://nhts.ornl.gov/2009/pub/stt.pdf (accessed on 18 May 2019).
Figure 1. Global and Chinese electric vehicle ownership in the past five years.
Energies 12 01915 g001
Figure 2. Research technology roadmap. The possible parameters and symbols in the text, formulas and diagrams of this paper are shown in Table 1.
Energies 12 01915 g002
Figure 3. Immune algorithm flow chart.
Energies 12 01915 g003
Figure 4. Planning area transportation network.
Energies 12 01915 g004
Figure 5. The trend of adaptation value of the shortest distance.
Energies 12 01915 g005
Figure 6. The trend of adaptation value at the lowest charging cost.
Energies 12 01915 g006
Figure 7. The trend of the adaptation value of the shortest charging time.
Energies 12 01915 g007
Figure 8. Initial position distribution of antibodies under multi-objective optimization.
Energies 12 01915 g008
Figure 9. (a) Trend 1 of fitness change; (b) Trend 2 of fitness change; (c) Trend 3 of fitness change; (d) Trend 4 of fitness change; (e) Trend 5 of fitness change; (f) Trend 6 of fitness change; (g) Trend 7 of fitness change; (h) Trend 8 of fitness change.
Energies 12 01915 g009aEnergies 12 01915 g009b
Figure 10. Antibody final position map.
Energies 12 01915 g010
Table 1. Symbols and Implications of Parameters.
Parameter SymbolParameter Implication
DrDead distance
D1Driving distance with charging requirement
D2Driving distance without charge requirement
PminInvestor’s Minimum Pricing
PmaxMaximum price acceptable to users
CItAnnual cash inflows
COtAnnual cash outflow
icBenchmark rate of return
NPVnet present value
WSStaying time
λPoisson parameter
μNegative exponential distribution parameters
SmaxRegional Maximum Charging Demand
FkValue of objective function
FminLower bound of objective function
FmaxUpper bound of objective function
Table 2. Electric vehicle performance parameters.
Parameter CategoryParameter Value
Battery capacity sb32 kW·h
Rated charging power pev3 kW
100 km power consumption e10015 kW·h
Table 3. Charging station cost parameter.
Parameter CategoryParameter Value
Infrastructure cost250,000 yuan per device
Distribution cost200,000 yuan per device
Operating cost30,000 yuan per device per year
Charging station life cycle20 years
Benchmark rate of return10%
Table 4. Antibody coding.
12345678910111213141516171819202122232425
1203021202123023212312101
Table 5. Cost distribution under different numbers.
Number of Charging DevicesInfrastructure CostDistribution CostAnnual Operating CostPresent Value of Cost
82 million yuan1.6 million yuan240,000 yuan5.64million yuan
92.25 million yuan1.8 million yuan270,000 yuan6.34 million yuan
102.5 million yuan2 million yuan300,000 yuan7.05 million yuan
Table 6. M/M/c model parameters under different numbers.
cρP0LqWs (h)
80.76440.00191.24720.6020
90.67940.00210.45310.5371
100.61150.00220.17640.5144
Table 7. The upper and lower limits of the three objective function values acceptable to the user.
Value of Objective FunctionLower Limit FminUpper Limit Fmax
Bypass distance (km)016
Charging cost (yuan/kW·h)0.192.8
Charging time (min)30.8736.12
Table 8. Optimal individual coding.
12345678910111213141516171819202122232425
0300000030030000000300000

