Reducing Tower Fatigue through Blade Back Twist and Active Pitch-to-Stall Control Strategy for a Semi-Submersible Floating Offshore Wind Turbine


1
Department of Energy and Power, Cranfield University, Cranfield, Bedfordshire MK43 0AL, UK
2
Department of Naval Architecture, Ocean & Marine Engineering, University of Strathclyde, Henry Dyer Building, 100 Montrose Street, Glasgow G4 0LZ, UK
3
Centre for Thermal Energy Systems and Materials, Cranfield University, Cranfield, Bedfordshire MK43 0AL, UK
*
Author to whom correspondence should be addressed.
Energies 2019, 12(10), 1897; https://doi.org/10.3390/en12101897
Submission received: 11 April 2019
/
Revised: 14 May 2019
/
Accepted: 15 May 2019
/
Published: 18 May 2019
(This article belongs to the Special Issue Assessment and Nonlinear Modeling of Wave, Tidal and Wind Energy Converters and Turbines)
Abstract
:The necessity of producing more electricity from renewable sources has been driven predominantly by the need to prevent irreversible climate chance. Currently, industry is looking towards floating offshore wind turbine solutions to form part of their future renewable portfolio. However, wind turbine loads are often increased when mounted on a floating rather than fixed platform. Negative damping must also be avoided to prevent tower oscillations. By presenting a turbine actively pitching-to-stall, the impact on the tower fore–aft bending moment of a blade with back twist towards feather as it approaches the tip was explored, utilizing the time domain FAST v8 simulation tool. The turbine was coupled to a floating semisubmersible platform, as this type of floater suffers from increased fore–aft oscillations of the tower, and therefore could benefit from this alternative control approach. Correlation between the responses of the blade’s flapwise bending moment and the tower base’s fore–aft moment was observed with this back-twisted pitch-to-stall blade. Negative damping was also avoided by utilizing a pitch-to-stall control strategy. At 13 and 18 m/s mean turbulent winds, a 20% and 5.8% increase in the tower axial fatigue life was achieved, respectively. Overall, it was shown that the proposed approach seems to be effective in diminishing detrimental oscillations of the power output and in enhancing the tower axial fatigue life.
1. Introduction
Worldwide, climate policies have encouraged the development of energy from renewable resources, such that, within Europe, 11.6% of energy demand was provided solely from wind energy in 2018 [1]. The installed capacity of offshore wind turbines has increased globally by 87%, between 2016 and 2017, rising to a total of nearly 19 GW [2], of which floating turbines currently play only a small part. Indeed, the world’s first floating farm, with a capacity of 30 MW only came online in 2017. However, due to the limited availability of offshore sites with shallow beds and low seabed slope, the industry is looking towards floating solutions in the future, with predictions of 5 GW of installed energy from floating wind by 2030. This would amount to 5% of the offshore wind market [2].
Generally, for floating platforms, the horizontal axis wind turbine (HAWT) specifics used for prototypes, model experimentation, and simulation purposes are largely those that have been originally designed for onshore locations. Although they are further modified for the offshore environment, the turbines, including most components and the controllers, have generally been optimized for a foundation fixed into the seabed. This has implications for the applicability of these simulations to floating platforms. Turbine loads, for example, are often increased when the HAWT is mounted on a floating platform, although the exact load, magnitude, and origin will vary, depending upon the platform design and environmental factors. Prominent load increases are usually the induced tower base bending moments, with extreme loads increasing by a factor as high as 1.6 times that seen in a fixed, land-based turbine [3]. Thus, the increased tower base axial fatigue could cause a large reduction in the expected life of the turbine, and therefore, there is a need to have more costly tower and platform structures in order to align with the standard 25–30 yr design life of modern offshore wind farms.
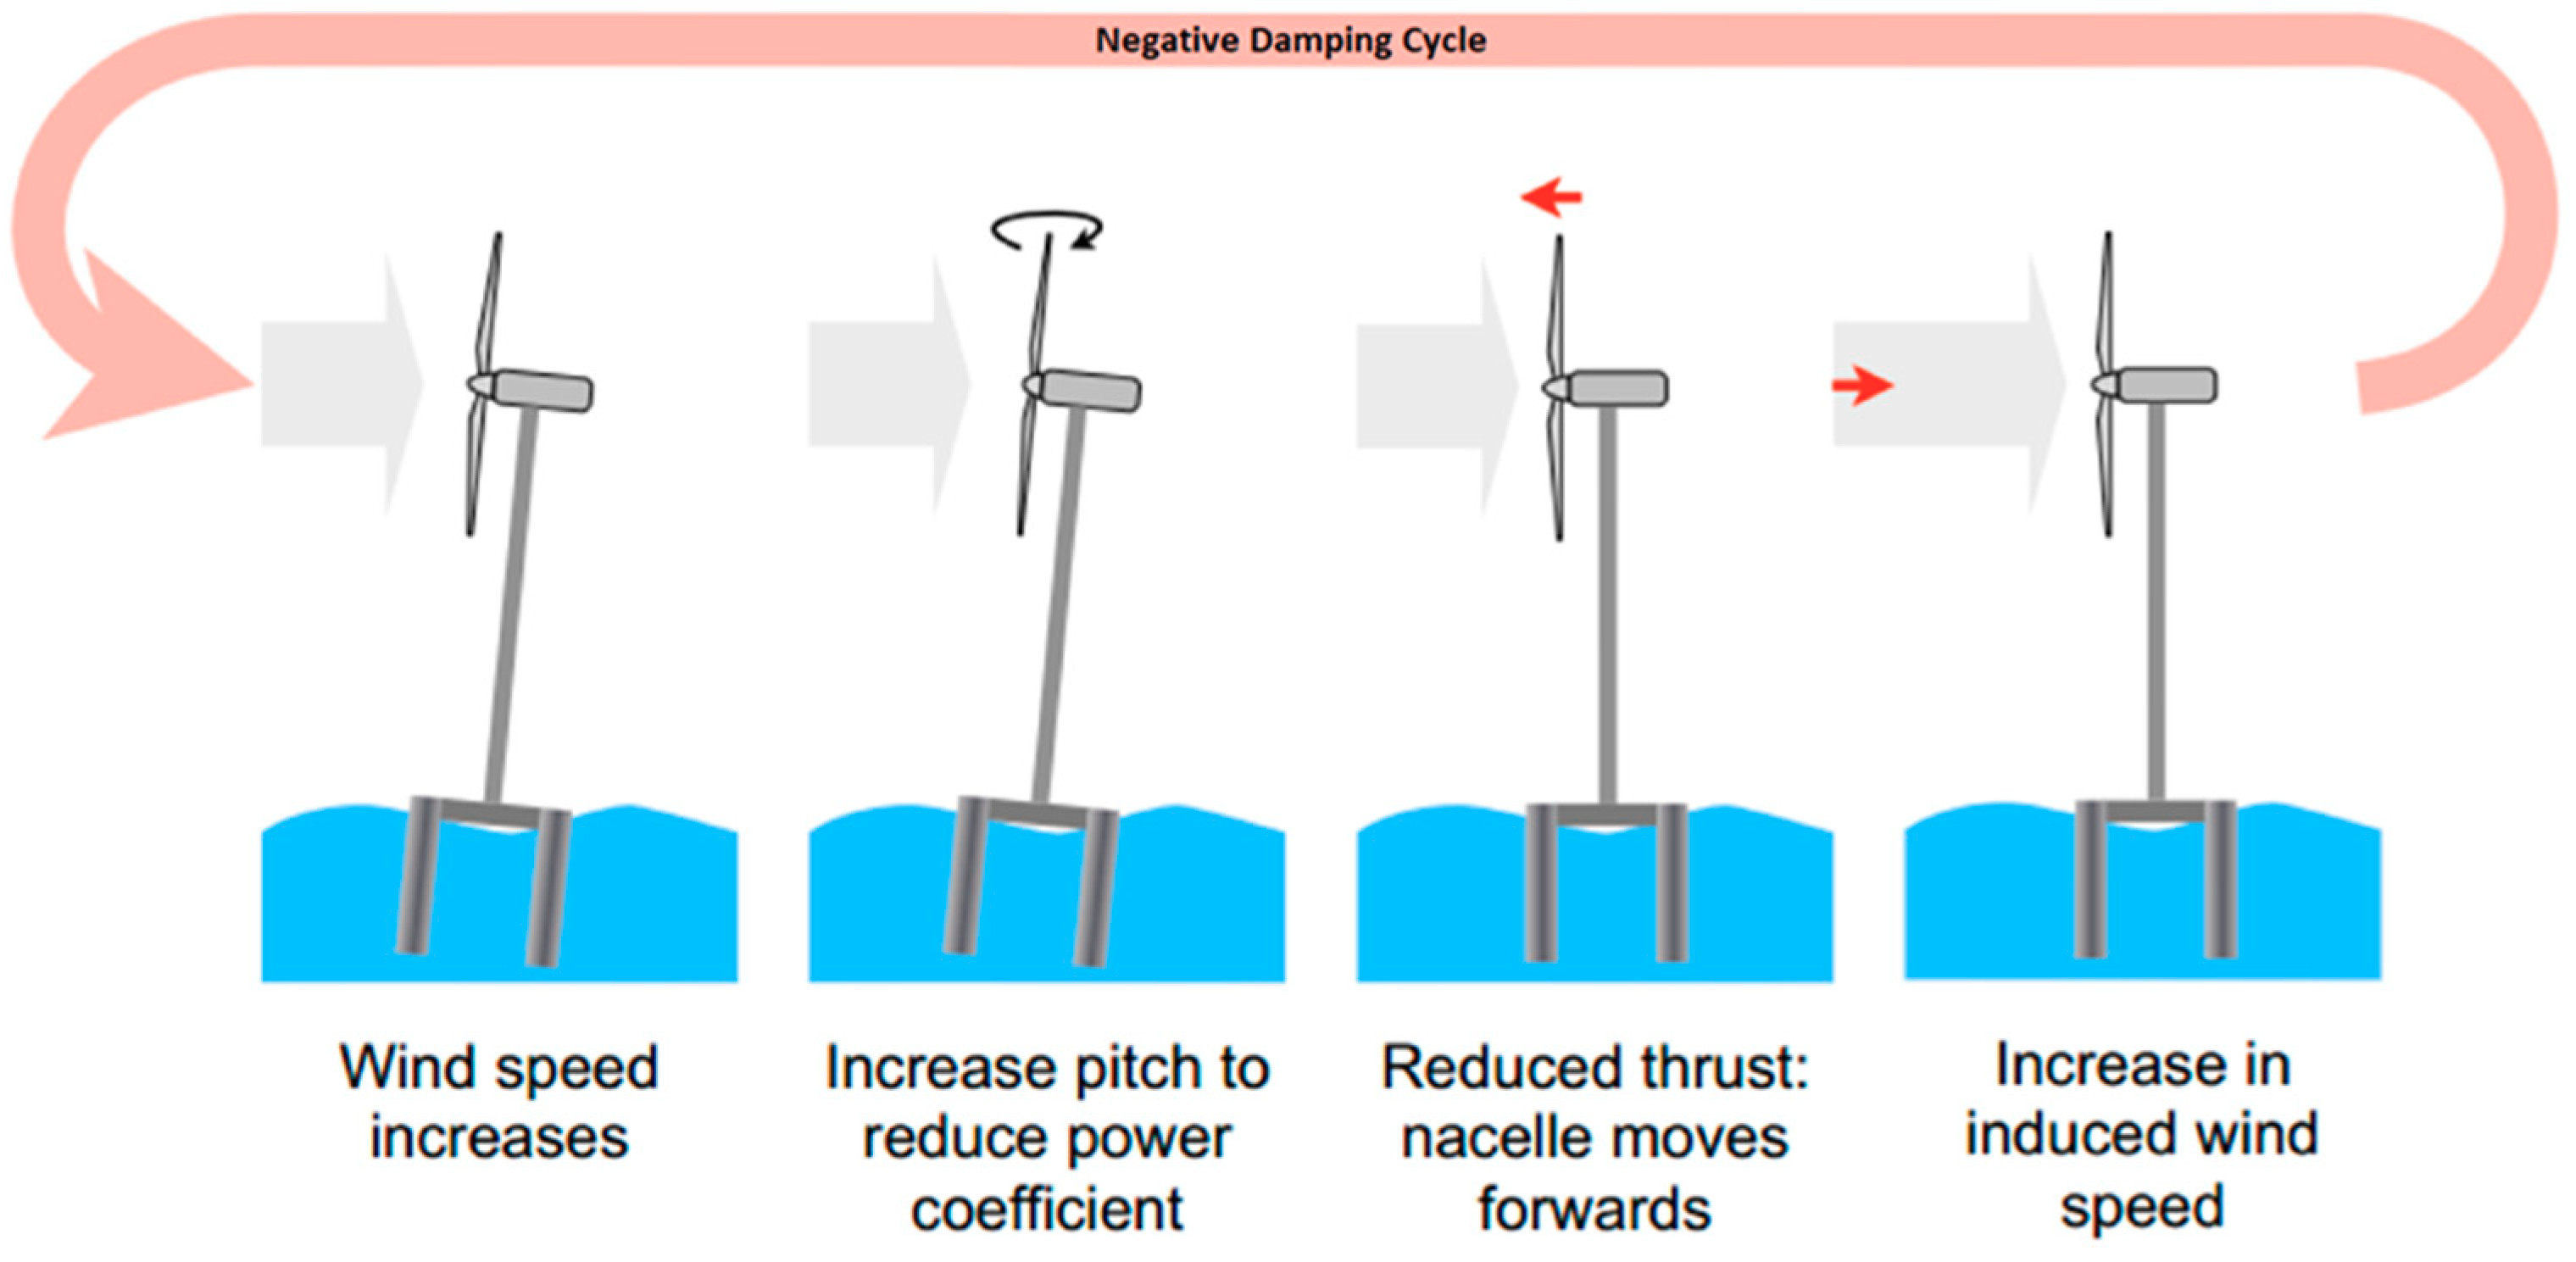
Currently, all large (3 MW+), variable speed, variable pitch, employ HAWTs pitch-to-feather to control the power output above rated wind speeds. Whether these turbines are fixed on dry land, the seabed, or floating offshore, they can experience a phenomenon when wind speeds exceed the rated wind speed, which is generally referred to as “negative damping”. This is due to a decrease in rotor thrust at constant rotor speed as the wind speed increases. This can then lead directly to tower fore–aft oscillation, hence, decreased tower axial fatigue life if not controlled, as illustrated in Figure 1 [4]. Fixed turbines can avoid the negative damping effect without a loss in performance as the natural frequency of the blade pitch control system is lower than the first resonance modes of the tower. However, for floating offshore wind turbines (FOWTs), the frequency of the motions (surge, sway, roll, and pitch) are one or more orders of magnitudes lower than for a fixed-base turbine, and therefore, the pitch controller frequency must be lower to avoid negative damping. This causes a reduction in the performance of the rotor speed when operating at above rated wind speeds, such that the ideal constant rotor speed fluctuates around the desired output, leading to more undesirable fluctuations in the generated power output [5].
Horizontal axis wind turbines with variable speed and variable pitch are now considered the industrial standard for large turbines. However, utilising active pitch-to-stall rather than pitch-to-feather control, where the blade is rotated so that the induced aerodynamic stall slows down the rotor to produce constant rotor speed, has largely been ignored. This omission is because the pitch-to-stall configuration can lead to increased blade deflections in larger, softer blades and reduced predictability in terms of induced lift and drag at a specific angle of attack. The issues related to the negative damping phenomenon can, however, be avoided by design when in pitch-to-stall operation, as the rotor thrust at constant rotor speed does not decrease as the wind speed increases. This increasing thrust allows the control frequency to be higher than typically expected on an FOWT, resulting in a much improved rotor speed performance and high-quality, regulated power. As such, utilising pitch-to-stall configurations could thus offer a solution to the performance reduction seen by current, industry-standard pitch-to-feather floating turbines.
Only two studies, by Larsen and Hanson [5] and Jonkman [6], have been conducted on large, variable speed, floating HAWTs that consider actively pitching the whole blade towards stall as a means to provide a near constant rotor speed at above rated wind speeds. This is partly due to the ambiguity that remains on the aerodynamic behavior of stalled blades [7]. Increased loads and deflection on stalling blades can also dictate that the blades are heavier [8], which would have a negative impact upon the rotor and turbine. The peak loads that can occur on a passive stall blade when power is not shed fast enough would, however, be more controlled when the stall blade is being actively pitched as the power control is more regulated at higher wind speed than in a pitch-to-feather control system. Therefore, although the thrust loads acting on a turbine are increased as the angle of attack increases, it also varies less with pitch angle changes, such that the thrust and the torque have increased stability when operating with pitch-to-stall blades [7]. This reduced variance in the thrust and torque responses will tend to have an overall benefit in terms of tower axial fatigue life. One of the studies simulated turbine, platform, and mooring responses of the Hywind spar concept for a 12 m/s mean turbulent stochastic wind, using a non-linear time domain simulation tool based on SIMO/RIFLEX, developed by Marintex, Trondheim, Norway and HAWC2, developed by DTU (Technical University of Denmark), Risø Campus, Denmark [5]. The simulation results for active pitch-to-stall control indicated not only improved regulation of rotor speed and power generation, but also saw more tower stability. These results were obtained even though the simulations used a blade designed for pitch-to-feather control. In fact, the authors, by accidentally making a pitch angle sign error in the pitch-to-feather control strategy, were using a pitch-to-feather wind turbine system in a pitch-to-stall mode. Hence, the design of the blades, controller, controller gains, and all components were from that original pitch-to-feather system. In the second study, Jonkman [6] looked at simulated responses for a floating barge in 18 m/s mean turbulent stochastic winds when actively pitching-to-stall as well as when actively pitching-to-feather. The results were generated with the aero-servo-elastic simulation package, FAST 7. In the simulations, rotor speed and power regulation again increased with stall control, as compared to feather control. However, this was at the expense of an increase in the tower motion. This difference in the impact of pitch-to-stall on tower stability between the two studies, such that for a spar response changes were beneficial, yet they were detrimental to the barge, indicates that the responses were very platform-type specific. The question of whether tower stability would be improved for a semi-submersible platform operating with a pitch-to-stall rotor has not been addressed to date. The impact of the platform-type is supported by the fact that the barge design also led to instability of the tower in pitch-to-feather control [6]. Although the blade used was also of a pitch-to-feather design (comparable to that used in the Larsen and Hanson [5] study), it had altered aerofoil lift coefficients, leading to a smoother change in lift coefficient being experienced over the range of angle-of-attack experienced along the blade length, during pitch-to-stall control. It was suggested by Jonkman [6] that a higher level of damping in pitch-to-stall could possibly be achieved if the aerofoil coefficients and rotor design were altered such that the rotor thrust continually increased from cut-in to cut-out wind speeds.
The optimisation of blade twist and its resultant effects have been extensively studied for pitch-to-feather and fixed-pitch stall configurations using a number of methods [9,10,11]. In such instances, the design criteria commonly focuses on maximising the power coefficient and reducing blade vibrations and fatigue. Stäblein et al. [10] achieved increased platform damping, and hence, reductions in tower fore–aft moment from blade twist modifications. For fixed-stall blades, a back twist was employed (the blade twists back towards feather at the tip for a proportion of the blade’s length) which resulted in the air flow remaining attached at the blade tip for higher wind speeds, thus increasing the power production capabilities of these sections of the blade [9]. By contrast, the benefits of actively pitching blades are often obtained at the expense of an increased blade pitching rate, and hence, actuator action which can impact on component life and operational costs. However, damage to the pitch bearing was not found to be adversely proportional to pitch rate increase when the blade flapwise loading was also reduced [12]. Merz [9] performed in-depth research on fixed-pitch stall blades and designed a family of optimised blades to minimize the cost of a unit of energy using simulations in the linear frequency domain. Investigation of the effects of including a back twist of a few degrees, originating at different points along the blade’s length were performed (starting from 5 to 22% of the blade length as measured from the tip). This resulted in a high level of aerodynamic damping at all operational wind speeds. Stäblein et al. [10] analyzed the effect of additional blade twist from simulations produced utilizing the non-linear time domain aero-servo-elastic simulation tool HAWCStab2, developed by DTU, Risø Campus, Denmark, specifically for wind turbines designed by DTU. This applied a twist to the blades of a land-based 10 MW DTU turbine under pitch-to-feather control. Models investigated changing the blade twist towards both feather and stall from as high up the blade as 70% of the blade radius from the tip. Reductions in both the blade root’s flapwise moment and the tower base’s fore–aft moment were seen, however, this study was not carried out for a floating turbine. Floating platforms need platform pitch frequencies to be below 0.05 Hz to avoid the wave excitation frequencies, thus the rotor speed would need to be actively controlled to dampen the platform’s pitch motion [9].
The question of whether a variable pitch-to-stall, variable speed FOWT could reduce the tower base’s fore–aft moment through blade design manipulation has not as yet been studied. Reductions in the blade root flapwise moments could decrease the tower base fore–aft moments, and therefore increase tower fatigue life. Improved rotor speed performance, and therefore higher quality energy regulation would also be anticipated due to the higher control frequency available to a variable pitch-to-stall controller. It is also worth noting that, whilst a dominant wind turbine floating platform type has not yet materialised on the market, it is desirable for research to have the potential to benefit more than one platform type.
To investigate the potential of active pitch-to-stall on a semi-submersible floating platform, this study investigates its possible benefits in terms of rotor speed performance, power generation, and tower base fore–aft moment-induced fatigue reduction. This study was conducted for a 5-MW floating turbine with a stall blade incorporating back twist (towards feather) nearer the tip. This research did not concern itself with the optimization of an actively pitching-to-stall blade or other systems loads, but rather focused on the effects of increasing back twist on tower fore–aft fatigue life, which can in turn be used to optimise the back twist for turbine life extension. This twist optimization was carried out for three specific wind and wave conditions. This is a method proposed by Stäblein et al. [13], as designing around an optimum tip speed ratio is not possible for a back-twisting blade. The 5 MW turbine was coupled to a floating semisubmersible platform, as this type of floater has not been previously investigated with an active pitch-to-stall control strategy and suffers from increased fore–aft oscillations of the tower, and therefore could benefit from this alternative control approach. Furthermore, the Carbon Trust’s report for the Scottish government also found that semisubmersibles had a better levelized cost of energy (LCoE) overall, compared to other platform types [14]. Thus, in combination with other benefits (e.g., that a semisubmersible could possibly be towed back to shore for maintenance, repair, and commissioning), this floating platform type is an attractive option [15].
2. Methods
The properties of a semi-submersible floating platform coupled to a 5 MW HAWT are investigated by running simulations utilizing the non-linear time domain FAST v8 simulation tool. The FAST v8 allows aero-hydro-servo-elastic analysis of land, offshore fixed, and offshore floating HAWTs and was developed by NREL (National Renewable Energy Laboratory), Golden, CO, USA [16]. The FAST v8 solves equations of motion by numerical integration utilizing the rigid bodies of the system and from these, expressions for velocity and acceleration are derived. The aerodynamic models within FAST v8 require the user to specify a particular wind data profile, which FAST v8 uses to solve the aerodynamic loads on the blades, including dynamic stall and rotor and wake effects. For the analysis of offshore floating turbine analysis, the aerodynamic models not only generate the previously mentioned outputs, but are also linked to hydrodynamic models of the floating structure as well as dynamic structural and control models. This allows fully-coupled non-linear aero-hydro-servo-elastic simulations to be performed within the time domain.
2.1. Model Parameters
For the purposes of this study, the semi-submersible floating platform was modelled with a three line catenary mooring system. This was based on a 1/50th scale experimental model tested in the MARIN (Maritime Research Institute Netherlands) wave basin, as part of the US DeepCWind project [17]. As a result of this, the platform model was used for the offshore simulation code comparison in the international OC4 Phase II study [18,19].
The wind turbine coupled to the semisubmersible was based on the NREL 5MW three-bladed HAWT [20], but with tower mode shapes that depict the expected flexibility of the tower when coupled to the semisubmersible floating platform [18]. The turbine had a hub height above sea water level (SWL) of 90 m, a rotor diameter of 126 m, and was rated at a wind speed of 11.4 m/s, which corresponded to a rated rotor speed of 12.1 rpm. It was designed to cut-in at 3 m/s (rotor speed of 6.9 rpm) and cut-out at 25 m/s. More details on the parameters of both models can be found in Reference [18]. The tower to platform coupling was represented in the turbine model as a cantilevered connection to capture the motions where the tower base joins to the platform. The environmental conditions were based on a site in the North Sea 100 miles northeast of Aberdeen with estimated water depths of 200 m. Such depths were, therefore, unsuitable for fixed base turbines [21]. Three main floating offshore wind turbine models were compared in this study:
- A conventional “Feather Base Model” with a pitch-to-feather gain scheduling blade pitch controller. This model was used in the OC4 Phase II code comparison investigation [18]. The other models developed were compared to this baseline data.
- A “Pitch-to-Stall Model” where the blade aerofoil lift coefficients were manipulated for stall operation in line with the blades used by Jonkman [6], such that a smoother change in lift coefficient occurred over the range of angle-of-attack experienced during pitch-to-stall control.
- Three “Back Twist Pitch-to-Stall Models” further build on the blade properties of the “Pitch-to-Stall Model” by additionally imposing a back twist towards feather on the blade (of 3, 6, and 9°). This third model type operated below rated at a set pitch angle of −4°, as changing the setting of the constant pitch angle below rated wind speed had also been employed to reduce fatigue and optimize the energy output on passive stall turbines [22].
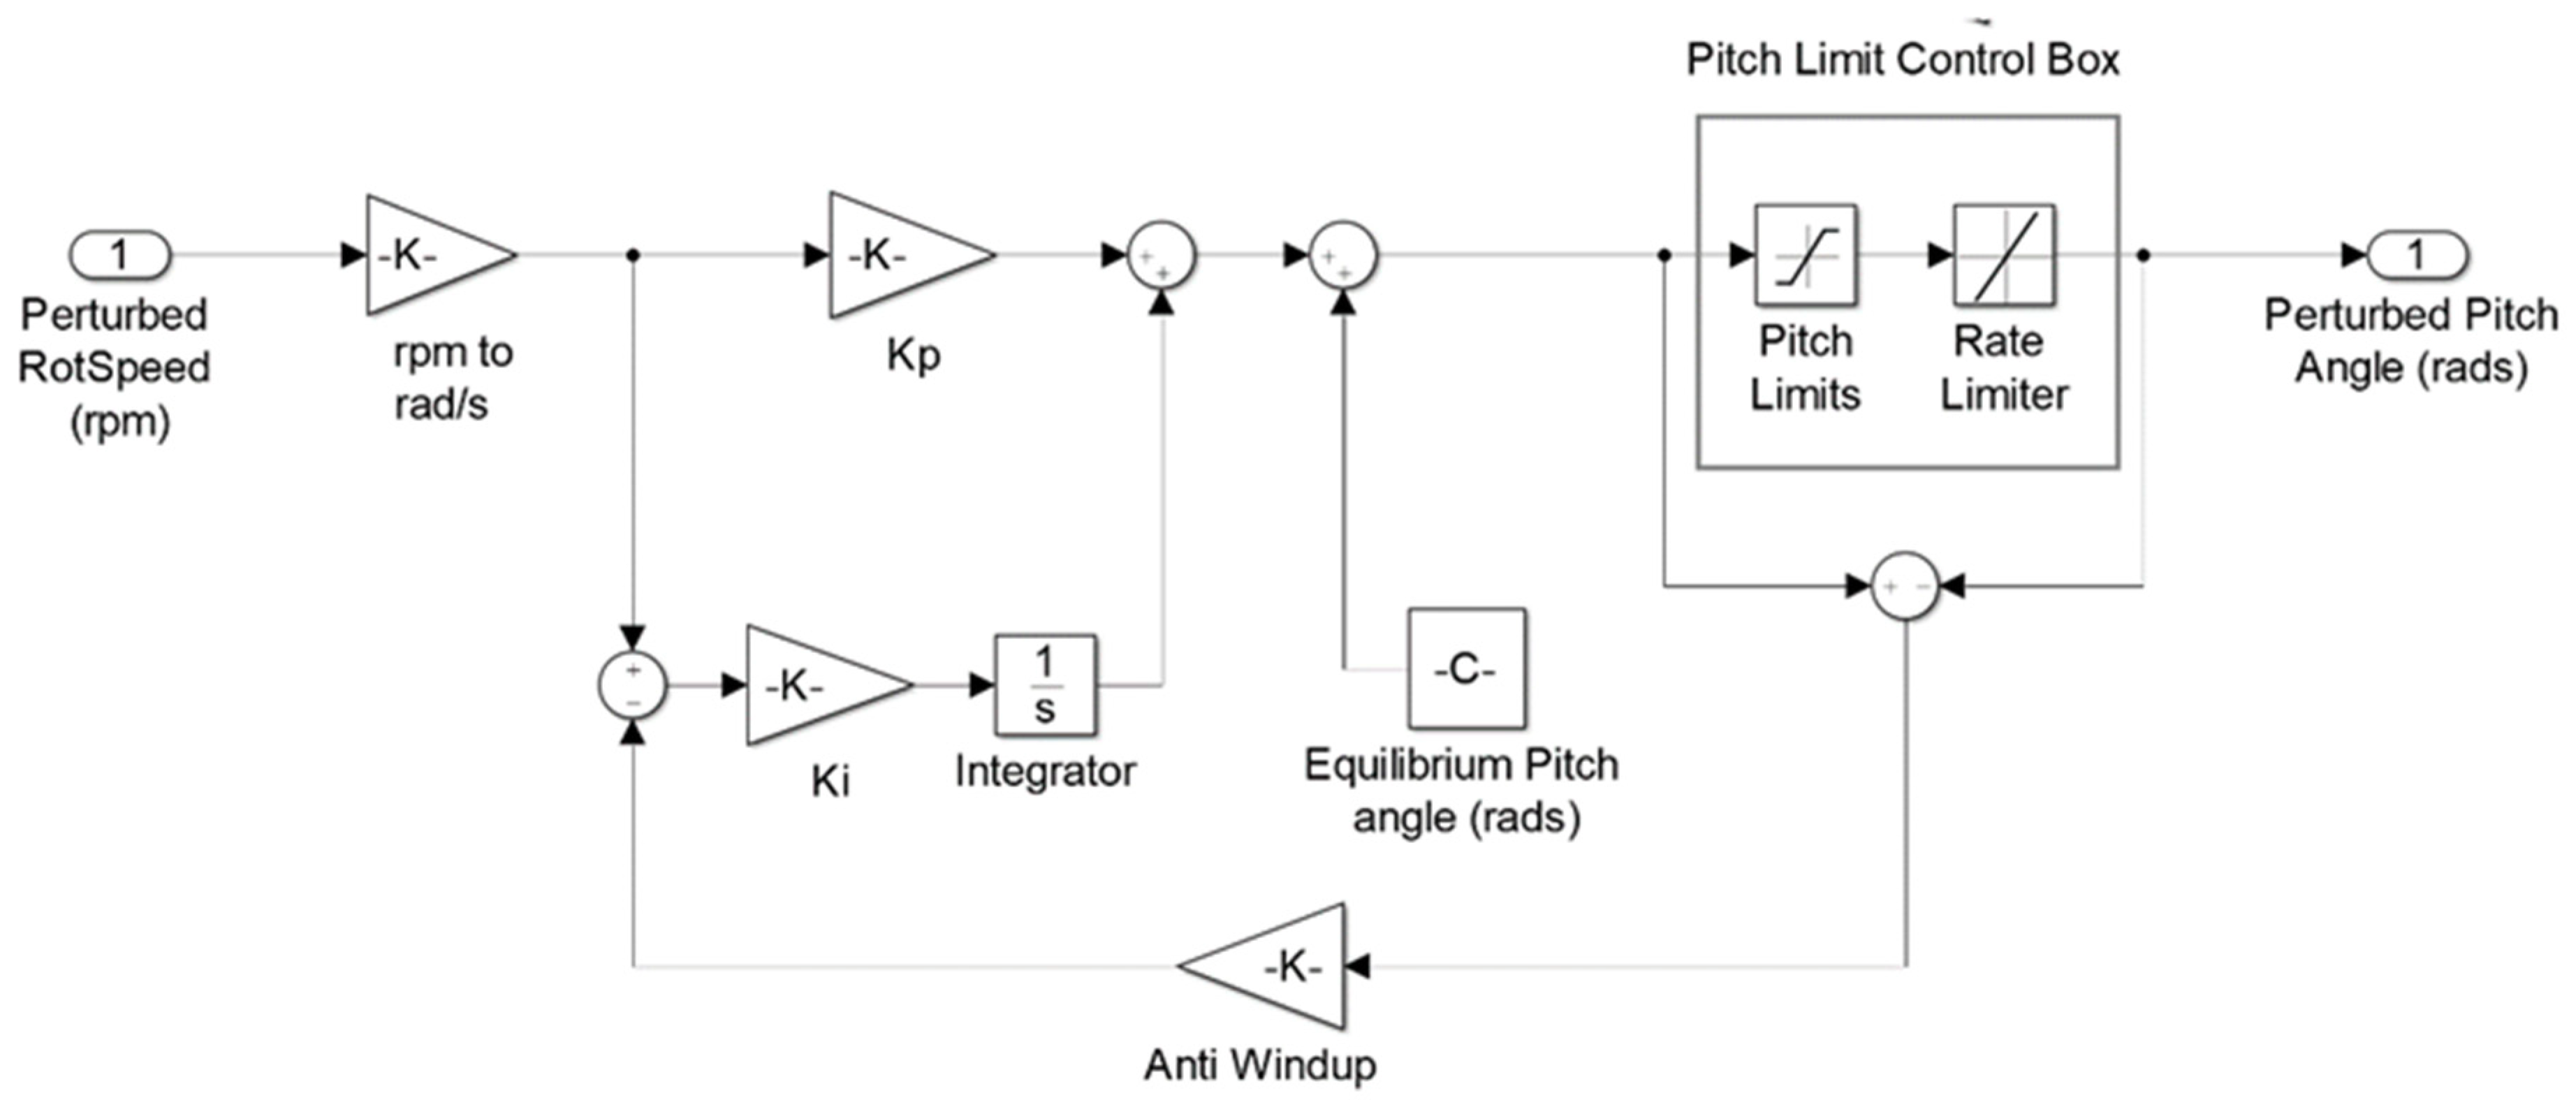
The collective blade pitch-to-stall control system that was designed for both the “Pitch-to-Stall Model” and the “Back Twist Pitch-to-Stall Model”, was a relatively simple feedback proportional-integral (PI) controller with constant gains derived at 18 m/s steady wind conditions, as shown in Figure 2. Utilizing a gain scheduler that relies upon the pitch angle at any moment in time to predict the gain change required would be much more complex with an active pitch-to-stall control. This is due to the double-valued nature of the pitch angle within region 3, as highlighted within Section 3.1. This controller pitches the blades to achieve a constant rotor speed when winds are above 11.4 m/s and incorporates a pitch-rate limiter set to +/−8°. This pitch-to-stall controller was implemented in Simulink, which was coupled directly with the FAST v8 simulation code. It expanded upon a simple “constant gains feedback” PI pitch controller designed for pitch-to-feather control by Wright and Fingersh [22].
To derive the pitch-to-stall controller gains that will ensure that the performance of the turbine results in a higher quality regulated power output over the full range of operational wind speeds from rated to cut-out, a single degree of freedom (DOF) system (the angular shaft rotation speed) was considered as presented by Larsen and Hanson [5] and Jonkman [6]. From this, Equations (1)–(2) can be derived when the derivative gain, KD, neglected for simplicity, as proposed by Hanen et al. [23].
where IDRIVETRAIN is the driveshaft inertia (kg/m2) found from Equation (3); Ω is the rotational speed (rad/s); ξϕ is the damping ratio related to the rotor speed error control system; wϕn is the natural frequency of the control system (rad/s); NGEAR is the gearbox ratio, and ɗP/ɗØ is the sensitivity of the aerodynamic power to the blade pitch angle (W/rad).
where IROTOR is the rotor inertia (kg/m2) and IGEN is the generator inertia (kg/m2).
KP = (2·IDRIVETRAIN·Ω·ξϕ·wϕn)/NGEAR·(−(ɗP/ɗØ))
KI = (IDRIVETRAIN·Ω·wϕn2)/NGEAR·(−(ɗP/ɗØ))
IDRIVETRAIN = IROTOR + (NGEAR2·IGEN)
The sensitivity of the aerodynamic power to the blade pitch angle for each model was derived in FAST v8.16.00 a-bjj through linearization of the turbine simulation model utilizing the pitch angles and rotor speed of each wind speed, as predicted in the periodic steady-state simulations detailed in Section 3.1. This followed the procedure presented for aerodynamic derivatives by Jonkman and Jonkman [24] such that all the structural DOF were disabled to eliminate convergence issues and frozen wake was applied. Values of 0.6 rad/s were used for the natural frequency of the control system and 0.7 for the damping ratio related to the rotor speed error control system as suggested in Hanen et al. [23]. This system frequency of the pitch-to-stall controller (0.6 rad/s) is much higher than the 0.2 rad/s used by the “Feather Base Model” pitch-to-feather controller, as negative damping is avoided with the pitch-to-stall control regime.
2.2. Blade Back Twist Configuration
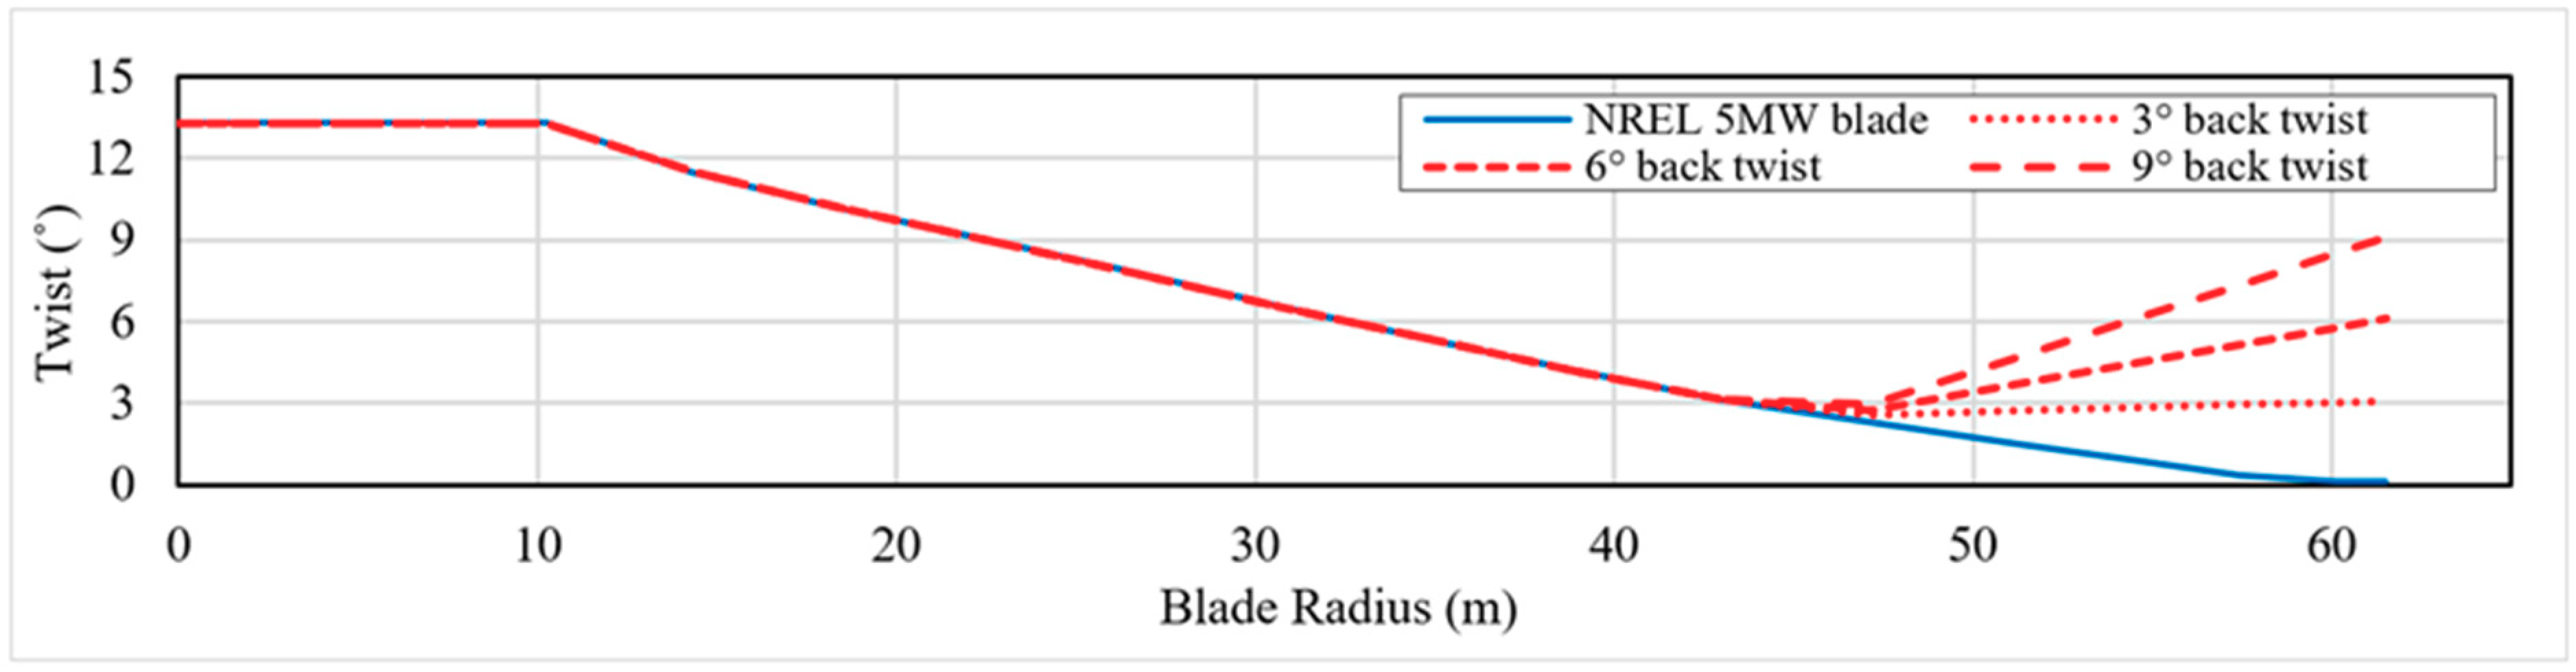
The back twists employed in this study were chosen after investigative research of the altered dynamic coupling effects on the tower, due to the changes in the blade geometry, specifically in terms of tower base fore–aft moment. The initial selection process looked at back twist applied at initiation points from 5% to 35% in 10% intervals along the blade length (measured from the tip), with a “best guess” back twist angle of 3°, based on previous research involving back twist on passive stall blades [9] and blades that pitch-to-feather [10]. Responses during mean turbulent winds of 18 m/s for short 600 s simulations were examined. The effects on tower fore–aft bending moment were then analyzed when both increasing and decreasing the back-twist angle, which indicated a reduction in tower fore–aft moment range could be achieved with a higher back twist angle of 9°. The initiation point of the back twist was chosen to be at 25% along the blade length, from the tip. Figure 3 gives a visual reference to the three back twist angles applied to the “Back Twist Pitch-to-Stall Model”, alongside the original twisted NREL 5 MW blade which is used for both the “Feather Base Model” and the “Pitch-to-Stall Model”.
A constant −4° pitch angle was also applied at all winds below rated to the three “Back Twist Pitch-to-Stall Models”. This was introduced as both fatigue life and energy generation, which were increased when it was incorporated into the back-twist designs, as compared to a constant pitch angle of 0° or −2.5°. Model specifications and controller gains for each stall model are shown in Table 1.
3. Results
3.1. Periodic Steady Wind Characteristics of a Blade Pitching-to-Stall
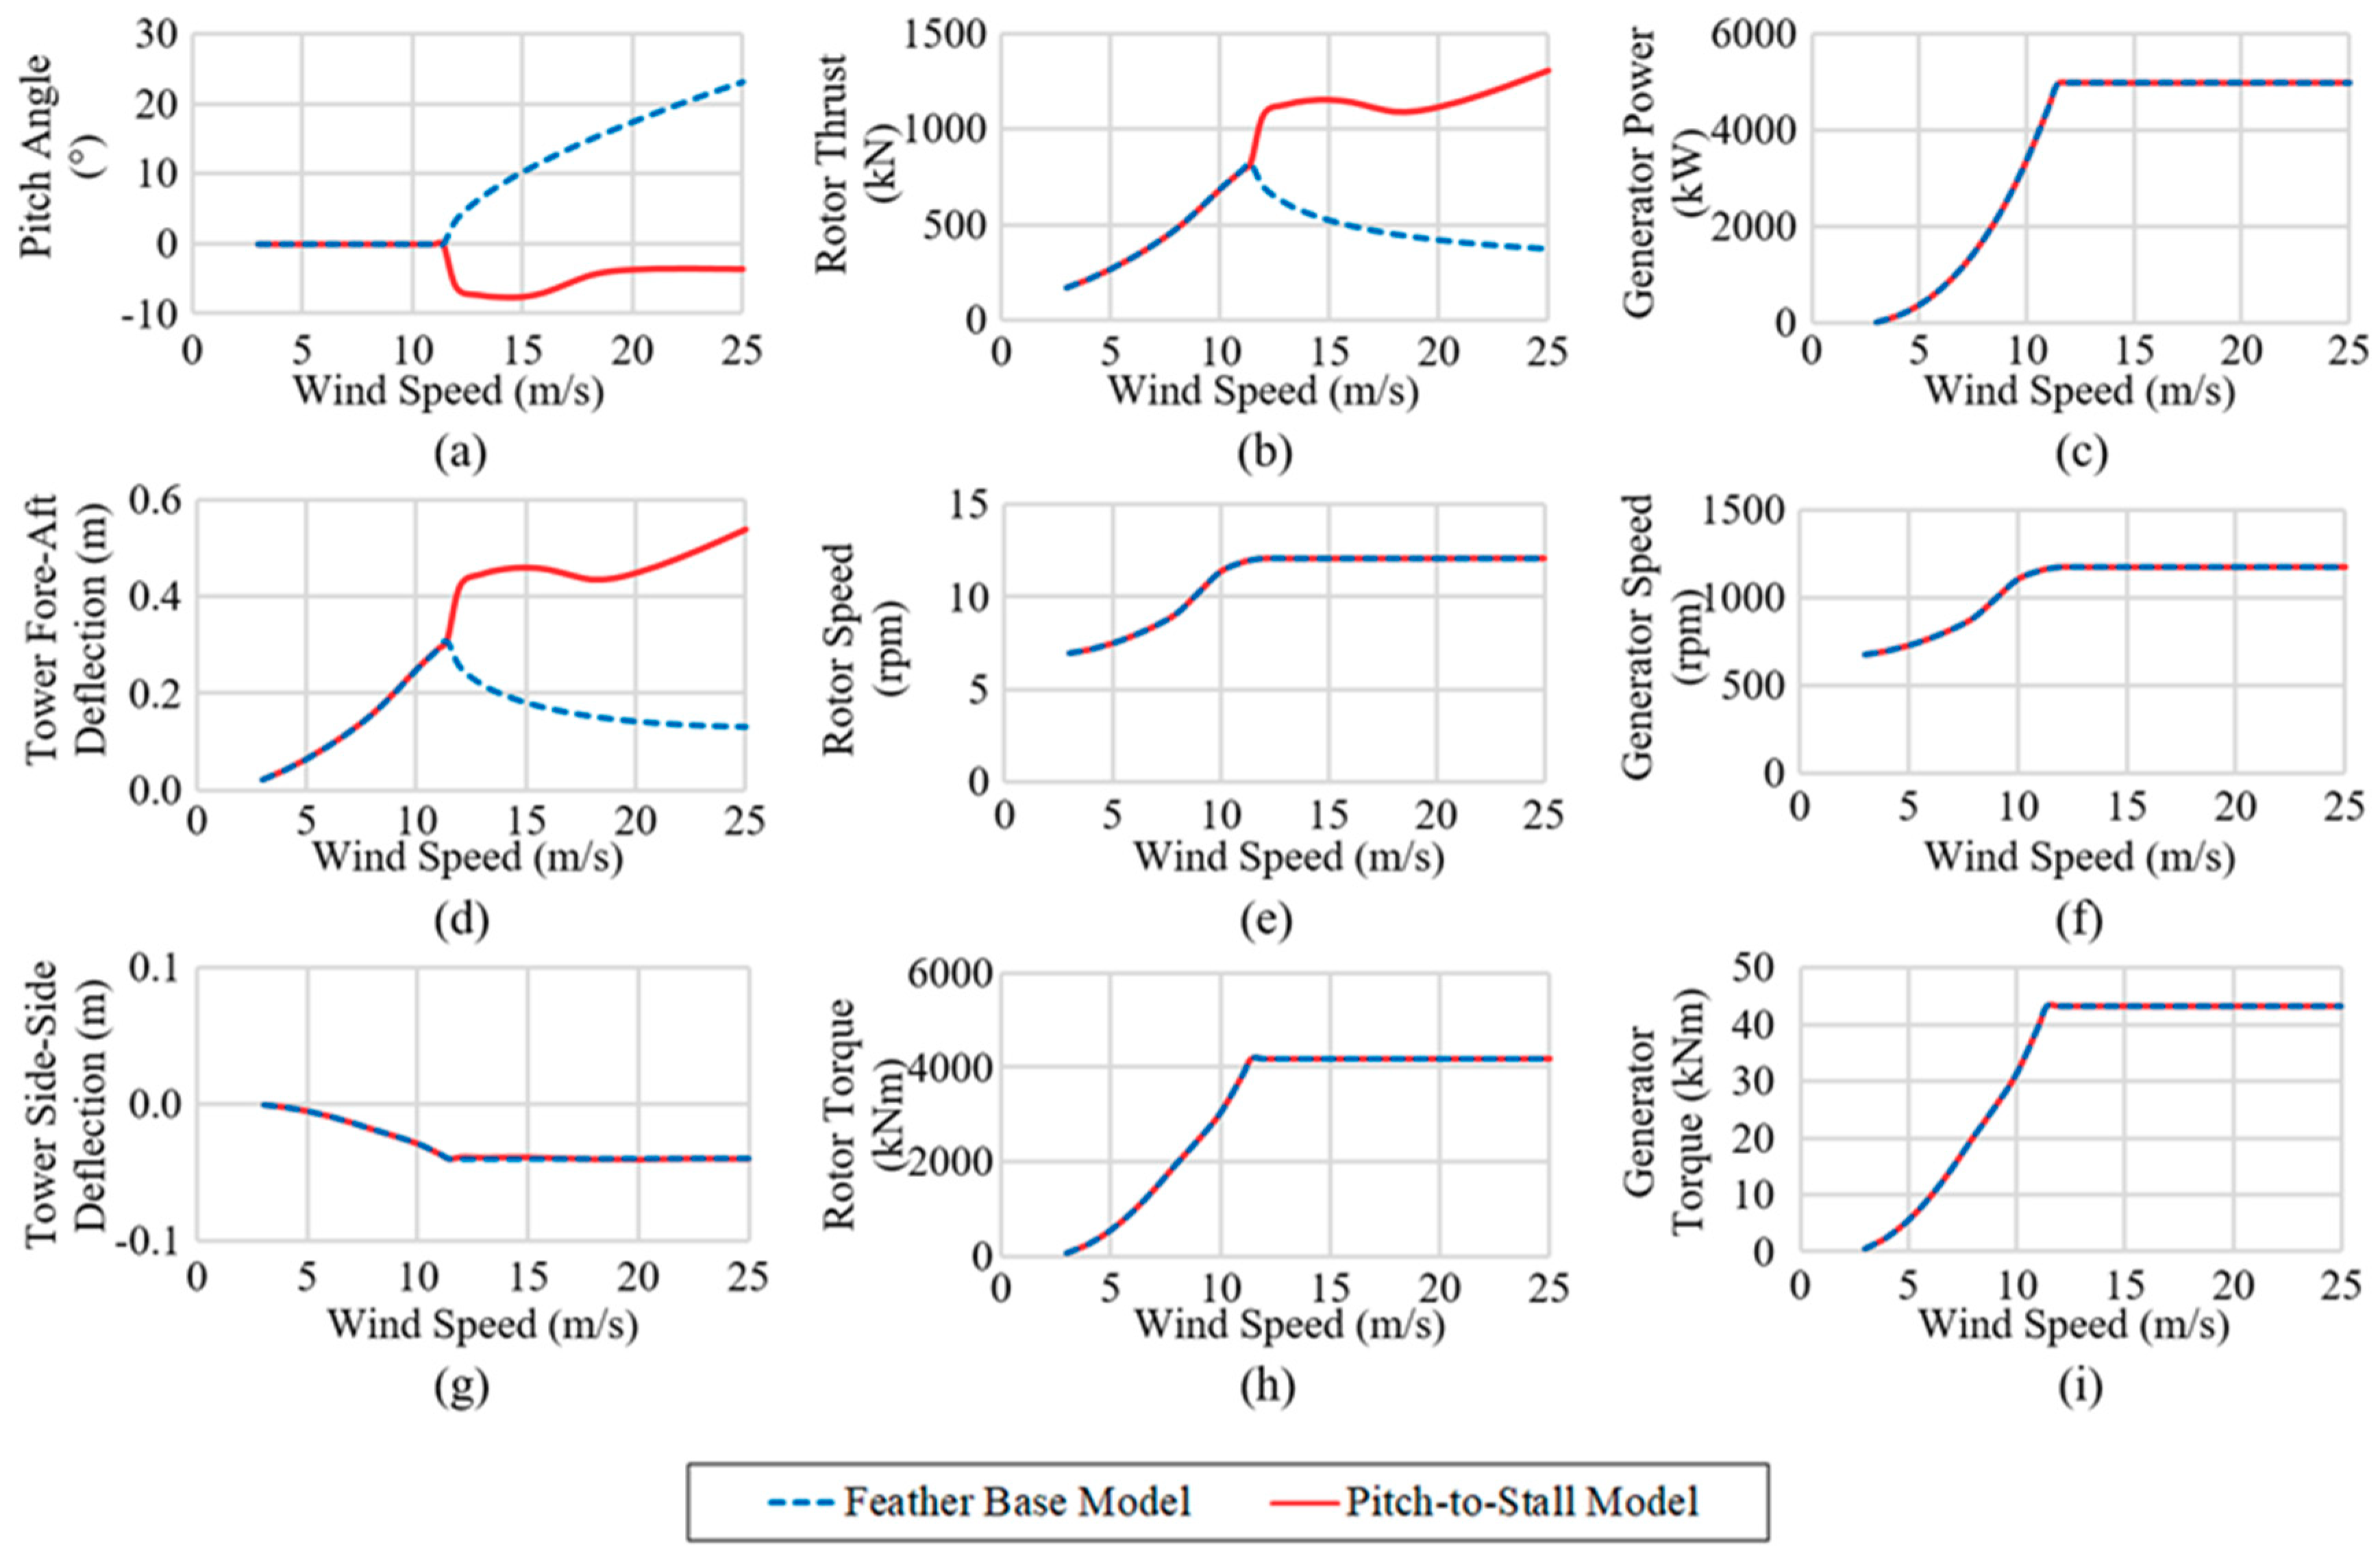
To compare the FOWT characteristics of the “Feather Base Model”, represented by the blue dashed lines in Figure 4, with the “Pitch-to-Stall Model”, represented by the solid red lines, periodic steady-state curves were derived from simulations. The periodic nature of the steady state was created as the variables did not have a constant value but a range of values that repeat over a given period. For all of the FOWT models presented here, the periodic influence was due to the tilt applied to the rotor shaft and the variables were repeated after each full rotation of the rotor. These simulations were run with steady uniform wind speeds from cut-in to cut-out, in 1 m/s increments, with all the platform DOF disabled (i.e., like a fixed land-based wind turbine) as suggested by Jonkman [6] to ensure that the semi-submersible floating platform is not excited by the applied wind and waves.
Figure 4a highlights the difference in the pitch angles required for both control methods. For feather control, a continuous, smooth rise in the blade pitch angle required was seen from 0° at the rated wind speed of 11.4 m/s, to just exceeding 23° at the cut-out wind speed of 25 m/s. For stall control, the negative pitch angle requirement rose steeply at wind speeds just above rated, the area of operation often referred to as Region 2.5, and a maximum negative pitch angle (approaching −8°) was experienced at wind speeds as low as 15 m/s. The pitch angle then slowly decreased in magnitude again as wind speeds increase to over 20 m/s, after which the required blade pitch angle was maintained at a fairly constant level of approximately −3.5° before the FOWT cut-out at 25 m/s.
From the simulated rotor thrusts in Figure 4b, it can be seen that, at wind speeds above rated, the rotor thrust curves were the inverse of the required pitch angle curves for both the pitch-to-feather and pitch-to-stall control methods. The tower fore–aft deflections curves, shown in Figure 4d, followed the same pattern as the rotor thrusts experienced by the relative control method. The outputs of all other parameters observed in Figure 4 were identical and are presented to show the specific responses for both control methods.
3.2. Integrator Saturation Issue
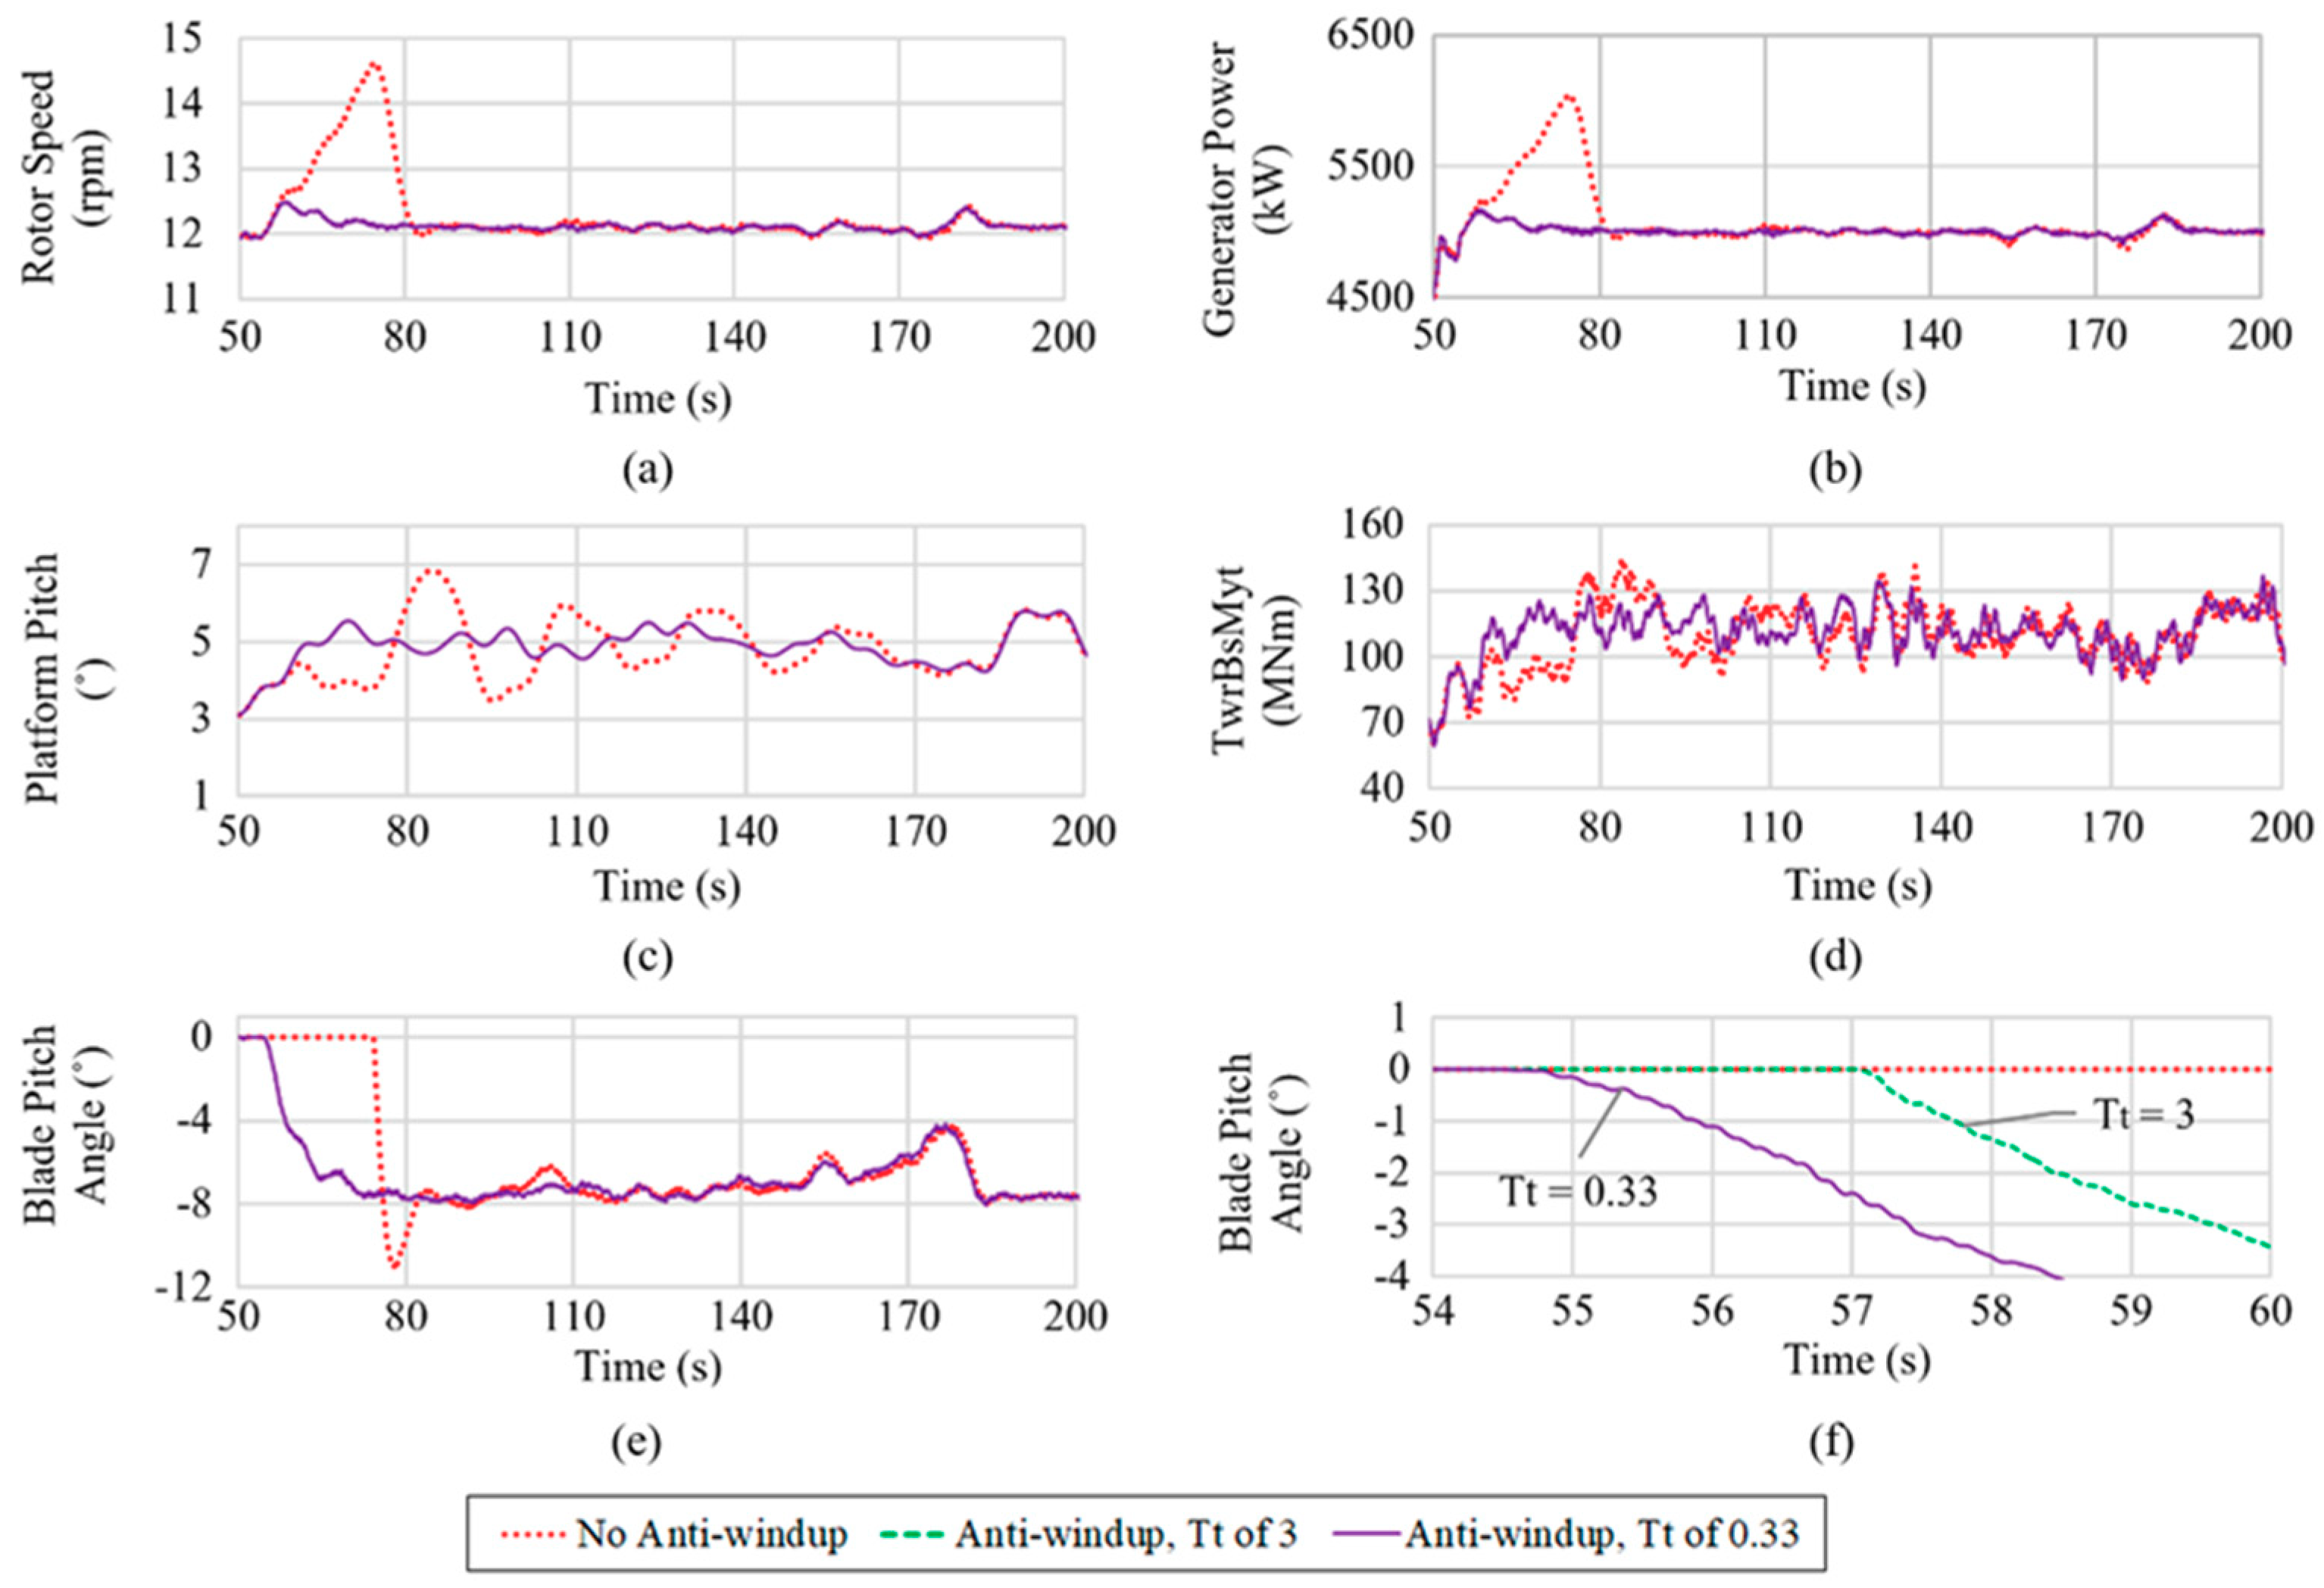
Initial investigation into the response and load analysis of the “Pitch-to-Stall Model” in turbulent winds, when the floating wind turbine was operating near to the rated wind speed, highlighted a problem with the rotor speed increasing with simulation time to velocities beyond the design limit, as seen in Figure 5a. As rotor speed directly influences the generated power, this was also negatively affected, as seen in Figure 5b. This rotor speed increase occurred during sudden changes from wind speeds below rated to wind speeds above rated and was due to the pitch controller actuator reaching its upper limit. When this occurred, it caused the feedback loop to become an open loop, thus the saturated actuator remained at its upper limit even when the output changed. This error then continued to be integrated by the PI controller, which caused the integrator to be “wound up”, as observed by Wright and Fingersh [22].
As well as a large overshoot in the blade pitch angle, such that the angle increases from around −8° to nearly −12° (Figure 5e), oscillations were also seen as the system returned to a stable state. This can clearly be seen by the response shown in red in Figure 5c,d for the platform pitch motion and the tower fore–aft bending moment, respectively. These oscillations lasted for up to 100 s after each rotor over-speed occurrence. These undesirable responses, along with rotor speeds far exceeding the design limit, cannot be tolerated by the turbine, hence, an anti-windup filter was incorporated to feed back into the pitch-to-stall controller design (Figure 2). The anti-windup filter changes the gain value of the integral during saturation and prevents the rotor speed from erroneously over-shooting. The anti-windup filter is inactive except when the floating wind turbine is operating near to the rated wind speed, as the pitch angle is the same at the input and output of the pitch-limit control box under these conditions (Figure 2).
3.3. Normalized Outputs in Turbulent Wind Conditions
A selection of the most relevant load analysis results are presented as ratios against the “Feather Base Model”, in Figure 6, obtained with all the DOF enabled except for the rotor-teeter DOF, which is not applicable to a three-bladed turbine. Each output was calculated from 3 × 3 hr simulations each generated with three different random wind and wave seeds, compiled from periodic winds files, such that the wind distribution was repeated every 10 min throughout the full simulation time. The 3 hr simulation length was chosen to improve the fatigue analysis, as the responses of FOWTs vary more with time than fixed turbines. The tower axial fatigue life was derived using a Rainflow cycle counting algorithm and Miner’s Rule within MATLAB, developed by The MathWorks, Natick, Massachusetts, USA [25]. The stochastic turbulent mean winds were generated using the Kaimal wind spectrum. Results presented as a range represent the full range of motion experienced from the maximum to the minimum values for the combined simulations. Simulations are presented under mean winds of 8, 13, and 18 m/s, each with an IEC (International Electrotechnical Commission) turbulent intensity model B (0.14) [26], a power law exponent of 0.14, and a surface roughness length of 0.03 m. All environmental conditions are the same for each model at each mean wind speed. The first 300 s of each simulation was discarded to avoid transient responses.
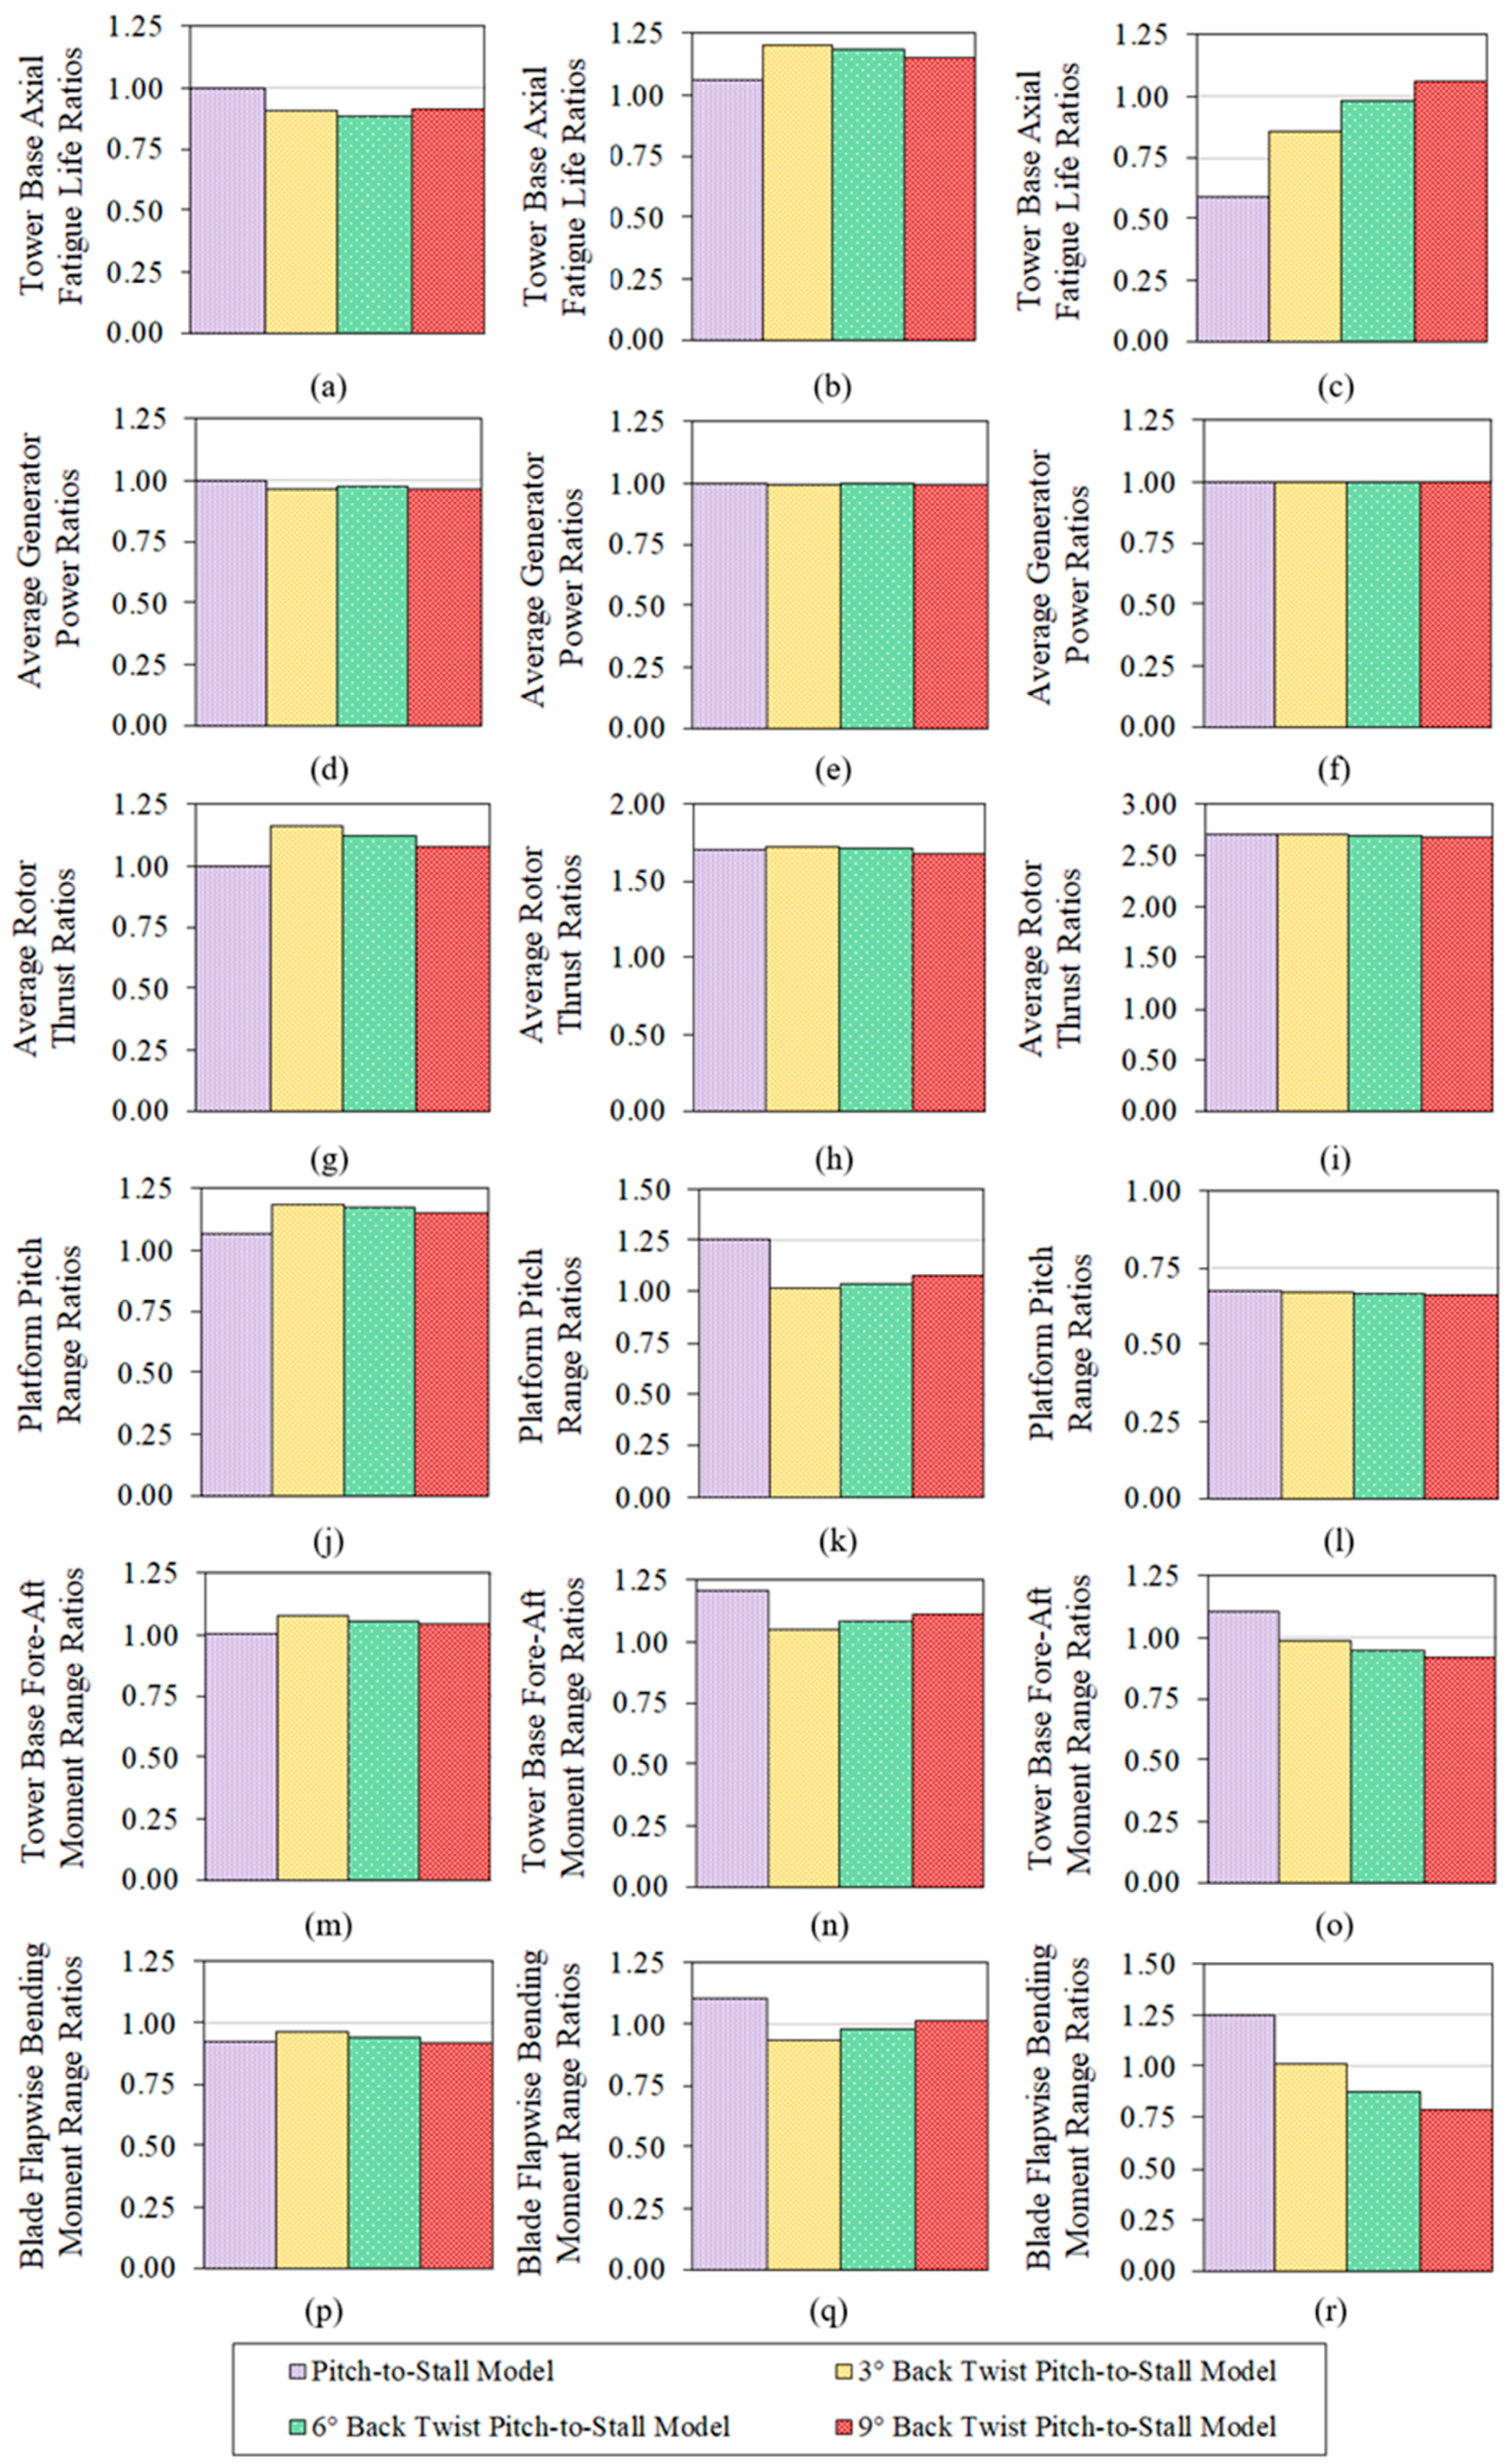
At 8 m/s mean wind speed, the tower base axial fatigue life of the untwisted Pitch-to-Stall Model, was seen to be identical to the “Feather Base Model” and higher than all “Back Twist Pitch-to-Stall Models” (Figure 6a). For mean winds of 13 m/s, seen in Figure 6b, the tower axial fatigue life increased for all stall scenarios, with a maximum extension in life of over 20% when the back twist was 3°. However, at the 18 m/s mean wind speed, shown in Figure 6c, it was only with the more extreme back twist of 9° that the tower life expectancy exceeded that achieved with pitch-to-feather control. The increase in tower axial fatigue life for this high back twist was 5.8%; however, the average generated power had a slight decrease for the back twisted pitch-to-stall models at the below rated wind speed (Figure 6d).
The rotor thrust was higher for all the blade models with a back twist for mean winds of 8 m/s (Figure 6g); however, the thrust decreased as the twist angle increased. The variation in rotor thrust was higher when moving from pitch-to-feather to pitch-to-stall at both mean wind speeds above rated; an increase of around 1.7×. at mean winds of 13 m/s (Figure 6h), rising to 2.7× at 18 m/s (Figure 6i). The variation between pitch-to-stall models, however, was negligible. The platform pitch response at mean wind speeds of both 8 and 13 m/s, as seen in Figure 6j,k, was in accordance with the tower base fore–aft moment range (Figure 6m,n), and hence corresponded inversely to the tower base axial fatigue life (Figure 6a,b).
At the higher mean wind speed of 18 m/s, the platform pitch range, shown in Figure 6l, was much lower for all stall blades than for the “Feather Base Model” at a ratio of approximately 0.67 with only a 1.2% variation between stall blades’ responses. Reductions in tower base fore–aft moment range were seen with back twist angle increases (Figure 6o). The blade flapwise bending moment was much reduced by the introduction of back twist when simulated in 18 m/s mean turbulent winds (Figure 6r) by over 20% for the most extreme back twist angle of 9°, when compared to the “Feather Base Model”.
3.4. Performance Characteristics in Turbulent Winds
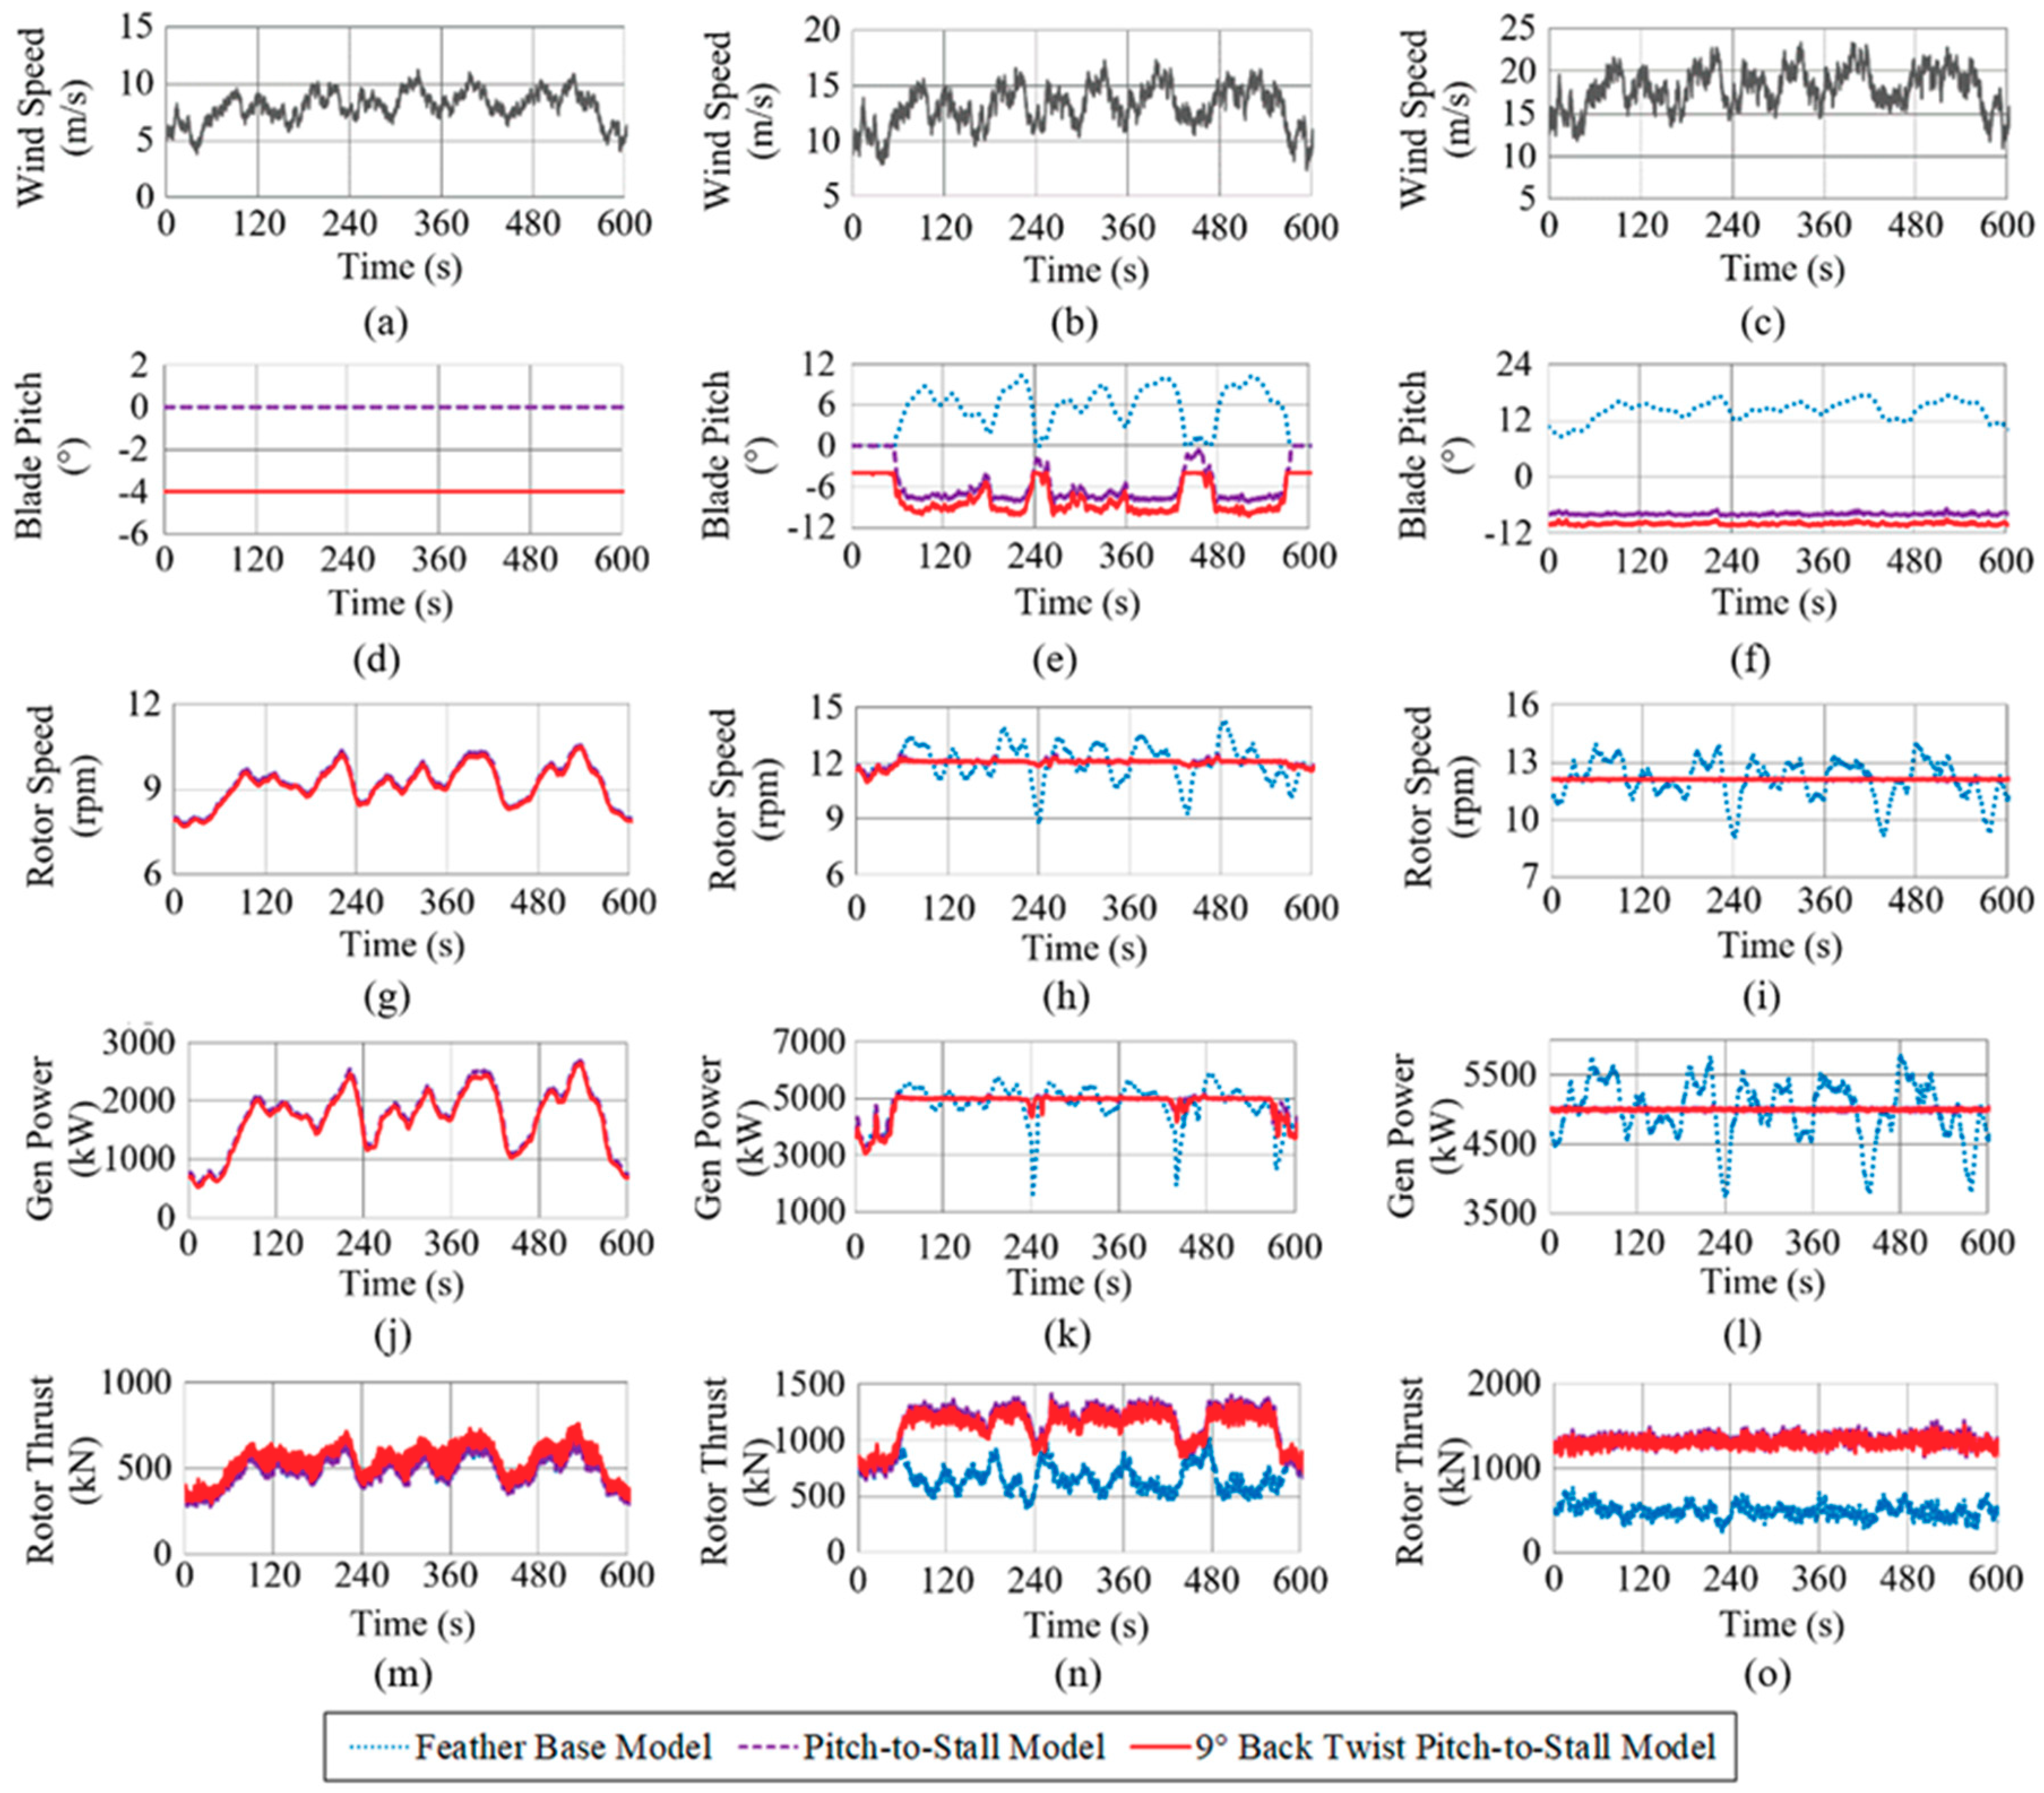
Relevant turbine responses for the “Feather Base Model” are shown alongside the original “Pitch-to-Stall Model” and the 9° “Back Twist Pitch-to-Stall Model” in Figure 7. These were derived with all DOF enabled (excluding rotor-teeter). The presented data are for one randomly selected wind and wave seed combination and highlight the performance of the relevant responses arising from mean wind speed, model, and controller variations. However, all numerical comparisons are the averages from the 3 × 3hr simulations, as detailed in Section 3.3. It should be noted that the results between the two stall models are within 1% of each other for the variables presented in Figure 7g–l, making no apparent distinction visible.
In Figure 7e, at mean turbulent winds of 13 m/s, the blade pitch angle range was reduced by over 2° with the 9° “Back Twist Pitch-to-Stall Model” compared to the “Pitch-to-Stall Model”. At 13 m/s, the variation in the rotor speed response seen in Figure 7h was 4.7 rpm for the “Feather Base Model” and 1.4 rpm for all pitch-to-stall models. The rotor speed range at 18 m/s was approximately 0.2 rpm for the pitch-to stall models, whereas the “Feather Base Model” range was 4.8 rpm (Figure 7i). The generated power also had a smoother response with pitch-to-stall control in above rated winds, with an average variance for all pitch-to-stall controlled models of 1980 kW compared to 3718 kW for pitch-to-feather control at 13 m/s (Figure 7k). The variation in generated power at 18 m/s was approximately 101 kW for all pitch-to-stall models, compared to 1997 KW with pitch-to-feather control (Figure 7l). The rotor thrust response range shown in Figure 7n at 13 m/s was not lower overall for the pitch-to-stall models; however, the variation was reduced with the implementation of the 9° “Back Twist Pitch-to-Stall Model”, which smoothed the response by 10% compared to the “Pitch-to-Stall Model”. At 18 m/s mean winds shown in Figure 7o, the rotor thrust was more constant overall with pitch-to-stall control, with the 9° “Back Twist Pitch-to-Stall Model” again have a further 10% thrust reduction compared to the “Pitch-to-Stall Model” response.
4. Discussion
For stall operation, a big reduction in the blade pitch actuation range (defined as the pitch angle) was seen (Figure 4a), a requirement of approximately 8° compared to a 23° for feather pitch control. This does not, however, correlate into a reduction in blade pitch actuation rate, as this tends to increase whenever control frequencies are higher, as allowed in pitch-to-stall control.
For the “Feather Base Model”, the continuous reduction in rotor thrust for above rated wind speeds (Figure 4b) would contribute to negative damping, and hence turbine tower instabilities and oscillations, if negative damping was not avoided by reducing the natural frequency of the pitch-to-feather control system. The “Pitch-to-Stall Model” also experiences a dip in the rotor thrust seen at around 17 to 18 m/s wind speeds. This negative derivative of the thrust versus the wind speed could introduce negative damping of the platform pitch mode, as the thrust does not increase within this section because excess power is discarded to keep the rotor speed constant. Ideally a pitch-to-stall model could be designed to produce a continuous rise in rotor thrust.
All turbine responses at 8 m/s mean turbulent winds, shown in the left hand column of Figure 6, are not influenced by the blade pitch control method as the pitch angle is constant below 11.4 m/s. Therefore, the increase in the simulated platform pitch response in Figure 6j and decrease in blade flapwise bending moment range in Figure 6p experienced by the “Pitch-to-Stall Model” compared to the “Feather Base Model”, must be solely due to the changes in blade aerofoil lift coefficients. The “Back Twist Pitch-to-Stall Models” are further influenced at 8 m/s mean wind speeds by the −4° constant blade pitch angle and the specific back twist angle for each model.
When operating in mean winds of 13 m/s, all the pitch-to-stall models experienced a beneficial increase in the tower axial fatigue life, shown in Figure 6b, when compared to the “Feather Base Model”. This was further increased by the introduction of a back twist that extended the tower axial fatigue life by over 20% when the back twist was 3°. At this mean wind speed, a correlation between tower fore–aft moment’s range reduction (Figure 6n) and platform pitch (Figure 6k) and blade flapwise bending moment (Figure 6q) reductions can be made.
At 18 m/s mean turbulent winds, the tower axial fatigue life of the “Pitch-to-Stall Model” was very low and the influence of applying and then increasing the back twist are very apparent. However, it is only with the more extreme 9° “Back Twist Pitch-to-Stall Model” that the tower axial life expectancy was exceeded, achieved by the “Feather Base Model” (Figure 6c). The increase in tower axial fatigue life is a very desirable 5.8%. A strong correlation between the tower fore–aft base moment (Figure 6o) and the blade flapwise bending moment (Figure 6r) was apparent at 18 m/s mean winds, such that as the flapwise bending range reduces so does the tower base fore–aft moment, and hence the fatigue life increases. However, this does not hold true when compared against the “Feather Base Model”, as there are scenarios where the blade flapwise bending moment range is higher than that seen for feather control, but the fatigue life is still improved for the stall cases and vice versa. This could be due to the different profile shapes of the blade relative to the axial bending direction, when pitching-to-feather versus pitching-to stall. Further investigation would be necessary to explore this theory. The platform pitch range seen in Figure 6l does not influence the tower fore–aft moment, and hence the tower fatigue life at this mean wind speed.
An account of the site wind speed probability density function for the three wind profiles was taken, such that the tower axial fatigue life was weighted depending upon its frequency of occurrence for the three mean wind speeds examined. A larger increase in tower base axial fatigue life was achieved with this weighting; with the higher 9° “Back Twist Pitch-to-Stall Model”, a 2.8% increase was achieved compared to the “Feather Base Model”. This came at the expense of a decrease in the power generation of 1%.
Pitch-to-stall control of the HAWT coupled the semi-submersible floating platform provided a more regulated energy output than was achieved with the “Feather Base Model”. The average variance for both pitch-to-stall models was 1980 kW compared to 3718 kW for the “Feather Base Model” at 13 m/s (Figure 7k), and 101 kW compared to 1997 KW at 18 m/s (Figure 7l). This is due to the higher pitch-to-stall control system frequency setting allowed, as negative damping is avoided by design.
5. Conclusions
In the present day, the requirement to increase the renewable portion of our energy supply worldwide is becoming more imperative each day. The offshore wind capacity has been increasing rapidly, by 87% between 2016 and 2017, in order to meet these needs [2] and due to the limited shallow bed and low seabed slope, the industry is looking more towards floating offshore wind solutions in the future. However, turbine tower loads are often increased when a turbine is mounted on a floating platform and unless these undesirable motions can be significantly reduced, then the strength of the tower must be increased.
This research is therefore concerned with reducing excessive motions and loads associated with FOWTs and their effects on the turbine tower, while improving energy generation by pitching the turbine to stall, instead of feather, to control rotor speed which avoids the negative damping issues by design, resulting in an improvement in the regulation of the power generated. The example FOWT presented is a semi-submersible floating platform, coupled to a 5 MW HAWT, investigated through simulation.
Overall, it has been shown that the proposed approach seems to be effective in diminishing detrimental oscillations of the power output and in enhancing the tower axial fatigue life. This is achieved by variable speed, variable pitch-to-stall control, reducing the negative damping phenomenon (more regular power output), and through manipulating the blade design by the introduction of a back twist towards feather (reductions in the blade root flapwise moment leading to reductions in the tower bending moments, and hence increasing the tower axial fatigue life). This research, therefore, highlights that active variable speed and variable pitch-to-stall control has potential benefits specific to FOWTs.
More specifically, tower base axial fatigue life was increased for all pitch-to-stall scenarios, when operating in 13 m/s mean turbulent winds. The introduction of a back twist added an additional desirable increase of over 20% when the back twist was 3°. This correlated with a corresponding decrease in both platform pitch and blade flapwise bending moment ranges of motion.
At 18 m/s mean winds, the more extreme 9° “Back Twist Pitch-to-Stall Model” provided a tower base life expectancy that exceeded that achieved by the “Feather Base Model” by 5.8%. No correlation between the platform pitch response and tower base fore–aft moment was apparent at this mean wind speed. However, a strong correlation between the ranges of motion from the blade flapwise bending and the tower base moment was seen, which strongly indicates that decreasing the blade flapwise bending range decreases the tower fore–aft moment range.
Overall, the 9° “Back Twist Pitch-to-Stall Model” achieved the best tower base axial fatigue life with a 2.8% increase on the “Feather Base Model” when accounting for the relevant frequencies of occurrence of the three mean turbulent wind speed profiles, for the specific site, at the expense of a decrease in the power generation of 1%. At wind speeds above rated, the performance of pitch-to-stall in terms of rotor speed regulation and generated power output far exceeds that achieved with pitch-to-feather.
Further investigation with more variations in terms of twist initiation point, back twist angle, and constant pitch below rated angles would be recommended. Additional research on a complete back-twisted stall blade design would also be required to enable an in-depth analysis of all the blade loads as well as loads on the nacelle, gearbox, drive train, and other system components. Hence, enabling an overall assessment of the pros and cons of a back twist blade for a FOWT with active pitch-to-stall control. A study on the benefits of this blade and pitch control system on other FOWT types would also be beneficial.
Author Contributions
Formal analysis, D.W.; investigation, D.W.; methodology, D.W.; supervision, M.C. and J.S.; validation, D.W.; writing—original draft, D.W.; writing—review and editing, M.C. and J.S.
Funding
This work was funded by the United Kingdom Engineering and Physical Sciences Research Council (EPSRC), grant EP/L016303/1, for Doctoral Training in Renewable Energy Marine Structures (REMS).
Conflicts of Interest
The authors declare no conflict of interest.
References
- WindEurope. Available online: https://windeurope.org/about-wind/daily-wind/about (accessed on 24 January 2019).
- Fried, L.; Qiao, L.; Sawyer, S. Global Wind Report: Annual Market Update 2017. Global Wind Energy Council. Available online: http://files.gwec.net/files/GWR2017.pdf (accessed on 10 April 2019).
- Robertson, A.N.; Jonkman, J.M. Loads Analysis of Several Offshore Floating Wind Turbine Concepts. In Proceedings of the 21st International Society of Offshore and Polar Engineers Conference, Maui, HI, USA, 19–24 June 2011; pp. 443–450. [Google Scholar]
- van der Veen, G.J.; Couchman, I.J.; Bowyer, R.O. Control of floating wind turbines. In Proceedings of the 2012 American Control Conference (ACC), Montreal, QC, Canada, 27–29 June 2012; pp. 3148–3153. [Google Scholar] [CrossRef]
- Larsen, T.; Hanson, T.D. A Method to Avoid Negative Damped Low Frequent Tower Vibrations For A Floating, Pitch Controlled Wind Turbine. J. Phys. Conf. Ser. 2007, 75, 12073. [Google Scholar] [CrossRef]
- Jonkman, J.M. Dynamics Modeling and Loads Analysis of an Offshore Floating Wind Turbine; Technical Report: NREL/TP-500-41958; National Renewable Energy Laboratory: Golden, CO, USA, November 2007. [Google Scholar]
- Bossanyi, E.A. Wind Turbine Control for Load Reduction. Wind Energy 2003, 6, 229–244. [Google Scholar] [CrossRef]
- Macquart, T.; Maheri, A. A Stall-Regulated Wind Turbine Design to Reduce Fatigue. Renew. Energy 2019, 133, 964–970. [Google Scholar] [CrossRef]
- Merz, K.O. Conceptual Design of a Stall-Regulated Rotor for a Deepwater Offshore Wind Turbine. Ph.D. Thesis, Norwegian University of Science and Technology, Trondheim, Norway, June 2011. [Google Scholar]
- Stäblein, A.R.; Hansen, M.H.; Verelst, D.R. Modal Properties and Stability of Bend–Twist Coupled Wind Turbine Blades. Wind Energy Sci. 2017, 2, 343–360. [Google Scholar] [CrossRef]
- Méndez, J.; Greiner, D. Wind Blade Chord and Twist Angle Optimization Using Genetic Algorithms. In Proceedings of the Fifth International Conference on Engineering Computational Technology, Las Palmas de Gran Canaria, Spain, 12–15 September 2006. [Google Scholar] [CrossRef]
- Barlas, A.; Bergami, L.; Hansen, M.H.; Pedersen, M.M.; Verelst, D.; Thomsen, K.; Aagaard, H. Load Alleviation Potential of Active Flaps and Individual Pitch Control in a Full Design Load Basis. In Proceedings of the EWEA Annual Event and Exhibition 2015, Paris, France, 17–20 November 2015; European Wind Energy Association (EWEA): Paris, France, 2015. [Google Scholar]
- Stäblein, A.R. Analysis and Design of Bend-Twist Coupled Wind Turbine Blades. In MARE-WINT; Springer: Cham, Switzerland, 2016; pp. 67–80. [Google Scholar] [Green Version]
- James, R.; Ros, M.C. Floating Offshore Wind: Market and Technology Review; Prepared for the Scottish Government June 2015; The Carbon Trust: London, UK, 2015. [Google Scholar]
- Thiagarajan, K.P.; Dagher, H.J. A Review of Floating Platform Concepts for Offshore Wind Energy Generation. J. Offshore Mech. Arct. Eng. 2014, 136, 020903. [Google Scholar] [CrossRef] [Green Version]
- Jonkman, J.M.; Buhl, M.L., Jr. FAST User’s Guide; Technical Report: NREL/EL-500-38230; National Renewable Energy Laboratory: Golden, CO, USA, August 2005. [Google Scholar]
- Goupee, A.J.; Fowler, M.J.; Kimball, R.W.; Helder, J.; de Ridder, E.-J. Additional Wind/Wave Basin Testing of the DeepCwind Semi-Submersible with a Performance-Matched Wind Turbine. In Proceedings of the ASME 2014 33rd International Conference on Ocean, Offshore and Arctic Engineering, San Francisco, CA, USA, 8–13 June 2014; Volume 9B: Ocean Renewable Energy. p. V09BT09A026. [Google Scholar] [CrossRef]
- Robertson, A.; Jonkman, J.; Masciola, M.; Song, H.; Goupee, A.; Coulling, A.; Luan, C. Definition of the Semisubmersible Floating System for Phase II of OC4; Technical Report: NREL/TP-5000-60601; National Renewable Energy Laboratory: Golden, CO, USA, September 2014. [Google Scholar]
- Robertson, A.; Jonkman, J.; Vorpahl, F.; Popko, W.; Qvist, J.; Frøyd, L.; Chen, X.; Azcona, J.; Uzunoglu, E.; Guedes Soares, C.; et al. Offshore Code Comparison Collaboration Continuum: Phase II Results Regarding a Floating Semisubmersible Wind System. In Proceedings of the 22nd International Society of Offshore and Polar Engineers Conference, Rhodes, Greeze, 17–22 June 2012. [Google Scholar] [CrossRef]
- Jonkman, J.; Butterfield, S.; Musial, W.; Scott, G. Definition of a 5-MW Reference Wind Turbine for Offshore System Development; Technical Report: NREL/TP-500-38060; National Renewable Energy Laboratory: Golden, CO, USA, February 2009. [Google Scholar]
- GEOS, F. Wind and Wave Frequency Distributions for Sites Around the British Isles; Offshore Technology Report 2001/030; HSE Books: Norwich, UK, 2001. [Google Scholar]
- Wright, A.D.; Fingersh, L.J. Advanced Control Design for Wind Turbines; Part I: Control Design, Implementation, and Initial Tests; Technical Report: NREL/EL-500-42437; National Renewable Energy Laboratory: Golden, CO, USA, March 2008. [Google Scholar]
- Hanen, M.H.; Hansen, A.; Larsen, T.J.; Øye, S.; Sørensen, P.; Fuglsang, P. Control Design for a Pitch-Regulated, Variable Speed Wind Turbine; Wind Energy Department Report: RisØ-R-1500(EN), Risø; National Laboratory: Roskilde, Denmark, January 2005. [Google Scholar]
- Jonkman, J.; Jonkman, B. FAST Modularization Framework for Wind Turbine Simulation: Full-System Linearization. Presented at the 2016 Science of Making Torque from Wind Conference, Munich, Germany, 5–7 October 2016. [Google Scholar]
- Kvittem, M.I.; Moan, T. Time Domain Analysis Procedures for Fatigue Assessment of a Semi-Submersible Wind Turbine. Mar. Struct. 2015, 40, 38–59. [Google Scholar] [CrossRef]
- BS EN 61400-1. Wind Turbines: Part 1: Design Requirements; British Standards: London, UK, 2005. [Google Scholar]
Figure 1.
Tower oscillation propagation in a pitch-to-feather horizontal axis wind turbine (HAWT) due to the negative damping cycle. Adapted from Reference [4] Reprinted with permission [van der Veen]; 2012, American Control Conference.
Figure 1.
Tower oscillation propagation in a pitch-to-feather horizontal axis wind turbine (HAWT) due to the negative damping cycle. Adapted from Reference [4] Reprinted with permission [van der Veen]; 2012, American Control Conference.

Figure 2.
Pitch-to-Stall proportional-integral (PI) controller for the “Pitch-to-Stall Model” and all “Back Twist Pitch-to-Stall Models”.
Figure 2.
Pitch-to-Stall proportional-integral (PI) controller for the “Pitch-to-Stall Model” and all “Back Twist Pitch-to-Stall Models”.

Figure 3.
Twist profiles for pitch-to-stall blades in the tower axial fatigue life study.

Figure 4.
Simulated FOWT characteristics from periodic steady winds for two different blade models: (blue) pitch-to-feather and (red) pitch-to-stall. (a) pitch angle (°); (b) rotor thrust (kN); (c) generator power (kW); (d) tower fore-aft deflection (m); (e) rotor speed (rpm); (f) generator speed (rpm); (g) tower side-side deflection (m); (h) rotor torque (kNm); (i) generator torque (kNm).

Figure 5.
Simulated responses of the “Pitch-to-Stall Model” with and without anti-windup at 13 m/s mean turbulent winds. (a) rotor speed (rpm); (b) generator power (kW); (c) platform pitch (°); (d) tower base fore-aft bending moment (TwrBsMyt) (MNm); (e) blade pitch angle (°); (f) blade pitch angle (°).

Figure 6.
Simulation outputs for pitch-to-stall blade models with and without back twist. Outputs were normalized against the “Feather Base Model” and given for 8 (left), 13 (center), and 18 m/s (right) mean turbulent winds. (a) tower base axial fatigue life ratios (TBAFLR)(8mps); (b) (TBAFLR) (13mps); (c) (TBAFLR) (18mps); (d) average generator power ratios (AGPR) (8mps); (e) AGPR (13mps); (f) AGPR (18mps); (g) average rotor thrust ratios (ARTR) (8mps); (h) ARTR (13mps); (i) ARTR (18mps); (j) platform pitch range ratios (PPRR) (8mps); (k) PPRR (13mps); (l) PPRR (18mps); (m) tower base fore-aft moment range ratios (TBFARR) (8mps); (n) TBFARR (13mps); (o) TBFARR (18mps); (p) blade flapwise bending moment range ratios (BFBMRR) (8mps); (q) BFBMRR (13mps); (r) BFBMRR (18mps).

Figure 7.
Simulation outputs for pitch-to-feather and pitch-to-stall blade models without and with 9° back twist at 8 (left), 13 (center), and 18m/s (right) mean turbulent winds. (a) wind speed, m/s (8mps); (b) wind speed, m/s (13mps); (c) wind speed, m/s (18mps); (d) blade pitch, ° (8mps); (e) blade pitch, ° (13mps); (f) blade pitch, ° (18mps); (g) rotor speed, rpm (8mps); (h) rotor speed, rpm (13mps); (i) rotor speed, rpm (18mps); (j) generator power, kW (8mps); (k) generator power, kW (13mps); (l) generator power, kW (18mps); (m) rotor thrust, kN (8mps); (n) rotor thrust, kN (13mps); (o) rotor thrust, kN (18mps).


Table 1.
Model parameters in terms of back twist, pitch below rated setting, and blade pitch controller gains.
Table 1.
Model parameters in terms of back twist, pitch below rated setting, and blade pitch controller gains.
| Model ID | Feather Base Model | Pitch-to-Stall (P-S) Model | 3° Back Twist P-S Model | 6° Back Twist P-S Model | 9° Back Twist P-S Model |
|---|---|---|---|---|---|
| Constant pitch angle below rated (°) | 0 | 0 | −4° | −4° | −4° |
| Twist starting distance from blade root (%) | N/A | N/A | 75 | 75 | 75 |
| Back twist angle increase towards feather at the tip (°) | 0 | 0 | 3 | 6 | 9 |
| Proportional gain at 18mps, Kp (s) | Inbuilt gain scheduler * | −0.865 | −0.917 | −1.105 | −1.414 |
| Integral gain at 18mps, Ki | −0.371 | −0.391 | −0.474 | −0.606 |
* As applicable to the OC4 (Offshore Code Comparison Collaboration Continuation) Phase II simulation model.
© 2019 by the authors. Licensee MDPI, Basel, Switzerland. This article is an open access article distributed under the terms and conditions of the Creative Commons Attribution (CC BY) license (http://creativecommons.org/licenses/by/4.0/).
Share and Cite
MDPI and ACS Style
Ward, D.; Collu, M.; Sumner, J. Reducing Tower Fatigue through Blade Back Twist and Active Pitch-to-Stall Control Strategy for a Semi-Submersible Floating Offshore Wind Turbine. Energies 2019, 12, 1897. https://doi.org/10.3390/en12101897
AMA Style
Ward D, Collu M, Sumner J. Reducing Tower Fatigue through Blade Back Twist and Active Pitch-to-Stall Control Strategy for a Semi-Submersible Floating Offshore Wind Turbine. Energies. 2019; 12(10):1897. https://doi.org/10.3390/en12101897
Chicago/Turabian StyleWard, Dawn, Maurizio Collu, and Joy Sumner. 2019. "Reducing Tower Fatigue through Blade Back Twist and Active Pitch-to-Stall Control Strategy for a Semi-Submersible Floating Offshore Wind Turbine" Energies 12, no. 10: 1897. https://doi.org/10.3390/en12101897
Note that from the first issue of 2016, this journal uses article numbers instead of page numbers. See further details here.