Research on the Comprehensive Performance of Hygroscopic Materials in an Office Building Based on EnergyPlus

1
School of Municipal and Environmental Engineering, Shenyang Jianzhu University, Shenyang 110168, China
2
State Key Laboratory of Subtropical Building Science, South China University of Technology, Guangzhou 510641, China
*
Authors to whom correspondence should be addressed.
Energies 2019, 12(1), 191; https://doi.org/10.3390/en12010191
Submission received: 5 November 2018
/
Revised: 1 January 2019
/
Accepted: 2 January 2019
/
Published: 8 January 2019
(This article belongs to the Special Issue Sustainable Energy Development Strategies: Energy Efficiency and Renewables)
Abstract
:This paper presents the research status of hygroscopic materials, points out the weak links as targets for major breakthroughs, and introduces humidifying mechanisms and their categories. In this paper, we simulated a single-monomer Shenyang office building with different envelopes of inner-surface hygroscopic materials for indoor humidity conditions, energy consumption, and economy, which are three aspects of energy consumption analysis in EnergyPlus software. To obtain the best moisture buffering performance from hygroscopic materials, we also simulated different cases including the laying area, ventilation strategy, thickness, and initial moisture content of different hygroscopic materials. The humidity fluctuation, with changes in the style of hygroscopic materials and usage conditions, of a room in a building can be analyzed by numerical simulation. This allows the determination of the best moisture buffering performance of the building structure. The results show that hygroscopic materials have great advantages in three energy saving aspects of building assessment. Hygroscopic materials can regulate indoor air humidity and reduce energy consumption. In addition, the entire life-cycle cost can be minimized. Lower rates of air exchange and larger usable areas can help enhance the level of performance of hygroscopic materials. The thickness and initial moisture content of hygroscopic materials have little impact on the moisture buffering value. This study strived to provide a theoretical basis and technical guidance for the production and installation of hygroscopic materials. It also promoted the passive materials market and the building’s energy savings. The best moisture buffering performance, evaluated at room level in this paper, can be obtained through real-world environmental simulation.
1. Background
Materials can stabilize room air humidity within a certain range [1]. Their effect depends on the difference in moisture content between the indoor and outdoor air and the capability of moisture exchange with the indoor air [2]. The use of hygroscopic materials can improve indoor air quality and human comfort [3,4]. Applying passive, new, environmentally friendly materials hygroscopic materials to the interior surface of exterior walls, has shown outstanding advantages [5]. In recent years, research on the physical parameters and applied effects of hygroscopic materials has made huge breakthroughs. The concept “hygroscopic material” was first proposed by Japanese researchers and was first developed and applied in Japan. Hygroscopic materials are used in museums, temples, libraries, art galleries, and other places [6]. The Japanese professionals using such materials have accumulated a wealth of experience.
The first publication in Chinese was by Zhan [7], the developer of a new type of hygroscopic material using agricultural waste and additives.
Xu X [8] used Matlab to calculate the different initial moisture contents and the effects of the inner surface of wallpaper on indoor humidity when cement mortar and gypsum board were used in different air conditioning modes. The researcher tested the effects of indoor moisture content per unit area and the initial moisture content of the inner envelope surface of a wet load. However, the hygroscopic material was assumed to be in contact with only one side of the room, the other sides were assumed to be insulated. This ignored the heat and mass transfer effects caused by the difference between the ambient temperature, humidity, and weather conditions and the indoor environment. Thus, there were some limitations.
Li K and Zhang X [9,10] tested the water vapor permeability coefficients and isothermal absorption and desorption curves of five kinds of materials: expanded polystyrene (EPS), extruded polystyrene (XPS), polyurethane (PU), concrete, and cement mortar. However, the heat and moisture characteristics are different because of the blending ratios of the different materials. The article did not indicate the basis of the material properties.
Yi He [11] investigated the moisture absorption and desorption of underfill material by thermogravimetric and dynamic mechanical analysis in a humidity-controlled environment. When the relative humidity (RH) was kept under 60%, the moisture diffusion of the material could be described by Fick’s diffusion law. Fick’s diffusion law is not applicable at higher moisture levels. Additionally, materials can suffer damage at high temperatures and humidity levels.
Based on limited experimental cases, Marjorie Bart [12] developed a heat and moisture transfer hybrid model. The isothermal heat and mass transfer through gypsum board and the nonisothermal heat and moisture transfer through cellulose insulation were investigated. The present model was compared to the abovementioned results. The effective moisture capacity needs to be considered to reach a better agreement between the two sets of results.
To form blended membranes for air dehumidification, T. D. Bui [13] separately added two hygroscopic materials, namely, inorganic lithium chloride (LiCl) and organic triethylene glycol (TEG), to poly(vinyl alcohol) (PVA). He found that the membrane formed from PVA/TEG was highly durable and suitable for dehumidification applications.
Kamilia Abahri [14] analyzed the convective and diffusive driving potentials on combined heat air and mass transfer in hygroscopic materials and defined the validity of the submodels by a numerical simulation. The results showed that when the hygric state between the environment and the envelope was stable, with respect to the diffusion process, convection was a prominent driving potential.
Research on hydroscopic materials in Japan [15,16] and Europe [17,18] is more mature and applied more widely than in China, especially with respect to the most developed technology in Japan and Europe. The earliest research concerned the humidity control mechanism and the effects of practical applications. Afterwards, with advances in computer technology, researchers began to pay more attention to thermal and moisture physical parameters. In this field, a large number of projects have been carried out outside of China. China should also establish a heat and moisture physical parameters database for domestic applications. In recent years, hygroscopic materials research at home and abroad has paid more attention to the development of new materials [19,20,21] by attempting to use natural, biodegradable waste materials to develop the best commissioning ratio of hygroscopic materials. However, in practice, for similar environments, users utilize the same materials, with differences in the effects often existing due to the use of air conditioning inside the building, ventilation strategy, use of area materials, thickness, and differences in the initial moisture content of the hygroscopic materials [18].
This paper, therefore, simulates the three aspects of indoor humidity conditions, energy consumption, and economy at the room level to evaluate the moisture buffering performance of different hygroscopic materials. To provide a theoretical analysis and technical guidance for engineering and manufacture, the research considers multiple factors, including surface area, ventilation strategy, thickness, and the initial moisture content of these materials.
1.1. Material Categories
1.2. The Humidity Control Mechanisms of Hygroscopic Materials
Ideal hygroscopic materials have efficient absorption and desorption capacity, a proper feedback effect, and are green and low cost [28,29].
The materials use diverse humidity control mechanisms. Inorganic hygroscopic materials with a microporous structure can absorb and desorb water vapor molecules. In walls, water vapor is absorbed in the pores of hygroscopic materials and condenses when the partial pressure of water vapor in the air is greater than the saturated vapor pressure of water in the pores [24,30]. Another humidity-control comes from the inorganic salt contained in hygroscopic materials. The humidity control mechanism of polymers is that organic molecules with polar groups become combined with water molecules in the air by Van der Waals and hydrogen bonding [22,26].
Figure 1 [31] shows a moisture adsorption and desorption isotherm curve of an ideal hygroscopic material. The difference between absorption (wetting) and desorption (drying loop) is called capillary hysteresis. The point Φ1 is typically near relative humidity when multilayer adsorption begins (20% to 25% RH), and the point Φ2 is near the capillary saturation of the material. When the temperature in the room changes, the same absolute content of vapor in the air will mean different relative humidity; with an increase in room temperature, the relative humidity decreases and the material can absorb more moisture from the air. When the temperature decreases and the relative humidity of the material increases, the hygroscopic materials quickly desorb some moisture, increasing the room’s RH. Thus, an ideal moisture buffer material should have an adsorption and desorption curve in the 40–60% range of RH and as steep as possible to be able to reduce the oscillations of relative humidity in the room.
2. Materials and Methods
2.1. Materials and Building Model
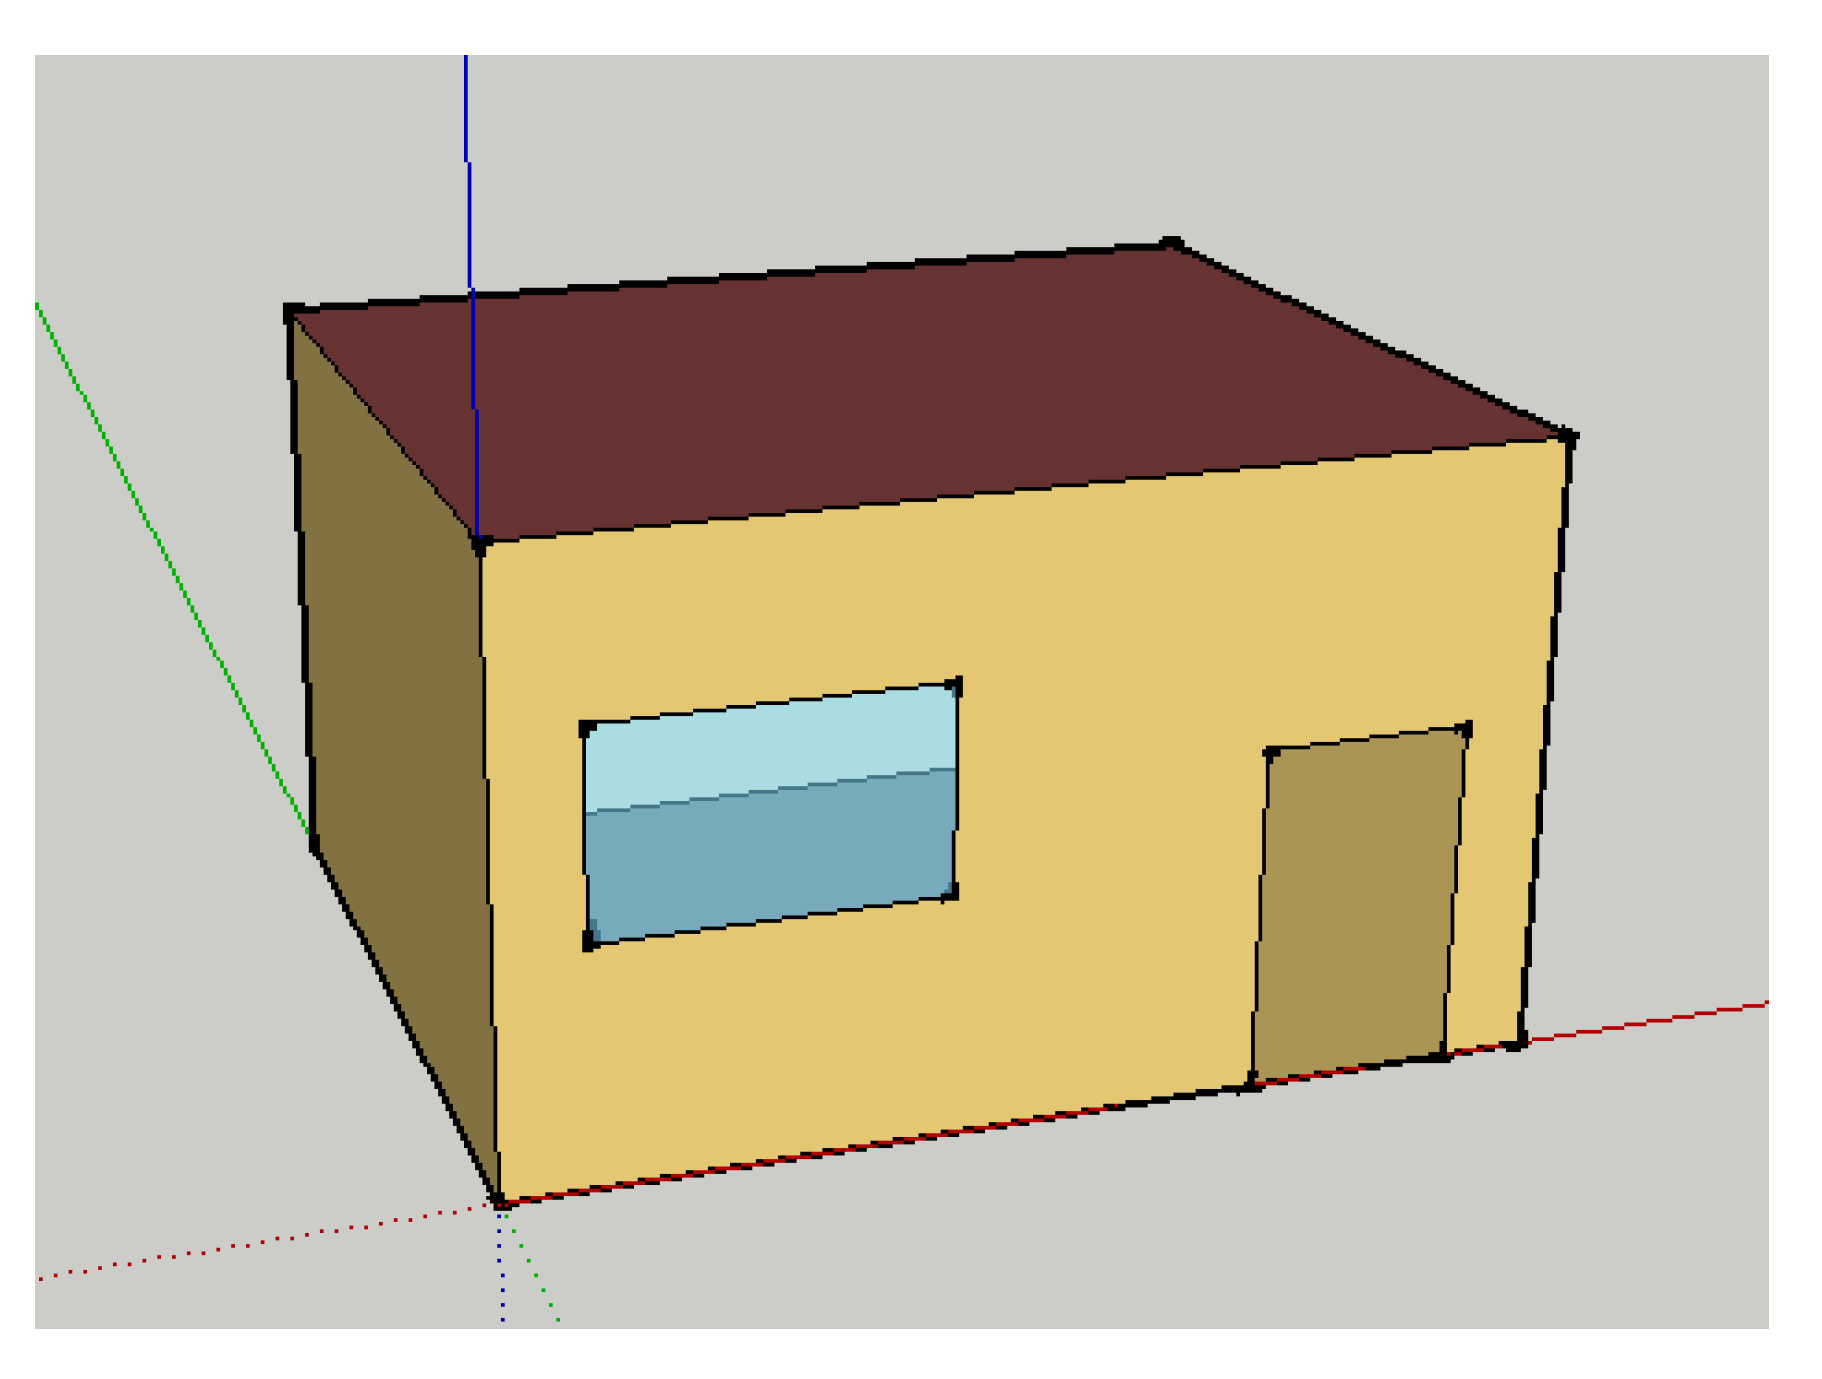
The modeled object was a simple N–S-oriented office house. It is located in Shenyang and each story is 6 m long, 5 m wide, and 3.6 m high. The construction area is 30 m2 with windows that are 2 m long and 1.2 m high, doors that are 1.2 m wide and 2 m in height, and walls that are 3.6 m high. The office is controlled by ideal air conditioning. The maximum heating supply air temperature was 50 °C, and the minimum cooling supply air temperature was 13 °C. From 5:00 to 19:00 on weekdays, heating, ventilation and air conditioning (HVAC) controlled the temperature and humidity of the office building with a constant temperature between 20 °C and 25 °C. The lighting level was 11 W/m2. The natural ventilation rate was 0.0083 m3/(s·people), the maximum heating supply air humidity ratio was 0.018 kg water/kg dry air, and the minimum cooling supply air humidity ratio was 0.01 kg water/kg dry air. The architectural model (Sketchup and Openstudio) is shown in Figure 2.
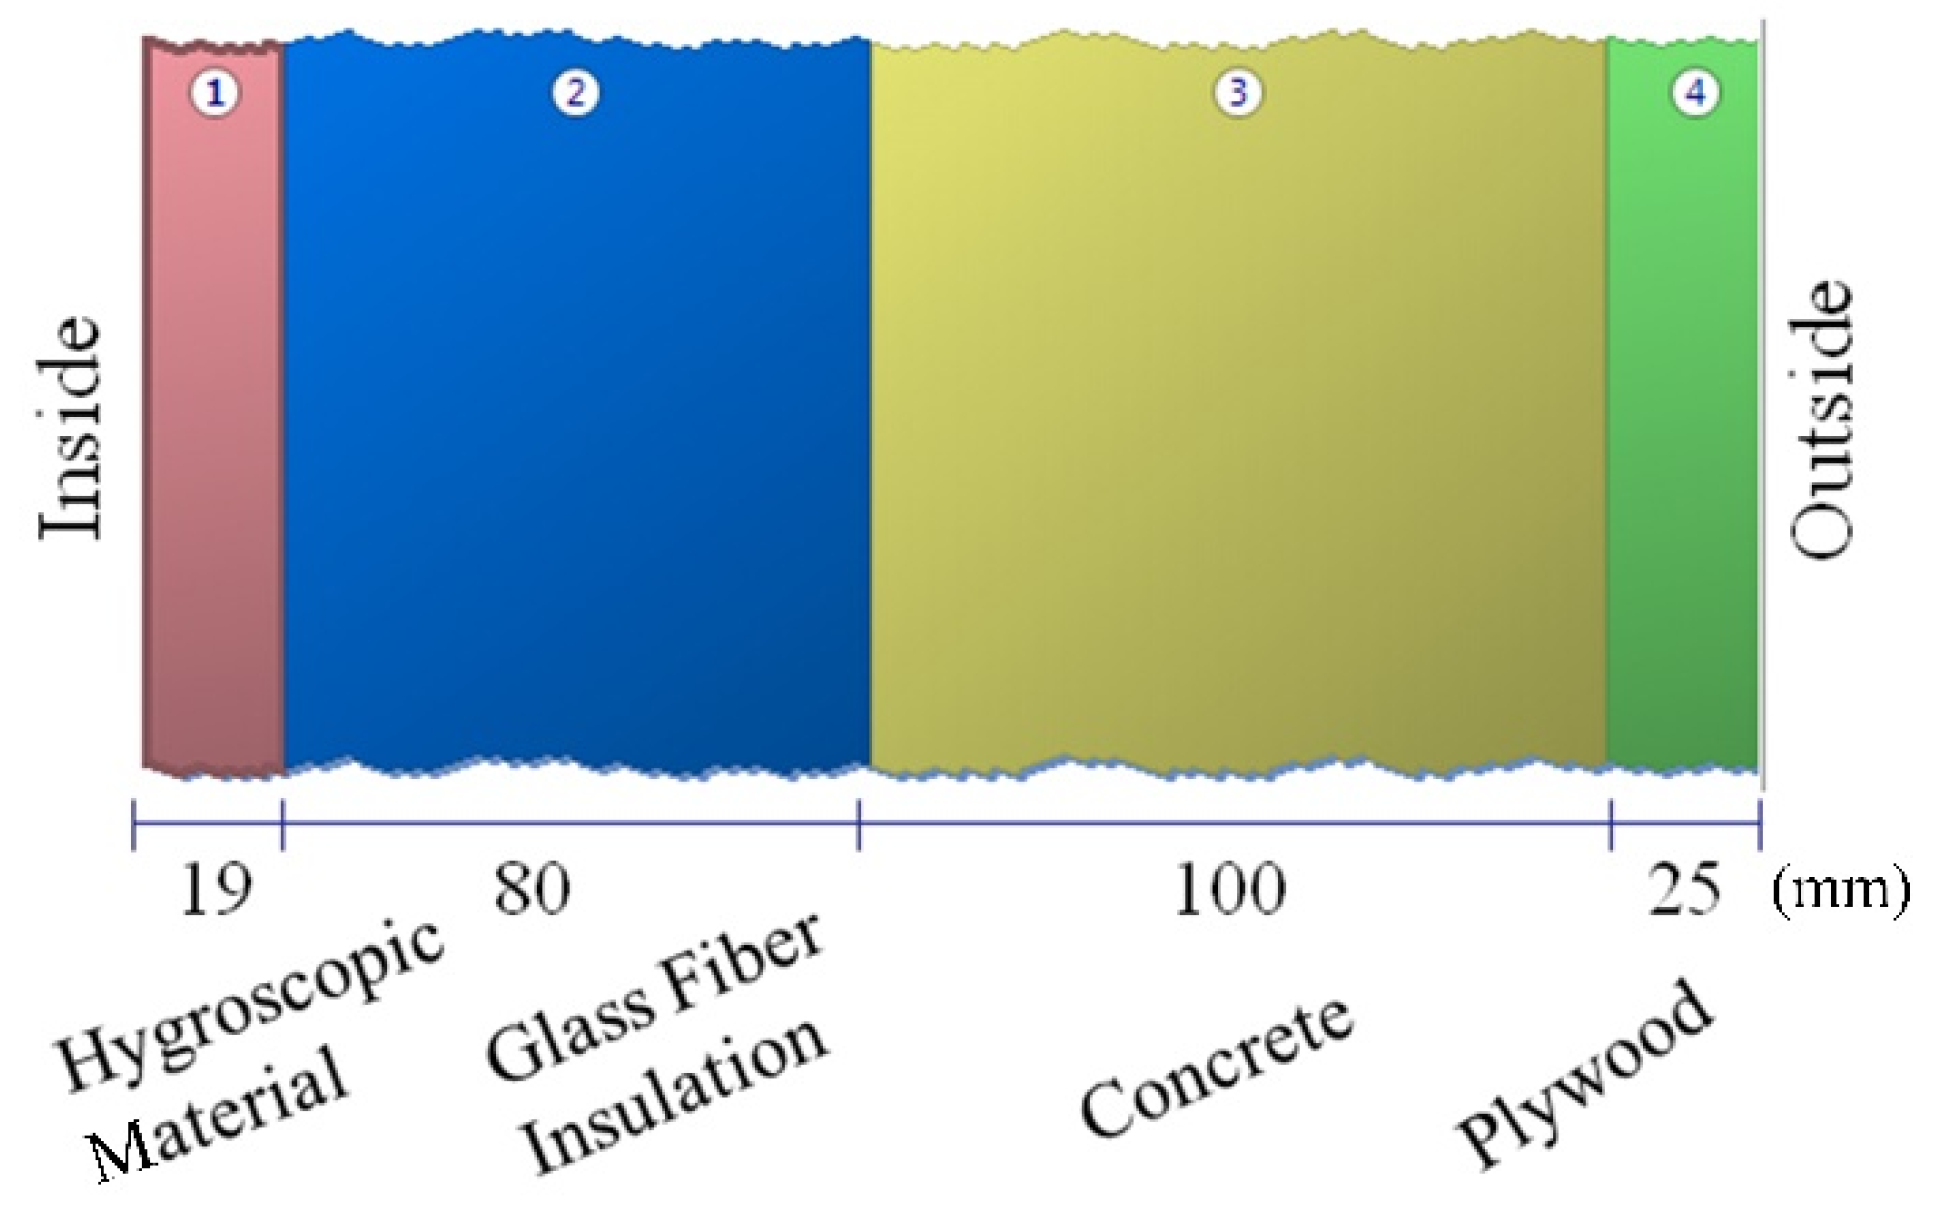
The walls of the building contain plywood, concrete, glass fiber insulation, and one interior moisture buffer material. The buffer materials studied included the following: gypsum board, mortar, spruce, wood fiber board, and light clay mortar. The physical properties of the materials are shown in Table 2. In terms of the effect on moisture buffering performance analysis, as a superior hygroscopic material, wood fiber board was selected. The basic physical properties were taken from the IDF editor dataset in EnergyPlus. The moisture characteristics of the materials were taken from the ASHRAE RP-1018 [32] databases. The external wall and roof construction are shown in Figure 3 and Figure 4. Compared with the mortar group, the light clay mortar included some clay. The wood fiber board had more plant fiber with superior humidity control performance than the spruce group.
2.2. Numerical Model
In energy simulation software calculations, users generally only consider energy loss caused by heat transfer passing through the building envelope. However, moisture transfer and storage must also be considered when calculating the moisture buffering function. The most common thermal balancing algorithm is CTF (conduction transfer functions) in EnergyPlus [33,34]. This paper used the HAM algorithm (combined heat and moisture finite element), which is a heat and moisture transfer finite element algorithm. The coupled heat and moisture transfer model using this algorithm can simulate the transport and storage of heat and moisture in the walls. The HAM model description is as follows.
The following formulas [35] express the heat and moisture equilibrium theoretical model. Equation (1) describes the heat transfer process and storage. Equation (2) describes the moisture storage and delivery process.
The relationship between the diffusion coefficient of water vapor in the air and the temperature of the vapor is defined by Equation (3).
The term in Equation (1) is related to the moisture content of the material. Equation (4) reflects the relationship between the heat transfer process and the moisture content of the material.
The moisture content w and water vapor diffusion resistance coefficient μ are related to the relative humidity. Each material has more than 10 layers for the transfer of heat.
Equation (5) describes the first layer’s heat storage and transfer within the wall. In Equation (6), it is expressed as the latent heat of vaporization in the cavity i.
In addition to the heat transfer in the wall caused by the indoor and outdoor temperature difference, other heat transfers are also present (for example, the radiant heat from other surfaces). The temperature of the wall reaches equilibrium under the action of the integrated heat field. Equation (7) describes the integrated temperature:
where is the thermal heat capacitance of cell i, and is the thermal resistance between cells i and j.
Moisture transfer is similar to heat transfer. One is liquid transfer which is propelled by relative humidity difference as the potential force. The other is gas transfer which is propelled by the difference in the water vapor partial pressure as the potential force. Equation (8) describes the moisture transfer process in the layer:
where is the “moisture capacitance” of cell i, is the moisture resistance between cells i and j, and is the vapor resistance between cells i and j.
2.3. Validation of the Numerical Model
To verify the reliability of the numerical methodology, we simulated the building model, tested in References [36,37], using EnergyPlus in a real environment. The real measurement data and simulation data were compared. In the literature, a series of experiments examining the moisture buffering effect of vermiculite board as a kind of hygroscopic material were conducted in two actual rooms (Room A and Room B).
In the experiments, the furnished hygroscopic material was installed in the walls on four sides of Room B and in none of the walls in Room A. For the two rooms, the target air change rate (ACH) was 0.5 ACH/h, and the target moisture production rate was 150 g/h. Figure 5 shows the results comparing the simulation and actual measurement. The trend of change of the two results is consistent. The average relative error of the simulation model was approximately 2.5%. Therefore, the numerical methodology could be applied. The precision of the calculation was sufficient to meet the needs of the pre-project performance valuation and design optimization.
3. Results and Discussion
In the assessment of low energy buildings, we paid attention to the following three issues: building energy consumption, indoor humidity condition, and life cycle cost. Adding high-performance hygroscopic materials will optimize these three aspects. Mechanical ventilation is widely used to constantly meet indoor temperature and humidity demands. It meets the requirements of the indoor humidity condition, but the building energy consumption is large. We examined to what extent moisture buffer materials could modify the indoor environment and improve the energy balance, as they also affect the indoor temperature through the latent heat of evaporation or the condensation of moisture. In the environment analysis, it was better when indoor humidity was close to the 50% and indoor humidity fluctuated between 40–60%. In the energy analysis, the total energy was expected to be smaller if there was no need to modify the water content of the air artificially.
3.1. Indoor Humidity Condition Analysis
Figure 6 shows the indoor air RH controlled between 30% and 60%. In the last two graphs, we can see that the hygroscopic material was able to regulate air humidity at the high end, but it required the humidity-controlling function of air conditioning to provide a comfortable environment. Humidity fluctuation is largest in the gypsum board group. From June to September, the indoor RH was close to 60% for the gypsum board group, mortar group, and spruce group, as these three types of materials already reached saturation at such levels of indoor RH. Therefore, the excess water vapor in the air was handled by the air conditioner. However, from June to September, the indoor air humidity corresponding to the light clay mortar and wood fiberboard group fluctuated more than that of other moisture absorption materials, but the fluctuation of RH was mainly in the range of 30–60% and the period of RH close to 50% was longer. The explanation for this was that these two materials did not reach saturation at this indoor relative humidity. Therefore, they had good absorption and desorption performance, and the energy consumption required for air conditioning adjustment was low so these two groups exhibited better performance than the other groups.
3.2. Zone Load and Annual Energy Consumption Analysis
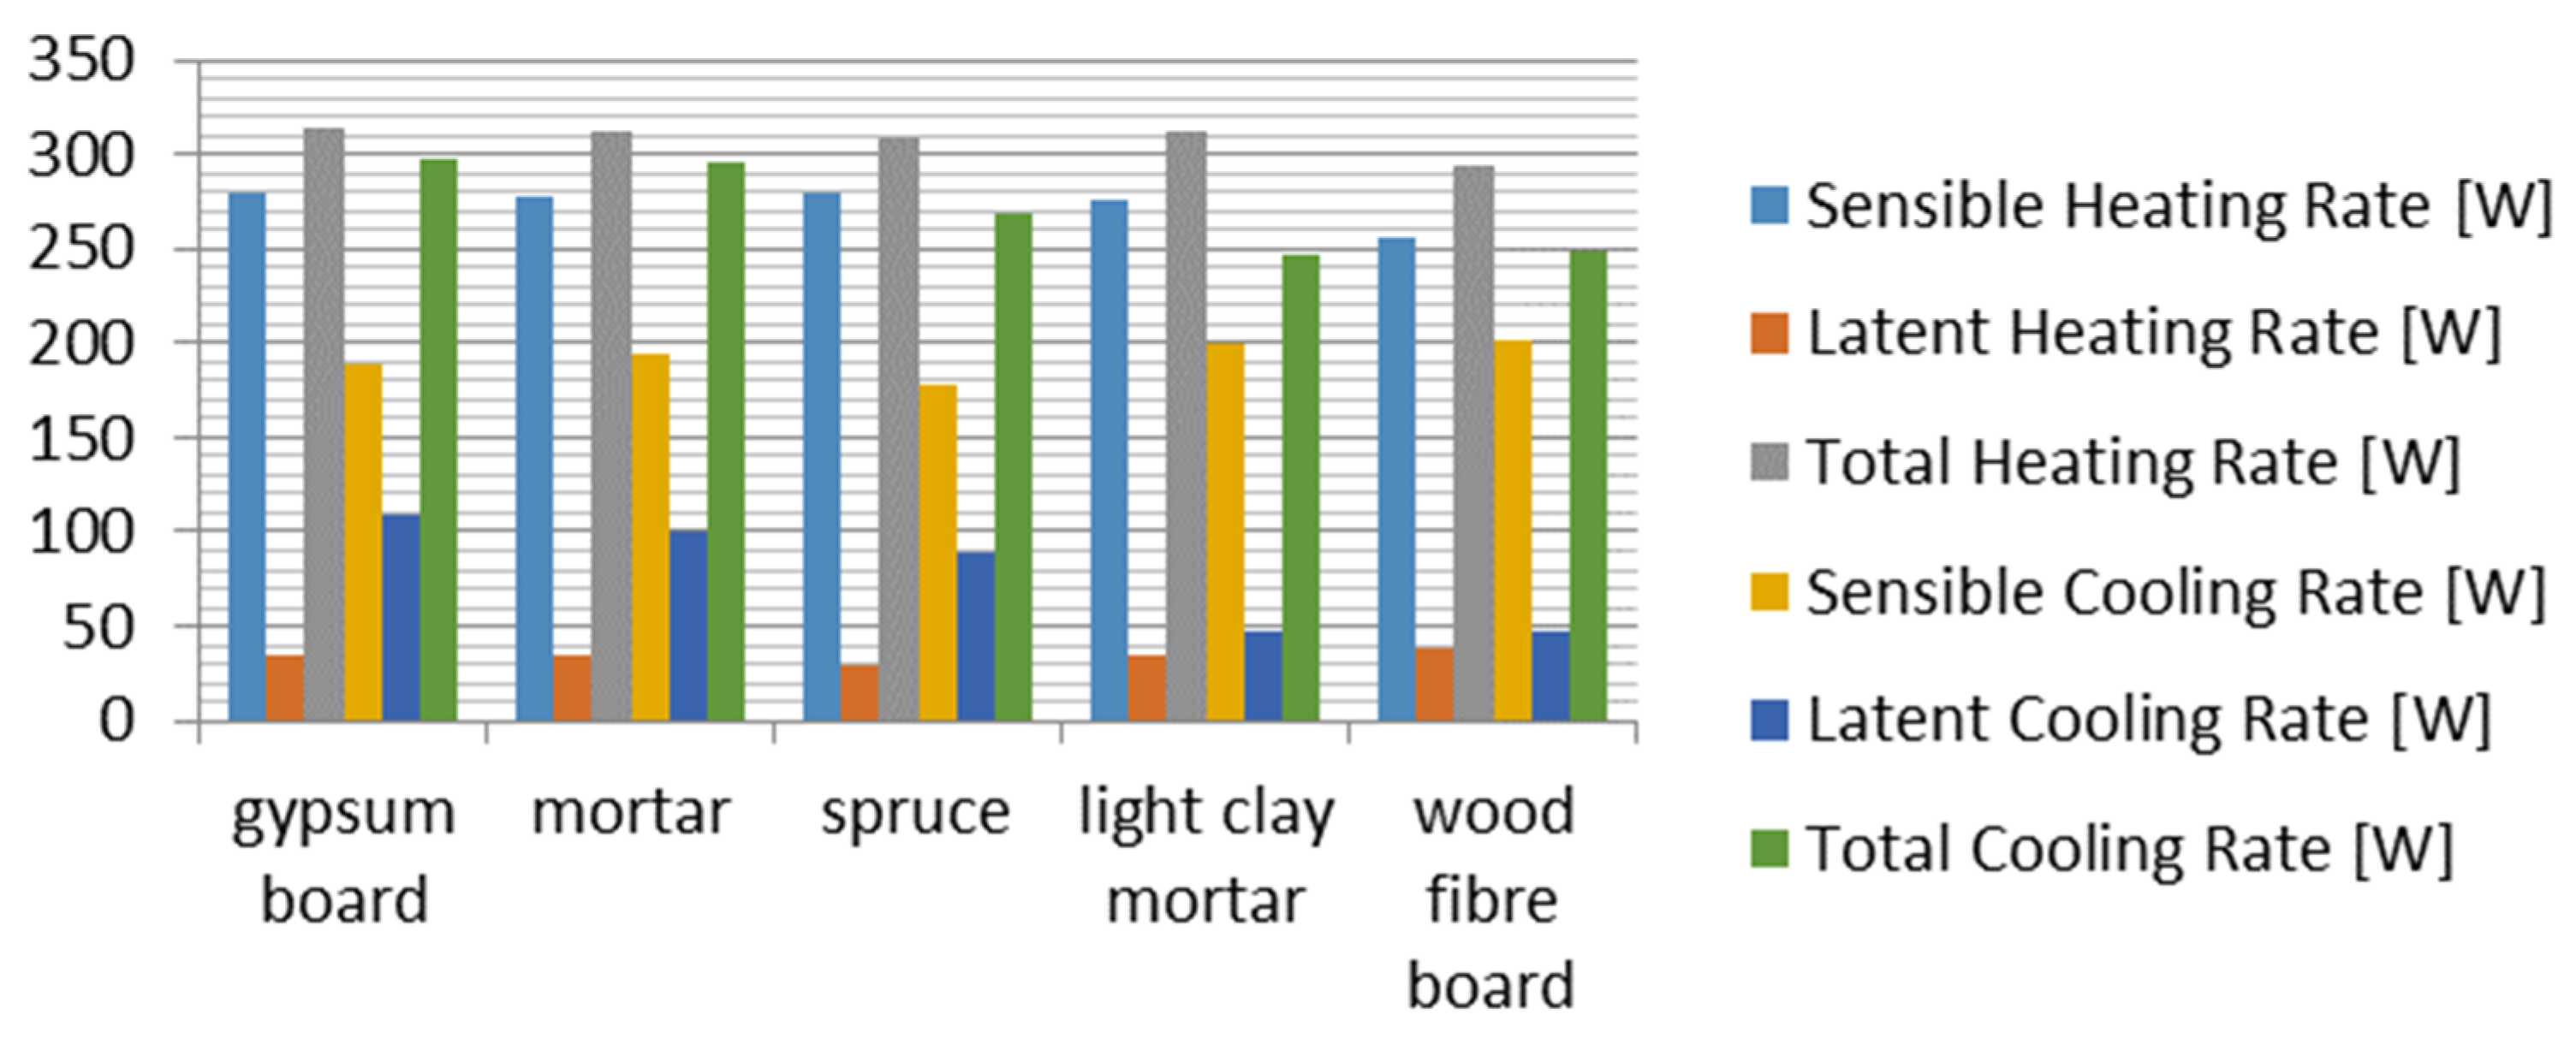
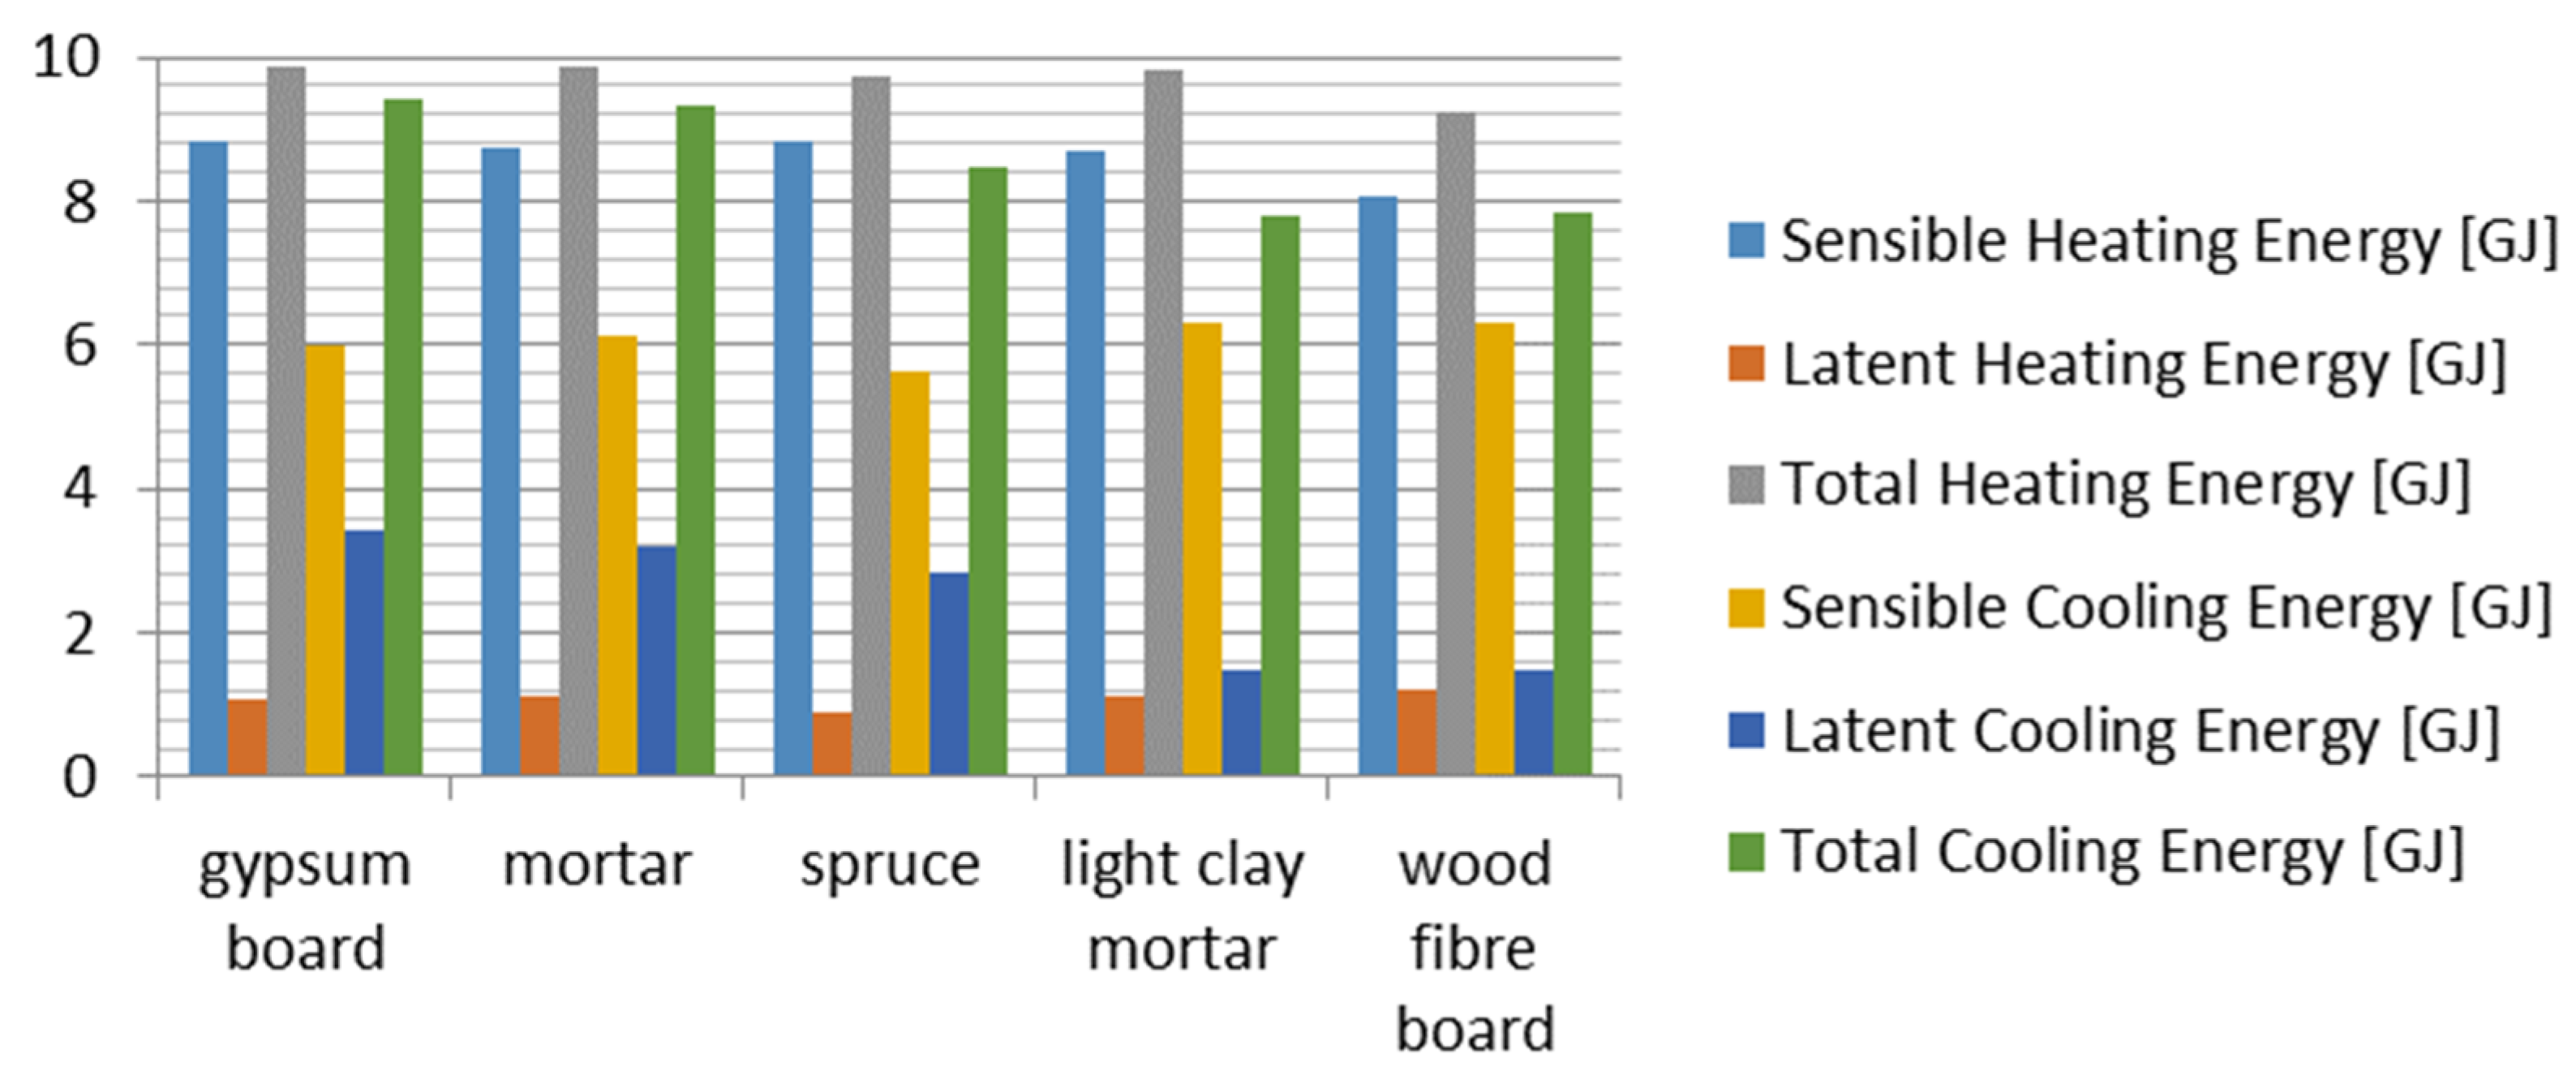
If hygroscopic materials are to be promoted, it is important to assess all aspects of the energy saving impacts. Figure 7, Figure 8 and Figure 9 show the zone load, annual cooling and heating energy, and total annual energy consumption.
In Figure 6, Figure 7 and Figure 8, we can see that several groups of hygroscopic materials optimized the humidity performance and sensible heating energy and resulted in a decreasing trend of latent cooling energy. Due to the absorption and desorption performance of hygroscopic materials, the indoor humidity was controlled to some extent and the operating time was extremely short. So, the latent cooling energy consumption decreased in summer and indicated the better performance of materials. However, indoor humidity was always at an acceptable value. We also noted that the sensible energy, which was related to coupled heat and moisture, did not change significantly. Materials can absorb heat when they desorb water vapor, and they can desorb heat when they absorb water vapor. Overall, as the humidity control of components increased, the total heating energy and total cooling energy decreased. In particular, as seen in Figure 8, as materials with better moisture buffering values were used, the total energy clearly decreased. We can conclude that hygroscopic materials have an obvious advantage in terms of total energy use and are more conducive to building energy efficiency.
3.3. Economic Analysis
LCC (life-cycle cost) refers to the building cost from material acquisition, material transport, building design, construction, operation, maintenance, and dismantling recovery over the entire cycle [38]. The life-cycle cost of a building involves costs over a long period of time, over which the value of money will change. To correctly evaluate the economic effects, we need to consider the monetary costs at different points relative to a common standard, i.e., to compare the cost base on the same foundation. In this study, for a research cycle, the commonly used period in residential construction was generally 50 years, considering the time value of money. The building cost, using several materials, was analyzed by converting the life-cycle cost to the initial time point. Comparing the economic costs allows the choice of hygroscopic materials with the best comprehensive benefit. Table 3 shows the univalence of materials, and Figure 10 shows the life-cycle cost.
According to Figure 10, we can see that construction costs using different hygroscopic materials were of little difference. In general, the cost of wood was slightly higher than that of gypsum and mortar. The operating costs were in agreement with building energy consumption. Materials with better hygroscopic behaviors had better advantages in terms of obtaining maximum comprehensive benefits, but the life-cycle cost was generally not significantly different.
3.4. The Effect of Quantity of Hygroscopic Materials on Moisture Buffering Performance
In actual use, due to the costs of hygroscopic materials, interior decoration, and installation, there is some difference in the paving modes of hygroscopic materials. In this paper, four cases were used for applying different hygroscopic materials to the wall surface. These four cases are applying a kind of hygroscopic material on one, two, three, or four walls and the roof surface. Plywood was applied to the wall(s) that did not receive the hygroscopic material application. We simulated the moisture fluctuations of the office room from 1 October to 20 October. The moisture fluctuations under the four situations are shown in Figure 11 (wood fiber board, as a hygroscopic material with a superior moisture buffering value, is shown).
Figure 11 shows that the greater the quantity of material, the lower the level of relative humidity fluctuation in the room, which demonstrated a more obvious moisture buffering effect. The indoor humidity was low from 1 October to 7 October and from 13 October to 19 October. Hygroscopic materials discharged moisture content, improving the indoor humidity. More hygroscopic materials will release more humidity. With outdoor humidity increasing during the period of 8 October to 12 October, the relative indoor humidity improved, and the hygroscopic materials absorbed moisture. Increasing the quantity of hygroscopic materials allowed for greater humidity absorption, slightly lowering the indoor humidity. Therefore, as more hygroscopic material was added, the moisture buffering effect was greater. Other hygroscopic materials showed a similar pattern with slightly smaller differences.
3.5. The Effect of Ventilation Strategy on Moisture Buffering Performance
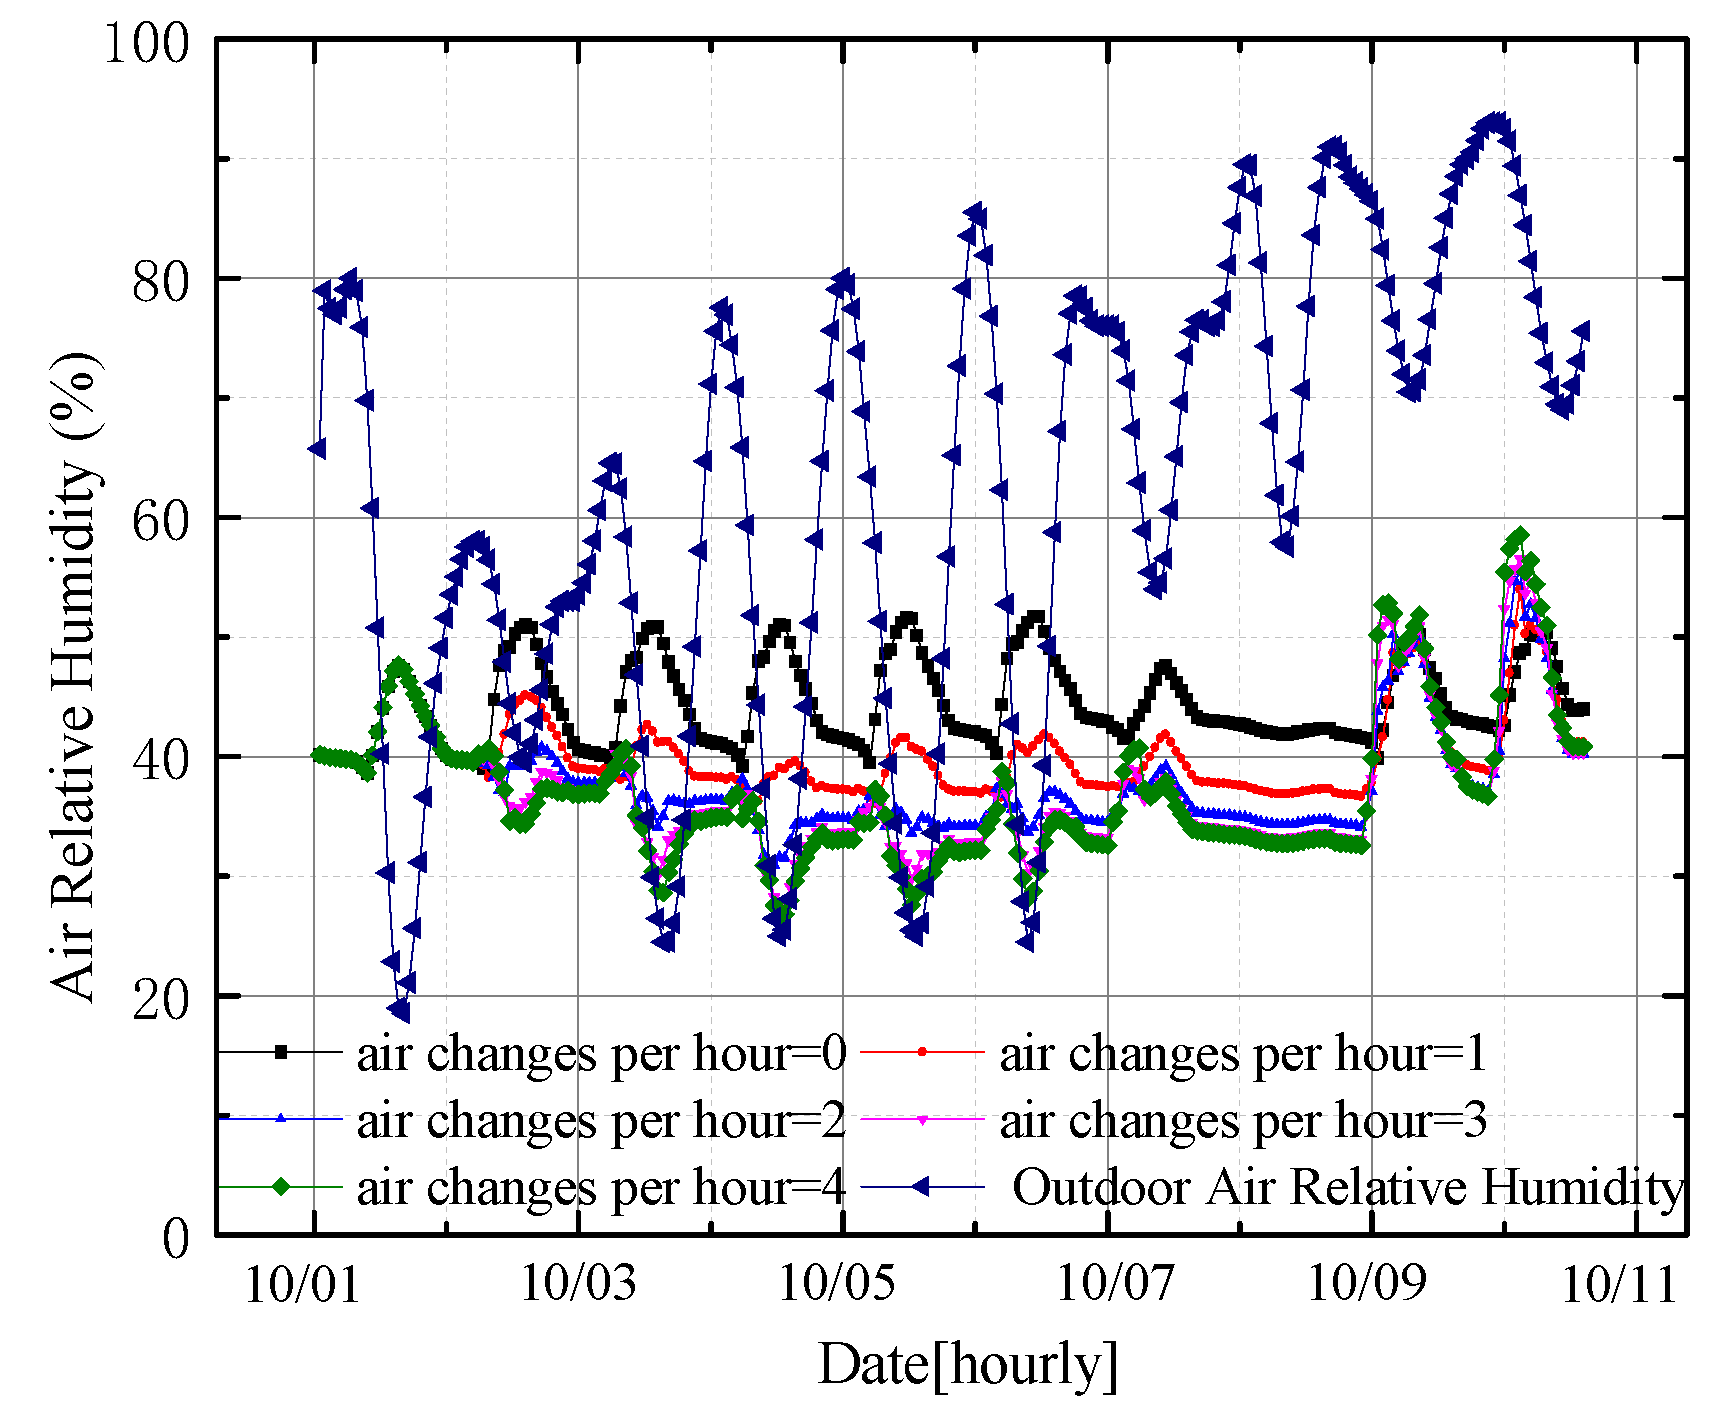
In summer and the transition seasons, the outdoor temperature is agreeable. To improve indoor air quality, people often replace indoor air with natural ventilation, adjusting the indoor temperature and humidity. In this case, the buffering capacity of the materials for indoor humidity will inevitably be affected [3]. This paper established different kinds of ventilation strategies, changing the air exchange rate across 1, 2, 3, and 4 ACH/h, and contrasted the outdoor humidity values hourly [39]. In all cases, the different kinds of hygroscopic materials were applied to all four walls. Figure 12 and Figure 13 show indoor air humidity fluctuations in the office room under different air exchange rates from 1 August to 10 August and from 1 October to 10 October, respectively (for wood fiber board).
Figure 12 shows that indoor humidity exhibits the same pattern of change as outdoor humidity variation, with some delay. The higher the ventilation value, the closer the values of indoor and outdoor room humidity. Since August is the hot part of summer, the outdoor air humidity is high. With humid air coming into the room, the hygroscopic materials were in the humidity-absorbing state. The humidity fluctuation without ventilation was the lowest, close to 50%. The moisture buffering performance was the highest in this case. With the increase in ventilation value, the indoor humidity and humidity fluctuation increased, lowering the humidity absorbing performance of the material. Other hygroscopic materials showed a similar pattern.
Figure 13 shows a pattern similar to that in Figure 11. The indoor humidity changes with the outdoor humidity fluctuation, but with a time lag. Since October is in autumn, a transition season, the temperature decreases compared to those in August and the outdoor air humidity fluctuation was large. The largest fluctuation was up to 60%. Hygroscopic materials fluctuate with moisture absorption and desorption. As shown in Figure 13, the indoor humidity fluctuation was still closest to 50% without ventilation. This meant that the moisture buffering performance was the highest in this case. With the increase in the value of the air exchange rate, the indoor humidity was reduced and the humidity fluctuations increased with a decrease in the humidity absorbing performance of the material. Other hygroscopic materials showed a similar pattern.
3.6. The Effect of Initial Moisture Content of Hygroscopic Materials on Moisture Buffering Performance
Because of differences in the craftsmanship of materials, production workshop environment, and seasons, there may have been a big difference in some initial parameters. The moisture buffering performance depended on the difference in the humidity between the material itself and the indoor space. After the material was transported from the workplace to the building, the moisture exchange between materials and the indoor environment did not cease until reaching equilibrium. Therefore, there was a significant impact from the initial moisture content of the material on the moisture buffering performance [39]. We set several different initial moisture contents, including 0.01 kg/kg, 0.05 kg/kg, and 0.1 kg/kg. The different kinds of hygroscopic materials were applied to all four walls in every case. The annual indoor humidity fluctuation was then simulated. Figure 14 shows the annual room relative humidity for the different initial moisture contents of the material (wood fiber board).
Figure 14 shows that in the first six months, the indoor air relative humidity showed little difference across the different initial moisture contents of the materials. The difference disappeared after six months. Therefore, the initial moisture content of the material had little effect on the indoor humidity. There was a smaller effect on the relative indoor humidity six months after application, and there was no effect after six months. Other hygroscopic materials showed a similar pattern, indicating that hygroscopic materials do not require pre-drying or humidification.
3.7. The Effect of Thickness of Hygroscopic Materials on Moisture Buffering Performance
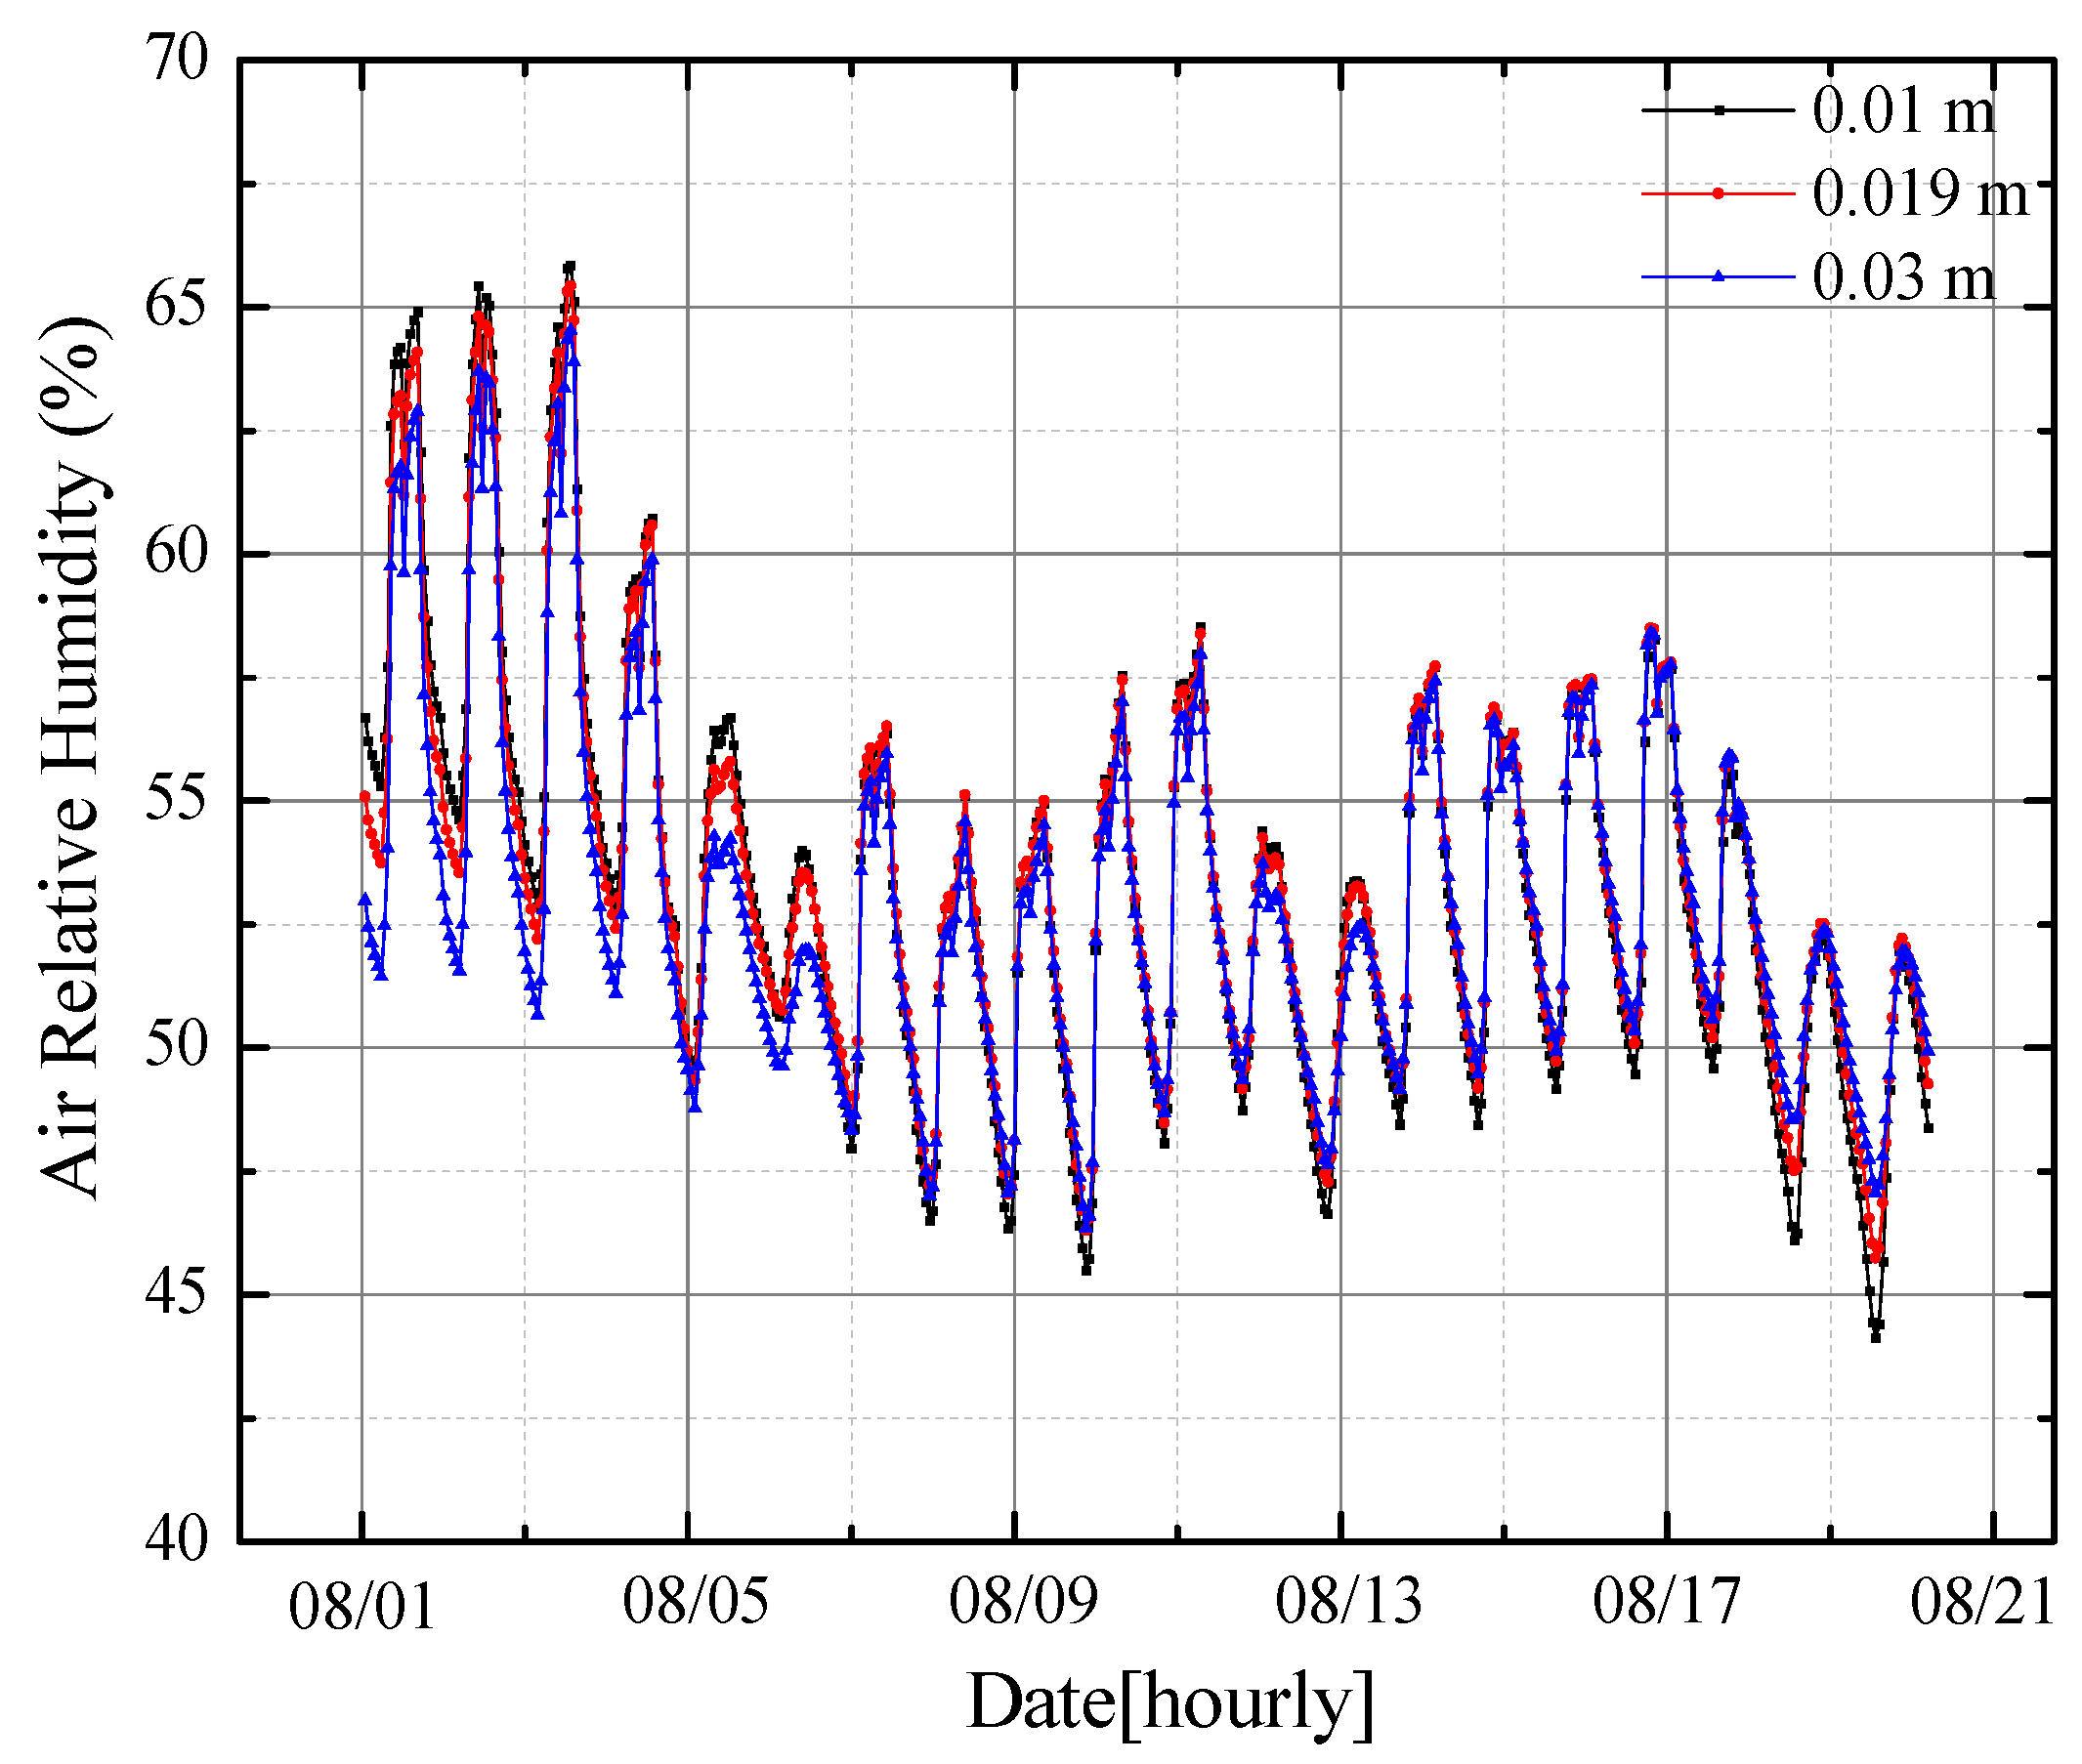
The production thicknesses of materials may be different due to differences between manufacturers and in material properties. According to the above analysis, the greater the area of use of the materials in the room, the higher the moisture buffering performance of the material [28]. Therefore, many users believe that if the hygroscopic materials are thicker, they will have perfect moisture buffering performance. To verify the correctness of this view, we established several thicknesses of hygroscopic material available in the market, including 0.01 m, 0.019 m, and 0.03 m. The different kinds of hygroscopic materials were applied to all four walls in every case. Figure 15 shows the indoor humidity fluctuations from 1 August to 20 August using different thicknesses of material (wood fiber board).
Figure 15 shows that the thickness has a low impact on the moisture buffering performance of hygroscopic materials. The thicker hygroscopic materials did indeed regulate indoor humidity well, with the relative indoor humidity often close to 50%. However, in doubling the thickness of the hygroscopic materials, the difference in the moisture buffering performance was negligible. Other hygroscopic materials showed a similar pattern.
4. Conclusions
This paper pioneers a new area of research in China, although this research may not be as new in some other countries, and poses several questions. First, evaluation methods are lacking. Significant efforts have been made in Europe to compare materials to each other but there is a need to conduct evaluations at room level. To this end, the heat and moisture transfer algorithm (HAM) was introduced to EnergyPlus.
This permitted us to examine moisture-buffering materials across three aspects: indoor humidity conditions, the building’s energy consumption, and the building’s life-cycle cost. The results showed that hygroscopic materials could control indoor air humidity changes and improve human comfort but they needed to be used together with central air conditioning because of their limited humidity controlling performance.
In energy efficiency terms, the energy saving effect of different hygroscopic materials was around 7%. The better the performance of the hygroscopic material, the lower the building energy consumption. In economic terms, the life-cycle cost calculated in our example was similar among different materials. The material cost made little difference. Overall, this research indicated that moisture buffer materials have great potential for further development.
Furthermore, by simulating different thicknesses, different initial moisture contents, and different air exchange rates, and comparing the indoor humidity fluctuations, we showed the complexity of the applications of the moisture-buffering materials. The effect of different initial moisture contents on performance could be eliminated in about half a year. In addition, the marginal impact could be ignored. Thus, the hygroscopic materials do not require pre-wetting or pre-drying. The exposure area of buffering materials has an impact on performance: the greater the surface area of buffering materials, the higher their contribution to the indoor environment and energy reduction. Therefore, moisture buffer materials with fire protective performance should replace drywall as the interior finish. We observed that the air exchange rate had the most significant impact on the moisture buffering performance of the materials. It may be appropriate to reduce the air exchange rate to ensure the ideal air exchange rate for better humidity control. This coincides with the trend for recirculating part of the air, which would also increase the efficiency of the moisture-buffering materials.
Author Contributions
Conceptualization, S.Y. and Y.C.; methodology, Y.C.; software, Y.C.; validation, Y.C.; formal analysis, Y.C.; writing—original draft preparation, Y.C.; writing—review and editing, Y.C.; manuscript revising, Y.C., F.H. and Y.S.; project administration, S.Y.; funding acquisition, S.Y.
Funding
This research was funded by: the National Key R and D Program of China, grant number 2017YFC0702601; the National Natural Science Funds, grant number 51308353, the Opening Funds of State Key Laboratory of Building Safety, Built Environment, grant number BSBE2016-06; the Shenyang Young and Middle-Aged Science and Technology Innovation Talents Program, grant number RC170313 and the Liaoning Provincial Natural Foundation, grant number 20170540761.
Conflicts of Interest
The authors declare no conflict of interest.
References
- Latif, E.; Lawrence, M.; Shea, A.; Walker, P. Moisture buffer potential of experimental wall assemblies incorporating formulated hemp-lime. Build. Environ. 2015, 93, 199–209. [Google Scholar] [CrossRef] [Green Version]
- Busser, T.; Berger, J.; Piot, A.; Pailha, M.; Woloszyn, M. Dynamic experimental method for identification of hygric parameters of a hygroscopic material. Build. Environ. 2018, 131, 197–209. [Google Scholar] [CrossRef]
- Fořt, J.; Doleželová, M.; Černý, R. Moisture Buffering Potential of Plasters for Energy Efficiency in Modern Buildings. In Proceedings of the International Environmental Engineering Conference, Vilnius, Lithuania, 27–28 April 2017. [Google Scholar] [CrossRef]
- De Silva, G.H.M.J.S.; Surangi, M.L.C. Effect of waste rice husk ash on structural, thermal and run-off properties of clay roof tiles. Constr. Build. Mater. 2017, 154, 251–257. [Google Scholar] [CrossRef]
- Vereecken, E.; Roels, S.; Janssen, H. In situ determination of the moisture buffer potential of room enclosures. J. Build. Phys. 2010, 34, 223–246. [Google Scholar] [CrossRef] [Green Version]
- Ran, M. Review of research and application of air humidity controlling materials in Japan. Mater. Rev. 2002, 16, 3. [Google Scholar]
- Zhang, X. Research on Humidity-Controlling Wall Materials and Its Moisture Absorption and Desorption Capability. Ph.D. Thesis, Tianjin University, Tianjin, China, 2005; pp. 23–34. (In Chinese). [Google Scholar]
- Xu, X. Effect of Building Envelope Absorption and Desorption on the Indoor Humidity and Moisture Load. Ph.D. Thesis, Central South University, Changsha, China, 2007; pp. 33–66. (In Chinese). [Google Scholar]
- Li, K.; Zhang, X.; Han, X.; Zhu, D. Experimental study on isothermal absorption and desorption curves of building material. J. Build. Mater. 2009, 12, 81–84. (In Chinese) [Google Scholar]
- Li, K.; Zhang, X.; Han, X.; Zhu, D. Experimental Research of Water Vapor Permeability through Building Materials. J. Build. Mater. 2009, 12, 288–291. [Google Scholar]
- He, Y. Moisture absorption and hygroscopic swelling behavior of an underfill material. Thermochim. Acta 2012, 546, 143–152. [Google Scholar] [CrossRef]
- Bart, M.; Moissette, S.; Ait Oumeziane, Y.; Lanos, C. Transient hygrothermal modelling of coated hemp-concrete walls. Eur. J. Environ. Civ. Eng. 2014, 18, 927–944. [Google Scholar] [CrossRef]
- Bui, T.D.; Wong, Y.; Thu, K.; Oh, S.J.; Kum Ja, M.; Ng, K.C.; Raisul, I.; Chua, K.J. Effect of hygroscopic materials on water vapor permeation and dehumidification performance of polyvinyl alcohol membranes. J. Appl. Polym. Sci. 2017, 134. [Google Scholar] [CrossRef]
- Abahri, K.; Bennacer, R.; Belarbi, R. Sensitivity analyses of convective and diffusive driving potentials on combined heat air and mass transfer in hygroscopic materials. Numer. Heat Transf. Part A Appl. 2016, 69, 1079–1091. [Google Scholar] [CrossRef]
- Concepts R.A JIS A 1470-1: Test Method of Adsorption/Desorption Efficiency for Building Materials to Regulate an Indoor Humidity; Japan Industry Press: Tokyo, Japan, 2002.
- Concepts R.A JIS A 1470-2: Test Method of Adsorption/Desorption Efficiency for Building Materials to Regulate an Indoor Humidity; Japan Industry Press: Tokyo, Japan, 2002.
- Rode, C. Status on NORDTEST Project-Moisture Buffering of Building Materials; ETH Zürich: Zurich, Switzerland, 2004. [Google Scholar]
- Roels, S.; Janssen, H. A comparison of the Nordtest and Japanese test methods for the moisture buffering performance of building materials. J. Build. Phys. 2006, 30, 137–161. [Google Scholar] [CrossRef]
- Jelle, B.P.; Hynd, A.; Gustavsen, A.; Arasteh, D.; Goudey, H.; Hart, R. Fenestration of today and tomorrow: A state-of-the-art review and future research opportunities. Sol. Energy Mater. Sol. Cells 2012, 96, 1–28. [Google Scholar] [CrossRef] [Green Version]
- Baetens, R.; Jelle, B.P.; Gustavsen, A. Properties, requirements and possibilities of smart windows for dynamic daylight and solar energy control in buildings: A state-of-the-art review. Sol. Energy Mater. Sol. Cells 2010, 94, 87–105. [Google Scholar] [CrossRef] [Green Version]
- Hu, J.; Meng, H.; Li, G.; Ibekwe, S.I. A review of stimuli-responsive polymers for smart textile applications. Smart Mater. Struct. 2012, 21, 053001. [Google Scholar] [CrossRef]
- Thomson, A.; Maskell, D.; Walker, P.; Lemke, M.; Shea, A.; Lawrence, R. Improving the hygrothermal properties of clay plasters. In Proceedings of the International Conference on Non-Conventional Materials and Technologies, Winnipeg, MB, Canada, 10–13 August 2015. [Google Scholar]
- Nguyen, D.M.; Grillet, A.-C.; Diep, T.M.H.; Ha Thuc, C.N.; Woloszyn, M. Hygrothermal properties of bio-insulation building materials based on bamboo fibers and bio-glues. Constr. Build. Mater. 2017, 155, 852–866. [Google Scholar] [CrossRef]
- Padfield, T.; Jensen, L.A. Humidity buffering of building interiors by absorbent materials. In Proceedings of the 9th Nordic Symposium on Building Physics, Tampere, Finland, 29 May–2 June 2011. [Google Scholar]
- Rode, C. Moisture Buffering of Building Materials; Department of Civil Engineering Technical University of Denmark: Lyngby, Denmark, 2005. [Google Scholar]
- Padfield, T. The Role of Absorbent Building Materials in Moderating Changes of Relative Humidity. Ph.D. Thesis, The Technical University of Denmark, Lyngby, Denmark, 1998. [Google Scholar]
- Kim, H.-J. The Hygric Performances of Moisture Adsorbing/Desorbing Building Materials. Aerosol Air Qual. Res. 2010. [Google Scholar] [CrossRef] [Green Version]
- Melero Tur, S.; García Morales, S.; Neila Gonzalez, F.J. Design and evaluation of a dehumidifying plaster panel for passive architecture integration. Revista De La Construcción 2015, 14, 21–28. [Google Scholar] [CrossRef] [Green Version]
- Li, Y.; Fazio, P.; Rao, J. An investigation of moisture buffering performance of wood paneling at room level and its buffering effect on a test room. Build. Environ. 2012, 47, 205–216. [Google Scholar] [CrossRef]
- Yang, X.; Fazio, P.; Ge, H.; Rao, J. Evaluation of moisture buffering capacity of interior surface materials and furniture in a full-scale experimental investigation. Build. Environ. 2012, 47, 188–196. [Google Scholar] [CrossRef]
- Hall, C.; Hoff, W.D.; Skeldon, M. The sorptivity of brick dependence on the initial water content. J. Phys. 1983, 16, 1875–1880. [Google Scholar] [CrossRef]
- Concepts, R.; Kumaran, M.K.J.A. A thermal and moisture transport property data base for common building and insulating materials (final report). ASHRAE Trans. 2014, 112, 485–498. [Google Scholar]
- D.O. Energy. Energyplus V8.9.0 Engineering Reference; U.S. Department of Energy: Washington, DC, USA, 2018.
- Karagiozis, A.; Künzel, H.; Holm, A. WUFI Ornl-ibp A North American Hygrothermal Model; Fraunhofer Institute of Building Physics: Munich, Germany, 2014. [Google Scholar]
- Kunzel, H.M. Simultaneous Heat and Moisture Transport in Building Components. One- and Two-Dimensional Calculation Using Simple Parameters. 1995. Available online: http://publica.fraunhofer.de/documents/PX-56656.html (accessed on 7 January 2019).
- Zhang, H.; Yoshino, H.; Hasegawa, K. Assessing the moisture buffering performance of hygroscopic material by using experimental method. Build. Environ. 2012, 48, 27–34. [Google Scholar] [CrossRef]
- Zhang, H.; Yoshino, H.; Hasegawa, K.; Liu, J.; Zhang, W.; Xuan, H. Practical moisture buffering effect of three hygroscopic materials in real-world conditions. Energy Build. 2017, 139, 214–223. [Google Scholar] [CrossRef]
- Lucchi, E.; Tabak, M.; Troi, A. The “Cost Optimality” Approach for the Internal Insulation of Historic Buildings. Energy Procedia 2017, 133, 412–423. [Google Scholar] [CrossRef]
- Osanyintola, O.F.; Simonson, C.J. Moisture buffering capacity of hygroscopic building materials: Experimental facilities and energy impact. Energy Build. 2006, 38, 1270–1282. [Google Scholar] [CrossRef]
Figure 1.
Isothermal desorption and adsorption curve of hygroscopic materials [31].
Figure 1.
Isothermal desorption and adsorption curve of hygroscopic materials [31].

Figure 2.
Architectural model.

Figure 3.
Wall construction.

Figure 4.
Roof construction.

Figure 5.
Relative humidity change comparison result.

Figure 6.
Indoor RH under central air conditioning control.

Figure 7.
Ideal zone loads.

Figure 8.
Energy use.

Figure 9.
Total energy.

Figure 10.
Life-cycle cost.

Figure 11.
Relative humidity by zone using different amounts of hygroscopic materials.

Figure 12.
Relative humidity with different air exchange from 1 August to 10 August.

Figure 13.
Relative humidity with different air exchange from 1 October to 10 October.

Figure 14.
Relative humidity under different initial moisture contents of hygroscopic materials.

Figure 15.
Relative humidity using different thickness of hygroscopic materials.


Table 1.
Hygroscopic material categories.
| Classification | Ingredient | Characteristic | Application | Notes |
|---|---|---|---|---|
| Inorganic silicon | Amorphous silicon dioxide | Superior moisture absorption capacity and moisture absorption rate with more severe hysteresis during the moisture absorption and desorption cycle | Ideal dry sorbent | High cost, limited application |
| Inorganic salt hygroscopic materials | Inorganic salt saturated salt solution | Large moisture storage capacity, swift absorption and desorption rate, deliquescent, unstable | Porous saliferous concrete material | Conducive to pollution, limited application, has research value |
| Inorganic mineral hygroscopic materials | Montmorillonite, kaolin, kieselguhr, zeolite powder, sepiolite | Symmetrical permeability, high temperature resistance, resistant to corrosion, swift water absorption and desorption speed (especially the latter), nontoxic and harmless to humans and the environment | Building wall | Cheap, a wide source of raw materials, long service life, popular and mature application |
| Organic polymer hygroscopic materials | High-molecular-weight polymer | Fast moisture absorption rate, large moisture content, diverse type, common moisture desorption performance | Suitable for different occasions | Complicated production process, high manufacturing cost, short functional life |
| Natural hygroscopic materials | Wood, bamboo charcoal, activated carbon | Different humidifying properties, bamboo charcoal can deodorize | Added to wall surface | Green and environmental protection, no pollution |
| Composite biomass hygroscopic materials | Crop waste (straw, rice straw, wheat straw, bean straw, cotton stalks, husks, etc.) | No pollution, lightweight, energy saving | Added to inner wall surface | Shows good prospects |
Table 2.
Physical properties of the materials.
| Materials | Density | Conductivity | Specific Heat | Porosity |
|---|---|---|---|---|
| (kg/m3) | (W/m·K) | (J/kg·K) | (m3/m3) | |
| Plywood | 530 | 0.14 | 1880 | 0.5 |
| Concrete | 2300 | 1.6 | 850 | 0.76 |
| Glass Fiber Insulation | 80 | 0.04 | 840 | 0.95 |
| Gypsum Board | 625 | 0.16 | 870 | 0.65 |
| Mortar | 1567.8 | 0.7 | 840 | 0.4084 |
| Spruce | 400 | 0.0938 | 1880 | 0.62 |
| Light Clay Mortar | 900 | 0.23 | 1000 | 0.47 |
| Wood Fiber Board | 320 | 0.0512 | 1880 | 0.981 |
Table 3.
The univalence of materials.
| Material | Thickness (m) | Univalence (RMB */m2) |
|---|---|---|
| Plywood | 0.025 | 34 |
| Concrete | 0.1 | 40 |
| Glass Fiber Insulation | 0.08 | 44 |
| Gypsum Board | 0.019 | 10.4 |
| Mortar | 0.019 | 9 |
| Spruce | 0.019 | 40 |
| Light Clay Mortar | 0.019 | 8.69 |
| Wood Fiber Board | 0.019 | 48 |
| Painting | 0.019 | 25 |
* RMB is the Chinese currency.
© 2019 by the authors. Licensee MDPI, Basel, Switzerland. This article is an open access article distributed under the terms and conditions of the Creative Commons Attribution (CC BY) license (http://creativecommons.org/licenses/by/4.0/).
Share and Cite
MDPI and ACS Style
Yu, S.; Cui, Y.; Shao, Y.; Han, F. Research on the Comprehensive Performance of Hygroscopic Materials in an Office Building Based on EnergyPlus. Energies 2019, 12, 191. https://doi.org/10.3390/en12010191
AMA Style
Yu S, Cui Y, Shao Y, Han F. Research on the Comprehensive Performance of Hygroscopic Materials in an Office Building Based on EnergyPlus. Energies. 2019; 12(1):191. https://doi.org/10.3390/en12010191
Chicago/Turabian StyleYu, Shui, Yumeng Cui, Yifei Shao, and Fuhong Han. 2019. "Research on the Comprehensive Performance of Hygroscopic Materials in an Office Building Based on EnergyPlus" Energies 12, no. 1: 191. https://doi.org/10.3390/en12010191
Note that from the first issue of 2016, this journal uses article numbers instead of page numbers. See further details here.