Comparative Analysis of CO2, N2, and Gas Mixture Injection on Asphaltene Deposition Pressure in Reservoir Conditions

Research Institute of Enhanced Oil Recovery, China University of Petroleum (Beijing), Beijing 102249, China
*
Author to whom correspondence should be addressed.
Energies 2018, 11(9), 2483; https://doi.org/10.3390/en11092483
Submission received: 24 July 2018
/
Revised: 3 September 2018
/
Accepted: 12 September 2018
/
Published: 18 September 2018
Abstract
:CO2 and N2 injection is an effective enhanced oil recovery technology in the oilfield especially for low-permeability and extra low-permeability reservoirs. However, these processes can induce an asphaltene deposition during oil production. Asphaltene-deposition-induced formation damage is a fairly severe problem. Therefore, predicting the likelihood of asphaltene deposition in reservoir conditions is crucial. This paper presents the results of flash separation experiments used to investigate the composition of crude oil in shallow and buried-hill reservoirs. Then, PVTsim Nova is used to simulate the composition change and asphaltene deposition of crude oil. Simulation tests indicate that the content of light components C1-C4 and heavy components C36+ decrease with increasing CO2 and N2 injection volumes. However, the extraction of CO2 is significantly stronger than that of N2. In shallow reservoirs, as the CO2 injection volume increases, the deposition pressure range decreases and asphaltenes are easily deposited. Conversely, the asphaltene deposition pressure of crude oil injected with N2 is higher and will not cause serious asphaltene deposition. When the CO2-N2 injection ratio reaches 1:1, the deposition pressure range shows a significant transition. In buried-hill reservoirs, asphaltene deposition is unlikely to occur with CO2, N2, and a gas mixture injection.
1. Introduction
Gas injection is becoming an increasingly widespread technology used to improve oil production in tertiary oil recovery [1,2]. General injected solvents include CO2, N2, and hydrocarbon gas. The process of gas injection can be miscible or immiscible, which depends on the properties of the reservoir fluid and the injected gas [3]. CO2 has good solubility in crude oil and can easily attain a supercritical condition (31 °C/1070 psi) in reservoir conditions. The density of supercritical CO2 increases drastically to approach the liquid state while the viscosity of supercritical CO2 is close to that of gas [4,5]. Therefore, the CO2-crude oil system easily reaches a miscible or near-miscible state that can eliminate or reduce interfacial and capillary properties, reduce the viscosity of crude oil, swell the oil phase, and improve the flow ability [6]. Additionally, supercritical CO2 has good injectivity when compared to liquid. N2 has a large expansion coefficient that plays an important role in the reservoir energy. However, the extraction of the light and medium components by CO2 and N2 injection can destroy asphaltene equilibria in crude oil and cause asphaltene precipitation/deposition [7].
Asphaltenes are the polydisperse fractions of heavy organics in crude oil that are classically defined as a solubility class. Asphaltenes are soluble components in low-molecular-weight aromatics such as benzene or toluene and is insoluble in low-molecular-weight alkanes such as pentane or heptane [1,8,9,10]. Asphaltenes have a fairly complex structure since they are composed of a distribution of aromatic clusters surrounded by aliphatic chains and heteroatoms, and are characterized as high-molecular-weight, are black to brown in color, have no melting point, and are polar [1,7,11,12]. It is commonly thought that asphaltenes either dissolve in oil or as a colloidal suspension in oil stabilized by resins absorbed on their surface, which are normally at equilibrium in reservoir conditions [1,13]. Furthermore, asphaltene stability depends on the asphaltene/resin content and the properties of the asphaltene itself and the remainder of non-asphaltene fraction. As factors including temperature, pressure, composition of crude oil, and the introduction of solvent change during oil production, the equilibrium may be disrupted [9]. Once asphaltene stability is destroyed, asphaltene deposition may occur. The process of asphaltene deposition can be divided into three stages: precipitation, flocculation, and deposition. The first stage occurs when the solid particles come out of the solution and form a distinct phase. At this stage, the size and quantity of particles may be quite small. The second stage involves a process of the small solid particles clumping together and growing larger. Lastly, the third stage is the point at which the particles are too large to be supported by the oil phase and therefore settle out on the rock’s surface [1].
The problem of the asphaltene-deposition-induced formation damage during oil production is increasingly emphasized in the petroleum industry. Asphaltene deposition can occur not only inside the reservoir but also in the wellbore, tubing, and surface facilities, which can plug the porous media, reduce the permeability of the reservoir, and damage the production equipment [14,15,16]. It is especially severe when accompanied by gas injection during oil production. Therefore, gas-injection-induced phase behavior change of asphaltenes is a significant matter requiring research.
Experimentally determining the thermodynamic conditions at which asphaltene deposition occurs would be ideal. However, the experiments require a large amount of on-site live oil (crude oil that maintains the original thermodynamic state of the reservoir), which is prohibitively expensive and live oil sometimes cannot be obtained for experiments. Thus, in order to determine the thermodynamic conditions of asphaltene deposition more intuitively and conveniently, a prediction model can be established according to the obtained experimental data and the law of thermodynamic changes. Various model approaches have been suggested in the literature for predicting asphaltene deposition such as solubility models, solid models, colloidal models, and associations of the equation of state (EOS) models [17,18,19,20,21]. Solid models proposed by Nghiem et al. were completely based on the EOS and the gas-liquid-solid equilibrium calculation method was used to determine the change in fugacity caused by temperature, pressure, and volume changes. Therefore, the phase state of asphaltenes can be determined by comparing the fugacity coefficients of asphaltenes in three phases and, ultimately, the thermodynamic conditions of asphaltene deposition can be determined [19]. Through analysis of the existing prediction model of asphaltene deposition, solid models were selected in this paper. The asphaltenes were considered to be a solid phase, and the asphaltene deposition problem was treated by liquid-solid equilibrium.
When the temperature, pressure, and composition of the crude oil change, asphaltene deposition occurs due to the broken phase equilibrium of the system. In order to determine the asphaltene deposition conditions, the complex multi-phase equilibrium of the system is involved. It was necessary to introduce the EOS for phase equilibrium calculation. For the gas, liquid, and solid three-phase equilibrium of the system, the cubic EOS is better especially when represented by the Soave-Redlich-Kwong (SRK) and Peng-Robinson (PR) equations. Past studies have proven that the PR equation is particularly suitable for the asphaltene flocculation and deposition calculation [22,23,24]. Since the composition of crude oil is complicated, obtaining its detailed chemical composition is difficult. Therefore, the critical parameters in the EOS are generally treated with some special mathematical methods called the characterization method, which includes the estimation of critical parameters (critical temperature, critical pressure, and critical volume), calculation of the interaction coefficient, and division of pseudo-components.
Researchers have investigated the law of asphaltene deposition through experimental study and numerical simulation over many years. Srivastava et al. investigated the likelihood of asphaltene deposition through dynamic and static precipitation tests conducted in reservoir conditions in the Weyburn reservoir (Southeast Saskatchewan, Canada). The studied observations indicated that the most important factor on which the asphaltene precipitation depended was the CO2 concentration, which was proportional to the initial asphaltene contents of the oil [25]. Muhammad et al. developed a simple model approach to determine the asphaltene stability envelope associated with CO2 injection, which was based on the Flory-Huggins polymer-solution theory and the Hildebrand solubility concept. The proposed model was verified by various experimental data in the literature [14]. Camilo et al. calculated the asphaltene precipitation pressure to predict the asphaltene precipitation in a reservoir by using differential liberation and refractive index (RI) data of the oil. The researchers investigated the effect on inhibiting the asphaltene deposition of cardanol. The results of this study showed that the asphaltene precipitation onsets (APO) of the crude oil were 2.06, 2.30, and 6.02 mL n-heptane/g of oil and cardanol was an effective inhibitor of asphaltene precipitation [26]. Ram et al. investigated the effect of pressure-depletion-induced asphaltene precipitation on interfacial properties of live-oil, brine, and quartz systems as well as the hysteresis of the contact angle after aging in high pressure and high temperature (HPHT) conditions. They pointed out that the contact angle decreases with pressure, which indicates a wettability alteration due to asphaltene precipitation under pressure depletion [27]. Davudov et al. discussed the effect of permeability reduction as a function of combined effects of surface deposition and interconnectivity loss. OLGATM was used to define the shift in critical particle sizes in research regions. Results indicated that both surface deposition and pore throat plugging seem to contribute fairly equally to permeability reduction in sandstone. In the case of carbonate, pore blockage seems to be mainly dominant [28]. Afra et al. researched the influence of heteroatoms on the asphaltene precipitation mechanism by conducting elemental analysis, and evaluated the sensitivity of asphaltene constituents stacking to extraction methods. Then, asphaltene precipitation onset was determined by using near-infrared (NIR) spectroscopy. Results revealed the substantial impact of various precipitants and solvents on asphaltene aromaticity and its propensity toward self- association [29]. Shen and Sheng investigated the size of asphaltene precipitated during CO2 and CH4 injection in a shale oil sample by using a nanofiltration technique. Results showed that a higher injected CO2 and CH4 concentration caused more asphaltene precipitation and growth in asphaltene aggregates size, and the particle size was large enough to cause pore-blocking [30]. However, few studies have quantitatively studied the effect of the injection volume and the ratio of CO2 and N2 on the degree of asphaltene deposition. Additionally, in the process of gas injection, especially CO2 and N2 huff and puff, the possibility of asphaltene deposition is greater due to the long acting time and the concentrated acting range. Therefore, researching asphaltene deposition induced by gas injection is important.
The objective of this paper was to investigate the condition of asphaltene deposition (pressure and temperature) with different injection volumes and ratios of CO2 and N2 using a numerical simulator software called PVTsim Nova. In this paper, the composition change induced by CO2 and N2 injection is also studied to further analyze the mechanism of asphaltene deposition.
2. Experiments
2.1. Flash Separation Experiments
Flash separation experiments are also known as single-gas degassing experiments which instantaneously form single-phase crude oil in the reservoir temperature and pressure conditions by flashing to atmospheric conditions. Then the volume and gas-liquid quantity changes are measured. The total composition of the crude oil during the separation of oil and gas are kept constant.
Experimental devices included a mercury-free visualization plunger type high-pressure pressure, volume, and temperature (PVT) device and an Agilent (Wilmington, DE, USA) gas chromatograph, which are shown in Figure 1. The mercury-free visualization plunger type high-pressure PVT device consisted of a PVT cell, an observation and recording system, a constant temperature air bath, a pressure sensor, a temperature sensor, a sample cylinder, a high-pressure metering pump, and an operating control system. The PVT cell is a plunger type cell whose volume change can be controlled by a precision motor driven plunger by the computer. The Agilent gas chromatograph was used to determine the composition of crude oil whose test range reaches up to C80.
The oil samples were obtained from a shallow reservoir and buried-hill reservoir in the Jidong Oil Field in China. The gas/oil ratio of crude oil in the shallow reservoir was 20 m3/m3 at reservoir temperature of 338.15 K (65 °C) and the initial reservoir pressure was 18.23 MPa. The gas/oil ratio of crude oil in the buried-hill reservoir was 152.9 m3/m3 at a reservoir temperature of 434.95 K (161.8 °C) and the initial reservoir pressure was 43.12 MPa.
The detailed experimental procedure for crude oil samples in a shallow reservoir include the following. We cleaned and vacuumed the high-pressure PVT analyzer at 338.15 K (65 °C). Then, we transferred a certain amount of crude oil sample in the shallow reservoir maintained in a single phase to the PVT analyzer and maintained it at 338.15 K (65 °C) for more than 4 h. We pressurized the crude oil sample to the reservoir pressure (18.23 MPa) and mixed it sufficiently to make it a stable single phase. Next, we released a certain volume of crude oil sample and maintained the reservoir pressure invariable. Afterward, we measured the volume of extracted gas and weighed the released oil sample in which we ultimately tested the factors including the gas-oil ratio, the formation oil density, and the formation oil volume coefficient. We then analyzed the composition of the oil phase and gas phase separated from the crude oil sample by using an Agilent gas chromatograph, tested the density of the flash oil, and calculated the composition of the crude oil according to the gas/oil ratio. The composition of crude oil samples in the shallow and buried-hill reservoir were obtained from flash separation experiments conducted by the previously mentioned five steps.
2.2. Asphaltene Deposition Simulation in the PVTsim Nova
PVTsim Nova is a versatile PVT simulation program developed by Calsep (Copenhagen, Denmark) for reservoir engineers, flow assurance specialists, PVT lab engineers, and process engineers. Based on extensive data material collected over a period of more than 30 years, PVTsim Nova inputs the information from experimental PVT studies into simulation software in a consistent manner without losing valuable information. It allows reservoir engineers, flow assurance specialists, and process engineers to combine reliable fluid characterization procedures with robust and efficient regression algorithms to match fluid properties and experimental data. The fluid parameters may be exported to produce high quality input data for the reservoir, the pipeline, and the process simulators.
The composition and physical properties of crude oil in shallow and buried-hill reservoirs can be obtained from flash separation experiments. The PR equation was selected as the EOS for the phase equilibrium calculation in the simulation process, which can be chosen in the operating interface. The molar volume content of hydrocarbon components C1-C36+ and non-hydrocarbon gas components, such as N2, CO2, and H2S were inputted into the New Plus Fluid function in the Fluid option under the Fluid Management module and then normalized. The relative molecular mass and density of the C36+ component was also inputted as the basis for the splitting pseudo-component. Due to the complex composition of crude oil, there are too many components if it is calculated according to a single carbon atom, which are not conducive to the solution of the PR equation. Therefore, it was necessary to artificially divide the crude oil into several components according to the properties of every single component, which is called the pseudo-component. The principle of splitting the pseudo-components is as refined as possible, but it is guaranteed to be solved for the EOS. The composition and critical parameters of pseudo-components in crude oil can be obtained using the Split Pseudo function. Subsequently, the molar volume content of CO2 and N2 in crude oil was changed to 5, 10, 15, 20, 25, 30, 35, and 40 mol % and was continuously normalized until the molar volume content of CO2 and N2 reached the target value and the total molar volume content of each component was 100%. At this time, the composition of crude oil with a different gas injection volume was acquired. Next, Asphaltene in the Flow Assurance option under the Simulations module was selected to simulate the asphaltene deposition of the previously generated composition. Fitting the asphaltene content in crude oil injected CO2 and N2 according to the experimental data was necessary to split C50+ components into asphaltene and non-asphaltene. The asphaltene components in the PVTsim Nova by default are considered to be the aromatic part of the C50+ fraction, which can accurately determine the asphaltene content. After the preparation and amendment, the asphaltene deposition simulation began in the Asphaltene where the relationship curve of temperature and pressure for asphaltene deposition were obtained. By selecting the asphaltene deposition pressure value at the target temperature (65 °C and 161.8 °C), the asphaltene deposition pressure (maximal deposition pressure, saturation pressure, minimal deposition pressure, and the deposition pressure range) curve of crude oil with different CO2 and N2 injection volumes was obtained. Lastly, according to the above method, the composition of crude oil injected in the 40 mol % gas mixture was simulated with injection ratios of CO2-N2 of 1:9, 3:7, 1:1, 7:3, and 9:1. The asphaltene deposition pressure curve (maximal deposition pressure, saturation pressure, minimal deposition pressure, and the deposition pressure range) of crude oil was also simulated after injecting different ratios of the gas mixture.
3. Results and Discussion
3.1. Effect on the Composition Change of CO2 and N2 Injection in the Shallow Reservoir
The composition of the crude oil in the shallow reservoir, which was measured by flash separation experiments, is shown in Table 1. The molecular weight of C36+ is 672.7 and the density of C36+ is 0.958 g/cm3.
The composition of crude oil was inputted into the New Plus Fluid in the Fluid option under the Fluid Management module. Then the composition and critical parameters of pseudo-components in crude oil were obtained using the Split Pseudo function (Table 2). In this paper, the composition of crude oil in the shallow reservoir was split into 21 pseudo-components in the PVTsim Nova. C48–C53-A, C54–C63-A, and C64–C80-A were the asphaltene components of C50+ components.
The composition of crude oil with different CO2 and N2 injection volumes was simulated by inputting the composition of crude oil into the PVTsim Nova. The molar volume content change of the light hydrocarbon components (C1–C4) and the heavy hydrocarbon components (C36+) induced by CO2 and N2 injection are shown in Table 3.
As seen from Table 3, the content of the light hydrocarbon component C1–C4 and heavy hydrocarbon component C36+ decreased with an increasing CO2 injection volume. The reason for this phenomenon is that CO2 reaches a supercritical state in the simulated temperature and pressure conditions and phase properties of CO2 change considerably. Supercritical CO2 has a strong solubility in crude oil because the density of supercritical CO2 is close to that of liquid while the diffusion coefficient of supercritical CO2 is significantly larger than that of liquid due to its viscosity being close to that of gas. Thus, the mass transfer ability of supercritical CO2 is fairly strong. In the process of CO2 injection, CO2 dissolves in crude oil. However, CO2 also extracts the light hydrocarbon components from crude oil into the gas phase. When this dynamic process reaches equilibrium, crude oil and CO2 are miscible, which is an important mechanism for enhancing oil recovery of CO2 flooding.
The stability of asphaltenes in crude oil is mostly related to the composition of crude oil. The colloid absorbed around the asphaltene, which plays a role in physical encapsulation, is dissolved due to the composition change of crude oil caused by a CO2 injection. The colloidal-asphalt stabilized structure is destroyed and the charged polarity asphaltene molecules are aggregated by an electrostatic action. As the size of the asphaltene particles continues to increase, asphaltene deposition occurs.
By changing the molar volume content of N2, the composition of crude oil with different N2 injection volumes was simulated. The composition change is shown in Table 3. Based on the table, the molar volume content of the light hydrocarbon component C1–C4 and heavy hydrocarbon component C36+ decreased with an increasing N2 injection volume, but the extraction of light hydrocarbon components by N2 was weaker than that of CO2. According to the theory of similarity and intermiscibility [22], N2 has weak solubility in crude oil whose corresponding weak mass transfer capacity leads to the weak extraction of light hydrocarbon components. With the increase in the N2 injection volume, the process of dissolution and extraction between N2 and crude oil continues and the content of light components in crude oil decreases continuously while the ratio of heavy components increases. The solubility of N2 in heavy hydrocarbon components is obviously weaker than solubility in the light hydrocarbon components. As the amount of dissolution decreases, the extraction continues to decrease.
3.2. Effect on Asphaltene Deposition Pressure of CO2, N2 and Gas Mixture Injection in a Shallow Reservoir
After fitting the asphaltene content of crude oil with different CO2 and N2 injection volumes, the pressure-temperature relationship curve (PT curve) of asphaltene deposition was delivered. According to the PT curve, the asphaltene deposition pressure change of crude oil with different CO2 and N2 injection volumes at 65 °C was obtained.
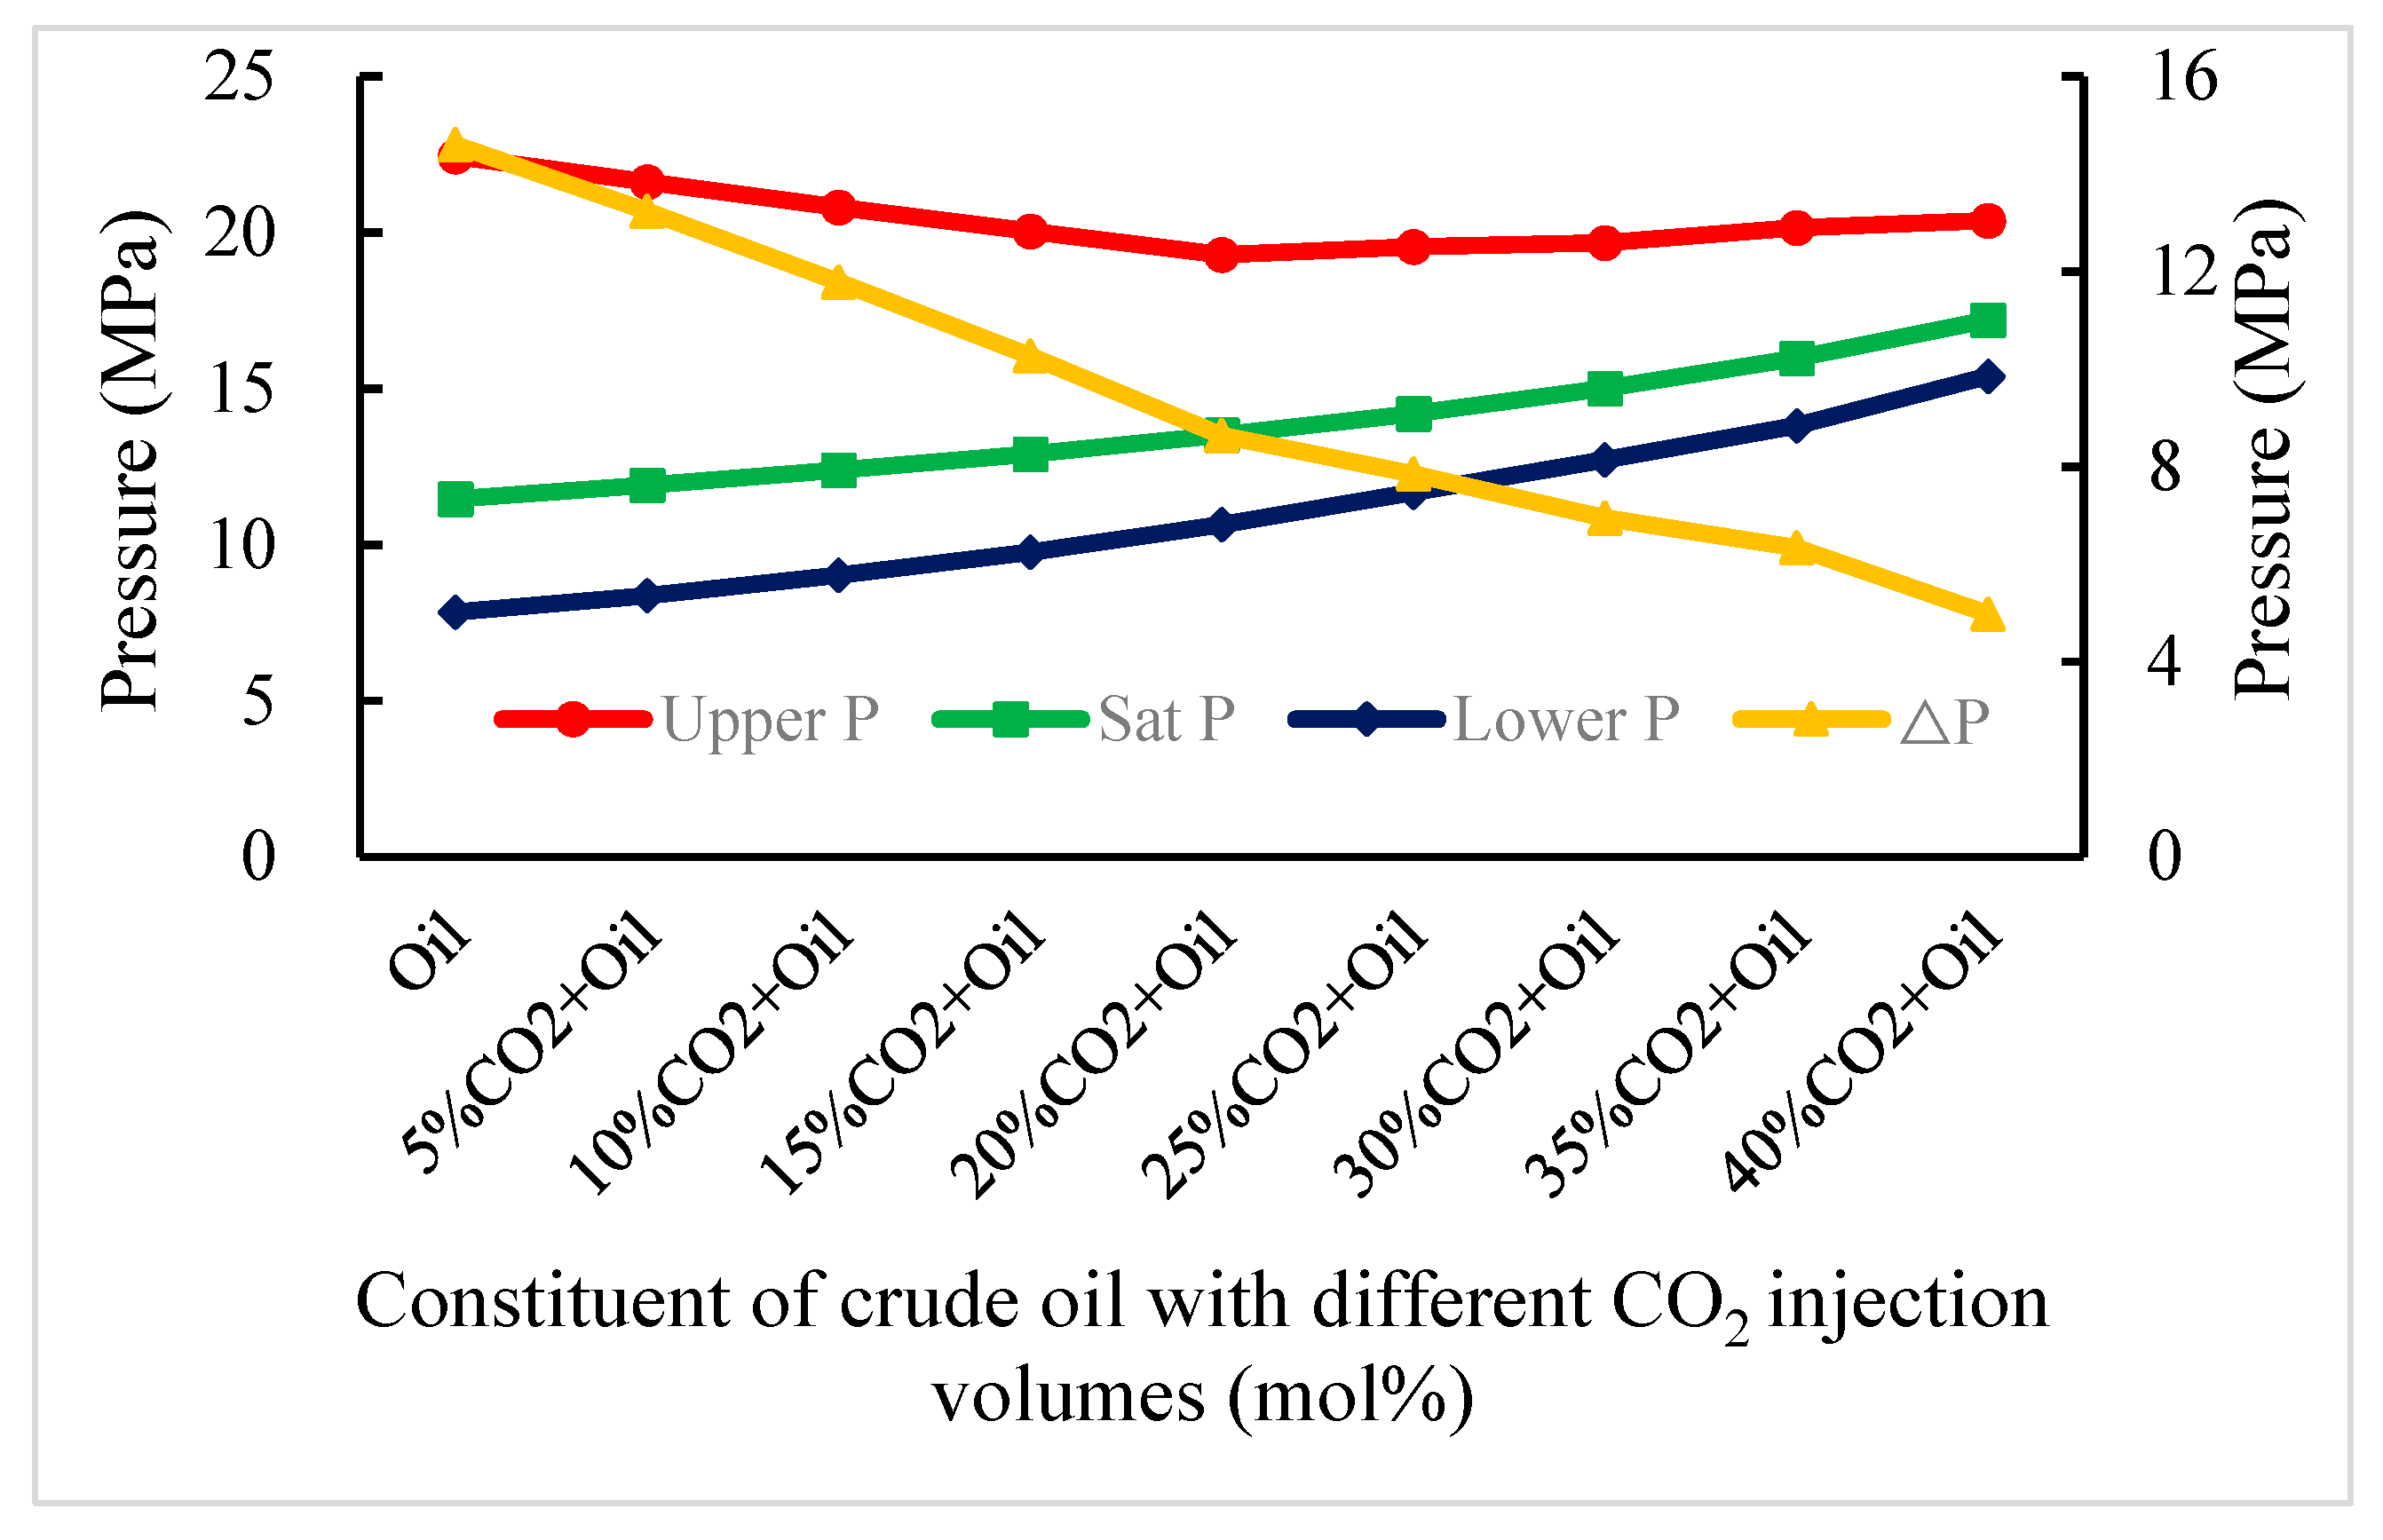
Figure 2 shows the asphaltene deposition pressure change with different CO2 injection volumes at 65 °C. The lines of maximal deposition pressure (Upper P), saturation pressure (Sat P), and minimal deposition pressure (Lower P) address the primary y-axis and the line of the deposition pressure range (ΔP) denotes to the secondary y-axis. The information for the primary y-axis and secondary y-axis in Figure 3 and Figure 4, respectively, is the same as in Figure 2. With the increase in CO2 injection volume, maximal deposition pressure of asphaltenes first decreased and then increased at 65 °C. Saturation pressure and minimal deposition pressure all increased when the injection volume of CO2 increased while the deposition pressure range decreased with increasing CO2 injection volume.
The regularity of asphaltene deposition is explained in the following description. The colloid in crude oil is an amphiphilic molecule and each end is respectively connected with the oil phase and the asphaltenes to form a stabilized structure. The colloid plays an important role in physical encapsulation that is adsorbed around the asphaltene core to form a solvation layer. As the CO2 injection volume increases, the content of light hydrocarbon components in crude oil gradually decreases due to the extraction of CO2 and the colloid begins to dissolve, which resulted in the destruction of the stable structure of colloidal-asphalt. Then, the flocculation and deposition of asphaltenes start to occur. With an increasing CO2 injection volume, the maximal deposition pressure of asphaltene gradually decreased, the minimal deposition pressure gradually increased, and the asphaltene deposition forms more easily. When the CO2 injection volume reached 20 mol %, the dynamic process of dissolution and mass transfer was balanced, and the maximal deposition pressure of asphaltene reached a minimum. With the continual increase in the CO2 injection volume, CO2 could not sustain mass transferring with light hydrocarbon components in crude oil and began to inhibit asphaltene deposition when the system pressure gradually increased. At this point, the deposition pressure range shrank with the asphaltene dissolving capacity in crude oil.
Figure 3 shows the change in the asphaltene deposition pressure with different N2 injection volumes at 65 °C. Maximal deposition pressure, saturation pressure, and minimal deposition pressure all increased when the N2 injection volume increased and the increment in pressure was much greater than the CO2 and crude oil system. Moreover, with the increase in the N2 injection volume, the deposition pressure range decreased first and then increased. Based on these simulation results, N2 has poor solubility in crude oil and has a short process of dissolution and mass transfer in crude oil when compared with CO2, and the extraction of light hydrocarbon components was poor. When the N2 injection volume reached 5 mol %, the dynamic process of dissolution and mass transfer reached equilibrium and the deposition pressure range reached the minimum. With the N2 injection volume continually increasing, the pressure of the system increased rapidly due to the large compression coefficient and strong expansion capacity of N2, which means N2 plays a role in complementing the reservoir energy. Additionally, as the system pressure increased, the difficulty of asphaltene deposition gradually increased and N2 injection did not cause serious asphaltene deposition.
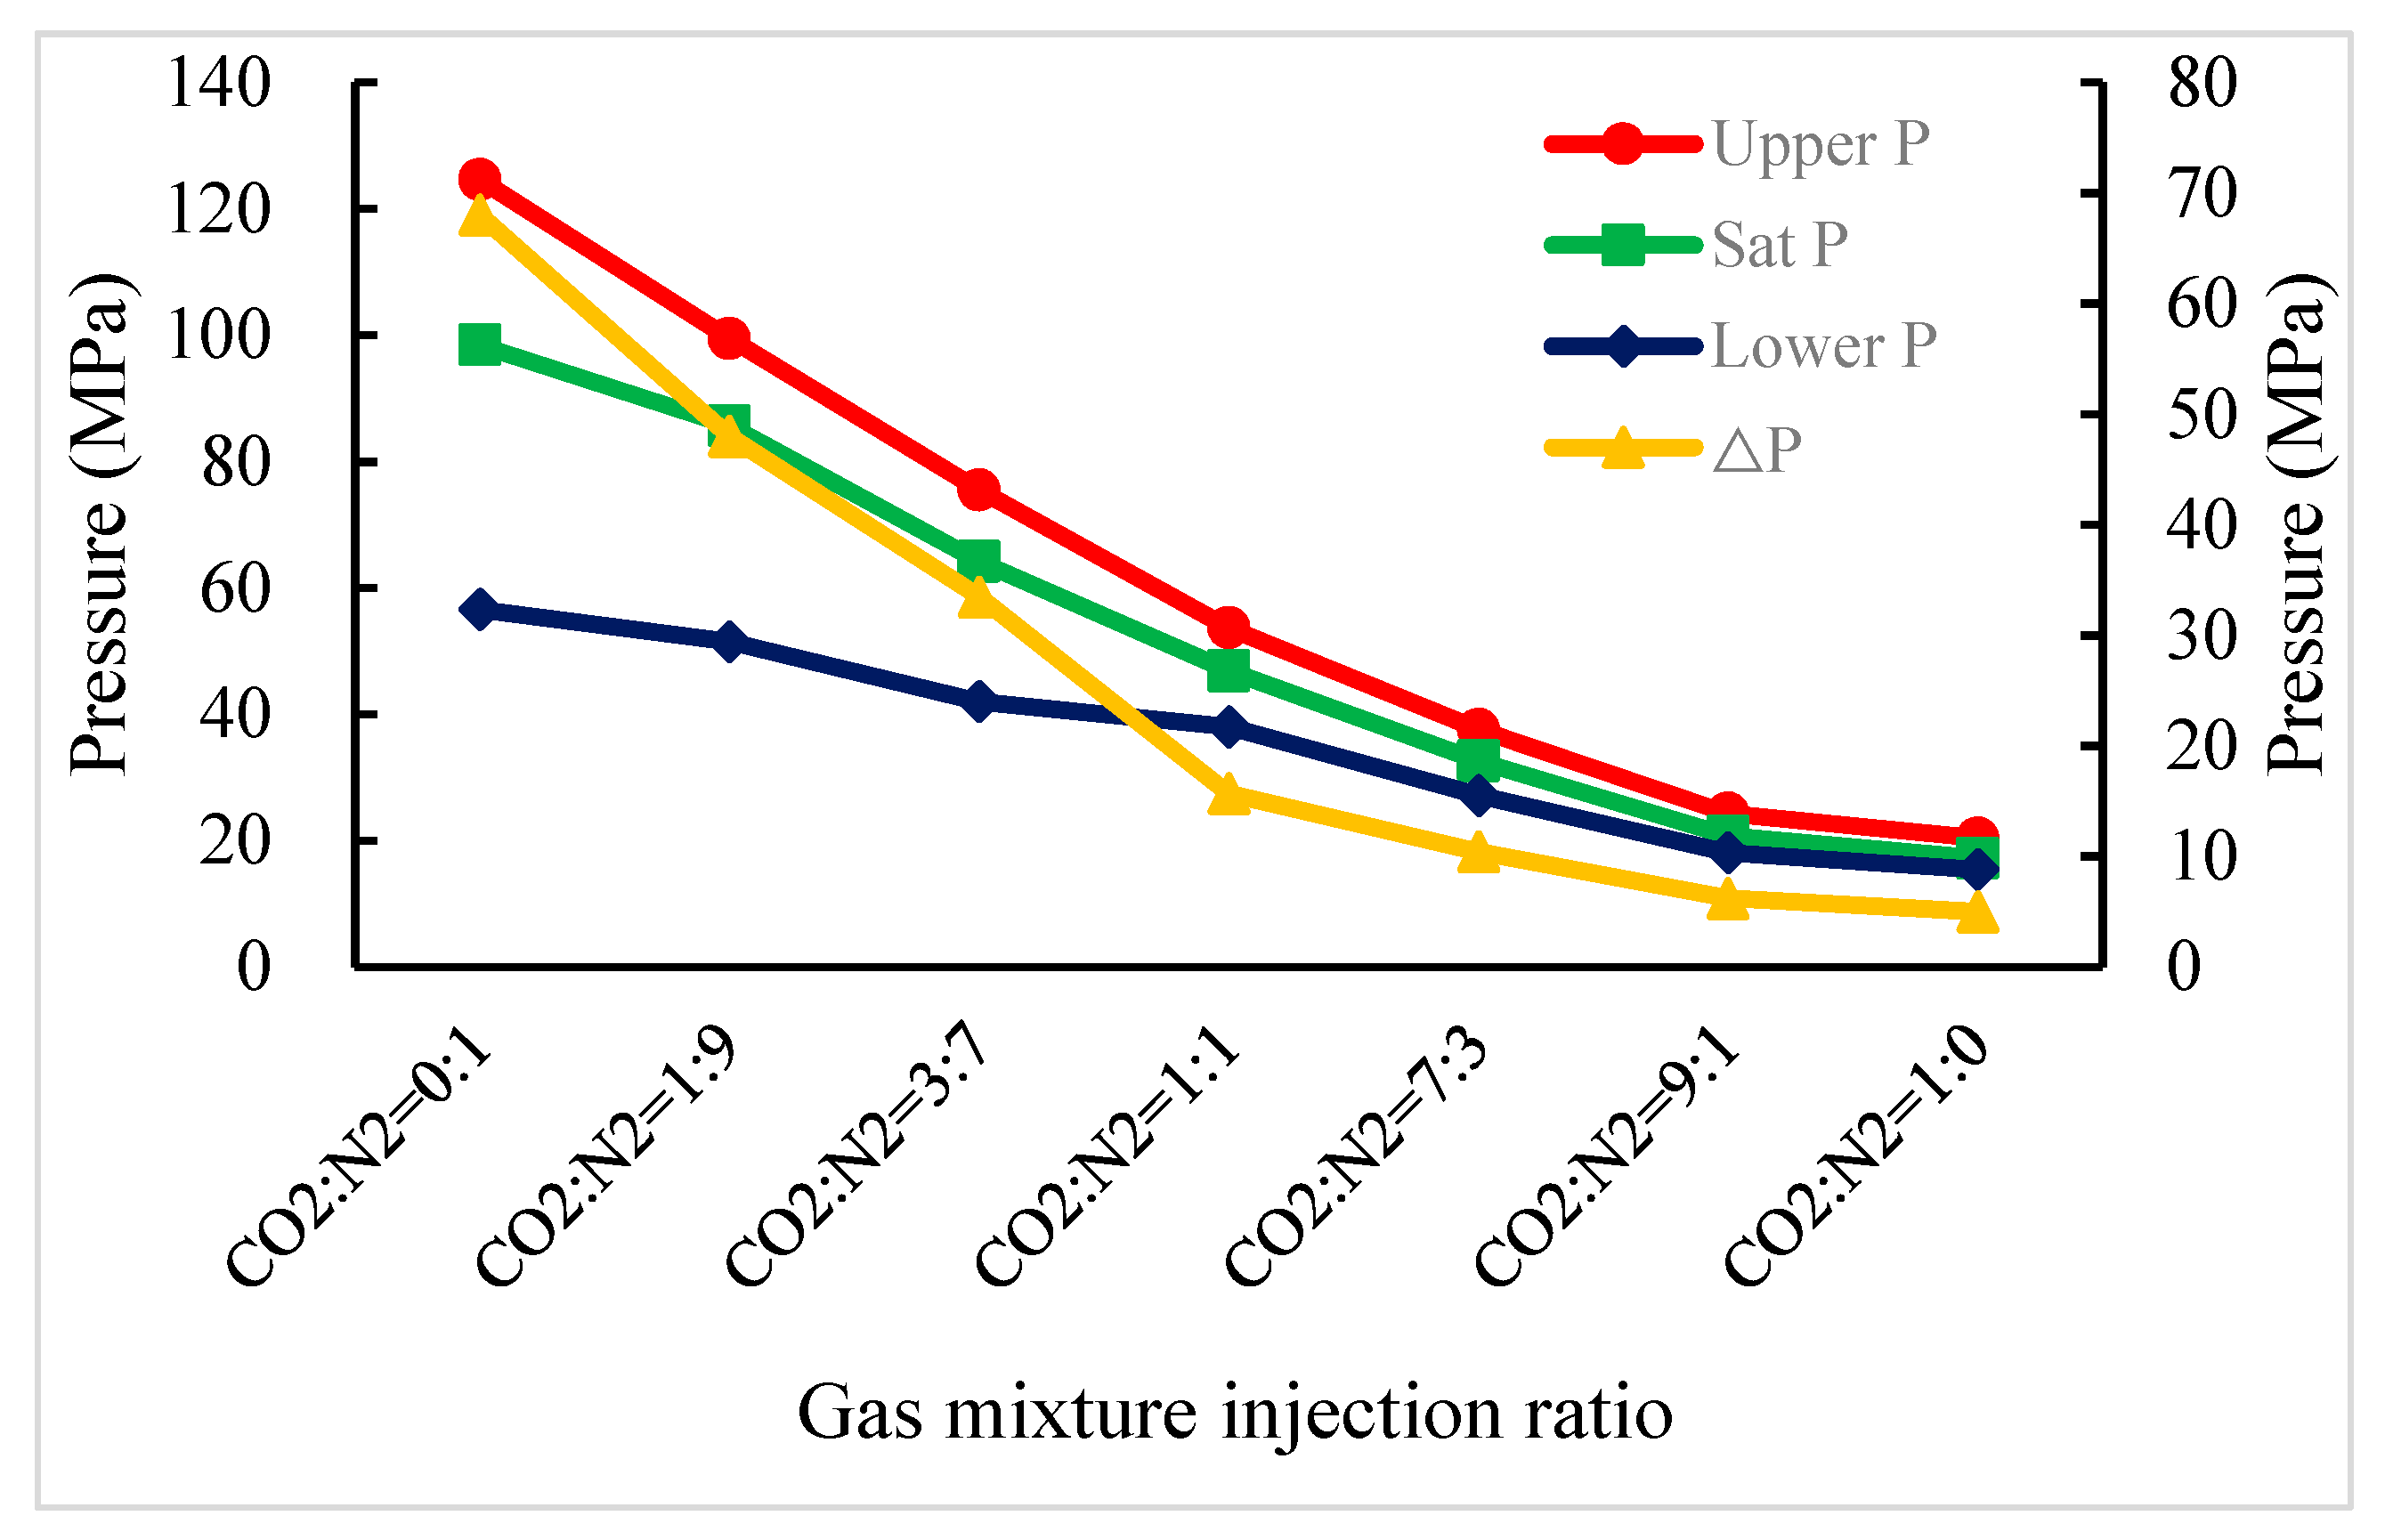
The PT curve of asphaltene deposition injected with different ratios of gas mixture in the same injection volume were simulated based on the method of injecting different volumes of CO2 and N2 into crude oil. Then, according to the PT curve, the asphaltene deposition pressure curve (Figure 4) with a 40 mol % injection volume of the gas mixture in different ratios was obtained. As shown in the figure, the maximal deposition pressure, the saturation pressure, and the minimal deposition pressure all decreased when the ratio of CO2 in the gas mixture increased. The deposition pressure range generally decreased with the increasing ratio of CO2 in the gas mixture. Before the CO2: N2 gas injection ratio reached 1:1, the diminution of the deposition pressure range was large. When the CO2: N2 gas injection ratio reached 1:1 and the reduction in the deposition pressure range significantly decreased. The reason for this finding is that N2 plays a leading role in the gas mixture-crude oil system when the ratio of N2 in the gas mixture is higher. The gas mixture-crude oil system has a high pressure due to a large expansion coefficient and poor extraction of N2. As the ratio of CO2 in the gas mixture increased, the dissolution and mass transfer processes of CO2 and crude oil continued and the content of light hydrocarbon components in crude oil decreased. Subsequently, the colloid-asphalt stabilized structure was destroyed and asphaltene deposition occurred, which caused the deposition pressure range to increasingly shrink. When the CO2: N2 gas injection ratio reached 1:1, and the CO2 injection volume was 20 mol %, the process of dissolution and mass transfer of CO2 and crude oil was balanced and the turning point of the deposition pressure range occurred. As the ratio of CO2 in the gas mixture continually increased, CO2 played a leading role in the system and the deposition pressure range continued to shrink. Otherwise, N2 would have a greater influence on the system pressure, and as the N2 injection volume decreased, the system pressure would decrease.
3.3. Effect of CO2 and N2 Injection on the Composition Change in a Buried-Hill Reservoir
The composition of crude oil in a buried-hill reservoir was measured by flash separation experiments and is shown in Table 4. The molecular weight of C36+ is 545.6 and the density of C36+ is 0.9597 g/cm3.
The composition and critical parameters of pseudo-components in crude oil (Table 5) were obtained using the Split Pseudo function. In this paper, the composition of crude oil in a buried-hill reservoir was split into 19 pseudo-components in the PVTsim Nova. C41–C77-A was the asphaltene component of C50+ components.
In the process of gas injection to enhance oil recovery, especially with regard to CO2 and N2 huff and puff, which had a long acting time and a concentrated acting range, it was necessary to simulate more CO2 and N2 injection volumes to determine the effect on asphaltene deposition under conditions of a low heavy hydrocarbon component of crude oil in buried-hill reservoirs. The composition of crude oil with CO2 and N2 injection in buried-hill reservoirs was simulated following the process used for a shallow reservoir. The simulation results are shown in Table 6. Compared to crude oil samples in a shallow reservoir, crude oil in a buried-hill reservoir is a conventional light oil, which has characteristically low density, low viscosity, low sulfur content, medium and high wax content, and medium content of colloidal/asphaltene according to fluid property data. When the CO2 and N2 injection volume increases, the content of the light hydrocarbon component C1–C4 and heavy hydrocarbon component C36+ decreased, but the extraction of light hydrocarbon components by N2 was weaker than that of CO2. CO2 had a strong extraction of the light components, which reached a supercritical state in the simulated temperature and pressure conditions. However, N2 had weak solubility in crude oil whose corresponding weak mass transfer capacity led to the ability to extract light hydrocarbons weakly.
3.4. Effect of CO2, N2 and Gas Mixture Injection on the Asphaltene Deposition Pressure in a Buried-Hill Reservoir
The change in asphaltene deposition pressure injected with different CO2 and N2 injection volumes at 161.8 °C were simulated, which was described in Section 3.2 (Figure 5). Based on these simulation results, asphaltene deposition was unlikely to occur during CO2, N2, and gas mixture injection, and the saturation pressure increased when the CO2 and N2 injection volume increased. There are two reasons for this phenomenon. First, the content of heavy components in crude oil was very poor, which means asphaltene deposition was likely prevented from occurring. Second, the temperature and pressure conditions in a buried-hill reservoir may inhibit the process of dissolution and mass transfer of CO2 and N2 with crude oil, which means the structure of colloidal-asphalt would steadily be destroyed. Otherwise, N2 has a large compression coefficient that causes the saturation pressure value and its increases would be higher than that of CO2 with an increasing injection volume.
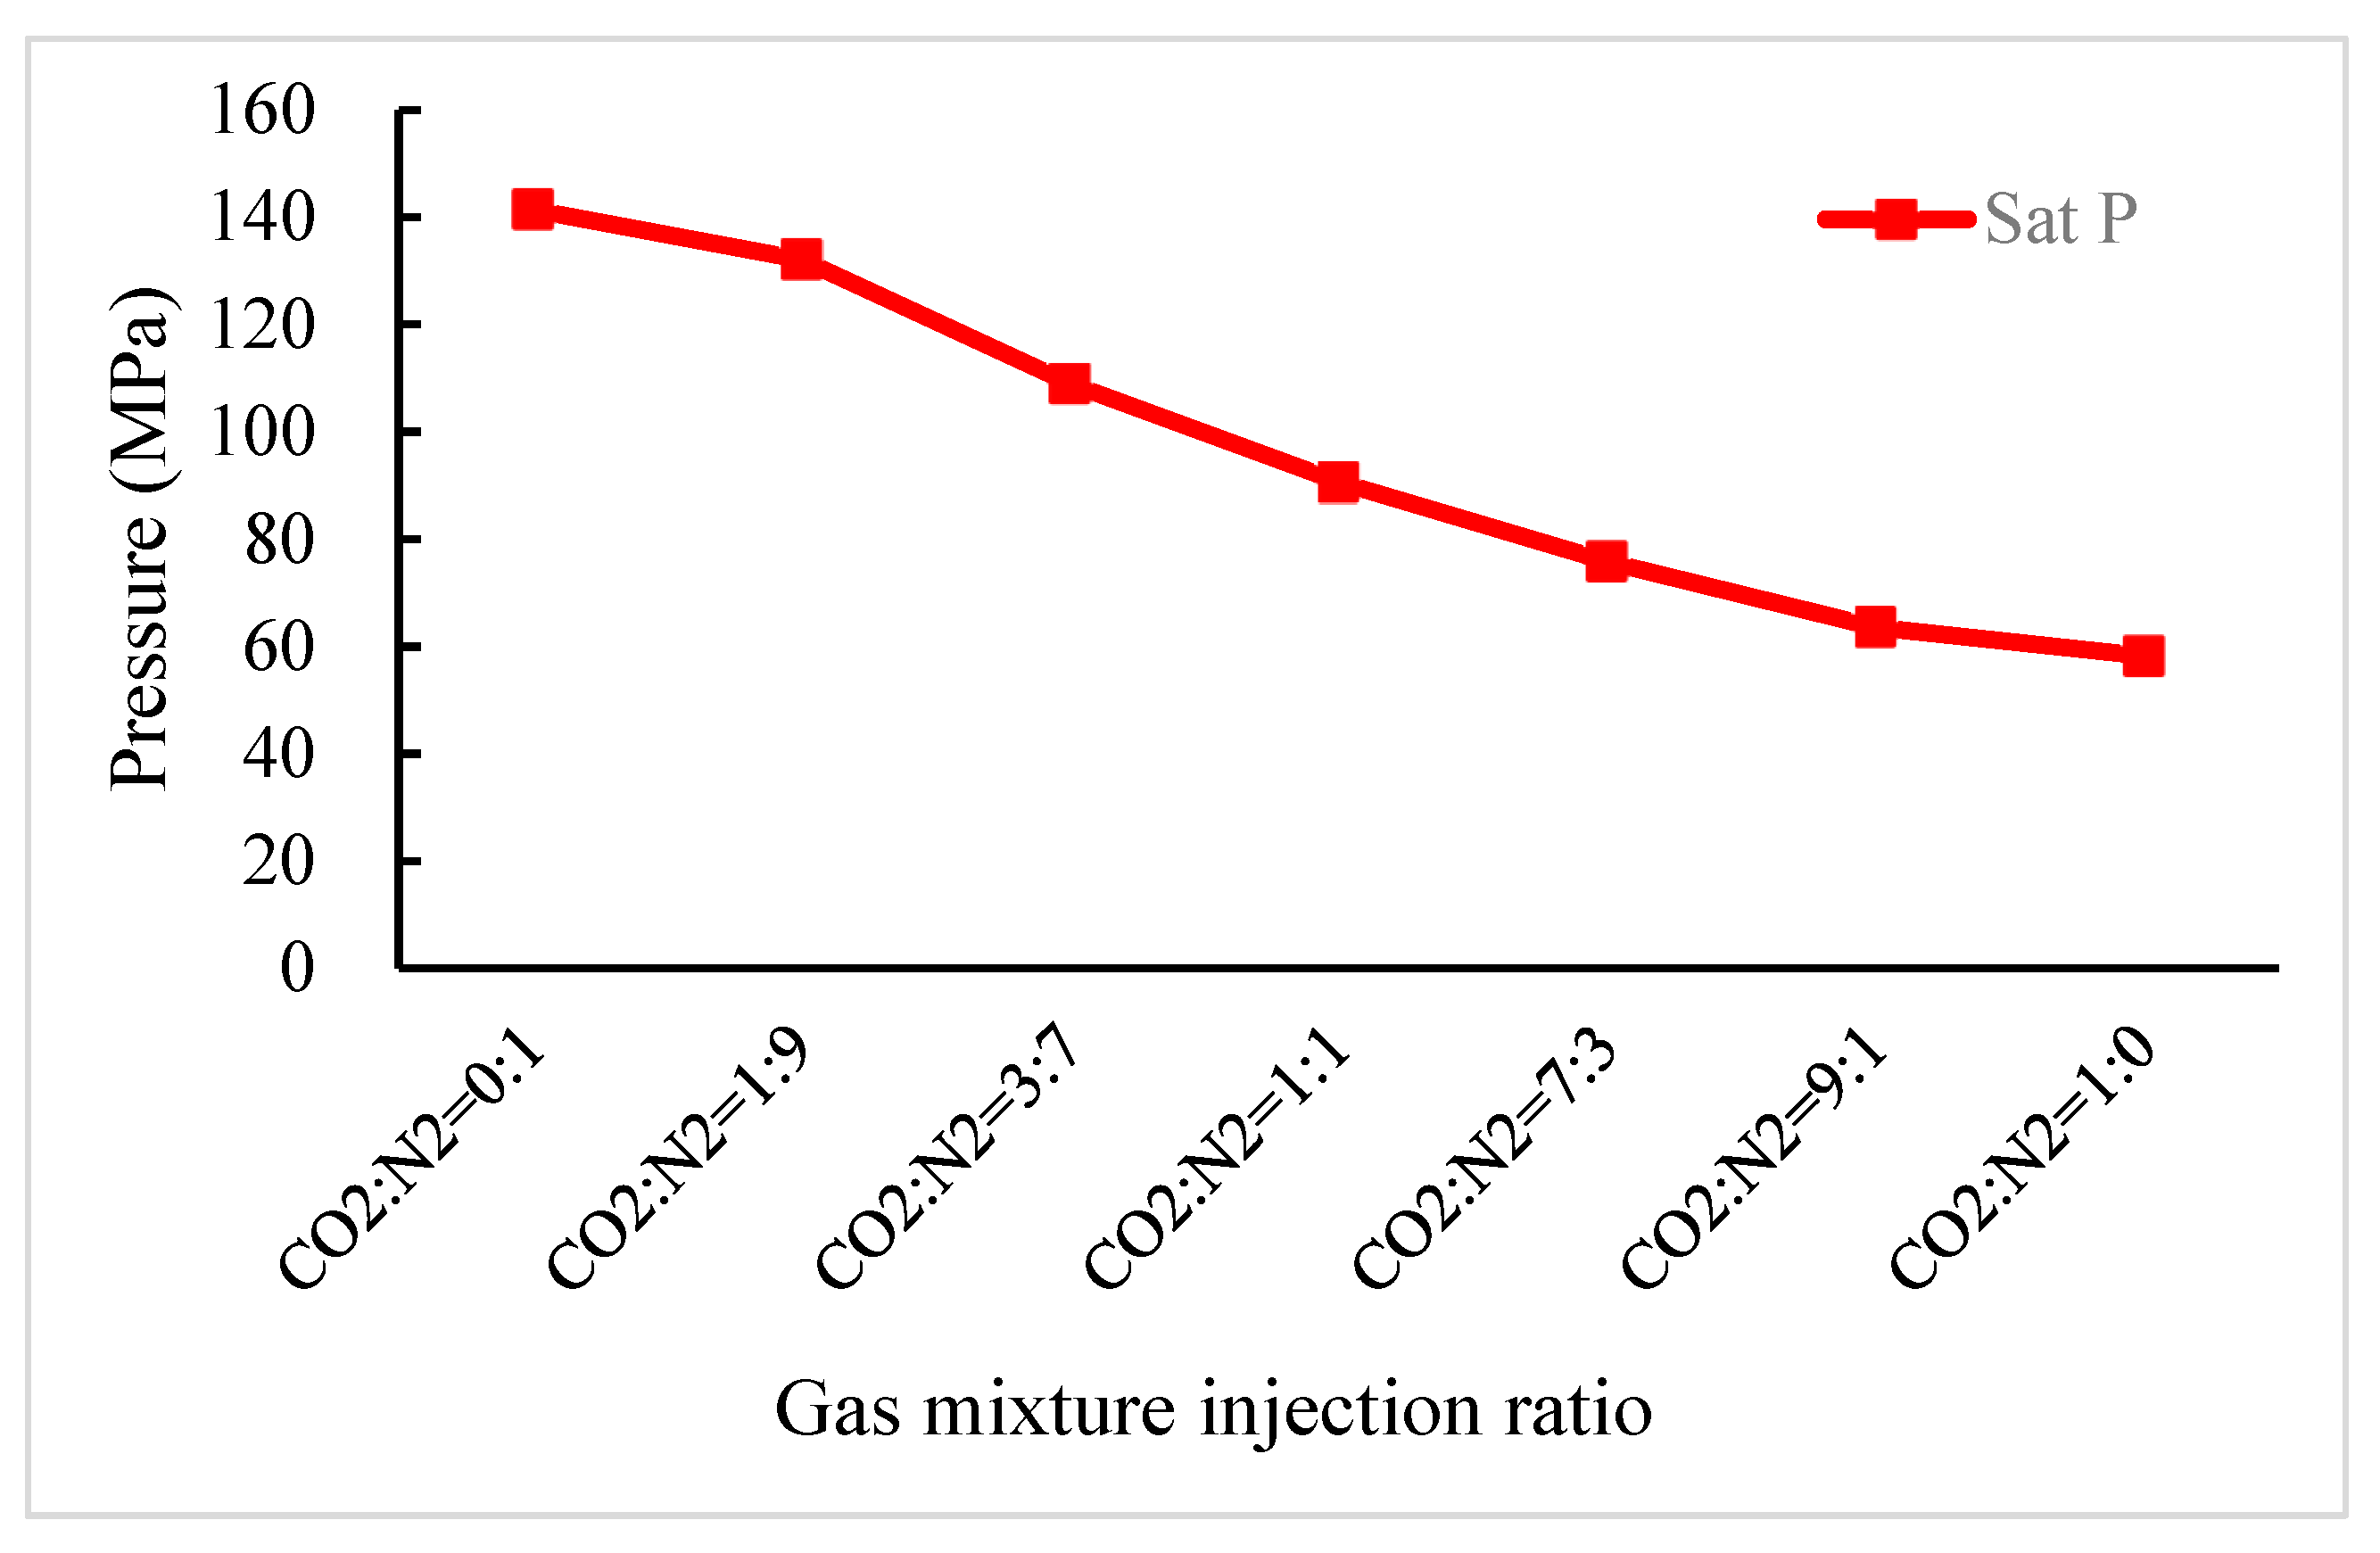
The PT curve of asphaltene deposition injected with different ratios of a gas mixture in the same injection volume was simulated based on the method reported in Section 3.2. Then, according to the PT curve, the asphaltene deposition pressure curve (Figure 6) with 40 mol % gas mixture in different ratios was obtained. From the figure, asphaltene deposition was unlikely to occur with different gas mixture injection ratios, and the saturation pressure decreased with an increasing ratio of CO2 in the gas mixture. The poor asphaltene content in crude oil and the harsh reservoir conditions are the two main factors inhibiting the asphaltene deposition.
4. Conclusions
Asphaltene deposition is a severe problem during oil production, which may not only lead to formation damage that plugs reservoir formation and reduces porosity and permeability, but also influences production facilities such as the wellbore, tubing, and pumps. Gas injection can destroy the stability of asphaltenes in crude oil, which may induce asphaltene deposition. Therefore, researching the possibility of asphaltene deposition induced by gas injection is important. In this paper, numerical simulation was performed to confirm the effect of CO2, N2 and gas mixture injection on the asphaltene deposition pressure in reservoir conditions. Simulation results demonstrated that the content of the light hydrocarbon component C1–C4 and heavy hydrocarbon component C36+ in crude oil decreased with increasing CO2 and N2 injection volumes. CO2 and N2 have an extraction effect on light hydrocarbon components that may destroy the colloidal-asphalt stabilized structure, which can trigger asphaltene deposition. In the reservoir temperature and pressure conditions of shallow reservoirs, CO2 injection will cause an asphaltene deposition and, as the CO2 injection volume increases, the deposition pressure range will be reduced, and the asphaltene will be easily deposited. The asphaltene deposition pressure of crude oil injected with N2 is higher. N2 injection increases the pressure of the N2 and crude oil system, which complements the reservoir energy and will not cause serious asphaltene deposition. Maximal deposition pressure, saturation pressure, minimal deposition pressure, and a deposition pressure range all decrease with the increasing ratio of CO2 in the gas mixture. When the CO2:N2 injection ratio reached 1:1, the process of dissolution and mass transfer of CO2 and crude oil was balanced and the deposition pressure range curve showed a significant transition. Asphaltene deposition with CO2, N2, and a gas mixture injection is due to the fluid properties and reservoir conditions of buried-hill reservoirs.
Author Contributions
Formal analysis, P.W. Investigation, P.W. Methodology, P.W. Project administration, F.Z. and J.H. Resources, F.Z. and J.H. Supervision, F.Z. Writing—original draft, P.W. Writing—review & editing, G.L., M.Z. and Z.W.
Funding
The project was supported by China National Major Technology Projects (2017ZX05032-004 and 2017ZX05009-004).
Acknowledgments
The authors want to acknowledge the guidance of Zhao Fenglan and the help of all the colleagues of the Institute of Enhanced Oil Recovery, China University of Petroleum (Beijing), China.
Conflicts of Interest
The authors declare no conflicts of interest.
References
- Srivastava, R.K.; Huang, S.S.; Dong, M. Asphaltene deposition during CO2 flooding. SPE Prod. Facil. 1999, 14, 235–245. [Google Scholar] [CrossRef]
- Ju, B.; Qiu, X.; Qin, J.; Chen, X.; Fan, T. Asphaltene deposition and its effects on production performances in the development of oil field by CO2 flooding: A numerical simulation assessment. In Proceedings of the SPE EUROPE/EAGE Annual Conference and Exhibition, Barcelona, Spain, 14–17 June 2010. [Google Scholar]
- Soroush, S.; Pourafshary, P.; Vafaie-Sefti, M. A comparison of asphaltene deposition in miscible and immiscible carbon dioxide flooding in porous media. In Proceedings of the SPE EOR Conference at Oil and Gas West Asia, Muscat, Oman, 31 March–2 April 2014. [Google Scholar]
- Einstein, M.A.; Castillo, Y.C.G.; Gil, J.C. A novel improved condensate-recovery method by cyclic supercritical CO2 injection. In Proceedings of the SPE Latin American and Caribbean Petroleum Engineering Conference, Buenos Aires, Argentina, 15–18 April 2007. [Google Scholar]
- Zekri, A.Y.; Almehaideb, R.A.; Shedid, S.A. Displacement efficiency of supercritical CO2 flooding in tight carbonate rocks under immiscible and miscible conditions. In Proceedings of the SPE EUROPE/EAGE Annual Conference and Exhibition, Vienna, Austria, 12–15 June 2006. [Google Scholar]
- Zekri, A.Y.; Shedid, S.A.; Almehaideb, R.A. An experimental investigation of interactions between supercritical CO2, asphaltenic crude oil, and reservoir brine in carbonate cores. In Proceedings of the SPE International Symposium on Oilfield Chemistry, Houston, TX, USA, 28 February–2 March 2007. [Google Scholar]
- Piyarat, W. Precipitation and Characterization of Petroleum Asphaltenes. Ph.D. Thesis, University of Michigan, Ann Arbor, MI, USA, 2004. [Google Scholar]
- Speight, J.G. On the molecular nature of petroleum asphaltenes. In Chemistry of Asphaltenes; Bunger, J.W., Li, N.C., Eds.; American Chemical Society: Washington, DC, USA, 1981. [Google Scholar]
- Ting, P.D. Thermodynamic Stability and Phase Behavior of Asphaltenes in Oil and Other Highly Asymmetric Mixtures. Ph.D. Thesis, RICE University, Houston, TX, USA, 2003. [Google Scholar]
- Speight, J.G. The Chemistry and Technology of Petroleum, 5th ed.; Taylor & Francis (Reprint): Boca Raton, FL, USA, 2014. [Google Scholar]
- Long, R.B. The concept of asphaltenes. In Chemistry of Asphaltenes; Bunger, J.W., Li, N.C., Eds.; American Chemical Society: Washington, DC, USA, 1981; pp. 17–27. [Google Scholar]
- Speight, J.G. The Chemistry and Technology of Petroleum; Marcel Dekker: New York, NY, USA, 1999. [Google Scholar]
- Yin, Y.R.; Yen, A.T. Asphaltene deposition and chemical control in CO2 floods. In Proceedings of the SPE/DOE Improved Oil Recovery Symposium, Tulsa, OK, USA, 3–5 April 2000. [Google Scholar]
- Buriro, M.A.; Shuker, M.T. Asphaltene prediction and prevention: A strategy to control asphaltene precipitation. In Proceedings of the SPE/PAPG Annual Technical Conference, Islamabad, Pakistan, 3–5 December 2012. [Google Scholar]
- Adyani, W.N.; Daud, W.A.W.; Darman, N.B.; Memon, A.I.; Khan, I.A.; Jamaluddin, A.K.M. A systematic approach to evaluate asphaltene precipitation during CO2 injection. In Proceedings of the SPE Enhanced Oil Recovery Conference, Kuala Lumpur, Malaysia, 19–21 July 2011. [Google Scholar]
- Novosad, Z.; Costain, T.G. Experimental and modeling studies of asphaltene equilibria for a reservoir under CO2 injection. In Proceedings of the 65th Annual Technical Conference and Exhibition of the Society of Petroleum Engineers, New Orleans, LA, USA, 23–26 September 1990. [Google Scholar]
- Hirschberg, A.; Dejone, L.N.J.; Schipper, B.A.; Meijer, J.G. Influence of temperature and pressure onasphaltene flocculation. SPE J. 1984, 24, 283–293. [Google Scholar]
- Leontaritis, K.J.; Amaefule, J.O.; Charles, R.E. A systematic approach for the prevention and treatment of formation damage caused by asphaltene deposition. SPE Prod. Facil. 1994, 9, 157–164. [Google Scholar] [CrossRef]
- Nghiem, L.X.; Coombe, D.A. Modelling asphaltene precipitation during primary depletion. SPE J. 1997, 2, 170–176. [Google Scholar] [CrossRef]
- Paricaud, P.; Galindo, A.; Jackson, G. Recent advances in the use of the SAFT approach in describing electrolytes, interfaces, liquid crystals and polymers. Fluid Phase Equilib. 2002, 33, 87–96. [Google Scholar] [CrossRef]
- Chapman, W.G.; Sauer, S.G.; Ting, D.; Ghosh, A. Phase behavior applications of SAFT based equations of state—From associating fluids to polydisperse, polar copolymers. Fluid Phase Equilib. 2004, 217, 137–143. [Google Scholar] [CrossRef]
- Chung, T.H. Thermodynamic modelling for organic solid precipitation. SPE Pap. 1992, 24851, 869–878. [Google Scholar]
- Anderson, S.I.; Speight, J.G. Thermodynamic models for asphaltene solubility and precipitation. J. Pet. Sci. Eng. 1999, 22, 53–56. [Google Scholar] [CrossRef]
- Leontaritis, K.J.; Mansoori, G.A. Asphaltene deposition: A comprehensive description of petroleum manifestations and modelling approaches. SPE Pap. 1989, 18892. [Google Scholar] [CrossRef]
- Srivastava, R.K.; Huang, S.S. Asphaltene deposition during CO2 flooding: A laboratory assessment. In Proceedings of the SPE Production Operations Symposium, Oklahoma City, OK, USA, 9–11 March 1997. [Google Scholar]
- Guerrero-Martin, C.A.; Montes-Páez, E.; Oliveira, M.C.K.; Campos, J.; Lucas, E.F. Calculating asphaltene precipitation onset pressure by using cardanol as precipitation inhibitor: A strategy to increment the oil well production. In Proceedings of the SPE Trinidad and Tobago Section Energy Resources Conference, Port of Spain, Trinidad and Tobago, 25–26 June 2018. [Google Scholar]
- Ratnakar, R.R.; Mantilla, C.A.; Dindoruk, B. Experimental and numerical investigation of the impact of asphaltene stability on interfacial properties and the hysteresis behavior at the interfaces. In Proceedings of the SPE EOR Conference at Oil and Gas West Asia, Muscat, Oman, 26–28 March 2018. [Google Scholar]
- Davudov, D.; Moghanloo, R.G.; Akita, E.; Karami, H. A diagnostic approach to predict asphaltene deposition in reservoir and wellbore. In Proceedings of the SPE Western Regional Meeting, Garden Grove, CA, USA, 22–27 April 2018. [Google Scholar]
- Afra, S.; Alrashidi, H.G.; Nasr-EL-Din, H.A. Interrelationship between asphaltene precipitation methods and asphaltene characteristics and self-association behavior. In Proceedings of the SPE Latin America and Caribbean Petroleum Engineering Conference, Buenos Aires, Argentina, 18–19 May 2017. [Google Scholar]
- Shen, Z.; Sheng, J.J. Experimental study of asphaltene aggregation during CO2 and CH4 injection in shale oil reservoirs. In Proceedings of the SPE Improved Oil Recovery Conference, Tulsa, OK, USA, 11–13 April 2016. [Google Scholar]
Figure 1.
Device diagram of flash separation experiments.
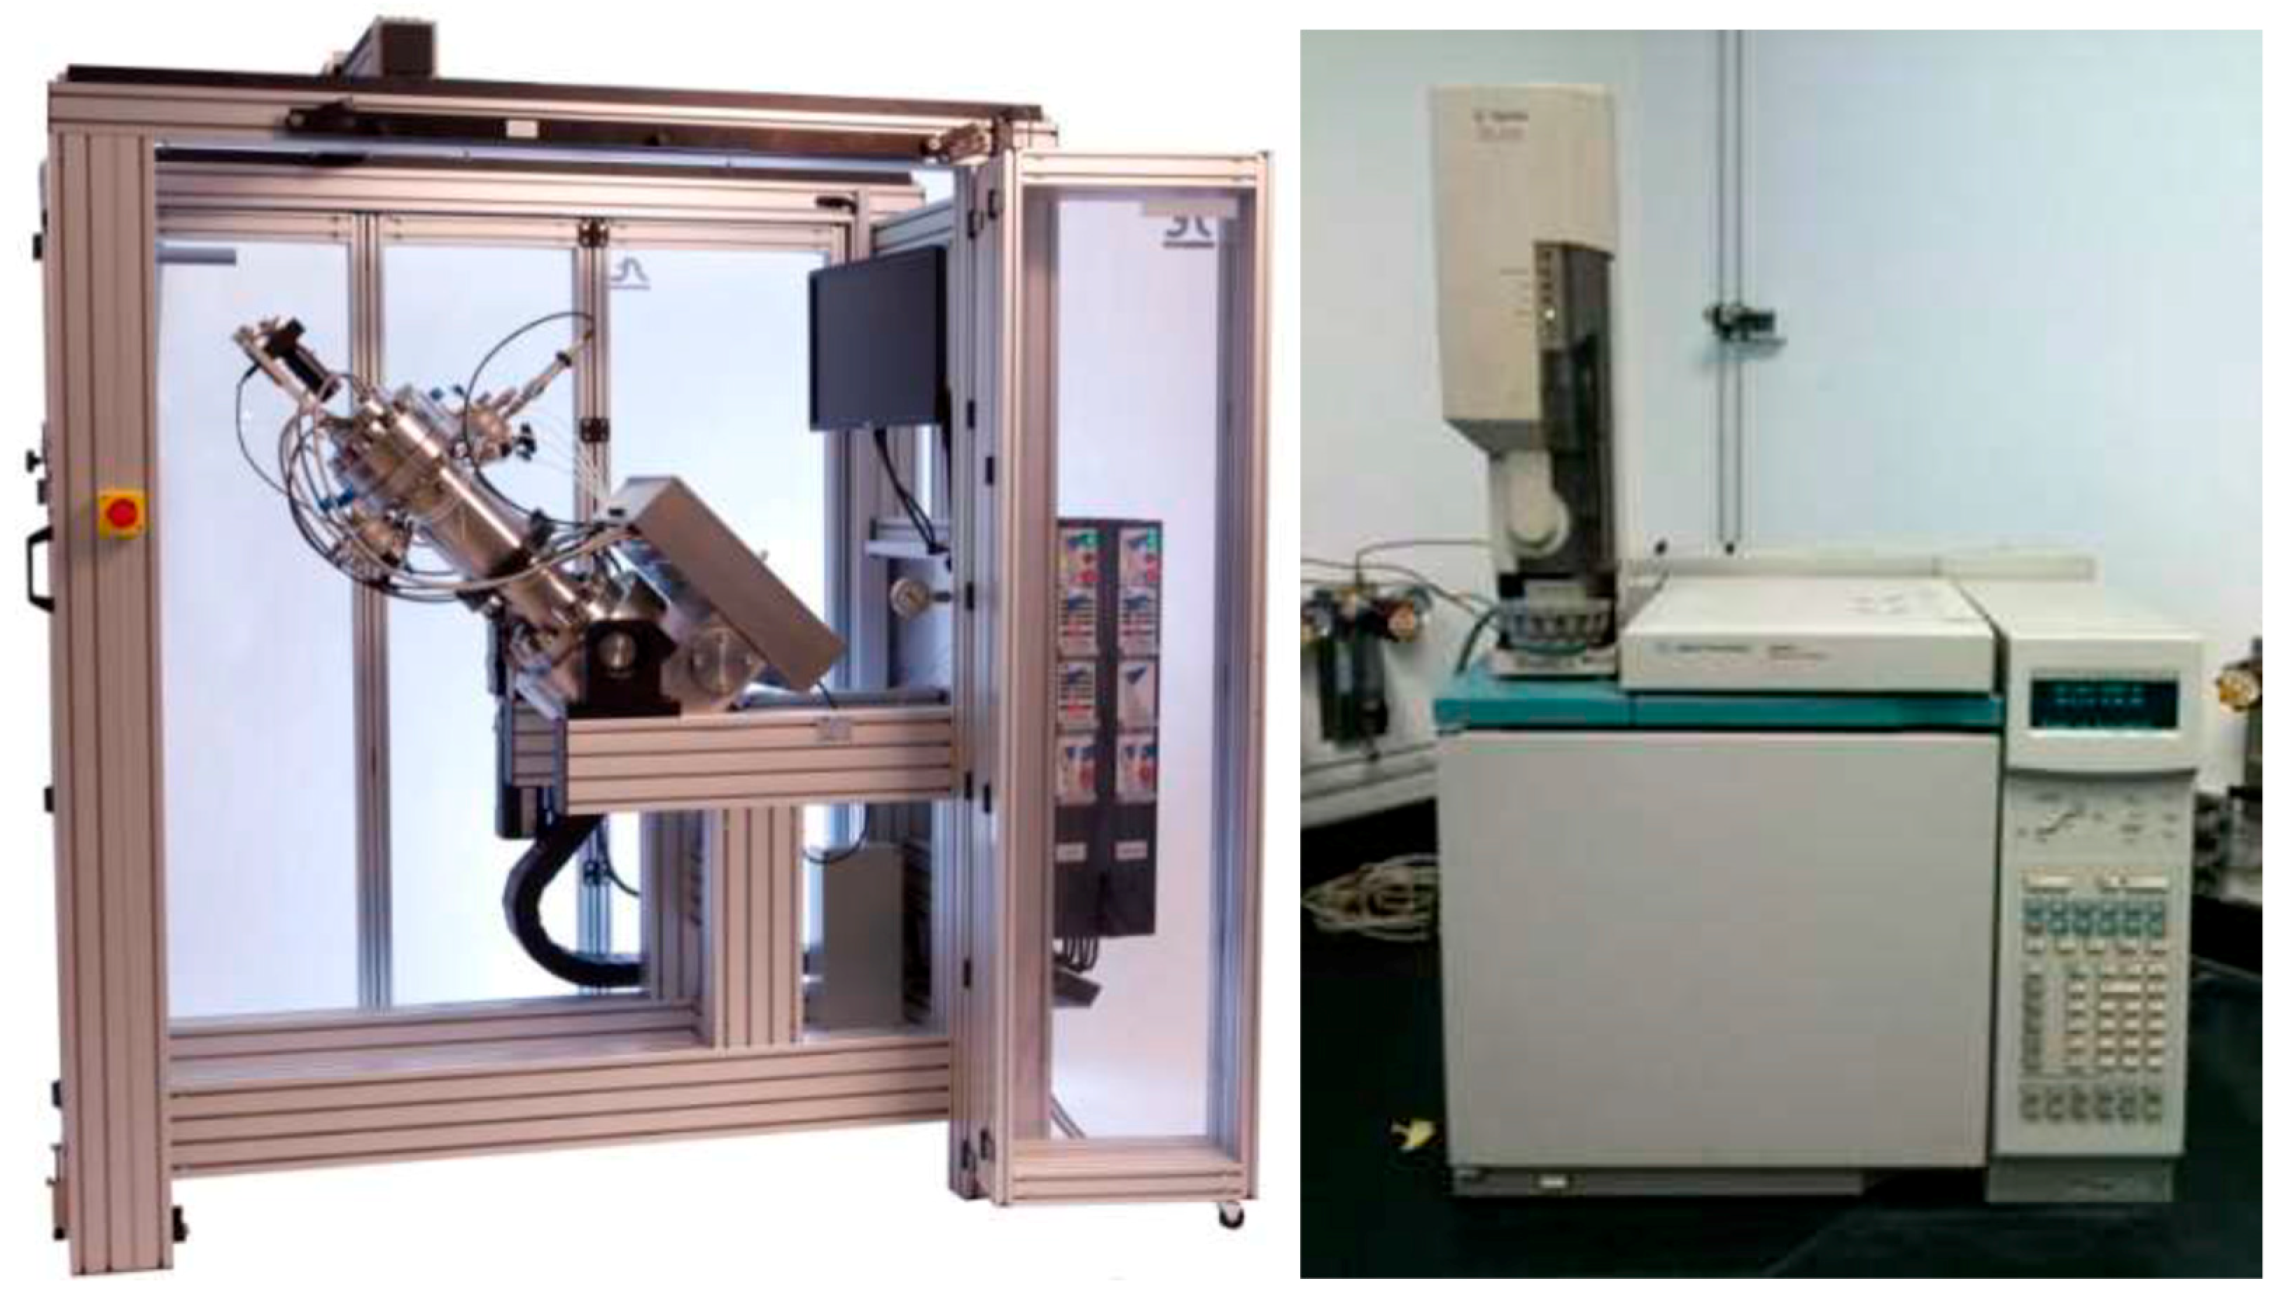
Figure 2.
Asphaltene deposition pressure change with different injection volumes of CO2 at 65 °C in a shallow reservoir.
Figure 2.
Asphaltene deposition pressure change with different injection volumes of CO2 at 65 °C in a shallow reservoir.

Figure 3.
Asphaltene deposition pressure change with different injection volumes of N2 at 65 °C in a shallow reservoir.
Figure 3.
Asphaltene deposition pressure change with different injection volumes of N2 at 65 °C in a shallow reservoir.

Figure 4.
Asphaltene deposition pressure change with different injection ratios of gas mixture at 65 °C in a shallow reservoir.
Figure 4.
Asphaltene deposition pressure change with different injection ratios of gas mixture at 65 °C in a shallow reservoir.

Figure 5.
An asphaltene deposition pressure change with different injection volumes of CO2 and N2 at 161.8 °C in a buried-hill reservoir.
Figure 5.
An asphaltene deposition pressure change with different injection volumes of CO2 and N2 at 161.8 °C in a buried-hill reservoir.
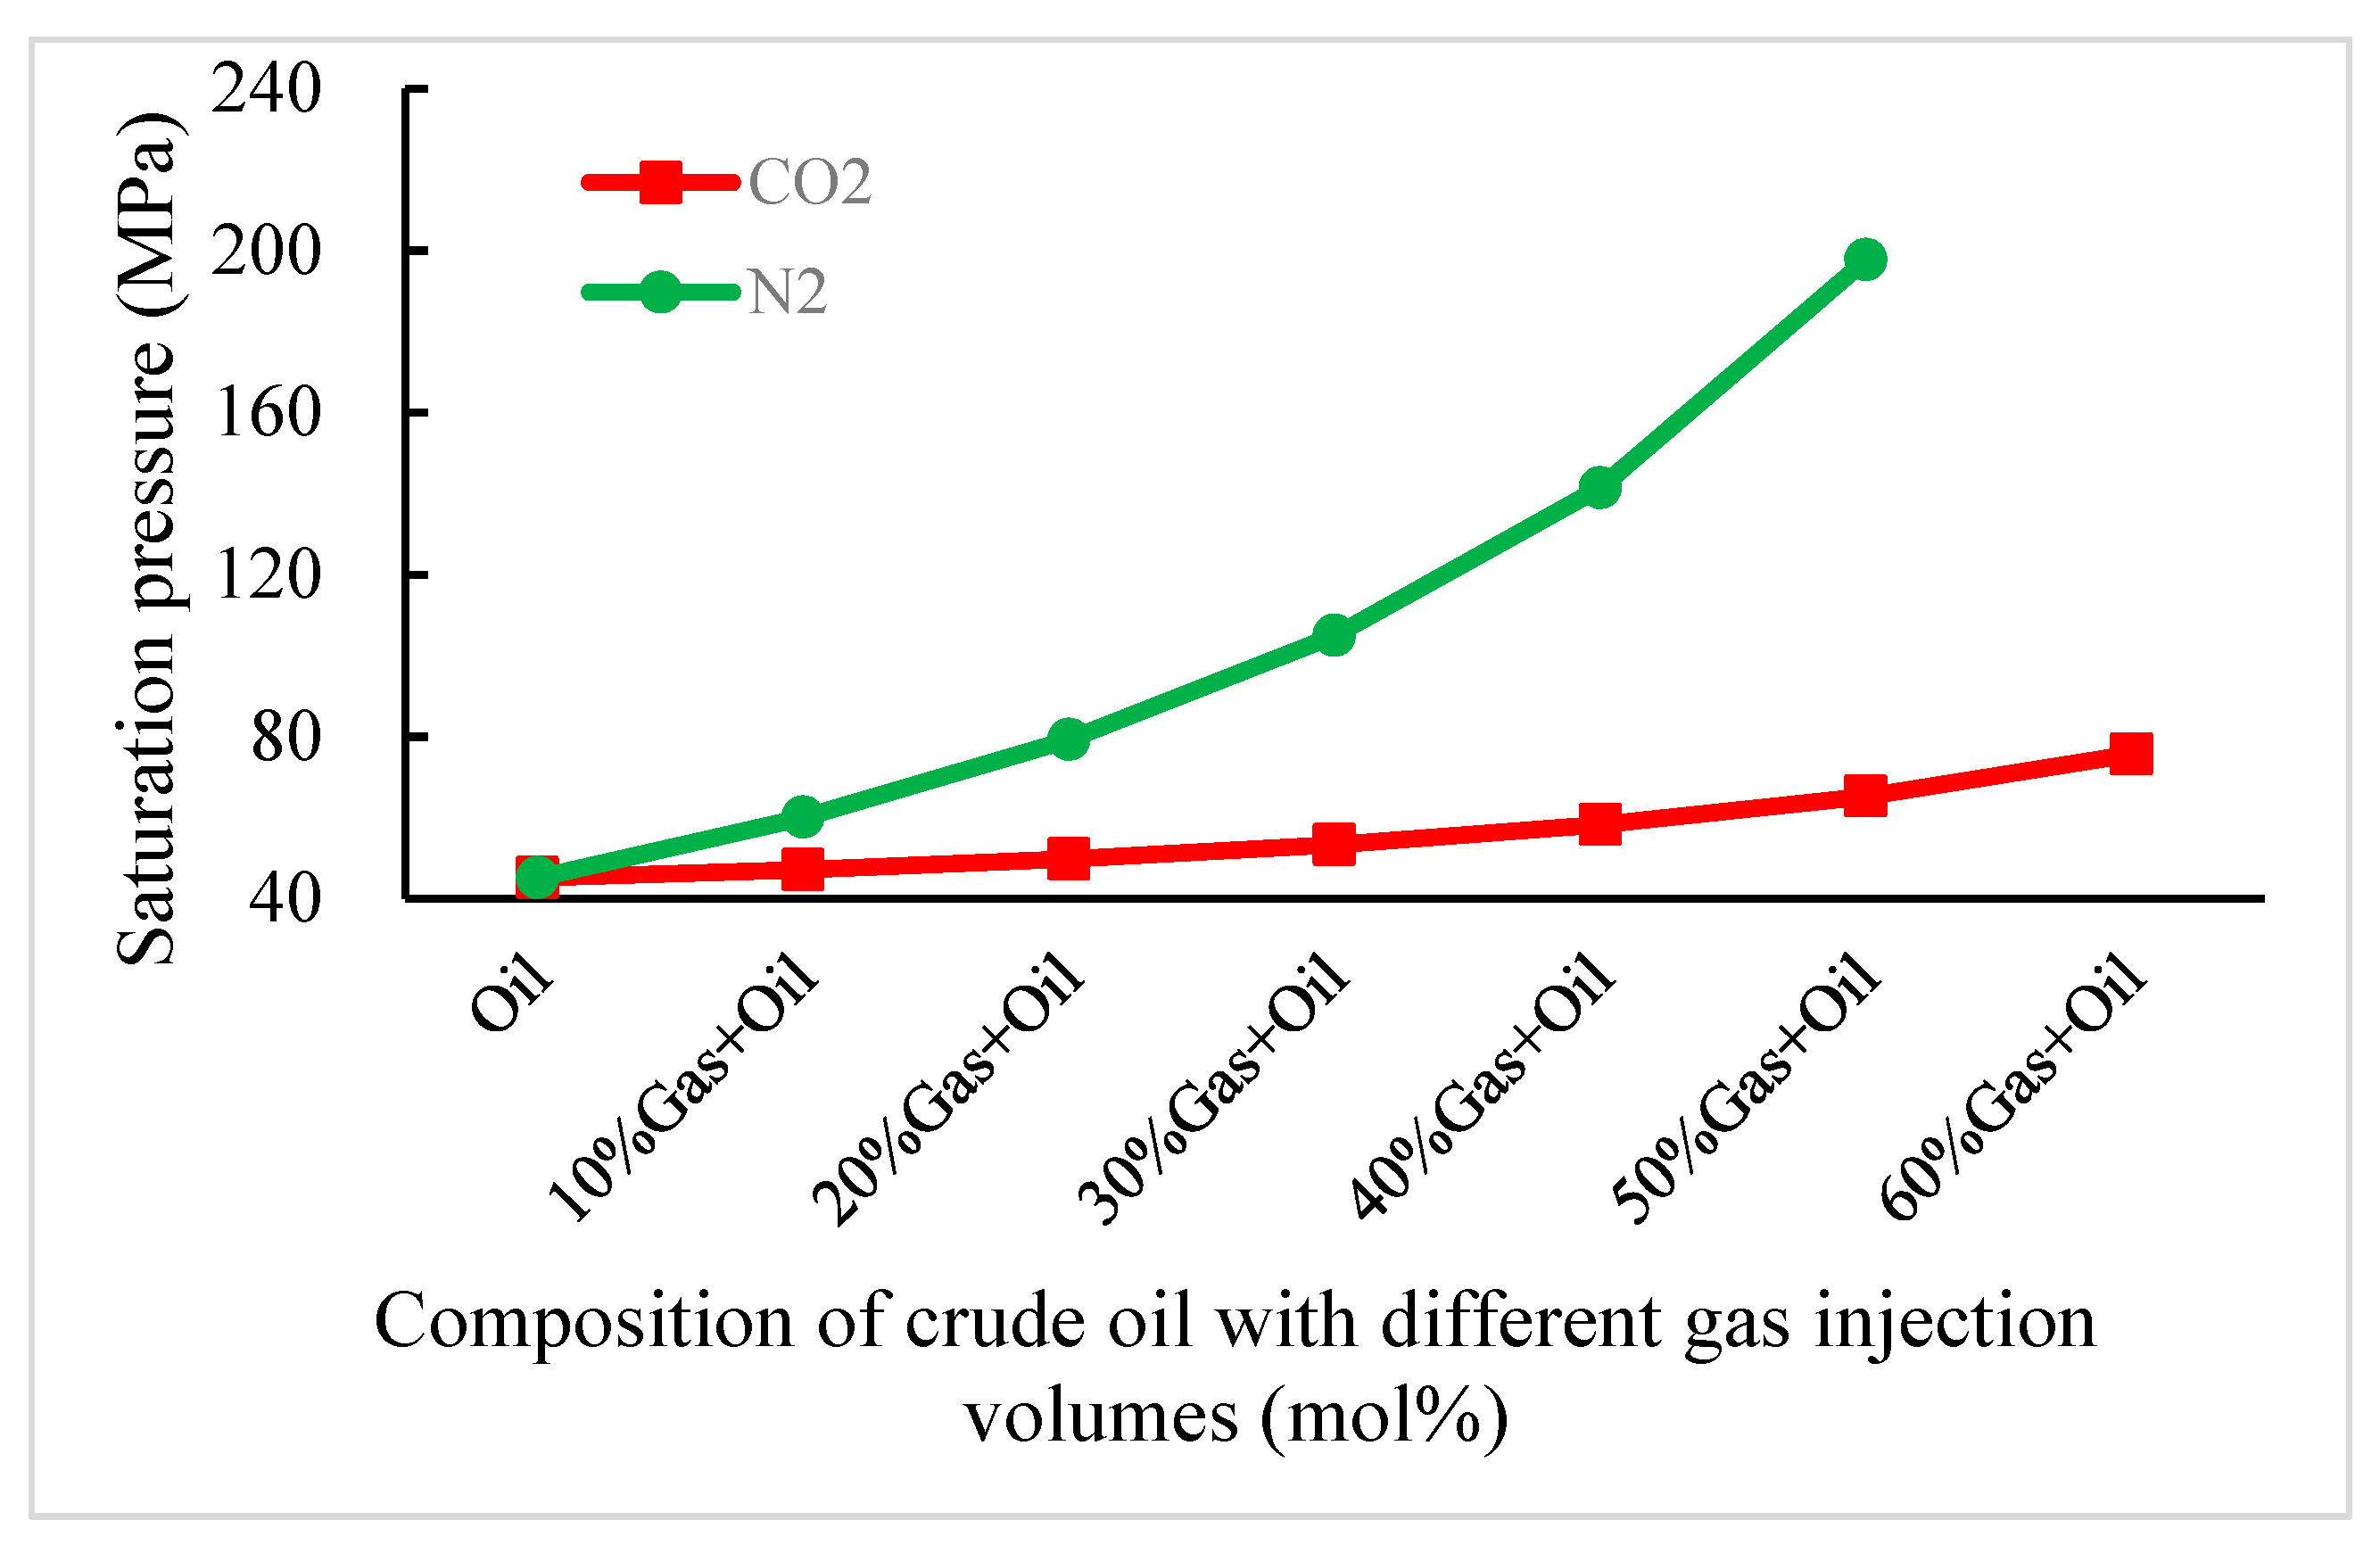
Figure 6.
Asphaltene deposition pressure change with different injection ratios of a gas mixture at 161.8 °C in a buried-hill reservoir.
Figure 6.
Asphaltene deposition pressure change with different injection ratios of a gas mixture at 161.8 °C in a buried-hill reservoir.

Table 1.
Composition of crude oil in a shallow reservoir.
| Components | Molar Volume Content (mol %) | Components | Molar Volume Content (mol %) |
|---|---|---|---|
| CO2 | 0.00 | C17 | 2.55 |
| N2 | 1.78 | C18 | 2.36 |
| C1 | 27.45 | C19 | 2.08 |
| C2 | 1.04 | C20 | 1.77 |
| C3 | 0.18 | C21 | 1.67 |
| iC4 | 0.06 | C22 | 1.53 |
| nC4 | 0.04 | C23 | 1.42 |
| iC5 | 0.00 | C24 | 1.31 |
| nC5 | 0.00 | C25 | 1.38 |
| C6 | 0.00 | C26 | 1.52 |
| C7 | 0.15 | C27 | 1.78 |
| C8 | 0.24 | C28 | 1.94 |
| C9 | 0.83 | C29 | 1.86 |
| C10 | 0.45 | C30 | 1.62 |
| C11 | 0.88 | C31 | 1.15 |
| C12 | 1.42 | C32 | 0.90 |
| C13 | 1.97 | C33 | 0.72 |
| C14 | 2.35 | C34 | 0.61 |
| C15 | 2.17 | C35 | 0.56 |
| C16 | 2.33 | C36+ | 27.93 |
Table 2.
Composition and critical parameters of pseudo-components in a shallow reservoir.
| Component | mol % | Mol wt.% | Liquid Density (g/cm3) | Critical Temperature (°C) | Critical Pressure (bara) | Critical Volume (cm3/mol) |
|---|---|---|---|---|---|---|
| N2 | 1.78 | 28.014 | −146.95 | 33.94 | 89.8 | |
| C1 | 27.45 | 16.043 | −82.55 | 46 | 99 | |
| C2 | 1.04 | 30.07 | 32.25 | 48.84 | 148 | |
| C3 | 0.18 | 44.097 | 96.65 | 42.46 | 203 | |
| iC4 | 0.06 | 58.124 | 134.95 | 36.48 | 263 | |
| nC4 | 0.04 | 58.124 | 152.05 | 38 | 255 | |
| C7 | 0.15 | 96 | 0.738 | 263.338 | 29.45 | 475.55 |
| C8 | 0.24 | 107 | 0.765 | 284.893 | 27.42 | 487.84 |
| C9 | 0.83 | 121 | 0.781 | 308.928 | 25.06 | 529.18 |
| C10–C19 | 18.56 | 211.075 | 0.8399 | 435.872 | 17.61 | 908.95 |
| C20–C26 | 10.6 | 315.691 | 0.8766 | 542.232 | 14.62 | 1364.5 |
| C27–C31 | 8.35 | 399.351 | 0.8995 | 618.622 | 13.49 | 1759.02 |
| C32–C37 | 6.389 | 487.292 | 0.9197 | 695.091 | 12.78 | 2201.57 |
| C38–C42 | 7.192 | 554.183 | 0.934 | 750.134 | 12.42 | 2543.06 |
| C43–C47 | 5.196 | 624.183 | 0.9475 | 806.373 | 12.15 | 2910.8 |
| C48–C53 | 3.806 | 700.352 | 0.9606 | 827.809 | 11.55 | 3319.78 |
| C48–C53-A | 0.563 | 700.352 | 0.9606 | 1125.35 | 14.95 | 3319.78 |
| C54–C63 | 3.471 | 807.543 | 0.9768 | 902.584 | 11.01 | 3911.42 |
| C54–C63-A | 0.906 | 807.543 | 0.9768 | 1125.35 | 14.95 | 3911.42 |
| C64–C80 | 2.535 | 982.587 | 0.9993 | 1068.026 | 10.72 | 4904.15 |
| C64–C80-A | 0.662 | 982.587 | 0.9993 | 1125.35 | 14.95 | 4904.15 |
Table 3.
Composition change of crude oil with different CO2 and N2 injection volumes in a shallow reservoir.
Table 3.
Composition change of crude oil with different CO2 and N2 injection volumes in a shallow reservoir.
| C1 (mol %) | C2 (mol %) | C3 (mol %) | iC4 (mol %) | nC4 (mol %) | C36+ (mol %) | |
|---|---|---|---|---|---|---|
| Oil | 27.45 | 1.04 | 0.18 | 0.06 | 0.04 | 27.93 |
| 5% CO2 + Oil | 26.08 | 0.99 | 0.17 | 0.06 | 0.04 | 26.53 |
| 10% CO2 + Oil | 24.71 | 0.94 | 0.16 | 0.05 | 0.04 | 25.14 |
| 15% CO2 + Oil | 23.33 | 0.88 | 0.15 | 0.05 | 0.03 | 23.74 |
| 20% CO2 + Oil | 21.96 | 0.83 | 0.14 | 0.05 | 0.03 | 22.34 |
| 25% CO2 + Oil | 20.59 | 0.78 | 0.14 | 0.05 | 0.03 | 20.95 |
| 30% CO2 + Oil | 19.22 | 0.73 | 0.13 | 0.04 | 0.03 | 19.55 |
| 35% CO2 + Oil | 17.84 | 0.68 | 0.12 | 0.04 | 0.03 | 18.16 |
| 40% CO2 + Oil | 16.47 | 0.62 | 0.11 | 0.04 | 0.02 | 16.76 |
| 5% N2 + Oil | 26.55 | 1.01 | 0.17 | 0.06 | 0.04 | 27.01 |
| 10% N2 + Oil | 25.15 | 0.95 | 0.17 | 0.06 | 0.04 | 25.59 |
| 15% N2 + Oil | 23.76 | 0.90 | 0.16 | 0.05 | 0.04 | 24.17 |
| 20% N2 + Oil | 22.36 | 0.85 | 0.15 | 0.05 | 0.03 | 22.75 |
| 25% N2 + Oil | 20.96 | 0.79 | 0.14 | 0.05 | 0.03 | 21.33 |
| 30% N2 + Oil | 19.56 | 0.74 | 0.13 | 0.04 | 0.03 | 19.91 |
| 35% N2 + Oil | 18.17 | 0.69 | 0.12 | 0.04 | 0.03 | 18.48 |
| 40% N2 + Oil | 16.77 | 0.64 | 0.11 | 0.04 | 0.02 | 17.06 |
Table 4.
Composition of crude oil in a buried-hill reservoir.
| Components | Molar Volume Content (mol %) | Components | Molar Volume Content (mol %) |
|---|---|---|---|
| CO2 | 11.72 | C17 | 1.34 |
| N2 | 0.00 | C18 | 1.16 |
| C1 | 55.47 | C19 | 1.12 |
| C2 | 3.11 | C20 | 1.06 |
| C3 | 0.80 | C21 | 1.04 |
| iC4 | 0.21 | C22 | 0.98 |
| nC4 | 0.17 | C23 | 0.93 |
| iC5 | 0.00 | C24 | 0.87 |
| nC5 | 0.00 | C25 | 0.83 |
| C6 | 0.00 | C26 | 0.78 |
| C7 | 0.04 | C27 | 0.75 |
| C8 | 0.10 | C28 | 0.67 |
| C9 | 0.15 | C29 | 0.59 |
| C10 | 0.37 | C30 | 0.49 |
| C11 | 0.70 | C31 | 0.41 |
| C12 | 1.14 | C32 | 0.33 |
| C13 | 1.42 | C33 | 0.28 |
| C14 | 1.70 | C34 | 0.23 |
| C15 | 1.40 | C35 | 0.20 |
| C16 | 1.43 | C36+ | 6.02 |
Table 5.
Composition and critical parameters of pseudo-components in a buried-hill reservoir.
| Component | mol % | Mol wt.% | Liquid Density (g/cm3) | Critical Temperature (°C) | Critical Pressure (bara) | Critical Volume (cm3/mol) |
|---|---|---|---|---|---|---|
| CO2 | 11.719 | 44.01 | 31.05 | 73.76 | 94 | |
| C1 | 55.464 | 16.043 | −82.55 | 46 | 99 | |
| C2 | 3.11 | 30.07 | 32.25 | 48.84 | 148 | |
| C3 | 0.8 | 44.097 | 96.65 | 42.46 | 203 | |
| iC4 | 0.21 | 58.124 | 134.95 | 36.48 | 263 | |
| nC4 | 0.17 | 58.124 | 152.05 | 38 | 255 | |
| C7 | 0.04 | 96 | 0.738 | 263.338 | 29.45 | 475.55 |
| C8 | 0.1 | 107 | 0.765 | 284.893 | 27.42 | 487.84 |
| C9 | 0.15 | 121 | 0.781 | 308.928 | 25.06 | 529.18 |
| C10–C15 | 6.729 | 177.7 | 0.8256 | 392.459 | 19.43 | 748.78 |
| C16–C18 | 3.93 | 235.674 | 0.8473 | 458.417 | 16.58 | 989.37 |
| C19–C22 | 4.2 | 282.762 | 0.8655 | 508.3 | 15.27 | 1202.86 |
| C23–C25 | 2.63 | 330.821 | 0.8809 | 555.086 | 14.36 | 1424.79 |
| C26–C29 | 2.79 | 379.09 | 0.8945 | 600.208 | 13.71 | 1658.63 |
| C30–C36 | 3.354 | 467.399 | 0.9184 | 679.217 | 12.94 | 2107.8 |
| C37 | 1.082 | 514 | 0.9385 | 717.487 | 12.72 | 2338.2 |
| C38–C40 | 1.945 | 539.531 | 0.9554 | 739.603 | 12.67 | 2480.55 |
| C41–C77 | 1.539 | 615.584 | 1.0017 | 798.062 | 12.51 | 2948.39 |
| C41–C77-A | 0.04 | 615.584 | 1.0017 | 1125.35 | 14.95 | 2948.39 |
Table 6.
Composition change of crude oil with different CO2 and N2 injection volumes in a buried-hill reservoir.
Table 6.
Composition change of crude oil with different CO2 and N2 injection volumes in a buried-hill reservoir.
| C1 (mol %) | C2 (mol %) | C3 (mol %) | iC4 (mol %) | nC4 (mol %) | C36+ (mol %) | |
|---|---|---|---|---|---|---|
| Oil | 55.47 | 3.11 | 0.80 | 0.21 | 0.17 | 6.02 |
| 10% CO2 + Oil | 49.19 | 2.76 | 0.71 | 0.19 | 0.15 | 5.34 |
| 20% CO2 + Oil | 42.91 | 2.41 | 0.62 | 0.16 | 0.13 | 4.66 |
| 30% CO2 + Oil | 36.63 | 2.05 | 0.53 | 0.14 | 0.11 | 3.98 |
| 40% CO2 + Oil | 30.35 | 1.70 | 0.44 | 0.12 | 0.09 | 3.29 |
| 50% CO2 + Oil | 24.06 | 1.35 | 0.35 | 0.09 | 0.07 | 2.61 |
| 60% CO2 + Oil | 17.78 | 1.00 | 0.26 | 0.07 | 0.05 | 1.93 |
| 10% N2 + Oil | 49.92 | 2.80 | 0.72 | 0.19 | 0.15 | 5.42 |
| 20% N2 + Oil | 44.37 | 2.49 | 0.64 | 0.17 | 0.14 | 4.82 |
| 30% N2 + Oil | 38.83 | 2.18 | 0.56 | 0.15 | 0.12 | 4.21 |
| 40% N2 + Oil | 33.28 | 1.87 | 0.48 | 0.13 | 0.10 | 3.61 |
| 50% N2 + Oil | 27.73 | 1.56 | 0.40 | 0.11 | 0.09 | 3.01 |
| 60% N2 + Oil | 22.19 | 1.24 | 0.32 | 0.08 | 0.07 | 2.41 |
© 2018 by the authors. Licensee MDPI, Basel, Switzerland. This article is an open access article distributed under the terms and conditions of the Creative Commons Attribution (CC BY) license (http://creativecommons.org/licenses/by/4.0/).
Share and Cite
MDPI and ACS Style
Wang, P.; Zhao, F.; Hou, J.; Lu, G.; Zhang, M.; Wang, Z. Comparative Analysis of CO2, N2, and Gas Mixture Injection on Asphaltene Deposition Pressure in Reservoir Conditions. Energies 2018, 11, 2483. https://doi.org/10.3390/en11092483
AMA Style
Wang P, Zhao F, Hou J, Lu G, Zhang M, Wang Z. Comparative Analysis of CO2, N2, and Gas Mixture Injection on Asphaltene Deposition Pressure in Reservoir Conditions. Energies. 2018; 11(9):2483. https://doi.org/10.3390/en11092483
Chicago/Turabian StyleWang, Peng, Fenglan Zhao, Jirui Hou, Guoyong Lu, Meng Zhang, and Zhixing Wang. 2018. "Comparative Analysis of CO2, N2, and Gas Mixture Injection on Asphaltene Deposition Pressure in Reservoir Conditions" Energies 11, no. 9: 2483. https://doi.org/10.3390/en11092483
Note that from the first issue of 2016, this journal uses article numbers instead of page numbers. See further details here.