Improved Data Center Energy Efficiency and Availability with Multilayer Node Event Processing


1
Faculty of Electrical Engineering and Computer Science, University of Maribor, Koroška c. 46, 2000 Maribor, Slovenia
2
NTR Inženiring d.o.o., Ulica Pohorskega bataljona 14, 2000 Maribor, Slovenia
*
Author to whom correspondence should be addressed.
Energies 2018, 11(9), 2478; https://doi.org/10.3390/en11092478
Submission received: 3 September 2018
/
Revised: 4 September 2018
/
Accepted: 15 September 2018
/
Published: 18 September 2018
Abstract
:This article presents an overview of a new multilayer node event processing (MNEP) method for improved data center energy efficiency and event management monitoring in its physical infrastructure. Event management is essential for the provision and maintenance of the reliability and functionality of the physical infrastructure. For effective maintenance, action preventing any downtime accurate event information as well as appropriate energy support is of outmost importance. The novelty of this approach lies in the enhanced availability and reliability of the physical infrastructure, improved data center infrastructure energy efficiency, as well as lower costs when designing a new physical infrastructure system. The MNEP method presents a data model based on the node tree processing. The experimental results show that the number of all potential unexpected events is reduced significantly as a result of the accurate identification of the alarm root cause. The comparison of time parameters required to evaluate the maintenance factors shows that the time needed to detect, identify, and react to alarm events decreases and has a significant impact on maintaining a defined high level of availability and energy efficiency in a data center physical infrastructure.
1. Introduction
The importance of energy efficiency in today’s data centers has grown significantly and has become more complex in recent years. To maintain high data availability, all components of the data center infrastructure must perform the assigned tasks to avoid any data center downtime requiring appropriate energy support. The technical infrastructure is fundamental of all information technology (IT) infrastructures and it includes power supplies, technical coolers, and technical security. Any downtime value of the physical infrastructure, no matter how low, has an essential impact on the IT service performance.
Communication technology in data centers works together with complex technical infrastructure, which runs the information service. Risk assessment [1,2] is taken into account in the system design structure, allowing the system to work according to the data center availability demands. Great importance has to be given to the monitoring and event management of all existing component parameters, including energy usage management in the data center infrastructure system to avoid or prevent any downtime.
The problem investigated in this research is important due to the complex data center information infrastructure analysis and event management monitoring. Several surveys have been conducted focusing on storage, energy-saving techniques, and file-system software for efficient data management in data centers. When designing a computer data center from the point of view of a support infrastructure, the necessary capacity has to be ensured for the main and the backup supplies, uninterruptible power supplies (UPSs), system and communication cabinet capacities, technical cooling, and for any other elements of electrical and cooling power supply. It is of outmost importance that data centers are adequately resistant against any support system downtimes. As these support systems are part of the support infrastructure, which is also referred to as technological systems, the goal of this research was to monitor all possible parameters that are crucial for the data center operation and to detect any faults in the shortest time possible (from their occurrence on). Since cost is an important factor of support infrastructure design, the aim is to optimize the energy costs to be as energy efficient as possible, i.e., to predict when additional UPS or coolers need to be used, both during the operation as well as during the data center upgrades. It is noteworthy that the reduced time to detect the faults significantly improves the availability of data centers [3,4].
In the article, an event management forecasting framework is presented in Section 2. Section 3 mainly introduces the event monitoring and event processing. In Section 4, experimental results are divided into: (i) experimental block diagram of data center technical infrastructure, (ii) experimental system node tree model for power supply block, (iii) data definition for event processing, (iv) data filtering and correlation, (v) root cause analysis, and (iv) experimental results of the multilayer node event processing (MNEP) methodology. This is followed by a discussion presented in Section 5. Finally, the paper is concluded in Section 6.
2. Event Management
Many studies on event management have been published, but only a few are not connected directly to data the center infrastructure. In Reference [5], the paper presents alarm management in the power energy distribution control. Research is based on an ontology concept. On the second ontology level, there is an expert system with expert-based if–then rules. Founded on these rules, relations between neurons were determined based on the data history. Rule determination relies on the expert knowledge, which is a complex task aiming at transforming knowledge into sum of understandable and logical rules. In Reference [6], authors searched with a heuristic algorithm for the combinations of events, which led to alarms. Based on the assumption that the most frequent alarms do not lead to critical failures, they minimized the number of alarms. Presentation of the sequence of alarms is made with a dependency graph where a heuristic algorithm does not cover all the parallel alarm flows. In Reference [7], fuzzy reasoning with a Petri net is used, but has limitations with more complex systems. This method is used to detect the place of failure in an electrical power distribution network. For every section or part of the network, there is a model based on the expert knowledge with possible failure causes. Backward reasoning with probability values is used to identify causes of a failure. With division to subsystems, failure data is limited to the affected subsystem only. In Reference [8], a systematic methodology for reconstructing event order and establishing correlations among events, which indicate the root causes of a given failure from very large system logs is presented. A diagnostics tool was developed to extract the log entries as structured message templates and uses statistical correlation analysis to establish probable cause and effect relationships for the fault being analyzed. A diagnostics tool is also able to identify dates and time that contain the significant events, which eventually led to the occurrence of compute node soft lockups. Complex event processing is researched in Reference [9] with processing a large volume of stream data. The paper presents a new scheme to detect complex events when the minimum conditions are satisfied to remove unnecessary operations. To check the minimum conditions of the complex events, complex queries are registered in a query index. In this way complex events using the query index and bitmap are detected. In Reference [10], distributed complex event processing is done with a query rewriting method. To enable generic and reusable complex event processing (CEP) system management procedures and self-management policies, this research introduces the attributed graph rewriting for complex event processing management (AGeCEP) formalism. AGeCEP represents queries in a language and technology diagnostic fashion using attributed graphs. Query reconfiguration capabilities are expressed through standardized attributes, which are defined based on a novel classification of CEP query operators. By leveraging this representation, AGeCEP also proposes graph rewriting rules to define consistent reconfigurations of queries. For event detection, the author in Reference [11] discusses the wireless sensor network as an alternative data acquisition, which can also be considered as a possibility in data center infrastructure design. This paper surveys novel approaches of handling query processing by the current sensor network query processors (SNQP) literature, the expressiveness of their query language, the support provided by their compiler/optimizer to generate efficient query plans, and the kind of queries supported. There are various SNQPs (implementing in-network declarative query processing) that provide data reduction, aggregation, logging, and auditing facilities. They allow users to pose declarative queries that provide an effective and efficient means to obtain data about the physical environment, as users would not need to be concerned with how sensors are to acquire the data, or how nodes transform and/or transmit the data. Standards for automated wireless networks in buildings and the reliability of wireless sensor networks are discussed in detail in References [12,13]. In Reference [14], tools with integrated processes called data center infrastructure management (DCIM) are discussed, where system connectivity and interrelationship among system operations to support data center operations managers are stressed out. Various communication technologies are presented as a model to use in data center communication path design. This model can also reduce investment cabling and network-operating costs, control energy costs, improve energy efficiency, and increase operational efficiency. DCIM in Reference [15] utilizes tools that monitor, measure, manage, and control data center resources and energy consumption of both IT equipment (servers, storage, switches) and also facilities infrastructure components (power distribution units (PDUs), air conditioning, UPS, etc.). Event and alarm management is a part of the DCIM philosophy in management and control subset, where users need to set alarms and prioritization manually by browsing through a series of events and alarms. However, the above-mentioned methods have some disadvantages. For instance, (i) expert knowledge or a heuristic algorithm does not cover all the parallel alarms, (ii) only the probability values are used to identify causes of a failure, (iii) only a statistical correlation analysis is used to establish a probable cause for the fault, and (iv) only the minimum conditions are satisfied to remove unnecessary operations, (v) only attributed graph rewriting and query reconfiguration is used. In some cases, the wireless sensor network as an alternative data acquisition is used or data center communication path is designed when data center operations managers are stressed out. Often users need to set alarms and prioritization manually by browsing through a series of events and alarms.
This paper, on the other hand, presents a new complex method to enhance availability, reliability, and energy efficiency of the physical infrastructure based on the monitoring of the physical infrastructure with multilayer node event processing. It is suitable for the use in small- and medium-sized data centers, distance location data centers, and modular data centers, and it makes it easier to implement and add any new components. It is also less time and resource consuming and offers a detailed view of the system components. This paper, therefore, proposes a new, complex way regarding how to design event processing especially in energy management, along with its implementation and embedment into the control system of the IT data center infrastructure. An important factor is the impact on the system maintainability and energy efficiency, which are improved as a result of a faster problem identification and reduced mean time for repairs.
3. Monitoring and Event Processing
3.1. Event Monitoring
Event monitoring enhances effectiveness, reduces costs, and helps to maintain the highest level of reliability, availability, and energy efficiency. Altogether, they represent the highest data center priorities. The task of monitoring includes technological component as well as device monitoring and controlling, energy controlling, alarm and event messaging, data display, and sending reports with data to higher central control components. Data from various technological parts and components is acquired with distributed acquisition modules and controllers. Controllers are connected to the network, where they provide acquired data for the central monitoring level servers.
Cause of errors can be technical resulting from power disturbance, communication system loss, security systems errors, disturbance of energy supply, cooling water supply, fuel supply, natural causes (earthquakes, flood, and fire), vandalism, and human factors. In modern data centers, which have a total dependency on the functionality of the technical infrastructure, reaction and action in case of a failure of any essential part of the system has a great impact on the system availability. For example, redundancy is provided, but is reduced with the failure event of a component in one redundancy path. Therefore, the identification of a failure and problem must be accurate and on time. When studying possible effects of a failure in the technical infrastructure, it is a fact that some IT equipment errors do not affect the user experience. However, when the technical infrastructure fails, it has an effect on the user experience. All IT infrastructure relies on the technical infrastructure. The need for new approaches for the event processing in data center design is increasing because of the:
- Growing data center complexity,
- Increased number of energy supplies and cooling systems,
- Influence and impact of the technical infrastructure on IT service which must be minimized,
- Correlation among the physical infrastructure and IT infrastructure events,
- High IT service standards,
- Event processing and alarming in one application,
- Event/alarm messaging and failure reduction, and
- Limited data center access.
3.2. Event Processing
Event processing consists of multiple processes and procedures. The purpose is to reduce the data center administrators’ response time and to give the maintenance useful information with accurate event and alarm data. Currently, there is a problem regarding how to identify where and on which component to react when the time to repair is running [16]. In control and management design, there has to be an option for the redundant power supply of the controller modules such that the device power supply is independent of the power supply of the event data acquisition. Processing of events and alarms is demanding because the system availability value must remain in the required boundaries. Information on the events and alarm management must be accurate and timely in order to proceed with the intervention measures and maintenance. During the data center operation, a number of events take place and we have to differentiate the events from the actual alarms [16]. Some events have other events as a consequence in a chain reaction. To remove all the consequences successfully, the cause of the problem has to be found based on a cause–effect philosophy [17]. In case of a component failure, all corrective actions have to be performed in order to establish the previous process availability state within the demanded period of time.
Alarms are a part of the complex event processing and are important for the maintainability process. Every event can have consequences in another connected part of the system. As a result, a large number of alarms can be triggered. This can lead to the confusion of the administrators about the real data center status [18]. In general, there is a difference between an event, an error, and a failure. One error or failure can have a chain reaction in a series of events also in other system layers. For the events with an alarm, the root cause needs to be found and identified [19]. Other system layers can also operate independently, but since they are all a part of a complex data center infrastructure system, they must operate and function together as one system. The success of the data processing methodology is based on the knowledge of the system.
In system operative mode, there is no available time to perform a root cause analysis manually and to determine the percentage of a possibility that a processed event is actually the root cause of a failure. On the other hand, for this manual approach, expert knowledge is always needed [20]. The MNEP method is an automated event processing method with alarm management that runs parallel with the data center process and analyses the acquired data and information. In information data centers, a high level of system availability is demanded [21]. Balance must be achieved between the system availability demands and energy efficiency, on the one hand, and the costs of the design and later the costs of maintenance, on the other. For several years now, the tier classification (Table 1) by the Uptime Institute has been a widely known and used classification of the data center’s availability [22]. Table 1 shows the tier classification to describe and differentiate facilities according to the availability level, and presents four stages of demands that need to be considered [23,24,25]. The development of the tier standards brought ANSI/TIA-942—Telecommunications Infrastructure Standard for Data Centers, issued by the Telecommunications Industry Association (TIA), which finally led to issuing a series of EN 50600 standards “Information technology‒data center facilities and infrastructures” [26]. In this series of standards, fundamental topics, such as building construction, power distribution, air conditioning, security systems, or the fields of management and operation, are covered comprehensively. In Table 1, the tier I data center has non-redundant capacity components and single non-redundant path distribution paths serving the site’s computer equipment. The data center has computer room cooling and power distribution, but it may or may not have a UPS or and engine generator. The data center must be shut down for annual predictive maintenance and repair work. Corrective maintenance may require additional shutdowns. Operation errors or spontaneous failures of infrastructure components will cause a data center disruption. As an example, a tier I data center may be suitable for small businesses where IT is intended for internal business processes. The tier II data center has redundant capacity components and single non-redundant distribution paths serving the site’s computer equipment. They have UPS and engine generators, but their capacity design is need plus one (N + 1), with a single power path. Maintenance of the critical power path and other parts of the site infrastructure will require a shutdown of computer processes. As an example, a tier II data center may be appropriate for internet-based companies without serious financial penalties for quality of service commitments. The tier III data center is concurrently maintainable and has redundant capacity components and multiple distribution paths serving the site’s computer equipment. Generally, only one distribution path serves the computer equipment at any time. This topology allows for any planned site infrastructure activity without disruption the computer systems operation in any way. An example of a tier III application would include companies that span multiple time zones or whose information technology resources support automated business process. The tier IV data center is fault tolerant and has redundant capacity systems and multiple distribution paths simultaneously serving the site’s computer equipment. All IT equipment is dual-powered and installed properly to be compatible with the topology of the site’s architecture. Fault-tolerant functionality also provides the ability of the site infrastructure to sustain at least one worst-case unplanned failure or event with impact to the critical load. This typically includes a system + system topology. Examples of a tier IV requirement include companies who have extremely high-availability requirements for ongoing business such as e-commerce, market transactions, or financial settlement processes. Table 1 displays the tier classification different mean time to repair (MTTR), which are shortest at Tier IV and have an availability of 99.991% [27,28].
With operational availability Ao (Equation (1)) (Table 1), a system with a realistic support environment, which consists of all maintenance actions, can be described [29]. Ao is a function of the mean time between maintenance (MTBM) and mean downtime (MDT). Therefore, operational availability is a function of the maintenance policy and logistics. With the measured data, the value for the whole system or just some component or a device within the system can be calculated:
The mean time to repair starts with the actual alarm/event occurrence and consists of the fault detection time (FDT) and repair time (RT) [30]:
To calculate the FDT, we have to sum up the data acquisition time (Tda), the application-processing time (Tap), and the error identification time (Tei):
The application-processing time (Tap) is the time needed to process the node tree application with the database query time (Tapp) and maintenance planning time (Tmp) based on history data [31]. Time to process the alarm events (Tapp) with this MNEP method mostly depends on the performance of the hardware used in the processing procedure (Tos—operating system application time, Tserver—main server response time, TDBMS—database management system time, and TNetwork—network response time).
The recovery time (RT) is described as a sum of maintenance response time (Tre) and the actual time to repair (Trp) the affected item [32].
4. Experimental Results
4.1. Block Diagram of Data Center Technical Infrastructure
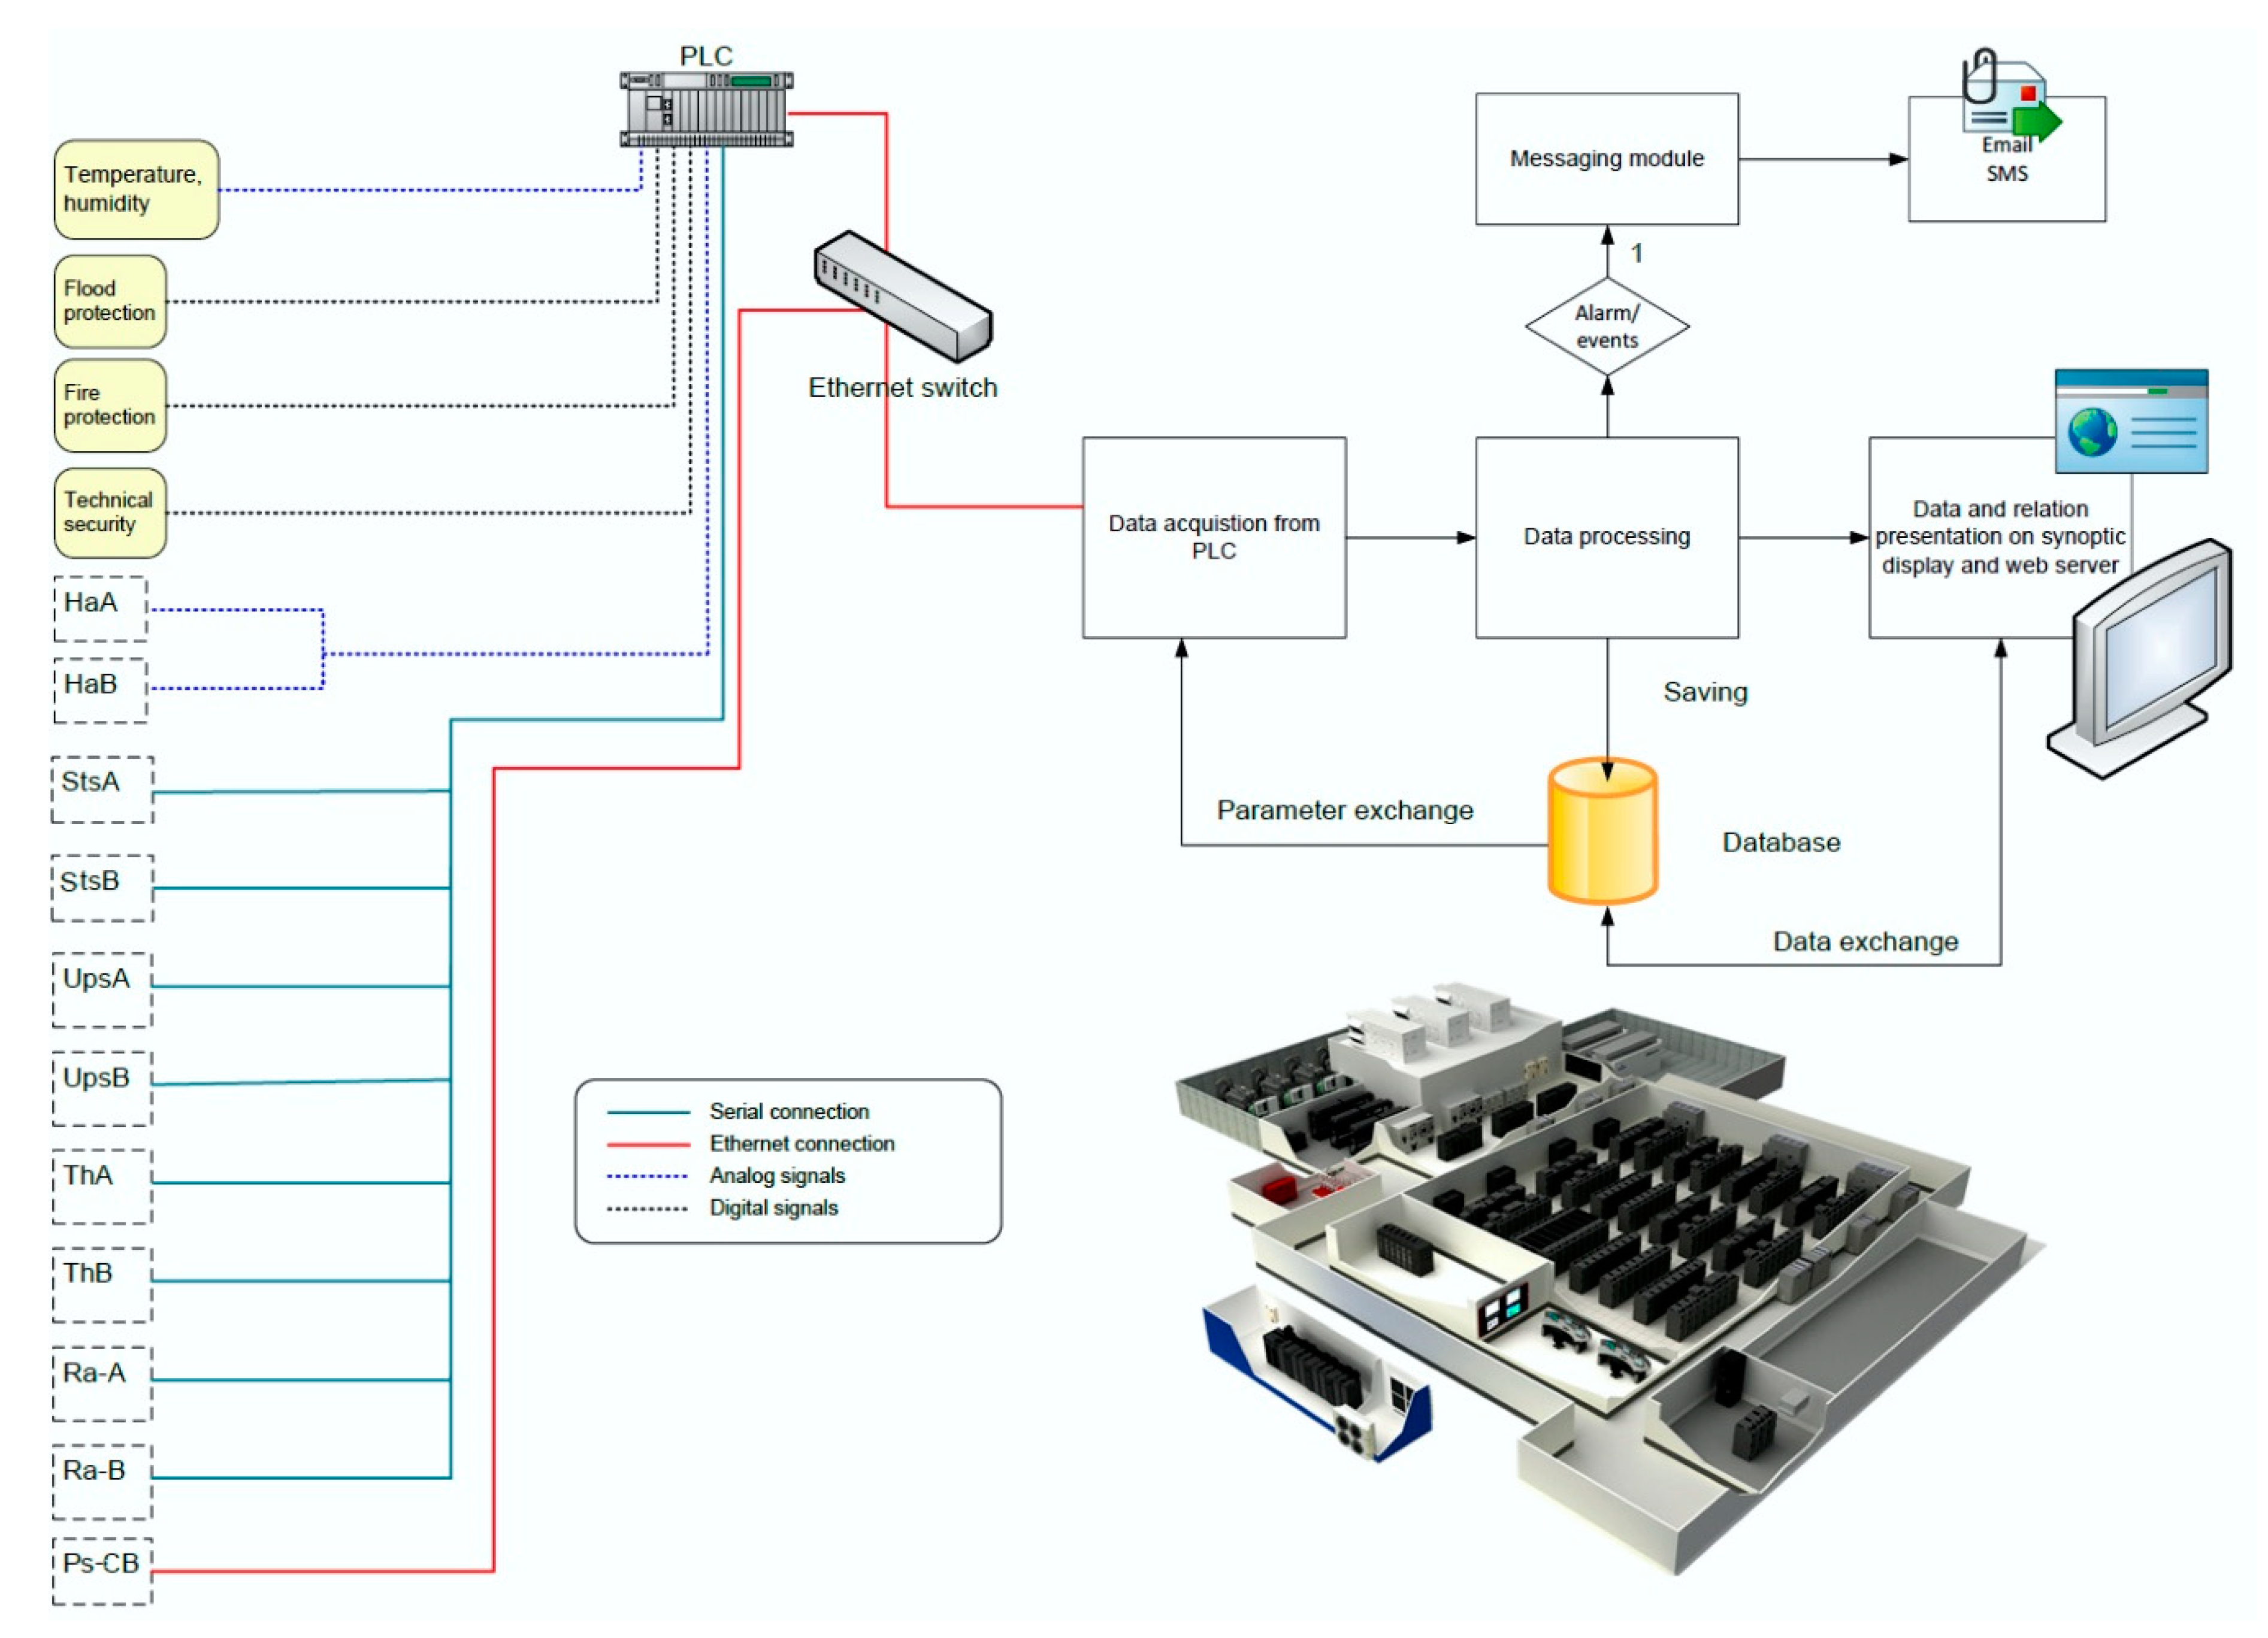
Figure 1 illustrates the data processing flow in the data center technical infrastructure. Data is captured to a programmable logic controller (PLC) over various data acquisition interfaces (such as serial, Ethernet, and analog and digital interfaces) and saved to a database.
The device status is acquired from the various sensors. HaA and HaB stand for the cooling chillers, StsA and StsB are static transfer switches, UpsA and UpsB are uninterruptible power supply systems, and ThA and ThB are cooling devices. Ra–A and Ra–B represent the power enclosures for the cooling device power supply and Ps–CB is an enclosure with the power switches and circuit breakers for the IT system equipment. Later on, all acquired data is presented on a synoptic console with an adequate user interface. The starting point in the physical infrastructure design is to build block diagrams for all data center infrastructure layers. A heuristic expert approach to design a constructive and accurate diagram is needed. Based on the process fundamentals, block diagrams are designed for the following layers:
- Power supply,
- Technical cooling,
- Technical security, and
- Control and management
Other layers can be added depending on the construction and demands of the data center (DC) power supplies. The most important base layer is the power supply layer.
4.2. System Node Tree Model for Experimental Power Supply Block
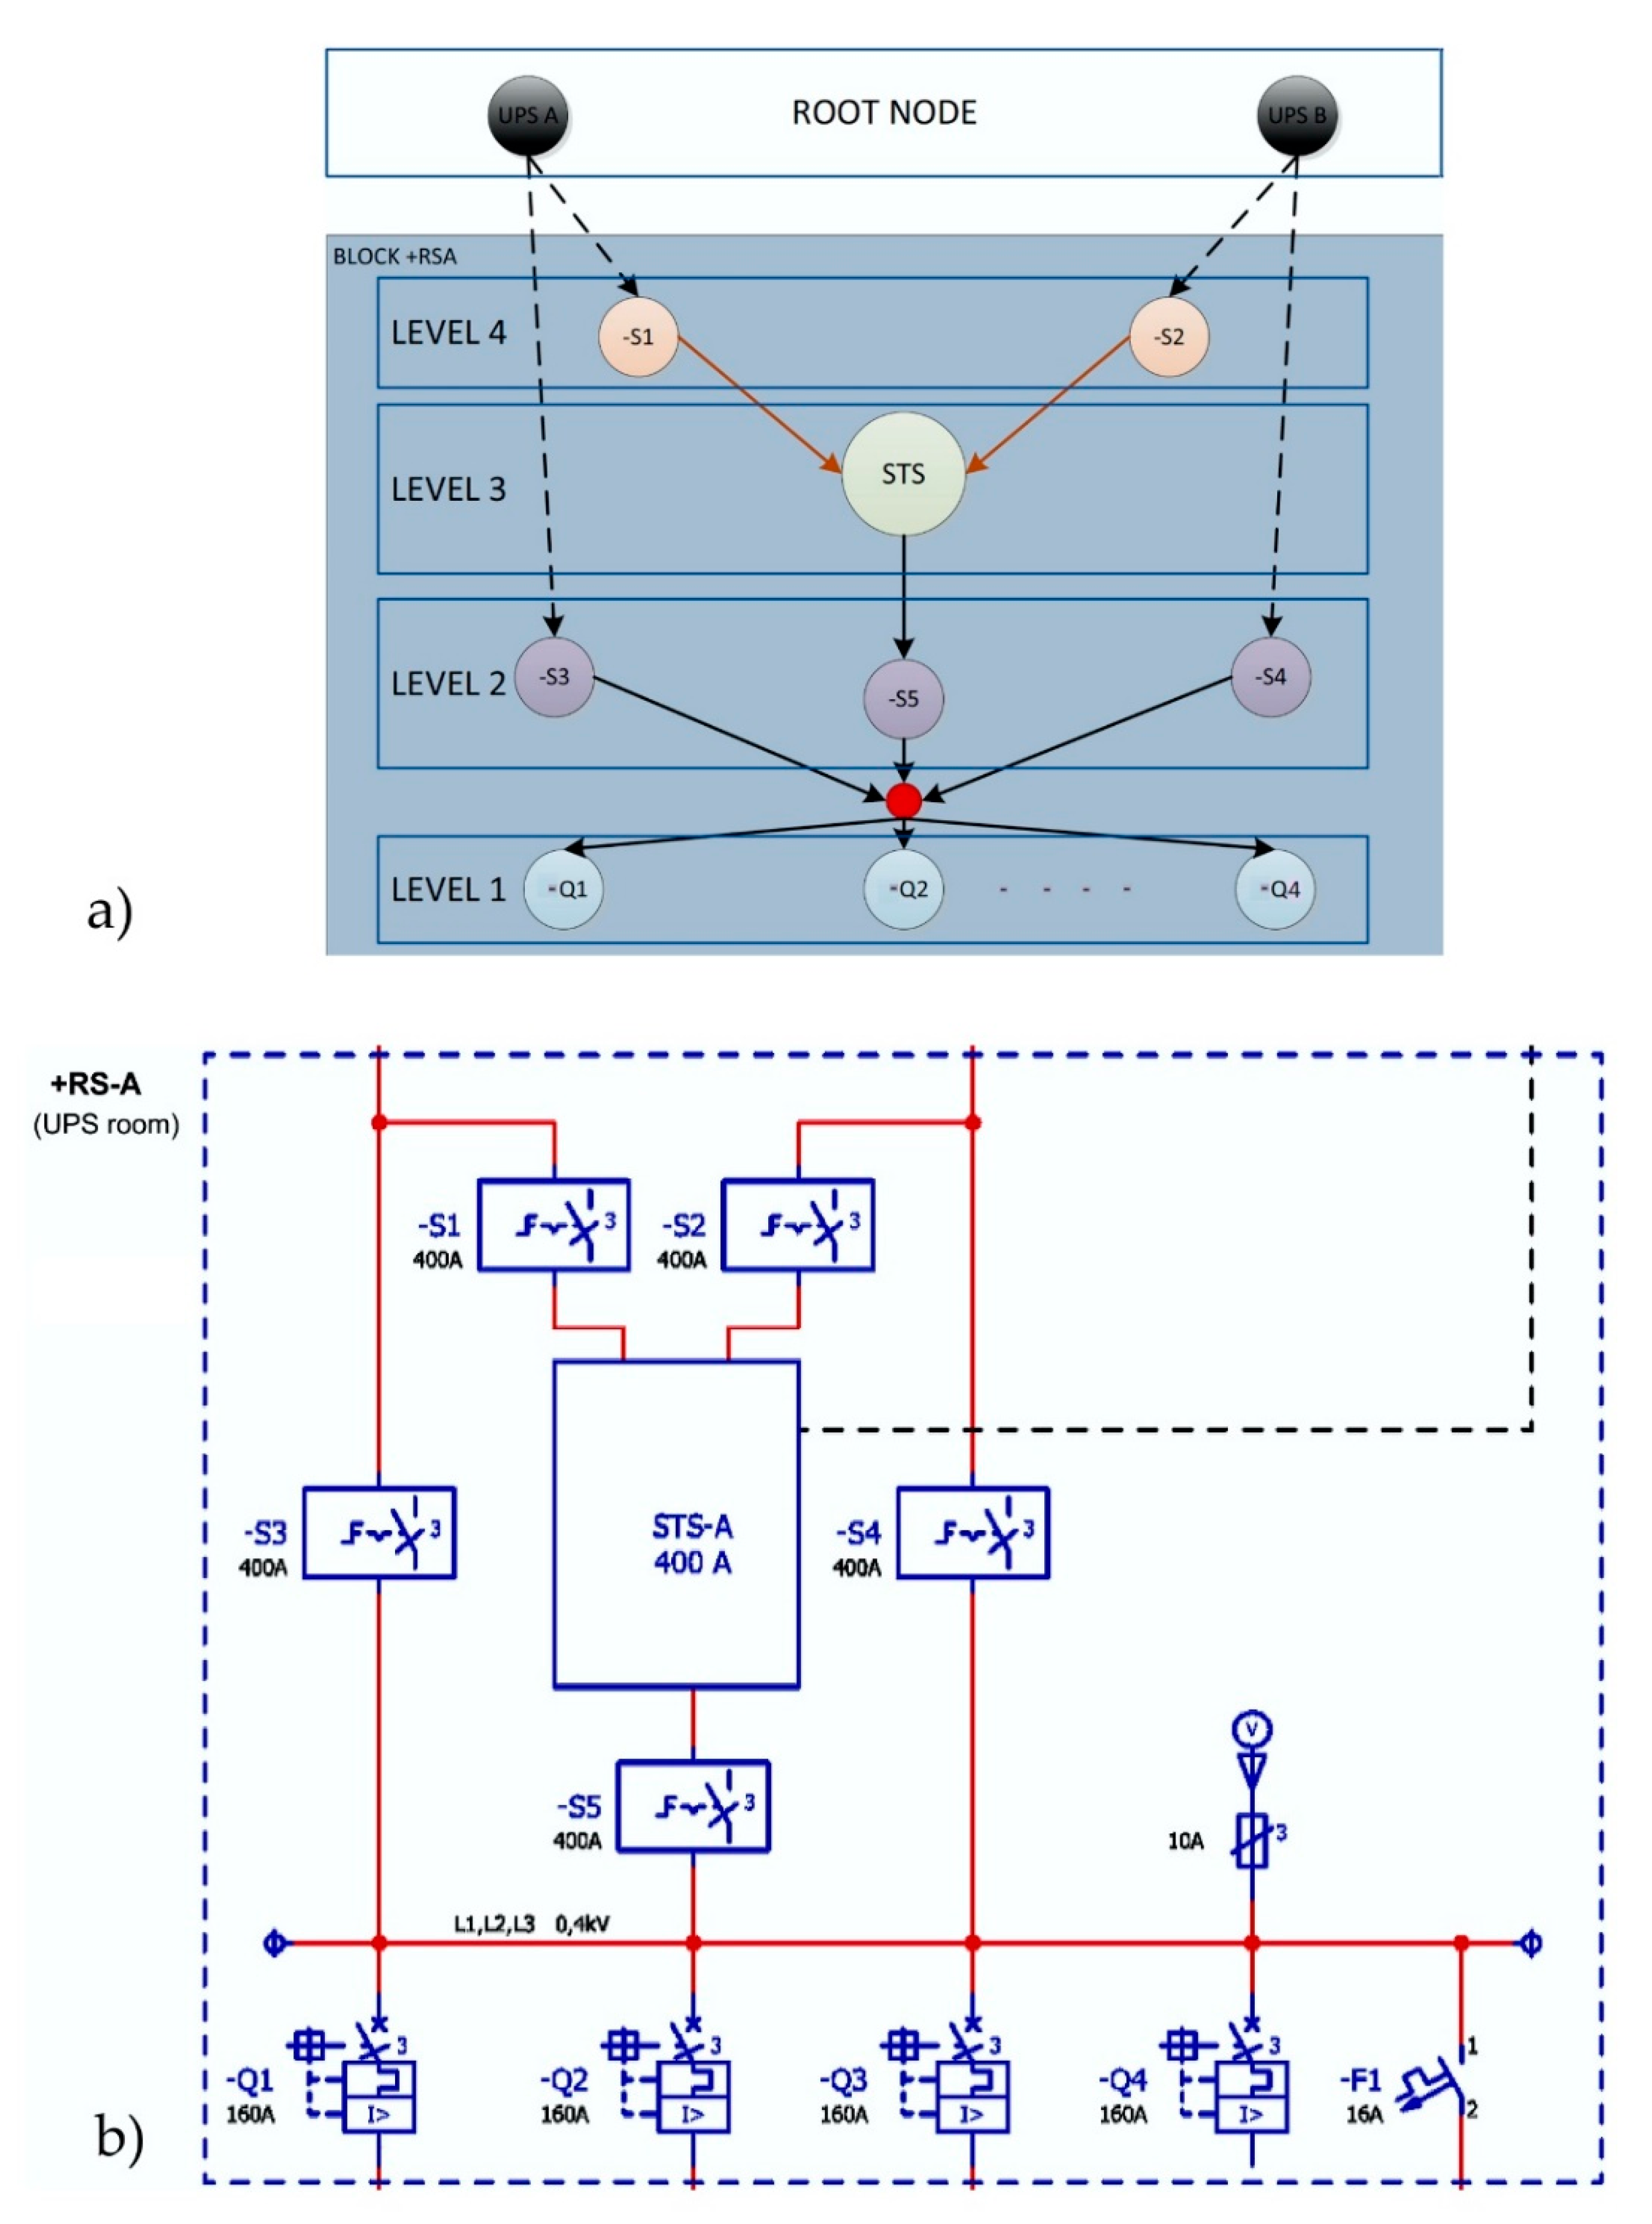
From the data center technical infrastructure block diagram (Figure 1), all components and devices, from which data is acquired, are transformed into nodes (Figure 2a). Figure 2a,b illustrates an experimental block diagram (just a part of it) of the static transfer switch, which has a task to transfer the power supply from one UPS to another one in case of an error or failure of the first UPS. In the experimental power supply block (Figure 2b), the node tree diagram (Figure 2a) shows the two root nodes representing two redundancy paths [33,34]. Devices named -S1 to -S5 represent power switches, STS–A (Figure 2b) is a static transfer switch, -Q1 to -Q4 are circuit breakers, and -F1 is a fuse. To these nodes, events and alarm trends are linked in a software procedure. The node tree is used to show cause and effect relations more precisely and transparently. With this approach, the data model is easier to implement. A tree graph theory was used based on the fact that the tree is a type of an undirected graph in which any two nodes are connected by exactly one path [33]. The node tree remains flexible to handle items with a mixture of real-valued and categorical features. It is proposed that the data is acquired from all components. Once constructed, new nodes can be easily added and classified. It replicates the course of events, and as such, remains robust, with the assumption that the input data is correct. Sophisticated tree models implemented using custom software applications can use historic data to apply a statistical analysis and make predictions regarding the probability of events. Internode is a node with information such as connections and interrelations and is used anywhere where there is more than one linear path. It is marked as a red small node in Figure 2a.
A child is a node connected directly to another node. A parent is a converse notion of the child. Siblings are nodes with the same parent. Since redundancy paths are required, some nodes can have multiple parents. A leaf is a node with no children, presented as -Q1 to -Q4. A path is a sequence of nodes connecting a node with a descendant. The number of connections between the node and the root defines the level of a node. The height of a node is the number of edges on the longest downward path between that node and a leaf. The depth of a node is the number of edges from the node to the tree’s root node. The root node is the node at which algorithms on the tree begin, since as a data structure, one can only pass from parents to children. This algorithm will search from the bottom to the top. All other nodes can be reached by following edges, links, and paths. This approach focuses on the fact that every node in a tree can be seen as the root node of the subtree rooted at that node. For minimizing the tree graph, internodes are used to rationalize the diversification of the graph and make it more transparent where there are multiple nodes with multiple same parents paths. When searching for the status of the relatives of an event, the priority redundancy path must be checked. During the primary redundancy path downtime, the secondary path takes over.
4.3. Data Definition for Event Processing
The data model needs to be implemented in a database management system (DBMS) from the node tree diagram. The first step is to define all nodes and events related to the events and alarm trends in the procedure. The software normally used for the controller programming is the CODESYS software language standard. CODESYS was developed and is marketed by the German (Kempten) software company 3S-Smart Software Solutions. The software tool covers different aspects of industrial automation technology with one surface.
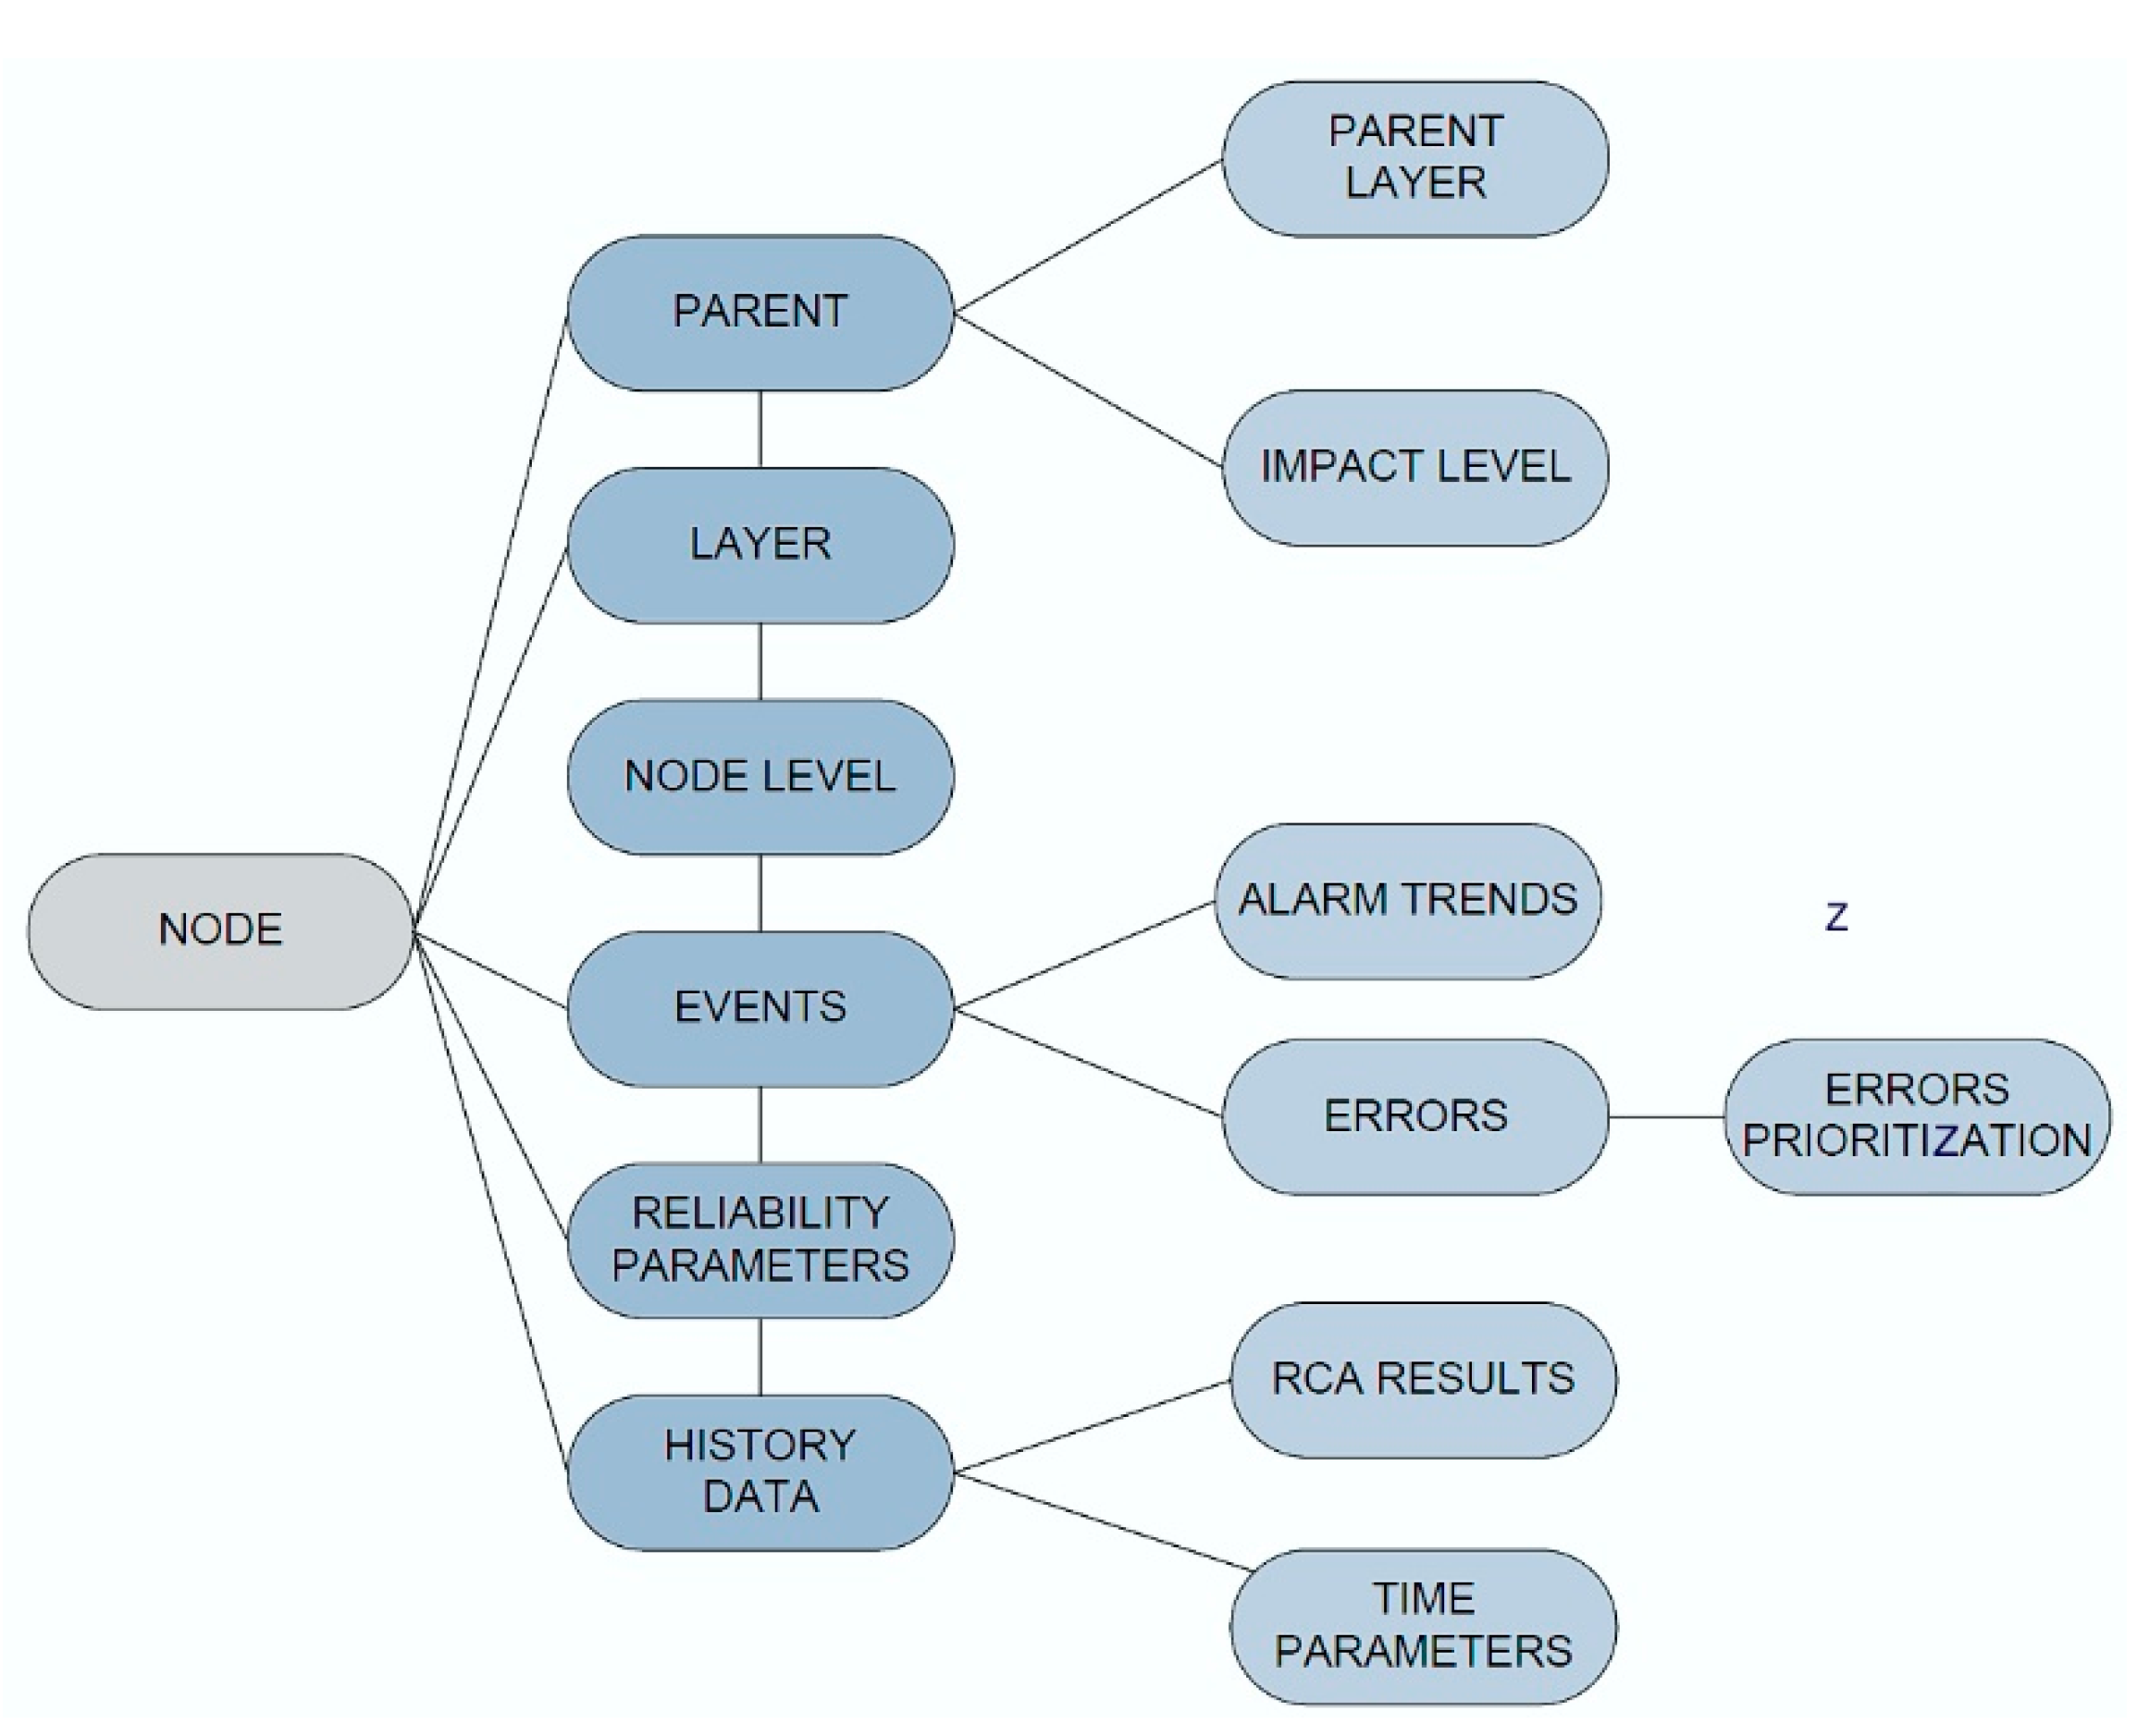
Figure 3 illustrates a node with its sum of possible entities. Database fundamentals were used to store the entities and attributes of all the available nodes and events [35]. Links have to be made between the node and all possible events pointing to the selected node. This also includes definitions of all parents on all available layers. All parent nodes need entities with a prioritization value as an impact level and reliability factors. To maintain and increase the availability rate, the following is to be considered:
- Error tolerance—for example UPS and UPS Bypass in case of internal failure or power overload.
- Redundancy—duplication of vital components of the system (UPS, cooling devices).
- Separation—separation of parts and components of the system to enable fire and water protection.
- Robustness—robust design with modular components.
- Prioritization—focus on important components.
- Simplification—the simplicity of use.
- Automatization—back up power supply and a fire protection system.
- Autonomy—back up power supply time.
4.4. Filtering and Data Correlation
There are many factors that influence the correctness and validation of data. Due to possible data loss resulting from an error in data transfer or discontinuation, a data transfer redundancy path has to be created to reduce the risk of system failure in the design phase. Furthermore, when managing and acquiring a great amount of data, a data overwrite, data reduplication, missing transfer data, and many other related events can happen. Because of these possible events, data filtering has to be done in order to find potential duplicated events and events with missing data in a selected time interval. Filtering also enables the same type of event, gathered via a different type of interface, to be marked as the same event.
After the event filtering and deduplication, a correlation step must be performed in order to search for all related events among alarms. Correlation does not imply causation [35,36], which means that one alarm event does not necessarily cause another. It can only be assumed, as to the definitions, that if the events are correlated, that means that a change of one event causes a change in another node. The correlation factor in this approach is related connectivity. If there are any alarm events that have the same parents, they are grouped together, so the node path of these events is checked in the root cause analysis only once. They are all marked with internode as shown in the event tree diagram. The events in the node tree diagram can also be grouped by the same location.
4.5. Root Cause Analysis (RCA)
Root cause methods and analyses track a problem to its source [37]. This technique is used to find an answer to a question as to what triggered a specific event. RCA assumes that systems and events are dependent. An event in one part of the system causes an effect in another part and so on. With the event tracking back to its source, the source of the problem and its consequences are identified. Patterns of negative consequences must be researched, hidden flaws in the system identified, and specific events, which led to the problem, defined. There is a possibility that an RCA reveals more than one root cause. In theory, RCA is performed heuristically with experts. RCA normally uses a manual cause and effect diagram, with which answers to why a specific causal factor exists or why it happens are researched for all possible causes and effects. Suggestions for the corrective actions must address the causes identified during the analysis process.
The MNEP method starts with the automated RCA on saved data gathered with the correlation procedure. Query on data starts on a node or a group of nodes with no child. Nodes that have the same group of parents have the same internode as described in Section 3.2. The procedure checks the parent state of all nodes in a possible alarm state. If a parent of the observed node is also in an alarm state, the procedure repeats the loop and checks the state of the next parent until it reaches the parent with no more error states. When following the parent’s path up the tree diagram, one redundancy path with the highest parent priority has to be checked as far as there is data available. Later, the parent’s path with other lower parents’ priority factors are checked. After applying queries to data, possible outcomes as results of an RCA are:
- Linear path event: root cause is on linear path in a node tree diagram with no other parent in the error event.
- Redundancy path event: multiple parents with the priority value and all redundancy paths are checked in order to define actual root cause.
- Isolated event: there are no related nodes with an event error.
- Event on layer 2 and deeper: event on layer 2 can have a root cause on layer 1.
- Missing data link: multiple linear paths are checked with possible root cause node events identified.
- More root causes: alarm prioritization according to node reliability.
In any given system, there are sometimes special events, which lead to special case consequences. These are special cases, which need to be accordingly formalized, manually defined, and implemented. This scenario is often implemented when the DC infrastructure is in operational mode because not all the events can be predicted in the design phase.
4.6. Experimental Results of the MNEP Methodology
From the described block diagram (Figure 1), relations were presented in the node trees and accordingly saved to the database. Experimental data was taken from the previously saved events of a random data center, which occurred over some longer period of time. Since data centers are designed to avoid alarms and errors, and it takes a longer time for the data center management control to detect an alarm event. All equipment and devices must comply with high reliability standards.
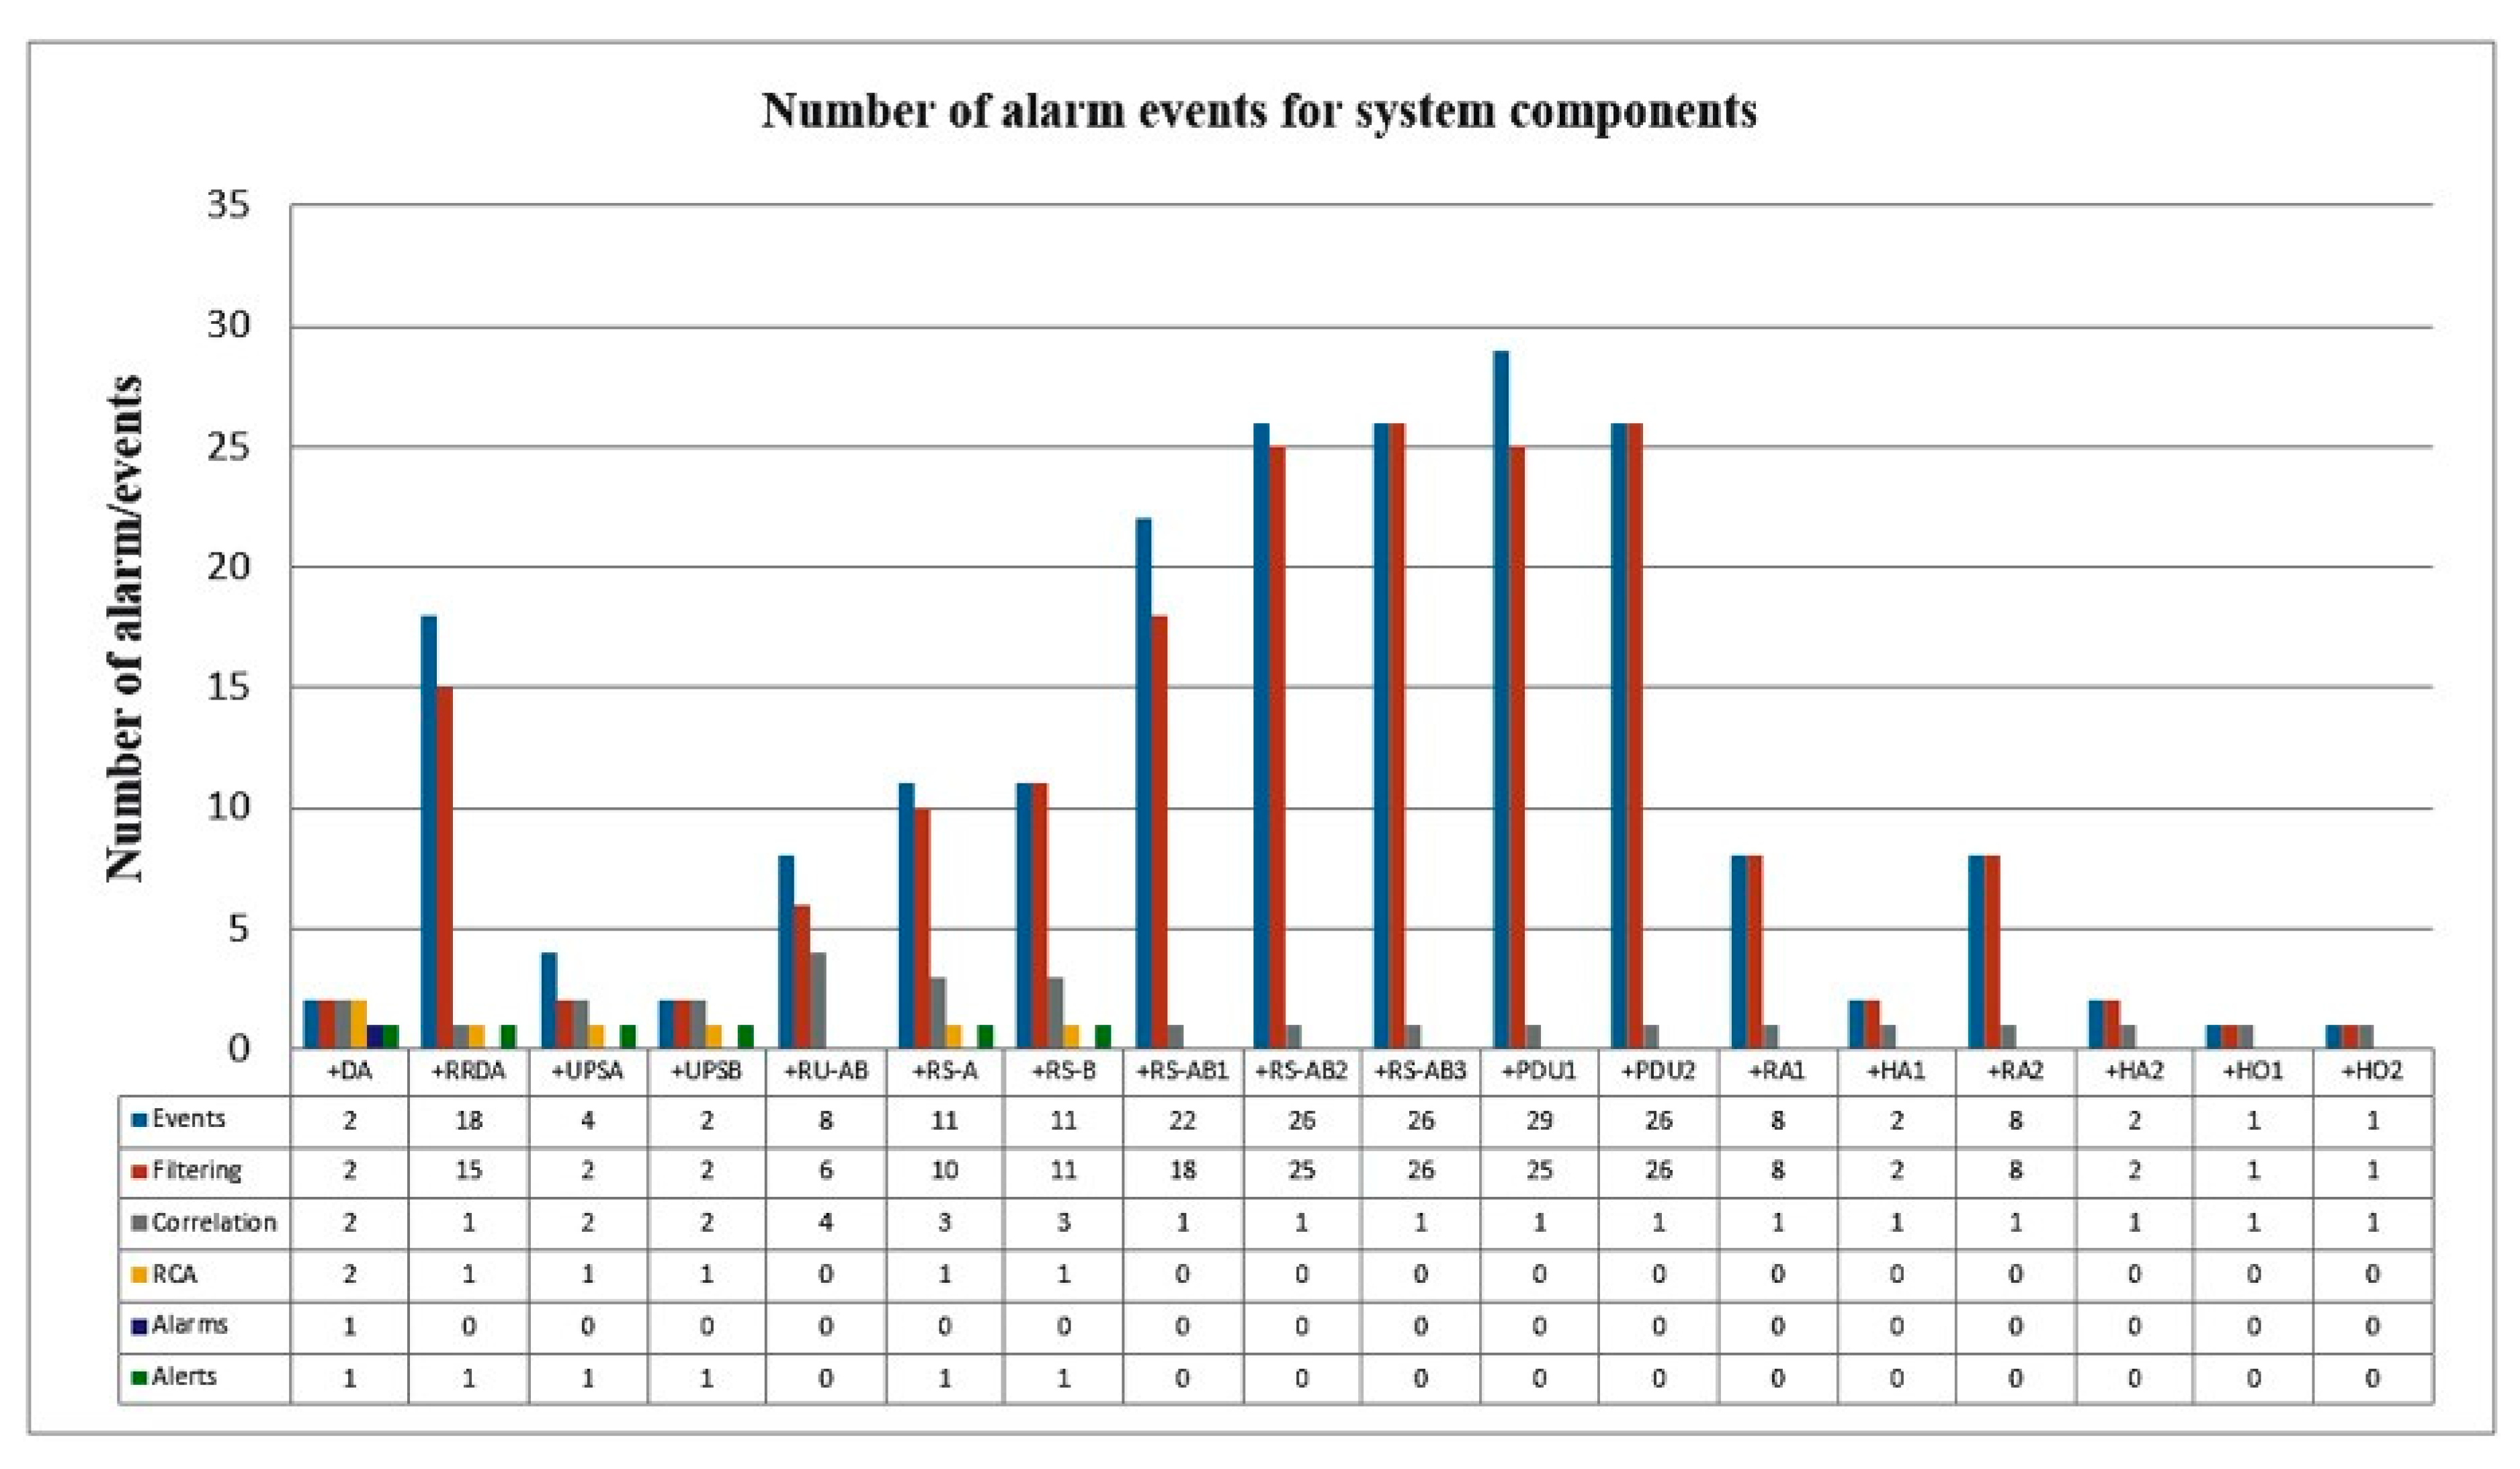
For the first experiment, the power supply downtime of the data center was simulated. All nodes had an event with alarms. Testing data was manually inserted in the database in Figure 4 events. The main root cause was inserted as a diesel generator breakdown due to a filter error. Figure 4 presents the numbers of alarms divided on components of the layer 1—power supply. For more transparent presentation, nodes with alarm events were grouped into parts related to the same device or power supply enclosures and devices. For example, components labelled “+DA” refer to the diesel electrical generator set. The power supply enclosure of the system cabinets is labelled with “+RS–AB”. The power distribution unit is marked as “+PDU,” and it is the power supply in each IT cabinet. Label “+UPSA,” for example, represents UPS A with all components related to it. The steps in the procedure marked with colors were applied to the database systematically, as shown in Figure 4. In the test data, the events and/or alarms that caused the data center downtime were taken into account. From the number of events it was calculated that the number of saved alarms was reduced to 92.41%, which means that the mean number of all alarms reduced by 7.59%.
After data filtering, a correlation procedure was applied in order to receive the related alarm events and to group the related events with the same group of parents. Following the connection of related events with internodes, the correlation gave results for an individual part of the system as shown in Figure 4 in the line “Correlation”. Figure 4 shows that the number of alarm events decreased by 56.84%. For example, in enclosures +RS–AB 1, 2, and 3, which all have directly connected users with power switches, but they all have same parent internode, they have the same group of power supply possibilities (UPSA and UPSB). Alarm events of this enclosure were grouped and therefore reduced to the same internode.
The RCA query procedure (Figure 2a) started with a node with no child. In case an internode existed as a parent of a node, all other children from the internodes were ignored. More root causes were identified due to the special rules saved with node entities (Figure 3). A backward chaining method was used to find the root cause from the group of related events. Therefore, as a result of the RCA, we had alarm events for:
- The diesel generator, which is also main root cause and one redundancy option power supply.
- RS–A and RS–B, which have the same power supply source, which is the main network power supply.
- UPSA and UPSB, which are identified as a root cause because of redundancy options and need to be maintained and checked.
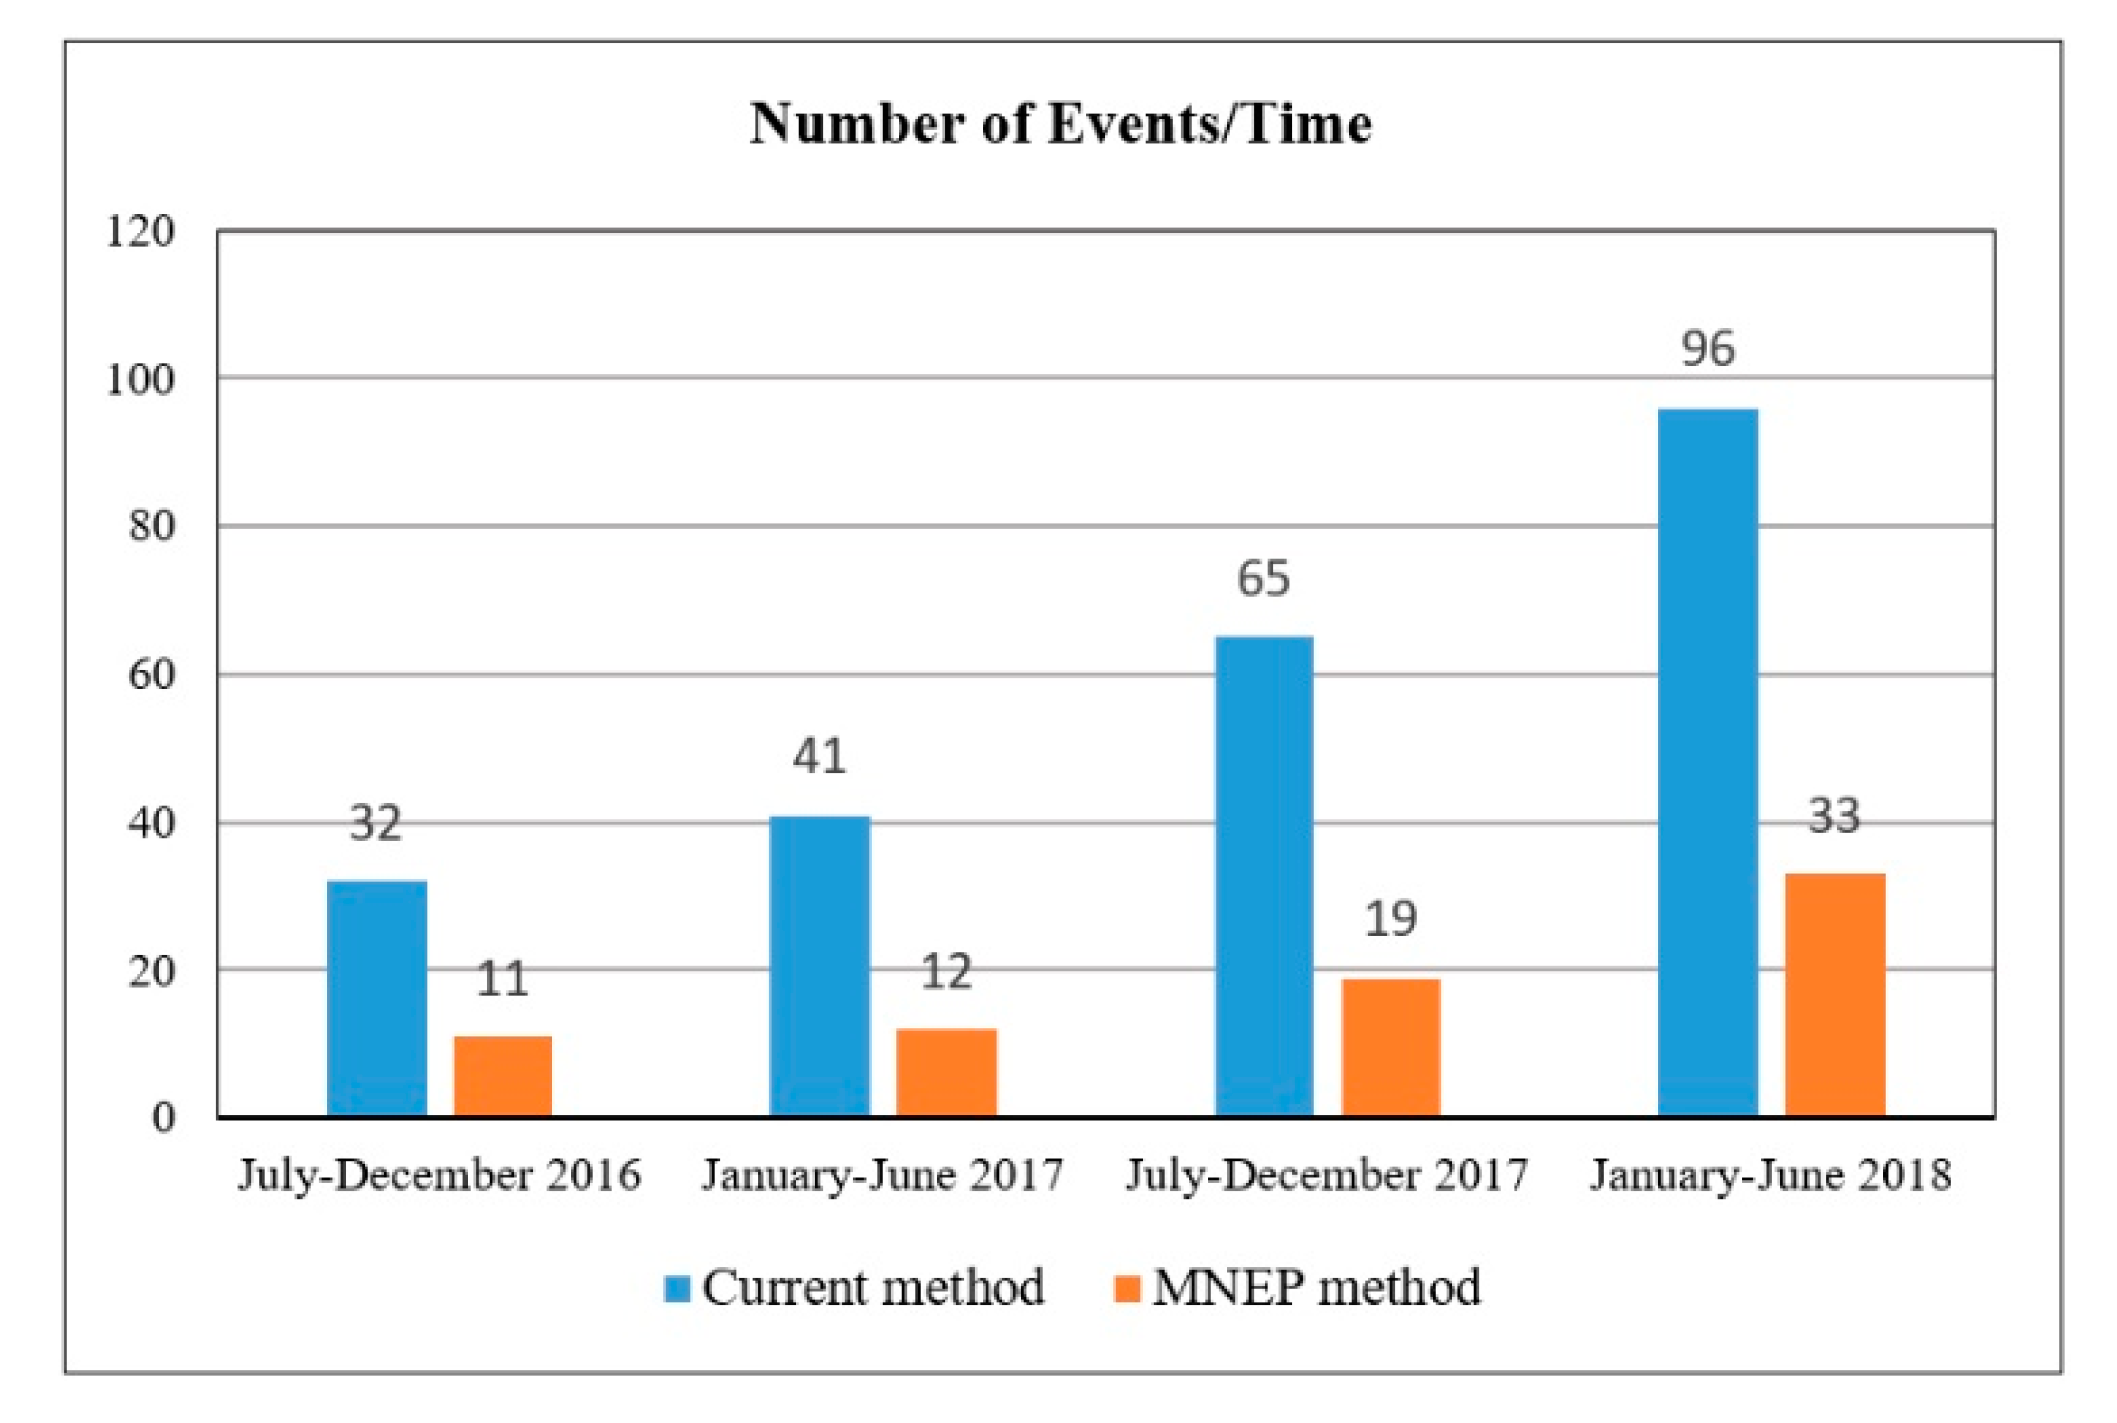
The third experiment was done on data saved in the history database for the messages, which were sent to the administrators. These messages contained all the information regarding events that occurred in the history. Figure 5 illustrates the sum of all events sent to corresponding administrators and maintenance with comparison to composed new messages based on the MNEP method. With this method applied to the saved data, the number of events as seen in Figure 5 was reduced. The event data that was saved in the history table was compared with the currently detected root causes. The graph shows that with the increasing number of alarms (events), detected real alarms increased as well when using the MNEP method. During the event collection period, no data center downtime occurred.
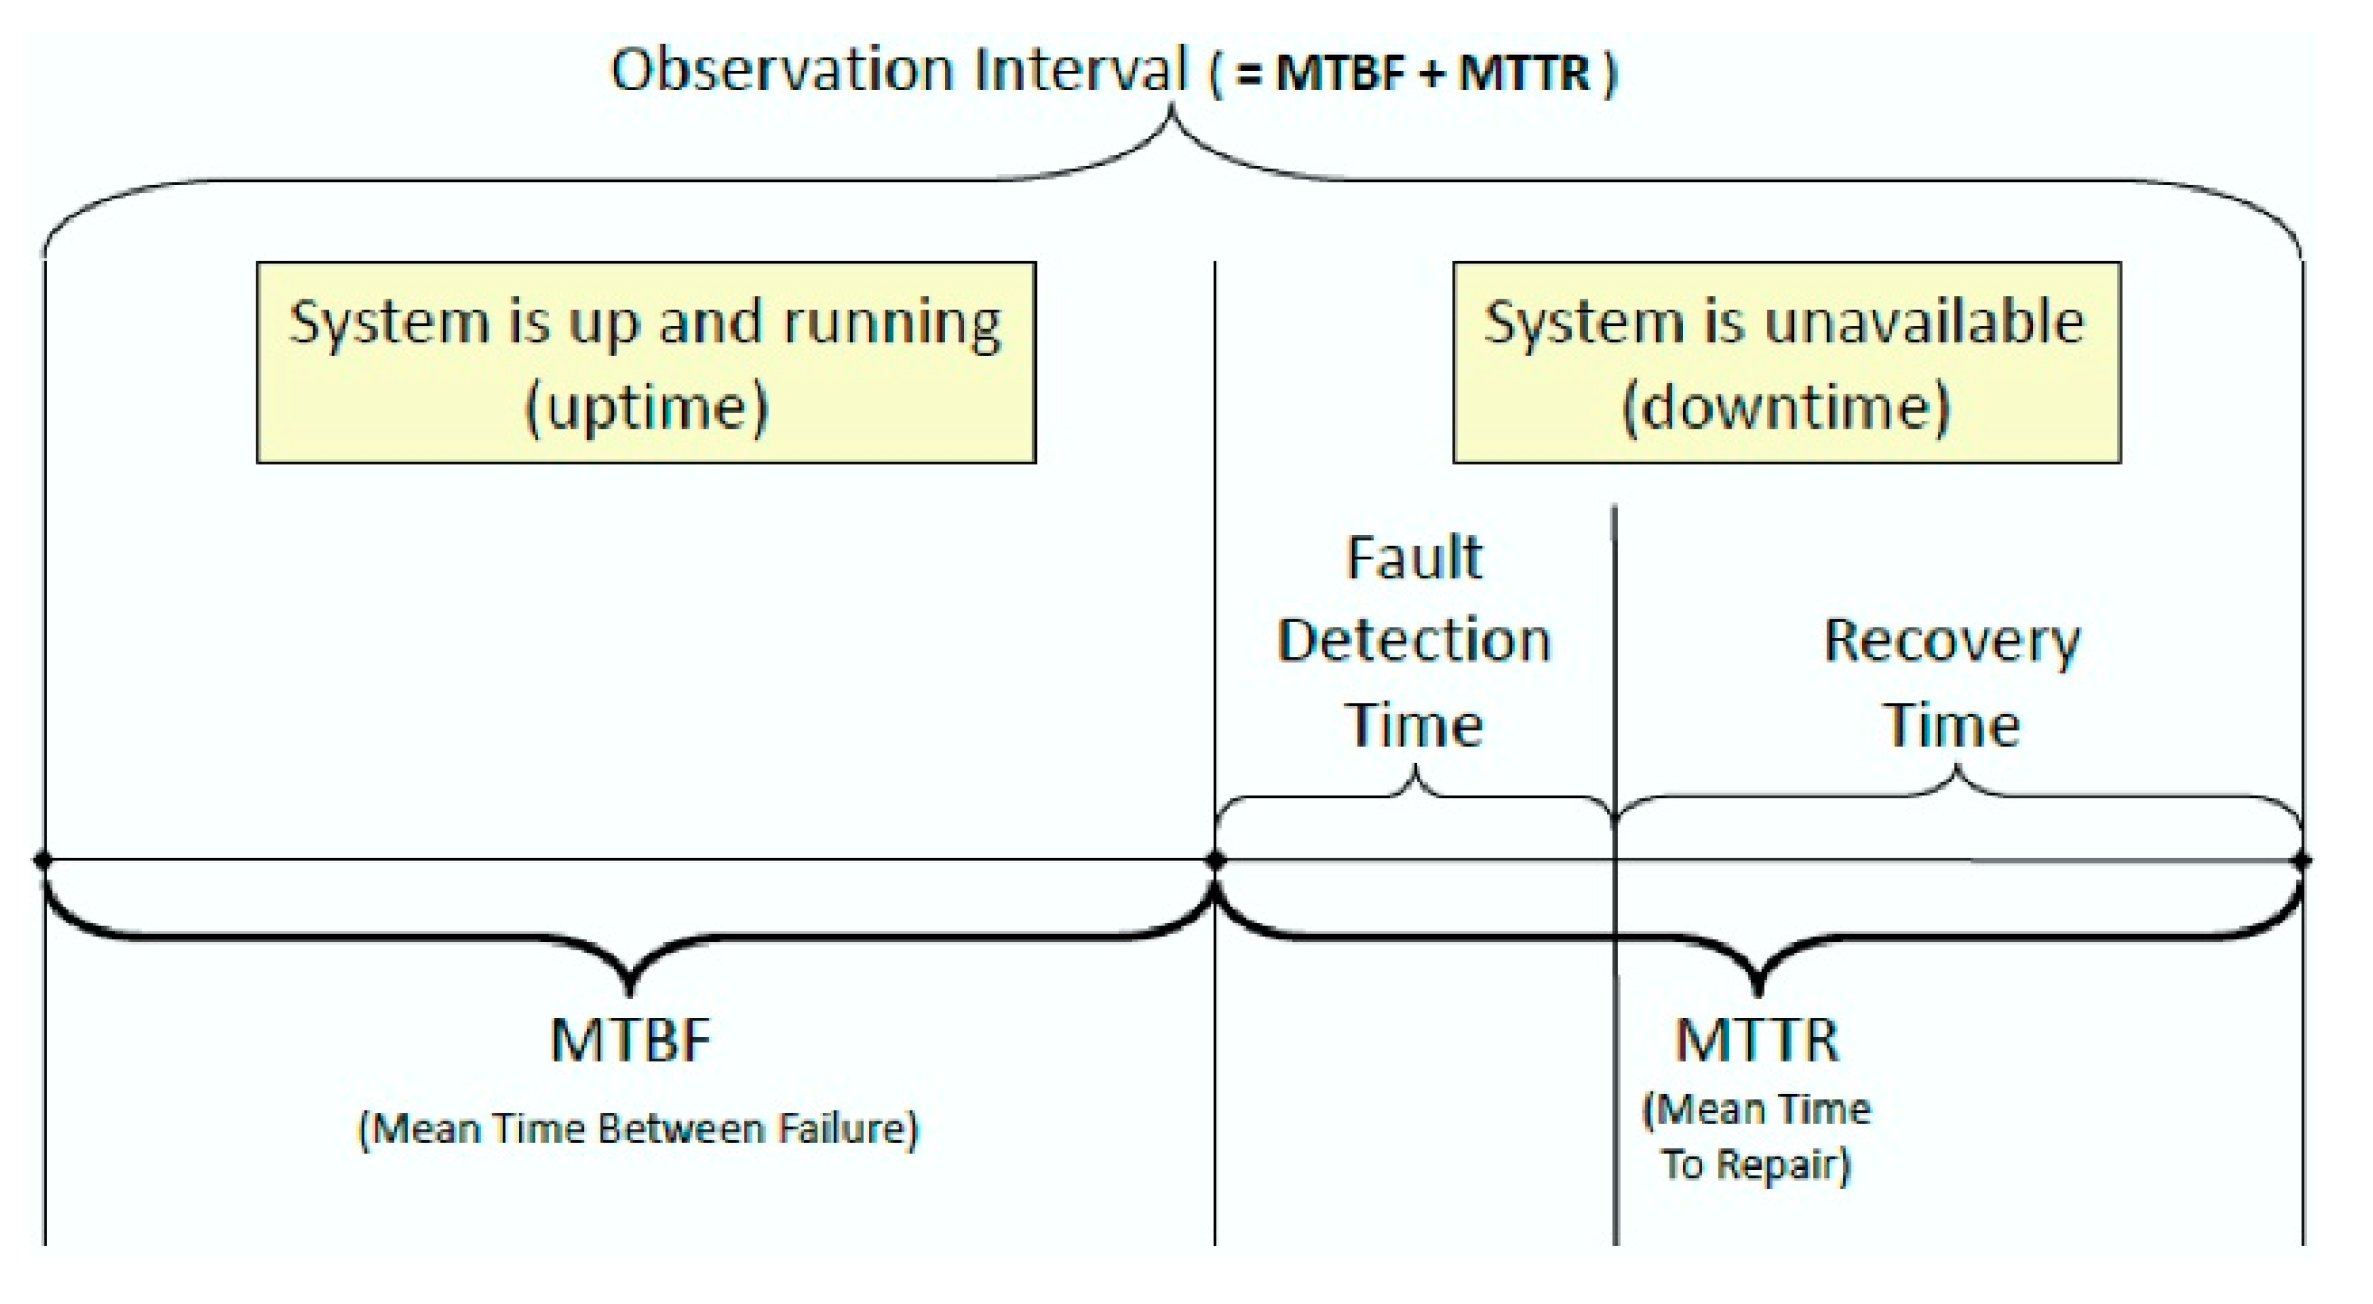
The fourth experiment was to compare the time factors, which contribute to the maintenance process. Time is always a factor that affects the effectiveness and availability parameters when overlooking the system in operational mode. Figure 6 presents the time parameters that were important for the observation. MTBF is the time with no error events.
Mean time to repair (MTTR) starts with an error event, which is also the fault detection time and ends with the identification of the error. The recovery time starts with the repair and maintenance actions and ends with the system’s full availability again.
In Table 2, the comparison of the mean times calculated from data saved in the history database with the times measured using the new approach is presented for the similar events. The results in Table 2 demonstrate the reduced time for the event identification and recovery time when using the MNEP method. The other difference is the maintenance planning time, which was decreased because of the exact and accurate root cause identification.
When comparing parameter Ao (Equation (1)) in Table 2 without and with the use of the new event processing system, we can compare the MTBM and MDT data in hours. From the database time history, the factors were taken for one particular downtime of one specific component whose MTBM = 5149 h and MDT improved from 17 h to 3 h. The calculations show that operational availability Ao without the use of this method was 99.671% (tier I). When using the MNEP method Ao improved, achieving the value of 99.936% (tier III). From the results it can be concluded that MDT was greatly reduced based on the MNEP method. With the lower value of MDT, the data center availability could reach 99.991% (tier IV) as proposed in the tier classification of the data center in Section 3.2.
5. Discussion
The experimental results of MNEP method (Figure 2, Figure 3, Figure 4 and Figure 5), provide more precise information on the node presenting root cause. From a large number of nodes with events, the number was reduced to a minimum by identifying the main root cause. With that root cause, all the possible consequences were displayed and enabled the user to browse through them and arrange them as needed. With the number of alarm events, the ratio between results, before using the MNEP approach and after, increased.
Data center energy efficiency has attained a key importance in recent years due to its (i) high economic, (ii) environmental, and (iii) performance impact. First, data centers have high economic impact due to multiple reasons. The cooling infrastructure consumes a major portion of the data center energy followed by servers and storage, and other infrastructure elements. A typical data center may consume as much energy as 25,000 households. Data center spaces may consume up to 100 to 200 times as much electricity as a standard office space. A general approach to manage data center energy consumption consists of four main steps: feature extraction, model construction, model validation, and application of the model to a task such as prediction [38]. Opposite of this, the MNEP method simultaneously provides more precise information about the energy consumption because the working parameters of each IT component are also included in the multilayer node event processing. Second, data center energy usage creates a number of environmental problems [39,40]. A recent study done by Van Heddeghem et al. [41] has found that data centers worldwide consumed 270 TWh of energy in 2014 and this consumption had a compound annual growth rate (CAGR) of 4.4% from 2007 to 2014. Due to these reasons, data center energy efficiency is now considered a chief concern for data center operators, ahead of the traditional considerations of availability and security [38]. The MNEP method provides more information from layer 1 (power supplies, cooling systems, etc.) regarding how to decrease the energy consumption growth rate in data centers. Finally, even when running in an idle mode, servers consume a significant amount of energy. Large savings can be made by turning off these servers. This and other measures, such as workload consolidation, need to be taken to reduce data center electricity usage. At the same time, these power saving techniques reduce system performance, pointing to a complex balance between energy savings and high performance. MNEP raises the energy efficiency of data centers because apart from the economic, environmental, and performance impacts, it also shortens MTTR, reducing in this way the cost of repair and raising the availability class. For example, computer room air conditioning (CRAC) units, which are a part of the cooling infrastructure, receive power through UPSs to maintain consistent cooling even during possible power failure. A swift data center failure identification is vital to the provision of the high-quality service. This is guaranteed by high availability and justifies higher service cost charged to the users.
When overlooking and comparing the time parameters in Table 2, the results show that with the new time to plan maintenance reduces because the maintenance has possible root causes presented on the user interface. Without the use of a new alarm event processing, system administrators had to rely on their system knowledge and search through all alarm events reported. With the help of results using the MNEP method, administrators and maintenance personnel can plan corrective actions more effectively and have a clearer overview on the systems components. The time needed for the application to process is negligible in comparison to the time needed for the maintenance plan.
The main advantage of the MNEP method is the reduction of MTTR based on a faster and more accurate cause identification. This method is also robust and modular since any new components can be easily added with minor procedure modifications (new parent–node links). With all acquired data of the selected event, a unique data source on reliability and availability status of the components in the data center physical infrastructure is obtained. Furthermore, these results can improve standards for the efficient energy management, maintenance actions, and replacing, changing, and adding components of the system. The disadvantage of this method is that most of the work is done in the design phase in order to maintain a higher level of availability. This method allows power supply addition, removal, and replacement, but the foundation should be designed during the data center infrastructure design phase. Any additional steps to increase availability in the operating phase requires higher costs in the life cycle of the process with minimal impact on availability. On the other hand, this processing system can be implemented later in the operating phase, whereby all relations between devices and equipment need to be identified and researched in detail as well.
The most critical activities of the MNEP method are addressed to design a software and sensor system in which all nodes (all components) need to be identified for the monitoring of all possible parameters that are crucial to the efficient data center operation. There are some limitations of the MNEP method. Humidity, for instance, can put the reliability of the IT computing equipment at risk. Very high humidity can cause water vapor to condense on the equipment, while very low humidity can cause electrostatic discharges. The primary purpose of the data center thermal management is to keep the temperatures in the room space and racks lower than the upper limits required in the standard with the lowest energy consumption [42]. The temperature for the A1 class should be in the range between 15 °C and 32 °C and the relative humidity between 20% and 80% [43]. Additionally, the evaluation metrics plays an important role in the thermal performance description. Several metrics have been introduced, such as the well-known power usage effectiveness (PUE), which shows the total energy consumed in a data center per unit of energy consumed by the IT load. However, to provide additional information that is not included in the meaning of the PUE, some other metrics, like the carbon usage effectiveness (CUE), the green energy coefficient (GEC), or the energy reuse factor (ERF) are considered relevant and give an idea about the introduction of renewable energy or the reuse of waste heat in data centers [44,45,46]. The overall performance metrics have also been conducted in References [44,46,47], in which the energy and cooling efficiency of a small data center was evaluated with 25 parameters over a period of six weeks of real-time monitoring. A wireless sensor network was established for the operational data center cooling system, and the measured data was compared using the supply heat index (SHI), rack heat index (RHI), rack cooling index (RCI), rack temperature index (RTI), and PUE. It was found that the server racks were overcooled for over 25% when the SHI and RHI were 16% and 74%, respectively. It demonstrated the potential for improving thermal improvement by lowering the cooling load. It was suggested that the thermal performance should be evaluated with metrics for the data center level and server rack level simultaneously such that the overall performance of data center cooling system could be indicated more accurately. This goal can be reached with the MNEP method [43,44,45,46,47].
In general, the MNEP method brings the following benefits: increased probability, frequency, and consistency of good decision-making for the corrective actions performed, and better energy performance monitoring. This method also enhances the utilization of most of the available data. It also permits objectivity by weighing evidence of alarm events reported without regard to the users’ personal reactions. Furthermore, dynamics is available through the modularity of the processing structure. The results encourage deeper investigation and research on critical events. The MNEP method does not guarantee the improvement of data centers’ energy efficiency [48] when all components are not included in the method. With the system upgrade, we can search through the history data for reports on a particular part of the system or device to check the reliability, availability, and energy efficiency of a particular manufacturer and include it in future decisions when purchasing the new equipment.
6. Conclusions
This article presents an overview of a MNEP method for the data center physical infrastructure monitoring and event management using the node tree diagram approach for enhanced data availability. The concept of event processing design and implementation was discussed and used as an advice guide to achieve an energy-efficient required availability level. The results show that all the described steps of this method contributed to the minimization of the events (alarms), since all produced events could have consequences on other related events.
The MNEP method also produced benefits such as identification of potential opportunities to reduce energy and the use standardized actions for addition and replacement of the equipment. It provided administrators with a wider overview of the current data center infrastructure’s operational state, which additionally contributed to the increased data center energy efficiency and availability.
Author Contributions
The presented work was carried out in collaboration between both authors. B.B. developed the software for the multilayer node event processing and conducted experiments, while V.M. supervised the work, analyzed the results, and prepared the article.
Funding
The authors are grateful to the Slovenian National Science Foundation for the partial support of this work though projects under Grant P2-0028.
Acknowledgments
The authors acknowledge the University of Maribor, Faculty of Electrical Enginnering and Computer Science and NTR Inženiring d.o.o., both from Maribor, Slovenia for technical support, and materials used for experiments.
Conflicts of Interest
The authors declare no conflict of interest.
References
- Ciapessoni, E.; Cirio, D.; Kjolle, G.; Massucco, S.; Pitto, A.; Sforna, M. Probabilistic Risk-Based Security Assessment of Power Systems Considering Incumbent Threats and Uncertainties. IEEE Trans. Smart Grid 2016, 7, 2890–2903. [Google Scholar] [CrossRef]
- Guerraiche, K.; Rahli, M.; Zeblah, A.; Dekhici, L. Budgetary and Redundancy Optimization of Heterogeneous Series-Parallel Power Systems under Availability Constraints. Energy Procedia 2015, 74, 547–554. [Google Scholar] [CrossRef]
- Jia, M.; Srinivasan, R.S.; Raheem, A.A. From occupancy to occupant behavior: An analytical survey of data acquisition technologies, modeling methodologies and simulation coupling mechanisms for building energy efficiency. Renew. Sustain. Energy Rev. 2017, 68, 525–540. [Google Scholar] [CrossRef]
- Bostoen, T.O.M.; Mullender, S.; Berbers, Y. Power-Reduction Techniques for Data-Center Storage Systems. ACM Comput. Surv. 2013, 45, 33. [Google Scholar] [CrossRef]
- Silva, M.J.D.; Pereira, C.E.; Götz, M. Knowledge Awareness in Alarm System Database. IFAC-PapersOnLine 2016, 49, 297–302. [Google Scholar] [CrossRef]
- Xu, J.; Tang, L.; Li, T. System situation ticket identification using SVMs ensemble. Expert Syst. Appl. 2016, 60, 130–140. [Google Scholar] [CrossRef]
- Liu, H.C.; You, J.X.; Li, Z.; Tian, G. Fuzzy petri nets for knowledge representation and reasoning: A literature review. Eng. Appl. Artif. Intell. 2017, 60, 45–56. [Google Scholar] [CrossRef]
- Fu, X.; Ren, R.; McKee, S.A.; Zhan, J.; Sun, N. Digging deeper into cluster system logs for failure prediction and root cause diagnosis. In Proceedings of the 2014 IEEE International Conference on Cluster Computing (CLUSTER), Madrid, Spain, 22–26 September 2014. [Google Scholar]
- Kyoung, S.B.; Myung, H.Y.; Jae, S.Y.; Byoung, Y.L. Efficient Complex Event Processing over RFID Streams. Int. J. Distrib. Sens. Netw. 2012, 2012, 435213. [Google Scholar] [CrossRef]
- Higashino, W.A.; Eichler, C.; Capretz, M.A.M.; Bittencourt, L.F.; Monteil, T. Attributed Graph Rewriting for Complex Event Processing Self-Management. ACM Trans. Auton. Adapt. Syst. 2016, 11, 19. [Google Scholar] [CrossRef]
- Jabeen, F.; Nawaz, S. In-network wireless sensor network query processors: State of the art, challenges and future directions. Inf. Fusion 2015, 25, 1–15. [Google Scholar] [CrossRef]
- Guo, W.; Healy, W.M.; Zhou, M. Impacts of 2.4-GHz ISM Band Interference on IEEE 802.15.4 Wireless Sensor Network Reliability in Buildings. IEEE Trans. Instrum. Meas. 2012, 61, 2533–2544. [Google Scholar] [CrossRef]
- Amaro, J.P.; Cortesao, R.; Landeck, J.; Ferreira, F.J.T.E. Harvested Power Wireless Sensor Network Solution for Disaggregated Current Estimation in Large Buildings. IEEE Trans. Instrum. Meas. 2015, 64, 1847–1857. [Google Scholar] [CrossRef]
- Wiboonrat, M. Next Generation Data Center Design under Smart Grid. In Proceedings of the 2012 Fourth International Conference on Ubiquitous and Future Networks (ICUFN), Phuket, Thailand, 4–6 July 2012. [Google Scholar]
- Sneha; Alam, M.A. Study and Analysis of Energy Efficient Data center for Sustainable Development of ICT. Int. J. Adv. Res. Comput. Sci. 2017, 8, 1486–1490. [Google Scholar]
- Straka, M.; Lenort, R.; Khouri, S.; Feliks, J. Design of Large-Scale Logistics Systems using Computer Simulation Hierarchic Structure. Int. J. Simul. Model. 2018, 17, 105–118. [Google Scholar] [CrossRef]
- Derringer, C.; Rottman, B.M. How people learn about causal influence when there are many possible causes: A model based on informative transitions. Cogn. Psychol. 2018, 102, 41–71. [Google Scholar] [CrossRef] [PubMed]
- Vrana, S.R.; Vrana, D.T. Can a computer administer a Wechsler Intelligence Test? Prof. Psychol. Res. Pract. 2017, 48, 191–198. [Google Scholar] [CrossRef]
- Opmanis, R.; ĶIkusts, P.; Opmanis, M. Root Cause Analysis of Large Scale Application Testing Results. Informatica 2016, 27, 819–842. [Google Scholar] [CrossRef] [Green Version]
- Prado, R.P.; Hoffmann, F.; Garcı´a-Galán, S.; Muñoz Expósito, J.E.; Bertram, T. On Providing Quality of Service in Grid Computing through Multi-objective Swarm-Based Knowledge Acquisition in Fuzzy Schedulers. Int. J. Approx. Reason. 2012, 53, 228–247. [Google Scholar] [CrossRef]
- Nguyen, T.A.; Kim, D.S.; Park, J.S. Availability modeling and analysis of a data center for disaster tolerance. Future Gener. Comput. Syst. 2016, 56, 27–50. [Google Scholar] [CrossRef]
- Dumsky, D.V.; Isaev, E.A. Data Centers for Physical Research. Phys. Proc. 2015, 71, 298–302. [Google Scholar] [CrossRef]
- Govindan, S.; Wang, D.; Chen, L.; Sivasubramaniam, A.; Urgaonkar, B. Modeling and Analysis of Availability of Datacenter Power; Technical Report for IBM Research Zurich: Luschlikon, Switzerland, 11 December 2010. [Google Scholar]
- Liu, L.; Sun, H.; Li, C.; Li, T.; Xin, J.; Zheng, N. Managing Battery Aging for High Energy Availability in Green Datacenters. IEEE Trans. Parallel Distrib. Syst. 2017, 28, 3521–3536. [Google Scholar] [CrossRef]
- Talapko, D. Telecom datacenter power infrastructure availability comparison of DC and AC UPS. In Proceedings of the Intelec 2012, Scottsdale, AZ, USA, 30 September–4 October 2012. [Google Scholar]
- Chille, V.; Mund, S.; Möller, A. Harmonizing physical and IT security levels for critical infrastructures. Sicherheit 2018, 10, 133–143. [Google Scholar] [CrossRef]
- Siu, S.K.; Lopopolo, J. Compatibility, Sizing, and Design Considerations for Generators and UPSs in Tiers I, II, III, and IV Topologies. IEEE Trans. Ind. Appl. 2011, 47, 2324–2329. [Google Scholar] [CrossRef]
- Chen, T.; Gao, X.; Chen, G. The features, hardware, and architectures of data center networks: A survey. J. Parallel Distrib. Comput. 2016, 96, 45–74. [Google Scholar] [CrossRef]
- Khatab, A.; Aghezzaf, E.H. Selective maintenance optimization when quality of imperfect maintenance actions are stochastic. Reliab. Eng. Syst. Saf. 2016, 150, 182–189. [Google Scholar] [CrossRef]
- Dong, Z.; Chuan, L.; Li, Y.; Guo, Z. A System’s Mean Time to Repair Allocation Method Based on the Time Factors. Qual. Reliab. Eng. Int. 2014, 30, 247–256. [Google Scholar] [CrossRef]
- Currim, S.; Snodgrass, R.T.; Suh, Y.-K.; Zhang, R.; Johnson, M.W.; Yi, C. DBMS Metrology: Measuring Query Time. ACM Trans. Database Syst. 2016, 42, 421–432. [Google Scholar] [CrossRef]
- Shen, C.; Tong, W.; Hwang, J.N.; Gao, Q. Performance modeling of big data applications in the cloud centers. J. Supercomput. 2017, 73, 2258–2283. [Google Scholar] [CrossRef]
- Strawn, G. Don Knuth: Mastermind of Algorithms [review of “The art of programming”]. IT Prof. 2014, 16, 70–72. [Google Scholar] [CrossRef]
- Lin, G.; Rajaraman, R. Approximation Algorithms for Multiprocessor Scheduling under Uncertainty. Theory Comput. Syst. 2010, 47, 856–877. [Google Scholar] [CrossRef] [Green Version]
- Baumgartner, M. A Regularity Theoretic Approach to Actual Causation. Erkenntnis 2013, 78, 85–109. [Google Scholar] [CrossRef]
- Zaki, M.J.; Meira, W., Jr. Data Mining and Analysis Fundamental Concepts and Algorithms; Cambridge University Press: New York, NY, USA, 2014. [Google Scholar]
- Dhukaram, A.V.; Baber, C. A Systematic Approach for Developing Decision Aids: From Cognitive Work Analysis to Prototype Design and Development. Syst. Eng. 2016, 19, 79–100. [Google Scholar] [CrossRef]
- Dayarathna, M.; Wen, Y.; Fan, R. Data Center Energy Consumption Modeling: A Survey. IEEE Commun. Surv. Tutor. 2016, 18, 732–794. [Google Scholar] [CrossRef]
- Bilal, K.; Malik, S.U.R.; Khan, S.U.; Zomaya, A.Y. Trends and challenges in cloud datacenters. IEEE Cloud Comput. 2014, 1, 10–20. [Google Scholar] [CrossRef]
- Whitehead, B.; Andrews, D.; Shah, A.; Maidment, G. Assessing the environmental impact of data centres part 1: Background, energy use and metrics. Build. Environ. 2014, 82, 151–159. [Google Scholar] [CrossRef]
- Heddeghem, W.V.; Lambert, S.; Lannoo, B.; Colle, D.; Pickavet, M.; Demeester, P. Trends in worldwide ICT electricity consumption from 2007 to 2012. Comput. Commun. 2014, 50, 64–76. [Google Scholar] [CrossRef] [Green Version]
- Fouladi, K.; Wemhoff, A.P.; Silva-Llanca, L.; Abbasi, K.; Ortega, A. Optimization of data center cooling efficiency using reduced order flow modeling within a flow network modeling approach. Appl. Therm. Eng. 2017, 124, 929–939. [Google Scholar] [CrossRef]
- Oró, E.; Depoorter, V.; Garcia, A.; Salom, J. Energy efficiency and renewable energy integration in data centres. Strategies and modelling review. Renew. Sustain. Energy Rev. 2015, 42, 429–445. [Google Scholar] [CrossRef]
- Zhang, K.; Zhang, Y.; Liu, J.; Niu, X. Recent advancements on thermal management and evaluation for data centers. Appl. Therm. Eng. 2018, 142, 215–231. [Google Scholar] [CrossRef]
- Yuventi, J.; Mehdizadeh, R. A critical analysis of Power Usage Effectiveness and its use in communicating data center energy consumption. Energy Build. 2013, 64, 90–94. [Google Scholar] [CrossRef]
- Spafford, G. Greening the Data Center: Opportunities for Improving Data Center Energy Efficiency; IT Governance Publishing: Ely, Cambridgeshire, UK, 2 April 2009. [Google Scholar]
- Lajevardi, B.; Haapala, K.R.; Junker, J.F. Real-time monitoring and evaluation of energy efficiency and thermal management of data centers. J. Manuf. Syst. 2015, 37, 511–516. [Google Scholar] [CrossRef]
- Han, G.; Que, W.; Jia, G.; Zhang, W. Resource-utilization-aware energy efficient server consolidation algorithm for green computing in IIOT. J. Netw. Comput. Appl. 2017, 103, 205–214. [Google Scholar] [CrossRef]
Figure 1.
Data center infrastructure.

Figure 2.
(a) Node tree diagram with internode; (b) Power Supply Block.

Figure 3.
Node model with possible entities.

Figure 4.
Comparison of the events numbers.

Figure 5.
Comparison of the total of all events between July 2016 and June 2018.

Figure 6.
Time parameter presentation.


Table 1.
Tier classification [23].
Table 1.
Tier classification [23].
| Tier I | Tier II | Tier III | Tier IV | |
|---|---|---|---|---|
| Number of supply paths | 1 | 1 | 1 Active 1 Passive | 2 Active |
| Redundancy (N corresponds to number of supply paths) | N | N + 1 | N + 1 | 2 (N + 1) |
| Simultaneously maintenance enabled | no | no | yes | yes |
| Critical errors’ tolerance | no | no | no | yes |
| Availability A0 (%) | 99.671 | 99.749 | 99.982 | 99.991 |
| Number of events (Downtime) | 1–2 over 4 h/1 year | 2 over 4 h/2 year | 2 over 4 h/5 years | 1 over 4 h/5 years |
| MTTR in hours/year | 28 | 22 | 1.6 | 0.4 |
Table 2.
Comparison of time parameters.
| Current Approach | New Approach | |
|---|---|---|
| Data acquisition time (seconds) | 0.03 | 0.03 |
| Application processing time (seconds) | 0.5 | 0.5 |
| Event identification time (seconds) | 300 | 0.5 |
| Maintenance planning time (seconds) | 5450 | 2230 |
| Recovery time (seconds) | 9630 | 5830 |
| MTBM (hours) | 5149 | 4730 |
| MDT (hours) | 17 | 3 |
| Tier I | Tier III | |
| Ao (%) | 99.671 | 99.982 |
© 2018 by the authors. Licensee MDPI, Basel, Switzerland. This article is an open access article distributed under the terms and conditions of the Creative Commons Attribution (CC BY) license (http://creativecommons.org/licenses/by/4.0/).
Share and Cite
MDPI and ACS Style
Matko, V.; Brezovec, B. Improved Data Center Energy Efficiency and Availability with Multilayer Node Event Processing. Energies 2018, 11, 2478. https://doi.org/10.3390/en11092478
AMA Style
Matko V, Brezovec B. Improved Data Center Energy Efficiency and Availability with Multilayer Node Event Processing. Energies. 2018; 11(9):2478. https://doi.org/10.3390/en11092478
Chicago/Turabian StyleMatko, Vojko, and Barbara Brezovec. 2018. "Improved Data Center Energy Efficiency and Availability with Multilayer Node Event Processing" Energies 11, no. 9: 2478. https://doi.org/10.3390/en11092478
Note that from the first issue of 2016, this journal uses article numbers instead of page numbers. See further details here.