A Study on the Strategy for Departure Aircraft Pushback Control from the Perspective of Reducing Carbon Emissions


1
College of Economics and Management, Civil Aviation University of China, Tianjin 300300, China
2
College of Civil Aviation, Nanjing University of Aeronautics and Astronautics, Nanjing 211106, China
3
College of Air Traffic Management, Civil Aviation University of China, Tianjin 300300, China, [email protected] (N.L.)
4
Operation and Control Center, Shandong Airlines, Jinan 250014, China
5
College of Business Administration, Capital University of Economics and Business, Beijing 100070, China
6
Zhongshan Institute, University of Electronic Science and Technology of China, Zhongshan 528400, China
*
Authors to whom correspondence should be addressed.
Energies 2018, 11(9), 2473; https://doi.org/10.3390/en11092473
Submission received: 2 August 2018
/
Revised: 3 September 2018
/
Accepted: 13 September 2018
/
Published: 17 September 2018
(This article belongs to the Special Issue Modeling and Simulation of Carbon Emission Related Issues)
Abstract
:In order to reduce the taxiing time of departing aircraft and reduce the fuel consumption and exhaust emissions of the aircraft, Shanghai Hongqiao Airport was taken as an example to study the control strategy for aircraft departure. In this paper, the influence of the number of departure aircraft on the runway utilization rate, the takeoff rate, and the departure rate of flight departures under the conditions of airport runway capacity constraints are studied. The influence of factors, such as the number of departure aircraft, the gate position of the aircraft, and the configuration of airport arrival and departure runways, on the aircraft taxiing time for departure is analyzed. Based on a multivariate linear regression equation, a time prediction model of aircraft departure taxiing time is established. The fuel consumption and pollutant emissions of aircraft are calculated. The experimental results show that, without reducing the utilization rate of the runway and the departure rate of flights, implementing a reasonable pushback number for control of departing aircraft during busy hours can reduce the departure taxiing time of aircraft by nearly 32%, effectively reducing the fuel consumption and pollutant emissions during taxiing on the airport surface.
1. Introduction
With the rapid development of air transportation, the number of flights at major airports in China has been increasing, making airport surface runways congested. This, in particular, causes the aircraft on airport surfaces to take a long time to taxi, and an excessive number of flights to wait in line at the entrance to the runway. Due to premature pushback of aircraft and waiting on crowded taxiways, an additional 10–20 kg of fuel consumption is added for each additional minute of taxi time [1,2], resulting in an increase in aircraft exhaust emissions affecting the air quality around the airport.
A series of studies have been conducted by scholars at domestic and foreign terminals to control the number of aircraft departing from airport surfaces and reduce the congestion time in aircraft taxiing. In 2007, Balakrishnan H and Jung Y [3] studied the airport surface operation of Dallas–Fort Worth airport by establishing an integer programming model. This study shows that using the method of delaying the pushback time of departing aircraft can reduce the number of airport surface taxiing aircraft and reduce congestion, thereby reducing the average taxiing time of departing aircraft, and using airport surface aircraft taxiway optimization methods can significantly reduce the waiting time for aircraft crossing the runway, thereby reducing the average taxiing time of arriving aircraft. In 2009, Simaiakis I et al. [4] analyzed the key factors affecting the taxi time of departing aircraft. Taking the Boston International Airport (BOS) as an example, a forecasting analysis of the departure taxiing time of aircraft was made, and a queuing theory model based on the departure process of aircraft was proposed. Using this queue-pushback strategy for departing aircraft can reduce the departure taxiing time and, thus, reduce aircraft pollutant emissions. In 2010, Jung YC et al. proposed the Spot Release Planner (SRP) and Runway Scheduler (RS) [5]. The SRP aims to reduce an aircraft’s taxiing time by keeping the runway productivity at the maximum level by sorting the order of departure of the departing aircraft on the apron and controlling the pushback time of each aircraft to control the time that the aircraft enters the maneuvering area. The RS is designed to sort and time-allocate departing aircraft and arriving flights across the takeoff runway to achieve maximum runway utilization. Jung YC et al. combined the proposed two strategies to optimize the operation of busy airport surfaces. In 2010, Lee H [6] proposed two ways to optimize the operation of airport surfaces: delayed pushback and path optimization. Delayed pushback refers to the control of off-board aircraft that is applied during an airport congested period to control the airport’s congestion. The path optimization optimizes the taxi path of all aircraft at the airport based on the delayed pushback. With the application of airport surface monitoring equipment, it makes it possible to analyze the airport surface trajectory of the aircraft in detail using the airport surface monitoring data. In 2011, I. Simaiakis et al. [7] applied Airport Surface Detection Equipment Model-X (ASDE-X) data from the monitoring equipment at Boston International Airport. They considered the impact of the airport runway configuration, the different type series in the fleet, meteorological conditions, and other factors on the airport runway capacity. A study on aircraft pushback rate control at the airport was conducted. In 2013, S Ravizza [8] and others calculated the required taxiing distance, the total steering angle, the type of departing and arriving aircraft, the number of aircraft in operation on the airport surface, the usage configuration of departure and arrival runways, and the position of the gate. The establishment of a multiple linear regression model helped to provide a more accurate prediction of the aircraft into and out of the required taxi time. In 2015, Tang Y [9] elaborated on the concept of the Advanced Surface Movement Guidance and Control System (A-SMGCS) proposed by International Civil Aviation Organization (ICAO) in his doctoral dissertation and conducted a comprehensive study on an aircraft’s initial taxi route planning, real-time optimization of aircraft taxiing routes, and A-SMGCS three-dimensional (3D) simulation. In addition, Xiangling Z et al. [10] studied the issue of virtual pushback queues for departing flights at the gate position and the issue of decision-making for collaborative pushback of departing flights. In 2016, Nan L and Hongzhe L [11] analyzed the surveillance data of Hongqiao Airport, used support vector machines to classify and determine the trajectory of taxi aircraft, and applied data mining technologies to the prediction of airport surface aircraft taxi time, the determination of airport surface taxi hotspots, and conflict zone determination.
Under the same runway configuration conditions, as the number of aircraft pushback into the apron and taxi systems increases, more flights are added to the takeoff queue, resulting in a gradual increase in runway utilization and departures from flights. However, due to the effect of aircraft wake spacing, when a certain number of taxiing departing aircraft is reached, the runway capacity becomes the limiting factor and the number of taxiing departing aircraft will continue to increase. The runway utilization rate and takeoff and departure rate of flights will only tend to change smoothly. Therefore, in practice, the tower controllers are more concerned with a reasonable number of departing aircraft operations in a given runway usage configuration. This paper uses the airport surface monitoring data from Shanghai Hongqiao Airport to study the influence of the number of different departing aircraft within the apron and taxi systems on the takeoff and departure rate of the flights, the departure taxiing time, and the runway utilization rate under runway capacity constraints. A departure time prediction model for departing aircraft is established. A reasonable control strategy is implemented for departing aircraft within the busy airport departure period without reducing the operating efficiency of the runway, thereby reducing the aircraft departure taxiing time and reducing aircraft fuel consumption and pollutant emissions.
2. Airport Surface Operation Data Analysis and Definition
2.1. Airport Surface Monitoring Data Analysis
While the airport surface monitoring system assists controllers in performing aerodrome control services more safely and efficiently, the equipment also records real-time aircraft trajectory data. The aircraft movement trajectory data recorded by the airport surface monitoring system includes a time stamp and the aircraft’s position, altitude, speed, and so forth, and by combining these with the airport topology data, we can identify the operational status of the aircraft, such as its pushback, taxiing, takeoff, and landing; calculate parameters, such as taxi distance and taxi time; identify the taxi path; and provide a data foundation for studying aircraft airport surface operation and optimization [12,13].
Through the data analysis of the Shanghai Hongqiao Airport’s March 2015 airport surface monitoring system, we have sorted out the full arrival and departure trajectories for flights when using the 18 L/18 R configuration on the departure and arrival runway (18 L runway for approach and 18 R runway for departure calculated as two complete tracks during the stop-and-depart process).
2.2. Airport Surface Operation Data Definition
Aircraft departure taxiing refers to the entire process of the pushback of the aircraft from the gate position, the taxiing to the departure runway, and the wait for takeoff. In order to analyze the operation of airport surfaces, this paper gives the following definitions of the quantitative indicators for measuring airport surface operations:
- Departure taxiing time: the total time of the aircraft’s pushback from the parking position to the time of taxiing to the departure runway, including the aircraft’s pushback, apron and taxiway taxiing, and the holding time the entrance of the runway (unit: minute).
- Number of airport surface aircraft: the total number of departing and arriving aircraft taxiing (including taxi wait) or undergoing pushback in the apron and taxiway systems (unit: flight).
- Number of departure aircraft: the number of departing aircraft that are taxiing (including the taxi wait) or undergoing pushback in the apron and taxiway systems (unit: flight).
- Runway utilization rate: the ratio of the length of time the runway is accumulatively occupied over a period of time to the length of the time period of the calculation.
- Takeoff and departure rate of flights: the number of departing aircraft per unit of time (unit: flights/minute).
When calculating the runway utilization rate over a period of time, first of all, it is necessary to find out the total time taken for the runway to be occupied during this period. In general, the time spent on the following operations of the aircraft is accumulated into the occupied time of the runway.
- 6.
- Takeoff running: the duration from the point where a departing aircraft accelerates for takeoff on the runway until the aircraft’s landing gear tires are off the ground;
- 7.
- Departure waiting: the departing aircraft waits for takeoff clearance on the runway;
- 8.
- Final Approach: the duration from an arriving aircraft’s being at its final approach phase of 2.5 nm (nautical miles) from the runway’s end to the landing of the aircraft on the runway;
- 9.
- Landing: the duration of an arriving aircraft’s starting to land to when it is off the runway;
- 10.
- Cross-taxi: the aircraft crosses over the runway.
For an airport with only one runway, when calculating the runway utilization rate of the airport, the cumulative time of the five operations (6)–(10) of the aircraft needs to be taken into account as the occupied time of the runway.
For airports with multiple runways, if aircraft arrivals and departures run on different runways, the time taken on the departure runway will only take into account the aircraft operations (6), (7), and (10), and only the aircraft operations (8)–(10) need to be considered when the approach runway is occupied.
3. Runway Capacity Analysis
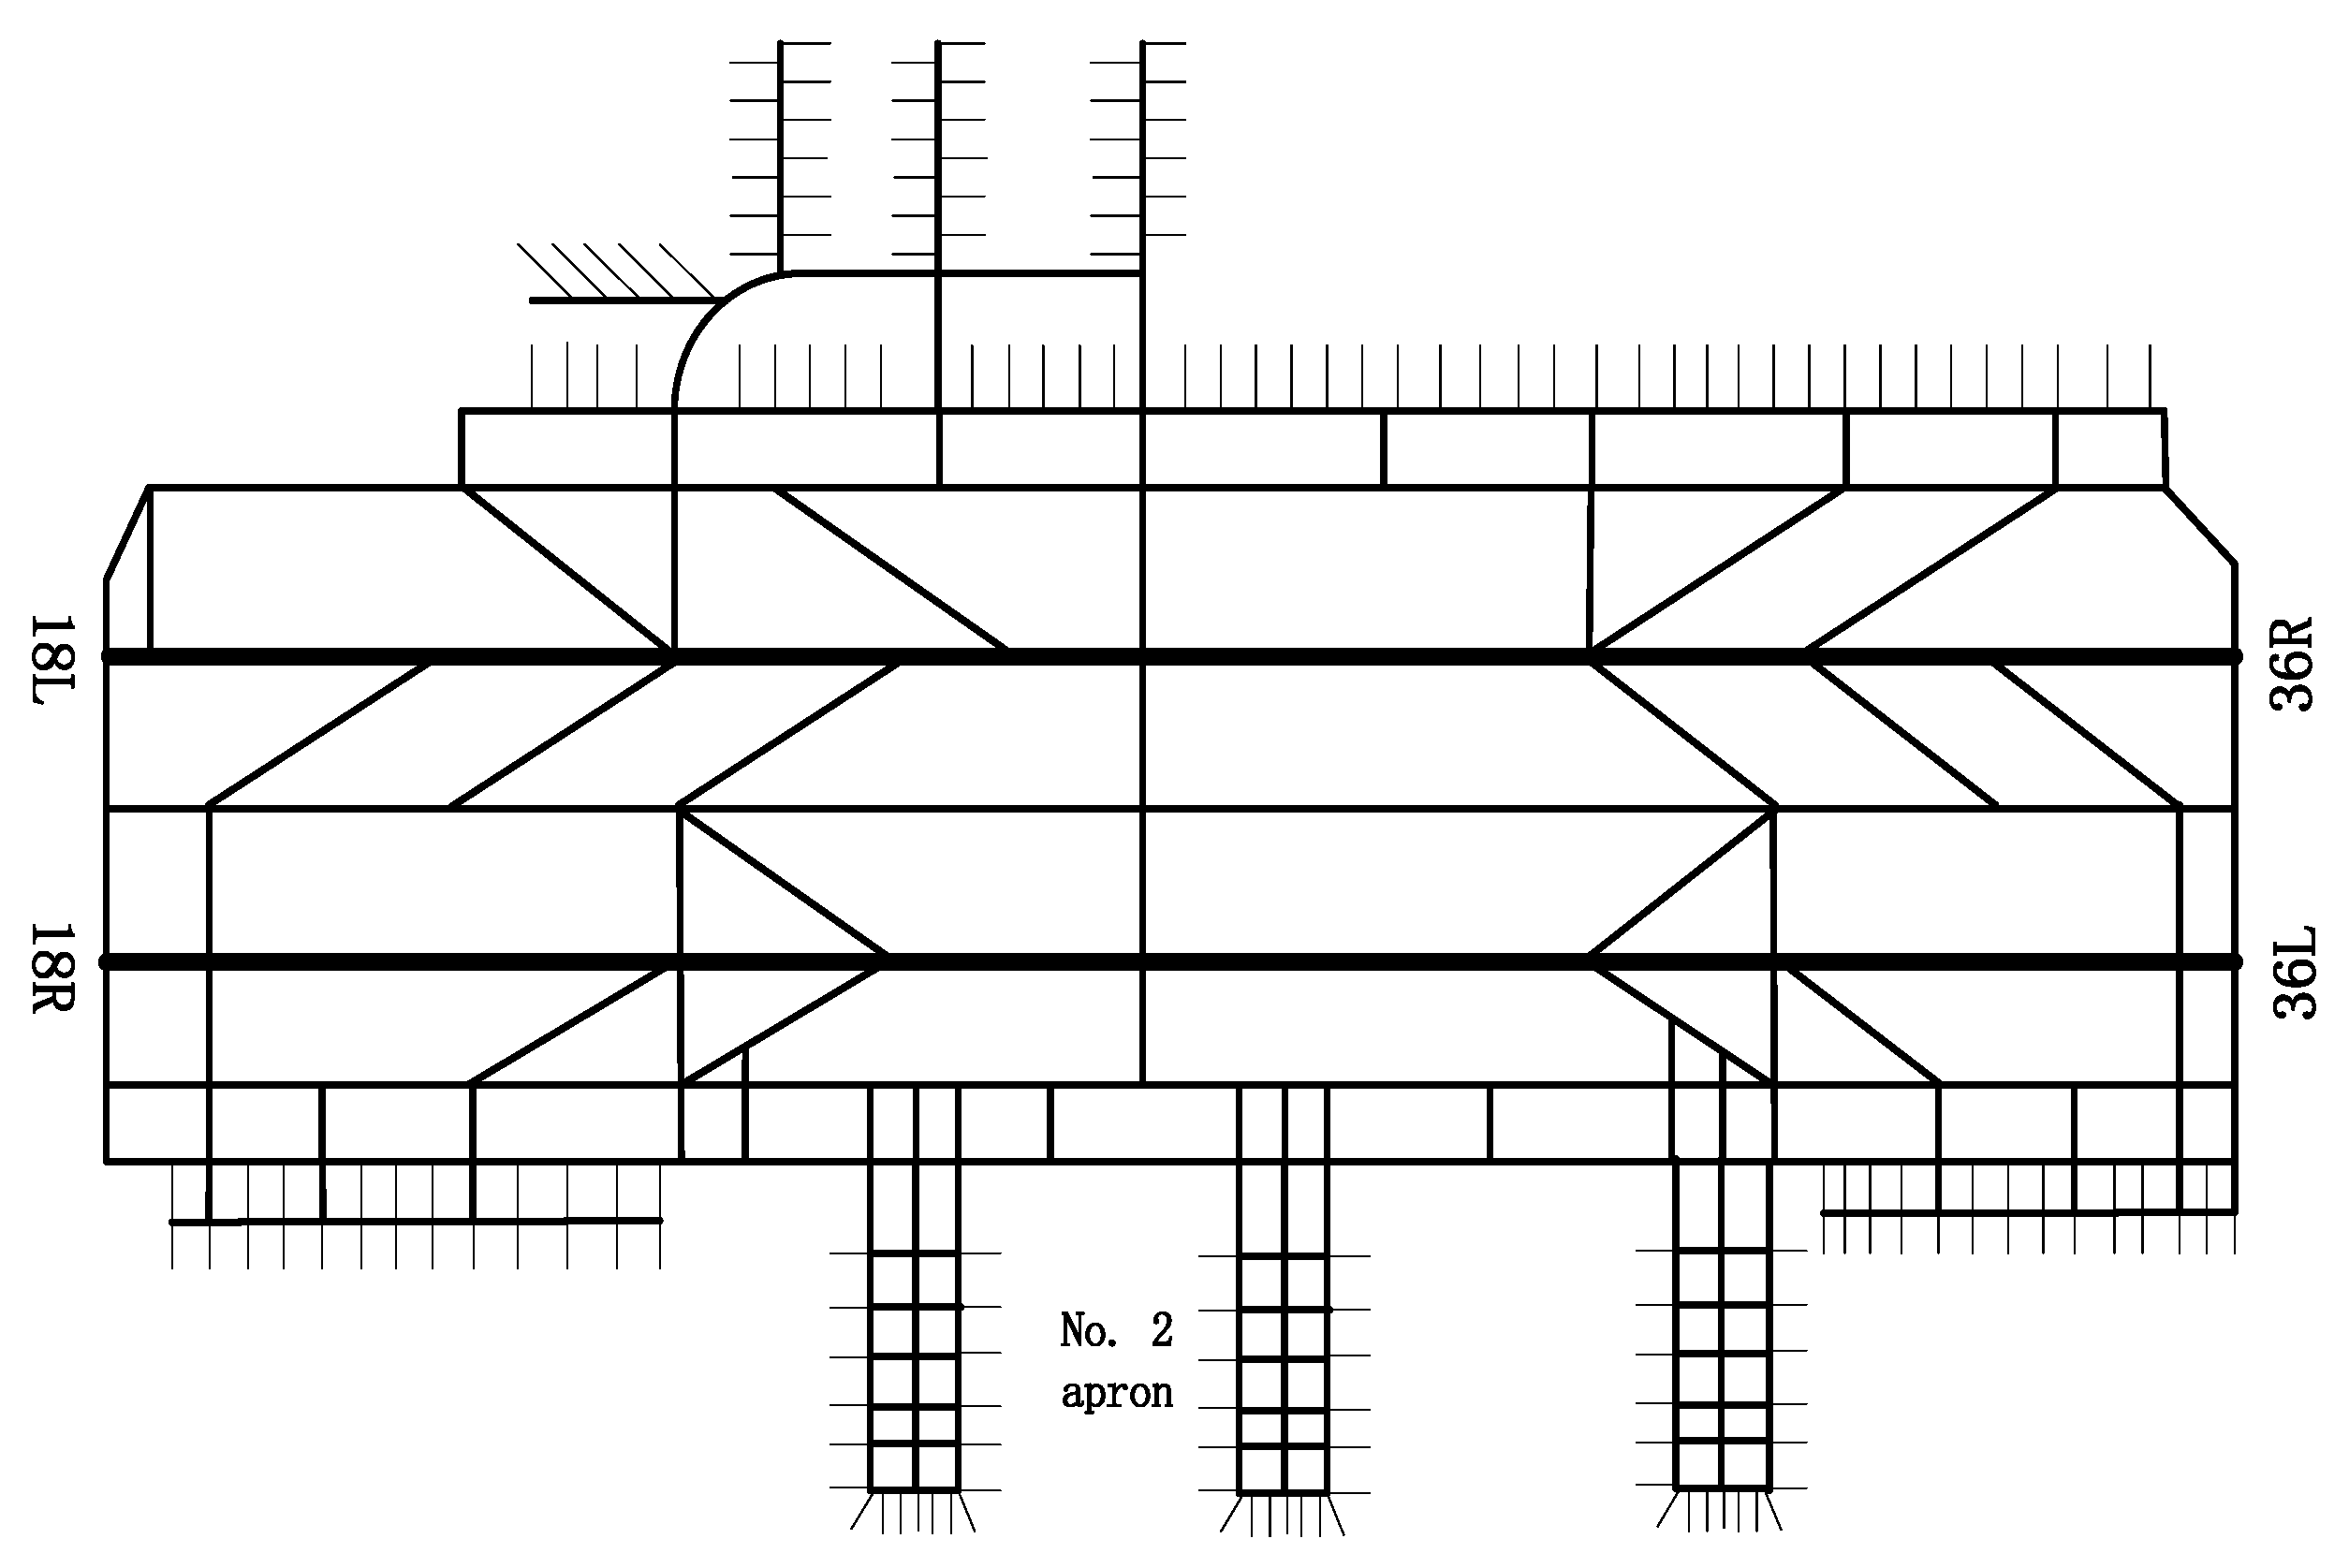
This section applies the airport surveillance data to analyze the actual airport operational data. Hongqiao Airport is a narrow-distance, dual-runway airport; 18 L is mainly used for arrival, 18 R is mainly used for departure, and its taxiway system network is shown in Figure 1.
3.1. Runway Utilization Rate Analysis
This paper analyzes the main runway configuration of Hongqiao Airport, namely the 18 L approach and the 18 R departure configuration. Figure 2 shows the relationship between the utilization of the departure 18 R runway and the number of departing aircraft on the airport surface. The calculation of the runway utilization rate is based on a statistical period of every 15 min, because the number of departing aircraft on the airport surface changes slightly every 15 min and this can avoid statistical errors caused by excessive changes in the number of departing aircraft. Additionally, a 15 min statistical period is not too short and the average runway utilization rate can be calculated during this period so as to avoid statistical errors due to excessive statistical fluctuations caused by the statistical time being too short.
The horizontal axis in Figure 2 shows the number of departure aircraft on the airport surface and the vertical axis shows the runway utilization rate of 18 R. It can be seen that when the number of departure aircraft on the airport surface is N ≤ 6, the number of aircraft departing the airport surface at this time is small, and the runway utilization rate of the departure runway 18 R increases with the number of airport surface departure aircraft. When the number of airport surface departure aircraft is N = 7, the runway utilization rate is already close to 1, indicating that under the operating scale of the number of departing aircraft, the 18 R departure runway has been basically used efficiently. When the number of departure aircraft in operation on the airport surface is N ≥ 8, the runway utilization rate fluctuates at a value close to 1, indicating that the departure runway 18 R is continuing to be used efficiently.
3.2. Analysis of Flight Takeoff Rate
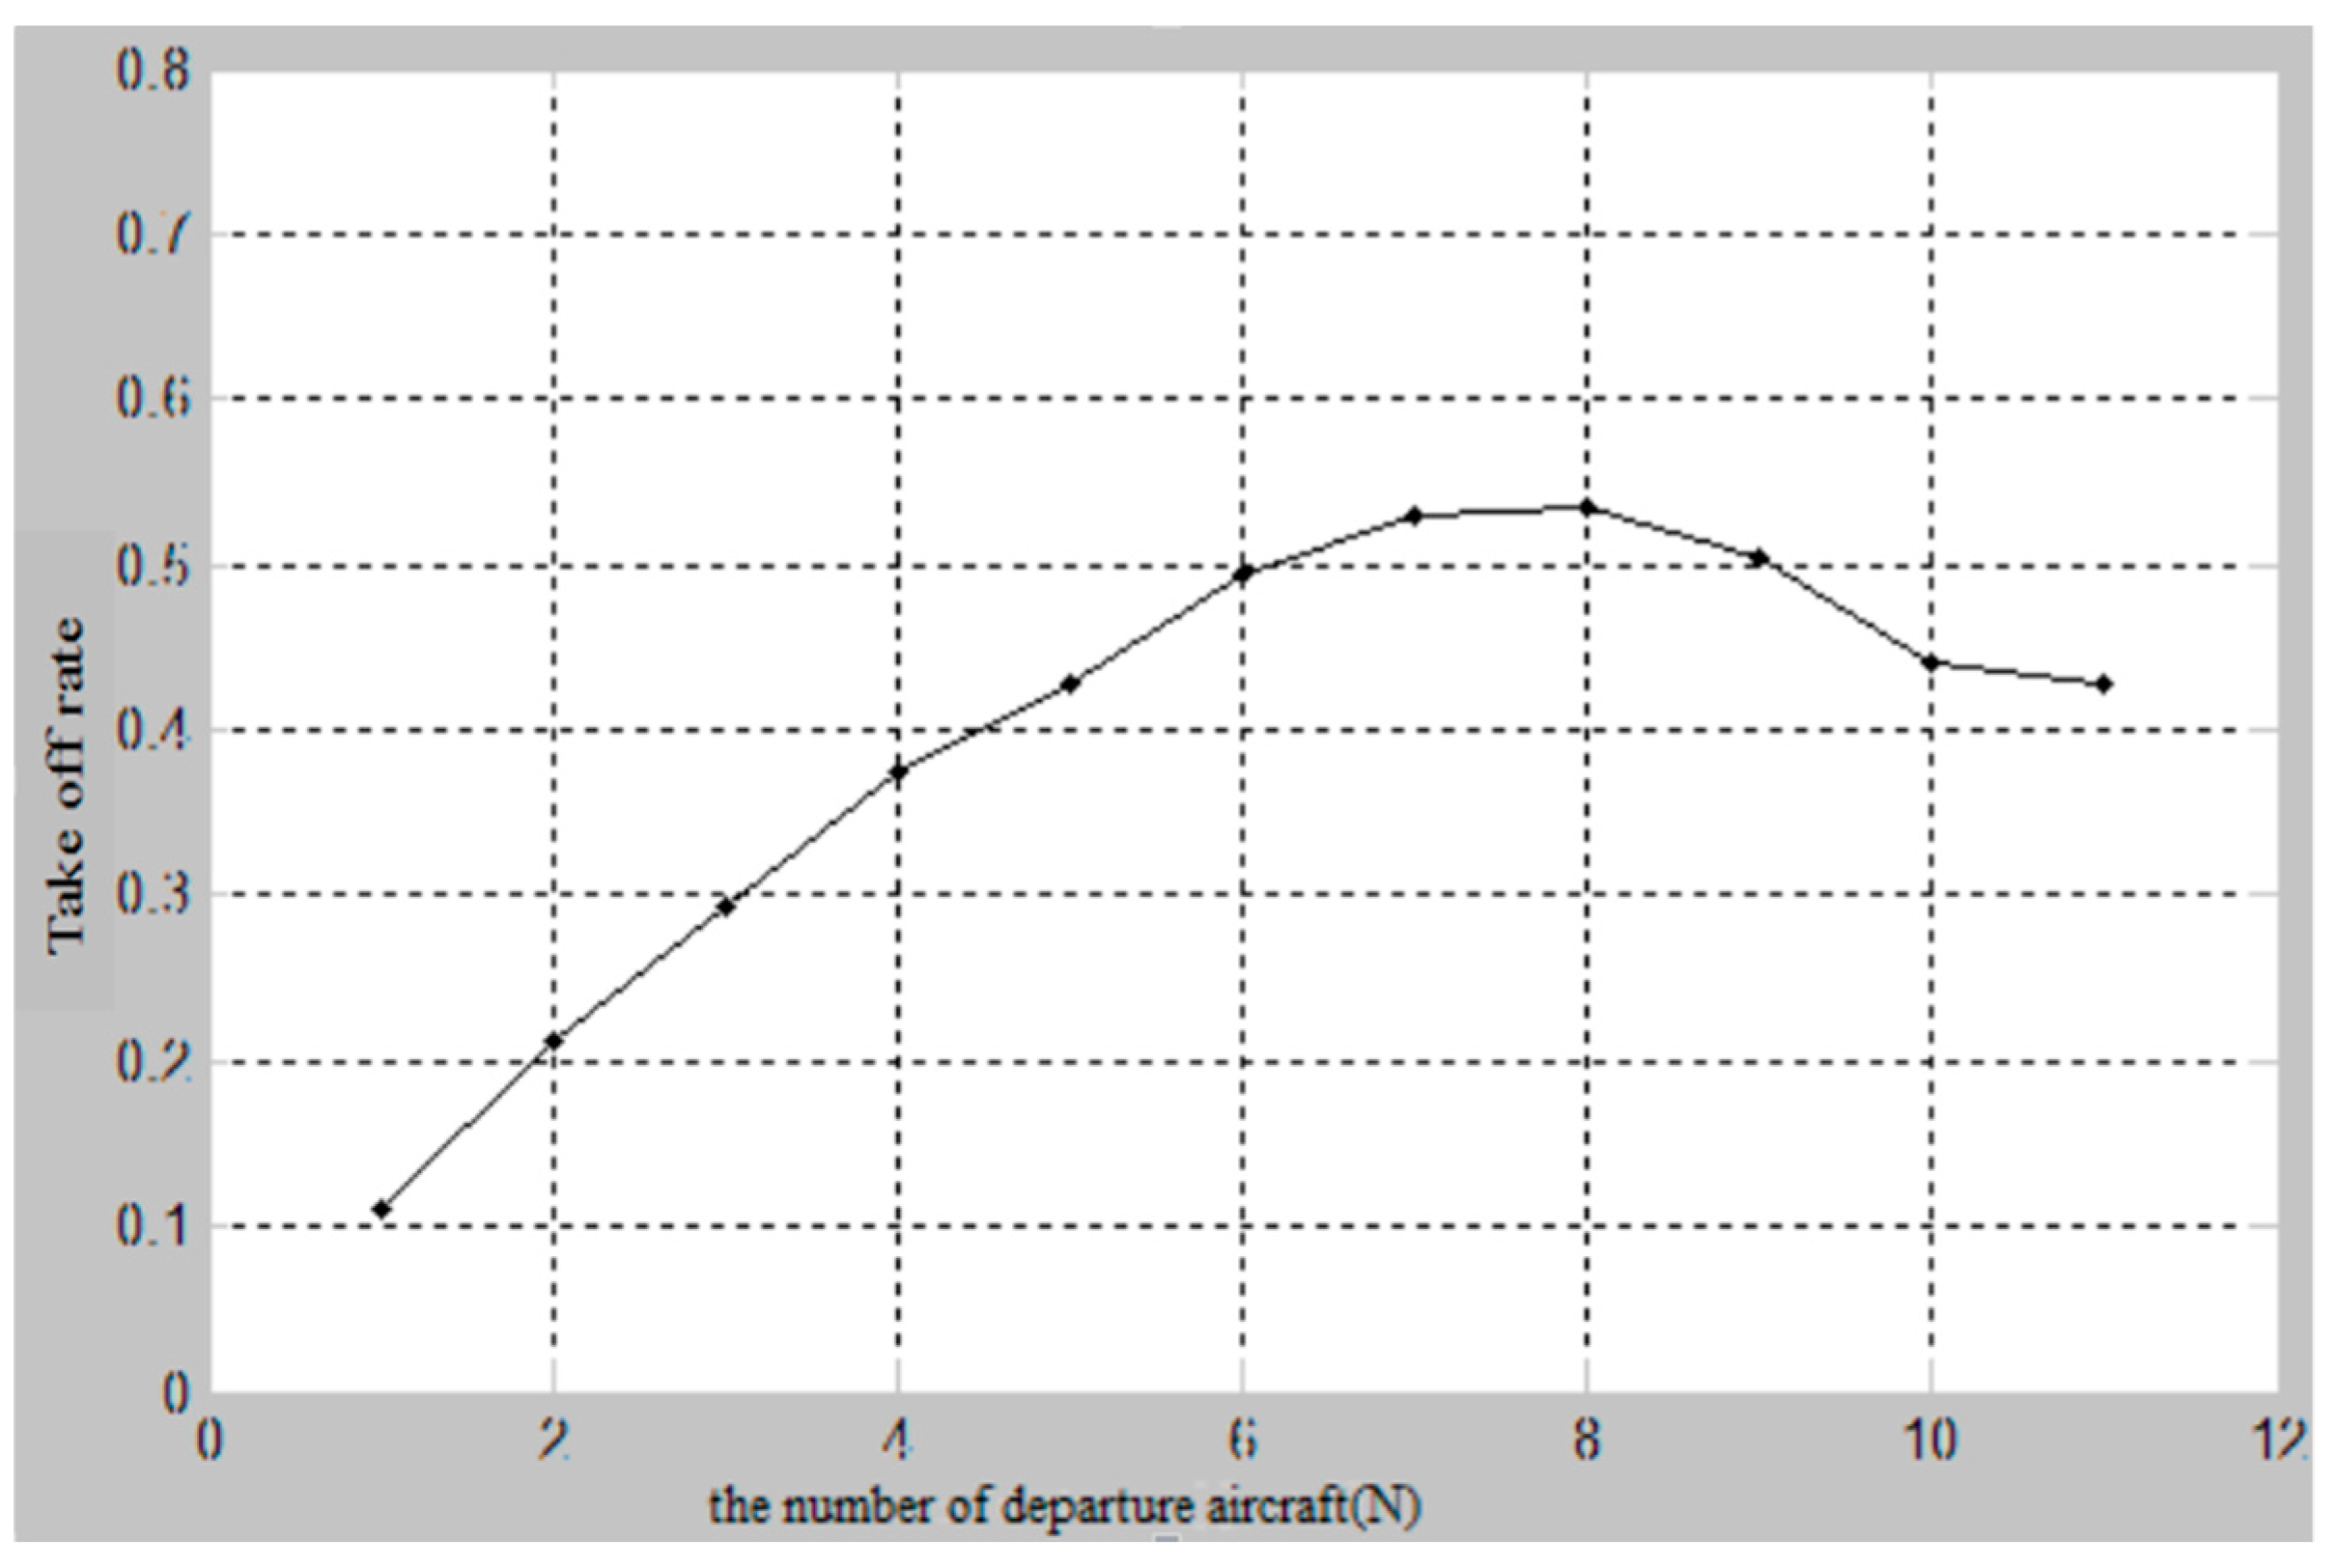
Figure 3 shows the takeoff rate of flights from departure runway 18 R as a function of the number of departure aircraft on the airport surface. The takeoff rate statistics for the runway are also based on a 15 min statistical period, and then the takeoff rate average of each departing aircraft quantity is calculated.
When the number of departing aircraft is N ≤ 6, the number of departure aircraft on the airport surface at this time is small, and the number of arriving and departing flights per unit of time increases with the increase in the number of departure aircraft on the airport surface. When the number of departure aircraft is N = 7, the takeoff rate of flights has reached its maximum. Correspondingly, from Figure 2, it can also be seen that the runway utilization rate is close to 1, indicating that the arrival and departure of the flights began to be restricted by the runway capacity; the arrival and takeoff rates of flights reach 0.52 flights/min (31 flights/h). When the number of departure aircraft on the airport surface is N ≥ 9, the takeoff rate of flights calculated by the statistics shows a slight downward trend. However, this does not simply indicate that the takeoff rate will decrease when the number of departure aircraft on the airport surface is large in correspondence with Figure 2. When the performance is N ≥ 9 compared to N = 7–8, the runway utilization is also close to 1, indicating that the runway is still fully utilized. However, the percentage of waiting time for the aircraft at the runway’s end increases when N ≥ 9 in Figure 2 compared with the case when N = 7–8, indicating that the decrease in the takeoff rate is due to the increase in the holding time for takeoff at the runway’s end. Through further analysis of the arrival and departure flight data, it was found that because the double runways of Hongqiao Airport are narrow parallel runways, the arriving and departing aircraft of the two runways cannot take off and land at the same time because of the aircraft wake spacing. This means that the two runways cannot operate independently. Therefore, the continuous arrival of multiple aircraft will affect the aircraft taking off, resulting in a decrease in the takeoff rate of the runway 18 R and a cumulative increase in the number of departure aircraft on the airport surface, such as the number of departure aircraft on the airport surface reaching 12. This situation is reflected in the performance of N ≥ 9 in Figure 2 and Figure 3. Although the takeoff rate of flights has decreased, the percentage of time that an aircraft is waiting to take off at the runway entrance has increased in the runway utilization histogram.
Figure 2 and Figure 3 can be summarized as follows: in the fixed runway configuration, the number of departure aircraft that undergo pushback into the apron and taxiway systems increases as more flights are added to the takeoff queue. The runway utilization rate and takeoff rate have gradually increased. However, aircraft takeoff will be limited by the time interval. When the number of departure aircraft on the airport surface reaches a critical value or if the number of departure aircraft on the airport surface continues to increase, the runway capacity will become a limiting factor. The runway utilization rate and the takeoff rate will only tend to have stable fluctuations and will no longer increase significantly.
4. Aircraft Departure Time Prediction
4.1. Factors Affecting Departure Taxiing Time
Analysis of the departure taxiing process shows that the aircraft departure taxiing time is related to the airport current runway configuration, the gate of the aircraft apron, and the congestion status of the departure taxiway through the apron and the taxiway systems. Under certain runway usage configurations, the influence of the gate of the apron on the taxi time of the departing aircraft can be expressed by a taxi distance parameter. The influence of the apron and taxiway systems’ congestion conditions on the taxi time of departing aircraft can be expressed by the parameter of the number of aircraft on the airport surface.
Through the data analysis of the Shanghai Hongqiao Airport March 2015 airport surface monitoring system, we select the flights in UTC time 04:00–06:00 (Local Time 12:00–18:00), which is the busy time. The full sample contains 1469 departure flights and 1399 arrival flights. The data in Table 1 summarizes the statistics for the departure flight sample.
4.2. Impact of the Number of Aircraft on the Airport Surface
Figure 4 is a scatter plot of the departure taxiing time of aircraft and the number of aircraft on the airport surface when each aircraft underwent pushback on 9 March 2015, UTC time 4:00–6:00. From the scatter plot, it can be clearly seen that the departure taxiing time of aircraft gradually increases with the increase in the number of aircraft on the airport surface.
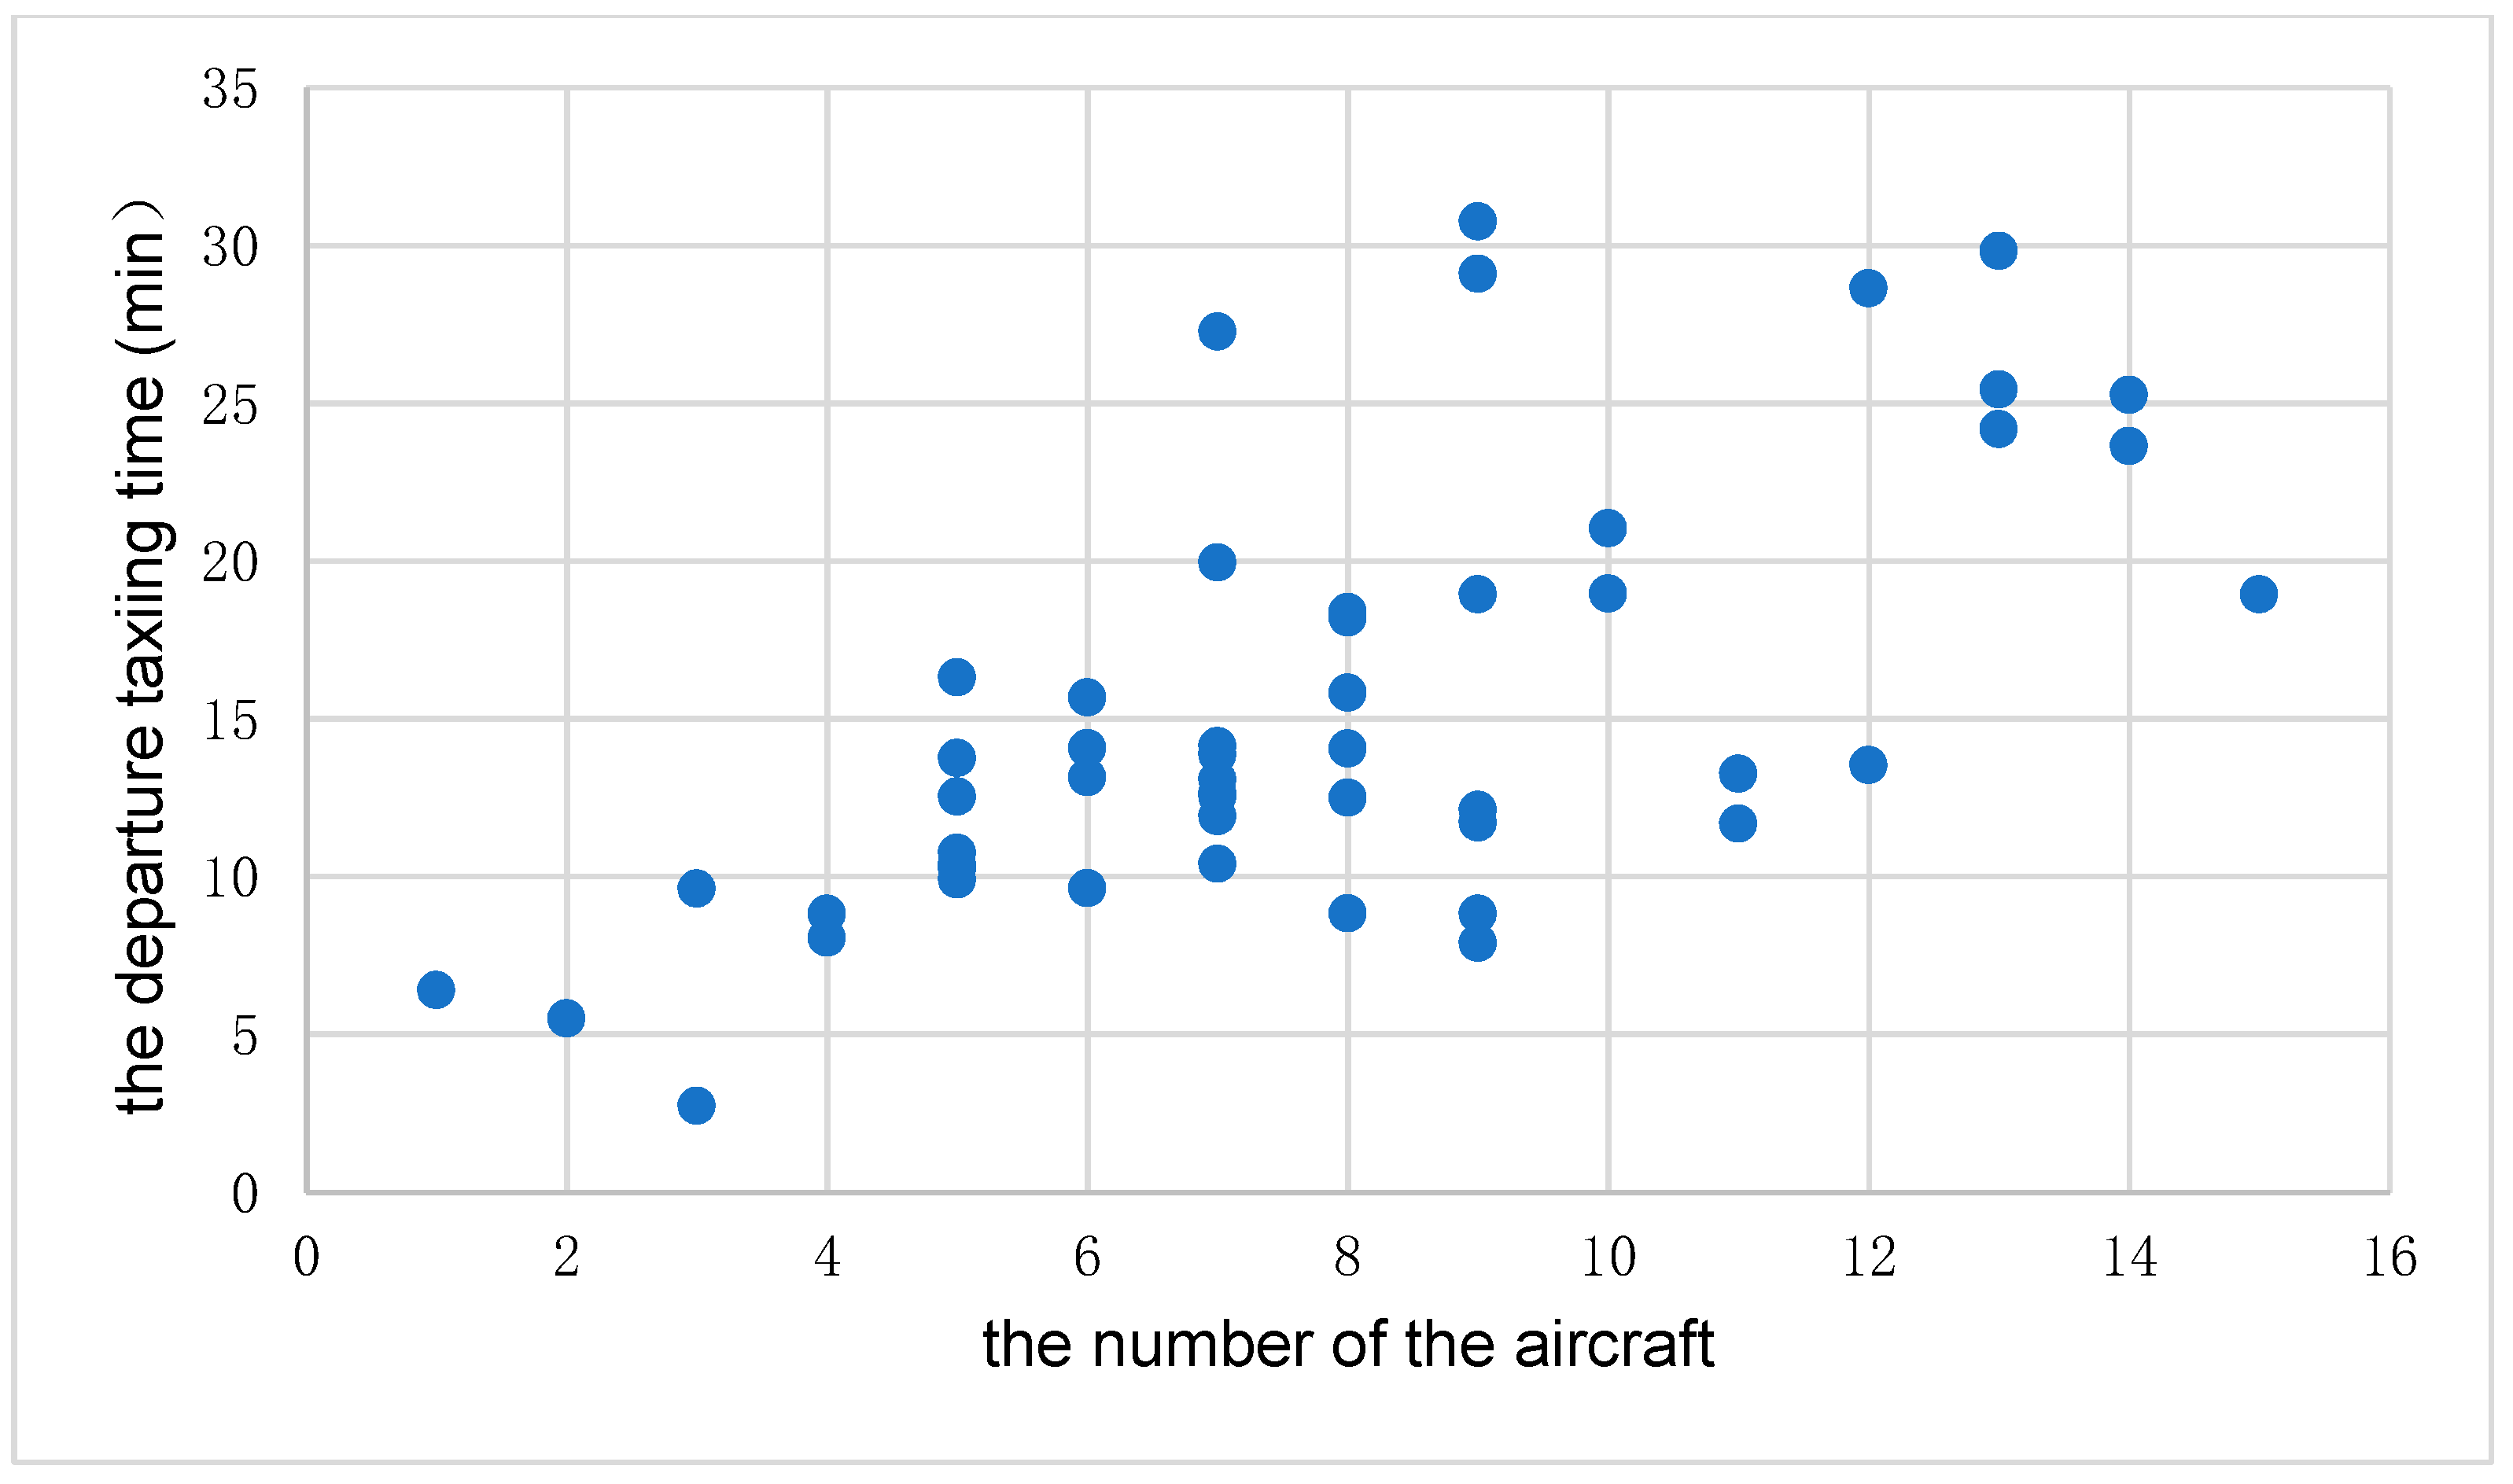
Considering that there are large differences in the taxi path between the arriving and departing aircraft, the number of arriving aircraft has little influence on the taxiing time of the departing aircraft. Therefore, all the arriving aircraft in the statistical data of Figure 4 are excluded and the scatter plot of the departure taxiing time of aircraft and the number of departing aircraft on the aircraft surface is obtained in Figure 5.
The linear correlation coefficient between the aircraft departure taxiing time and the number of aircraft on the airport surface is R1 = 0.62; the linear correlation coefficient between the aircraft departure taxiing time and the number of departure aircraft on the airport surface is R2 = 0.79. By comparing R1 and R2, it is shown that the aircraft departure taxiing time has a stronger linear relationship with the number of departure aircraft on the airport surface at the time of aircraft pushback. Therefore, the number of departure aircraft on the airport surface can be used as a predictor variable of the aircraft departure taxiing time.
4.3. Effect of Aircraft Departure Taxiing Distance
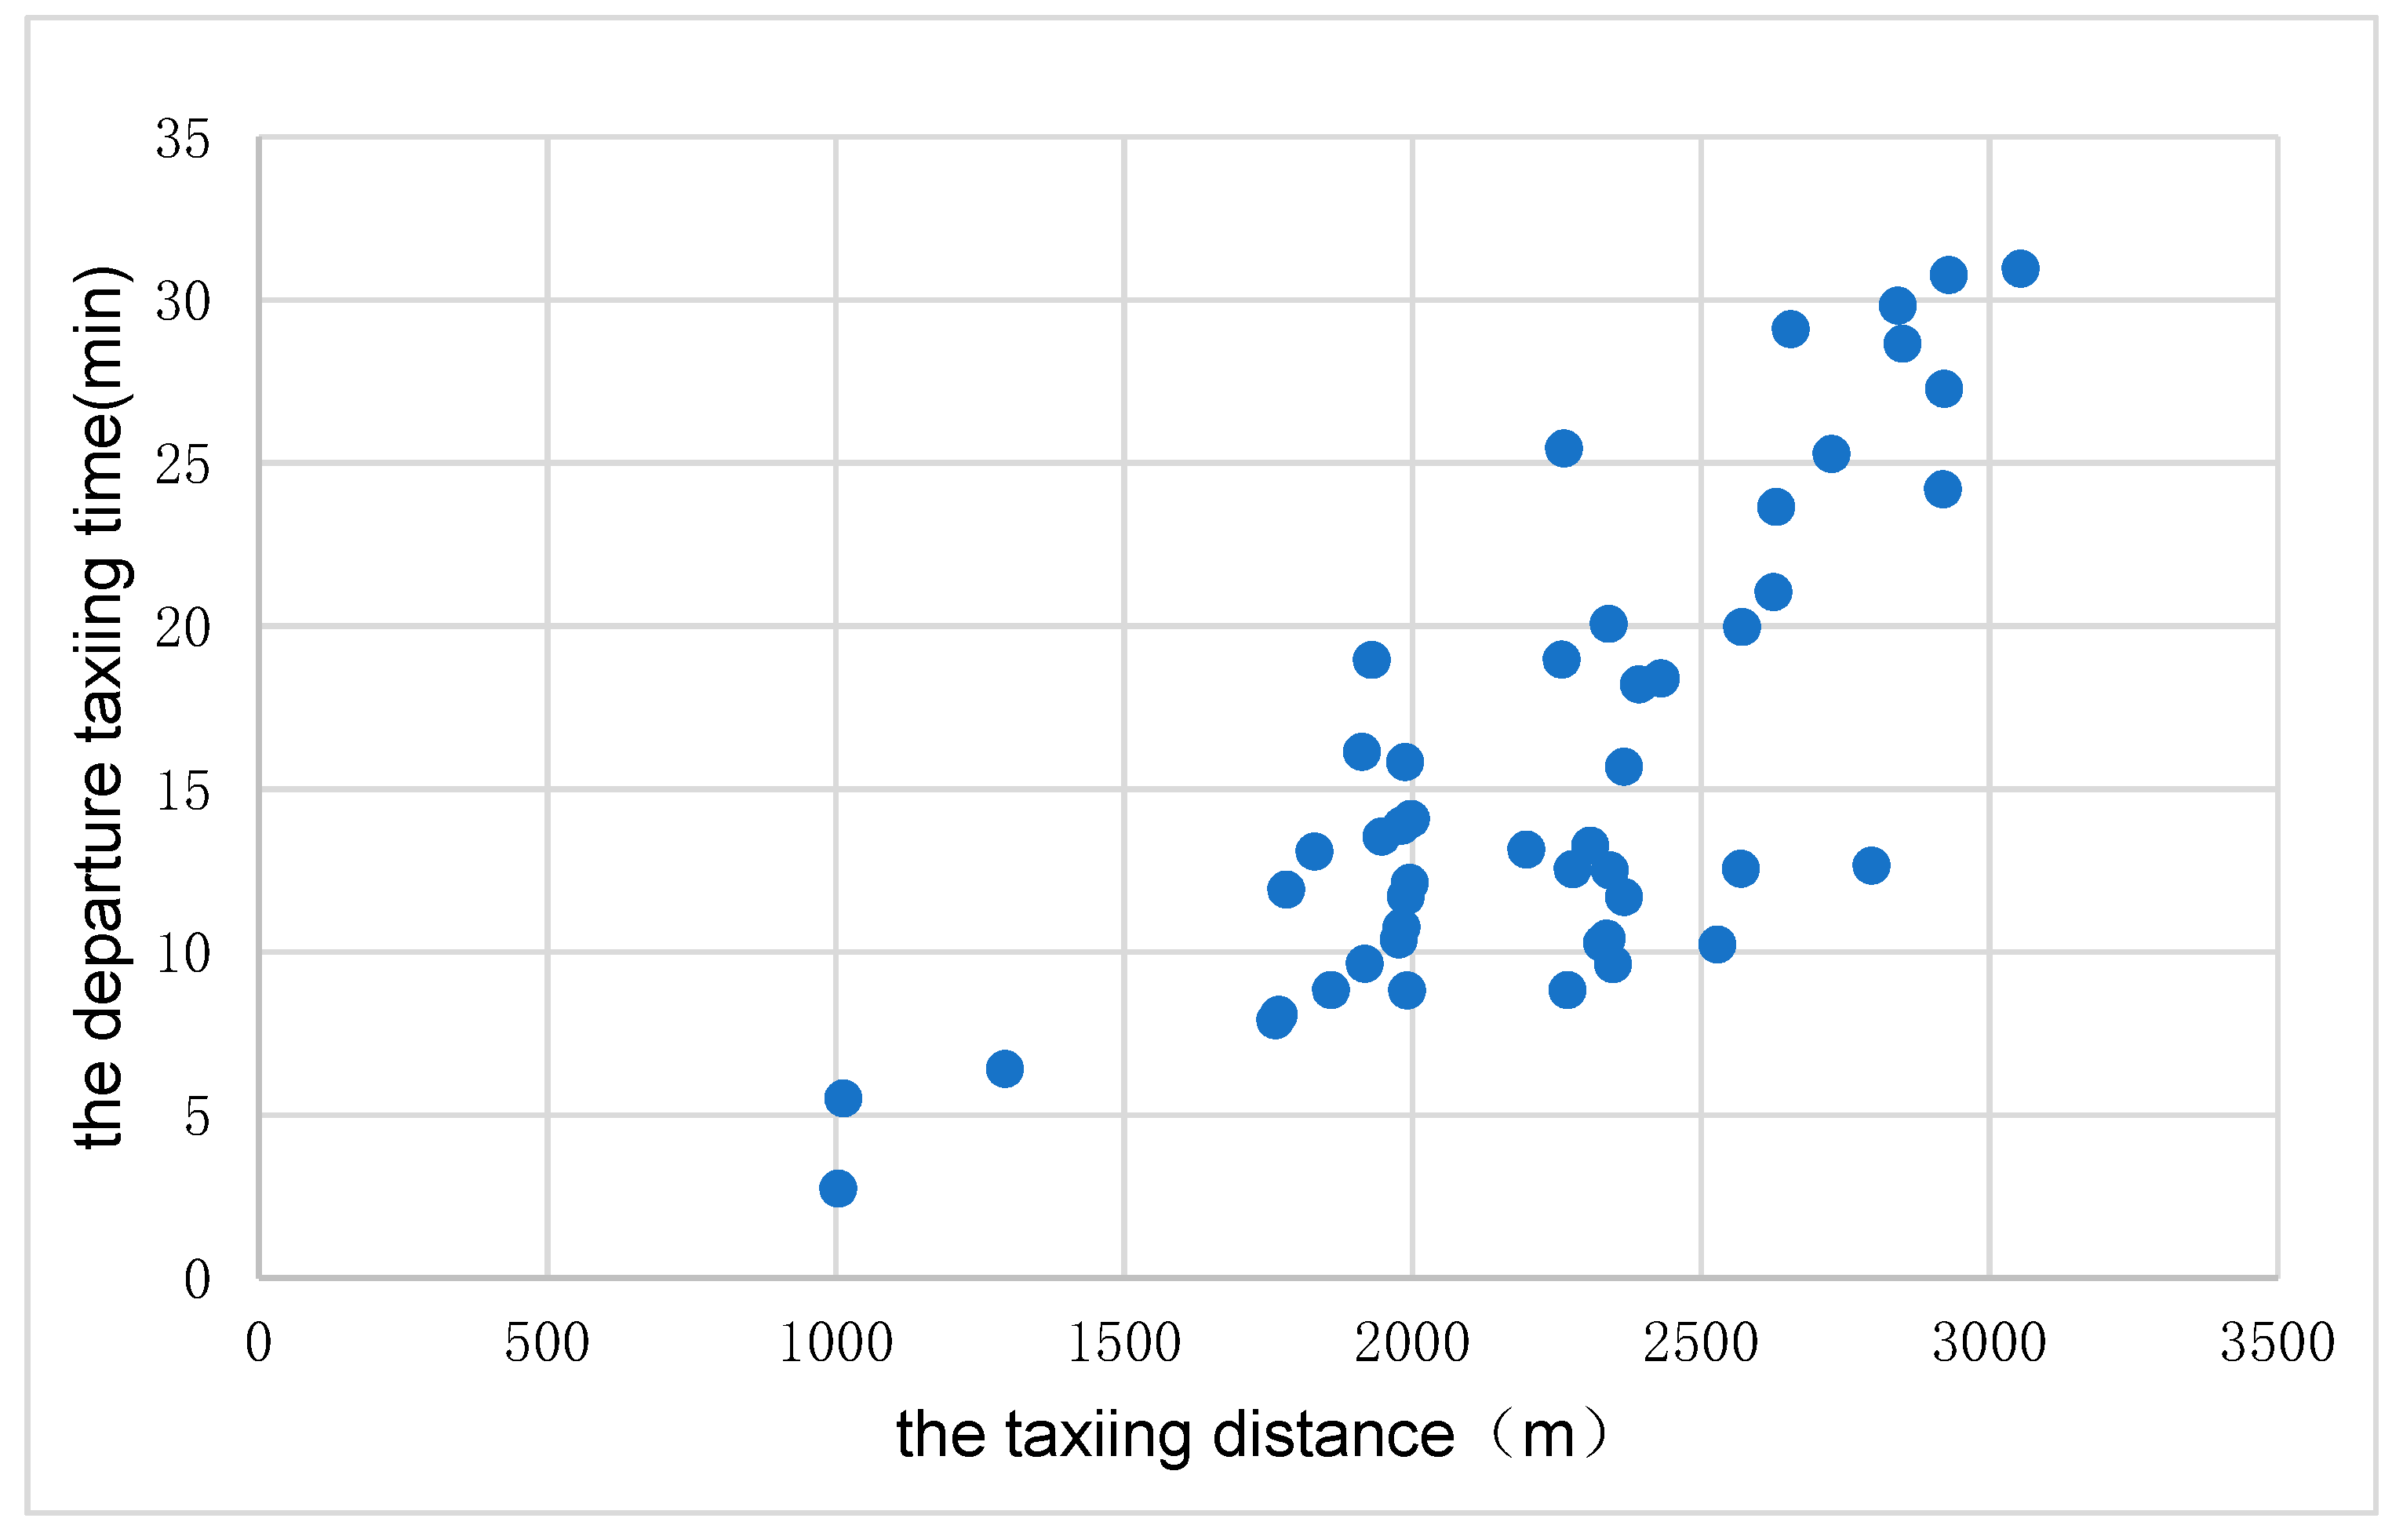
The effect of the airport runway configuration and an aircraft’s gate position on the aircraft's departure taxiing time is reflected in the distance required for the aircraft to taxi from the apron to the takeoff runway entrance. Figure 6 is the scatter plot of the aircraft departure taxiing time and the required taxi distance for departure on 9 March 2015, UTC time 4:00–6:00. From the scatter plot, it can be seen that the departure taxiing time increases gradually with an increase in the taxiing distance.
In apron and taxiway systems, the aircraft generally taxis at a low and uniform speed. Therefore, under an ideal no-taxiing-collision condition, when the aircraft is taxiing at a constant speed, the taxiing time is positively related to the taxiing distance. The linear correlation coefficient between the aircraft departure taxiing time and departure taxiing distance is R3 = 0.77. This indicates that the aircraft departure taxiing time and the departure taxiing distance have a strong linear relationship. Therefore, the aircraft departure taxiing distance can be used as a predictor of aircraft departure taxiing time.
4.4. Departure Taxiing Time Prediction Model
The aircraft departure taxiing time T can be divided into two parts:
where represents the time taken by the aircraft to taxi from the apron to the departure runway without conflict, and the magnitude of the value is related to the taxiing distance d; and indicates the amount of time spent escaping and waiting for each aircraft during the taxiing process due to mutual influence. The magnitude of the value reflects the degree of airport congestion and is related to the number (N) of aircraft departures on the airport surface.
From the analysis in the previous section, the departure taxiing time of aircraft is linearly related to the number of aircraft departing the airport surface and the departure taxiing distance. Table 2 shows the correlation data. According to the correlation coefficient r of the independent variable, when r is close to 1, there is a strong linear relationship between the two independent variables. It represents only a judgment on collinearity between two independent variables. Therefore, multiple linear regression models could be used to predict the aircraft departure taxiing time.
The multiple linear regression equation can be expressed as
Since the linear regression assumes that m(x1, x2, …, xp) is a linear function of the random variables (x1, x2, …, xp), in this paper, the aircraft departure taxiing time T is linearly related to the number of departure aircraft on the airport surface N and the departure taxiing distance d. Therefore, the multivariate linear regression equation expression of the aircraft departure taxiing time prediction model can be expressed as
In this formula, are the linear regression coefficients to be solved. For convenience of description, Equation (3) is represented by the matrix expression below (Equation (4)):
To ensure correct statistics, it is usually necessary to make multiple observations on the independent variable and the dependent variable corresponding to the independent variable. Assume that the observation statistics are performed n times, where Y and are n-dimensional column vectors, is a (p + 1)-dimensional column vector, and the independent variable X is an n × (p + 1)-dimensional matrix whose first column is all 1. Additionally, take p = 2 corresponding to Equation (3).
In order to obtain the best-estimated vector parameter , we make the sample estimation as close as possible to the observed value Y, making the error term as small as possible. Using least squares estimation, we can see that when , the square of ε-mode
reaches the minimum, so the best linear unbiased estimate is
The adjusted coefficient of determination can be used to measure how well the model fits the data. The expression is as follows:
In this formula, is the number of observations, that is, the number of departure aircraft counted; is each observation value of the dependent variable, that is, the ith aircraft departure taxiing time; is the average of the dependent variable observations, that is, the average departure taxiing time of the aircraft calculated; and is the estimated value of the dependent variable for each observation, that is, the multiple linear regression model prediction of the departure time of the ith aircraft. values between 0 and 1, with values closer to 1 indicating a better fit [14].
To sum up, we assume that the number of airport surface departure aircraft is N and the required departure taxiing distance is d. Equations (3) and (6) can then be used to obtain the fitting prediction formula for the aircraft departure taxiing time T as
Table 3 shows the parameters of the multiple linear regression. By Equation (7), the goodness of fit is described by an Adjusted R2 = 0.835, which shows that the aircraft departure taxiing time prediction model is reasonable.
5. Pushback Strategy for Departure on the Airport Surface
5.1. Implementation of Control Strategies
Taking the departing flight of the No. 2 apron of Hongqiao Airport shown in Figure 1 as an example, data analysis is conducted to compare the flight departure taxiing time, the runway utilization rate, and the takeoff rate under different departure aircraft numbers on the airport surface.
When the airport runway configuration is 18 L/18 R, the average departure taxiing distance of the No. 2 apron departing flight is 2.25 km, and we substitute the taxiing distance into Equation (8). Thus, the correspondence between the departure taxiing time of the flight and the number of departure aircraft on the airport surface can be obtained. Then, the corresponding relationship between the runway utilization rate, the flight takeoff and departure rate, and the number of departure aircraft on the airport surface can be calculated according to the statistics of Figure 2 and Figure 3. Thus, Table 4 can be obtained.
According to Table 4, when the number of aircraft departures on the airport surface is N ≤ 6, the number of departure aircraft is small and the flight departure taxiing time, runway utilization rate, and takeoff and departure rate of flights increase with an increase in the number of aircraft departures on the airport surface. When the number of aircraft departures on the airport surface is N = 7, the average departure taxiing time of No. 2 apron flights is 16.9 min, the runway utilization rate begins to be close to 1, the takeoff and departure rate is 0.53 flight/min, and the flight departure process begins to be controlled by the runway capacity limits. When the number of airport surface departure aircraft is N ≥ 8, the runway utilization rate and the flight takeoff and departure rate no longer increase, while the average taxi time of departure flights on the No. 2 apron no longer increases. Therefore, when the number of airport surface departure aircraft is N ≤ 7, the tower aircraft controller can act in accordance with the first-come first-service (FCFS) principle based on the pushback request clearance issued by the flight. When the number of airport surface departure aircraft is N ≥ 8, the controller can first control the aircraft pushback at the gate position, and then set up a virtual pushback sequence for these departure flights. When N ≤ 7, the departure flights will be queued according to the virtual pushback sequence. The implementation of the departure control strategy for the aircraft did not reduce the runway utilization rate and flight takeoff and departure rate, but it slowed the airport surface congestion so that the departure taxiing time can be effectively reduced without increasing the total delay in departure flights.
5.2. SIMMOD Simulation
The SIMMOD software was used to simulate the use of the departure control strategy. SIMMOD is a discrete-time simulation software released by the U.S. Federal Aviation Administration. SIMMOD provides dynamic decisions based on user-defined rules, and each process of a flight is controlled based on user rules. Its performance indicators are: the flight time of the aircraft, the capacity per unit of time, delays, etc. [15,16,17,18,19].
The SIMMOD simulation model relies mainly on a detailed description of the airport and airspace network, and the traffic flow moves on the nodes and connections of the network. The operating path of the aircraft can be specified either by the user or automatically by the Dijkstra Algorithm [20,21,22,23].
First, the Computer Aided Design (CAD) map of Hongqiao Airport is imported into SIMMOD to establish the airport topology map and the waypoints are inputted to establish the arrival and departure procedures and routes. Then, according to the flight plan of on 9 March 2015, UTC time 4:00–6:00 (local time 12:00–14:00), the arrival and departure flight information is established. The departure control strategy simulation is implemented.
The simulation results show that the average wait time of the 52 departure flights was 2.24 min, the total taxi time was decreased by 119 min, and the maximum waiting time for the gate was 14 min. As shown in Figure 7, the blue line represents the case where the departure control is not used, and the red line represents the case where the departure control is used. It can be clearly seen from the figure that by the use of the departure control strategy, the total departure taxi time is reduced.
The taxi time predicted in Section 5.1 by the Section 4 multiple linear regression prediction method is basically consistent with the taxi time obtained by the Section 5.2 SIMMOD simulation.
5.3. Analysis of Fuel Saving and Emission Reduction Data
During the busy hours of airport operation, the number of departure aircraft on the airport surface was controlled at N = 7. Compared with N = 9–11, the runway utilization rate and the takeoff and departure rate did not change substantially; however, the average departure taxiing time of each aircraft on the No. 2 apron decreased by 2.8–5.4 min, accounting for 16.7–31.9% of the aircraft departure taxiing time at this time.
Taking the CFM56-5B4/P engine of the Airbus A320 as an example, the total amount of fuel oil and pollutant gas emissions consumed for each departing aircraft’s taxiing on the No. 2 apron is calculated when the aircraft implements different departure control strategies [24,25] as shown in Table 5.
As can be seen from Table 2, when the number of airport surface departure aircraft is controlled to be N = 7, the fuel consumption per A320 departure flight is reduced by 35 kg to 67 kg compared to N = 9–11. Gas emissions decreased by 1.13–2.17 kg.
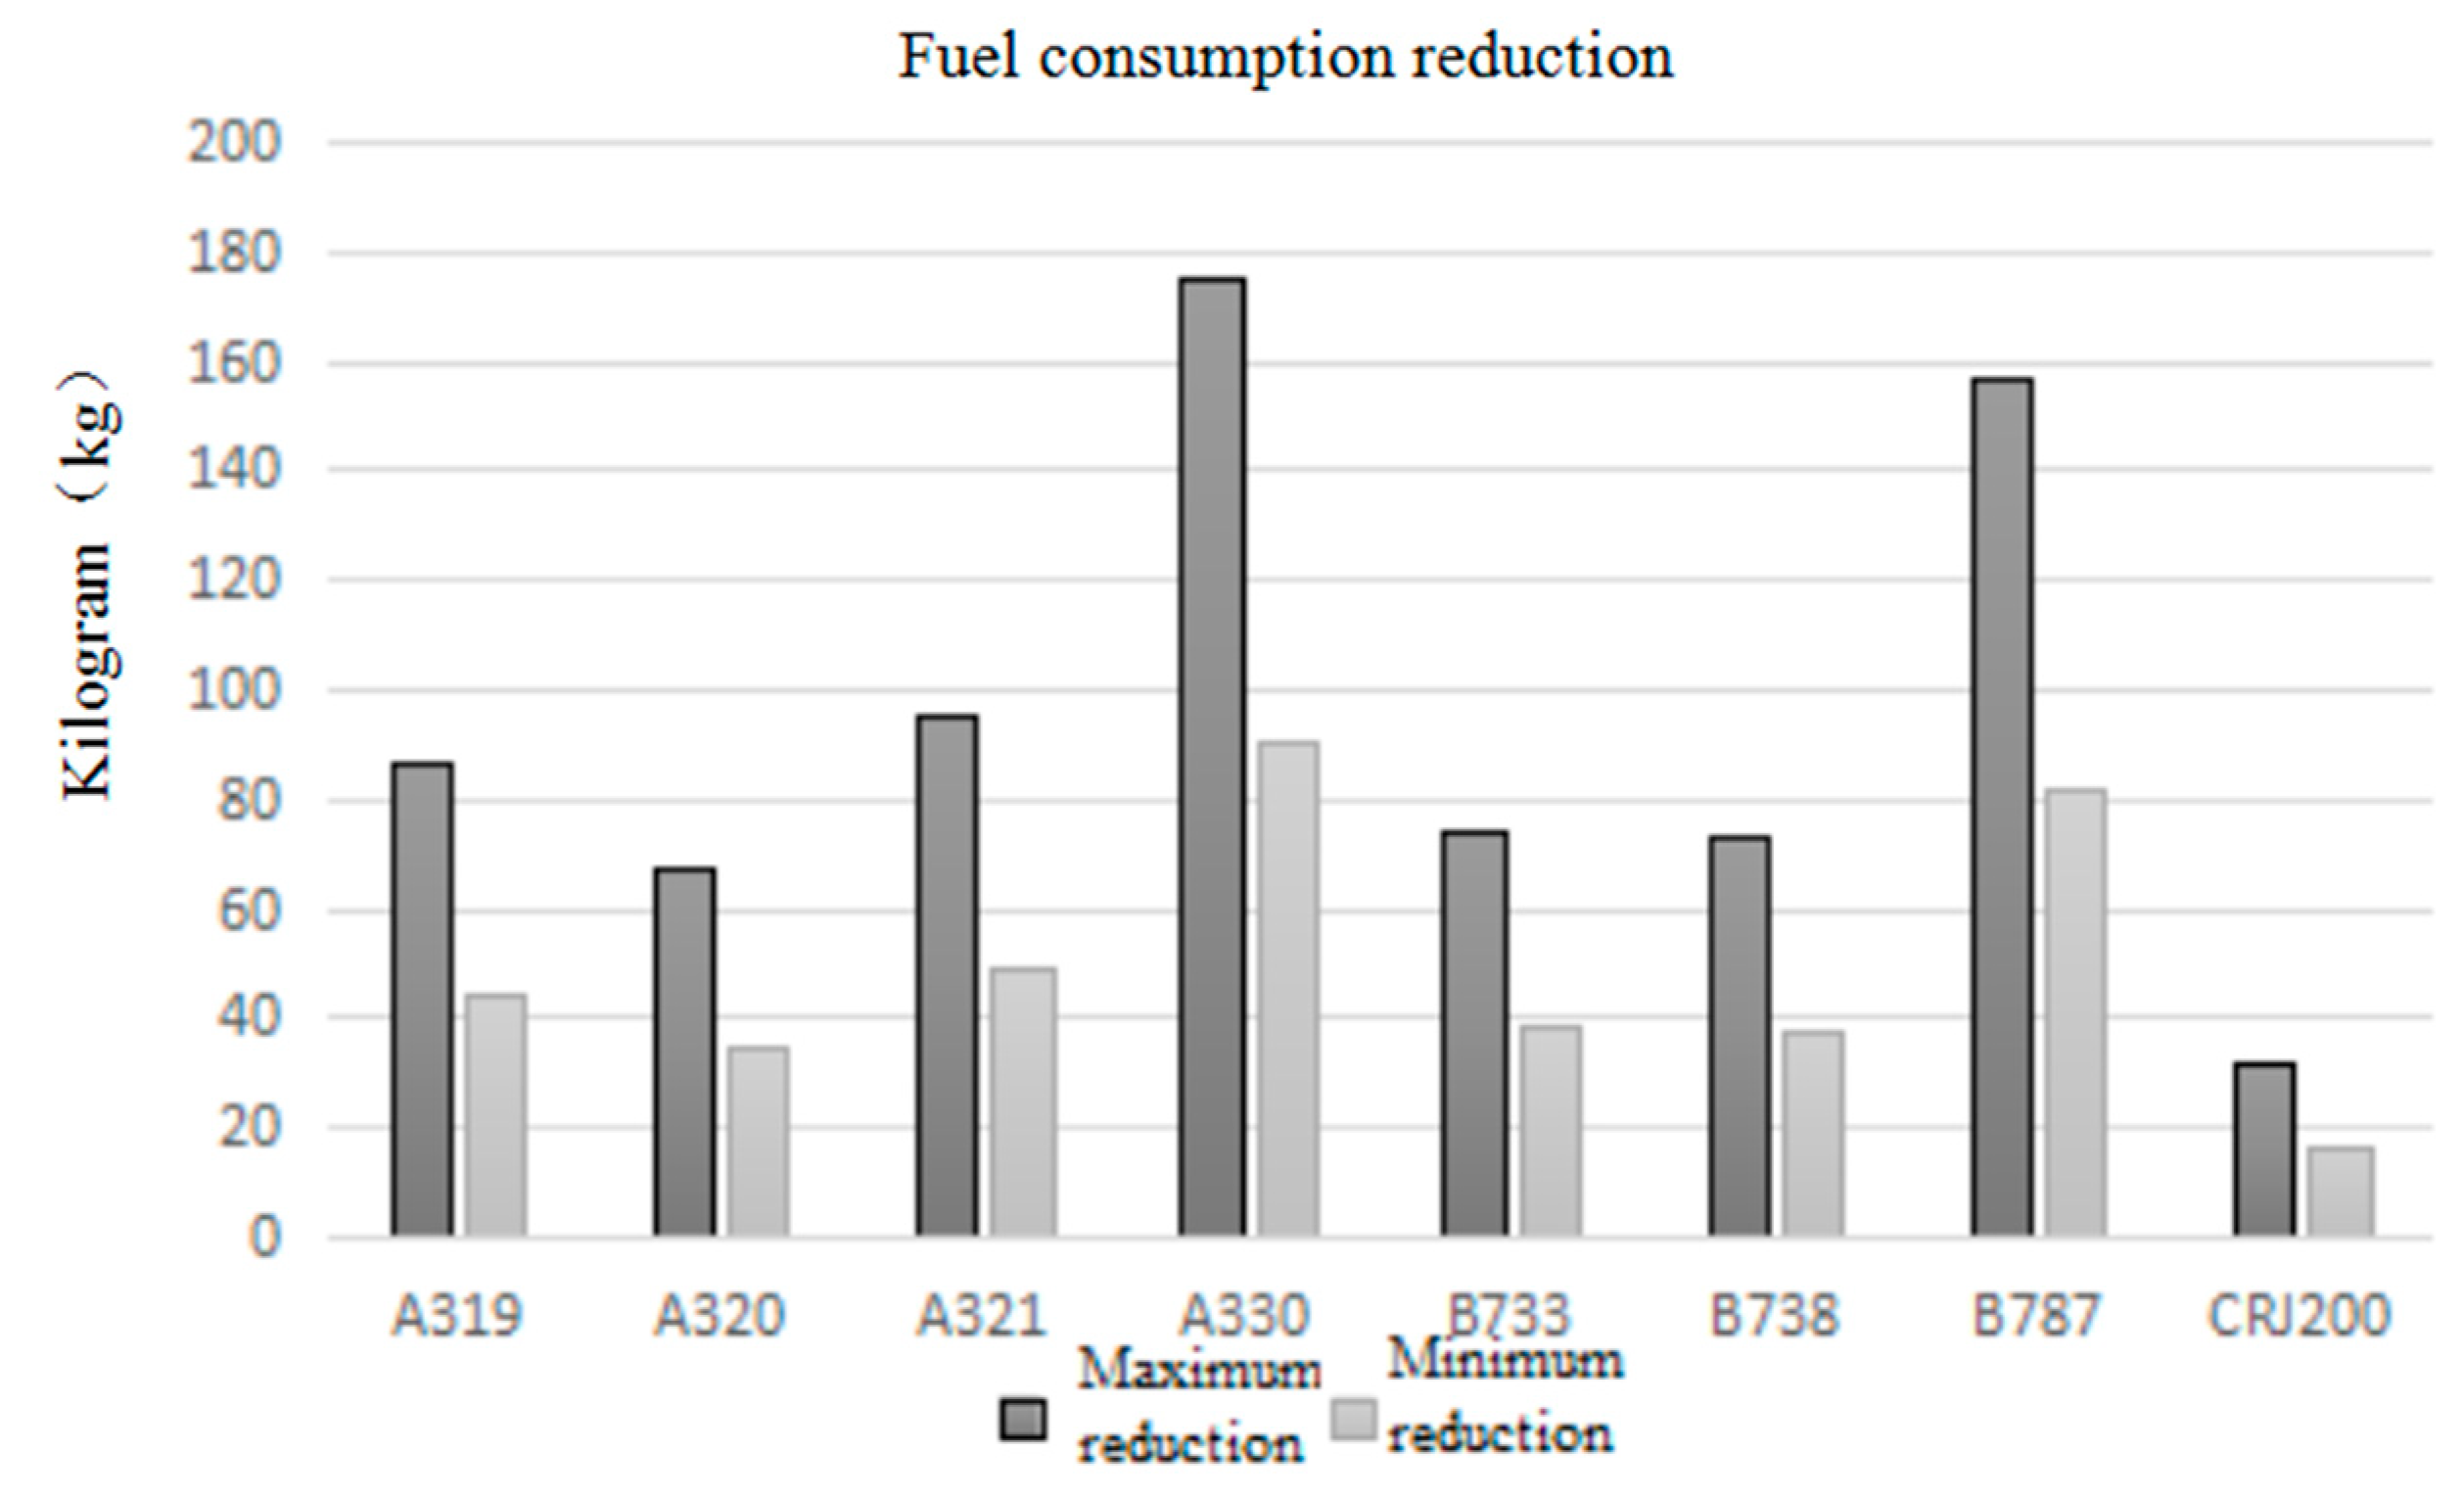
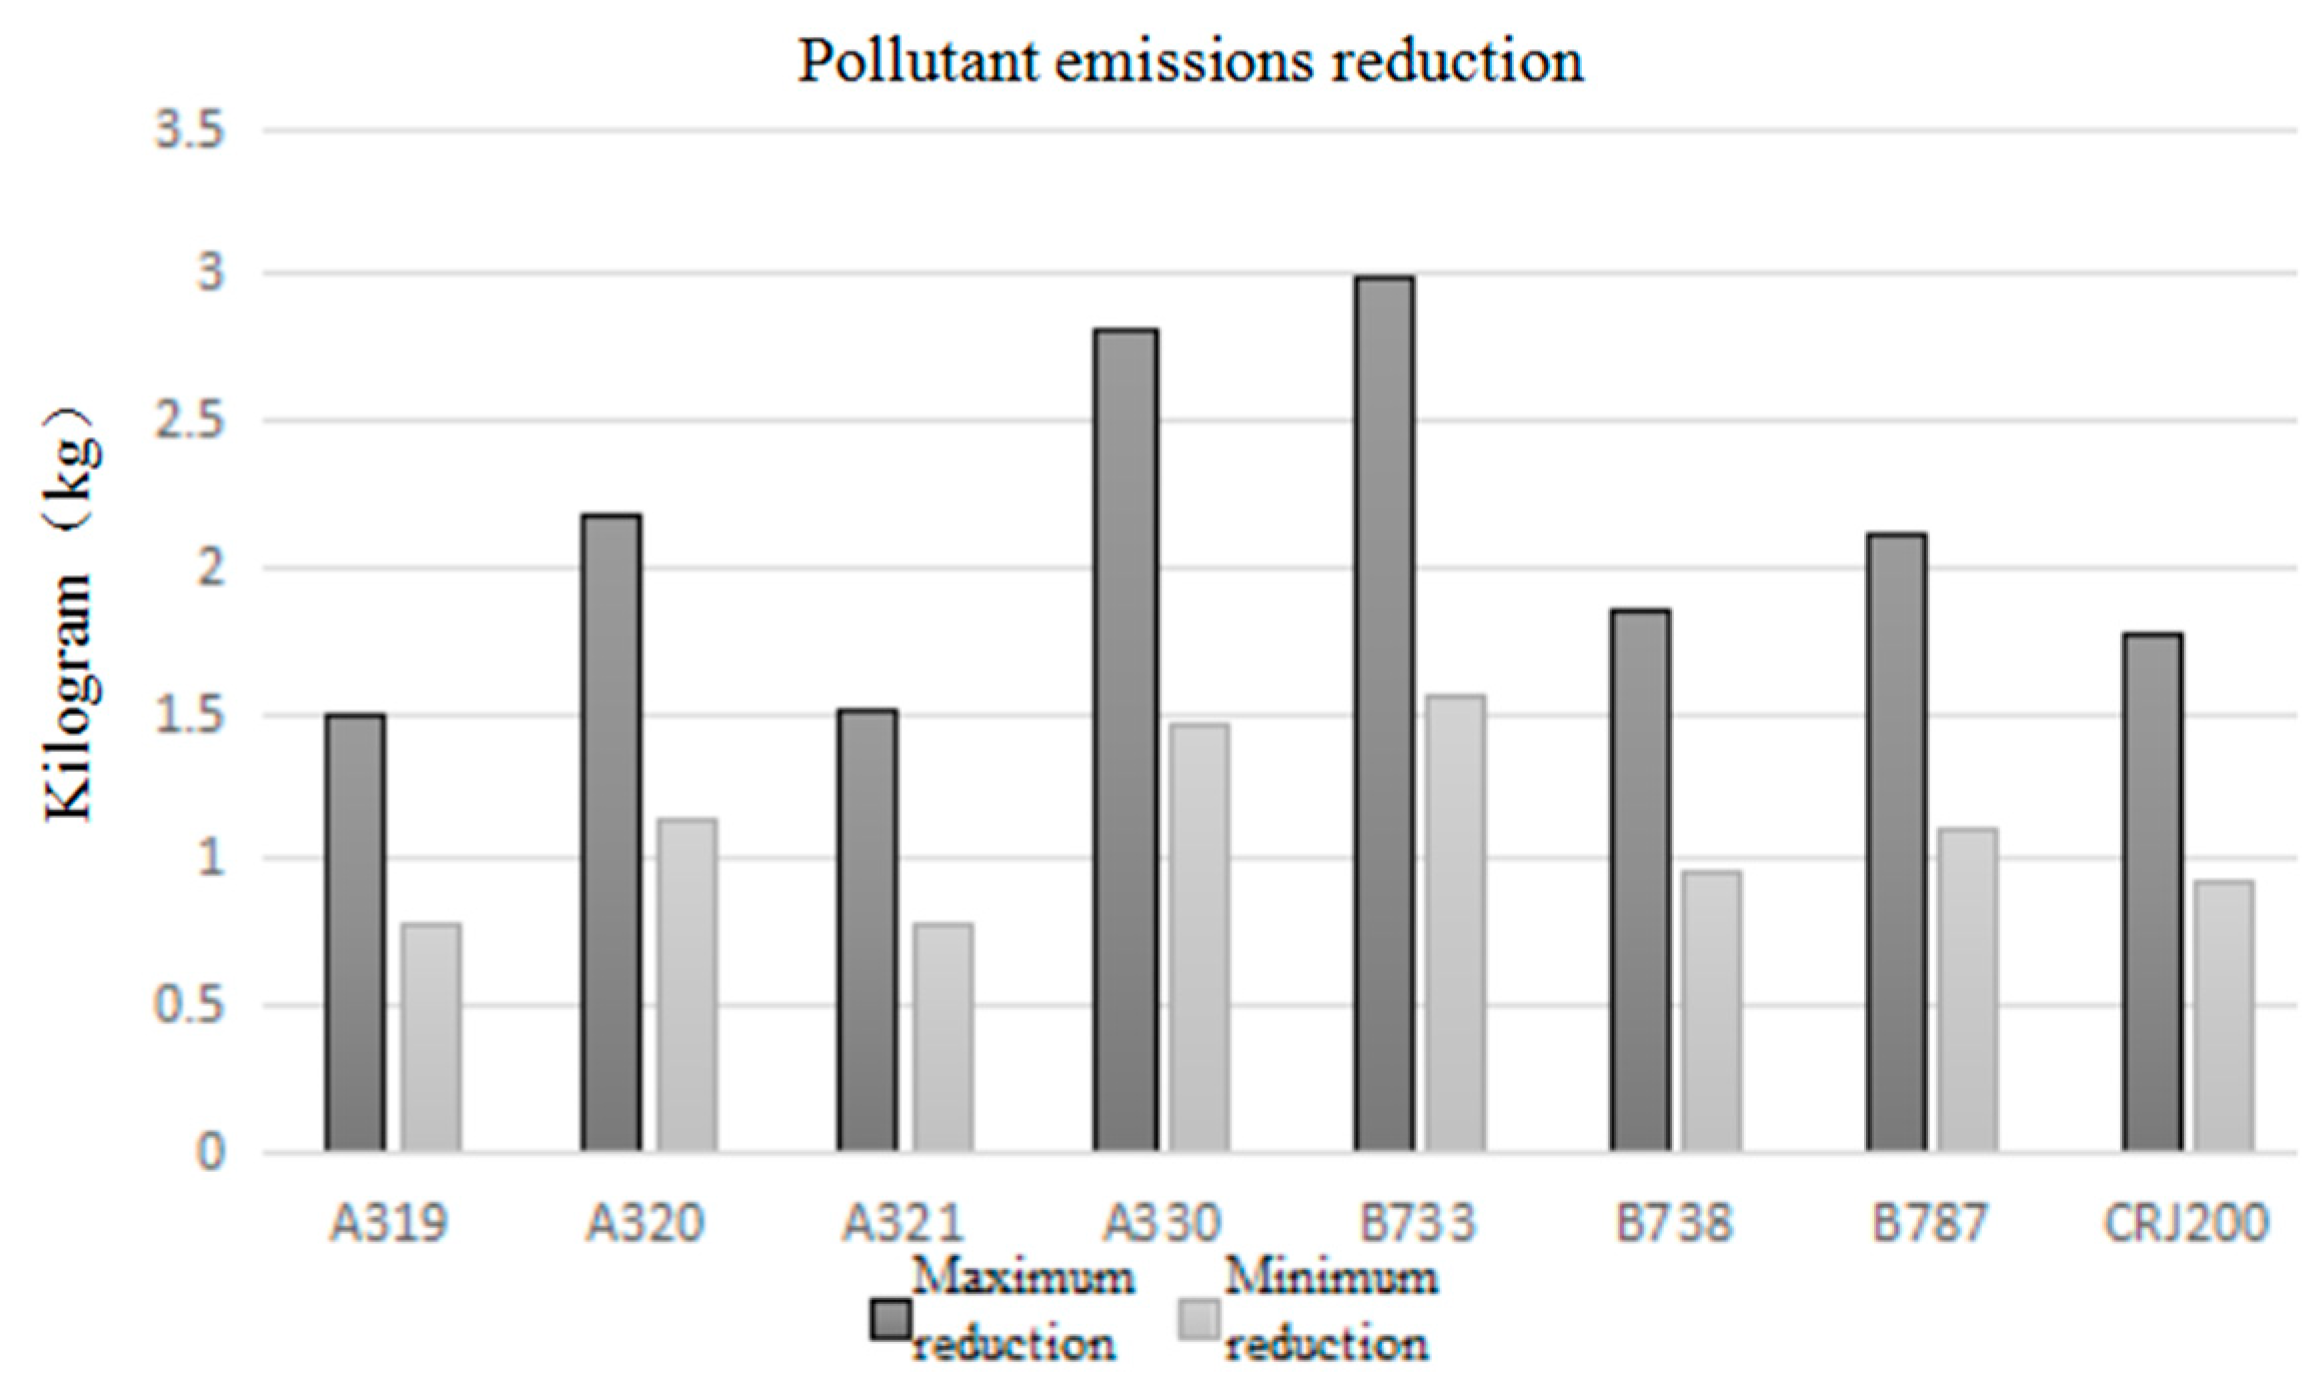
For other common aircraft types on the apron, when the airport implements a departure control strategy with N = 7 during busy hours, the reduction in fuel consumption and total pollutant emissions per flight is shown in Figure 8.
From Figure 8 and Figure 9, it can be seen that the fuel consumption and pollutant emissions of each type are greatly reduced. Therefore, the departure control strategy was adopted during the busy hours of airport operation, which effectively reduced the fuel consumption during the taxiing stage of the aircraft and reduced their pollutant emissions.
6. Conclusions
In this paper, the Shanghai Hongqiao Airport is taken as an example to study the control strategy for departure aircraft pushback on the airport surface. The influence of the different numbers of departure aircraft within the apron and taxiway systems on the runway utilization rate and the takeoff rate was studied under airport runway capacity constraints. Additionally, the influence of factors, such as the number of departure aircraft in the apron and taxiway systems, the position of the apron, and the configuration of airport arrival and departure runways, on the departure taxiing time of aircraft was analyzed. Multiple linear regression equations were used to establish an aircraft taxi departure time prediction model and the reductions in fuel consumption and pollutant emissions were calculated. The results show that reasonable control of the pushback of departing aircraft during the airport’s busy hours can reduce the aircraft departure taxiing time without reducing the runway utilization rate and takeoff and departure rate of the aircraft, thereby reducing aircraft fuel consumption and pollutant emissions during the taxiing phase.
Author Contributions
Writing: X.Z. and N.L.; Providing the case study and the idea: X.Z., N.L., Y.S., and H.Z.; Revising and editing: S.-B.T. and K.W.
Funding
This research was funded by the National Natural Science Foundation (No. U1533112) and the National Social Science Foundation (No.13CGL005).
Acknowledgments
The authors would like to thank the National Natural Science Foundation (No. U1533112) and the National Social Science Foundation (No.13CGL005) for the support.
Conflicts of Interest
The authors declare no conflict of interest.
References
- María, V.M.; Hall, C.A. Modelling Performance and Emissions from Aircraft for the Aviation Integrated Modelling project. J. Aircr. 2010, 47, 812–819. [Google Scholar]
- Jung, Y. Fuel Consumption and Emissions from Airport Taxi Operations. Available online: https://core.ac.uk/display/10559073 (accessed on 17 August 2018).
- Balakrishnan, H.; Jung, Y. A Framework for Coordinated Surface Operations Planning at Dallas-Fort Worth International Airport. Available online: https://arc.aiaa.org/doi/abs/10.2514/6.2007-6553 (accessed on 13 September 2108).
- Simaiakis, I.; Balakrishnan, H. Queuing Models of Airport Departure Processes for Emissions Reduction. Available online: https://arc.aiaa.org/doi/10.2514/6.2009-5650 (accessed on 13 September).
- Jung, Y.C.; Hoang, T.; Montoya, J. A Concept and Implementation of Optimized Operations of Airport Surface Traffic. Available online: https://arc.aiaa.org/doi/abs/10.2514/6.2010-9213 (accessed on 13 September).
- Lee, H.; Simaiakis, I.; Balakrishnan, H. A comparison of aircraft trajectory-based and aggregate queue-based control of airport taxi processes. In Proceedings of the 29th Digital Avionics Systems Conference, Salt Lake City, UT, USA, 3–7 October 2010; pp. 1–15. [Google Scholar]
- Simaiakis, I.; Khadilkar, H.; Balakrishnan, H.; Hansman, R.G. Demonstration of reduced airport congestion through pushback rate control. Transp. Res. Part A 2014, 66, 251–267. [Google Scholar] [CrossRef] [Green Version]
- Ravizza, S.; Atkin, J.A.D.; Maathuis, M.H.; Burke, E.K. A combined statistical approach and ground movement model for improving taxi time estimations at airports. J. Oper. Res. Soc. 2013, 64, 1347–1360. [Google Scholar] [CrossRef] [Green Version]
- Tang, Y. Aircraft Taxi Routes Planning and 3D Simulation for A-SMGCS. Ph.D. Thesis, Nanjing University of Aeronautics and Astronautics, Nanjing, China, December 2014. [Google Scholar]
- Zhao, X.; Tang, J.; Lu, F.; Han, B. Strategy Analysis for Delayed Fights Pushback and Sensitivity Analysis of the Length of Virtual Queue. J. Sichuan Univ. 2016, 3, 115–123. [Google Scholar]
- Li, N.; Lv, H. Method to Find out Path of Aircraft on Surface Based on Surface Movement Radar Data. Aeronaut. Comput. Tech. 2016, 46, 6–9. [Google Scholar]
- Lv, H. The Analysis of Aircraft Taxiing and Prediction Study Based on Surveillance Data. Master’s Thesis, Civil Aviation University of China, Beijing, China, April 2016. Available online: http://kns.cnki.net/KCMS/detail/detail.aspx?dbcode=CMFD&dbname=CMFD201701&filename=1016776031.nh&uid=WEEvREcwSlJHSldRa1FhdkJkVWI0UTA0a3RxcEdTZnNJVW1ZVVFkM3gvVT0=$9A4hF_YAuvQ5obgVAqNKPCYcEjKensW4IQMovwHtwkF4VYPoHbKxJw!!&v=MDAwNDFyQ1VSTEtmYnVkb0Z5bmhWYjdMVkYyNkdMUy9HTkhQcnBFYlBJUjhlWDFMdXhZUzdEaDFUM3FUcldNMUY= (accessed on 17 August 2018).
- Eurocontrol Standard Document for Surveillance Data Exchange Part 9: Category 062 SDPS Track Messages. Available online: https://www.google.com.tw/url?sa=t&rct=j&q=&esrc=s&source=web&cd=1&ved=2ahUKEwiHtb3gtLndAhWLyrwKHdT3AxoQFjAAegQIARAC&url=https%3A%2F%2Fwww.eurocontrol.int%2Fsites%2Fdefault%2Ffiles%2Fcontent%2Fdocuments%2Fnm%2Fasterix%2Farchives%2Fasterix-cat062-system-track-data-part9-v1.11-042010.pdf&usg=AOvVaw389n3cb5i1jElDR9PsFJ3s (accessed on 14 September 2018).
- Anderson, R.C.; Reeb, D.M. Founding-family Ownership and Firm Performance: Evidence from the S&P 500. J. Financ. 2003, 58, 1301–1328. [Google Scholar]
- Tsai, S.-B. Using the DEMATEL Model to Explore the Job Satisfaction of Research and Development Professionals in China’s Photovoltaic Cell Industry. Renew. Sustain. Energy Rev. 2018, 81, 62–68. [Google Scholar] [CrossRef]
- Lee, Y.-C.; Hsiao, Y.-C.; Peng, C.-F.; Tsai, S.-B.; Wu, C.-H.; Chen, Q. Using Mahalanobis-Taguchi System, Logistic Regression and Neural Network Method to Evaluate Purchasing Audit Quality. Available online: http://journals.sagepub.com/doi/10.1177/0954405414539934 (accessed on 13 September 2108).
- Liu, B.; Li, T.; Tsai, S.B. Low carbon strategy analysis of competing supply chains with different power structures. Sustainability 2017, 9, 835. [Google Scholar]
- Qu, Q.; Tsai, S.-B.; Tang, M.; Xu, C.; Dong, W. Marine ecological environment management based on ecological compensation mechanisms. Sustainability 2016, 8, 1267. [Google Scholar] [CrossRef]
- Lee, Y.-C.; Wang, Y.-C.; Chien, C.-H.; Wu, C.-H.; Lu, S.-C.; Tsai, S.-B.; Dong, W. Applying revised gap analysis model in measuring hotel service quality. SpringerPlus 2016, 5, 1191. [Google Scholar] [CrossRef] [PubMed]
- Wang, J.; Yang, J.; Chen, Q.; Tsai, S.-B. Collaborative Production Structure of Knowledge Sharing Behavior in Internet Communities. Mob. Inf. Syst. 2016, 2016, 8269474. [Google Scholar] [CrossRef]
- Tsai, S.-B.; Lee, Y.-C.; Guo, J.J. Using modified grey forecasting models to forecast the growth trends of green materials. Proc. Inst. Mech. Eng. Part B J. Eng. Manuf. 2014, 228, 931–940. [Google Scholar] [CrossRef]
- Ge, B.; Jiang, D.; Gao, Y.; Tsai, S.-B. The influence of legitimacy on a proactive green orientation and green performance: A study based on transitional economy scenarios in china. Sustainability 2016, 8, 1344. [Google Scholar] [CrossRef]
- Lee, S.-C.; Su, J.-M.; Tsai, S.-B.; Lu, T.-L.; Dong, W. A comprehensive survey of government auditors’ self-efficacy and professional Development for improving audit quality. SpringerPlus 2016, 5, 1263. [Google Scholar] [CrossRef] [PubMed]
- ICAO Aircraft Engine Emissions Databank. Available online: https://www.easa.europa.eu/easa-and-you/environment/icao-aircraft-engine-emissions-databank (accessed on 17 August 2018).
- Li, N.; Zhang, H.F. Calculating aircraft pollutant emissions during taxiing at the airport. Acta Sci. Circumstantiae 2017, 37, 1872–1876. [Google Scholar]
Figure 1.
Network diagram of the Shanghai Hongqiao Airport taxiway system.

Figure 2.
The relationship between runway utilization and the number of departing aircraft.
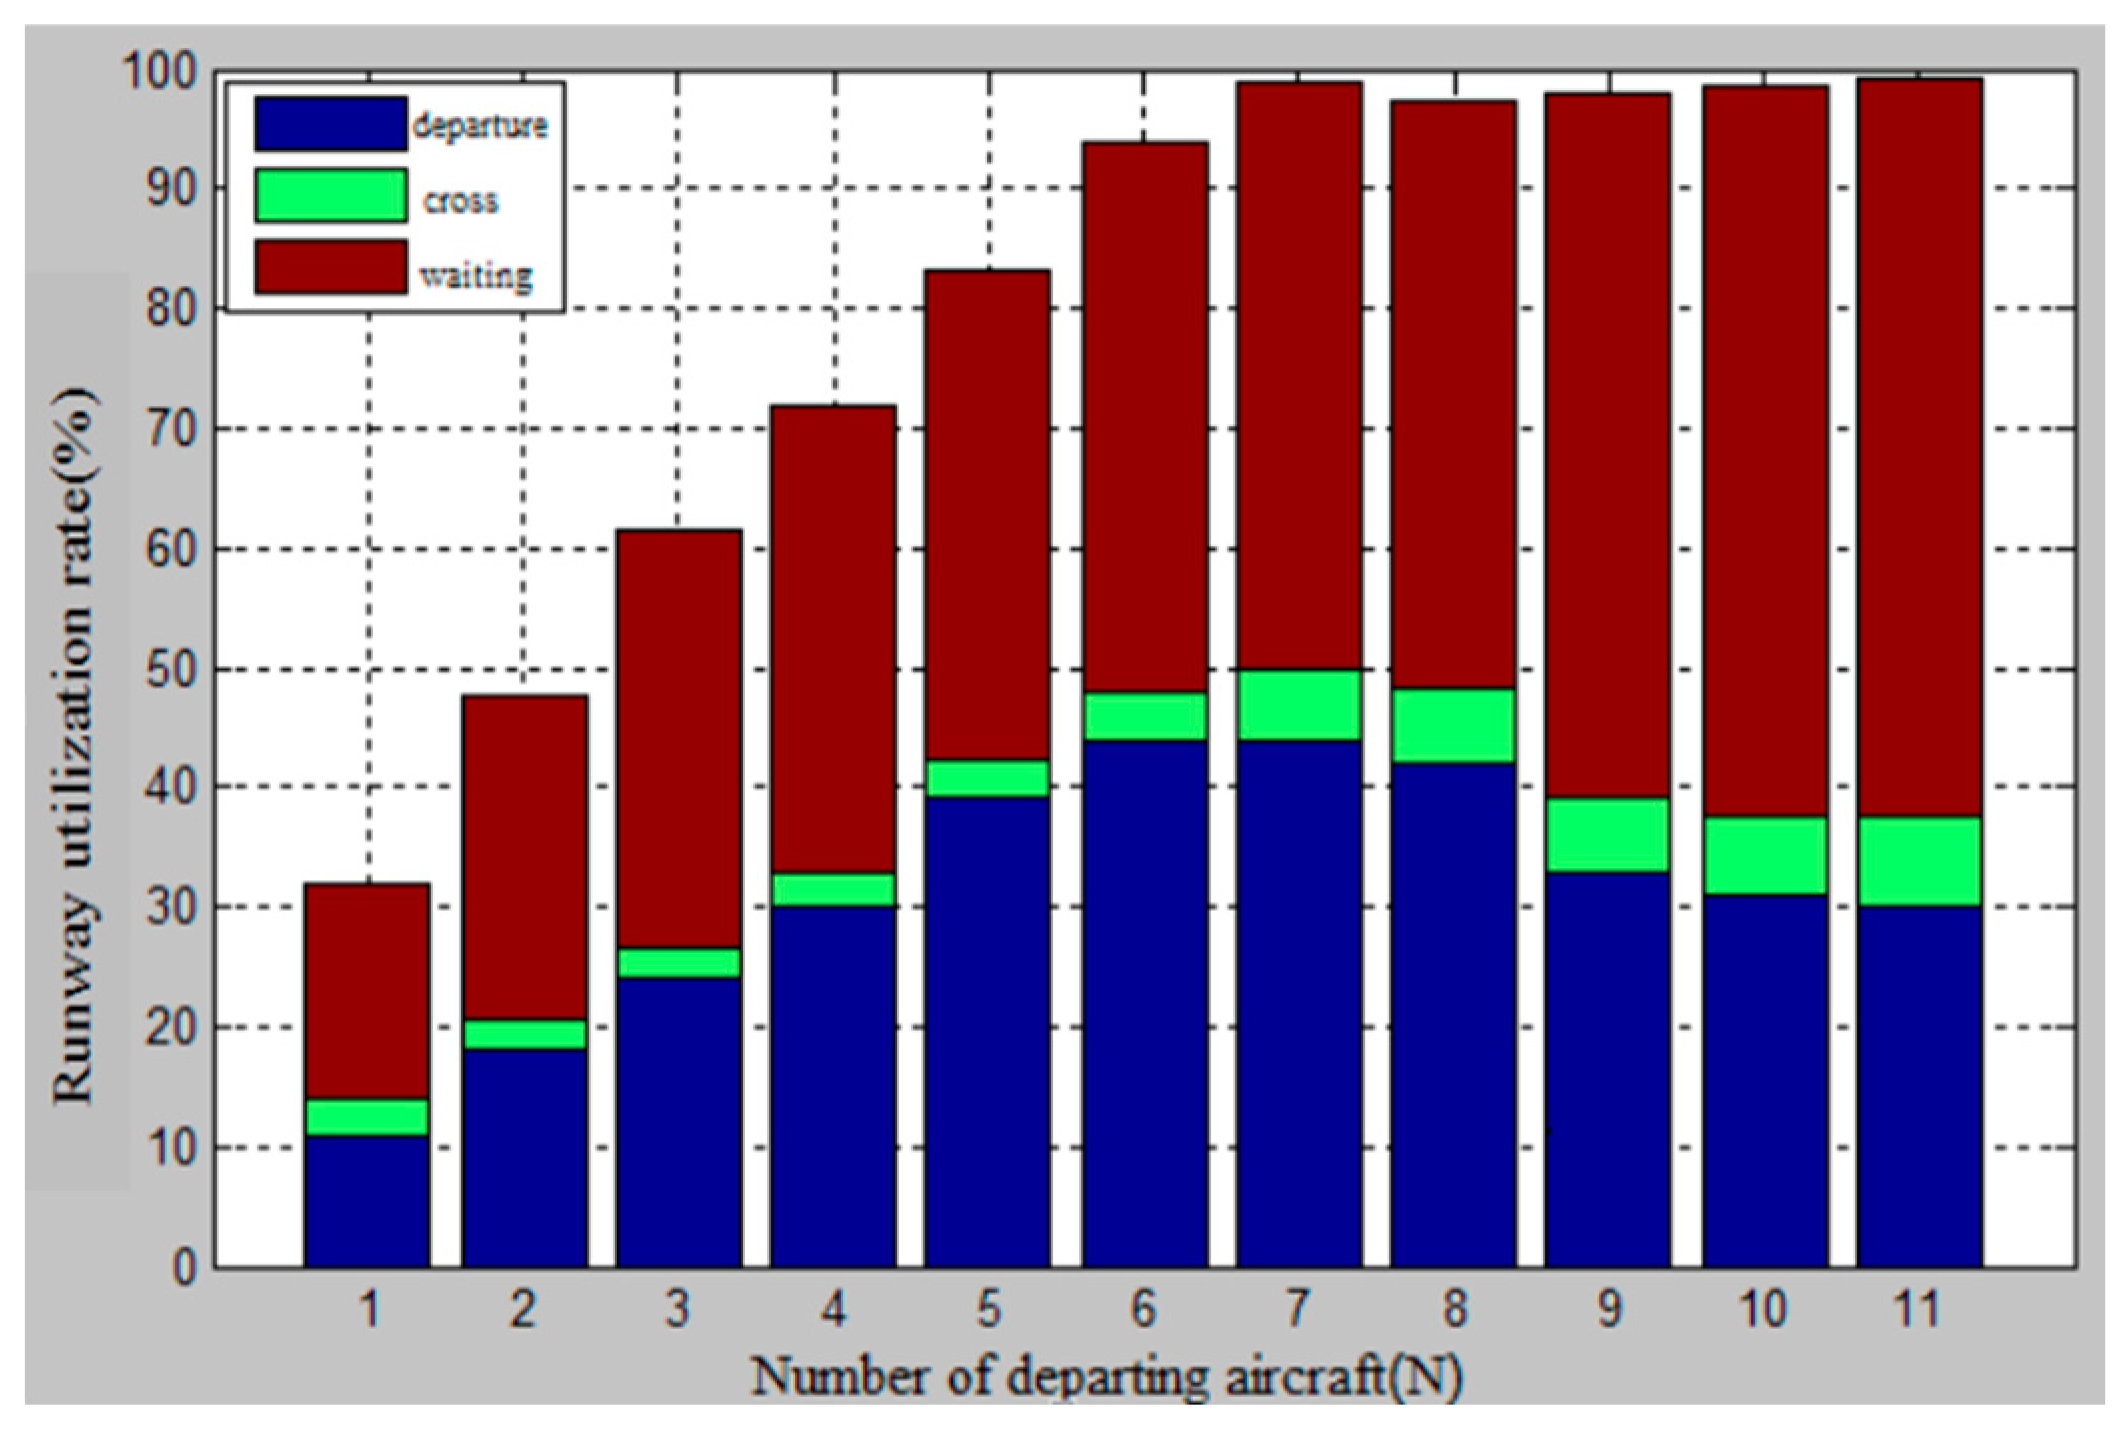
Figure 3.
The relationship between the takeoff rate and the number of departure aircraft.

Figure 4.
The scatter diagram of the relationship between the departure taxiing time and the number of aircraft.
Figure 4.
The scatter diagram of the relationship between the departure taxiing time and the number of aircraft.

Figure 5.
The scatter diagram of the relationship between the departure taxiing time and the number of departing aircraft.
Figure 5.
The scatter diagram of the relationship between the departure taxiing time and the number of departing aircraft.
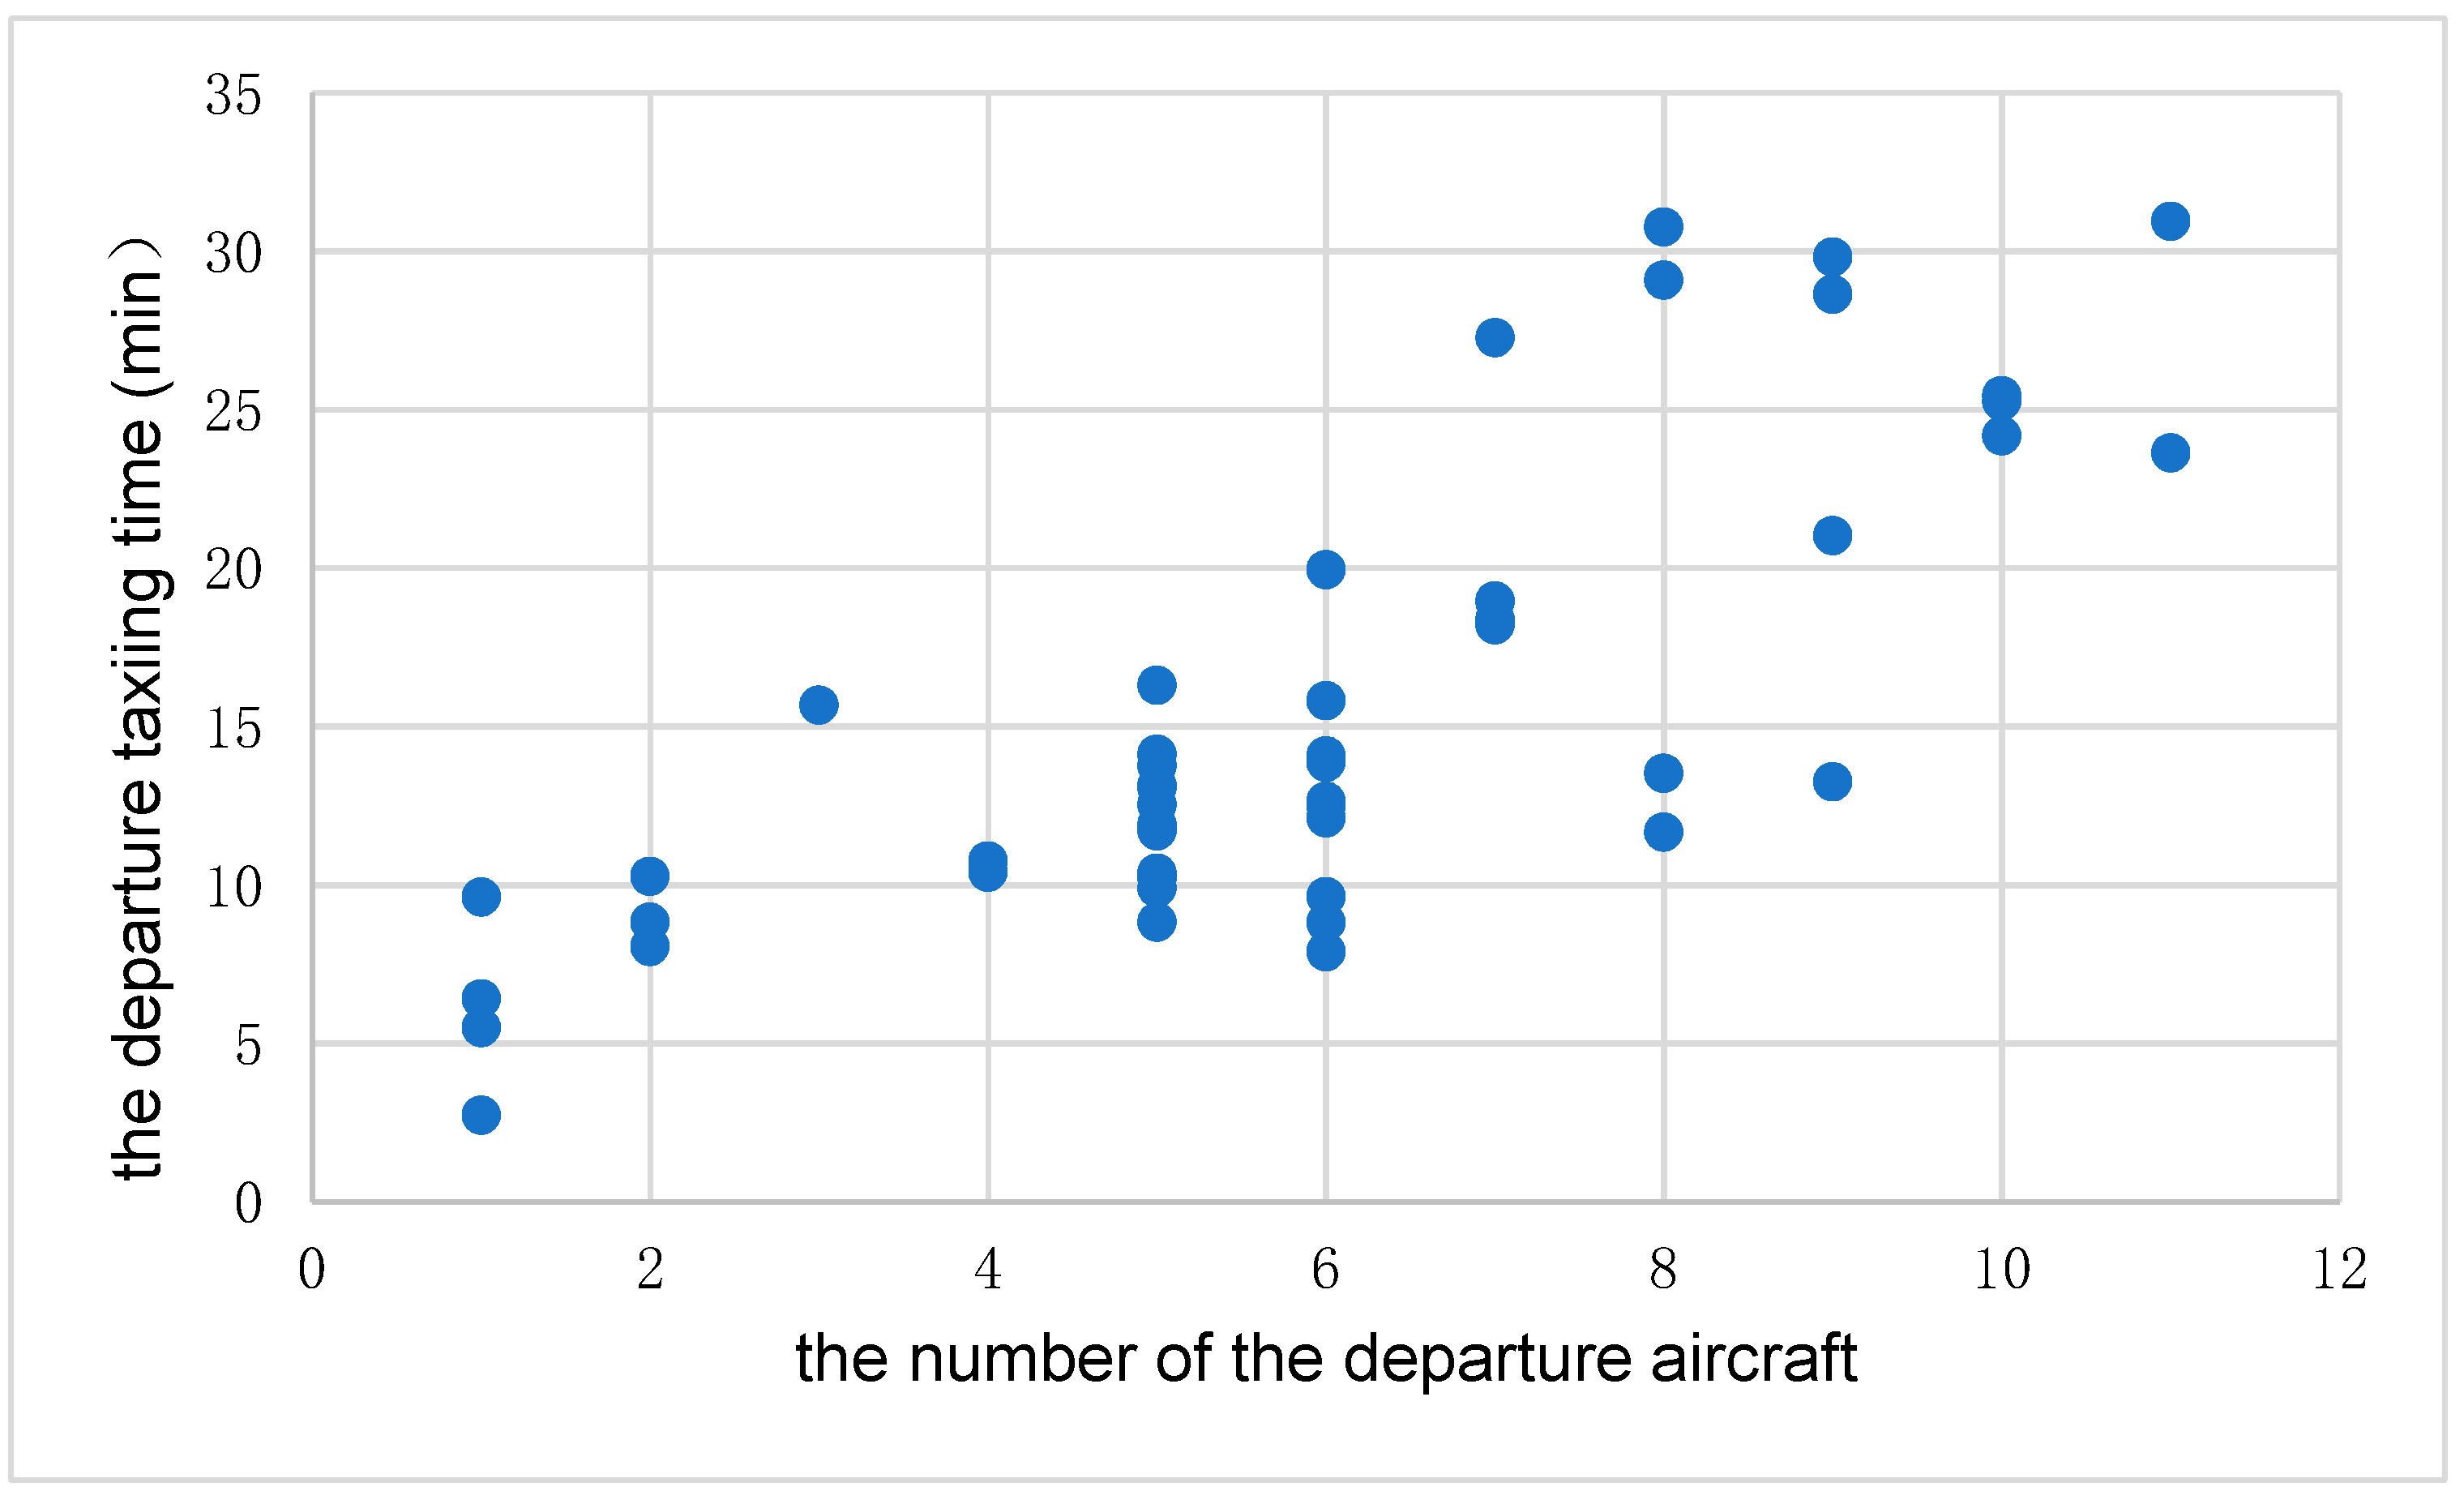
Figure 6.
The scatter diagram of the relationship between the flight taxi time and the taxi distance.
Figure 6.
The scatter diagram of the relationship between the flight taxi time and the taxi distance.

Figure 7.
The scatter diagram of the relationship between the flight taxi time and the taxi distance.
Figure 7.
The scatter diagram of the relationship between the flight taxi time and the taxi distance.
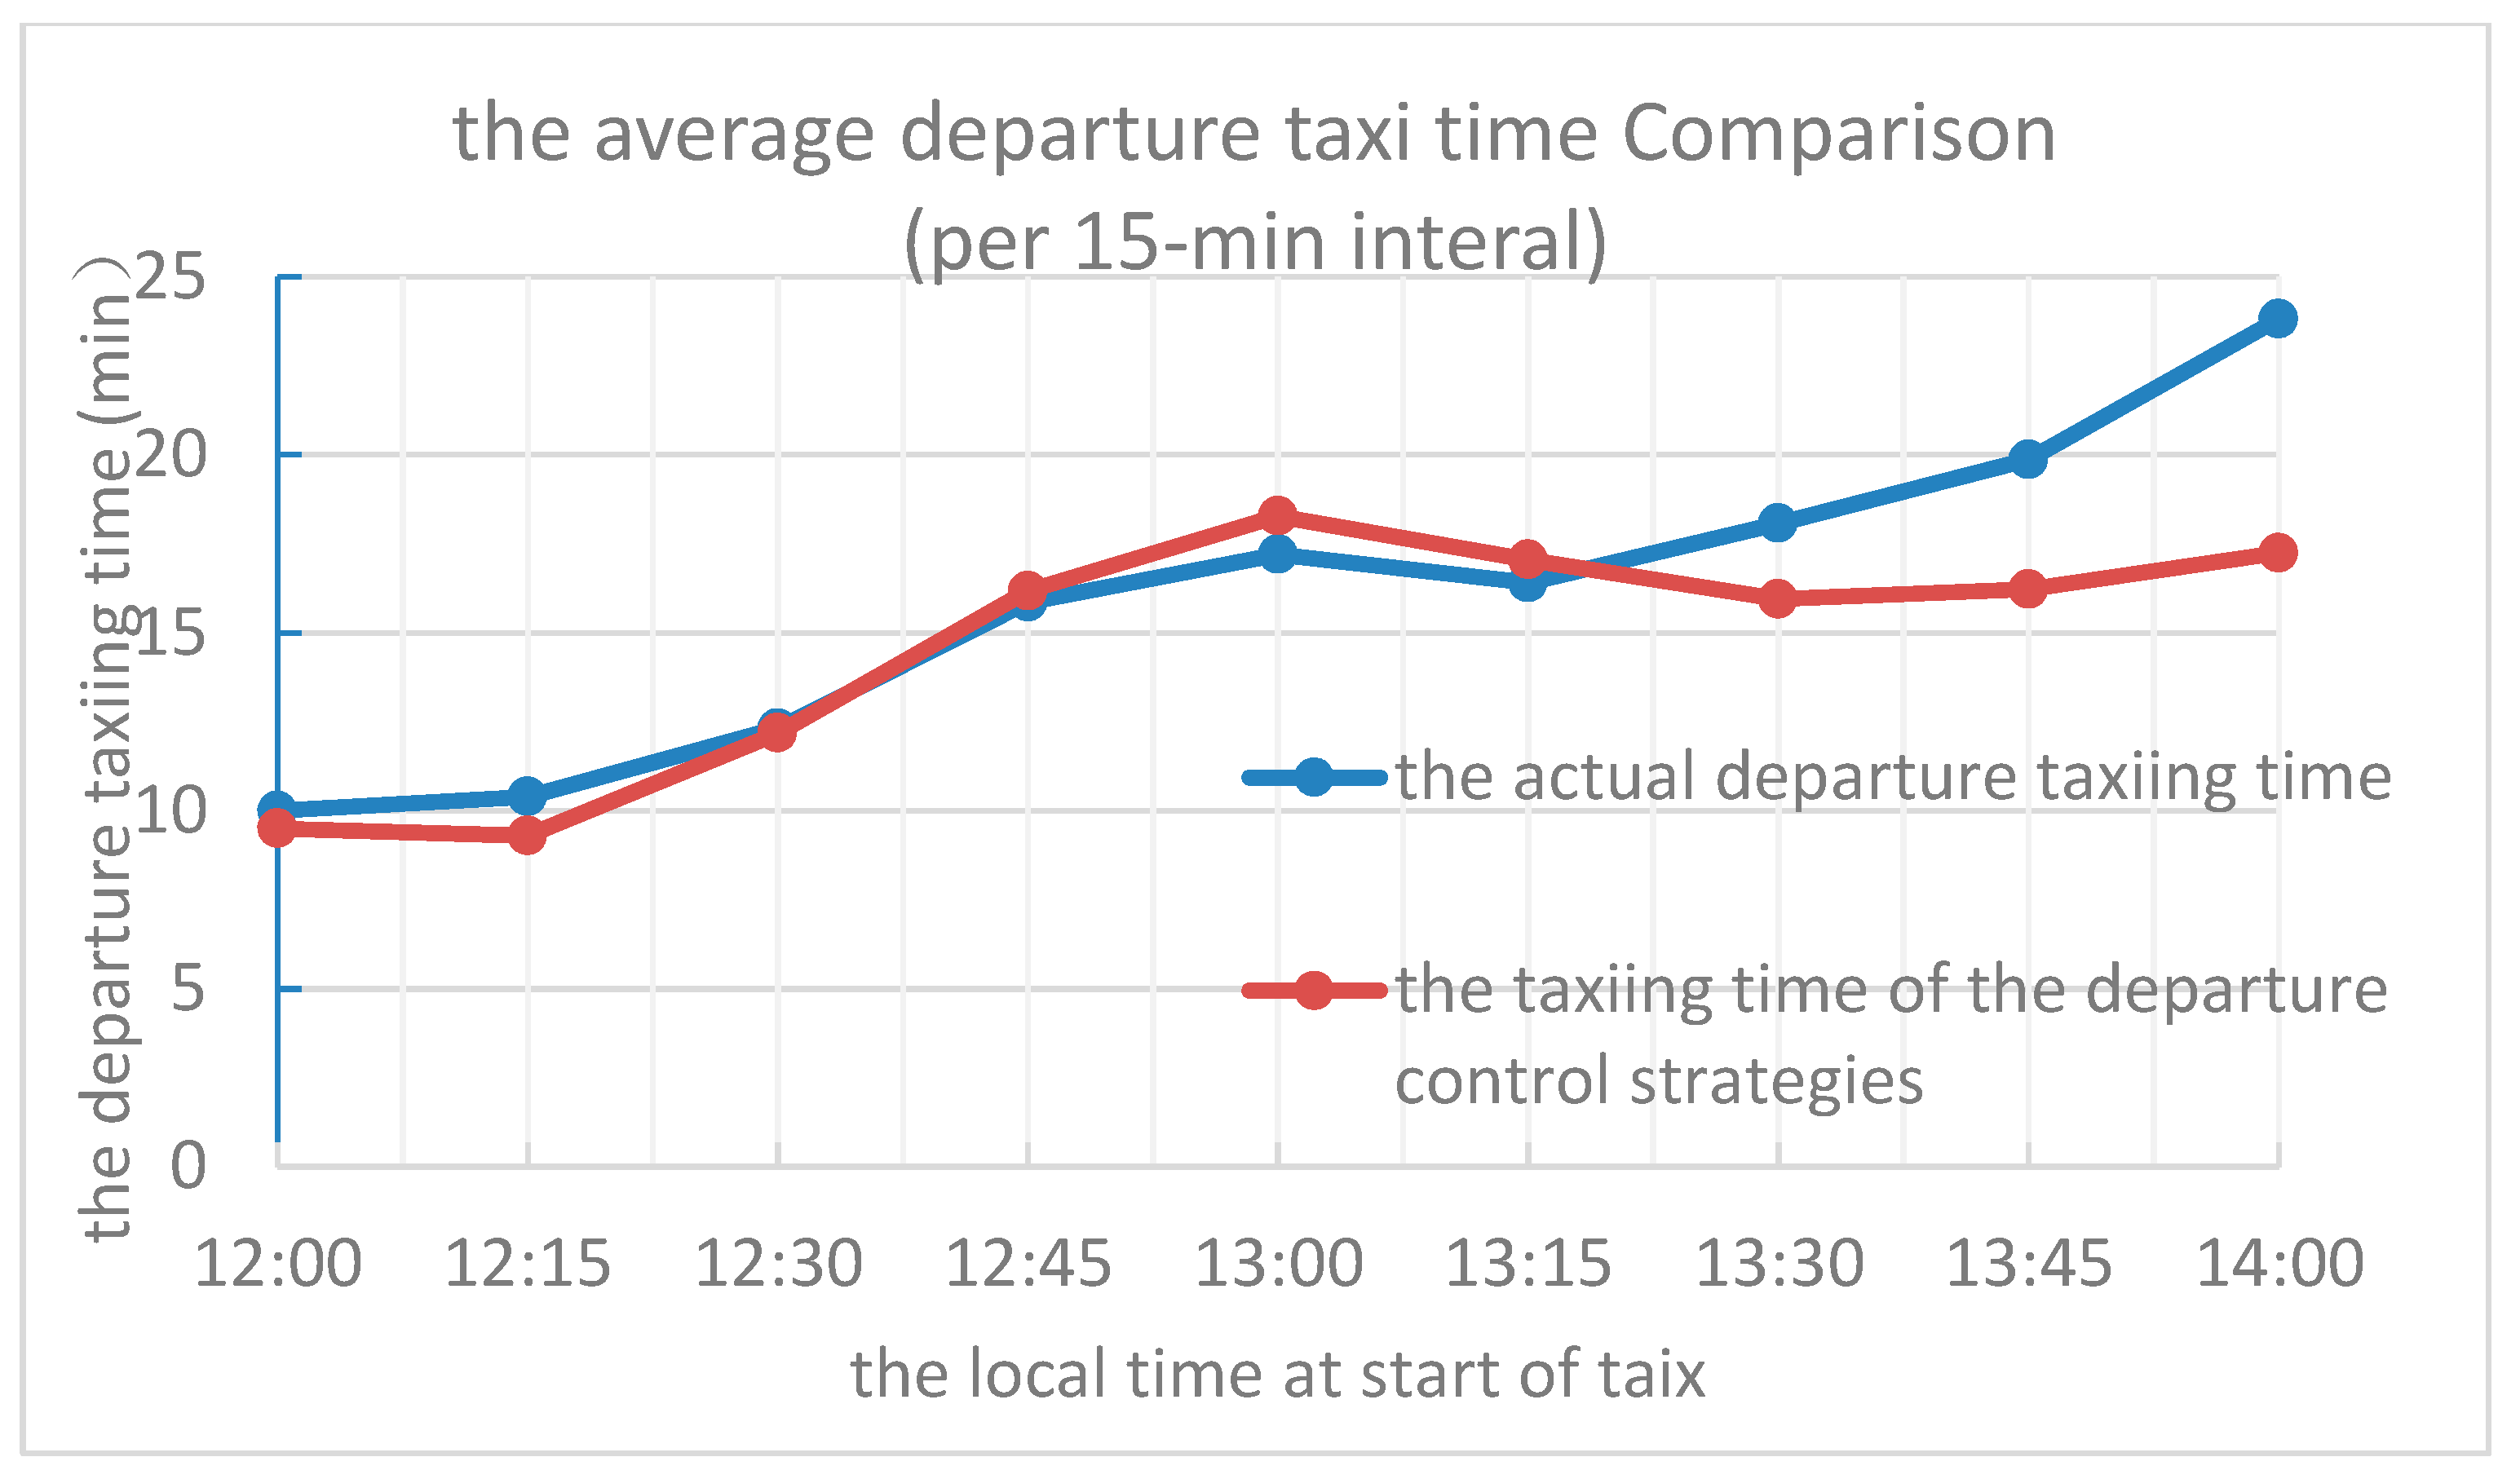
Figure 8.
The fuel consumption reduction graph.

Figure 9.
The reduction in the pollutant emissions.


Table 1.
Summary of Statistics for the departure flight Sample.
| Mean | Median | Standard Deviation | Max. | Min. | |
|---|---|---|---|---|---|
| the Departure Taxiing Time (Minutes) | 16.32 | 14.19 | 7.05 | 30.94 | 2.73 |
| the Number of the Departure Aircraft (Flights) | 5.90 | 6 | 2.55 | 11 | 1 |
| the Taxiing Distance (Meters) | 2232.37 | 2278 | 458.06 | 3055 | 1005 |
Table 2.
Correlation Data.
| the Number of Departure Aircraft | the Taxiing Distance | |
|---|---|---|
| the Number of Departure Aircraft | 1 | 0.66551 |
| the Taxiing Distance | 0.66551 | 1 |
Table 3.
The tables of the parameters for regression.
| Variable | Coefficient | t-Statistic | Sig |
|---|---|---|---|
| C | −8.078409 | −2.81201 | ** |
| N | 1.353452 | 4.748534 | *** |
| d | 6.958 | 4.259463 | *** |
Sig. indicates if the p-value is 0.05 (*), 0.01 (**), or 0.001 (***).
Table 4.
The operating parameters for different numbers of departure aircraft.
| Airport Surface Departure Aircraft Number (N) | Taxi Time (min) | Takeoff and Departure Rate (flight/min) | Runway Utilization (%) |
|---|---|---|---|
| 1 | 8.87 | 0.11 | 32.0 |
| 2 | 10.2 | 0.21 | 47.5 |
| 3 | 11.6 | 0.29 | 61.5 |
| 4 | 12.9 | 0.37 | 72.1 |
| 5 | 14.3 | 0.43 | 83.3 |
| 6 | 15.6 | 0.49 | 94.0 |
| 7 | 16.9 | 0.53 | 98.9 |
| 8 | 18.3 | 0.53 | 97.3 |
| 9 | 19.7 | 0.50 | 97.0 |
| 10 | 21.0 | 0.44 | 98.5 |
| 11 | 22.3 | 0.42 | 100 |
Table 5.
The total fuel consumption and total pollutant emissions of departing aircraft under different departure control strategies.
Table 5.
The total fuel consumption and total pollutant emissions of departing aircraft under different departure control strategies.
| Airport Surface Departure Aircraft Number (N) | Fuel Consumption (kg) | Pollutants Total Emissions (kg) |
|---|---|---|
| 6 | 194.6 | 6.28 |
| 7 | 210.9 | 6.81 |
| 8 | 228.4 | 7.37 |
| 9 | 245.9 | 7.94 |
| 10 | 262.1 | 8.46 |
| 11 | 278.3 | 8.98 |
© 2018 by the authors. Licensee MDPI, Basel, Switzerland. This article is an open access article distributed under the terms and conditions of the Creative Commons Attribution (CC BY) license (http://creativecommons.org/licenses/by/4.0/).
Share and Cite
MDPI and ACS Style
Zhu, X.; Li, N.; Sun, Y.; Zhang, H.; Wang, K.; Tsai, S.-B. A Study on the Strategy for Departure Aircraft Pushback Control from the Perspective of Reducing Carbon Emissions. Energies 2018, 11, 2473. https://doi.org/10.3390/en11092473
AMA Style
Zhu X, Li N, Sun Y, Zhang H, Wang K, Tsai S-B. A Study on the Strategy for Departure Aircraft Pushback Control from the Perspective of Reducing Carbon Emissions. Energies. 2018; 11(9):2473. https://doi.org/10.3390/en11092473
Chicago/Turabian StyleZhu, Xinhua, Nan Li, Yu Sun, Hongfei Zhang, Kai Wang, and Sang-Bing Tsai. 2018. "A Study on the Strategy for Departure Aircraft Pushback Control from the Perspective of Reducing Carbon Emissions" Energies 11, no. 9: 2473. https://doi.org/10.3390/en11092473
Note that from the first issue of 2016, this journal uses article numbers instead of page numbers. See further details here.