Short-Circuit Current Calculation and Harmonic Characteristic Analysis for a Doubly-Fed Induction Generator Wind Turbine under Converter Control


State Key Laboratory for Alternate Electrical Power System with Renewable Energy Source, North China Electric Power University, Beijing 102206, China
*
Author to whom correspondence should be addressed.
Energies 2018, 11(9), 2471; https://doi.org/10.3390/en11092471
Submission received: 30 August 2018
/
Revised: 13 September 2018
/
Accepted: 14 September 2018
/
Published: 17 September 2018
(This article belongs to the Special Issue Modeling of Wind Turbines and Wind Farms)
Abstract
:An accurate calculation of short-circuit current (SCC) is very important for relay protection setting and optimization design of electrical equipment. The short-circuit current for a doubly-fed induction generator wind turbine (DFIG-WT) under excitation regulation of a converter contains the stator current and grid-side converter (GSC) current. The transient characteristics of GSC current are controlled by double closed-loops of the converter and influenced by fluctuations of direct current (DC) bus voltage, which is characterized as high order, multiple variables, and strong coupling, resulting in great difficulty with analysis. Existing studies are mainly focused on the stator current, neglecting or only considering the steady-state short-circuit current of GSC, resulting in errors in the short-circuit calculation of DFIG-WT. This paper constructs a DFIG-WT total current analytical model involving GSC current. Based on Fourier decomposition of switch functions and the frequency domain analytical method, the fluctuation of DC bus voltage is considered and described in detail. With the proposed DFIG-WT short-circuit current analytical model, the generation mechanism and evolution law of harmonic components are revealed quantitatively, especially the second harmonic component, which has a great influence on transformer protection. The accuracies of the theoretical analysis and mathematical model are verified by comparing calculation results with simulation results and low-voltage ride-through (LVRT) field test data of a real DFIG.
1. Introduction
With the worsening global energy crisis and environmental pollution, renewable energy sources have received worldwide attention and undergone rapid development. The doubly-fed induction generator wind turbine (DFIG-WT) is one of the most popular wind turbine generators due to its low manufacturing cost, high efficiency, and high flexibility, and is extensively applied on wind farms [1,2,3]. In earlier studies, DFIG-WT was regarded as a load or synchronous generator for short-circuit calculation, as the capacity of wind farms is small [4,5]. However, with the increasing capacity of wind power access to the grid, the influence of the short-circuit current (SCC) of DFIG-WT can no longer be ignored. Since accurate SCC calculation is very important to protection settings [6,7], equipment selection, and the optimal design of wind turbine control strategies [8,9], transient characteristics analysis and the SCC calculation model for DFIG-WT have attracted the attention of researchers around the world in recent years.
Grid codes require that wind turbines must remain connected during specific fault conditions and support the grid voltage by providing a reactive current with a magnitude proportional to the voltage deviation. A quick response of reactive current provision is also required, and the response times are explicitly stipulated in the grid codes; for example, it is less than 75 ms in the Chinese criteria [10], and is even more strict in the German criteria, with a value of 20 ms [11]. To comply with the grid code requirements, a crowbar circuit is often utilized by the rotor for protection against excessive current. The short-circuit current characteristics of DFIG-WT with crowbar protection have been extensively discussed [12,13,14]. However, the crowbar operation is not desired due to the loss of controllability and absorption of reactive power.
Under non-severe fault conditions or for some DFIG-WTs with a higher tolerance for voltage drops, excitation control of converters is retained during a fault. Due to different constrictions compared with traditional generators and inverter interfaced generators, the transient characteristic of DFIG-WT under converter control is determined by both electromagnetic equations of the generator and control strategies of the AC-DC-AC converters, and the short-circuit current of DFIG-WT contains the stator short-circuit current and grid-side converter (GSC) short-circuit current.
In evaluating the transient fault characteristics of DFIG-WT, establishing a mathematical analytical model is effective and helpful in obtaining the physical mechanisms and numerical values of electrical quantities. A simplified stator fault current model was built in [15] by neglecting the dynamic process of stator flux linkage and hypothesizing step mutations of the rotor voltage after a fault, but the model could not fit the actual transient short-circuit current completely. A stator current analytical model was presented in [16] by solving a second-order differential equation related to the rotor current of the time domain. This method produced ideal linearization of input and output characteristics of the converter, and did not consider transient responses in the converter. In [17], a more detailed stator current analytical model was constructed based on transfer functions of the control system. However, the sampling delay of the converter and transfer characteristics of pulse-width modulation (PWM) were not considered in this study, resulting in sudden changes of initial short-circuit current at the time of fault occurrence and inaccuracy of transient current calculation. It is mentioned in [18] that the current reference values of the converter should be limited to prevent overcurrent, and the control limits for the rotor side converter were studied in [19]. However, the influence of current limitation of the converter on SSC calculation was not discussed in the above studies. In addition, the analytical SCC models in these studies did not include GSC current.
The influencing factors of GSC short-circuit current were simulated and analyzed in [20], but no analytical model of GSC-transient SCC was constructed. Based on different control targets, a DFIG-WT steady-state short-circuit current model with a consideration of GSC current was constructed in [21]. By comparing the results calculated with and without GSC steady-state current, that study concluded that GSC current should be considered for accurate fault analysis and protection settings, but it only focused on steady-state current and did not mention the transient characteristics of SCC. Since transient characteristics of GSC fault current are influenced by coupling factors, including control strategies of the two-side convertors, transient fluctuation of DC bus voltage, and the electromagnetic transient response of the generator, the construction of a GSC transient current model is more complex than the stator fault current. Existing studies on transient SCC of DFIG-WT have not fully discussed transient characteristics of GSC current. Moreover, there is a lack of theoretical references on calculation errors of transient short-circuit total current caused by neglecting GSC current.
Moreover, most of the models built in the above studies were validated by simulation. As was mentioned in [22], the wind power industry urgently needs validation in comparison with real measurements to verify the accuracy and corresponding usability of the models. Additionally, the validation of a generic DFIG-WT was presented based on a measurement campaign carried out in a real wind farm, which is of great interest to researchers in the field of wind energy. Field test data of a real DFIG-WT are also presented to verify the short circuit current calculation model in this article.
This paper discusses the following to construct a more accurate transient short-circuit current calculation model for DFIG-WT. First, transient response characteristics of GSC and rotor side convertor (RSC) control systems after a symmetric voltage dip are analyzed based on the transfer functions of the control system. The relation equations among GSC current, DC bus voltage, RSC current, and stator flux linkage are constructed. The coupling mechanisms of the key internal electrical quantities in the converters are thus revealed. Second, the analytical expressions of RSC current, DC bus voltage, and GSC current are deduced based on the above equations. Specifically, a more accurate calculation model of RSC short-circuit current with no sudden changes in the initial time of failure is constructed, considering sampling delay of the control system and small inertial PWM. A detailed calculation model of GSC transient current is established with a consideration of DC bus voltage fluctuation. It was found that there is a high proportion of second harmonic current in the GSC transient fault current, which may result in a false operation of the secondary harmonic restraint relay for transformer protection. Third, the nonlinear characteristics of steady-state fault current of DFIG-WT considering limitations of rotor current are analyzed, and an estimation formula for the maximum steady-state SCC is put forward and verified by simulation. Finally, the accuracy of the theoretical analysis and mathematical models is verified by simulation tests and low-voltage ride-through (LVRT) field test data of a real DFIG. Proportions of GSC current and the second harmonic component in short-circuit total current of DFIG-WT under different fault situations are analyzed.
2. Transient Mathematical Models of DFIG
The electrical parts of DFIG mainly include the induction generator, rotor-side converter, and grid-side converter. RSC and GSC are connected through the DC capacitor [17]. The mathematical models and control strategies of these three parts are briefly introduced in the following section.
2.1. Induction Generator Model
Motor convention is applied on the stator and rotor sides of the induction generator. The magnetic saturation effect is neglected. The mathematical model of the generator in the synchronous reference frame is:
2.2. RSC Control with Consideration of the Limiting Reference Current
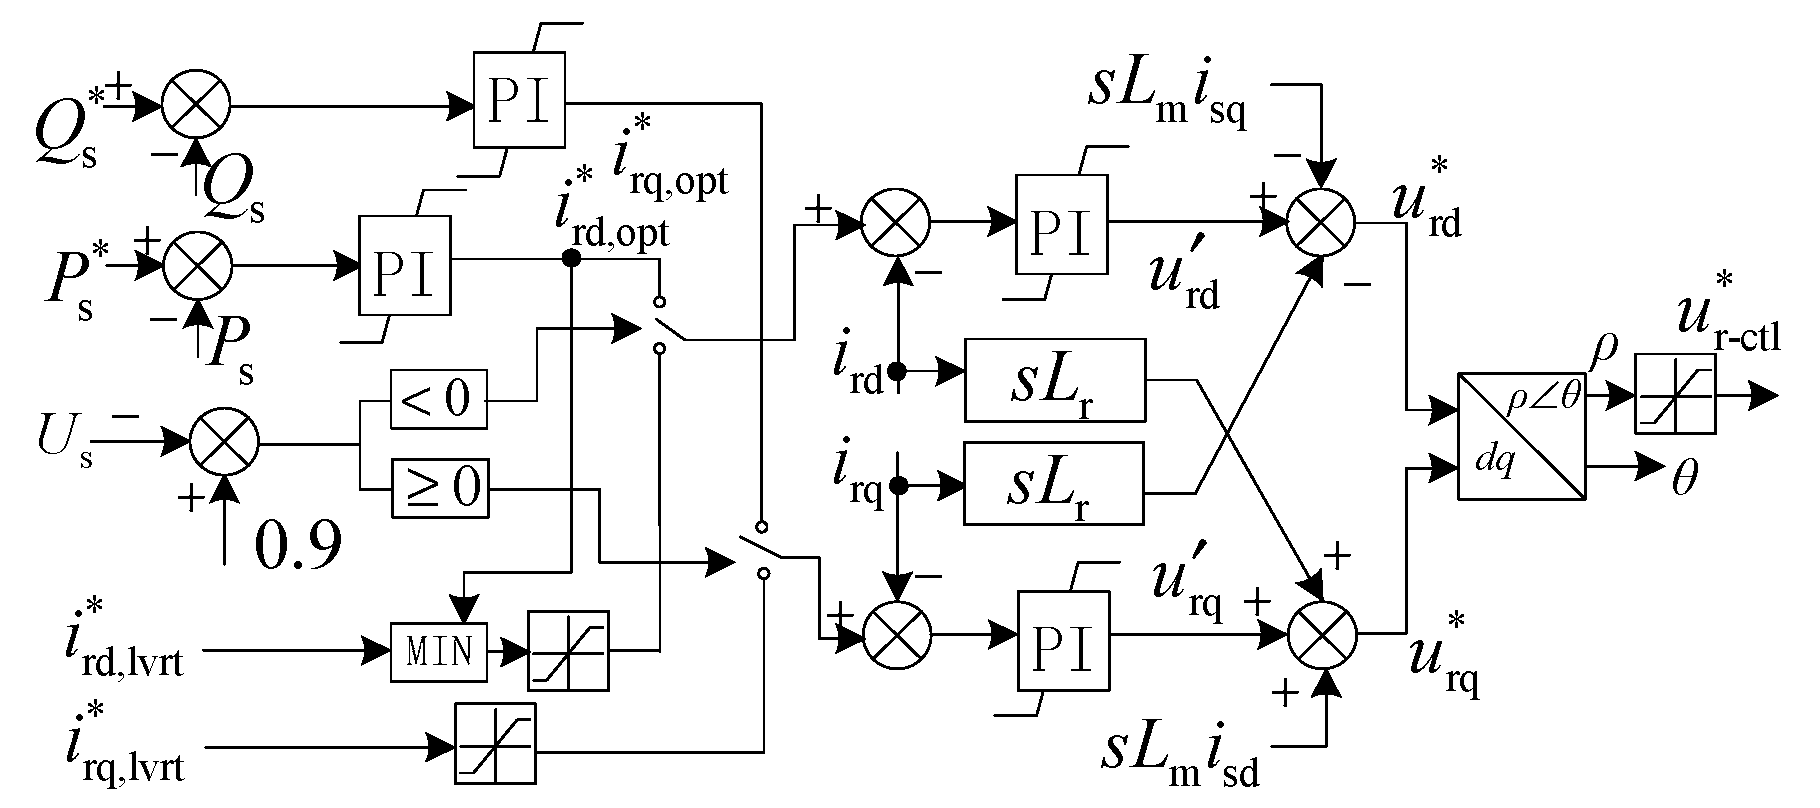
Double closed-loop vector control based on stator voltage orientation was applied on RSC, with the inner loop as the current loop and the outer loop as the power loop. The control mechanism diagram is shown in Appendix A. The reference value of the inner current controller under normal operation control is:
where Ird-max is the active current-limiting value and Ir-max is the rotor current-limiting value.
When a three-phase short-circuit fault occurs at the terminal of a wind turbine, the outer power loop of RSC will be open and the reference current of the inner current loop will be given directly in order to quickly respond to the terminal voltage dip and fulfill the grid codes, which require wind turbines to have LVRT capability and provide reactive power to support grid voltage recovery. Considering the current limits of RSC, the reference value of the inner current loop during low-voltage circumstances is:
where Kd is the reactive current coefficient, usually Kd ≥ 1.5.
2.3. GSC Control Mechanism
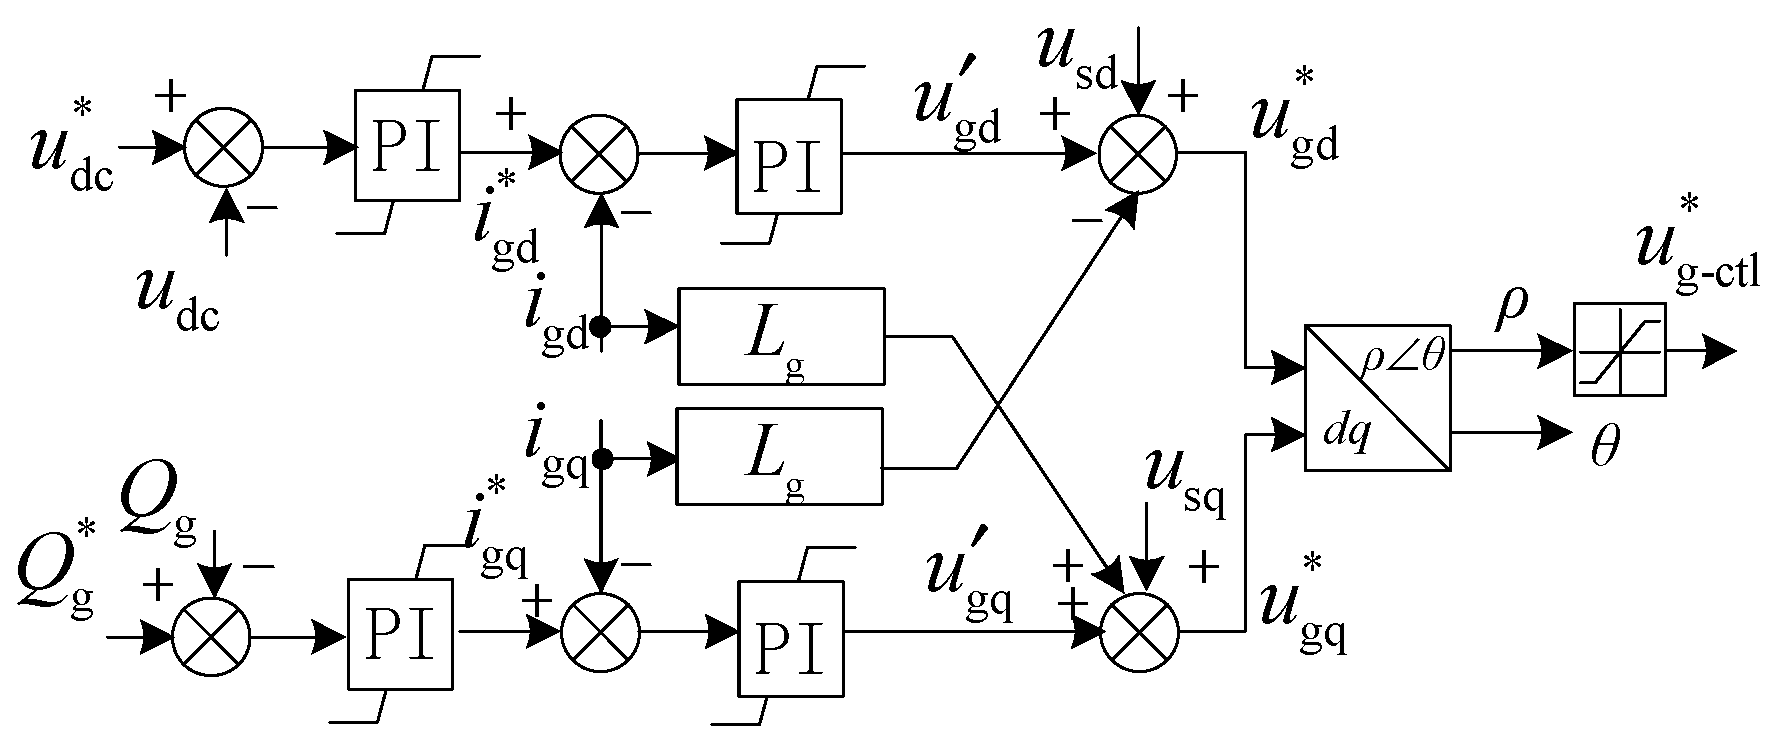
The double closed-loop vector control method based on stator voltage orientation is also applied to GSC control. The inner loop is the current loop, and the outer loop is the DC voltage loop and reactive power loop. The control mechanism diagram is shown in Appendix A.
Viewed from the GSC side, the current from the RSC side can be regarded as an equivalent load. Thus, the DC bus voltage equation is:
3. Converter Transient Response Characteristics of DFIG-WT
3.1. GSC Transient Response Characteristics
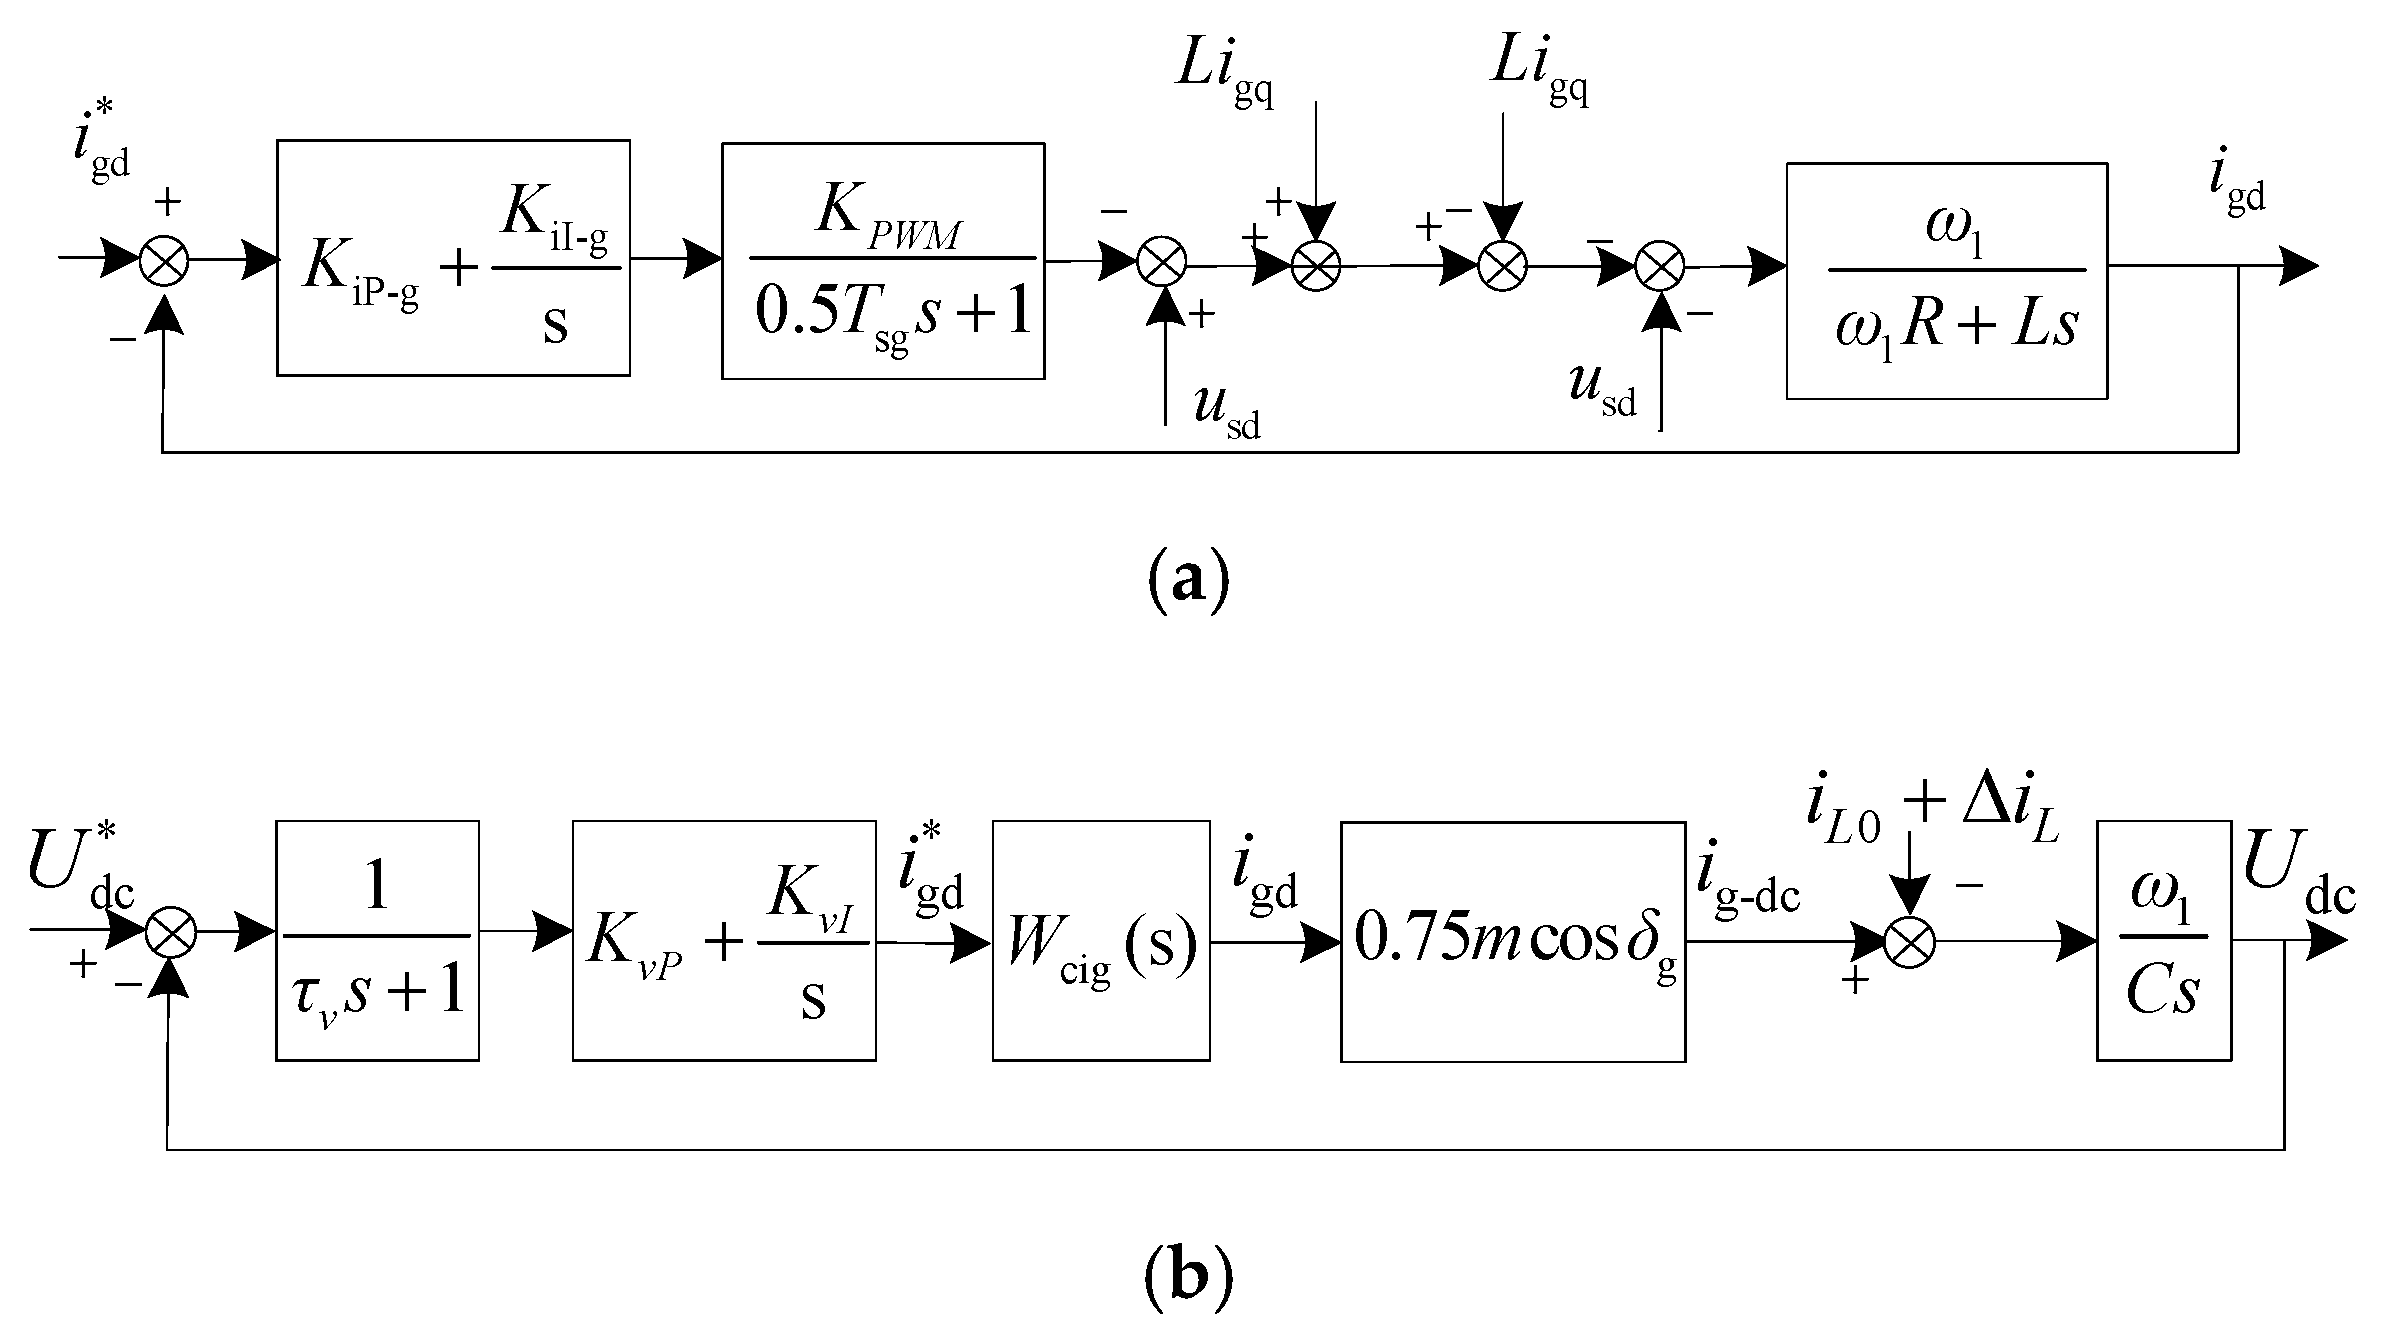
In GSC control, the d-axis is responsible for maintaining the stability of DC bus voltage and the q-axis is responsible for adjusting the power factor of the wind turbine generator, which is generally operated at a unit power factor. The dq-axis control structure is symmetric, so we just take the d-axis control as an example. According to the control diagram of GSC, the d-axis control framework of the inner current loop and DC voltage loop is shown in Figure 1.
In the figure, KiP-g and KiI-g are the proportional gain and integral gain of the inner current controller, respectively; Tsg is the switching period of PWM; KPWM is the PWM equivalent gain of the bridge circuit, KPWM = 0.8165; τv is the period of voltage sampling time; KvP and KvI are the proportional gain and integral gain of the proportional and integral (PI) regulator in the DC voltage loop, respectively; m is the modulation ratio of PWM; iL0 is the DC-side pre-fault current of RSC; and ΔiL represents the changes of RSC current on the DC side.
The current loop has to track the reference current quickly, and it is often designed according to a typical first-order system [23,24]. Then, KiP-g and KiI-g can be adjusted as:
where .
According to Equation (5) and Figure 1, the current loop of GSC is equivalent to the first-order inertial element and the transfer function is:
where is the bandwidth angular velocity of the inner current loop: .
The outer voltage loop of GSC focuses on disturbance resistance. The PI parameter of the outer voltage loop of GSC is designed according to a typical second-order system:
where is the middle frequency bandwidth of the outer voltage loop and Tev is the equivalent time constant of outer voltage loop: Tev = τv + 3Ts.
GSC current is determined by its reference value, which is related to DC bus voltage in the outer voltage loop. According to Figure 1 and Equation (6), the d-axis component of GSC current is:
where ∆Udc is the difference between DC bus voltage and its reference value and igd0 is the initial value of the d-axis component of the GSC pre-fault current. GSC active power is about slip times of stator active power, that is, Pg0 ≈ −sPs0. Therefore, igd0 ≈ −sPs0/Us0.
According to Equation (8), in order to calculate GSC current, it is necessary to obtain the DC bus voltage expression first. It can be seen from Figure 1b that the DC bus post-fault voltage is related to Udc*, iL0, and ΔiL. DC bus voltage is maintained as constant under the collaborative effect of Udc* and iL0 under normal operating conditions. Under fault conditions, the fluctuation of DC bus voltage ∆Udc is mainly influenced by ΔiL. According to Figure 1b, the transfer function from ΔiL to DC bus voltage Udc is:
where λ1,2 is the characteristic roots of Equation (9):
It is worth noting that ΔiL is the DC-side current of RSC. The transfer relationship between DC-side current and AC-side current of RSC is:
Since the switching frequency is significantly higher than the grid fundamental frequency and transient analysis mainly focuses on fundamental frequency, the higher harmonic components can be neglected and only low-frequency components of the switch function are considered. Fourier decomposition of the switch function Sabc of RSC is carried out as:
where δr is the fundamental wave initial phase angle of the switch function.
Based on Equations (11) and (12) and the transfer of RSC current from the stationary reference frame to the synchronous reference frame, the DC-side current of RSC can be expressed as:
Equation (13) reflects that the DC-side current of RSC can be calculated according to the AC-side current. In fact, the AC-side current of RSC is equal to the rotor current and is related to the transient response of the inner current loop of RSC.
After the occurrence of the three-phase short-circuit fault on the terminal of the wind turbine, GSC is mainly responsible for maintaining the stability of DC bus voltage. Meanwhile, GSC is also able to generate a small amount of reactive power independently to support the grid voltage [25]. To realize the goal of fast regulation, the outer loop of reactive power is open and the reference value of the inner current loop is given directly after the fault. Referring to Equation (6) and considering fast adjustment of the inner current loop, the q-axis component of GSC current can be regarded as equal to the reference value.
3.2. RSC Transient Response Characteristics
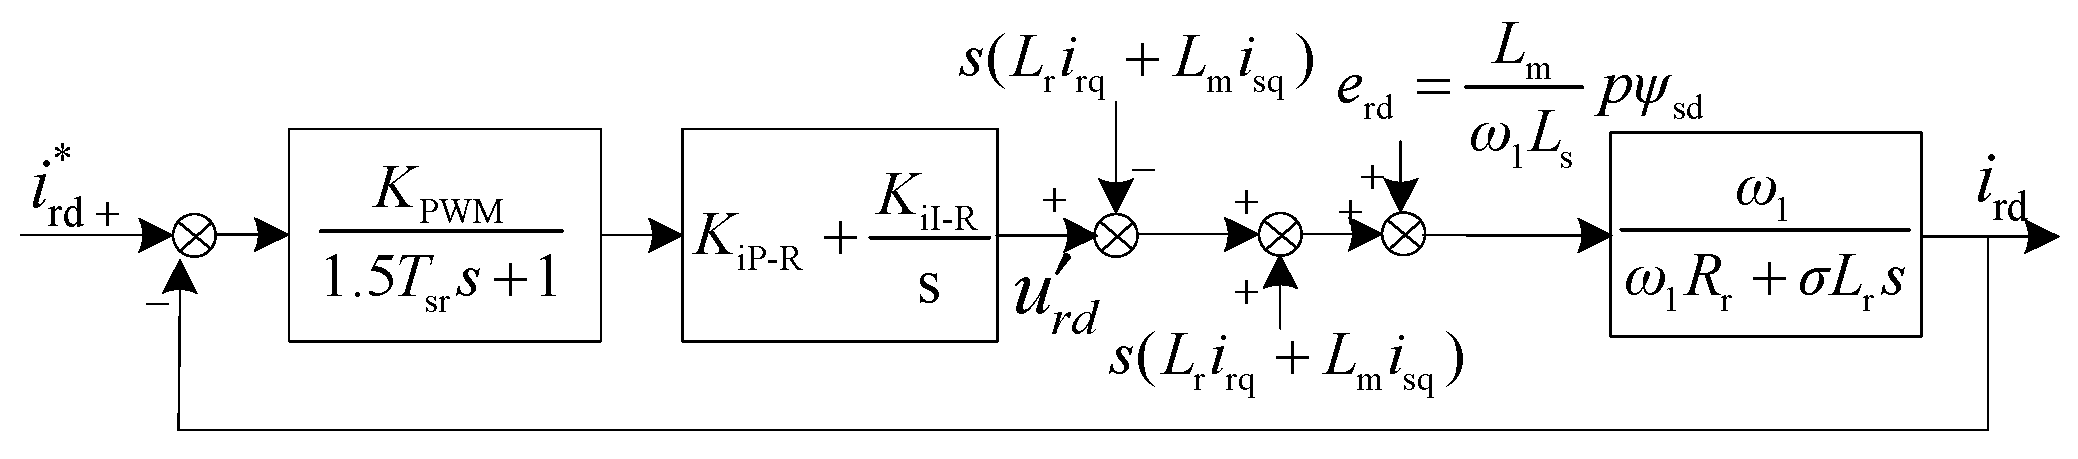
According to the above analysis, in order to calculate the DC bus voltage and GSC current, it is necessary to obtain the RSC current, which is determined by the inner current loop of RSC. The dq-axis structure is symmetric. The control framework of the d-axis is shown in Figure 2.
In Figure 2, KiP-R and KiI-R are the proportional gain and integral gain of the PI controller of the inner current controller, respectively; Tsr is the switch period of PWM; and erd is the d-axis component of voltage disturbance.
It can be seen from Figure 2 that changes of reference current ir* and voltage disturbance erd will cause transient responses of RSC. When calculating the transient current of RSC, reference [17] neglected the sampling delay of the converter and small inertial characteristics of PWM, causing the calculated rotor short-circuit current to change suddenly at the moment the fault occurred. In the following section, one more accurate expression of rotor transient current is deduced based on the detailed model of RSC, since rotor current is vital to stator current and GSC current.
Similar to the current loop of GSC, the current loop of RSC can be regarded as a first-order inertial element. The closed-loop transfer function of RSC is:
where is the bandwidth angular frequency of the inner current loop: .
As stated in Section 3.2, when the terminal voltage drops to lower than 90% Un, the DFIG-WT will switch to LVRT control and the rotor current reference value will change from a normal operation state (Equation (2)) to an LVRT state (Equation (3)). The rotor transient current caused by sudden changes of the reference value is:
where ∆ir* = ir1* − ir0, ir1* is the post-fault reference rotor current and ir0 is the pre-fault rotor current.
On the other hand, considering the sampling delay of the converter and small inertia of PWM, the closed-loop transfer function from voltage disturbance to transient current of rotor is:
According to the conservation principle of flux linkages, the stator flux linkage after the occurrence of the three-phase short-circuit fault is [26]:
where τs is the stator attenuation time constant: τs = (σLs)/ω1Rs.
According to Equation (17), the frequency domain expression of voltage disturbance is:
Substituting Equation (18) into Equation (16), the transient current of the rotor caused by voltage disturbance is:
where ∆ir1,2,3,4 represents coefficients of attenuation components of the rotor current. The detailed coefficient expressions are shown in Appendix B. These coefficients are related to voltage drop amplitude and parameters of the generator and converter, and meet with ∆ir1 + ∆ir2 + ∆ir3 = 0, thus assuring ∆ir-er(0) = 0 at the initial fault stage.
According to Equations (17) and (19), the time domain expression of the rotor current is:
In this section, the equations between different electrical quantities, such as GSC current, DC bus voltage, and AC-side and DC-side currents of RSC, are deduced based on control mechanisms of GSC and RSC. Moreover, the coupling relationships and variation laws of the DC capacitor and key electrical quantities of GSC and RSC are revealed.
4. Transient Short-Circuit Current Calculation Model of DFIG-WT
4.1. DC Bus Voltage
DC bus voltage has to be calculated first to obtain the GSC current. According to the transfer function in the DC voltage loop and DC-side current of RSC, the expression of DC bus voltage fluctuation ΔUdc can be deduced according to Equations (9), (13), and (19):
where Udc1, Udc2, Udc3, Udc4, Udc5, Udc6, and Udc7 are coefficients of different components. Detailed expressions are shown in Appendix B.
It can be seen from Equation (4) that the fluctuating DC bus voltage is caused by an active power imbalance between the converters at the two sides. The fundamental frequency attenuation component in RSC current may cause a fundamental frequency attenuation component in Udc. This implies that Udc1 corresponds to the fundamental frequency attenuation component ∆ir1 in the rotor current. Similarly, Udc2, Udc5, Udc6, and Udc7 correspond to ∆ir2, ∆ir3, ∆ir4, and ∆ir*, respectively. Udc3 and Udc4 represent transient response characteristics of the DC voltage loop and their amplitudes are related to all of the transient components in the rotor current.
Equation (21) shows that the DC bus voltage contains complicated frequency components. To elaborate proportions of frequency components in ∆Udc and their relationships with rotor current, a group of data concerning coefficient amplitudes and time constants of the damping components of rotor current and DC bus voltage is given in Table 1. The parameters used in the calculation are from the simulation case. The voltage at the generator terminal dropped to 70% Un. Before the fault, the DFIG-WT was operated at a rated active power and with a unit power factor.
The following conclusions can be drawn from Table 1:
- (1)
- Fundamental frequency attenuation components ∆ir1 and Udc1 account for the highest proportion in rotor current and DC bus voltage, respectively.
- (2)
- DC attenuation components ∆ir2 and Udc2 account for the lowest proportion.
- (3)
- In rotor current, oscillating attenuation components ∆ir3 and ∆ir4, of which both frequencies and time constants are ωci, will cause the homogeneous components Udc3 and Udc4 in DC bus voltage. Due to the high switching frequency of RSC, Udc3 and Udc4 attenuate very quickly. They will attenuate to lower than 10% of their amplitude by about 4 ms.
- (4)
- Udc6 and Udc7 in DC bus voltage are related to the characteristic roots of the transfer function of the DC voltage loop. According to Equation (10), the characteristic roots are related to the intermediate frequency bandwidth of the DC voltage loop. When ωcv < 7, the characteristic roots of the transfer function are a pair of conjugate complexes. Under this circumstance, Udc6 and Udc7 are oscillating attenuation components. The oscillation period is the imaginary part of the characteristic roots, and the attenuation time constant is the reciprocal of the real part of the characteristic roots. When ωcv ≥ 7, the characteristic roots are two different (or same) real numbers. In this case, Udc6 and Udc7 are DC attenuation amplitudes, and the attenuation time constant is the reciprocal of the characteristic roots.
4.2. GSC Current
Equation (21) is transferred into the frequency domain and then substituted into Equation (8). The expression of GSC current in the synchronous reference frame is:
where Ig1, Ig2, Ig3, Ig4, and Ig5 are coefficients for different components. Specific expressions are shown in Appendix B.
Comparing Equations (21) and (22), GSC current in the synchronous reference frame contains frequency components corresponding to the transient attenuation components in Udc and additionally generates a DC attenuation component with time constant τv due to the inner current loop. According to Table 1, Udc2 has a small amplitude, and Udc3, Udc4, and Udc5 attenuate quickly. Therefore, it is applicable to neglect the above parameters to obtain a simplified expression of GSC current. Transferred into the stationary reference frame, the a-phase expression of GSC current is:
Equation (23) demonstrates that GSC current in the stationary reference frame contains a steady-state fundamental component, a fundamental component attenuating at different time constants, a DC attenuation component, and a second harmonic frequency attenuation component. Among them, the amplitude of the second harmonic frequency attenuation component is proportional to the fundamental attenuation component in DC bus voltage. According to Table 1, it can be deduced that the second harmonic frequency attenuation component accounts for a large proportion of GSC transient current and takes four to six periods to damp to 0. This second component will influence the second harmonic restraint of transformer protection, which will be further discussed in the simulation section.
4.3. Stator Current and DFIG-WT Total Current
According to Equations (1), (17), and (20), the time domain expression of stator current in the synchronous reference frame is:
where Les = Lm/Ls.
Transferring Equation (24) to the stationary reference frame, the a-phase stator current expression is:
Equation (25) reveals that the a-phase stator short-circuit current contains a steady-state fundamental component, a fundamental attenuation component, a DC attenuation component, and an oscillating attenuation component with ωci as the period and time constant. It can be concluded from Table 1 that the transient attenuation component of the stator current mainly contains a DC attenuation component, while fundamental attenuation and ωci relevant components account for a small proportion and attenuate quickly.
With the above analysis and deduction, a short-circuit total current calculation model of DFIG-WT can finally be built as the sum of GSC current and stator current according to Equations (22) and (24):
To demonstrate the transient short-circuit current calculation model of DFIG-WT effectively, a simplified diagram of the relations among key electrical quantities based on the structure of DFIG-WT is shown in Figure 3a, and a detailed flow chart of the entire derivation process is presented in Figure 3b. In the figure, the symbol in bold represents complex vectors in the two phase synchronous rotation coordinate system, and the normal form represents the d (or q)-axis component.
According to Figure 3, the construction process of the transient short circuit current calculation model of DFIG-WT is summarized as follows:
At first, the terminal voltage of DFIG-WT drops to us1, causing a fundamental frequency attenuation component (ψsn) that appears in the stator flux, and at the same time, making changes to the reference value of RSC current (ir*). The fundamental frequency attenuation component in the stator flux creates a voltage disturbance quantity (er) in the current inner loop of RSC, which causes transient fluctuation of the rotor current (∆ir-er), and change of the reference value of RSC current will also cause a transient component in the rotor current. The above two transient components, together with the steady-state component determined by the reference value of the rotor current, constitute the post-fault rotor current. At last, the calculation model of stator short circuit current can be built according to the rotor current and stator flux.
Meanwhile, the rotor current is converted to the DC side of converters as load current (iL) of the GSC. According to the control diagram of the voltage outer loop of the GSC, changes of load current (∆iL) will cause a fluctuation component (ΔUdc) in DC bus voltage, causing further fluctuation of the d-axis component of GSC current. The q-axis component of GSC current is generally 0 or very small, which can be considered as equal to its reference value. Finally, the transient short circuit current calculation model of DFIG-WT is the sum of the stator current and GSC current.
According to the above analysis and the flow chart, the generating mechanism and evolution law of transient fluctuations of critical electrical quantities of the DFIG-WT are revealed clearly.
4.4. Analysis of Steady-State Current of DFIG-WT Considering Current Limits
With a detailed short-circuit current calculation model, quantitative analysis can be carried out to further reveal the fault characteristics of DFIG-WT. Among all the frequency components of the SCC, fundamental components are the most important to protection settings. As shown in Equations (22) and (24), fundamental components of total SCC are mainly composed of steady-state components, while the transient fundamental components attenuate rapidly. Therefore, a detailed analysis of the steady-state current of DFIG-WT was carried out considering the current limit.
According to Equations (22) and (24), the complex of the steady-state component is:
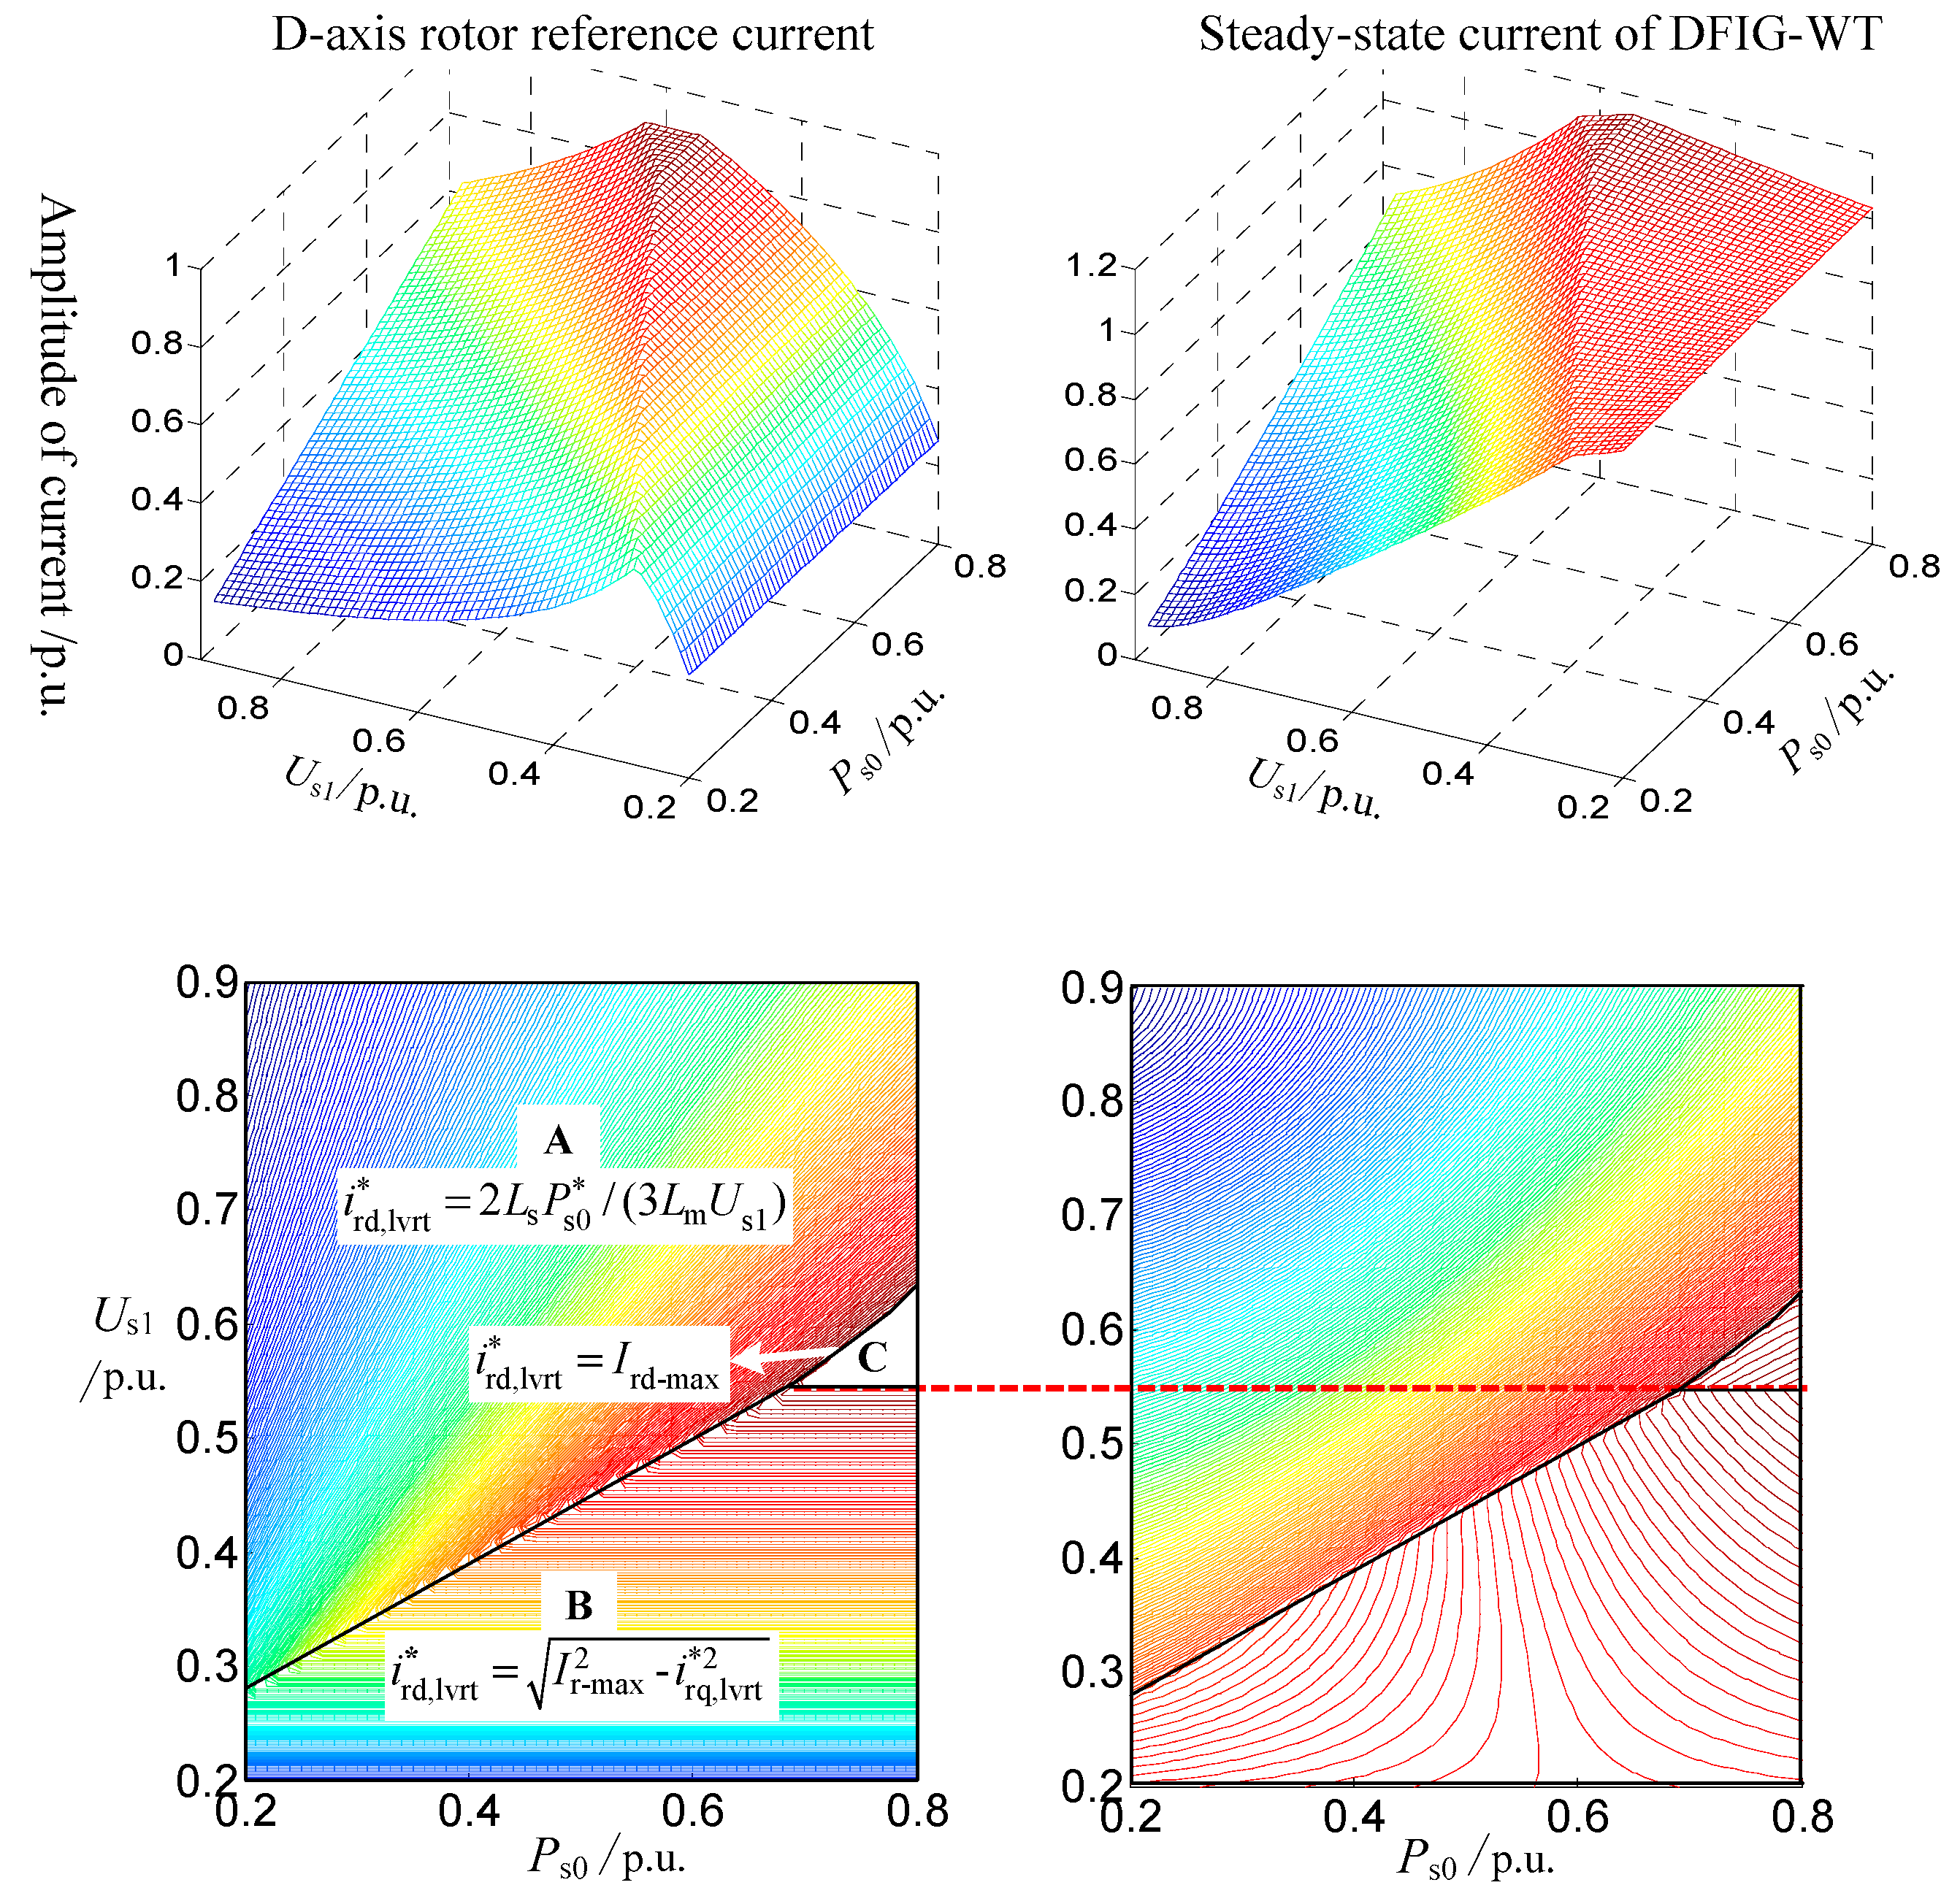
According to Equation (4) and considering the limit of the converter, the q-axis component of the rotor reference current linearly increases as the voltage drop deepens, while the d-axis component is double-limited by the maximum load current and the maximum rotor current. With parameters from the simulation case, three-dimensional diagrams and contour maps concerning the d-axis rotor reference current and the amplitude of the steady-state short-circuit current of DFIG-WT (ITf) are shown in Figure 4. The x-axis is the amplitude of post-fault voltage Us1 and the y-axis is the pre-fault stator active power Ps0.
It can be seen from Figure 4 that, due to the influence of current-limiting of the converter, the steady-state short-circuit current of DFIG-WT exhibits nonlinearity when the terminal post-fault voltages and pre-fault power change. It is worth noticing that the deeper the voltage sag is, the larger the steady-state short-circuit current will be. The DFIG steady-state short-circuit current reaches its maximum value when the terminal voltage drops to Us-max and the pre-fault power is full.
According to the contour map of Figure 4, the maximum steady-state short-circuit current of the DFIG appears on the isobaric line between region B and region C of the d-axis rotor reference current. Us-max can be deduced from the boundary of region B and region C:
As can be seen from the above equation, Us-max only relates to the RSC reference current limit and reactive current coefficient.
Combining Equations (27) and (28) and ignoring the term 1/Lm in the denominator of Equation (28), the estimation formula for the maximum steady-state short-circuit current of DFIG IT-max under different voltage drops and pre-fault conditions is simplified and obtained as:
where is the maximum rotor speed frequency in per-unit value, usually about 1.2–1.3.
Parameters in the simulation case are used to verify the accuracy of Equation (29). When the DFIG steady-state short-circuit current reaches its maximum, Us-max is about 0.55 p.u. and calculated IT-max is 1.2263 p.u. Compared with the simulation result, the error of the maximum steady-state short-circuit current estimation formula is:
The estimated value is slightly larger than the actual value, and the error comes from ignoring the term 1/Lm, which results in the Us-max calculated value decreasing and the short-circuit current reactive current increasing, leading to an increase in the IT-max calculated value. However, due to the excitation inductance, 1/Lm is generally large, and the error caused by ignoring this item is small.
According to Equation (30), because of convertor current limiting, the steady-state short-circuit current provided by the DFIG-WT is relatively small and has nonlinear relationships with terminal voltage and pre-fault power. This is quite different from the synchronous generators, whose short-circuit current calculation model is a constant internal voltage behind a linear transient impedance, which could bring new problems to the traditional relay setting calculation.
5. Simulation Analysis and Verification
To verify the accuracy of the constructed short-circuit current calculation model and the transient response characteristics of converters during a fault, a simulation system of DFIG-WT with an LVRT control strategy was built in the MATLAB/Simulink simulation platform based on the demo for detailed DFIG-WT. The simulation system is shown in Figure 5. Major parameters of the system are listed in Table 2.
5.1. Contrast Verification of Key Electrical Quantities of Generator and Converter
In this simulation case, DFIG-WT operates at a supersynchronous state with a unit power factor when a three-phase-to-ground fault through transition resistance Zf occurs on Bus 3 at 0.113 s, making the voltage at the generator terminal drop to 0.65 p.u. Before the fault, the stator active power is about 0.82 p.u. and GSC active power is about 0.18 p.u. The slip ratio is about −0.21.
5.1.1. Verification of DC Bus Voltage
The postfault DC bus voltage was calculated according to Equation (21) and compared with the simulation waveform under the fault condition. According to Equation (4) and the analysis in Section 3.1, when the voltage at the generator terminal drops suddenly, there will be transient fluctuation in Udc, which is caused by the power imbalance of the converters at the two sides. As shown in Figure 6a, the calculated waveform coincides with the simulated waveform, verifying the accuracy of Equation (21).
The decomposition of transient attenuation components in Udc, which are calculated from Equation (21), is shown in Figure 6b. Different frequency components are represented by different colors and their relevant coefficients. As shown in Figure 6b, the fundamental component takes the dominant role among all attenuation components of Udc. The remaining components attenuate to 0 in less than one period and their amplitudes are smaller than the fundamental component.
5.1.2. Verification of GSC Current
A-phase GSC current is calculated according to Equation (23) and is compared with the simulated waveform, as shown in Figure 7a. Under the simulation condition, the peak value of the GSC A-phase short-circuit current is about 0.39 p.u., and generally damps to the steady-state value of 0.16 p.u. in about four periods. The theoretical calculation accurately coincides with simulation results.
It can be observed from Figure 7a that there are evident harmonic components in the first three cycles. The frequency spectral analysis result of the first cycle of simulated A-phase GSC current is shown in Figure 7b. The total harmonic distortion (THD) of the current of the selected window is about 55.88%, and the second harmonic content is about 54.2%. According to the theoretical analysis in Section 4, the fundamental attenuation component, which accounts for a high proportion in DC bus voltage, will induce the second harmonic frequency component in the GSC current. The simulation results coincide with the theoretical analysis.
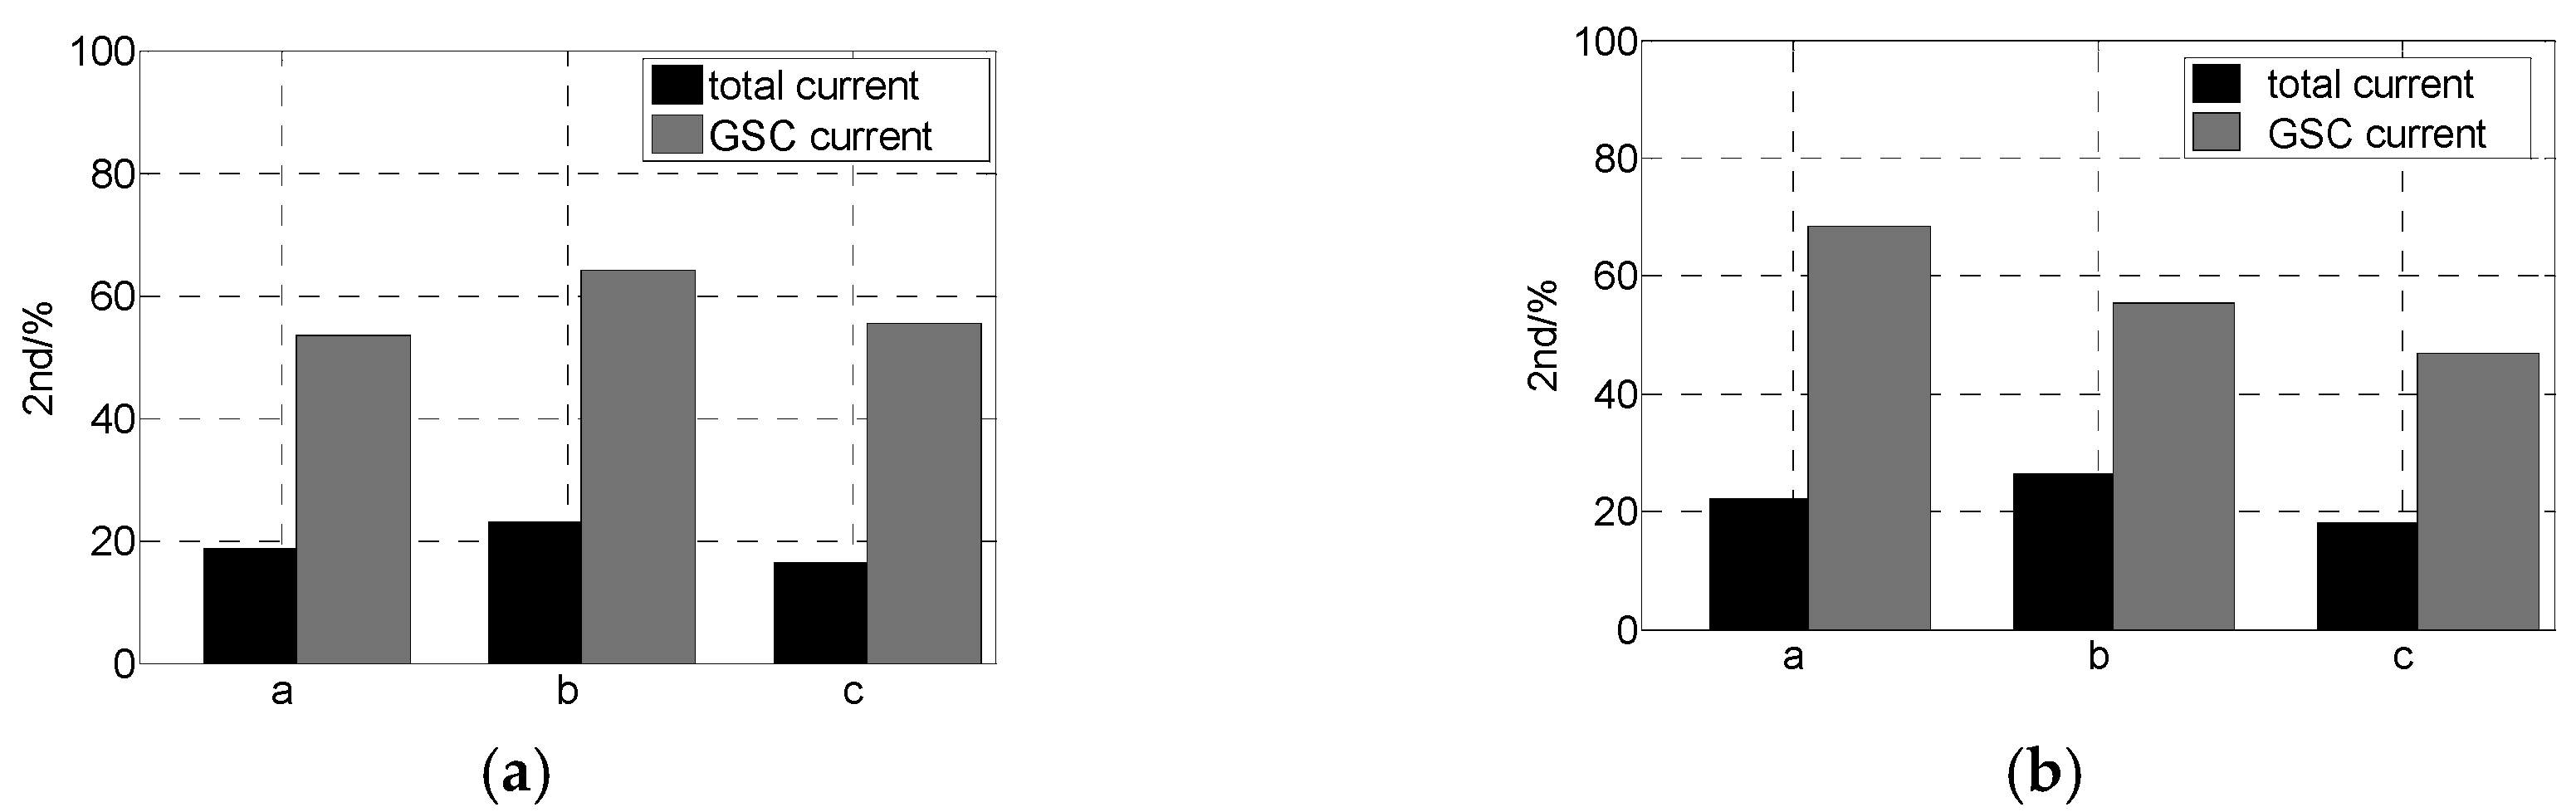
The characteristics of the second harmonic component in the GSC current are studied further under supersynchronous and subsynchronous conditions. The second harmonic frequency component in GSC is positively related to the voltage dip level according to Equation (23), meaning that a lower residual voltage will cause a higher proportion of the second harmonic component in the short-circuit current. When the terminal voltage drops to 40% Un, the proportions of the second harmonic component in the short-circuit current of DFIG-WT and GSC are as shown in Figure 8. Moreover, the proportion gets higher under subsynchronous conditions, with up to 68.4% in GSC current and 26.6% in DFIG-WT current.
Since the method of second harmonic restraint is widely used in transformer protection to overcome maloperation caused by a magnetizing inrush current, and the threshold for second harmonic content is usually set at 15–20%, the high proportion of the second harmonic component generated by DFIG-WT may cause the transformer protection failure to operate.
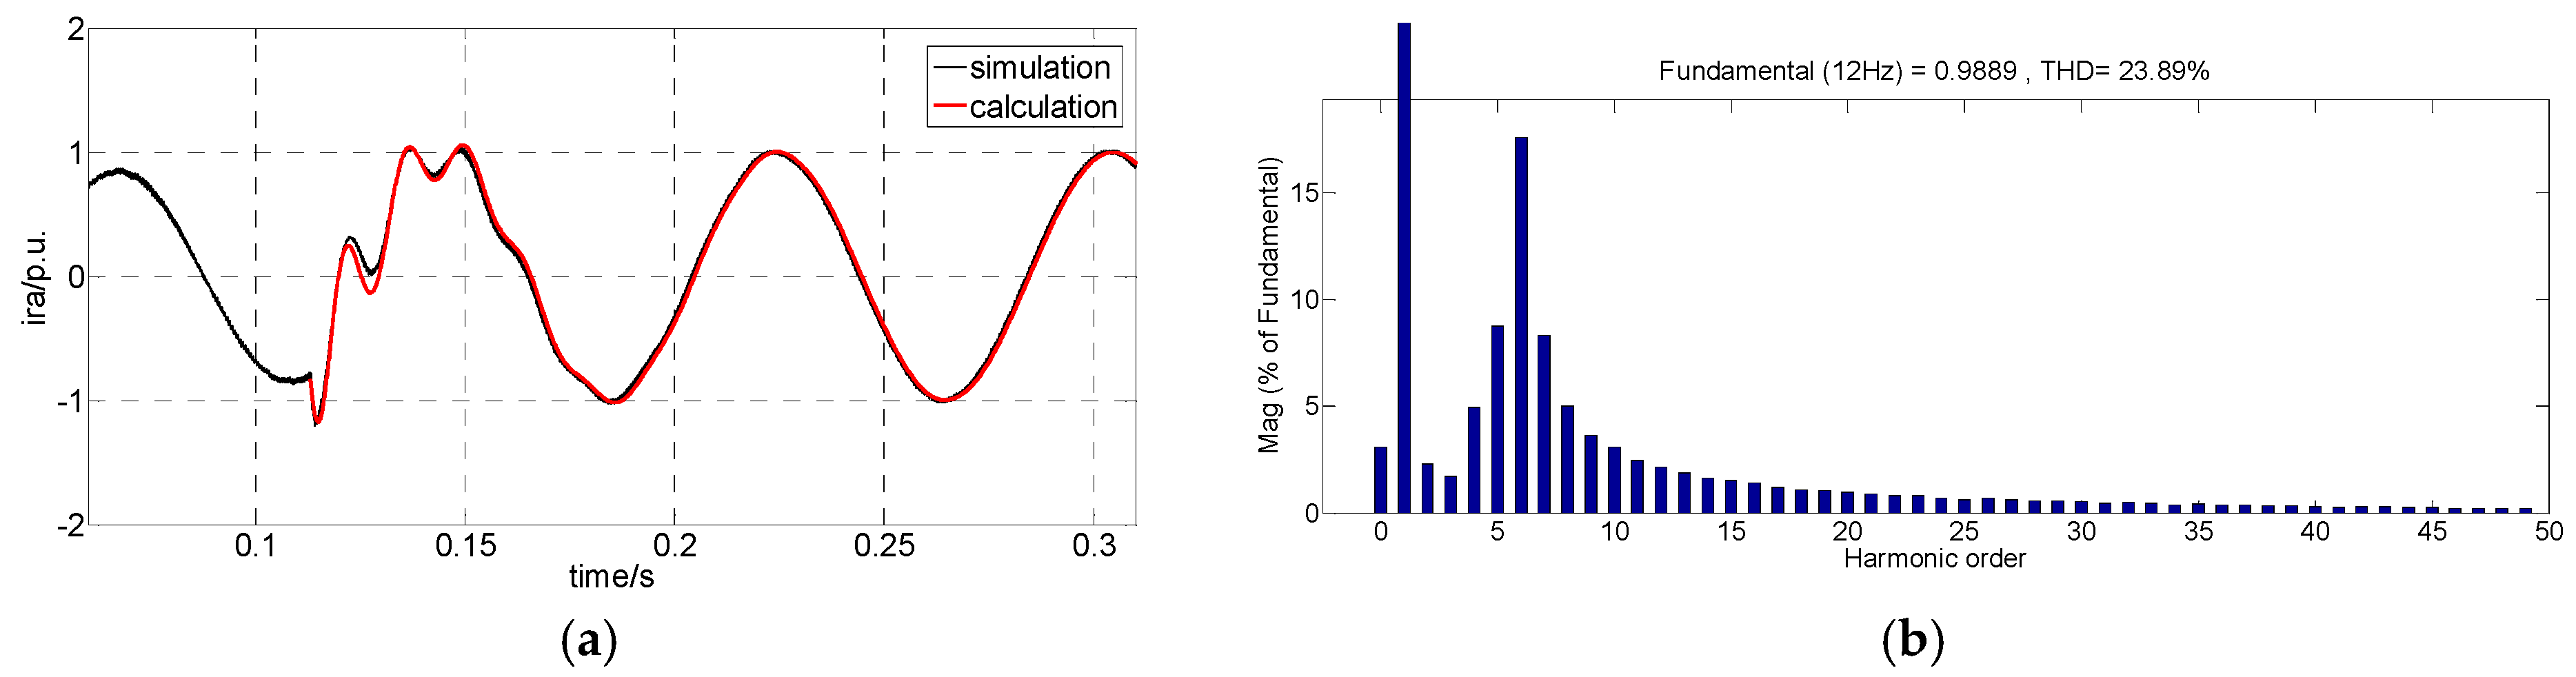
5.1.3. Verification of Rotor Current
A-phase rotor current was calculated according to Equation (20) and transferred to the rotor coordinate system. A comparison between the calculated waveform and simulated waveform is shown in Figure 9a. According to Equation (19) and Table 1, the fundamental component ∆ir1 is the key attenuation component of rotor short-circuit current in the synchronous reference frame, while in the rotor coordinate system, its frequency is (1 − s) times the rotor fundamental frequency. In this simulation case, with a slip ratio of −0.21, the frequency of ∆ir1 is about 72 Hz and it attenuates to 0 by about 0.064 s.
Frequency spectral analysis results of the first cycle of simulated rotor current are shown in Figure 9b. It can be seen from Figure 9b that among different harmonic components, the sixth harmonic accounts for the largest proportion, which is 72 Hz, with a fundamental of 12 Hz. Its proportion relative to the fundamental wave is 17.6%. Besides, as discussed in Section 3.2, there is no sudden change of rotor current at the moment the fault happens because the calculation considers the sampling delay and PWM small inertial characteristics. Theoretical analysis coincides with simulation results, which verifies the accuracy of the theory.
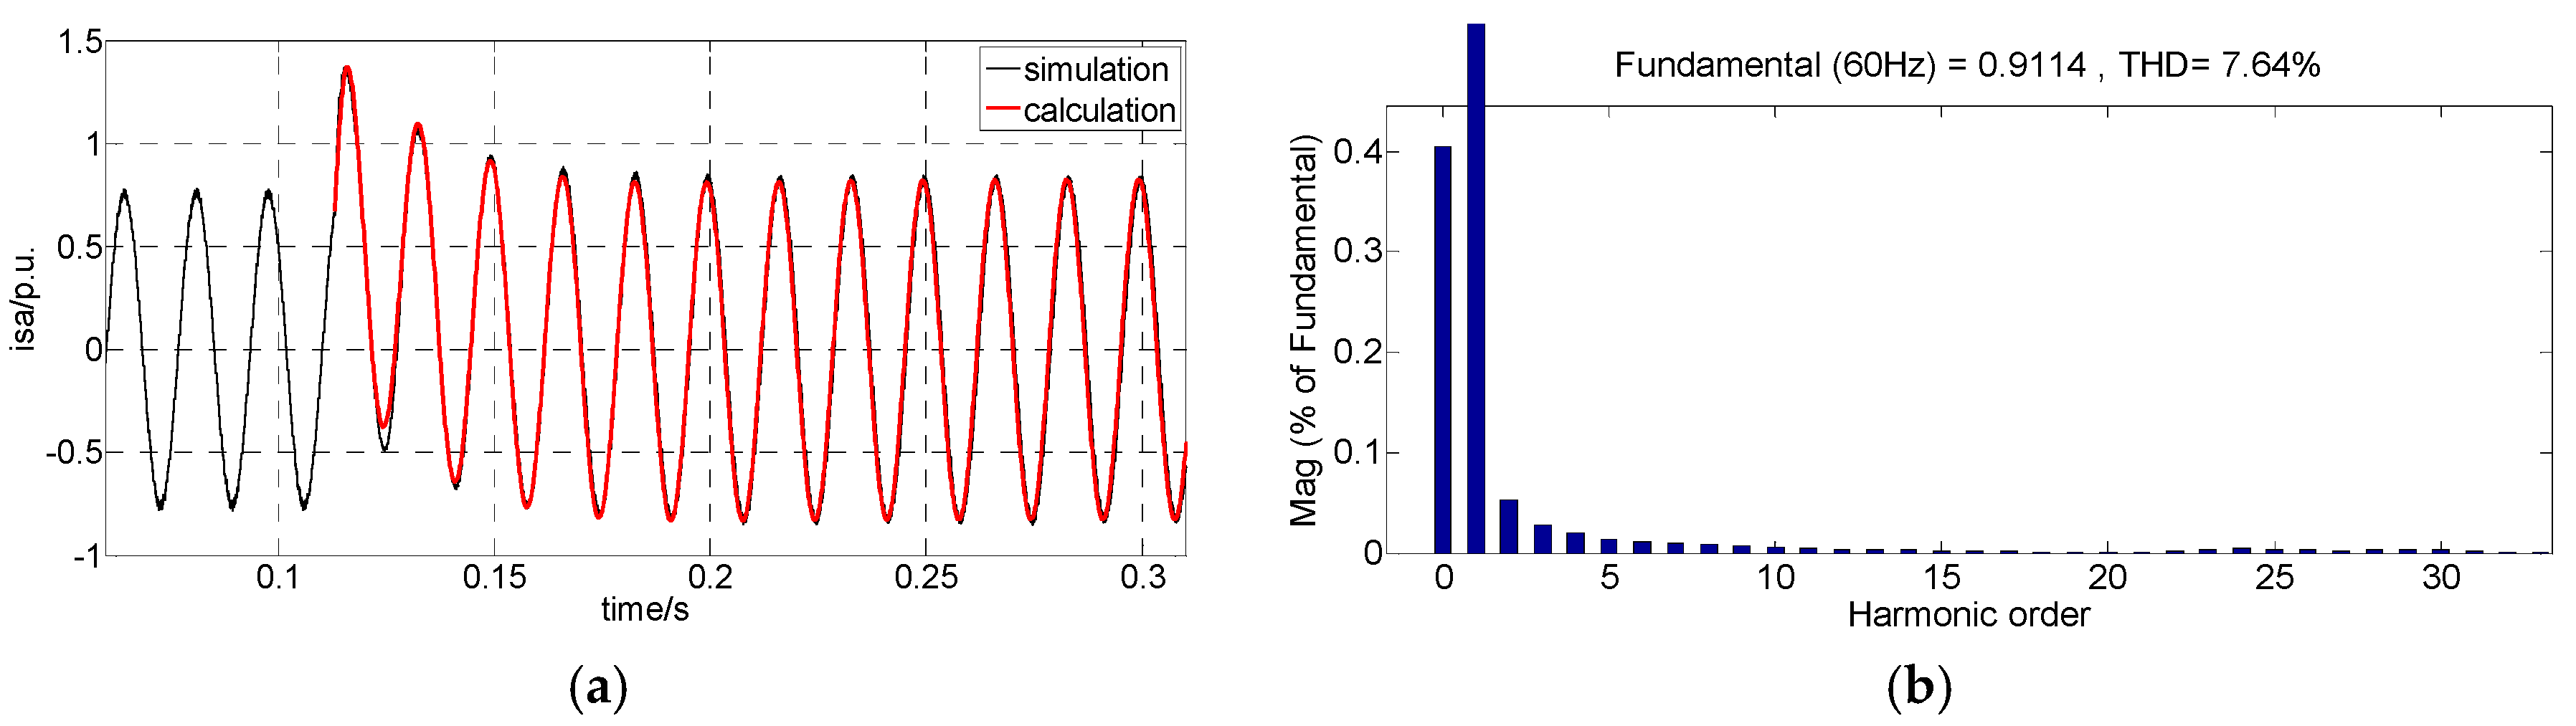
5.1.4. Verification of Stator Current
A comparison between the A-phase stator current calculated by Equation (25) and the simulated waveform is shown in Figure 10. When the voltage at the generator terminal drops to 0.65 p.u., the peak value of A-phase stator short-circuit current is about 1.37 p.u. and the steady-state value is about 0.81 p.u. According to Equation (25) and as shown in Figure 10b, DC is the main transient attenuation component of the stator short-circuit current.
Compared with Figure 7, the short-circuit current of GSC is about 20% of the stator short-circuit current in a steady state, while the peak value of GSC SCC is about 28.5% of the stator SCC. In [15,16,17], the GSC current is neglected and the stator current is used to replace the short-circuit total current of DFIG-WT, which will surely result in a large calculation error.
5.2. Contrast Verification of DFIG-WT Transient Characteristics under Different Situations
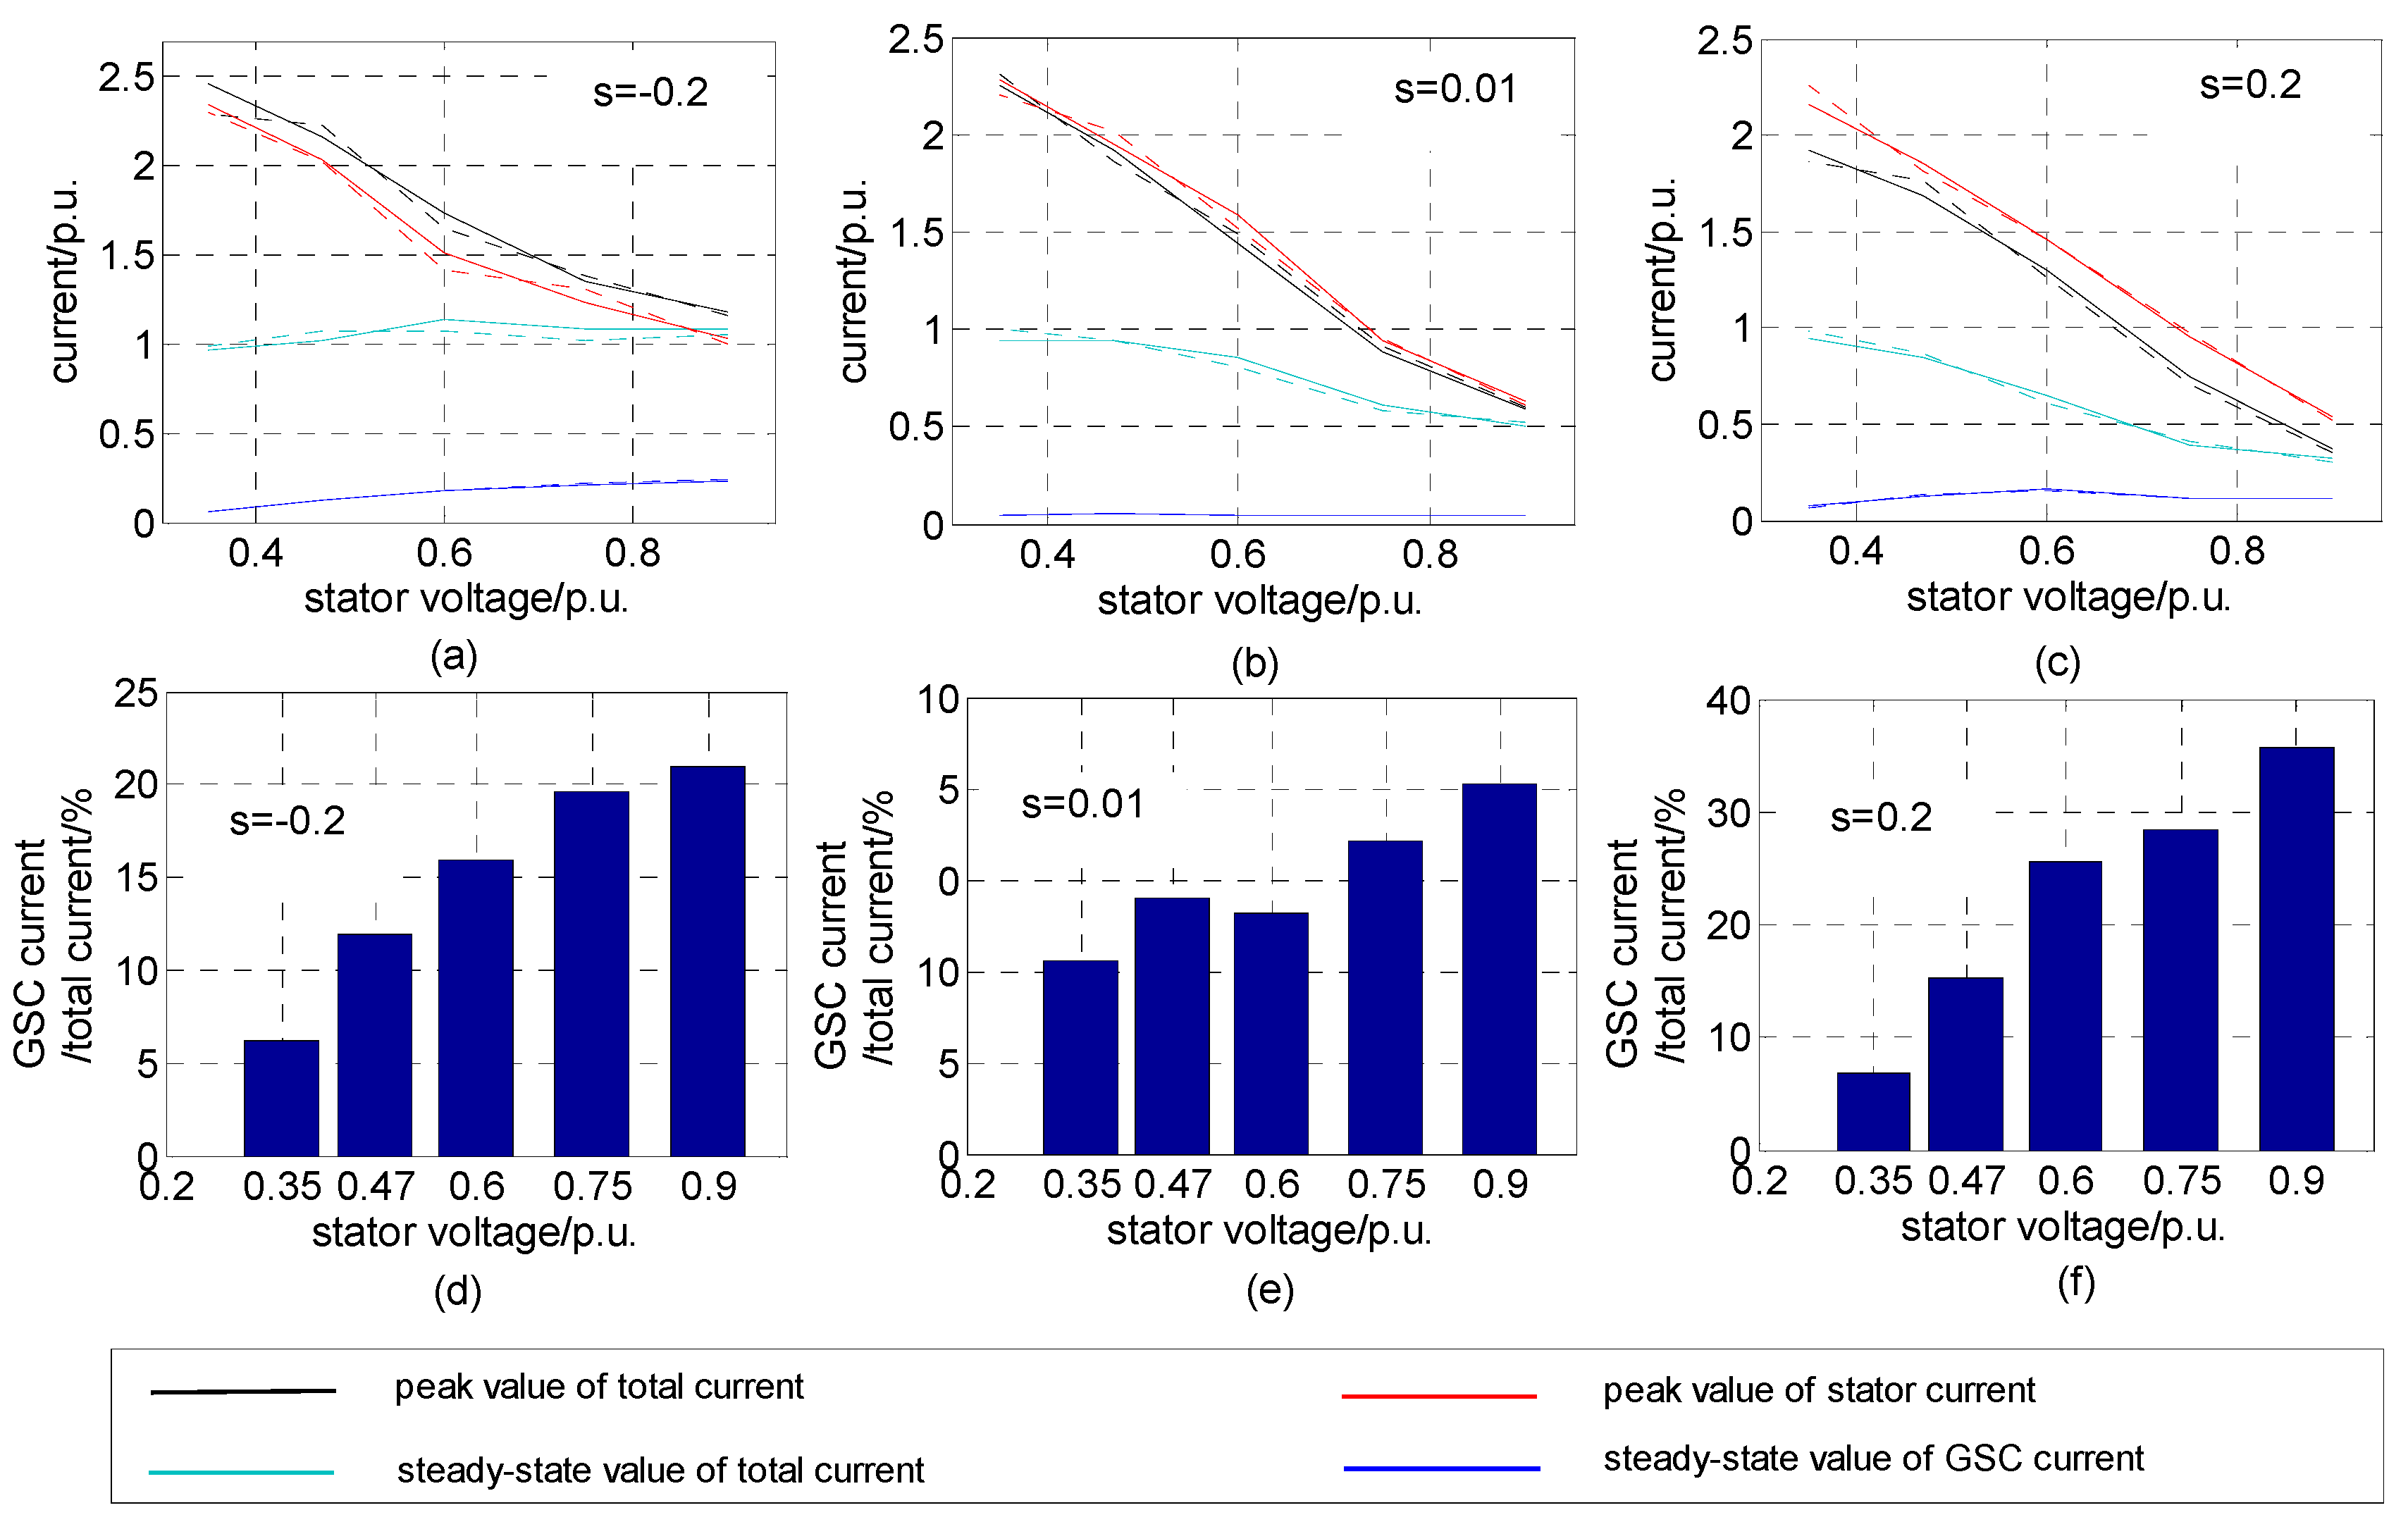
For a more comprehensive analysis and verification of the theoretical analysis, 15 groups of experiments were carried out under different operating conditions and voltage drops. A comparison between simulated results and calculated results of key characteristic parameters of the short-circuit current is shown in Figure 11, with solid lines representing simulation results and dotted lines representing calculated results.
In the experiments, three typical working conditions of DFIG-WT were chosen: supersynchronous (s = −0.2), synchronous (s = 0.01), and subsynchronous (s = 0.2). The voltage at the generator terminal dropped to 0.35 p.u., 0.47 p.u., 0.6 p.u., 0.75 p.u., and 0.9 p.u., respectively. Key characteristic parameters include peak values of DFIG-SCC and stator SCC, and steady-state values of DFIG-SCC and GSC-SCC.
The diagrams in the first row of Figure 11 show variations of the four key characteristic parameters with different residual voltages and operating conditions. Under the supersynchronous condition, the peak value of total current is higher than that of stator current. However, the opposite phenomenon is observed under the subsynchronous condition, while under the synchronous condition, these two parameters are almost equal to each other. This is because GSC current has the same direction as stator current under the supersynchronous condition, the opposite direction under the subsynchronous condition, and almost 0 under the synchronous condition.
The diagrams in the second row of Figure 11 show steady-state value proportions of GSC-SCC of DFIG-SCC. Under the subsynchronous condition, the proportion of GSC current is higher than that in other conditions, reaching 35% at the most.
Among the comparisons in all cases, the maximum calculation error is about 6.8%, as shown in Figure 11, which occurred at the peak value of DFIG-SCC when s = −0.2 and the voltage dropped to 0.35 p.u.
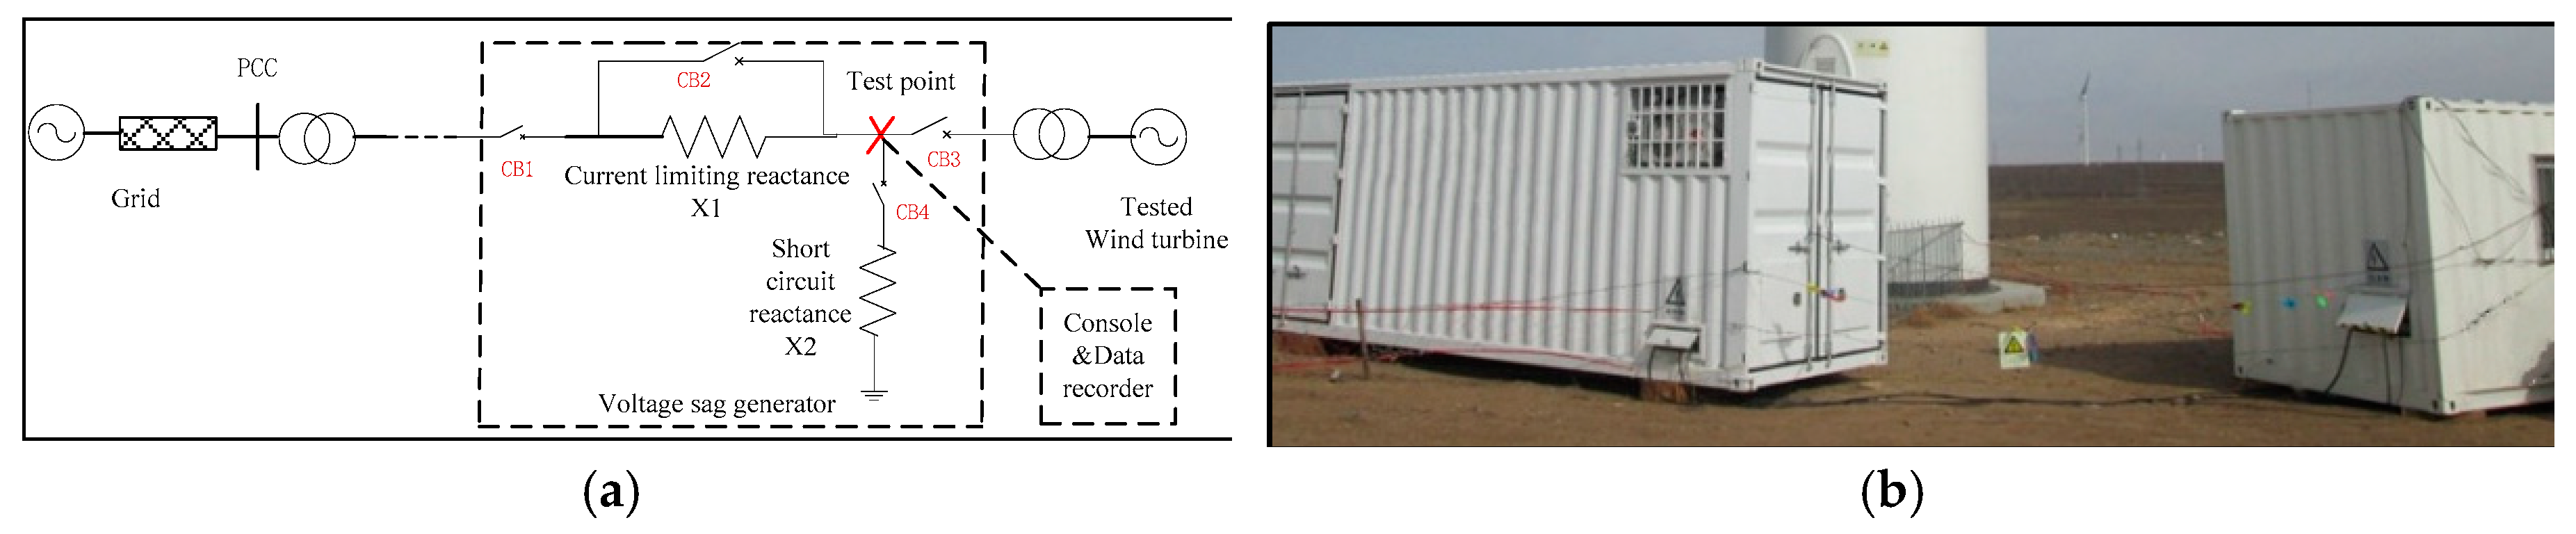
6. Verification with LVRT Test Data
According to the grid criteria for wind power [27], the LVRT test must be conducted with all kinds of wind turbines before they have access to the grid, which provides reference data for studying the fault characteristics of wind turbine generators. The LVRT test schematic diagram is shown in Figure 12a. A movable vehicle-mounted container structure is adopted by LVRT test devices, including a voltage sag generator and remote console cabinet, as shown in Figure 12b. The terminal voltage of tested wind turbines is remotely controlled by adjusting the voltage division ratio of the current, limiting reactance, and short-circuit reactance. The three-phase voltage and current at the terminal of tested wind turbines are saved by a Dewetron DEWE-5000 high-precision recorder (DEWETRON, Grambach, Austria).
In the following section, a group of field test data are analyzed and compared with the proposed analytic expressions. Parameters of the tested DFIG-WT are listed in Table 3. In the test, the terminal voltage dropped to about 0.23 p.u. under subsynchronous (P = 0.28 p.u., s = 0.2) and supersynchronous (P = 0.97 p.u., s = –0.2) conditions.
Active and reactive power generated by wind turbines under two test conditions are shown in Figure 13. As the grid codes require, wind power generators should output reactive power during the LVRT process to support grid voltage recovery. It can be concluded from Equation (3) that active power during the LVRT process under different operating conditions should be the same with the same voltage dip level. As shown in Figure 13, the reactive power is about 0.3 p.u. under both test conditions during the LVRT process as the residual voltages are the same. Reactive power output is the primary concern for DFIG-WT control, limiting the active power output capacity. The active power in the supersynchronous condition (about 0.21 p.u.) is slightly larger than that in the subsynchronous condition (about 0.14 p.u.). This is because GSC outputs active power under the supersynchronous condition and absorbs active power under the subsynchronous condition.
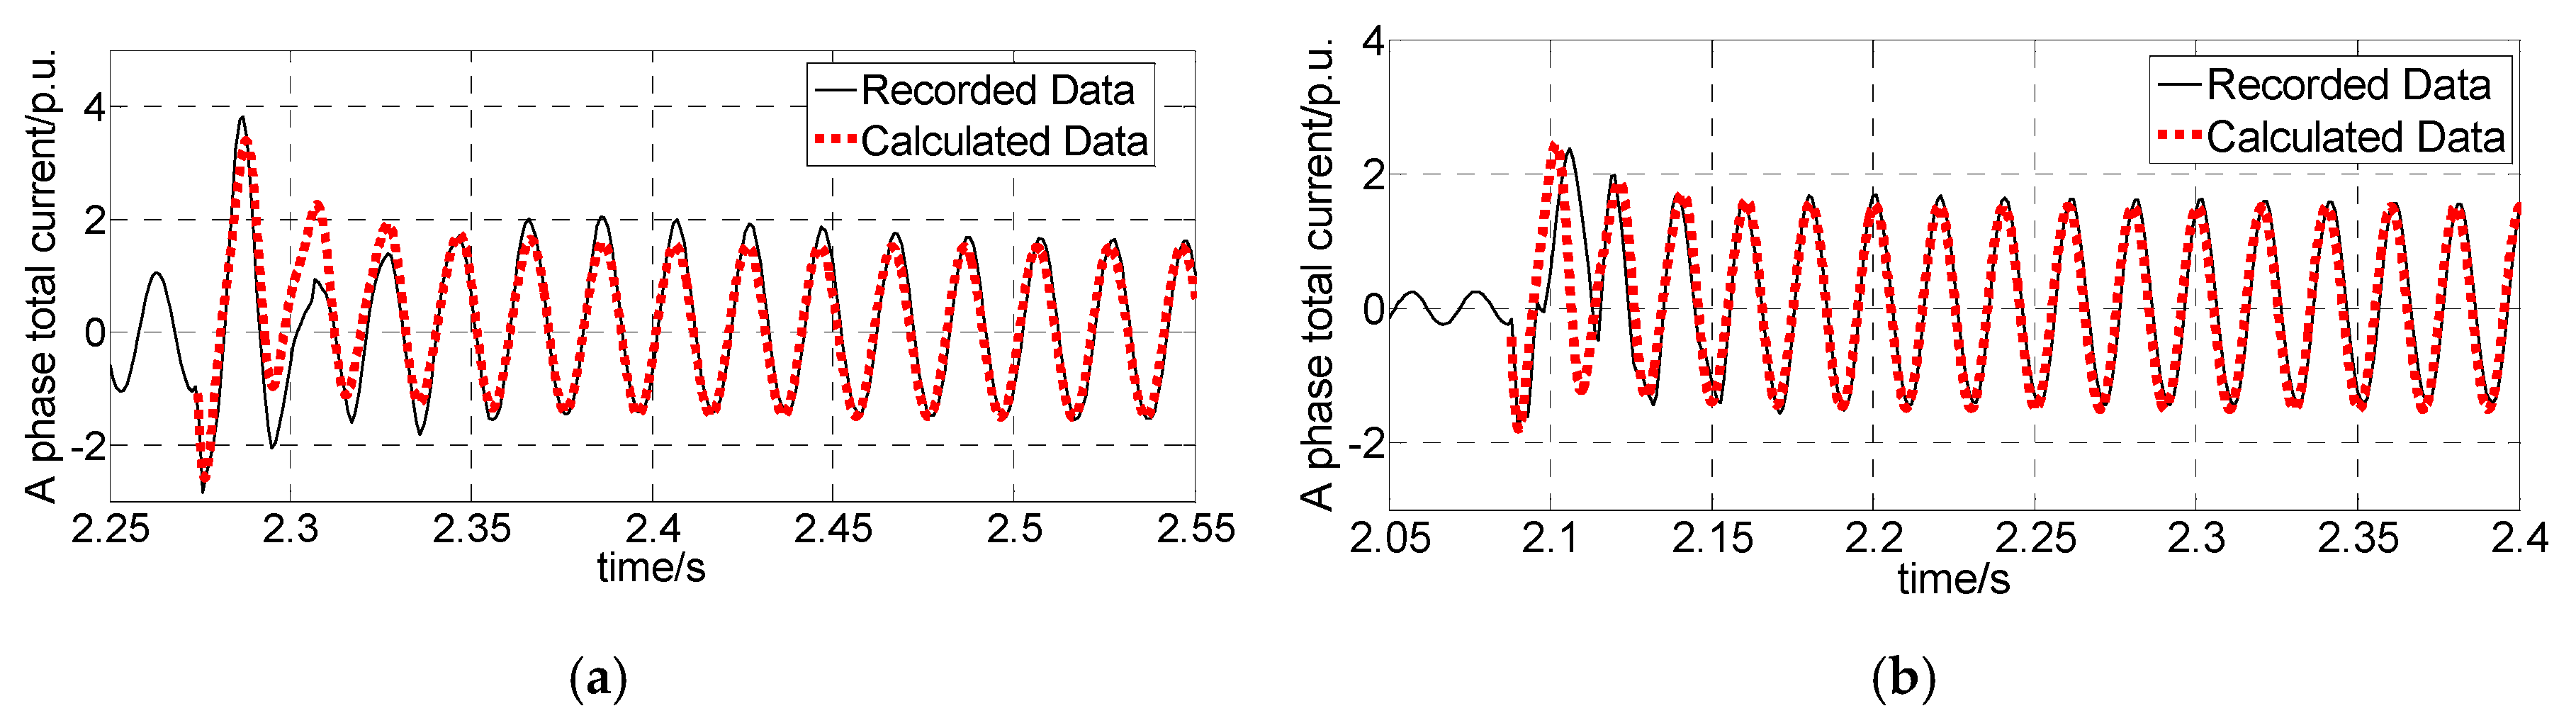
Parameters of the tested DFIG-WT are substituted into Equations (21), (24), and (26) to obtain the calculated waveforms of the DFIG-SCC under different conditions. A comparison between the actual waveforms and calculated waveforms is shown in Figure 14. Transient characteristics and the attenuation law of the calculated waveform and simulated waveform are consistent. However, the first three circles do not match well. This is because the controller may not be able to perform as ideally as the simulated model under severe fault conditions. Moreover, the steady-state short-circuit current agrees precisely.
According to the test data, the steady-state value of the short-circuit current is 1.642 p.u. under the supersynchronous condition and 1.507 p.u. under the subsynchronous condition. Parameters of DFIG-WT are transferred into per-unit values and substituted into Equation (3). The reference values of rotor current are gained as:
The reference values of rotor current are substituted into Equation (26). The steady-state short-circuit current under the two conditions is calculated as:
where and are amplitudes of short-circuit currents of DFIG-WT under full and sub synchronous conditions, respectively. Their relative errors with test data are 1.9% and 2.9%, respectively, verifying the accuracy of the proposed analytical expression.
The second harmonic contents of the first cycle in the three-phase short-circuit current under two conditions are shown in Table 4. According to Table 4, the following conclusions can be drawn as follows:
- (1)
- According to theoretical derivation and Equation (23), the deeper the voltage drops, the higher the second harmonic content will be. It can be seen from Table 4 that when the terminal voltage drops to 0.23 p.u., the second harmonic content in the three-phase short circuit current can reach up to 51.74%, far exceeding the transformer’s second harmonic setting value (15–20%).
- (2)
- Under the same voltage drop level, the second harmonic content is higher under the sub-synchronous condition than the super-synchronous condition. This is because the secondary harmonics are mainly generated by GSC, and the proportion of GSC current to the total current is higher under the sub-synchronous condition, which is consistent with the result in Figure 8.
- (3)
- Then second harmonic content in the three-phase current is different, and this phenomenon can be explained by the mechanism of second harmonic generation. According to the theoretical derivation and the flow chart in Figure 4, the second harmonic component in three phase short circuit currents is originally caused by the DC component in stator flux, which is generated due to the conservation law of flux linkage and its amplitude is determined by the instantaneous value of stator flux at the time the fault occurs. Therefore, the DC attenuation components in the three phases are not equal, so that the second harmonic content in three phases is also different.
- (4)
- The phase with the highest second harmonic content is related to the time of failure due to the same reason at the point (3). In Table 4, the highest second harmonic content is in phase C when the fault occurred at 2.27 s under the super synchronous condition, and it is phase A when the fault occurred at 2.08 s under the sub synchronous condition. As shown in Figure 8, in the simulation study, the fault occurs at the same time in both cases, and the phase with the highest second harmonic content is phase B.
7. Conclusions
In this paper, transient characteristics of DFIG-WT short-circuit current under converter control are analyzed and a detailed analytical calculation model of short-circuit total current of DFIG-WT, including GSC current and stator current, is deduced. Based on the established model, the characteristics of steady-state fault current of DFIG-WT are further studied. The accuracy of the theoretical analysis and mathematical deduction is verified by comparing simulation test and LVRT field test data. The main work of this paper can be summarized and conclusions can be drawn as follows:
- (1)
- Equations for GSC current, DC bus voltage, and rotor current are constructed. The disturbance evolution mechanism in converters and the coupling relationships of the electrical quantities are thus revealed.
- (2)
- The transient analytical models of GSC current, DC bus voltage, stator current, and rotor current are constructed. With the transient analytical model, short-circuit current frequency components, key influencing factors, and attenuation characteristics are quantized.
- (3)
- The amplitude of steady-state short-circuit current of DFIG-WT varies with the post-fault terminal voltage and pre-fault power nonlinearly, considering the multi-limitation of rotor current. Estimation formulas for the maximum steady-state SCC of DFIG-WT and the corresponding voltage are put forward and verified by simulation.
- (4)
- It is proved by theoretical analysis and simulation that the proportion of short-circuit current of GSC is related to the pre-fault operation state. The proportion of GSC current is higher under subsynchronous conditions. The accurate calculation of the total short-circuit current of DFIG-WT should take the influence of GSC current into account, or it will generate up to 30% error.
- (5)
- Reasons for high second harmonic contents contained in the transient short-circuit current of GSC are disclosed. It is concluded that the second harmonic content is positively related to the voltage dip level, and the second harmonic component might have an adverse impact on transformer differential current protection.
The results and conclusions in this paper could provide theoretical references for short-circuit current calculation of power systems with DFIG-WTs connected to the grid, as well as optimizing settings and redesigns for relevant protection, such as transformer protection with second harmonic restraint. Moreover, from the aspect of control strategies of convertors, if the fluctuation of DC bus voltage could be suppressed, the second harmonic content contained in the short-circuit current should also be decreased.
Author Contributions
Conceptualization, J.L. and T.Z.; methodology, J.L.; software, J.L.; validation, J.L. and T.Z.; formal analysis, J.L.; investigation, J.L.; resources, Z.W.; data curation, J.L.; writing—original draft preparation, J.L.; writing—review and editing, J.L., T.Z. and Z.W.; visualization, J.L.; supervision, T.Z. and Z.W.; project administration, T.Z. and Z.W.; funding acquisition, Z.W.
Funding
This work was funded by the National Key Research and Development Plan of China (2016YFB0900640) and Research Project of State Grid Corporation of China (5211TZ16000F).
Acknowledgments
We acknowledge the North China Electric Power Research Institute (NCEPRI), which provided technical support and LVRT field test data for this research.
Conflicts of Interest
The authors declare no conflict of interest.
Nomenclature
| us, ur | Stator and rotor voltage vectors | Ls, Lr | Stator and rotor self-inductances |
| is, ir | Stator and rotor current vectors | Rs, Rr | Stator and rotor resistances |
| ψs, ψr | Stator and rotor flux vectors | Lm | Mutual inductance |
| ig | GSC current vector | C | Capacitance of the capacitor |
| iT | Total current vector of DFIG-WT | L, R | Filter inductance and resistance |
| Udc | DC bus voltage | Pg | Active power of the GSC |
| iL, ig-dc | DC-side currents of RSC and GSC | ira,b,c | AC-side three-phase rotor currents |
| Pload | DC-side active power of the RSC | * | Superscript donating reference value |
| ω1 | Synchronous angular frequency | s | Slip of DFIG |
| Us0, Us1 | Amplitudes of pre-fault and post-fault stator voltages | P*s0, Q*s0 | Reference values of pre-fault stator active and reactive powers |
| p | Differential operator | Sabc | Switch function of the converter |
| d, q | Subscripts donating d-axis component and q-axis component | f, n | Subscripts donating forced component and natural component |
| Note: a symbol in bold form denotes a complex vector. | |||
Appendix A
Control diagrams of the RSC and GSC
Figure A1.
Control diagram of the RSC.

Figure A2.
Control diagram of the GSC.

Appendix B
1. Coefficients of rotor current in Equation (19):
where
2. Coefficients of DC bus voltage in Equation (21):
where ,
3. Coefficient of GSC current in Equation (22):
References
- Mai, T.; Wiser, R.; Sandor, D.; Brinkman, G.; Heath, G.; Denholm, P.; Hostick, D.J.; Darghouth, N.; Schlosser, A.; Strzepek, K. Renewable Electricity Futures Study Volume 1: Exploration of High-Penetration Renewable Electricity Futures; National Renewable Energy Laboratory: Golden, CO, USA, 2017. [Google Scholar]
- Li, H.; Eseye, A.T.; Zhang, J.; Zheng, D. Optimal energy management for industrial microgrids with high-penetration renewables. Prot. Control Mod. Power Syst. 2017, 2, 12. [Google Scholar] [CrossRef]
- Tazil, M.; Kumar, V.; Bansal, R.C.; Kong, S.; Dong, Z.Y.; Freitas, W.; Mathur, H.D. Three-phase doubly fed induction generators: An overview. IET Electr. Power Appl. 2010, 4, 75–89. [Google Scholar] [CrossRef]
- Strezoski, V.L.; Prica, D.M. Short-circuit analysis in large-scale distribution systems with high penetration of distributed generators. IEEE/CAA J. Autom. Sin. 2017, 4, 243–251. [Google Scholar] [CrossRef]
- Wang, X.; Pan, X.; Wan, J.; Qi, J.; Zhang, H.; Li, S. A wind farm short-circuit current calculation practical model applied to high voltage power grid simulation. In Proceedings of the 2014 International Conference on Mechatronics, Electronic, Industrial and Control Engineering, Shenyang, China, 17–19 November 2014. [Google Scholar] [CrossRef]
- Shen, S.; Lin, D.; Wang, H.; Hu, P.; Jiang, K.; Lin, D.; He, B. An adaptive protection scheme for distribution systems with DGs based on optimized Thevenin equivalent parameters estimation. IEEE Trans. Power Deliv. 2017, 32, 411–419. [Google Scholar] [CrossRef]
- Kauffmann, T.; Karaagac, U.; Kocar, I.; Jensen, S.; Mahseredjian, J.; Farantatos, E. An accurate type III wind turbine generator short circuit model for protection applications. IEEE Trans. Power Deliv. 2017, 32, 2370–2379. [Google Scholar] [CrossRef]
- Zhou, N.; Wu, J.; Wang, Q. Three-phase short-circuit current calculation of power systems with high penetration of VSC-based renewable energy. Energies 2018, 11, 537. [Google Scholar] [CrossRef]
- Dosoglu, M.K.; Guvenc, U.; Sonmez, Y.; Yilmaz, C. Enhancement of demagnetization control for low-voltage ride-through capability in DFIG-based wind farm. Electr. Eng. 2018, 100, 491–498. [Google Scholar] [CrossRef]
- General Administration of Quality Supervision, Inspection and Quarantine of the People’s Republic of China and the Standardization Administration of the People’s Republic of China. Technical Rule for Connecting Wind Farm to Power System; Xinhua Press: Beijing, China, 2012.
- VDE Verlag GmbH. Technical Requirements for the Connection to and Parallel Operation with Low-Voltage Distribution Networks; VDE Verlag GmbH: Berlin, Germany, 2017. [Google Scholar]
- Swain, S.; Ray, K.P. Short circuit fault analysis in a grid connected DFIG based wind energy system with active crowbar protection circuit for ride-through capability and power quality improvement. Electr. Power Energy Syst. 2017, 84, 64–75. [Google Scholar] [CrossRef]
- Zhu, Q.; Ding, M.; Han, P. Equivalent modeling of DFIG-based wind power plant considering crowbar protection. Math. Probl. Eng. 2016, 2016, 8426492. [Google Scholar] [CrossRef]
- Yuan, Y.H.; Wu, F. Short-circuit current analysis for DFIG wind farm considering the action of a crowbar. Energies 2018, 11, 425. [Google Scholar] [CrossRef]
- Yin, J.; Bi, T.; Xue, A.; Yang, Q. Study on short circuit current and fault analysis method of double fed induction generator with low voltage ride-through control strategy. Trans. China Electr. Tech. Soc. 2015, 30, 118–125. [Google Scholar]
- Ouyang, J.; Zheng, D.; Xiong, X.; Xiao, C.; Yu, R. Short-circuit current of doubly fed induction generator under partial and asymmetrical voltage drop. Renew. Energy 2016, 88, 1–11. [Google Scholar] [CrossRef]
- Kong, X.; Zhang, Z.; Yin, X.; Wen, M. Study of fault current characteristics of the DFIG considering dynamic response of the RSC. IEEE Trans. Energy Convers. 2014, 29, 278–287. [Google Scholar]
- Abad, G.; Lopez, J.; Rodrlguez, A.M.; Marroyo, L.; Iwanski, G. Doubly Fed Induction Machine: Modeling And Control For Wind Energy Generation; Wiley-IEEE Press: Hoboken, NJ, USA, 2014; pp. 246–247. [Google Scholar]
- Xiao, S.; Geng, H.; Zhou, H.; Yang, G. Analysis of the control limit for rotor-side converter of doubly fed induction generator-based wind energy conversion system under various voltage dips. IET Renew. Power Gener. 2013, 7, 71–81. [Google Scholar] [CrossRef]
- Hu, J.; He, Y. DFIG wind generation systems operating with limited converter rating considered under unbalanced network conditions—Analysis and control design. Renew. Energy 2011, 36, 829–847. [Google Scholar] [CrossRef]
- Chen, P.; Zhang, Z.; Yin, X.; Xiao, F.; Yang, Z.; Wang, L. Steady fault current calculation model of doubly-fed induction generator considering grid-side converter current and different control strategies. Autom. Electr. Power Syst. 2016, 40, 8–16. [Google Scholar]
- Honrubia-Escribano, A.; Jiménez-Buendía, F.; Gómez-Lázaro, E.; Fortmann, J. Field validation of a standard type 3 wind turbine model for power system stability, according to the requirements imposed by IEC 61400-27-1. IEEE Trans. Energy Convers. 2018, 33, 137–145. [Google Scholar] [CrossRef]
- Zhang, C.W.; Zhang, X. PWM Rectifier and Control; Machine Press: Beijing, China, 2003; pp. 114–117. [Google Scholar]
- Xiao, F.; Zhang, Z.; Yin, X. Fault current characteristics of the DFIG under asymmetrical fault conditions. Energies 2015, 8, 10971–10992. [Google Scholar] [CrossRef]
- Liu, S.M.; Bi, T.S.; Jia, K.; Yang, Q.X. Coordinated fault-ride-through strategy for doubly-fed induction generators with enhanced reactive and active power support. IET Renew. Power Gener. 2016, 10, 203–211. [Google Scholar] [CrossRef]
- Lopez, J.; Sanchis, P.; Roboam, X.; Marroyo, L. Dynamic behavior of the doubly fed induction generator during three-phase voltage dips. IEEE Trans. Energy Convers. 2007, 22, 709–717. [Google Scholar] [CrossRef]
- National Energy Administration. Test Procedures of WIND Turbine Low Voltage Ride Through Ability; Xinhua Press: Beijing, China, 2015. [Google Scholar]
Figure 1.
Current regulating loop and voltage regulating loop of the grid-side converter (GSC): (a) current regulating loop; (b) voltage regulating loop.
Figure 1.
Current regulating loop and voltage regulating loop of the grid-side converter (GSC): (a) current regulating loop; (b) voltage regulating loop.

Figure 2.
Control framework of inner current loop of RSC.

Figure 3.
Flow chart of the integration process of the transient short-circuit current calculation model for DFIG-WT: (a) simplified graphic of the relations among critical quantities; (b) detailed flow chart of the integration process.
Figure 3.
Flow chart of the integration process of the transient short-circuit current calculation model for DFIG-WT: (a) simplified graphic of the relations among critical quantities; (b) detailed flow chart of the integration process.
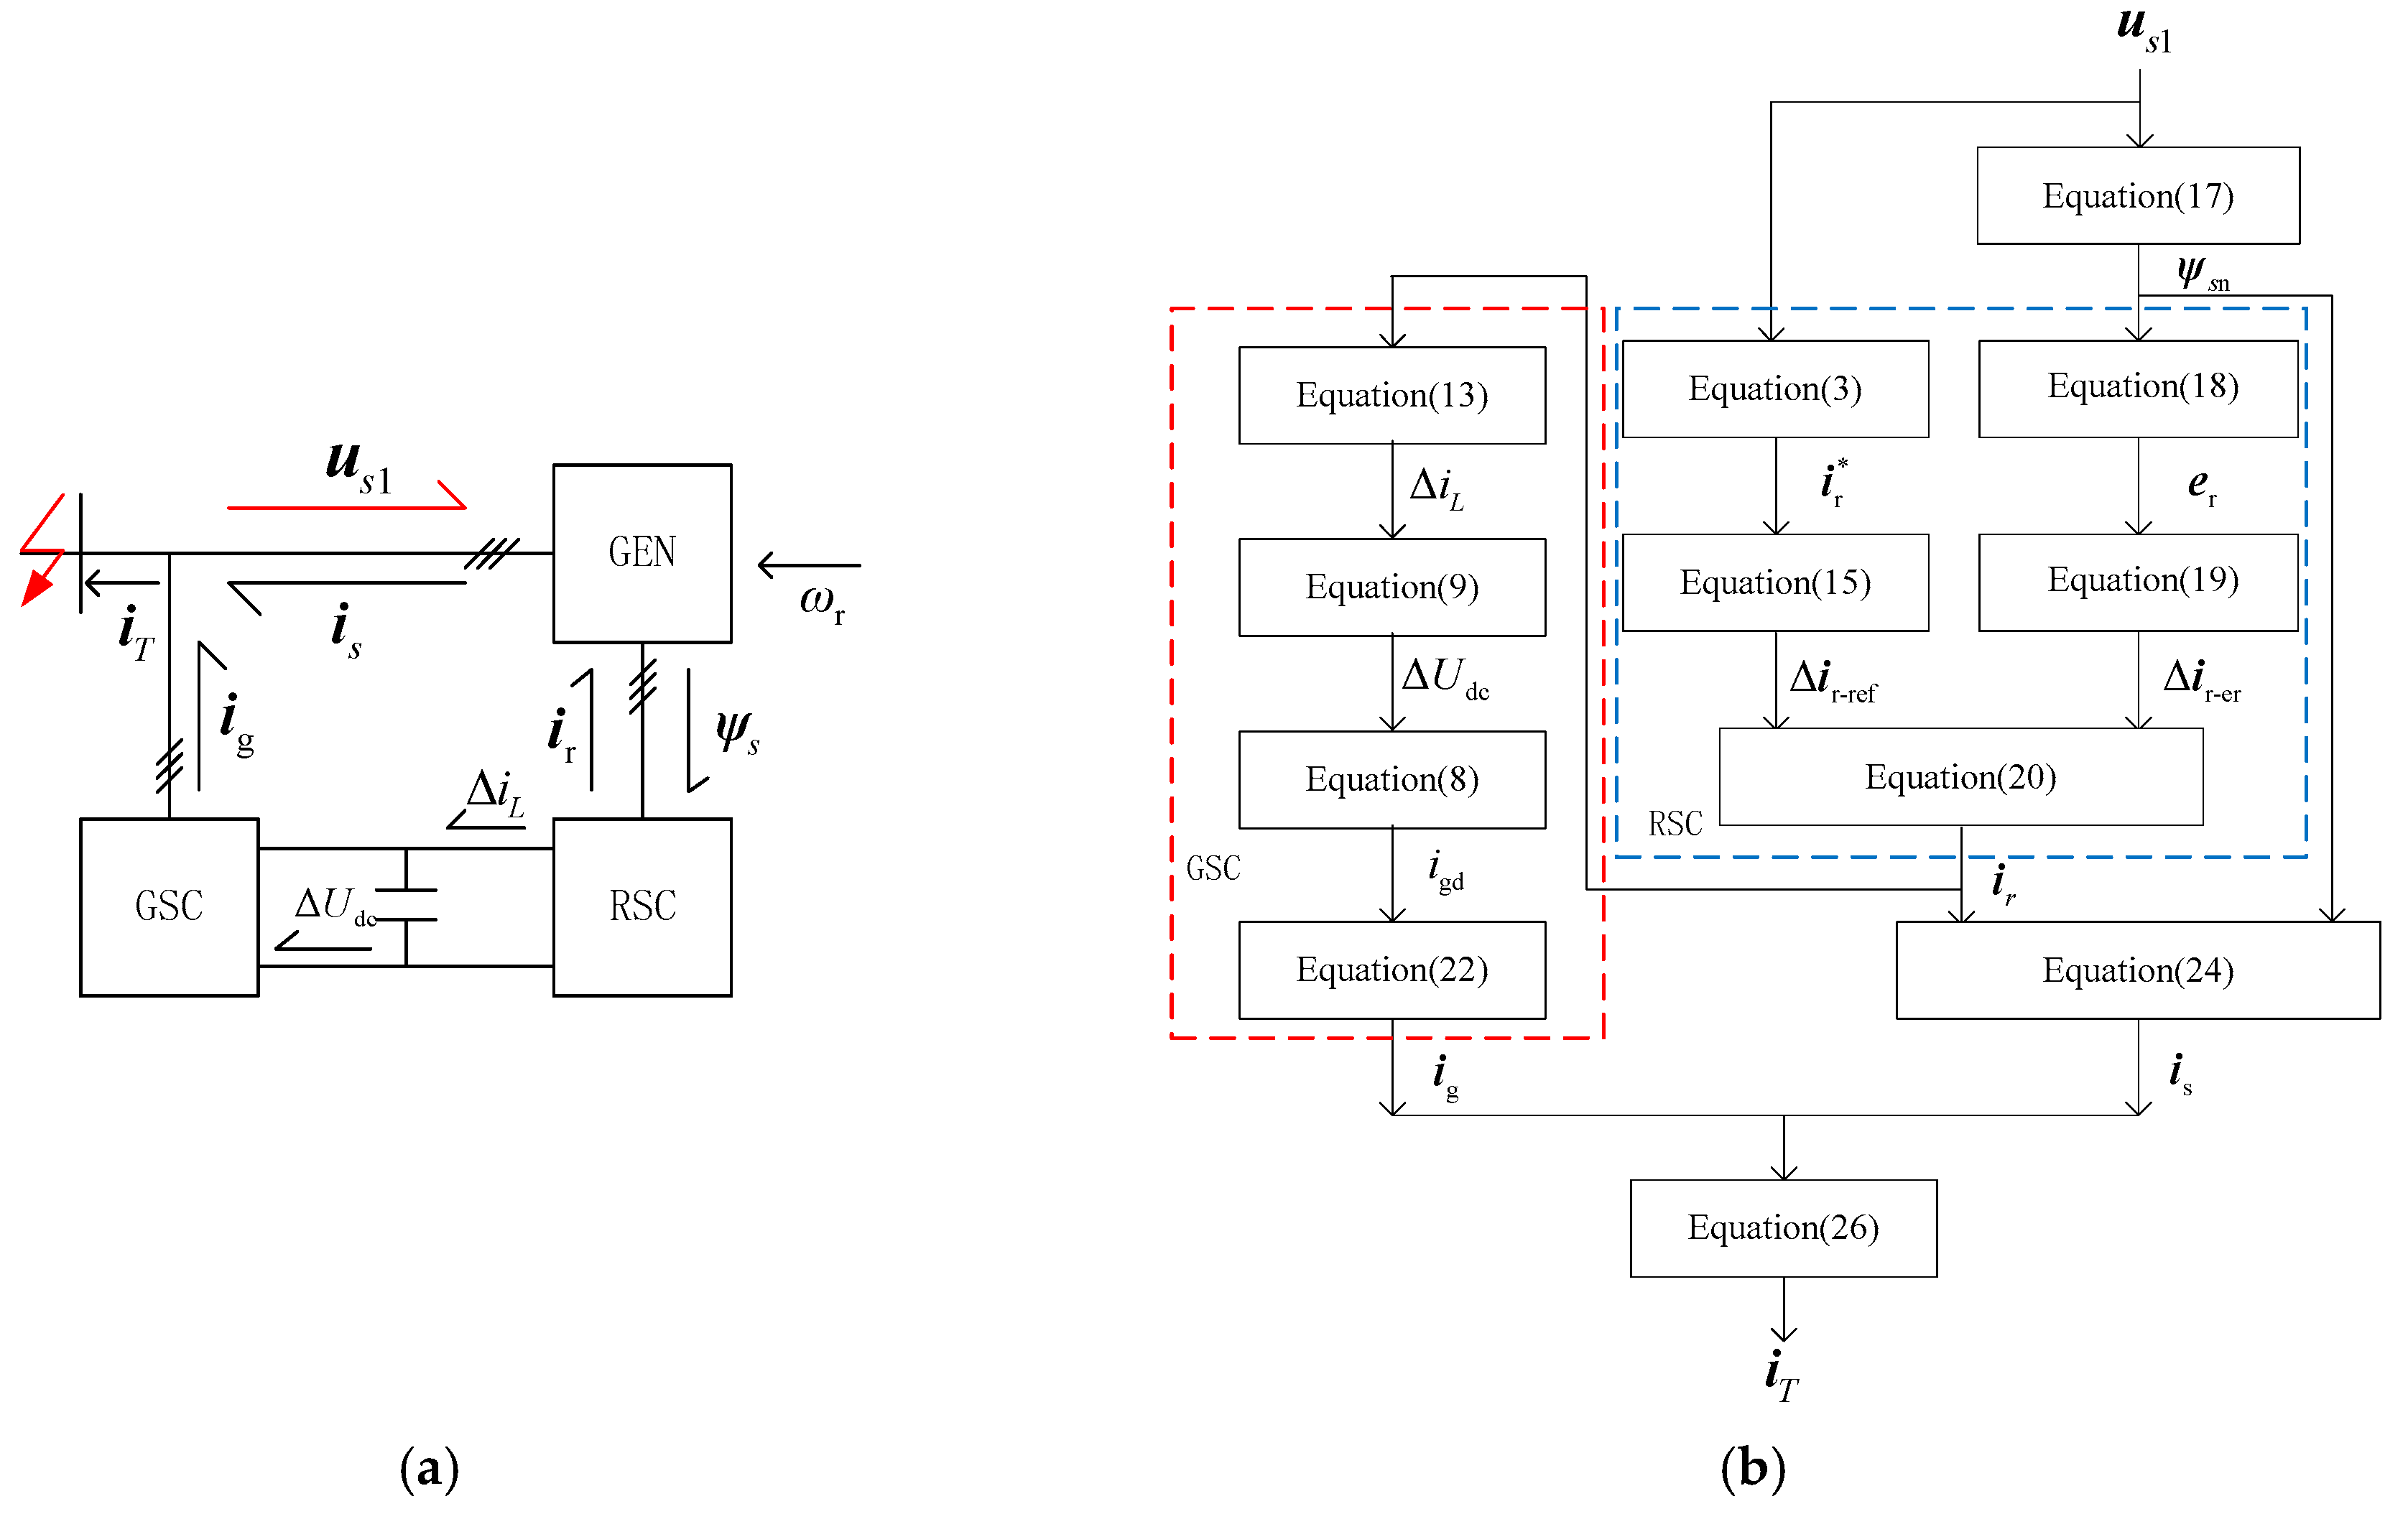
Figure 4.
Characteristics of steady-state components of DFIG-WT fault current.

Figure 5.
Simulation system.

Figure 6.
Comparison of DC bus voltage and decomposition of frequency components: (a) comparison between simulated and calculated waveform; (b) decomposition of frequency components.
Figure 6.
Comparison of DC bus voltage and decomposition of frequency components: (a) comparison between simulated and calculated waveform; (b) decomposition of frequency components.
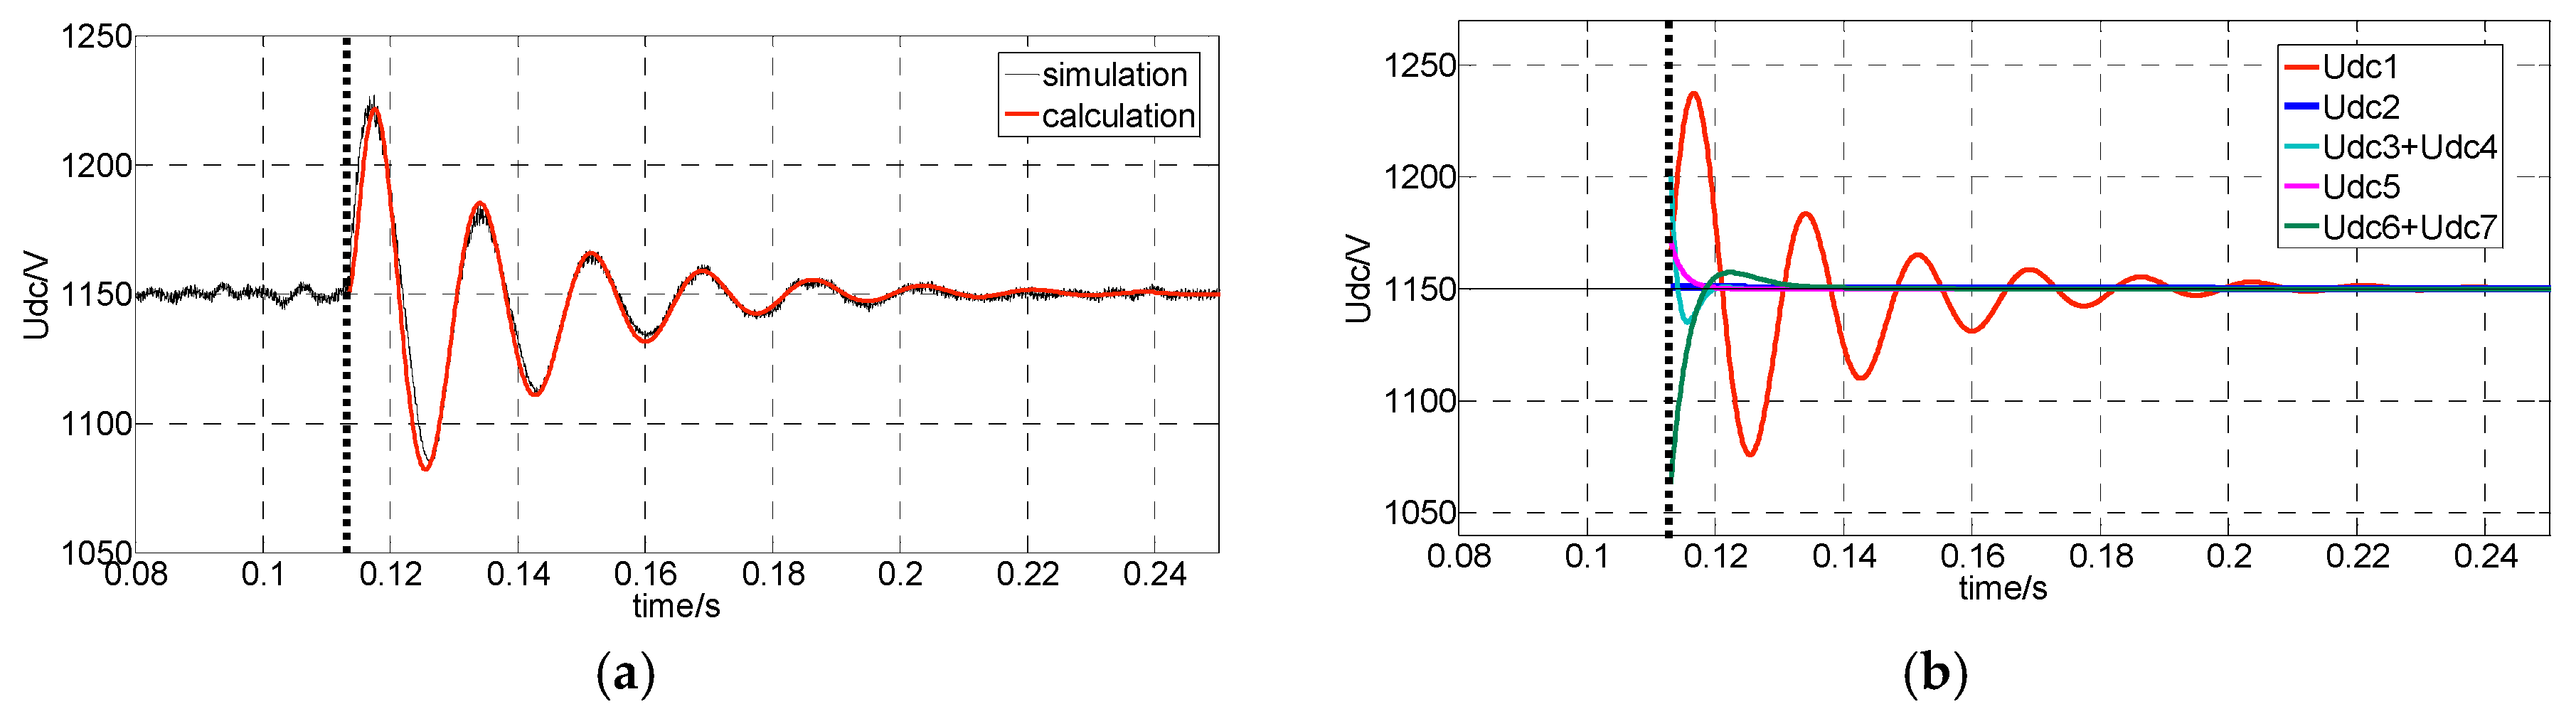
Figure 7.
GSC short-circuit current and its frequency spectral analysis: (a) comparison between simulated and calculated waveform; (b) frequency spectral analysis.
Figure 7.
GSC short-circuit current and its frequency spectral analysis: (a) comparison between simulated and calculated waveform; (b) frequency spectral analysis.
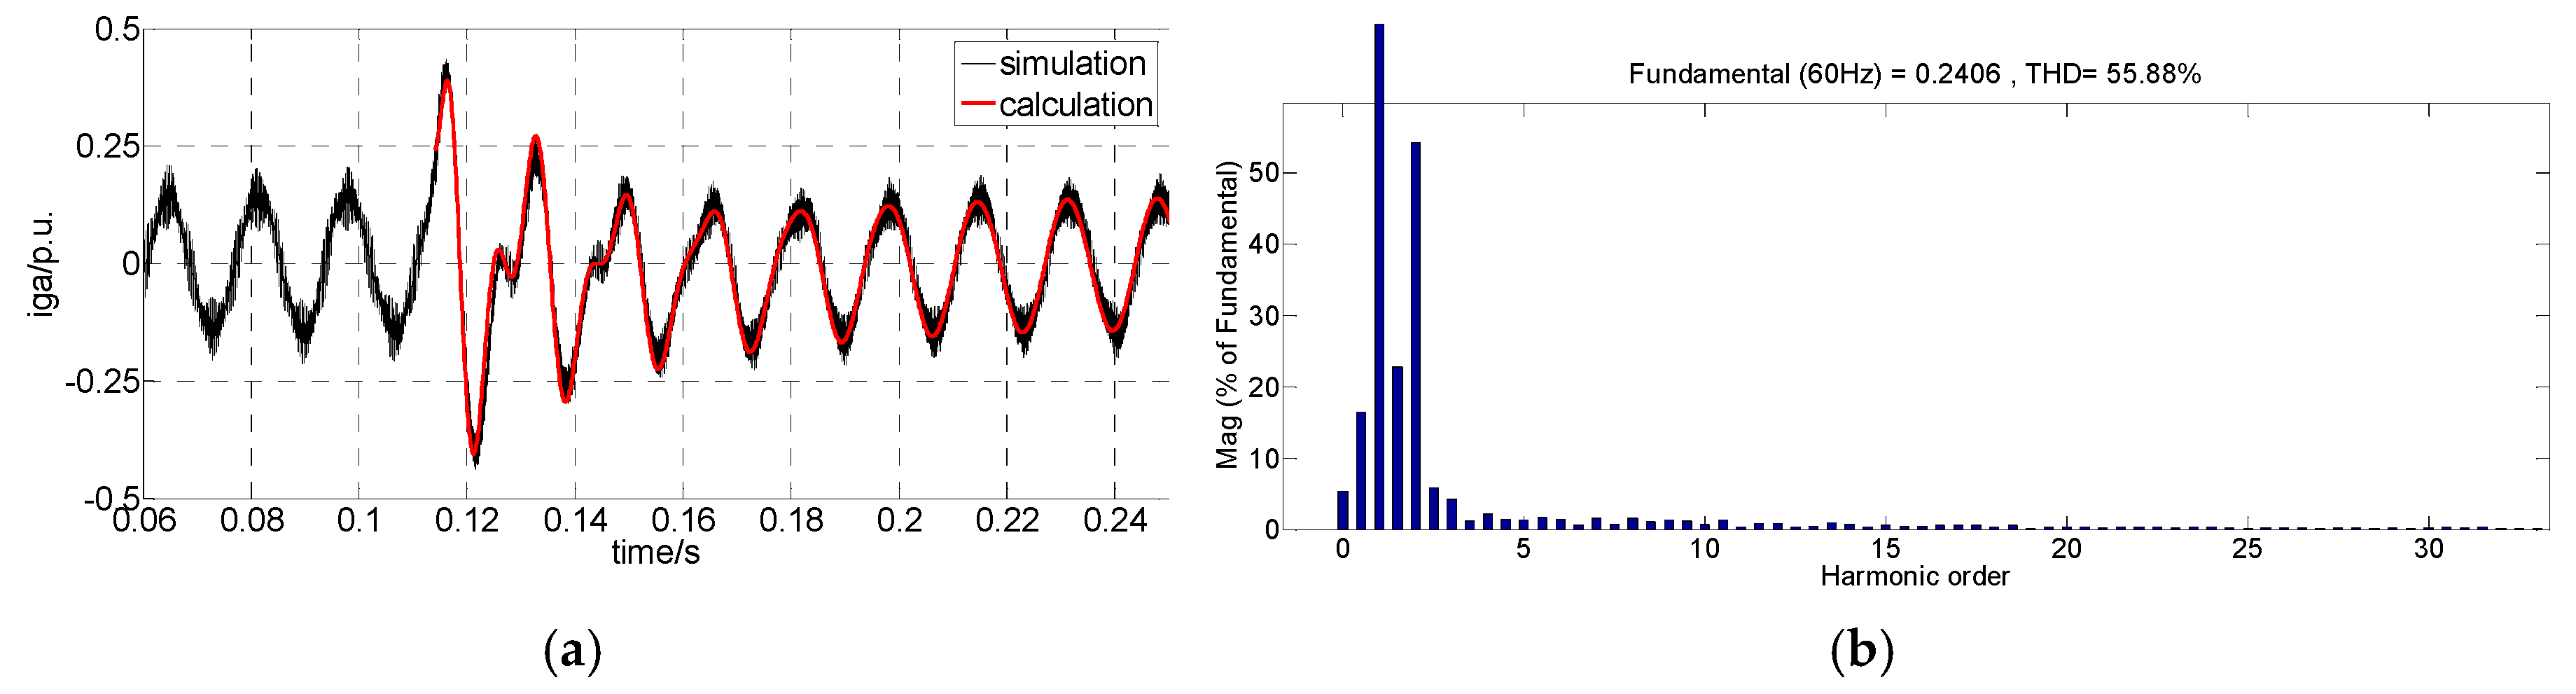
Figure 8.
Proportions of the second harmonic component in short-circuit current of DFIG-WT and GSC: (a) supersynchronous, s = −0.2; (b) subsynchronous, s = 0.2.
Figure 8.
Proportions of the second harmonic component in short-circuit current of DFIG-WT and GSC: (a) supersynchronous, s = −0.2; (b) subsynchronous, s = 0.2.

Figure 9.
Rotor short-circuit current and its frequency spectral analysis: (a) comparison between simulated and calculated waveform; (b) frequency spectral analysis.
Figure 9.
Rotor short-circuit current and its frequency spectral analysis: (a) comparison between simulated and calculated waveform; (b) frequency spectral analysis.

Figure 10.
Stator short-circuit current and its frequency spectral analysis: (a) comparison between simulated and calculated waveform; (b) frequency spectral analysis.
Figure 10.
Stator short-circuit current and its frequency spectral analysis: (a) comparison between simulated and calculated waveform; (b) frequency spectral analysis.

Figure 11.
Contrast verification of key characteristic parameters of short-circuit current under different conditions, as well as proportions of steady-state GSC-SCC.
Figure 11.
Contrast verification of key characteristic parameters of short-circuit current under different conditions, as well as proportions of steady-state GSC-SCC.

Figure 12.
(a) LVRT test schematic diagram, (b) picture of the LVRT field test devices.

Figure 13.
Active and reactive power under different conditions: (a) supersynchronous condition; (b) subsynchronous condition.
Figure 13.
Active and reactive power under different conditions: (a) supersynchronous condition; (b) subsynchronous condition.
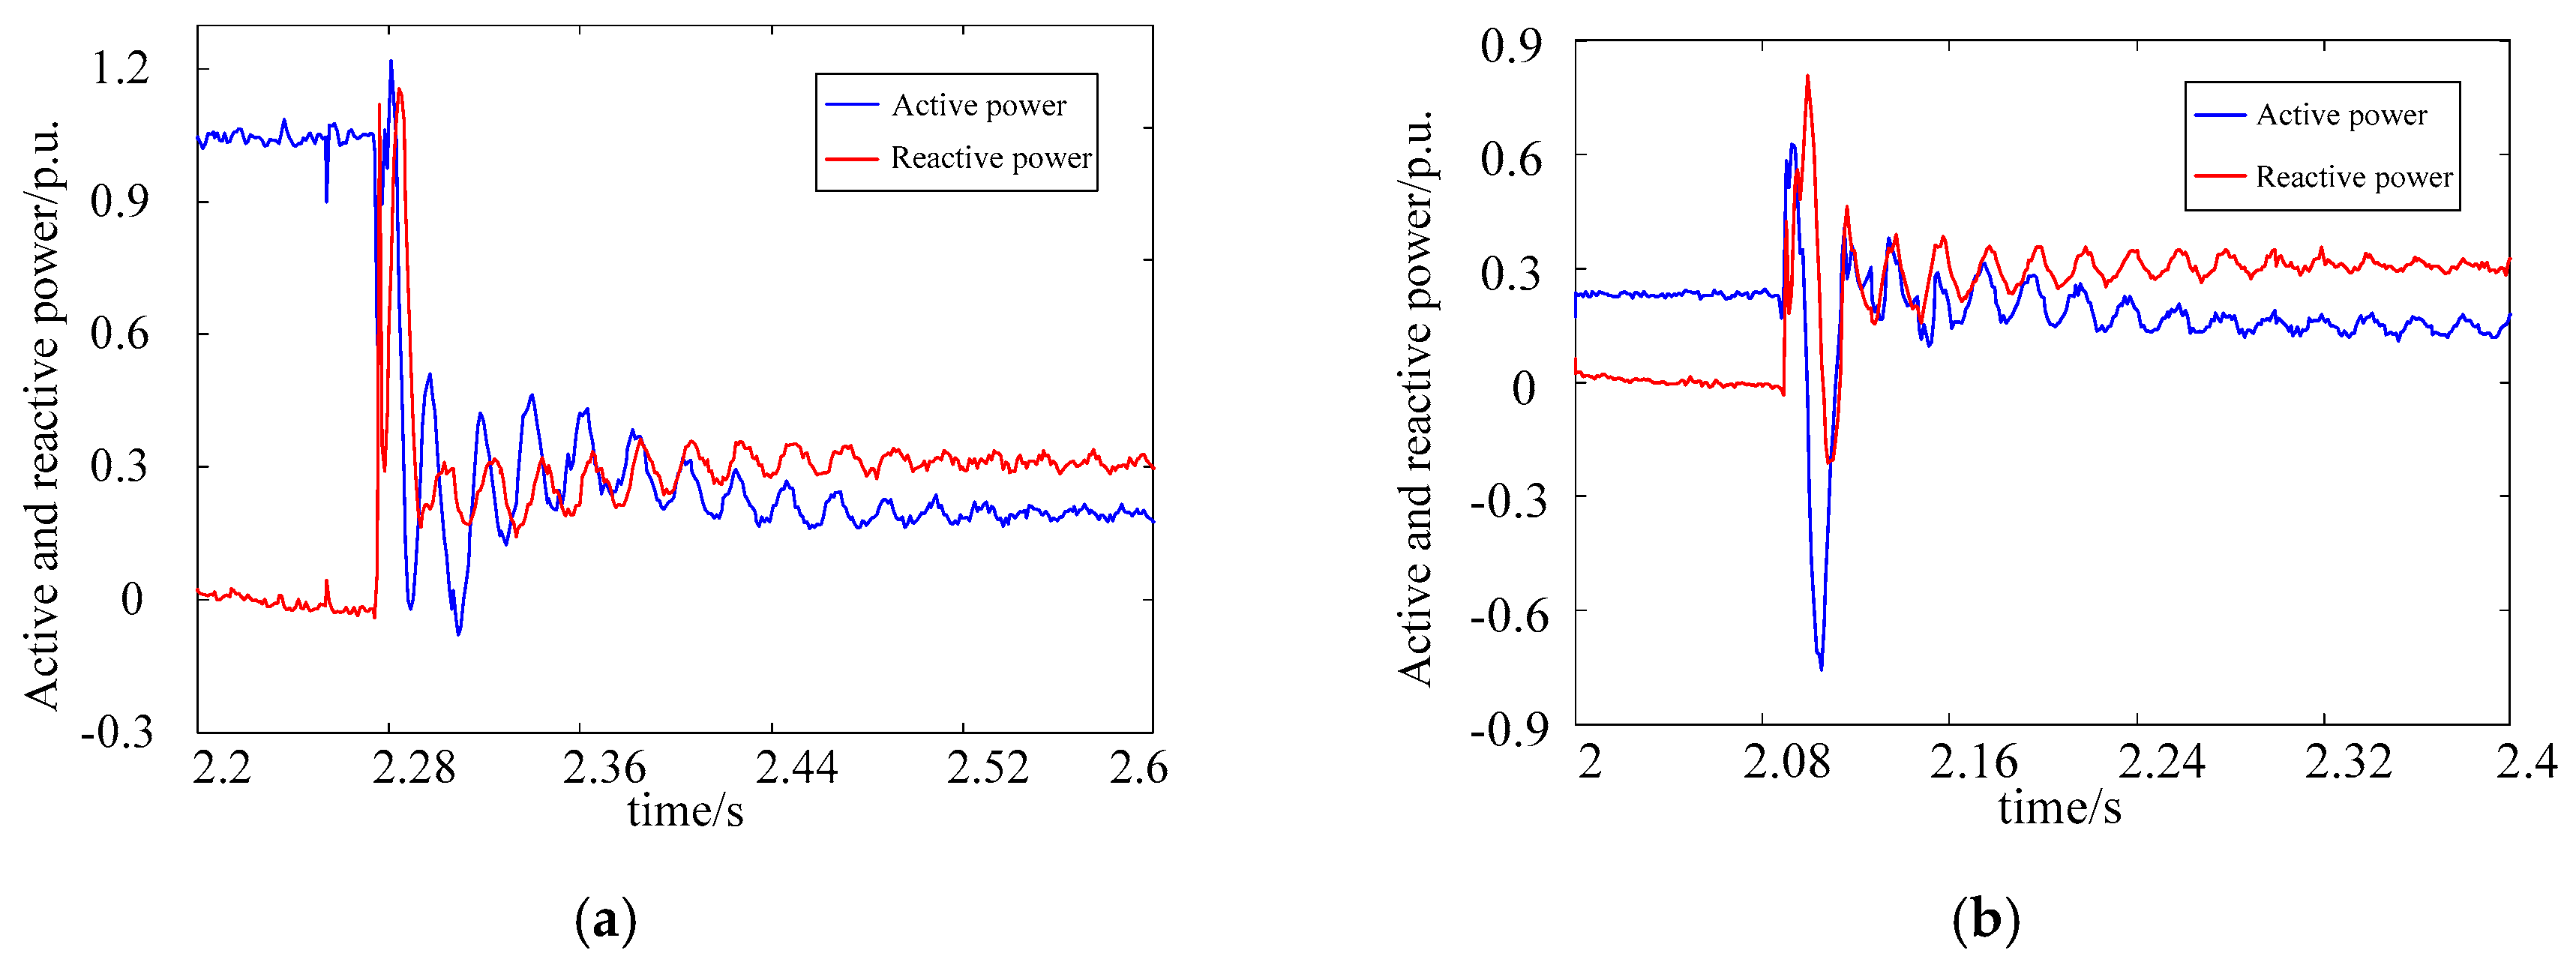
Figure 14.
Comparison between recorded data and calculated data under two operating conditions: (a) supersynchronous condition; (b) subsynchronous condition.
Figure 14.
Comparison between recorded data and calculated data under two operating conditions: (a) supersynchronous condition; (b) subsynchronous condition.


Table 1.
Coefficient amplitudes and time constants of attenuation components in ir and ∆Udc.
| ir Coefficient Amplitude/p.u. | ∆Udc Coefficient Amplitude/p.u. | Attenuation Time Constant | |||
|---|---|---|---|---|---|
| ∆ir1 | 0.7026 | Udc1 | 0.1351 | τs | 0.0306 |
| ∆ir2 | 0.0316 | Udc2 | 0.0009 | τi | 0.0575 |
| ∆ir3 | 0.2112 | Udc3 | 0.0312 | 1/ωci | 0.0019 |
| ∆ir4 | 0.2275 | Udc4 | 0.0410 | 1/ωci | 0.0019 |
| ∆ir* | 0.3332 | Udc5 | 0.0369 | 1/ωci | 0.0019 |
| Udc6 | 0.0505 | −1/λ1 | 0.0079 | ||
| Udc7 | 0.0579 | −1/λ2 | 0.004 | ||
Table 2.
Parameters of the DFIG-WT simulation model.
| Parameter | Value | Parameter | Value |
|---|---|---|---|
| Rated capacity | 1.5 MW | Switching frequency of RSC | 1.6 kHz |
| Rated voltage of stator | 690 V | Proportionality coefficient of inner current loop | 0.578 |
| Stator resistance | 0.023 p.u. | Integral coefficient of inner current loop | 10.58 |
| Rotor resistance | 0.016 p.u. | Switching frequency of GSC | 2.7 kHz |
| Stator inductance | 3.08 p.u. | Proportionality coefficient of DC voltage loop | 6.17 |
| Rotor inductance | 3.06 p.u. | Integral coefficient of DC voltage loop | 400 |
| Rated DC bus voltage | 1150 V | Reactive current coefficient Kd | 1.5 |
| Active current-limiting of rotor | 0.9 p.u. | Maximum current-limiting value of rotor | 1.15 p.u. |
| DC bus capacitor | 0.0032 p.u. | Modulation coefficient of PWM | 0.95 |
Table 3.
Parameters of the tested DFIG-WT.
| Parameter | Value | Parameter | Value |
|---|---|---|---|
| Rated capacity | 1.5 MW | Leakage inductance of rotor | 0.0162 Ω |
| Rated voltage of stator | 690 V | Exciting inductance | 1.123 Ω |
| Rated voltage of rotor | 1800 V | Switching frequency of converter | 2.5 kHz |
| Stator resistance | 0.0023 Ω | Current-limiting value of rotor | 1.5 p.u. |
| Rotor resistance | 0.0024 Ω | Reactive current coefficient | 1.8 |
| Leakage inductance of stator | 0.0184 Ω | Rated voltage of DC bus | 1150 V |
| Proportionality coefficient of inner current loop | 0.6 | Proportionality coefficient of DC voltage loop | 10 |
| Integral coefficient of inner current loop | 15 | Integral coefficient of DC voltage loop | 500 |
| DC bus capacitor | 0.001 F | Modulation coefficient of PWM | 0.95 |
Table 4.
Second harmonic contents of three-phase short-circuit current under two conditions.
| Operating Condition | A-Phase | B-Phase | C-Phase |
|---|---|---|---|
| Super-synchronous | 32.68% | 25.16% | 43.40% |
| Subs-synchronous | 49.45% | 34.58% | 51.74% |
© 2018 by the authors. Licensee MDPI, Basel, Switzerland. This article is an open access article distributed under the terms and conditions of the Creative Commons Attribution (CC BY) license (http://creativecommons.org/licenses/by/4.0/).
Share and Cite
MDPI and ACS Style
Li, J.; Zheng, T.; Wang, Z. Short-Circuit Current Calculation and Harmonic Characteristic Analysis for a Doubly-Fed Induction Generator Wind Turbine under Converter Control. Energies 2018, 11, 2471. https://doi.org/10.3390/en11092471
AMA Style
Li J, Zheng T, Wang Z. Short-Circuit Current Calculation and Harmonic Characteristic Analysis for a Doubly-Fed Induction Generator Wind Turbine under Converter Control. Energies. 2018; 11(9):2471. https://doi.org/10.3390/en11092471
Chicago/Turabian StyleLi, Jing, Tao Zheng, and Zengping Wang. 2018. "Short-Circuit Current Calculation and Harmonic Characteristic Analysis for a Doubly-Fed Induction Generator Wind Turbine under Converter Control" Energies 11, no. 9: 2471. https://doi.org/10.3390/en11092471
Note that from the first issue of 2016, this journal uses article numbers instead of page numbers. See further details here.