Article

Multi-Objective Optimization Design of an Electrohydrostatic Actuator Based on a Particle Swarm Optimization Algorithm and an Analytic Hierarchy Process

School of Automation Science and Electrical Engineering, Beihang University, Beijing 100191, China
*
Author to whom correspondence should be addressed.
Energies 2018, 11(9), 2426; https://doi.org/10.3390/en11092426
Submission received: 1 July 2018 / Revised: 10 August 2018 / Accepted: 10 August 2018 / Published: 13 September 2018

Abstract

:
During the last few years, the concept of more-electric aircraft has been pushed ahead by industry and academics. For a more-electric actuation system, the electrohydrostatic actuator (EHA) has shown its potential for better reliability, low maintenance cost and reducing aircraft weight. Designing an EHA for aviation applications is a hard task, which should balance several inconsistent objectives simultaneously, such as weight, stiffness and power consumption. This work presents a method to obtain the optimal EHA, which combines multi-objective optimization with a synthetic decision method, that is, a multi-objective optimization design method, that can combine designers’ preferences and experiences. The evaluation model of an EHA in terms of weight, stiffness and power consumption is studied in the first section. Then, a multi-objective particle swarm optimization (MOPSO) algorithm is introduced to obtain the Pareto front, and an analytic hierarchy process (AHP) is applied to help find the optimal design in the Pareto front. A demo of an EHA design illustrates the feasibility of the proposed method.

1. Introduction

With the rapid development of aeronautical science and technology, power-by-wire actuation systems will replace traditional hydraulic actuation systems gradually [1]. In power-by-wire actuation systems [2], power transfers from a secondary power system to actuators by means of electric power transmission. The power-by-wire technology causes the centralized hydraulic system to be cancelled or reduced, which means the reliability and maintainability will be increased and the weight will be decreased greatly. In current power-by-wire actuation systems, EHAs attract more and more attention because of their characteristics of small size and high power density [3]. As EHAs can improve the viability and reliability of aircraft, this brings down the cost of maintenance. Therefore, the use of EHAs can not only improve the performance of the aircraft, but also reduce the maintenance cost [4]. It is of great significance to do research in the design and optimization of EHAs, which will be the leading actuators of aircraft in the future [5].
Optimization design of EHAs is a nonlinear multi-objective programming problem which should consider several inconsistent objectives simultaneously [6]. In general, there is no perfect solution that performs best on every objective. The common way to solve the multi-objective optimization problem is transforming it into a single objective by getting a sum of objectives and multiplying with weight coefficients. The drawback of this method is that the weight coefficients are difficult to decide. In the last ten years, many innovative engineering mathematics and modern intelligent algorithms have sprung up, such as a simulated annealing algorithm [7,8], genetic algorithm (GA) [9,10], neural network algorithm [11,12], particle swarm algorithm (PSO) [13,14,15] and so on, many of which are applied to multi-objective optimization [16]. In paper [17], a Pareto-based multi-objective genetic algorithm is applied to optimize a sheet metal-forming process, to minimize objective functions of fracture, wrinkle, insufficient stretching and thickness simultaneously. In paper [18], the optimization algorithms, which are genetic algorithms, differential evolution (DE) and simulated annealing (SA), are applied to the design of synchronous reluctance motors. The optimization goals are to maximize the torque-per-Joule loss ratio and minimize the torque ripple. In paper [19], the work focuses on a multi-objective optimization technique in the process of designing hybrid energy systems. Four different objectives, levelized energy cost, unmet load fraction, wasted renewable energy and fuel consumption, are used to obtain the Pareto front. Paper [20] describes a multi-objective optimization preliminary design method of the EHA with the objectives of weight and efficiency. Particle swarm optimization is a new global optimization algorithm developed rapidly in recent years. Many advantages of PSO, such as fewer restrictions to the optimization problem, an instructive search process, and that the search scope spreads throughout the solution space, make it possible to find the global optimal solution. Multi-objective particle swarm optimization, combined with Pareto theory [21] and particle swarm optimization, overcomes the shortcomings of the traditional optimization algorithm and is used in neural networks, machine learning, data mining, adaptive control and other aspects widely. In paper [22], MOPSO is applied in the optimization design of a benchmark cogeneration system. In paper [23], a comprehensive framework for multi-objective design optimization of switched reluctance motors is proposed based on a combination of the design of experiments and particle swarm optimization approaches.
The result of multi-objectives is a set of Pareto fronts which still need to decide a best solution. Analytic hierarchy process (AHP) is a widely used method to achieve a multicriterion decision problem [24]. It combines qualitative and quantitative analyses together, in which elements related to task decisions are decomposed into object level, criteria level and scheme level [25]. AHP mathematizes the decision process using a small amount of quantitative data on the base of deep analysis, including the influence factors and internal relations of the decision making problems, and thus it can provide a simple decision method for complex decision problems with multiple criteria and no obvious structural characteristics. In paper [26], the multi-objective particle swarm optimization method is used to obtain the optimization of a hollow plunger-type solenoid for a high-speed on/off valve, and an approved solution in the Pareto frontier is selected by the analytic hierarchy process.
In this paper, an EHA design method is proposed which uses multi-objective particle swarm optimization to obtain the Pareto frontier, and then gets the best design scheme using a synthetic decision method. An optimization model of the EHA is built. The three objective functions are the weight, the power consumption and the stiffness of the EHA. MOPSO is applied to optimize the mathematical models and a set of Pareto frontiers with good diversity is obtained. The EHA optimization design is taken as a system, and the best design in the Pareto front is acquired by AHP. The whole evaluation system is displayed in a hierarchical and systematic manner, and the whole assessment process is clear and explicit.

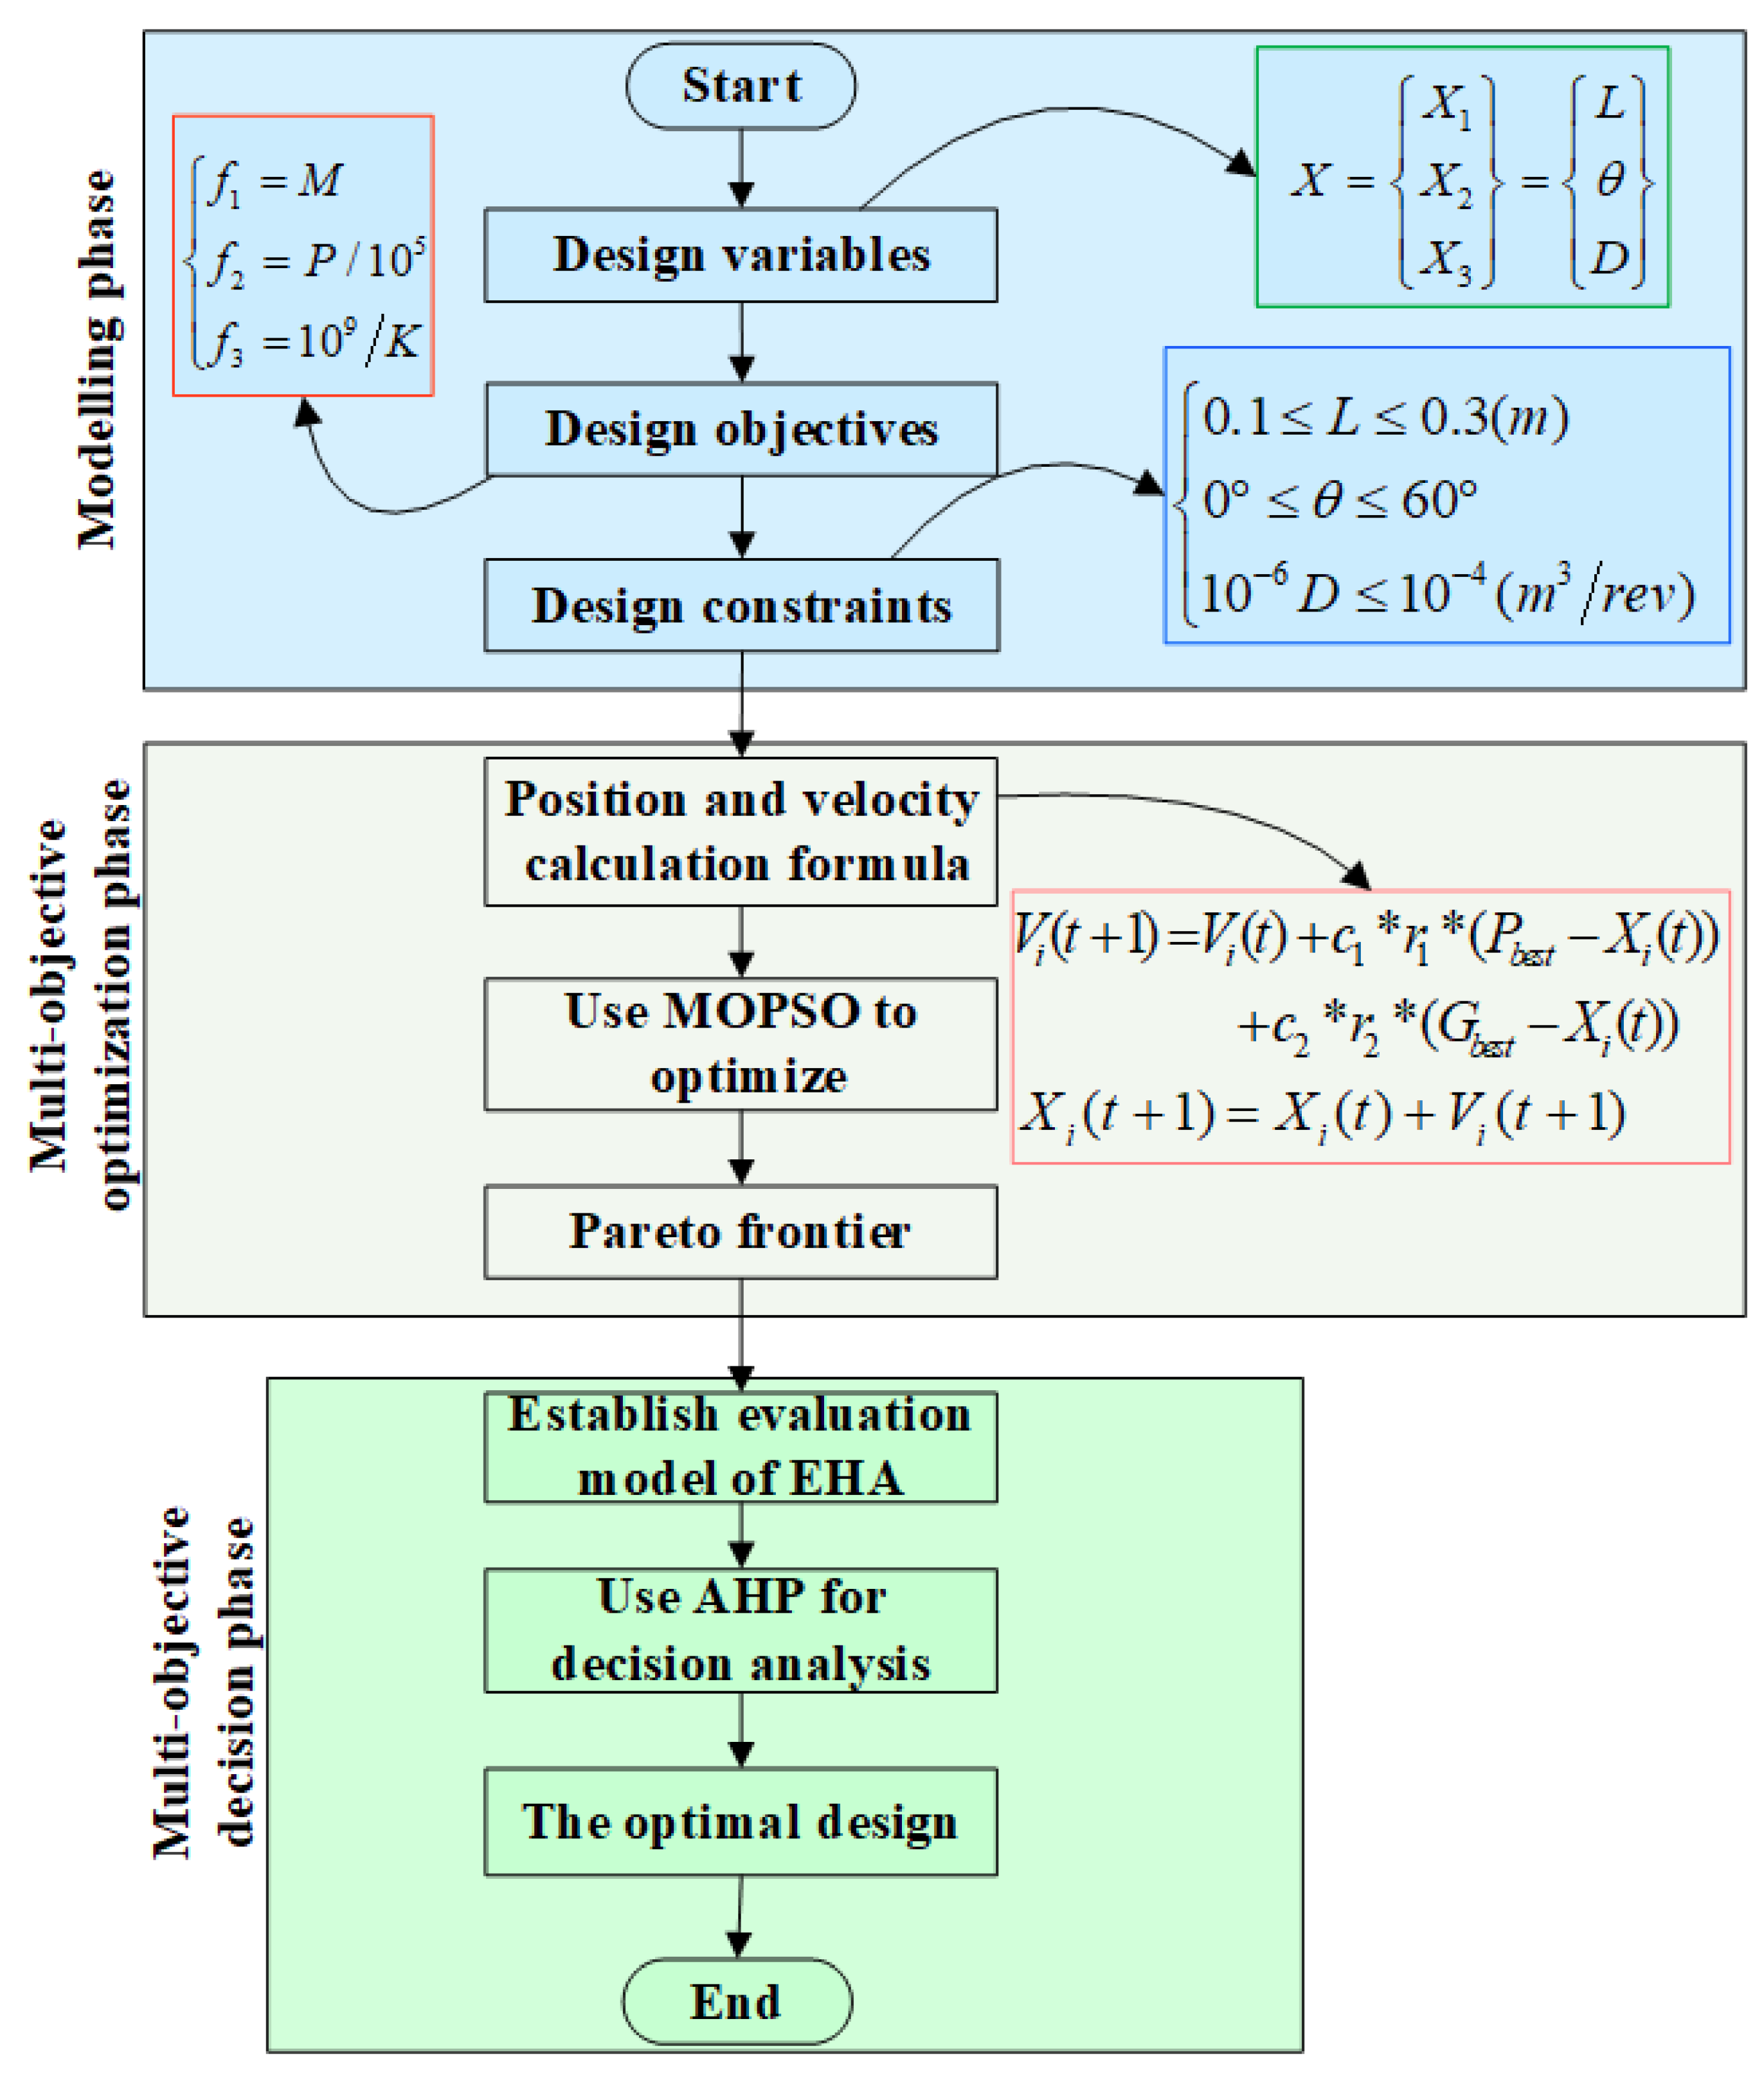
2. Multi-Objective Optimization Model

The flow chat of the proposed multi-objective optimization method of the EHA is shown in Figure 1. The optimization process can be divided into three phases, the modeling phase, the multi-objective optimization phase and the multi-objective decision phase.
The first issue of optimization design is to present the design problem as a mathematical model, which include the arithmetic expression of the design variables, constraint condition and objective function. The general mathematical model of optimal design is as follows [27].
Design variables:
X = ( X 1 , X 2 X n ) T .
Objective function:
min f ( X ) X R n .
Constraint condition:
{ g i ( X ) 0 i = 1 , 2 , 3 m h i ( X ) = 0 i = 1 , 2 , 3 k .

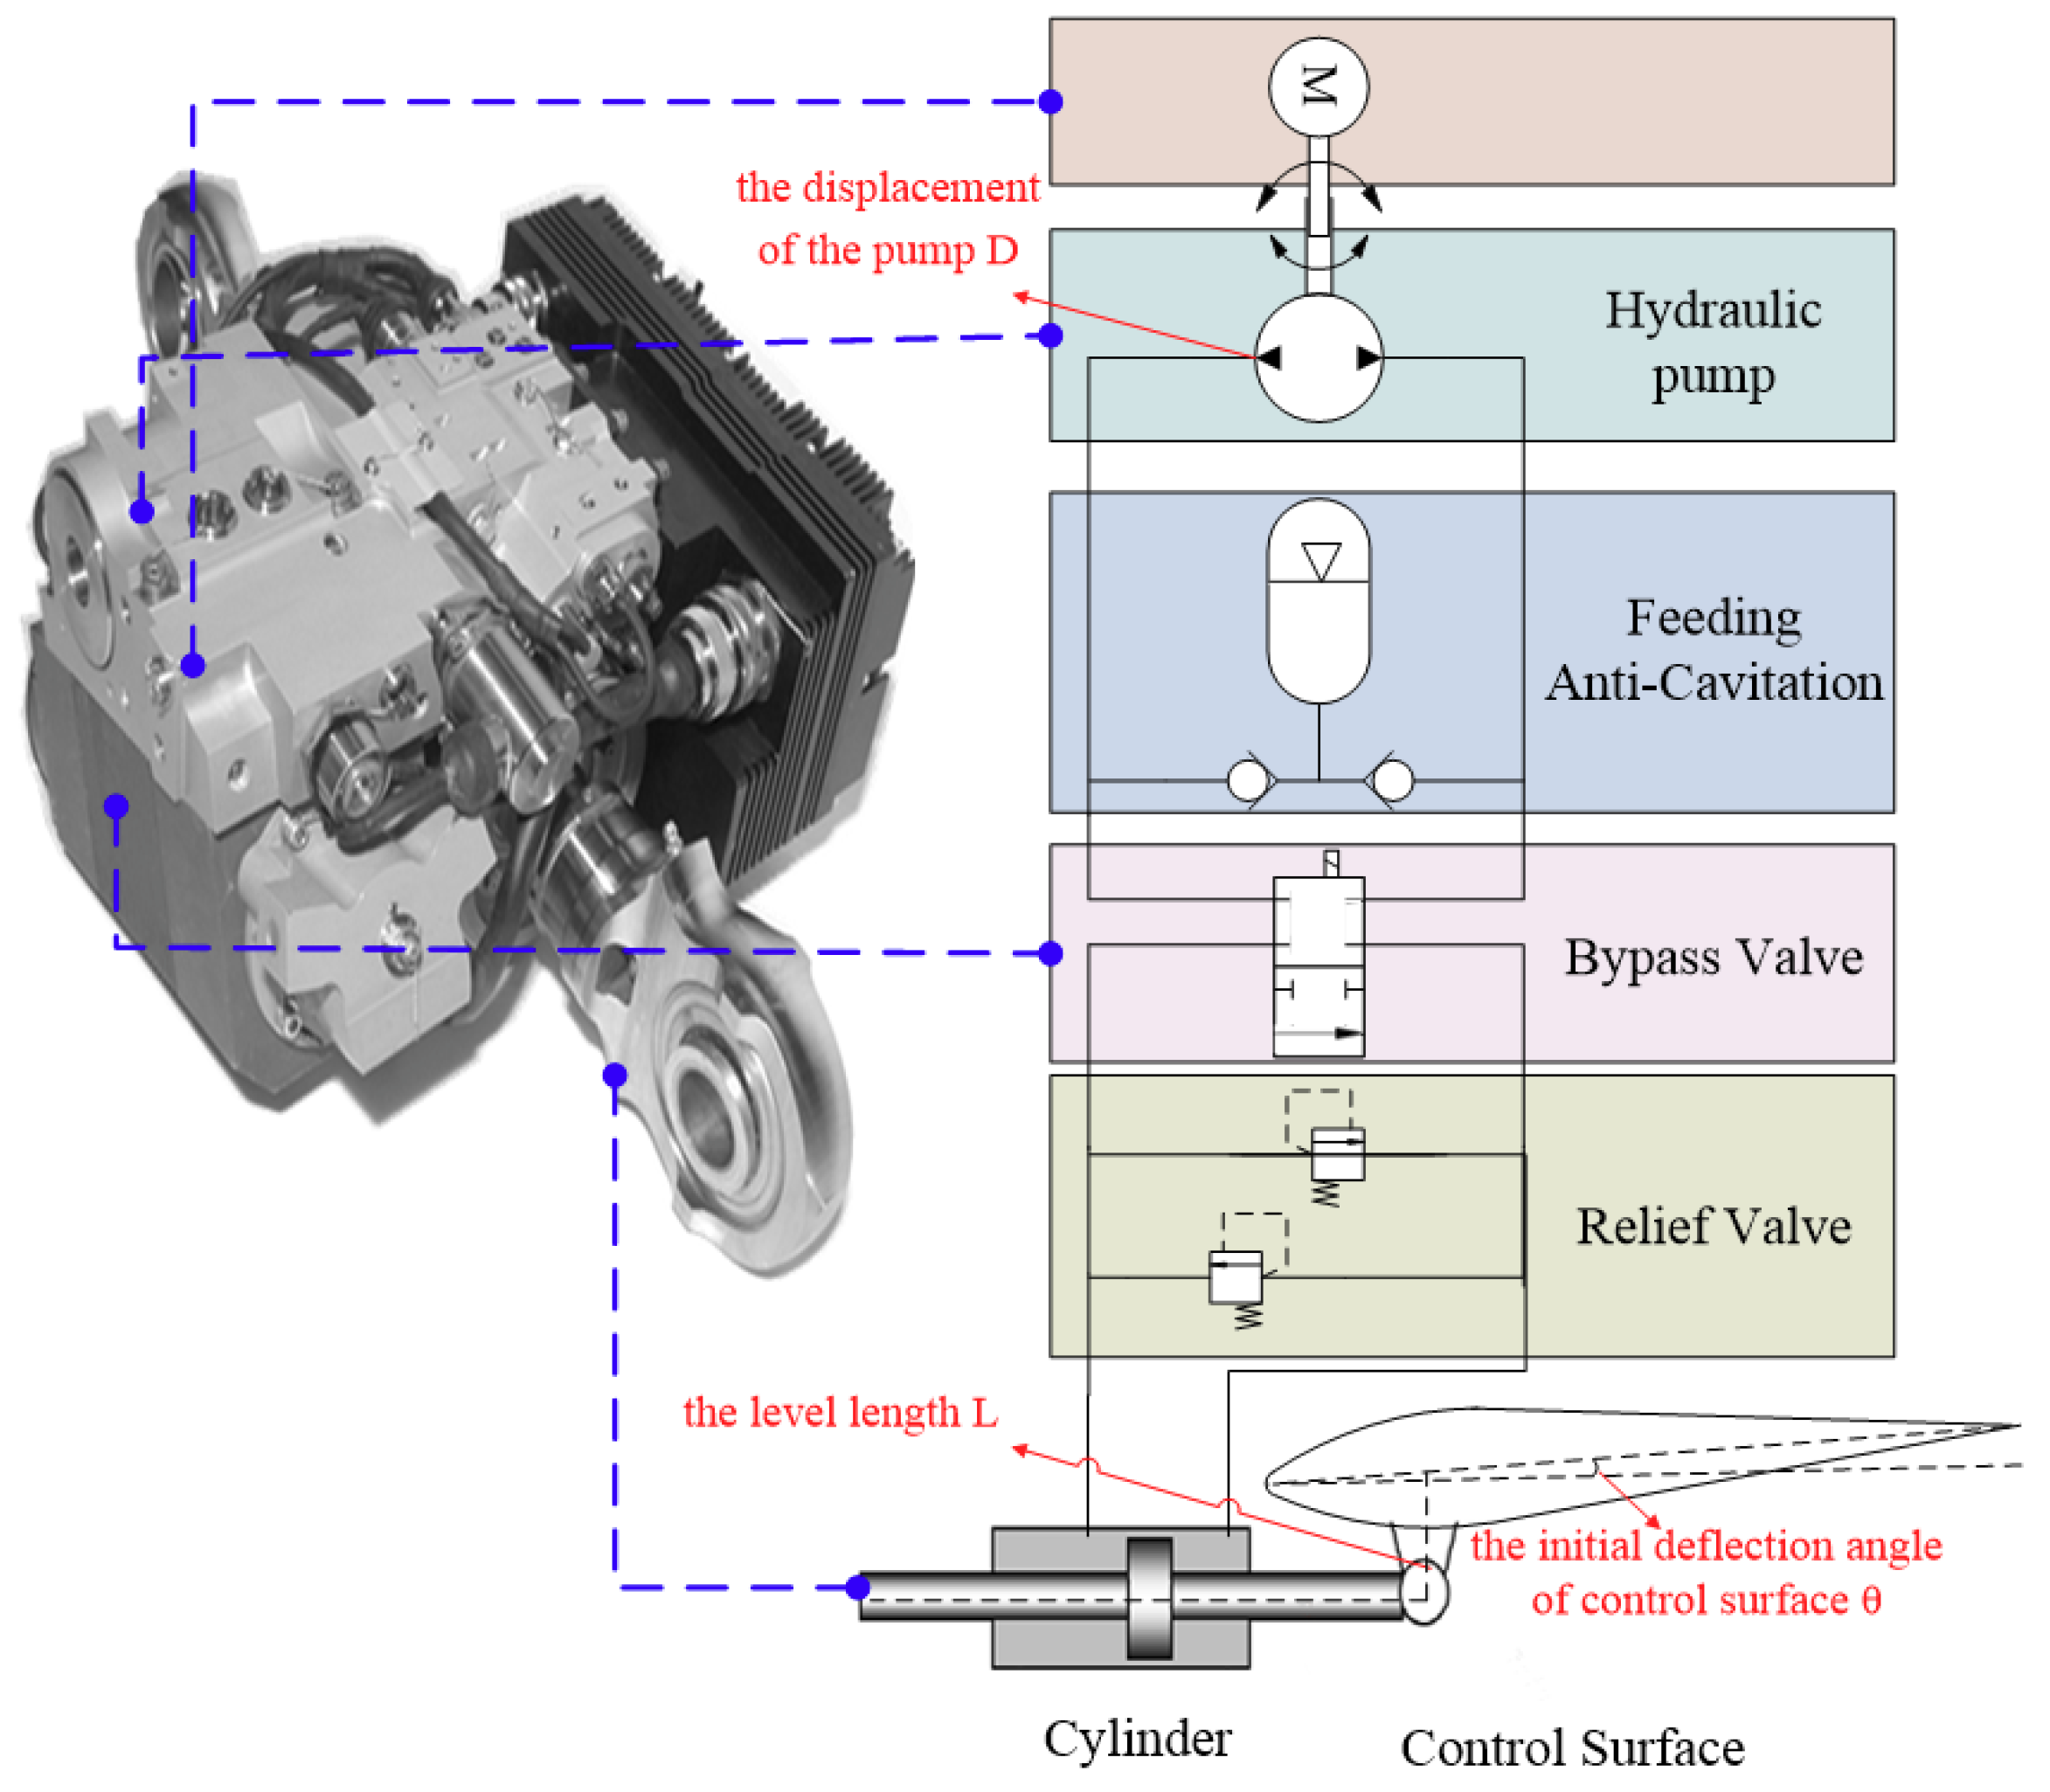
2.1. The Optimization Model of EHA

The structure of the EHA is shown in Figure 2. A servo pump is used to drive a bidirectional pump to control the pressure and the flowrate of the fluid, which in turn drives the piston in a linear motion. The EHA is used for driving the control surface of the aircraft.

2.2. Objective Function

The purpose of optimization design is to find the best solution from the feasible solutions. The best solution can satisfy the objective of design requirements to the utmost extent. The increase of the weight of the EHA will limit the aircraft’s installed power, so weight is an important indicator of the EHA performance. Power consumption is another important performance indicator of the EHA. In the design of actuators, especially high-efficiency actuators, how to reduce the power consumption with the existing technical and equipment conditions is a problem that must be solved by actuator design engineers. At the same time, EHAs have the requirement of working in high-load and highly dynamic contexts, so stiffness must be considered.

2.2.1. Weight

The EHA is divided into four main parts, the cylinder, pump, motor and integration block. The total weight of the EHA can be presented as:
m E H A = m c y l i n d e r + m p u m p + m m o t o r + m b l o c k ,
where m c y l i n d e r is the mass of the cylinder, m p u m p is the mass of the pump, m m o t o r is the mass of the brushless direct-current motor (BLDC), and m b l o c k is the mass of the integration block. In paper [20], it is proposed to use the scaling law to calculate the weights of the pump, motor and integration block.
A permanent magnet brushless direct-current motor is used in the EHA because of the good control performance and high power-to-mass ratio. The weight prediction of the motor can be expressed as in Equation (5), which indicates that the motor mass is a power function of torque with index of 3/3.5 [20].
m m o t o r = 0.628 T 3 / 3.5 + 0.783 ,
where T is the motor torque.
The weight of the hydraulic pump is proportional to the displacement of the pump which can be presented as [20]:
m p u m p = 0.339 D + 2.038 ,
where D is the pump displacement.
The integration block is the frame of the EHA and includes the necessary components such as checking valve, filter and accumulator. The total weight can be estimated by the power of the EHA, which can be presented as [20]:
m b l o c k = 0.105 P E H A + 2 ,
where P E H A is the maximum power of the EHA.
The weight of the hydraulic cylinder consists of the following four parts [20]:
m c y l i n d e r = m r o d + m p i s t o n + m s h e l l + m c o v e r ,
where m r o d is the weight of the plunger rod, m p i s t o n is the weight of the piston, m s h e l l is the weight of the shell, and m c o v e r is the weight of the cylinder cover. They are calculated by the following formula:
{ m r o d = π 4 × d r o d 2 × L r o d × ρ s t e e l m p i s t o n = A × t p i s t o n × ρ c o p p e r m s h e l l = π 4 × ( d s h e l l 2 4 A π ) × L s h e l l × ρ s t e e l m cov e r = 2 × π 4 × d s h e l l 2 × t c o v e r × ρ s t e e l ,
where d r o d is the diameter of the plunger rod, L r o d is the length of the plunger rod, ρ s t e e l is the density of steel, t p i s t o n is the thickness of the piston, ρ c o p p e r is the density of copper, d s h e l l is the diameter of the shell, L s h e l l is the length of the shell, and t c o v e r is the thickness of the piston.

2.2.2. Power Consumption

For EHAs, the motor transforms electrical energy into hydraulic energy, and pushes the cylinder to move the control surface. For an EHA system when its control surface load is certain, the scheme is more energy efficient, which has smaller power consumption of the motor. The torque of the control surface T s , the speed of the control surface ω s and the pressure P s are known design specifications.
As shown in Figure 2, the purpose of reducing the power consumption of the EHA is because it can be converted to reduce the output power of the motor P , which can be expressed as:
P = T × ω ,
where T is the torque of the motor, and ω is the speed of the motor.
The motor is directly connected with the pump, so the torque and speed of the motor and pump are the same. The torque of the pump is shown in the following equation:
T = J p m × d ω d t + K f r i c × ω + ( p f + 2 p p i p e ) × D 2 π ,
where J p m is the moment of inertia of the pump, K f r i c is the viscosity coefficient, J p m × d ω d t = 0 ; when the pump rotates at a constant speed, p f is difference pressure between the two cavities of the cylinder, and p p i p e is the pressure loss in the pipe. Then, Equation (11) can be represented as:
T = K f r i c × ω + ( p f + 2 p p i p e ) × D 2 π ,
where p f = F / A , F is the load force of the EHA, and A is the effective area of the piston.
A = k F P s ,
where k > 1 is a reasonable excess margin [20], and F can be expressed as:
F = T s × sin ( θ + 30 ° ) L .
The flow of pump Q can be expressed as:
Q = Q p u m p + Q p i p e + Q c y l i n d e r ,
where Q p u m p is the leak of the pump, Q p i p e is the flow loss in the hydraulic pipe, and Q c y l i n d e r is the flow of the cylinder.
{ Q p u m p = ξ × ( p 1 - p 2 ) = ξ × F / A Q c y l i n d e r = A × v Q p i p e = 2 × ξ × p p i p e ,
where ξ is the leakage coefficient of the pump, p p i p e is the pressure loss in the pipe, and v is the velocity of the cylinder, which can be represented as:
v = ω s 180 × π × L 1000 × cos ( θ + 30 ° ) .
Then, Equation (15) can be represented as:
Q = D 2 π × ω .
The speed of the pump can be expressed as:
ω = A × v + ξ × F / A + 2 × ξ × p p i p e D / 2 π .

2.2.3. Stiffness

Stiffness is an important indicator to evaluate the performance of an EHA. A low stiffness will reduce control precision and dynamics seriously. The hydraulic spring is the main part that affects the stiffness of an EHA [28]. Therefore, this paper mainly considers the hydraulic spring component in the optimization design of stiffness. The stiffness of an EHA can be expressed as:
1 K = 1 K y ,
where K is the stiffness of the EHA, and K y is the stiffness of a hydraulic spring.
The stiffness of the hydraulic spring can be calculated by the following equation [20]:
K y = 4 E y A S ,
where A is shown in Equation (13), E y is the elasticity modulus of the hydraulic oil, and S is the translational displacement of the cylinder, which can be expressed as:
S = L × sin θ L × sin ( θ 30 ° ) .
Three objective functions are designed as follows:
{ f 1 = M 10 f 2 = P / 10 5 f 3 = 10 9 / K .

2.3. Design Variables

The expression of an objective indicates that there are lots of parameters that should be determined in EHA design. However, considering all these parameters in an optimization process will make it difficult to converge and will take a long time. Therefore, only important parameters that have a large impact on EHA performance should be optimized. In general, the selection principles of the design variables are as follows:
(1)
The number of design variables should be reduced as far as possible. Generally, the number of design variables in mechanical optimization design should not exceed five.
(2)
Choose the parameters that have a great influence on the objective function. Indicators that affect the constraint and performance directly should be selected as design variables.
(3)
The selected variables should be independent.
(4)
The variables should be selected according to the optimization objective.
Since the linkage length L and pump displacement D will decide the size of the motor, pump and actuator, they are important variables that influence the performance of weight. The equation of power consumption indicates that the initial deflection angle θ of the control surface and pump displacement are the two important parameters. The model of stiffness denotes that the linkage length and initial deflection angle are the most important parameters. Therefore, the optimization variables are selected as follows:
X = { X 1 X 2 X 3 } = { L θ D } .

2.4. Constraints

The vector of variables in optimization design is X = ( X 1   X 2 X n ) T . The value of X i should meet certain constraints. With the purpose of getting a feasible optimum design scheme, this paper should not only seek the extreme of the objective function but also should seek to restrict the values of the design variables to make the performance or structure size coincide with the specified values. The restricted condition is called the constraint. In general optimization design, there are two types of constraint, boundary constraint and performance constraint. The boundary constraint considers the limits of design variables directly, while the performance constraint is constrained by the relationship derived from the performance requirements of the mechanical structure.
In this paper, the following constraints are inspected.
{ 100 L 300   ( mm ) 0 ° θ 60 ° 0 . 2 D 2   ( mL / rev ) .

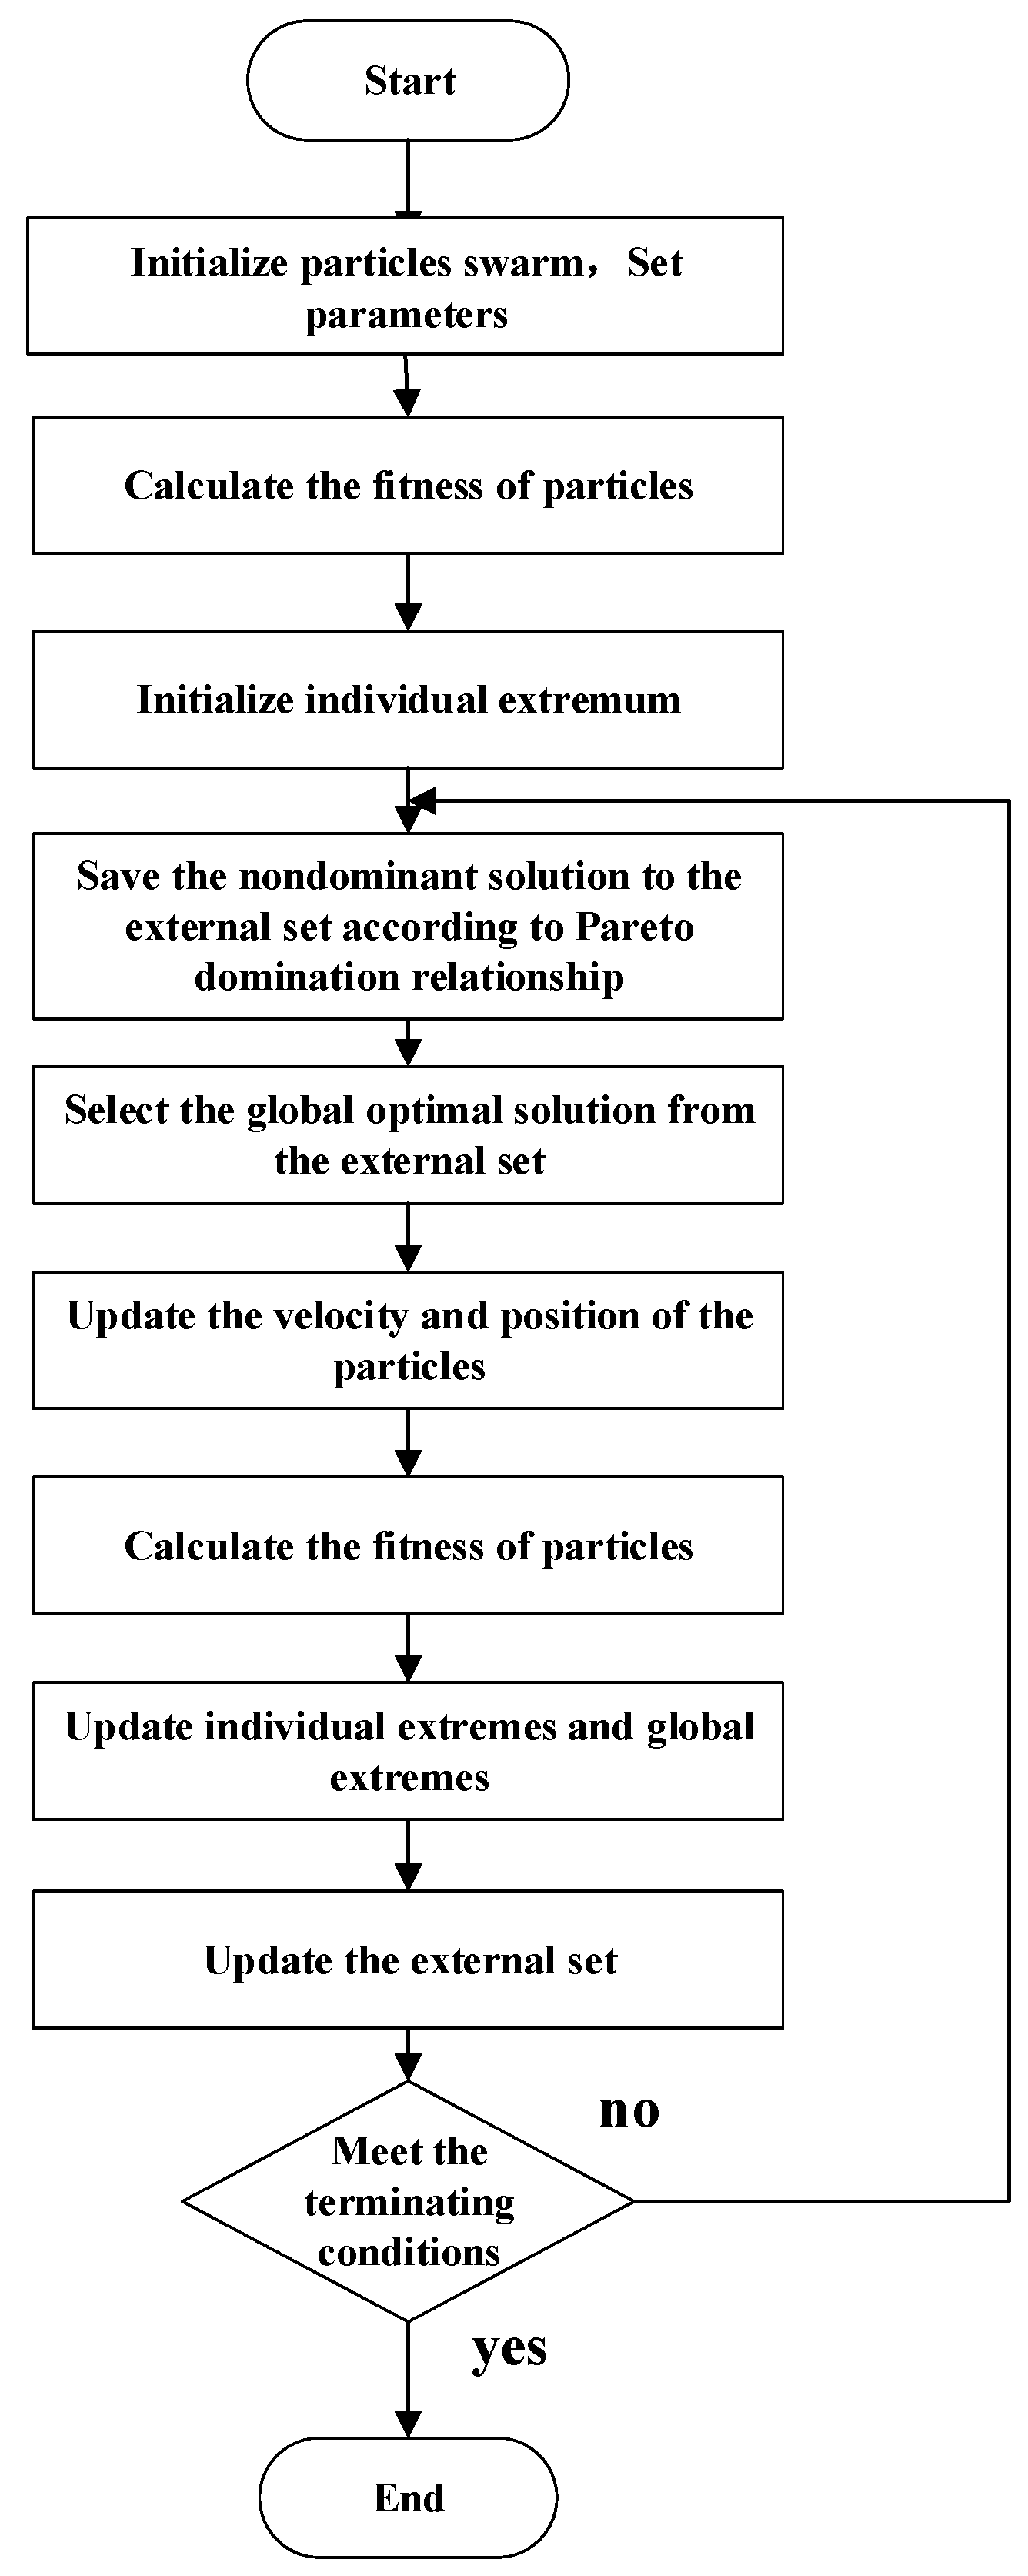
3. Multi-Objective Optimization Algorithm

In this paper, weight f W ( x ) , power consumption f P ( x ) , and stiffness f K ( x ) are selected as objective functions. Various objectives restrict each other via design variables; the optimization of one objective must be at the expense of reducing the character of another, and at the same time, the unit of each objective is different. All of the above issues make it difficult to estimate the quality of a multi-objective scheme objectively. The solution of the multi-objective optimization problem is not a single solution, but an optimal set, in which the elements are called the Pareto optimal solutions. Elements of Pareto optimal solution sets are incomparable if all goals are concerned.
Multi-objective minimization of an EHA can be described as:
min f ( x ) = { f W ( x ) , f P ( x ) , f K ( x ) } x Z R n ,
where Z R n is a feasible solution domain, and E = { f ( x ) | x R n } is a vector space of the objective solution.
The optimization problem in this paper is aimed at EHA design, which is a continuous optimization problem. A PSO algorithm is suitable for optimizing continuous problems, and has strong distributed ability and fast convergence. Most of the multi-objective particle swarm optimization algorithms are based on Pareto theory. Firstly, construct a nondominated set by dominance relation. Secondly, compare the quality of particles by dominance relation and construct an external set. Finally, deposit all the nondominated sets and guide nondominated sets close to the Pareto optimal front rapidly. A flow diagram of a multi-objective particle swarm optimization algorithm is shown in Figure 3.
(1)
Initialize the particle swarm, set parameters and maximum iterations, the dimensions of the particles are three ( x L , x θ , x D ), and number of particles is 100.
(2)
Set the velocity and initial position of particles, and limit the value range of velocity. If the particle is out of range, give it an opposite speed to make the particle optimize in the correct range.
(3)
Put the velocity and position of particles into the objective function f W ( x ) , f P ( x ) , f K ( x ) , and obtain the values of the fitness function of each particle.
(4)
Select the nondominated particles according to the Pareto dominance relation and put them into the nondominated set.
(5)
Update the velocity and position of the particles according to the modified multi-objective particle swarm optimization algorithm.
(6)
Put the updated velocity and position of the particles into the objective function f W ( x ) , f P ( x ) , f K ( x ) , and obtain the updated fitness values. After comparing to the particles deposited in the nondominated set according to the Pareto dominance relation, deposit the nondominated values and delete the dominated values.
(7)
Put the particles in the nondominated set into the external set. If the number of particles deposited is larger than the maximum storage of the external set, the method of crowding distance should be applied and redundant inferior solutions should be deleted.
(8)
Put the particles in the external set in descending order.
(9)
Determine whether the number of iterations has been reached or not. If the maximum number of iterations is not reached, turn to step 5 and continue to iterate; if the maximum number of iterations is reached, export the particles in the external set and take them as the non-inferior solution set of the objective function.

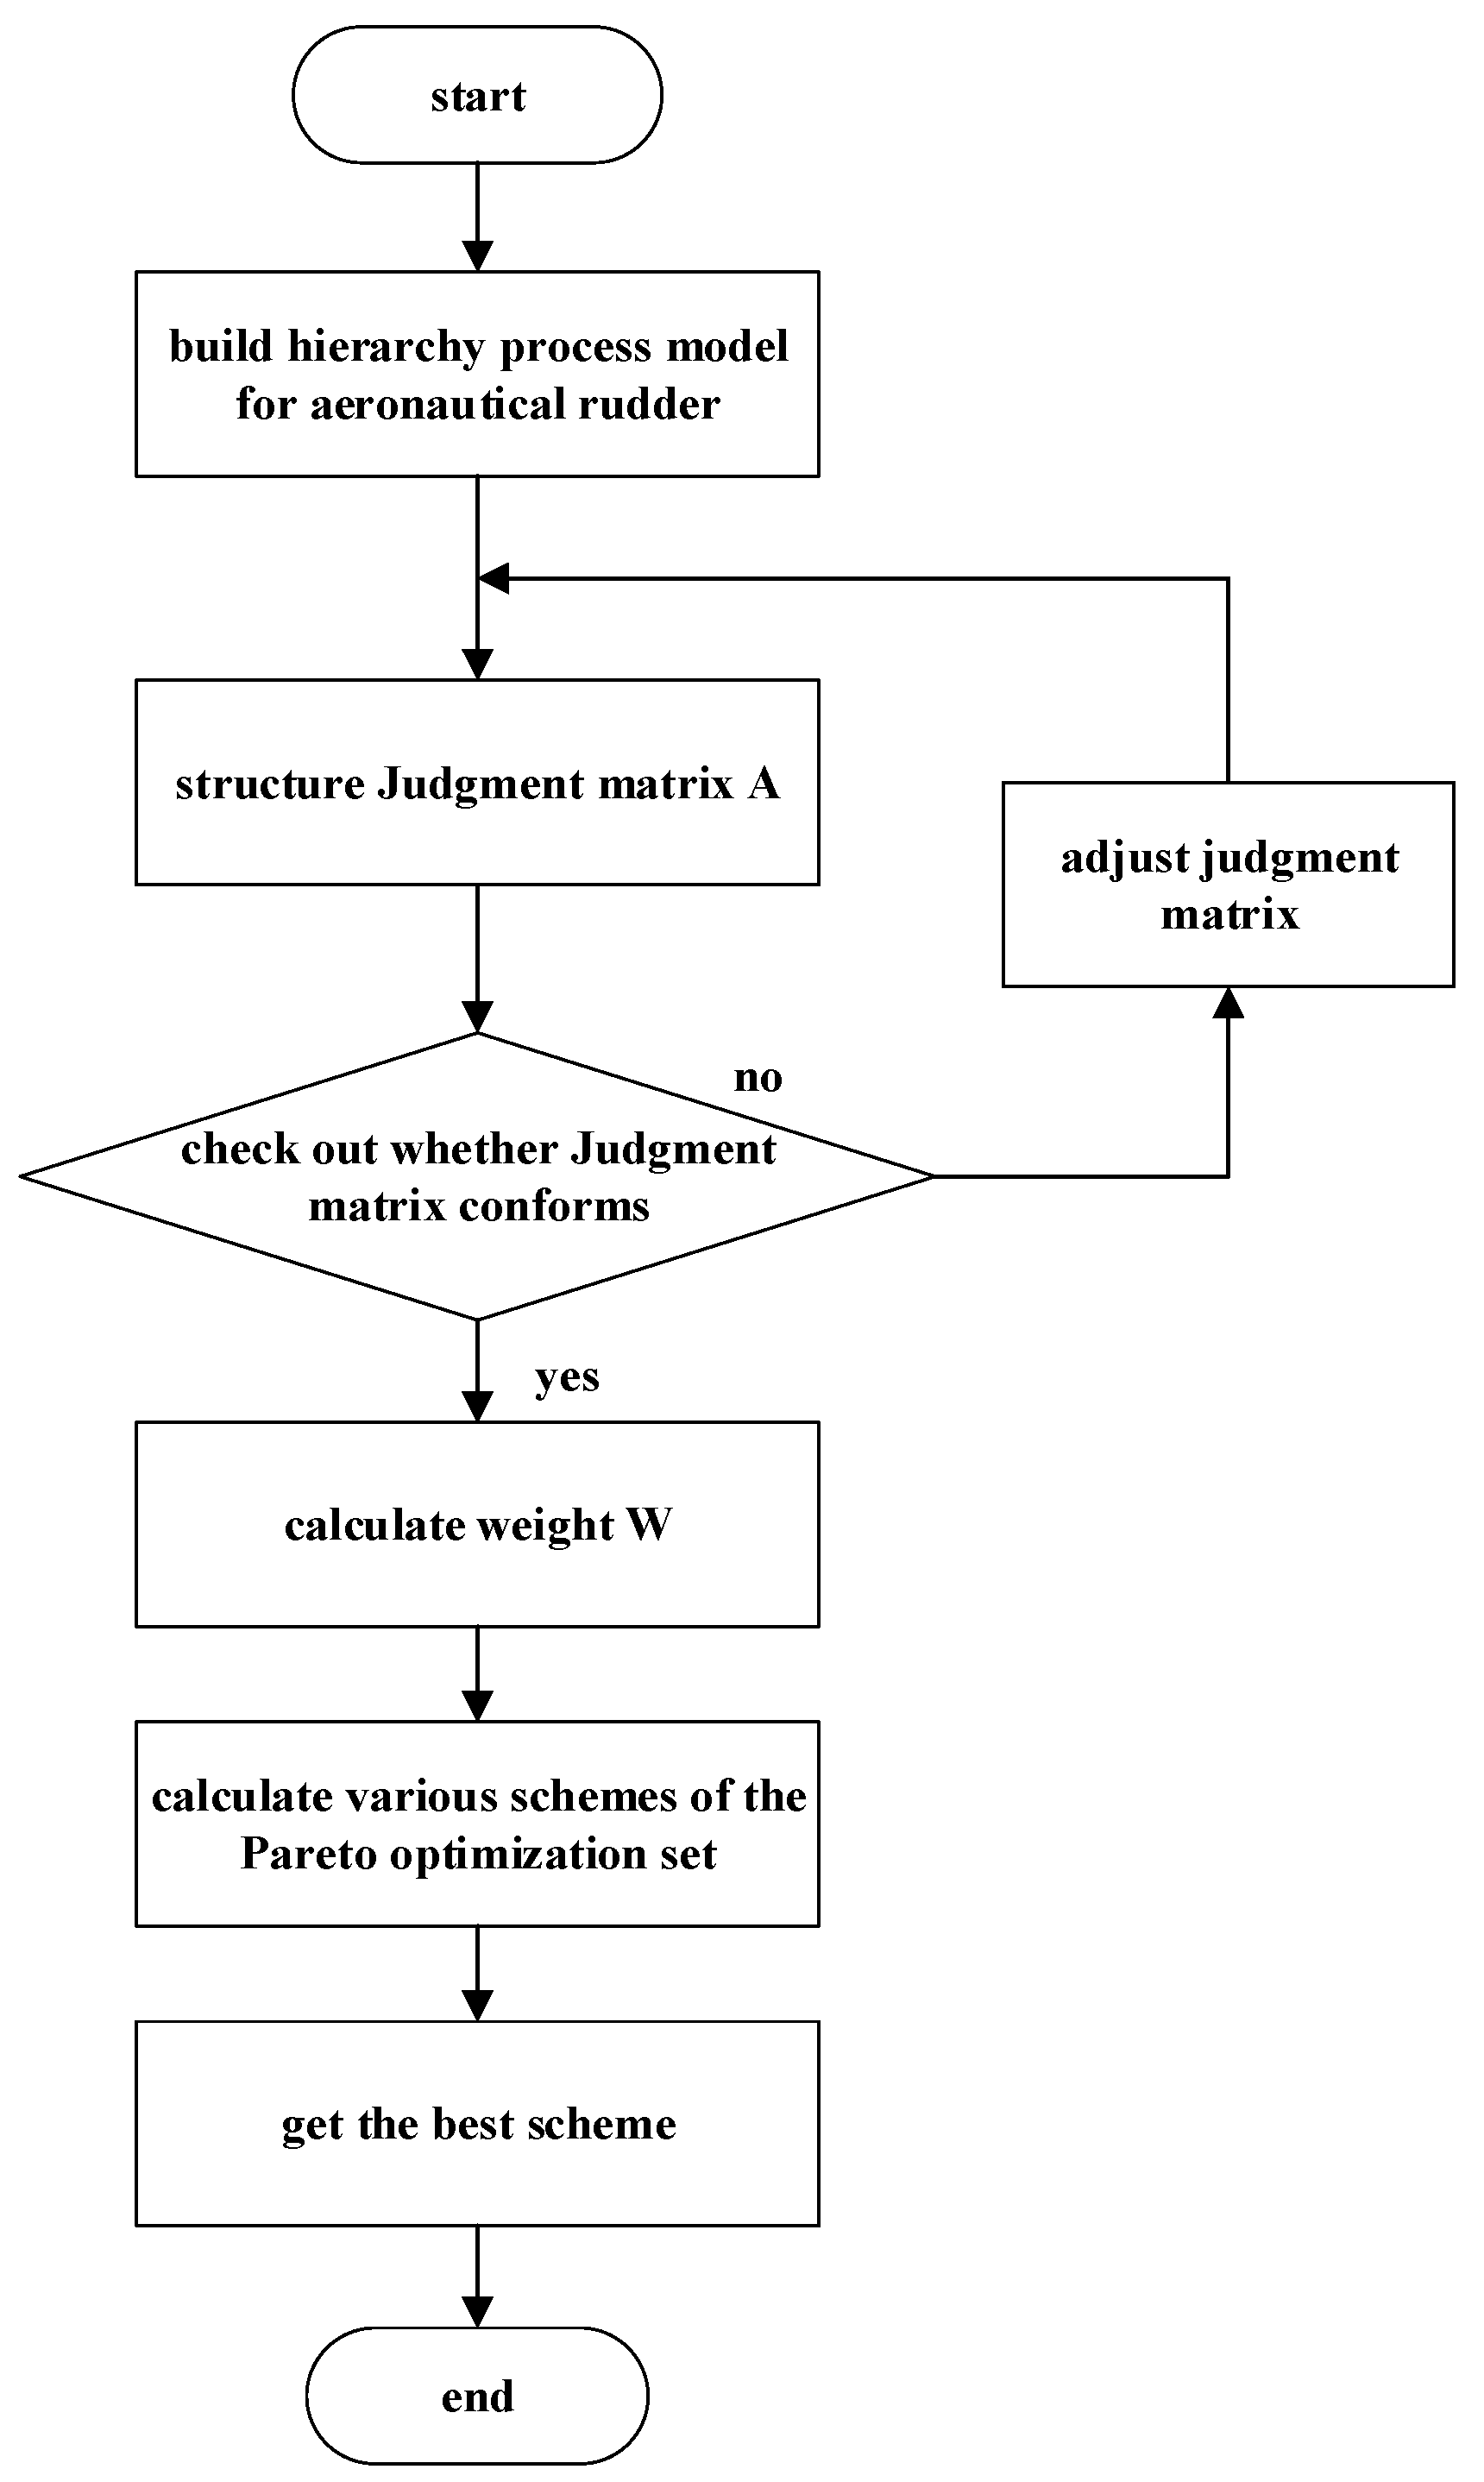
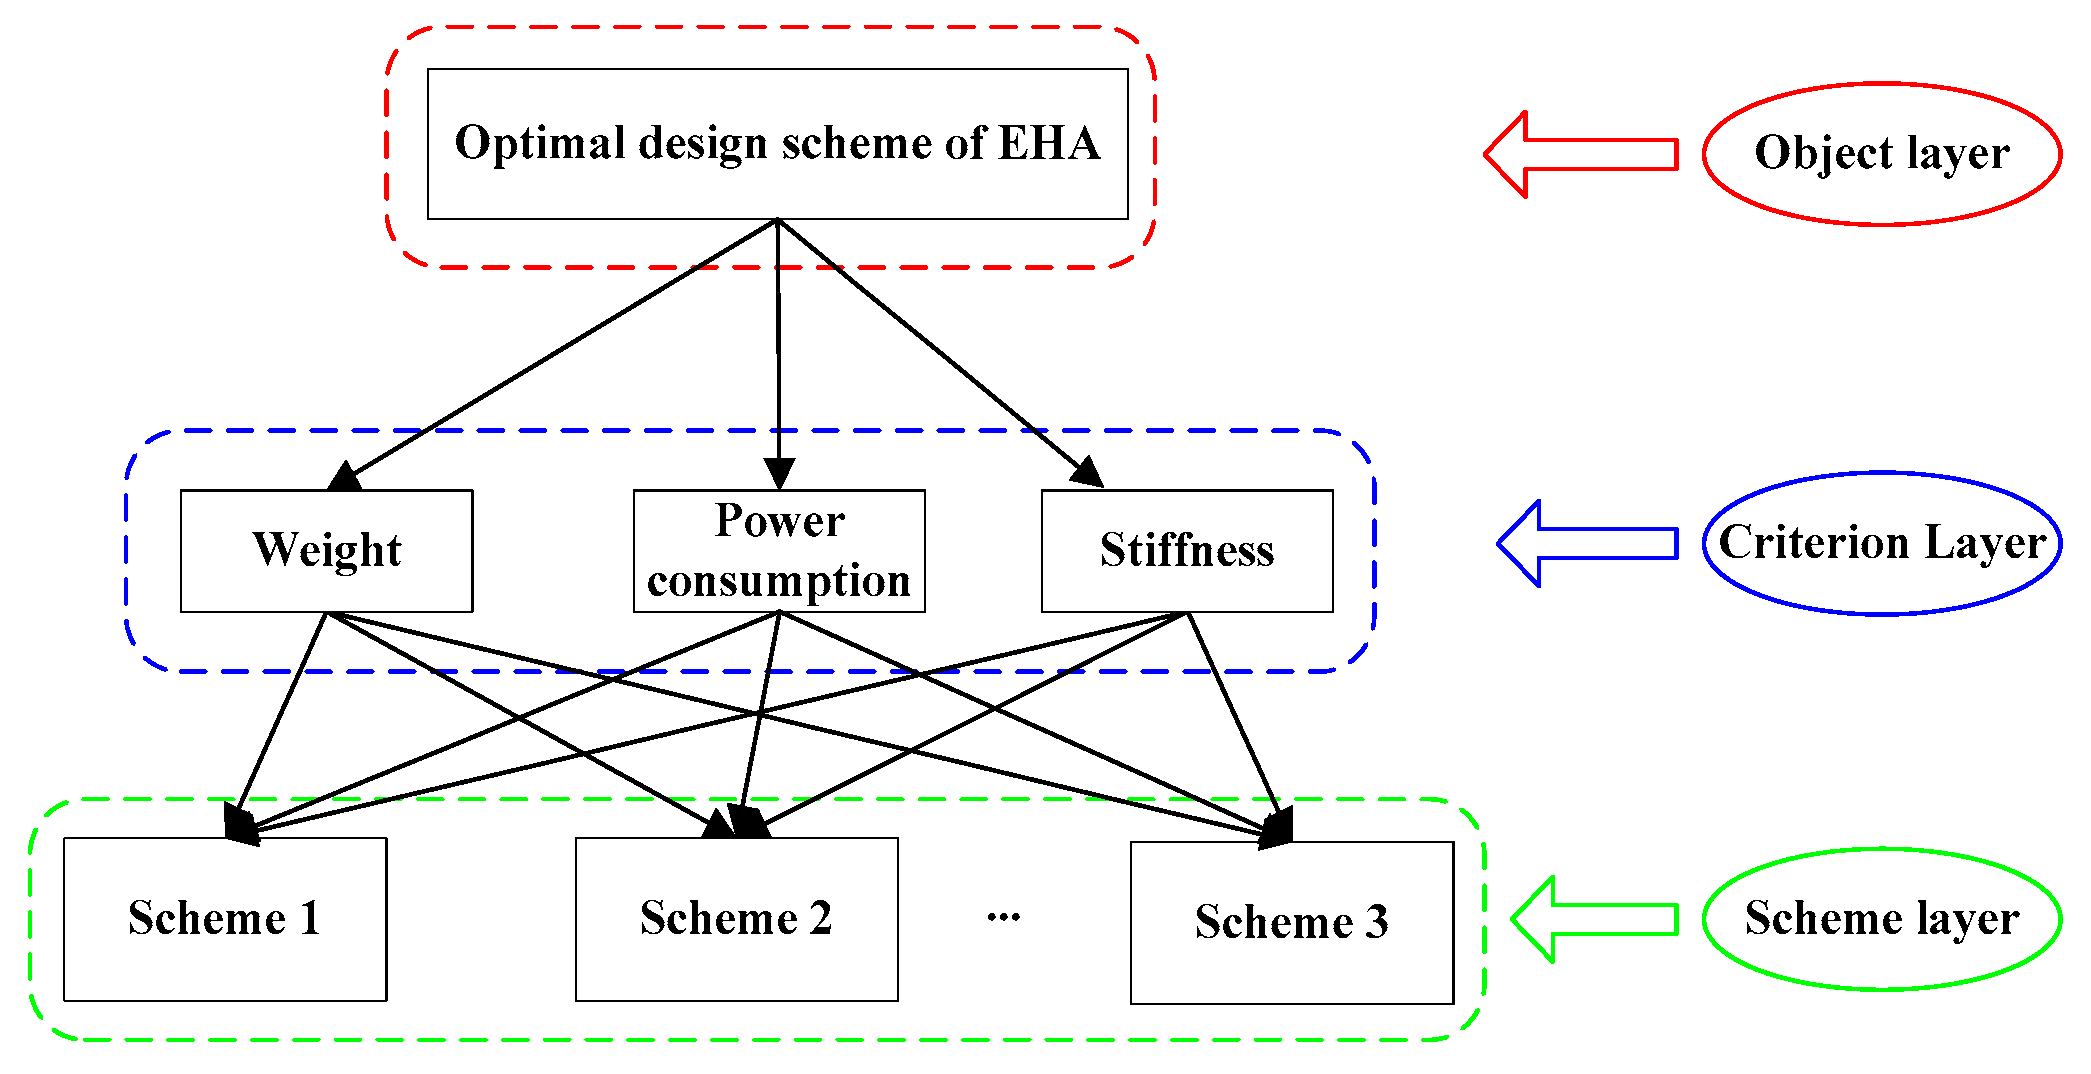
4. Multi-Criterion Decision Making Technique

The analytic hierarchy process is a multi-objective decision analysis method combining qualitative and quantitative analysis, in which elements related to task decisions are decomposed into the object level, criteria level and scheme level. The AHP mathematizes the decision process using a small amount of quantitative data on the base of deep analysis, including the influence factors and internal relations of the decision making problems. AHP can provide a simple decision method for complex decision problems with multiple criteria and no obvious structural characteristics. Questions to be assessed in EHA optimization design should be methodized and layered, and the structural model of hierarchical analysis should be established. A three-level hierarchical framework for an EHA is shown in Figure 4. Level one is the overall goal of decision making, which is the optimal design of an EHA. The second level is the objectives, in which weight, power consumption and stiffness are used as assessment criteria of EHA multi-objective optimization design. The third level is the schemes, in which the solutions are identified in the Pareto frontier obtained by the MOPSO method.
The analytic hierarchy process is used to get the optimal design from the Pareto frontier, which is obtained above by the conventional process. The analytic hierarchy process consists of structuring a judgment matrix, calculating weight coefficients, verifying the consistency of the judgment matrix, and calculating weight coefficients of goal levels. The process is shown in Figure 5.
(1)
Establish the decision model for AHP as shown in Figure 4.
(2)
Structure the judgment matrix J . Judgment matrix is constructed according to the relationships between the objectives in the criteria layer.
J = [ 1 1 3 1 9 3 1 1 7 9 7 1 ] .
(3)
Verify the consistency of the judgment matrix. Coincidence indicator C I is calculated as follows:
{ C I = λ max n n 1 C R = C I R I ,
where C I is the coincidence indicator of the judgment matrix, R I is the average random consistence indicator of the judgment matrix (specific values are in Table 1), C R is the random consistence ratio of the judgment matrix, λ max is the maximum value of the matrix eigenvalue, and n is the order of the judgment matrix.
By calculation, if λ max = 3.08 , and C I = ( 3.08 3 ) / ( 3 1 ) = 0.04 , then C R = 0 . 04 / 0 . 58 = 0 . 07 < 0 . 1 , which means the weight matrix is consistent. If the consistency check is not satisfied, return to step 2 where the judgment matrix should be reconstructed.
(4)
Calculate the weight coefficient between the compared elements with the corresponding criteria. Calculate the continued product M i of every row element in A , the product of each row element and its n-th root w ¯ 1 .
{ M i = i = 1 n x i j = [ 1 27 3 7 63 ] T , i = 1 , , n w ¯ 1 = M i n = [ 0.3333 0.7539 3.9791 ] T , i = 1 , , n .
Normalize w ¯ 1 as W i = w ¯ 1 / i = 1 n w ¯ 1 , W i is the weight coefficient of each factor.
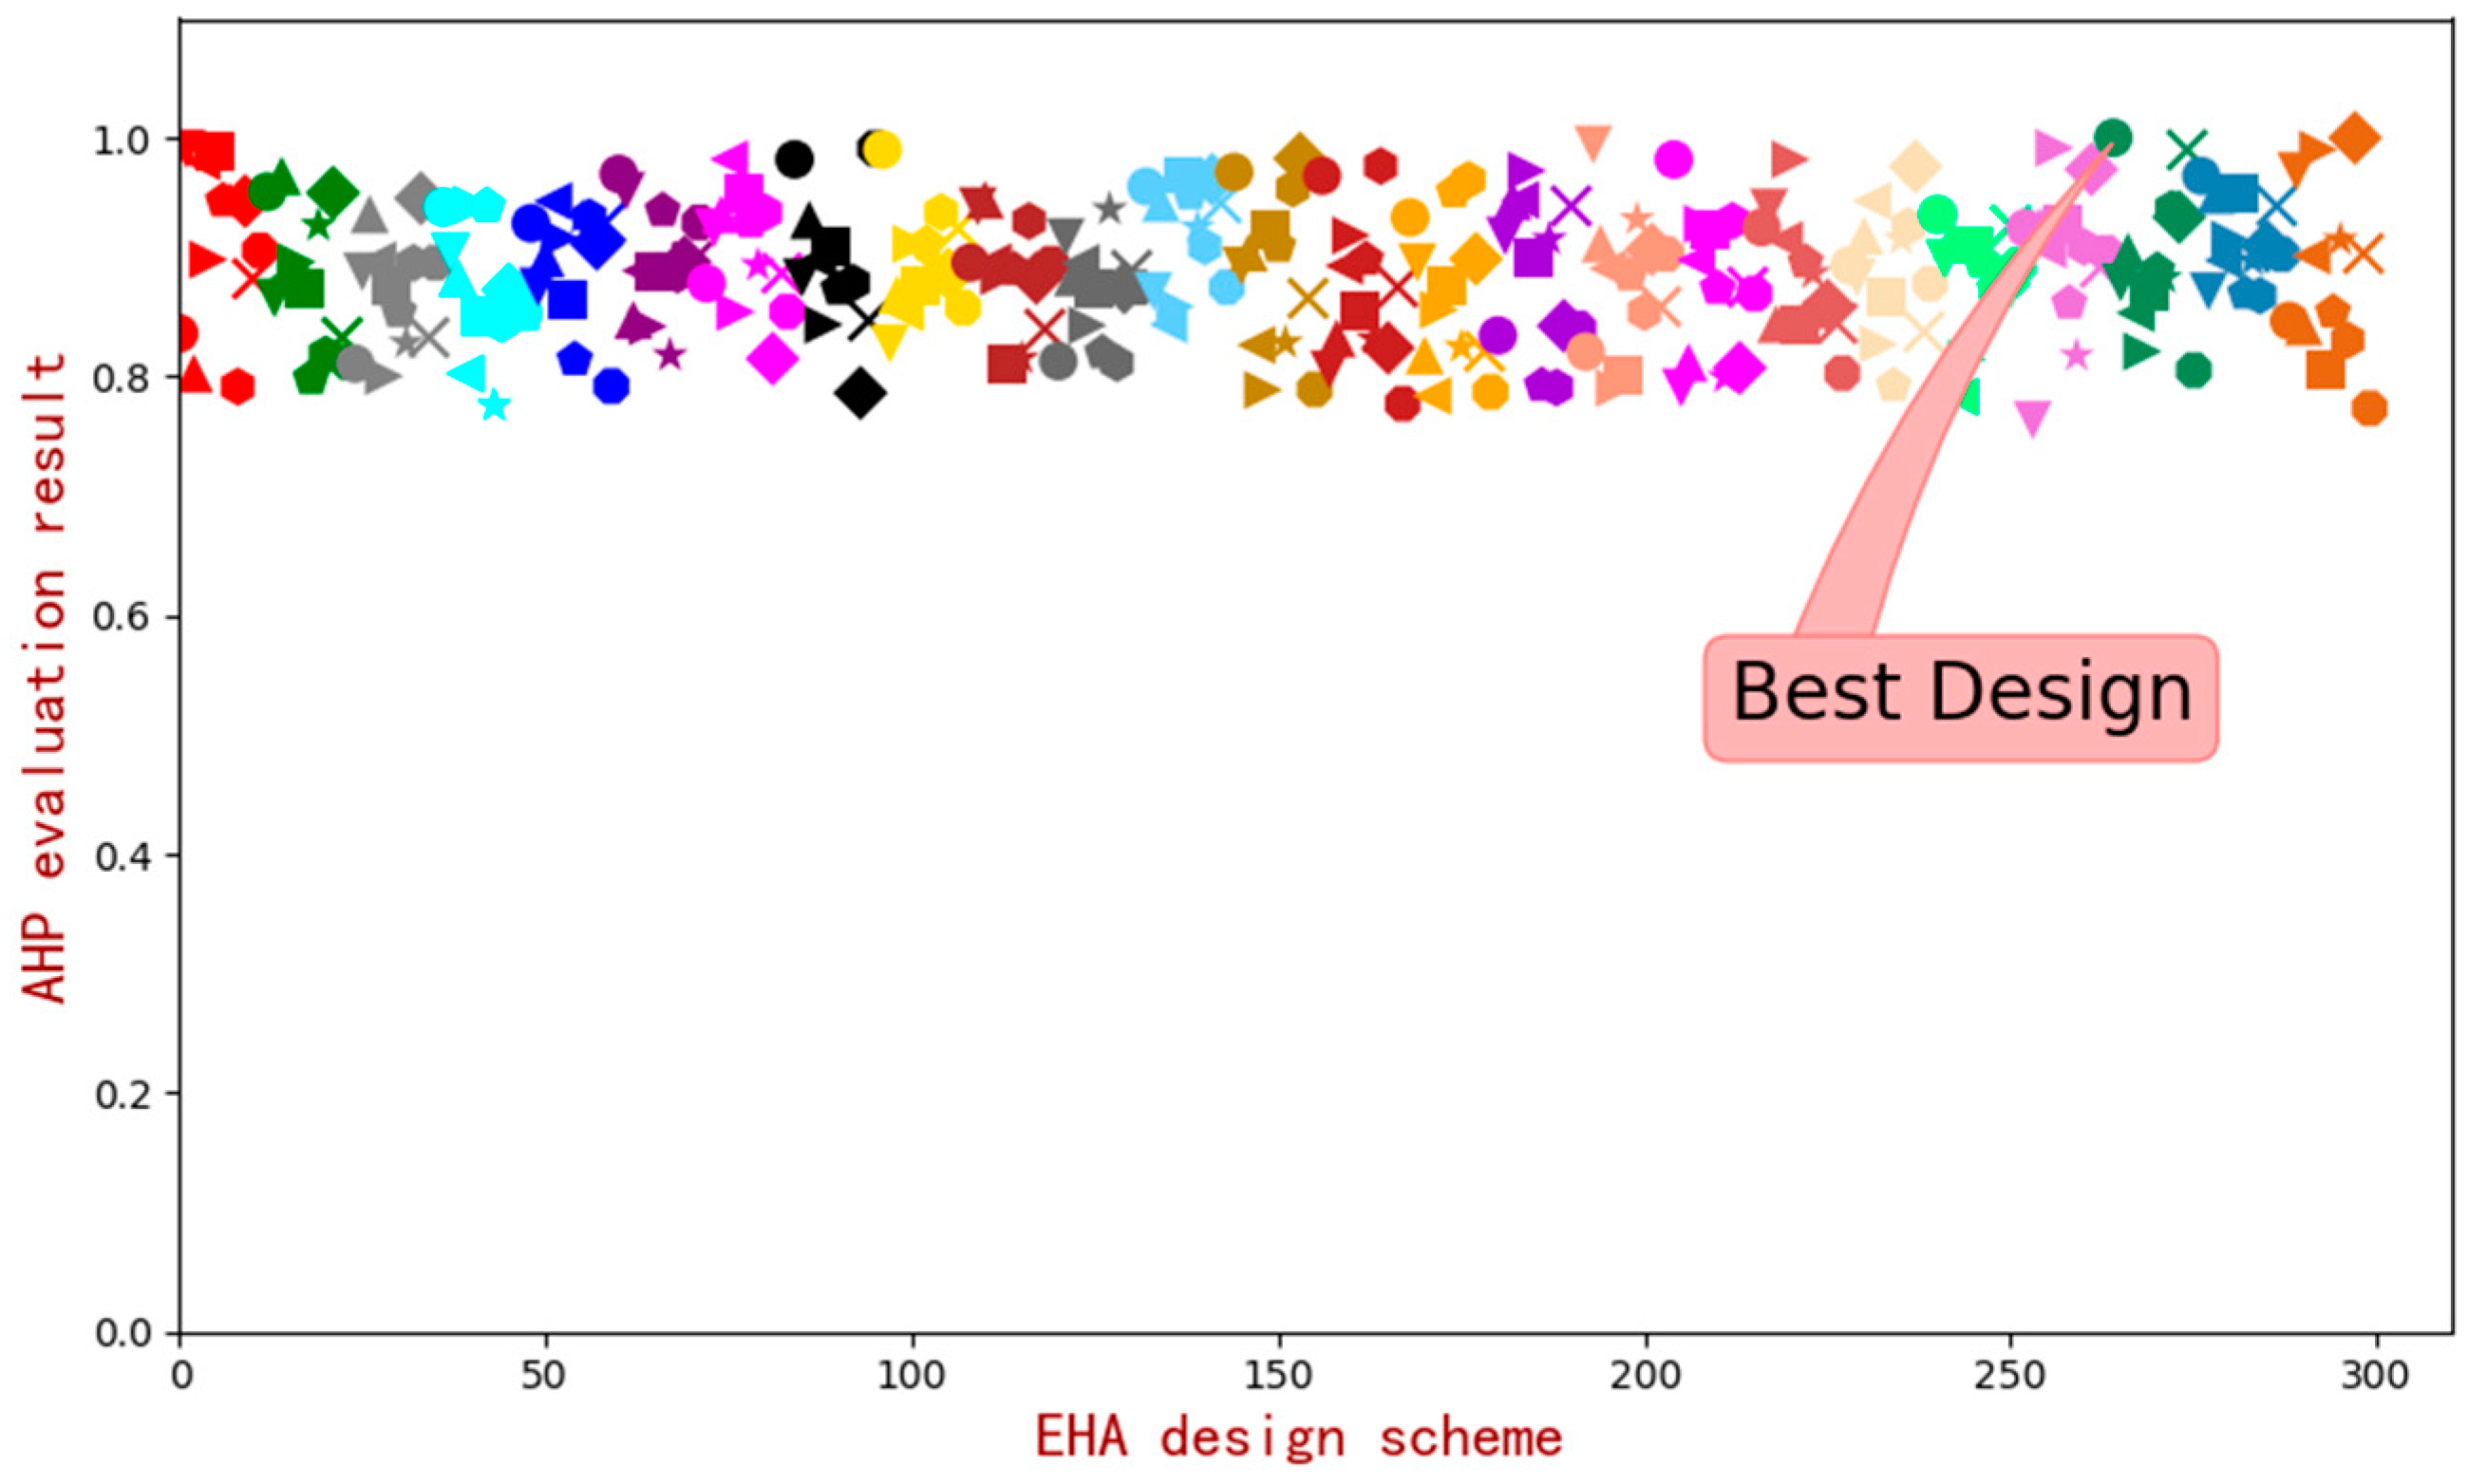
W = [ 0 . 066 0 . 149 0 . 785 ] .
(5)
Estimate the designs in the Pareto frontier according to the weight coefficients of each criterion, and then get the optimal design of the EHA.

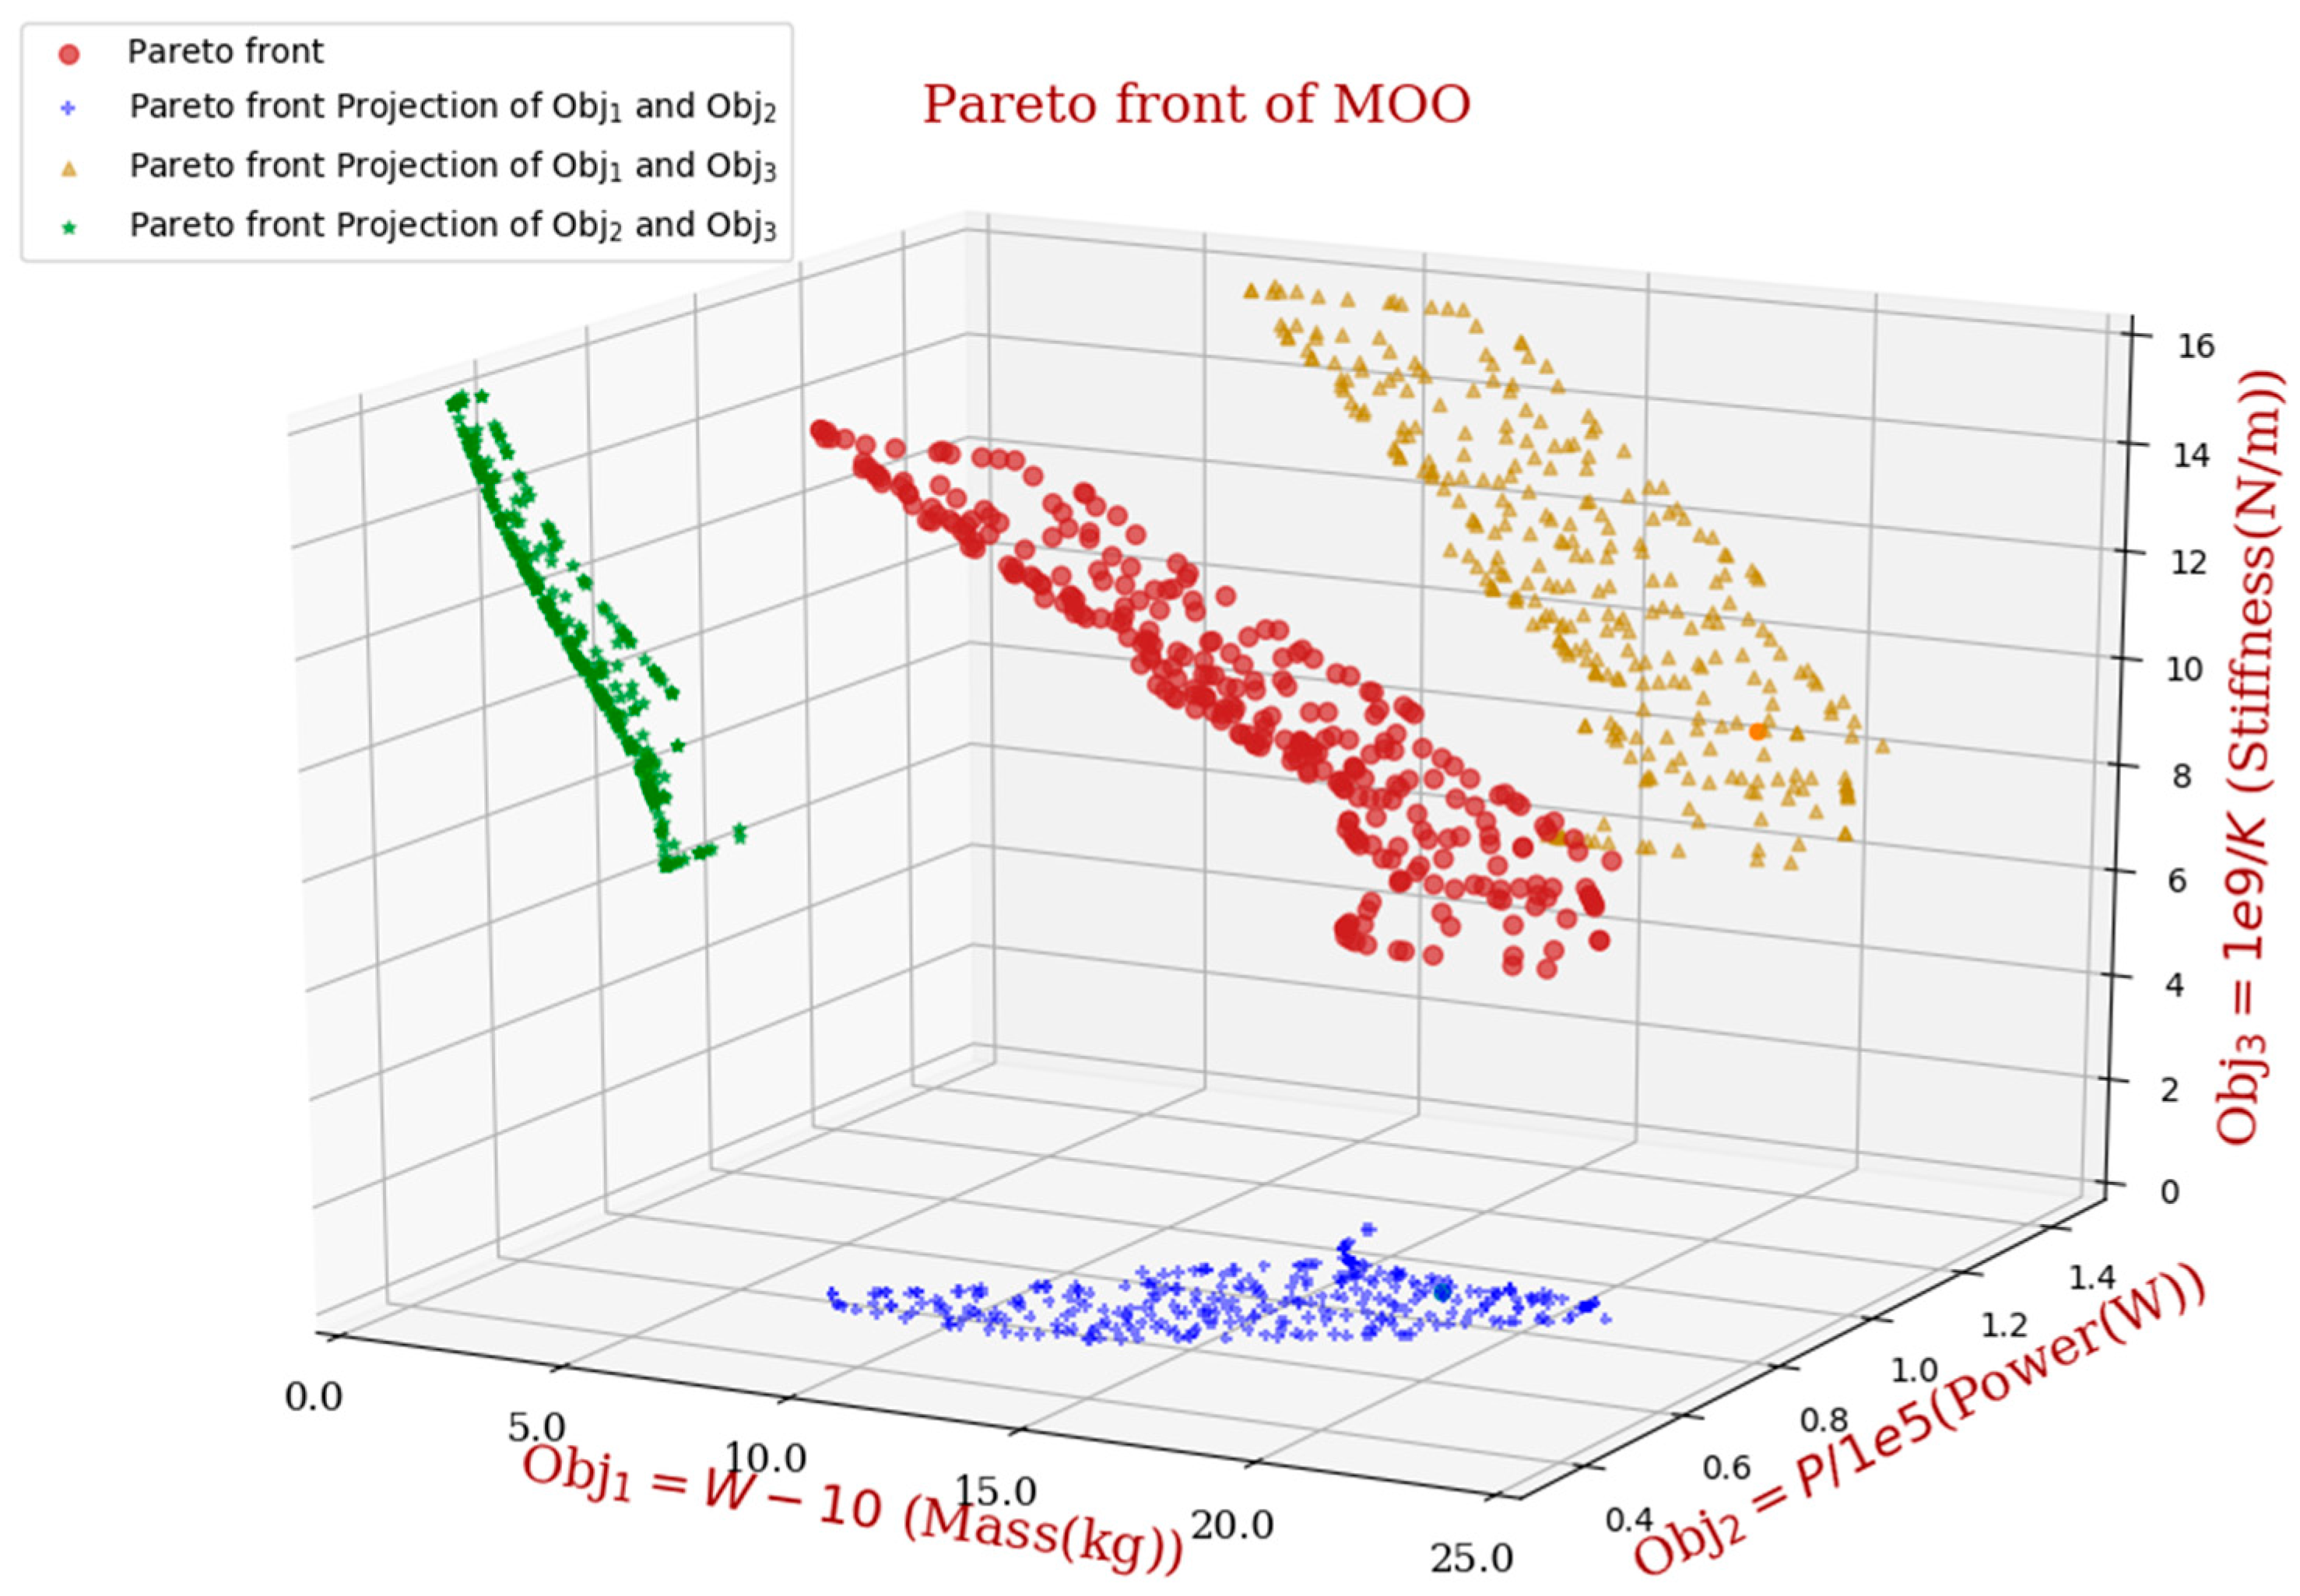
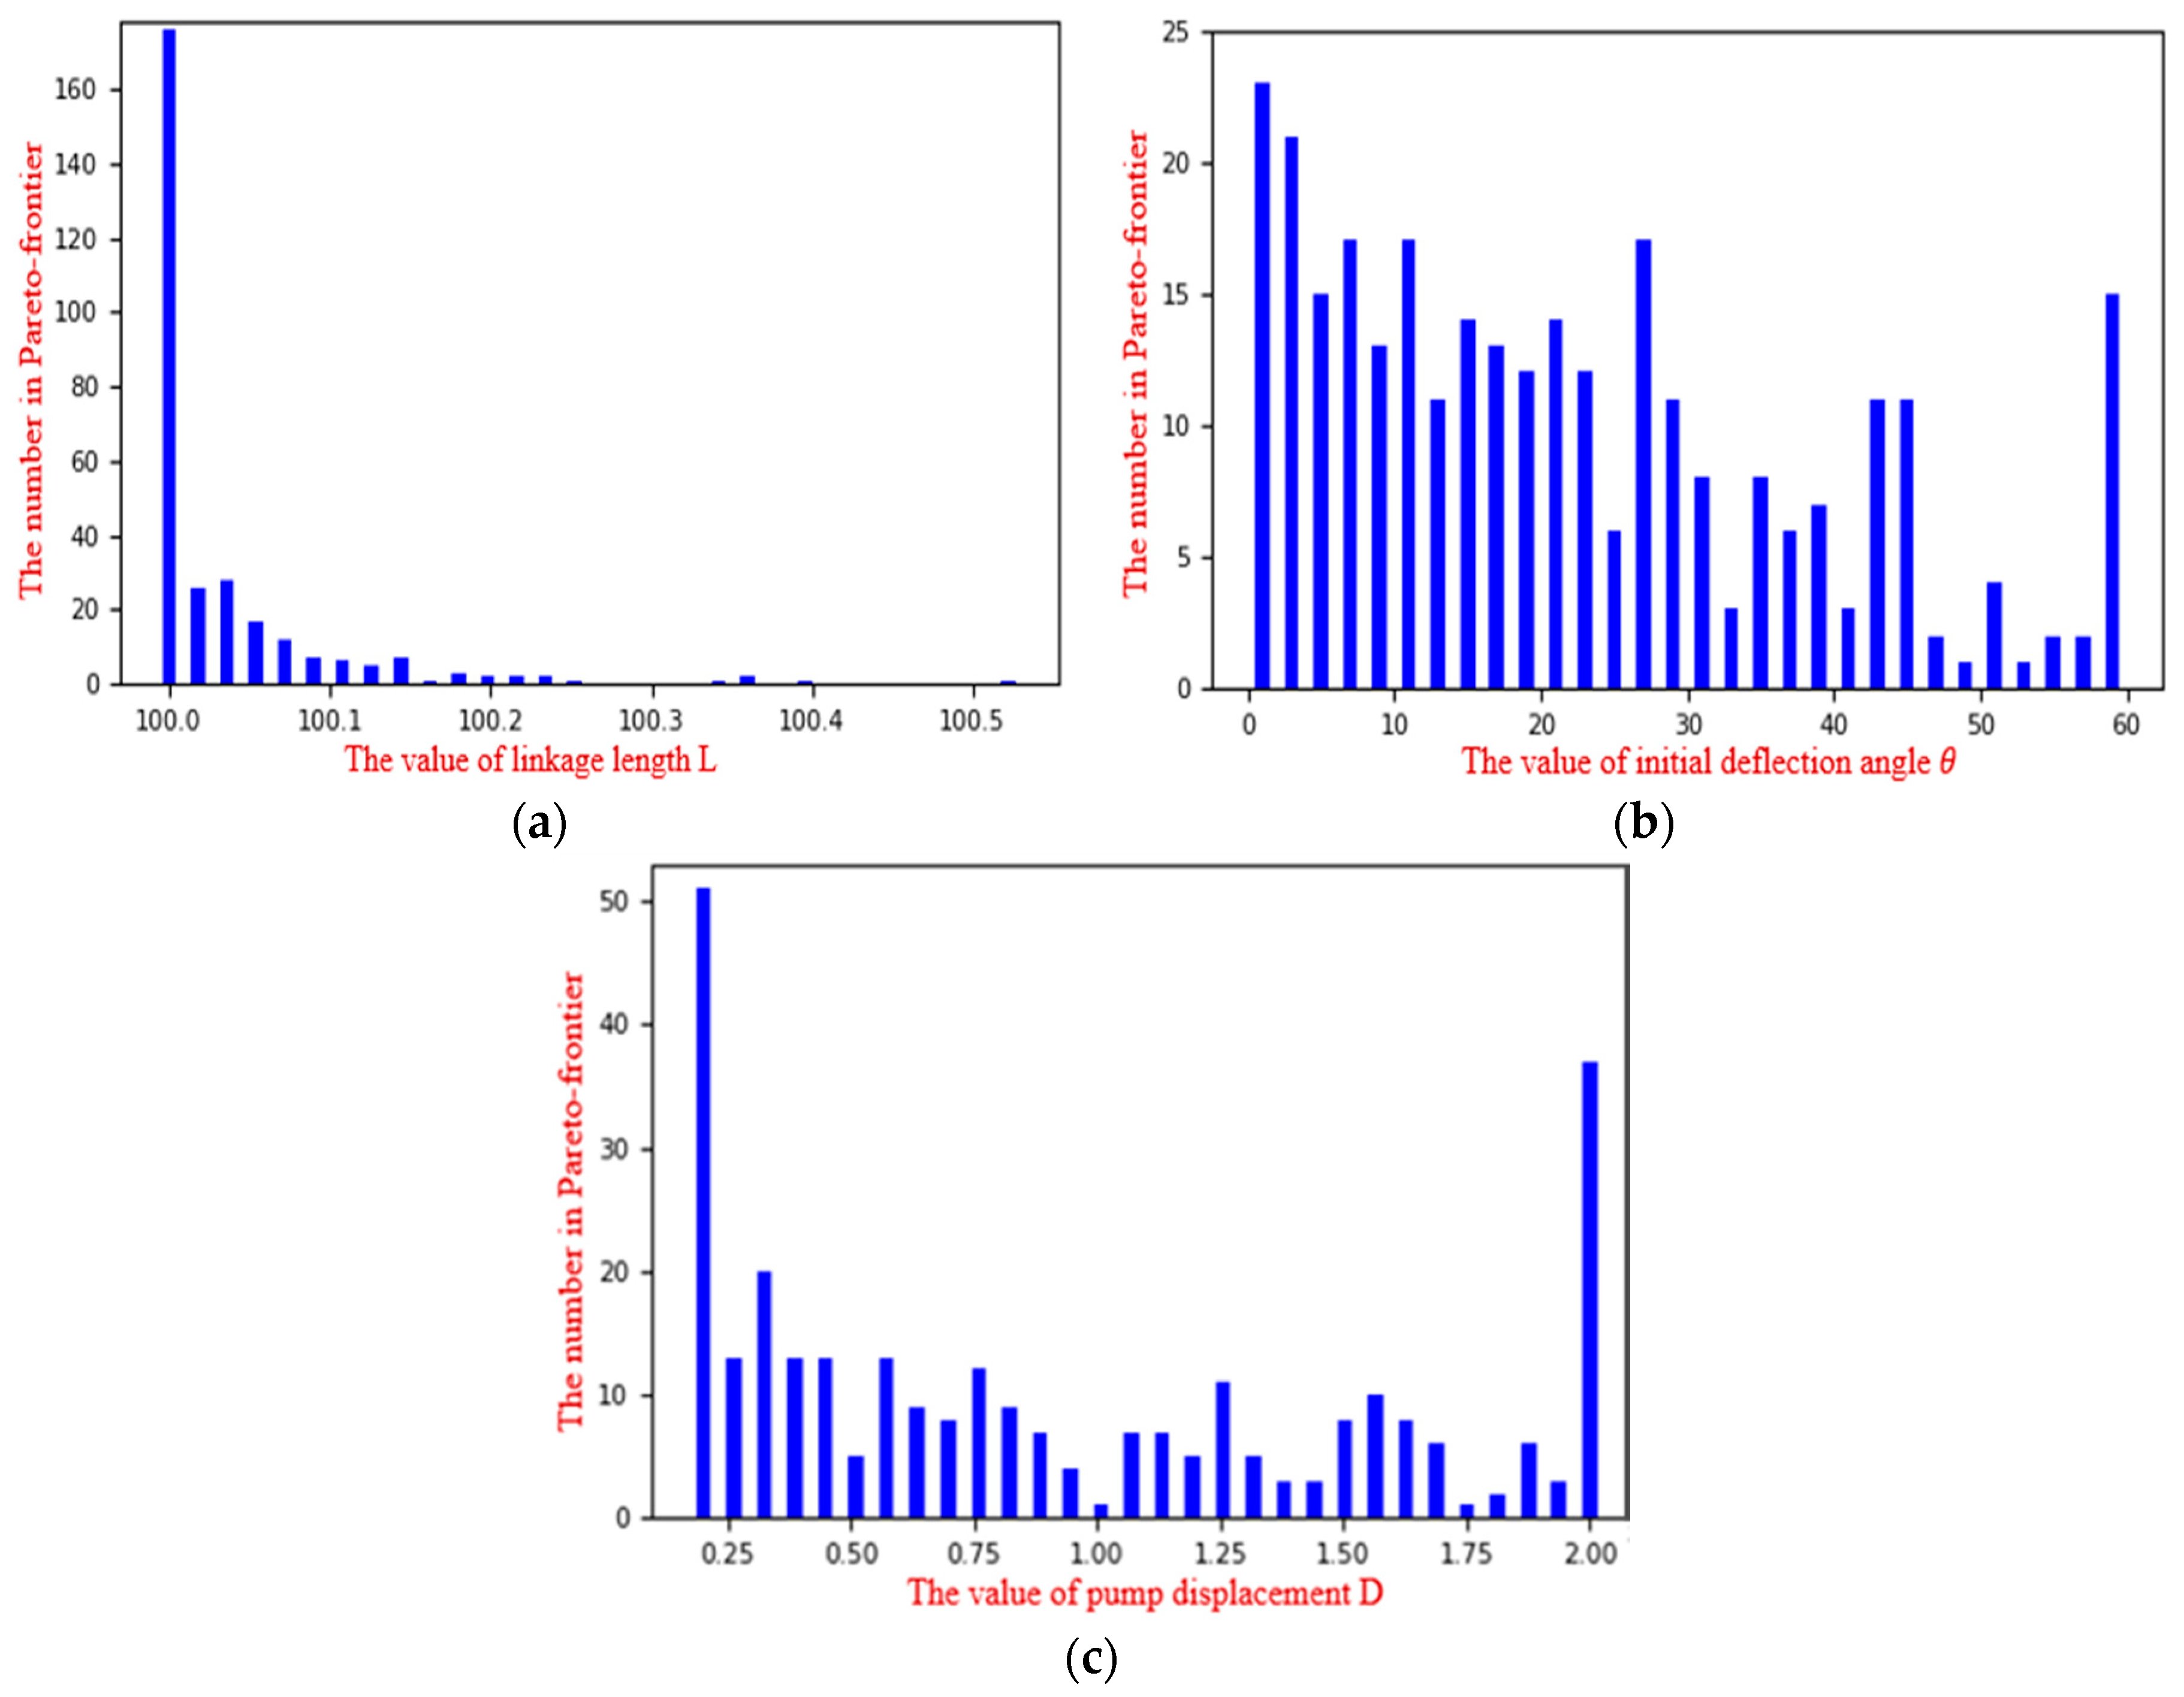
5. Optimization Results and Discussion

The optimization bound of parameters is shown in Equation (25). Set maximum optimization iterations of MOPSO as 100, set the particle count as 600 and set the capacity of the repository as 300. The Pareto front of the optimization result, which includes 300 solutions, is shown in Figure 6. M is the weight of the EHA, P is the power consumption of the EHA, and 1/K is the stiffness reciprocal of the EHA. The curved surface of the red round dots is a three-dimensional Pareto frontier curved surface. Each of the round dots represents a design. The green hollow pentagram, blue cross symbol and yellow triangle are projected on three planes.
The three 3-D graphs in Figure 6 represent the relationships of the three objectives. It can be seen that there is a contradictory relationship between weight, power consumption and stiffness. The x, y plane shows that the two objectives, weight and power consumption, have the relations of benign mutual promotion. As the power consumption goes up, the weight becomes heavier. The design goal is to minimize weight and minimize power consumption, so these two goals do not conflict. The x, z plane shows that the two objectives, weight and stiffness reciprocal, have a contradictory relationship. As the stiffness reciprocal is increasing, the weight is getting smaller. That is to say that when the stiffness becomes smaller, the weight will become smaller and smaller, which is in conflict with the design goal. The y, z plane shows that the contradictory relationship between power consumption and stiffness is reciprocal, and it is not a simple linear relationship. When the power consumption increases, the reciprocal of stiffness decreases; that is to say, when the stiffness becomes smaller, the power consumption will become smaller and smaller, which is in conflict with the design goal. Because of the existence of conflicting relationships between design indicators, it is difficult to make all indicators optimal at the same time.
Figure 7 represents the distribution of each particle in the Pareto frontier set. As seen from Figure 7a, linkage length L in the Pareto frontier is mainly concentrated around 100 mm and gradually decreases. As seen from Figure 7b, the value of the initial deflection angle θ is uniformly distributed between 0° and 60°, which is the value range of the deflection angle θ . As seen from Figure 7c, the value of displacement D is distributed between 0.25 mL/rev and 2.00 mL/rev. At the same time, the regions with the most intensive values are distributed at the maximum and minimum values. At the same time, the densest regions are at both ends of the range of values.
After multi-objective optimization, the Pareto optimization frontier, which contains 300 valid solutions, is obtained. How to find the best solution in the Pareto frontier is still a difficult problem which can be solved by the AHP method. Through the above introduction, it can be seen that different optimal solutions can be achieved by structuring different judgment matrices when applying AHP to make the decision analysis. In order to see the relationship between the objectives more directly, the judgment matrix is expressed in Table 2.
By using the AHP method, the score of each solution of the Pareto frontier is obtained. The solution that gets the highest score is the best one. As shown in Figure 8, the best design scheme is number 264 of the Pareto frontier. The corresponding design parameters and objectives values of EHA optimal design are shown in Table 3.
The results show that the method proposed in this paper, which combines multi-objective optimization and multi-objective decision making, can achieve the multi-objective optimization design of an EHA. The solutions in the Pareto front obtained by the MOPSO algorithm are evenly distributed, which means that we can provide designers with more diverse design options. At the same time, the method of AHP is used for the final decision analysis. This allows designers to introduce preferences and design experience for various objectives.

6. Conclusions

This paper presents the multi-objective optimization of an electrohydrostatic actuator. By designing the level length, the initial deflection angle of the control surface and the displacement of the pump, the objectives, which are weight, power consumption and stiffness of the EHA, are optimized. However, because of the conflict between these three objectives, it is difficult to minimize all the objectives at the same time. The Pareto optimal solution set is obtained by multi-objective particle swarm optimization, which can compromise multiple objectives. Since the Pareto front solution is not a solution but a solution set, a multi-objective decision analysis method is needed to find the optimal solution in the Pareto frontier. In this paper, a method of combining multi-objective optimization and multi-objective decision making is introduced. The multi-objective particle swarm optimization is used to get the optimal solution set, called the Pareto frontier. Then, the optimal design is obtained by an analytic hierarchy process. The result indicates the feasibility of the proposed optimization method. This work also points out that the multi-objective optimization and multi-objective decision making methods can be used in the optimization design of EHAs. This method is also suitable for other components and systems.

Author Contributions

S.W. designed the optimization framework. B.Y. and S.W. realized all of the algorithms. Z.J. and Y.S. contributed jointly by supervising the overall work. B.Y. write the paper.

Funding

This work is supported by the National Basic Research Program of China (973 Program) (Grant No. 2014CB046401), the National Aviation Science Foundation (Grant No. 20160751003) and the National Natural Science Foundation of China (Grant No. 51775014).

Conflicts of Interest

The authors declare no conflict of interest.

References

  1. Kargov, A.; Werner, T.; Pylatiuk, C.; Schulz, S. Development of a miniaturised hydraulic actuation system for artificial hands. Sens. Actuators A Phys. 2008, 141, 548–557. [Google Scholar] [CrossRef]
  2. Samer, A.; Fethi, B.O.; Faycal, N.; Gordon, G. High performance Integrated Electro-Hydraulic Actuator for robotics—Part I: Principle, prototype design and first experiments. Sens. Actuators A Phys. 2011, 169, 115–123. [Google Scholar]
  3. Samer, A.; Fethi, B.O.; Faycal, N.; Gordon, G. High performance Integrated Electro-Hydraulic Actuator for robotics. Part II: Theoretical modelling, simulation, control & comparison with real measurements. Sens. Actuators A Phys. 2011, 169, 124–132. [Google Scholar]
  4. Shi, C.; Wang, X.; Wang, S.; Wang, J.; Tomovic, M.M. Adaptive decoupling synchronous control of dissimilar redundant actuation system for large civil aircraft. Aerosp. Sci. Technol. 2015, 47, 114–124. [Google Scholar] [CrossRef]
  5. Ahn, K.K.; Nam, D.N.C.; Jin, M. Adaptive backstepping control of an electrohydraulic actuator. IEEE/ASME Trans. Mechatron. 2014, 19, 987–995. [Google Scholar] [CrossRef]
  6. Mahamat, M.; Balira, O.K.; Souleymane, K.; Blaise, S. Alienor Method for Nonlinear Multi-Objective Optimization. Appl. Math. 2011, 2, 217–224. [Google Scholar]
  7. Pandian, V.; Utku, K.; Junzo, W. Metaheuristic Techniques in Enhancing the Efficiency and Performance of Thermo-Electric Cooling Devices. Energies 2017, 10, 1703. [Google Scholar] [Green Version]
  8. Sanghamitra, B.; Sriparna, S.; Ujjwal, M. A Simulated Annealing-Based Multiobjective Optimization Algorithm: AMOSA. IEEE Trans. Evolut. Comput. 2008, 12, 269–283. [Google Scholar] [Green Version]
  9. Ehsan, G.; Man-Hoe, K. Multi-Objective Optimization of a Solar Chimney Power Plant with Inclined Collector Roof Using Genetic Algorithm. Energies 2016, 9, 971. [Google Scholar] [Green Version]
  10. Myeong, J.K.; Yong, S.K.; Min, H.C.; Hung Chan, J. Multi-Objective Optimization Design for a Hybrid Energy System Using the Genetic Algorithm. Energies 2015, 8, 2924–2949. [Google Scholar] [Green Version]
  11. Alexandru, C.Z.; Gerd, B.; Edwin, L.; Sdwin, S.; Wolfgang, A.; Erich, P.K. Hybridization of multi-objective evolutionary algorithms and artificial neural networks for optimizing the performance of electrical drives. Eng. Appl. Artif. Intell. 2013, 26, 1781–1794. [Google Scholar]
  12. Yizhe, L.; Zhiyong, F. Enterprise Femtocell Network Optimization based on Neural Network Modeling. In Proceedings of the 8th Annual IEEE Consumer Communications and Networking Conference, Las Vegas, NV, USA, 9–12 January 2011; pp. 1130–1131. [Google Scholar]
  13. Sara, G.S.; Anders, M.; Viktoria, M. Design Optimization of a Small-Scale Polygeneration Energy System in Different Climate Zones in Iran. Energies 2018, 11, 1115. [Google Scholar] [Green Version]
  14. Kangji, L.; Lei, P.; Wenping, X.; Hui, J.; Hanping, M. Multi-Objective Optimization for Energy Performance Improvement of Residential Buildings: A Comparative Study. Energies 2017, 10, 245. [Google Scholar] [Green Version]
  15. Luciano, B.; Simeone, B.; Massimiliano, M. A particle swarm approach for flight path optimization in a constrained environment. Aerosp. Sci. Technol. 2013, 26, 128–137. [Google Scholar]
  16. Mieloszyk, J.; Goetzendorf, G.T. Introduction of full flight dynamic stability constraints in aircraft multidisciplinary optimization. Aerosp. Sci. Technol. 2017, 68, 252–260. [Google Scholar] [CrossRef]
  17. Liu, W.; Yang, Y. Multi-objective optimization of sheet metal forming process using Pareto-based genetic algorithm. J. Mater. Process. Technol. 2008, 208, 499–506. [Google Scholar]
  18. Francesco, C.; Gianmario, P.; Chris, G. Design of synchronous reluctance motors with multiobjective optimization algorithms. IEEE Trans. Ind. Appl. 2014, 50, 3617–3627. [Google Scholar]
  19. Perera, A.T.D.; Attalage, R.A.; Perera, K.K.C.K.; Dassanayake, V.P.C.D. A hybrid tool to combine multi-objective optimization and multi-criterion decision making in designing standalone hybrid energy systems. Appl. Energy 2013, 107, 412–425. [Google Scholar] [CrossRef]
  20. Shuai, W.; Bo, Y.; Zongxia, J.; Yaoxing, S. Preliminary design and multi-objective optimization of electro-hydrostatic actuator. Proc. Inst. Mech. Eng. Part G J. Aerosp. Eng. 2016, 231, 1258–1268. [Google Scholar]
  21. Kasprzak, E.M.; Lewis, K.E. Pareto analysis in multiobjective optimization using the collinearity theorem and scaling method. Struct. Multidiscip. Optim. 2001, 22, 208–218. [Google Scholar] [CrossRef]
  22. Sayyaadi, H.; Babaie, M.; Farmani, M.R. Implementing of the multi-objective particle swarm optimizer and fuzzy decision-maker in exergetic, exergoeconomic and environmental optimization of a benchmark cogeneration system. Energy 2011, 36, 4777–4789. [Google Scholar] [CrossRef]
  23. Cong, M.; Qu, L. Multiobjective Optimization of Switched Reluctance Motors Based on Design of Experiments and Particle Swarm Optimization. IEEE Trans. Energy Convers. 2015, 30, 1144–1153. [Google Scholar]
  24. Medineckiene, M.; Zavadskas, E.K.; Bjork, F.; Turskis, Z. Multi-criteria decision-making system for sustainable building assessment/certification. Arch. Civ. Mech. Eng. 2015, 15, 11–18. [Google Scholar] [CrossRef]
  25. Alfredo, A.; Pilar, G.; Manuel, S. Influence, relevance and discordance of criteria in AHP-Global Bayesian prioritization. Int. J. Inf. Technol. Decis. Mak. 2013, 12, 837–861. [Google Scholar]
  26. Wu, S.; Zhao, X.; Li, C.; Jiao, Z.; Qu, F. Multi-Objective Optimization of a Hollow Plunger Type Solenoid for High Speed On/Off Valve. IEEE Trans. Ind. Electron. 2018, 65, 3115–3124. [Google Scholar] [CrossRef]
  27. Liu, G.E.; Han, X.; Jiang, C. A novel multi-objective optimization method based on an approximation model management technique. Comput. Methods Appl. Mech. Eng. 2008, 197, 2720–2731. [Google Scholar] [CrossRef]
  28. Zhanlin, W. Hydraulic Servo Control; Beijing College of Aeronautic Press: Beijing, China, 1987. [Google Scholar]
Figure 1. The flow chart of the multi-objective optimization design of the EHA system.
Energies 11 02426 g001
Figure 2. The structure of the EHA system.
Energies 11 02426 g002
Figure 3. Flow chart of MOPSO.
Energies 11 02426 g003
Figure 4. Three-level hierarchical framework for an EHA.
Energies 11 02426 g004
Figure 5. Flow chart of AHP.
Energies 11 02426 g005
Figure 6. The Pareto front of optimization results of EHA.
Energies 11 02426 g006
Figure 7. The Pareto front of optimization results of EHA. (a) The distribution of linkage length L in the Pareto frontier; (b) the distribution of initial deflection angle θ in the Pareto frontier; (c) the distribution of pump displacement D in the Pareto frontier.
Energies 11 02426 g007
Figure 8. The AHP evaluation result of the Pareto frontier.
Energies 11 02426 g008
Table 1. Values of the average random consistence indicator.
n123456789
RI0.000.000.580.901.121.241.321.411.45
Table 2. The relationship between the objectives.
ObjectivesWeight (M)Power Consumption (W)Stiffness Reciprocal (1/K)
Weight (M)11/31/9
Power consumption (W)311/7
Stiffness reciprocal (1/K)971
Table 3. The corresponding design parameters and objectives values of EHA optimal design.
EHA SchemeLevel Length L Initial Deflection Angle θ Pump Displacement D WeightPower ConsumptionStiffness
Optimal design100 mm37.04°0.27 mL/rev24.03 kg9.6 × 105 W6.03 × 109 N/m

