Article

Novel Design Support Methodology Based on a Multi-Criteria Decision Analysis Approach for Energy Efficient District Retrofitting Projects

by
Miguel Á. García-Fuentes
1,*,
Rubén García-Pajares
1,
Cecilia Sanz
1 and
Alberto Meiss
2
1
CARTIF Technology Centre, 47151 Boecillo (Valladolid), Spain
2
School of Architecture, University of Valladolid, 47014 Valladolid, Spain
*
Author to whom correspondence should be addressed.
Energies 2018, 11(9), 2368; https://doi.org/10.3390/en11092368
Submission received: 29 July 2018 / Revised: 21 August 2018 / Accepted: 6 September 2018 / Published: 7 September 2018
(This article belongs to the Section A: Sustainable Energy)

Abstract

:
Districts can be considered as a system of complex interconnections, interactions, relationships and flows. Therefore, a comprehensive approach is essential for effective decision-making with regards to energy efficiency improvement. When addressing interventions with a wider scale, the range of possible interventions is greater, as well as the possibilities of new business models to make bankable the interventions. However certain barriers can appear linked to the interactions among stakeholders, which are usually more complex than when tackling individual actuations. To overcome these barriers it is necessary to establish integrated and systemic methodologies able to support stakeholders to implement better collaboration approaches and carry out more informed decisions. These decisions should be based on a set of relevant indicators, calculated at district level, capturing the different stages that form the retrofitting process (from the diagnosis to the final assessment). This paper presents a holistic design methodology based on the application of a Multi-Criteria Decision Making approach that allows designing optimised solutions. This methodology is based on the evaluation of a set of District Sustainability Indicators while proposing an Integrated Project Delivery method improving the communications among stakeholders and, therefore, the decision-making process.

1. Introduction

The Energy 2020 strategy posed the objective of increasing energy efficiency as one way to tackle the challenge to lower the EU GHG emissions. One of the main approaches proposed to obtain this objective is tapping into the biggest energy-saving potential sectors, one of them being the built environment [1].
The main challenge could be summarized as the capability to adapt European cities and urban ecosystems to more sustainable, efficient and inclusive societies that can generate growth, jobs and attract investments. Thus, the necessity of developing new methodologies and better business models to address projects for improving the energy efficiency in buildings has become an indubitable issue in the recent years. In general, the pillars to address this kind of projects are based on a deep evaluation of the indoor comfort conditions and the integration of strategies to reduce the energy demand, improvement of systems’ efficiency, energy production through Renewable Energy Sources (RES) and use of optimized tools to manage the energy consumed and produced [2].
In this sense, while for new buildings the concept of nearly Zero Energy Buildings (nZEB) seems more feasible and clear; in the case of building retrofitting, the problem cannot be solved under the same principles. In addition, the consideration of isolated buildings as unique energy units does not always allow the implementation of the necessary measures for this aim. However, if these energy units are composed by groups of buildings the set of possibilities is wider, appearing the concept of nZED. In contrast to these advantages that present a favourable scenario, also several barriers appear when facing a bigger scale; from buildings to districts. Thus, while technological barriers are usually reduced at district level due to the wide range of applicable Energy Conservation Measures (ECMs); economic and legal barriers are usually increased. There is still a strong need of administrative coordination in order to update the regulatory framework, along with the need of specific initiatives and measures to support Research and Technological Developments. Once a high level of technological maturity is reached, the critical size of the interventions makes the difference to achieve bankable interventions [3]. Therefore, the creation of economies of scale is a key factor for their feasibility and success of this kind of projects.
In this context, the European project R2CITIES aims at developing and validating an integrated and systemic methodology for energy retrofitting at urban scale, providing a methodological and scientific instrument able to support the evaluation and implementation of solutions at district level. This methodology is based on the Multi-Criteria Decision Analysis (MCDA) evaluation method that explicitly considers multiple criteria in decision-making environments [4]. The objective is to support the decision makers facing the district energy retrofitting design process, since there is no a unique optimal solution for it.
A large number of studies about residential areas energy efficient retrofitting can be found in literature, but normally focused on the renovation of individual buildings or a group of buildings without a holistic district concept. Ma, Cooper et al. [5] reviewed the state-of-the-art of experiences in existing building retrofits, showing also a methodology that covers all stages that need to be addressed when facing retrofitting activities. Thus, different experiences achieving savings ranging from 20% to 60% depending on the intervention scale are shown.
This methodology presents a step beyond the state-of-the-art tackling the change of scale from buildings to districts and adopting an optimized management structure to improve the efficiency of the process.

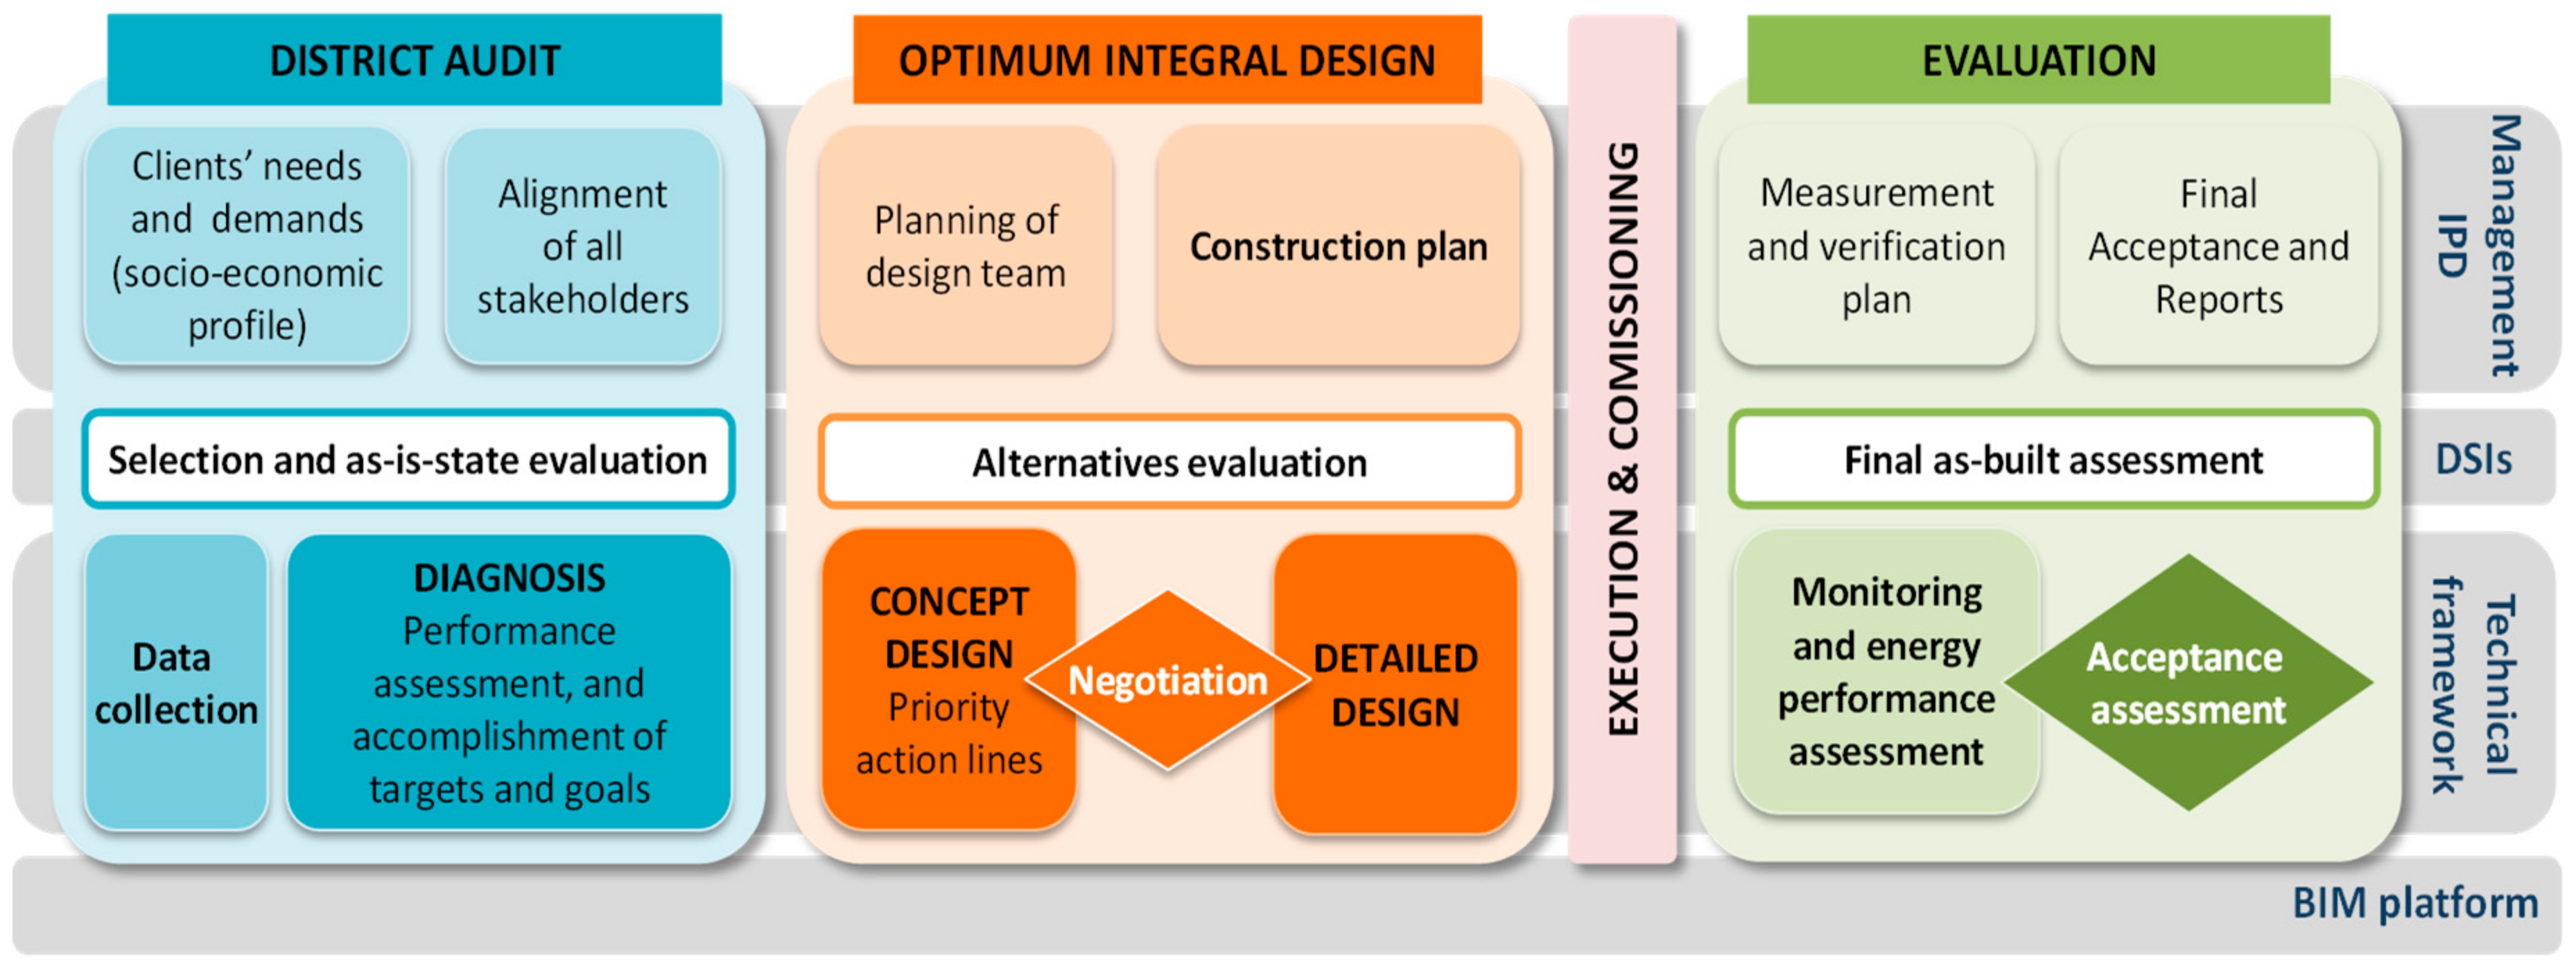
2. A 4-Stepframework Methodology for Energy Efficient Districts Retrofitting

The main innovative aspect of the methodology (Figure 1) derives from the utilization of the Integrated Project Delivery (IPD) concept accompanied by the Building Information Modelling (BIM) principles in order to improve the efficiency during all the phases of the retrofitting process and optimize the project results. The IPD principles are translated into a holistic approach to the retrofitting process in which all the project stakeholders and participants involved in the value chain of the retrofitting process work in highly collaborative relationships throughout all phases, and the commissioning procedure is enhanced [6]. This results in an intensive quality control plan covering the whole process aimed at improving the quality of the designed solutions, enhancing the design conformance to the clients’ needs and demands and ensuring functional and high-quality of the final intervention. Additionally, the implementation of the IPD methods requires the utilization of integrated management tools for supporting the multi-faceted collaboration. Therefore, BIM tools are used to store most of the information of the retrofitting process, including all the phases of the methodology, and the district during its life cycle. The utilization of this virtual representation of the district, containing all the information and parameters, results into the reduction of uncertainties throughout the process [7]. These models allow capturing all the relevant information of the district supporting the utilization of tools (as EnergyPlus) for the evaluation of the stages of the retrofitting process: diagnosis, evaluation of alternatives for the design or final assessment [8].
Along with the IPD principles based on BIM methods, the methodology grounds on the concept of District Sustainability Indicators (DSIs) which have been specifically defined for considering the district as an energy unit where the energy and emissions are balanced globally. This unit is composed by a set of sub-entities (buildings and energy systems) that interact in order to cover the operational demands of the users to maintain the comfort conditions.

2.1. Step I—District Audit

The diagnosis phase is supported by the utilization of tools and methods aimed at quantifying each DSI for the current conditions of the district. At a first stage, considering the stakeholders’ needs and demands, a preliminary set of goals is defined to optimise the indicators that need to be addressed. Data collection allows its quantification by energy performance simulations, monitoring and testing of certain parameters, non-destructive testing, analysis of energy contracts, or gathering inhabitants’ data related to comfort, social or economic aspects. All these data are processed and DSIs are quantified through standardized calculation methods.
From one hand, energy performance simulation tools are essential for the analysis of energy and comfort aspects. Current conditions of the district are modelled taking the geometrical and constructive information from the BIM models as well as other parameters related to comfort, energy profiles, schedules, etc., which are collected through the methods mentioned above. On the other hand, other indicators (as urban or economic) allow determining the main barriers and opportunities for implementing certain measures.
Once the diagnosis phase has been completed, objectives and goals are reviewed to be aligned with the client needs and demands established when starting this methodology. The ambitious of these goals in terms of energy savings, comfort improvement or other aspects related to social issues (e.g., accessibility) are determined by the barriers, especially those non-technical related to legal aspects and economic viability. To align client demands to technical and normative aspects, the involvement of all stakeholders during the establishment of goals is essential.

2.2. Step II—Evaluation of ECMs and Optimum Integral Design

This phase starts with concept design and finalises with detailed design. In between, the negotiation process, which is the core of this second step, is placed. The objective of this stage is the formulation and evaluation of candidate retrofitting scenarios. These scenarios are defined as combinations of ECMs and within this methodology they are evaluated against the set of DSIs defined for this aim. Thus, stakeholders are enabled with a decision support mechanism to allow comparing the candidate scenarios and select those most suitable.

2.3. Step III—Implementation of the Construction Works, Operation and Maintenance

The methodology is completed with the implementation of the construction works and the district commissioning, along with the verification of the achievement of the goals defined before.
Under traditional methods, in this phase new agents appear for the construction works or building management. However, the IPD-based methodology ensures that all stakeholders are involved from the early phases of the retrofitting process, reducing thus the risks related to re-designing during this phase. In this sense, the implementation of BIM approaches is essential to support the IPD methods and to contribute reducing modifications in this stage, which derive into increased costs.
Along with these aspects, also the promoters of the intervention have to establish a process for the monitoring of the works that allow to validate that the methodology is being implemented under the previous principles and to guarantee that the goals finally achieved are those defined under the previous phases.

2.4. Step IV—Measurement and Verification of Energy Savings and Acceptance Plan

Energy renovation programs at district level require careful evaluation due to the high cost to implement the ECMs and the expectations related to the reduction of the energy use. It should be noticed that the energy renovation of a district could modify the behaviour and the social characteristics the district in the long term, which could even result in an increase of the energy consumption.
However, Measurement and Verification (M&V) protocols allow to reliably quantify actual savings (energy, cost and greenhouse gas emissions) delivered by an ECM. This is achieved through accounting for all external factors that have affected the energy performance and that are not related to the ECM itself, extracting these variations in the energy consumption from the actual savings calculation.
Therefore, savings are determined by comparing measured use before and after the implementation of an ECM making suitable adjustments for changes in conditions. This concept comprises three stages:
  • Before the ECM is implemented, a period of time prior to the ECM implementation is selected and the energy use is measured in order to define the “baseline period” and an energy model.
  • After the ECM is implemented, a suitable period of time is defined, and the energy use is once again measured in order to define the “post-retrofit” performance period.
  • Energy savings are determined by subtracting the measured actual usage from the adjusted baseline.
    Energy Savings = Adjusted Baseline Energy − Actual Energy
The verification of the impact of ECMs in the areas of energy and demand savings, as well as cost, can be addressed by adopting suitable M&V protocols. Currently several protocols provide very useful information on M&V and are adopted to provide confidence in the accuracy of reported savings based on a rigorous measurement process, incorporate adjustments for changes in area energy usage patterns to enable a “like-for-like” comparison, and demonstrate the uncertainty of the figures.
The International Performance Measurement and Verification Protocol (IPMVP) is the most widely used and recognised M&V protocol in the world [10]. The IPMVP has been widely adopted internationally and “has become the de-facto protocol for measurement and verification of performance contracts”. This protocol presents an overview of the best practices available to verify energy savings resulting from energy efficiency, water conservation and renewable energy projects within a commercial or industrial building. The IPMVP provides definitions and a structure to assist any user, inexperienced or expert, in developing an M&V plan for a project.
However, IPMVP is limited to the building scenario while for tackling a district level IPMVP needs to be extended for applying its premises into districts. Specially, in terms of monitoring it is strictly necessary to reach a cost-effective solution while ensuring an enough precise performance model to calculate the indicators to quantifying the savings due to the implementation of the ECMs. Thus, through the utilization of sampling and aggregation techniques [11], the extended protocol is able to be implemented in districts where building typologies are similar, with the aim to leverage as much as possible the replicability potential of this method in this kind of district retrofitting environments.

3. Development of a Decision Making Support Methodology

Within these four steps, the core part is the second step, where the decisions are taken towards designing the alternative that better meets the goals defined by the stakeholders The design of district energy retrofitting towards nZED is a typical example of a multi-objective decision problem. This is a question in which there is more than one objective and the objectives cannot be combined in any way in a unique scenario. For the resolution, the suggested MCDA method allows the aggregation of sustainability indicators. According to [12], “it is important to select an approach that is consistent with the decision maker’s information need”.
While multi-criteria design problems do not define explicitly the alternatives, and these are infinite and not countable (or very large in countable), in multiple-criteria evaluation problems, which is the case of the evaluation method proposed within this methodology, it consists on a finite number of alternatives that are defined at the beginning of the solution process. These alternatives are represented by its performance in multiple criteria, and the problem tries to identify the best alternative to be suggested to the decision maker (DM), or to find a set of good alternatives, depending on the decision project objectives. This second case is the one pursued in this methodology: a set of proposed good solutions are provided to the decision makers, in order to support them in the process of identification of the optimal combination that will be finally applied to the district.
Following this approach, the following steps need to be covered:
  • Identification and definition of the decision maker
  • Definition of the decision project objectives
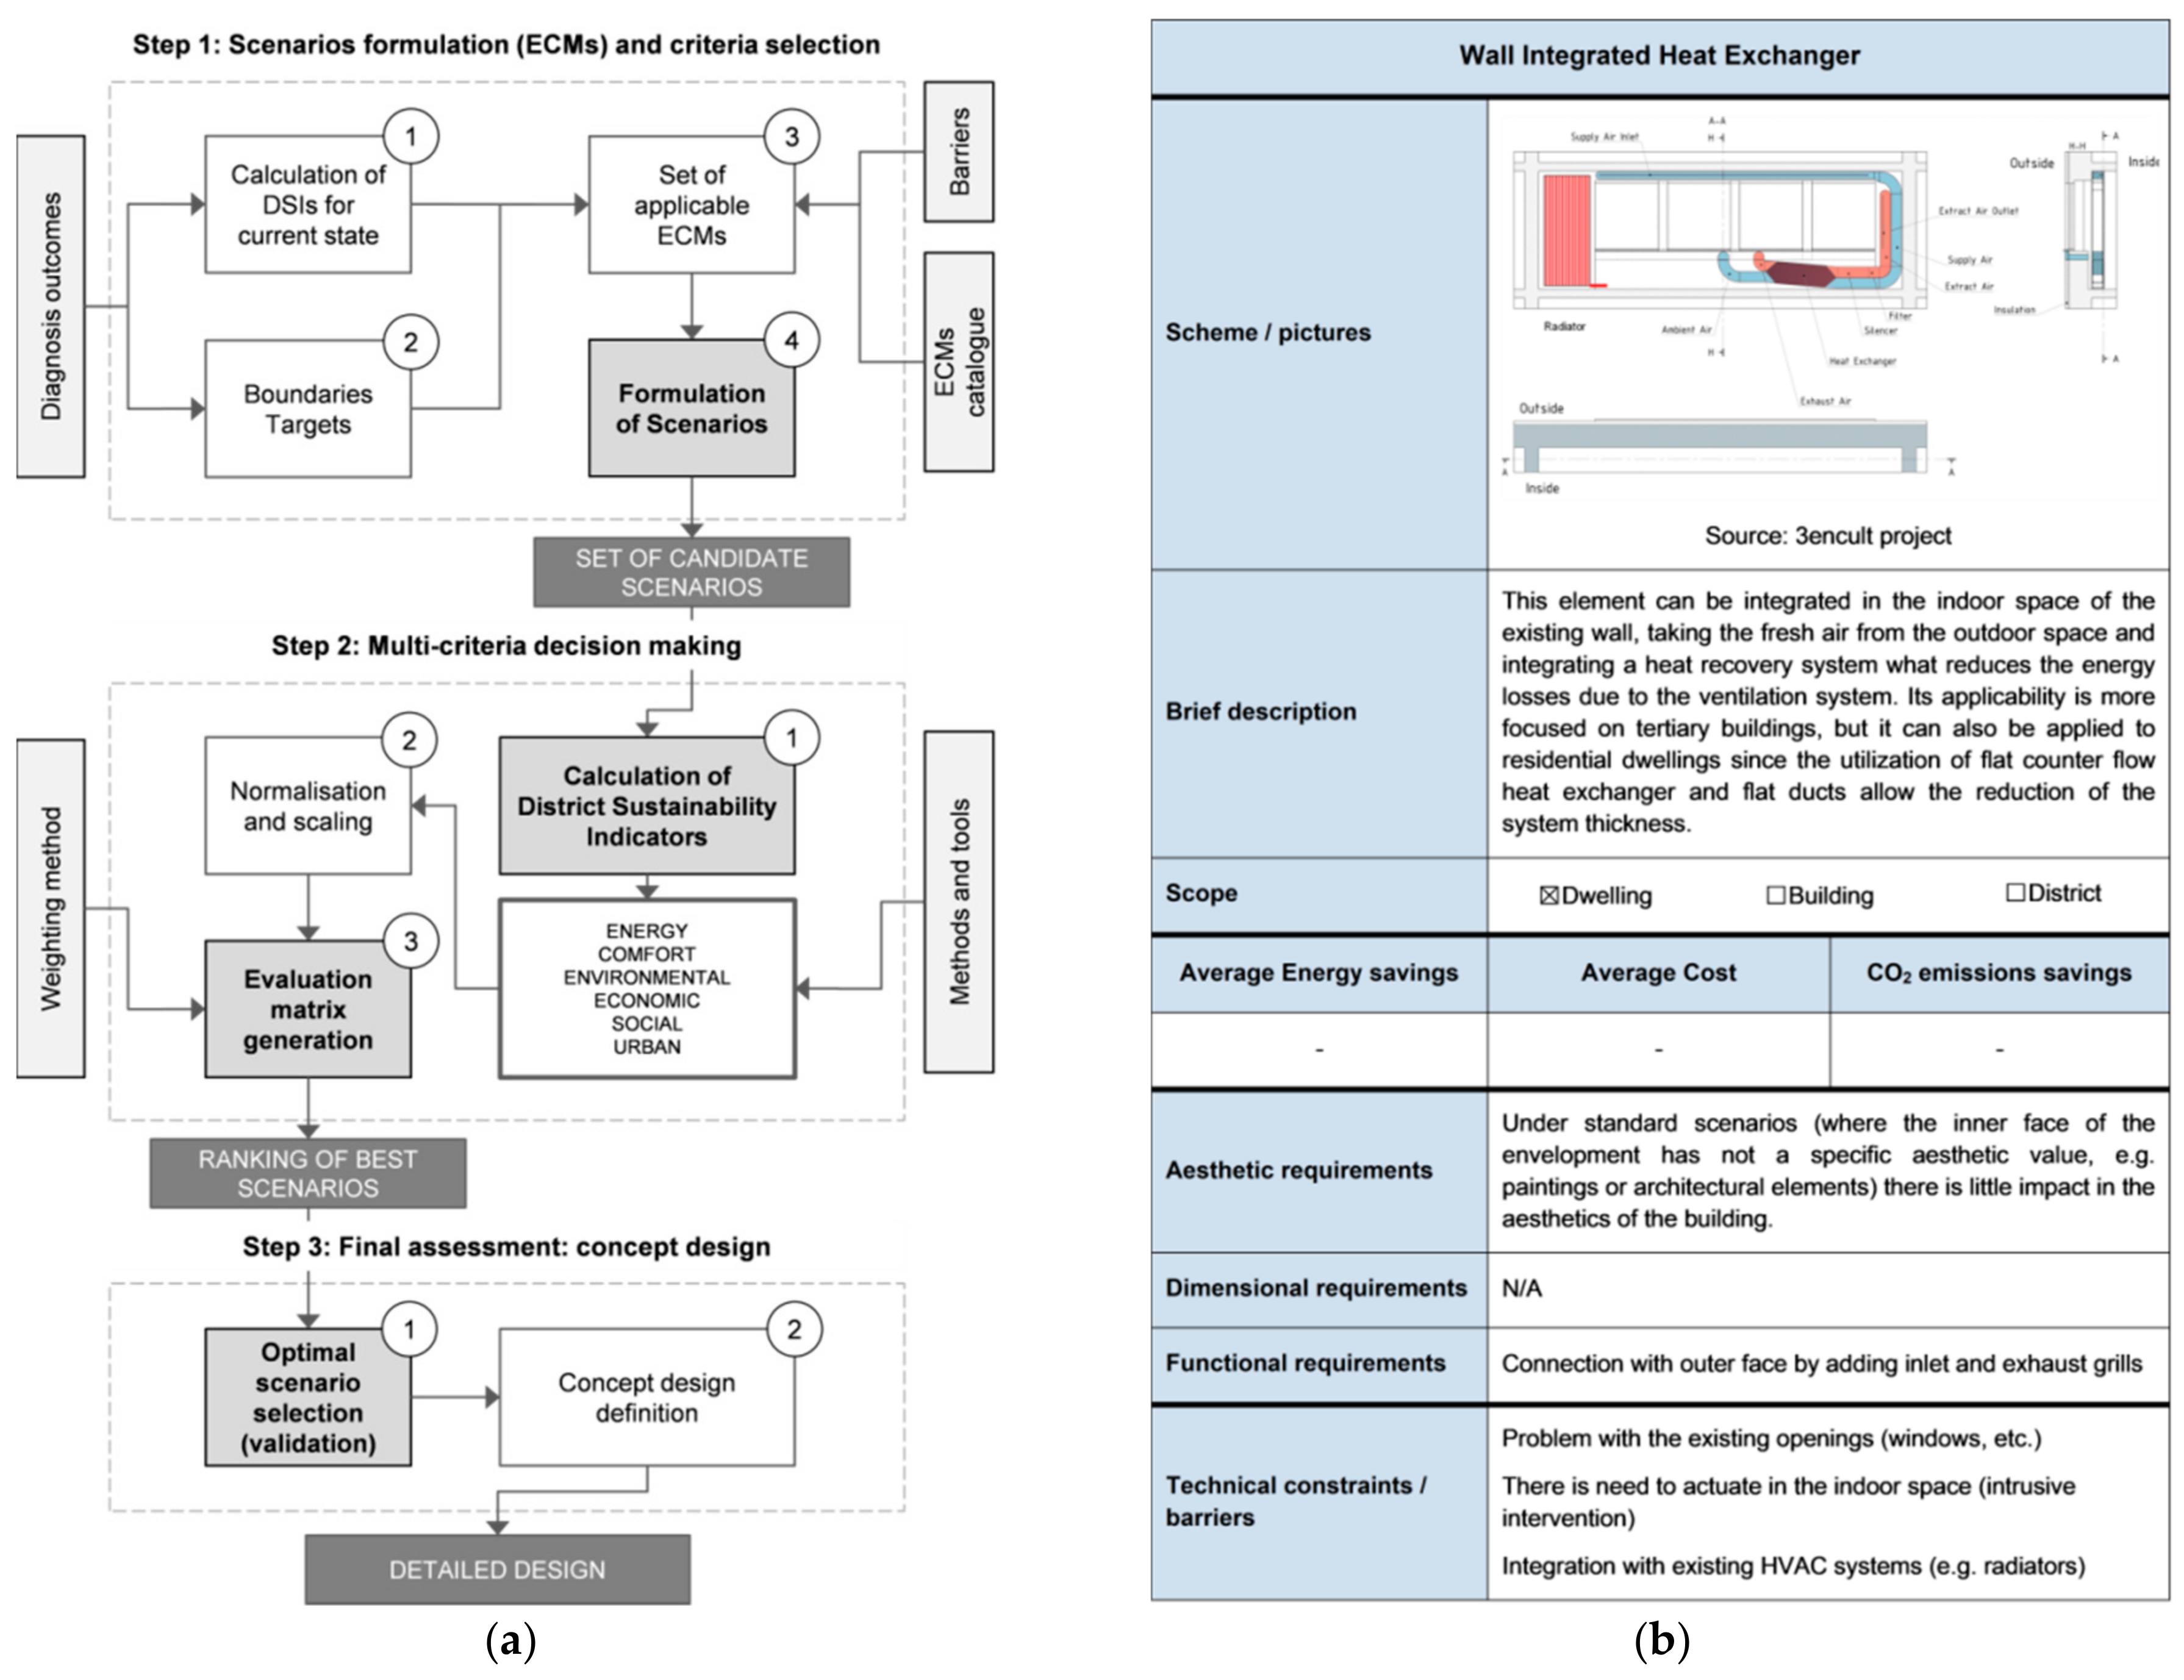
  • Scenarios formulation and criteria selection (step 1 in Figure 2a): which includes the process of generating the candidate retrofitting alternatives based on the combination of ECMs
  • Multi-criteria decision making (step 2 in Figure 2a): which requires the establishment of the evaluation criteria (DSIs in this methodology), a normalization approach and a weighting scheme in order to allow comparing the scenarios formulated in the previous step
  • Selection of retrofitting scenario and design (step 3 in Figure 2b) by the stakeholders

3.1. Identification and Definition of the Decision Maker

For a district energy retrofitting, it is recommended that the main decision making board is covered by a Project Management Team (PMT), which is a committee shaped by the main representative of the Owner, Designers and Contractor.
The weight of each member of the PMT committee shall be equally distributed if a tri-party agreement is signed. If the agreement between parties is not a tri-party, the weight on the decision is assigned attending to their percentage of total investment or total cost of the project.
Due to particular conditions of actual construction processes, it is possible to find some participants that may have more weight in decisions than others, but always considering that decisions implicating life, health, property and public welfare and which are required to be made by a licensed design professional, shall be made by the Designer in accordance with their responsibilities.
If there is no consensus between parties of the PMT, the members who play the roles of advisory group shall give support regarding topics corresponding to their areas of expertise. Finally, if no consensus continues, the owner will make the decision in the best interest of the project as a whole subject to the dispute resolution plan.

3.2. Definition of the Decision Project Objective

Once PMT participants are aligned, the decision making regarding the definition of the decision project objectives may start. Thus, consistent with [12], “environmental decision makers are often charged with choosing an alternative (e.g., a technology, material, product, or management strategy) from a set of alternatives”. From those decision situations usually encountered in sustainability decision processes [13,14], in this methodology the choice problematic is the decision process objective, which should not be confused with the project objective(s) that are the targets and goals defined when started the process and reviewed after the finalisation of the diagnosis phase. Under the choice problematic, the objective is to choose the most suitable alternative from a set of feasible alternatives, which is the aim of this evaluation process.
These feasible alternatives are defined as scenarios of combined ECMs, considering those measures that can be applied once evaluated the barriers, constraints and targets that have to be ensured after the process. The PMT will be in charge of defining those scenarios (as alternatives of combined measures).

3.3. Scenarios Formulation and Criteria Selection

The process to define the applicable scenarios (Figure 2a) may be quite simple or may be deceptively non-trivial. Within this section, a method to pre-select (or to discard) scenarios in a first step is depicted. Those scenarios are later evaluated through the utilisation of the evaluation matrix in which all indicators are weighted and the score in terms of District Sustainability Index is given to the decision maker (PMT) as a ranking of best scenarios.
These scenarios are the combination of possible Energy Conservation Measures (Figure 2a) that can be implemented to improve the district performance in terms of energy and comfort, while considering impacts on economic, social or environmental fields. A sort of catalogue shall be used, considering technologies to improve the district performance in terms of passive, active, RES integration or control strategies. Along with the development of this methodology, a catalogue of solutions was generated [15], which captures (Figure 2b) for each technology specific characteristics as average unit cost, average potential energy savings, etc. as well as information on main barriers appearing when implementing them and aesthetic, dimensional and functional requirements.
From the catalogue of technologies, filters at three levels are implemented in order to reduce the space of solutions and to only those scenarios that are suitable for the retrofitting objectives. The three methods to discard ECMs are:
  • Veto threshold application: From the results coming from the diagnosis and the analysis of barriers, the decision maker panel (PMT) should apply a veto threshold to the wide range of applicable ECMs based mainly on barriers for their implementation, which can be technical, social or economic.
  • Pre-evaluation of costs: The average cost information provided within the catalogue can be used to perform a preliminary evaluation and to check which of the combinations surpass the limits established as boundary conditions. These scenarios, for which this economic pre-calculation is higher, can be discarded from the evaluation, reducing therefore the space of solutions. Relevant importance should be paid at the fact of the economic differences among countries or areas, where the inputs from the Project Management Team are essential to review those economic values provided within the catalogue.
  • Pre-evaluation of benefits: A first evaluation of benefits is carried out in terms of:
    Expected energy savings
    Expected contribution of renewables / expected net fossil energy consumption savings
    The average values from those given in the catalogue can be used to perform this evaluation as an approach to discard scenarios to reduce the space of solutions

3.4. Multi-Criteria Decision Making

3.4.1. Establishing the Evaluation Criteria

From a finite number of these scenarios or alternatives, a normalized decision matrix will support the comparison of these sets of combinations of technologies. These alternatives are represented by their performance in multiple criteria and by a unique index (District Sustainability Index) that aggregates the indicators from the six evaluation fields (energy, comfort, environmental, economic, social and urban). Thus, evaluating the scenarios through these indicators and index allow the stakeholders identifying the most cost-effective scenario in line with the retrofitting project’s objectives.
The definition of the DSIs is a key factor in order to evaluate the success of the retrofitting processes. These indicators refer to the data types that are measured or estimated to show in quantifiable manner the district performance in the fields of energy, comfort, environmental, economic, social and urban conditions, as listed in Table 1. This table also depicts the phases in which the indicator is used, since some of them are only applicable to some phases as it can be the analysis of certain barriers during the diagnosis phase (e.g., GDP level or employment rate). Some of the DSIs have been defined following existing sources of indicators mainly related to the energy efficiency in building sector [16].

3.4.2. Normalisation Approach

The normalisation approach intends transforming the selected criteria that is measured according to different units, into a common new criteria following the same unit. According to [17], three different methods can be applied, being the most suitable to address synthetic indicators that follow a fixed scale unit change. Thus, it is possible to transform the criteria into a homogenous framework that can be weighted and aggregated. Two factors should be ensured when selecting the normalisation approach among all existing techniques [18]: the robustness (insensitivity against the existence of extreme values) and efficiency (estimated value close to the expected optimum when the real data distribution is unknown) of the selected technique. In this case, given that there is not a sufficient representative sampling to use techniques as the z-score, a min-max normalisation will be used, based on the utilisation of minimum (Xmin) and maximum (Xmax) values obtained again through the experts panel for each criteria. Therefore, minimum values will be substituted by 0, while maximum values will be replaced by 1, being all the intermediate measures relative values in the interval [0,1].
The min-max normalisation functions depend on whether the objective value is the highest (as it can be for RES production), or whether it is the lowest (energy demand). When the objective value is the maximum, the normalisation function will be:
I k i = { 0 X k i < X k _ m i n X k i X k _ m i n X k _ m a x X k _ m i n X k _ m i n X k i X k _ m a x 1 X k i > X k _ m a x
where Iki is the normalised value for the criteria k for the exploitation I, Xki is the original value of this criteria for the same exploitation, and Xk_min and Xk_max the minimum and maximum values for k, respectively.
However, if the objective value is a minimum, then the function will be:
I k i = { 1 X k i < X k _ m i n X k m a x X k i X k _ m a x X k _ m i n X k _ m i n X k i X k _ m a x 0 X k i > X k _ m a x
Through the application of this method, the values used to feed the evaluation matrix turn non-dimensional, taking values in the interval [0, 1], where 0 represents the worst value for the indicator (the less sustainable) and 1 represents the best value (the most sustainable).

3.4.3. Defining the Weighting Scheme

The problem for the decision making process can be formulated as a decision matrix that tries to identify the alternative A i that maximizes the performance of the whole criteria set C j , following a weighting procedure based on the weights w j established, in this case, by the selected experts group:
Criteria C 1 C 2 C n weights w 1 w 2 w n alternatives X = A 1 A 2 A m ( x 11 x 12 x 1 n x 21 x 22 x 2 n x m 1 x m 1 x m n ) m x n
Within this methodology, the alternatives A i correspond with the candidate retrofitting scenarios that have been formulated by the stakeholders as combination of ECMs; the criteria C j correspond with the indicators against which the scenarios are evaluated (i.e., the DSIs); and the weights w j represent the importance given by the stakeholders to every criteria and calculated through the implementation of fuzzy questionnaires distributed to a panel of experts as depicted in the following paragraphs.
Thus, four main stages have to be then covered: alternatives formulation and criteria selection, criteria weighting for the indicators and sub-indicators, evaluation procedure and final treatment and aggregation.
As this methodology aims to provide an evaluation matrix including the set of weights for the indicators, a method was required in order to transform the experts’ knowledge into quantifiable values to be inserted. A well-balanced stakeholders’ group was generated considering industry players (including SMEs), academia, research and financial institutions and local authorities in order to capture their knowledge on the importance of the DSIs.
Then, in order to transform this knowledge into quantifiable values, the use of the Fuzzy Delphi Method has been followed. This method consists on a slight modification of the pure Delphi Method [19], whose foundations are: anonymous response, iterative process and controlled feedback that provides a statistically valid group response. The fuzzy formulation proposes to handle a controlled level of uncertainty or ambiguity that inherently underlies behind the establishment of an exact quantitative value to reflect an expert’s opinion. So the efficiency and quality of the questionnaires is improved.
The Fuzzy Delphi Method can be summarised in the next four steps:
  • Establishment of a structure of sub-indicators related to the six sustainability fields (a. energy, b. comfort, c. environmental, d. economic, e. social, and f. urban).
  • Collection of the opinions of the expert’s advisory group from a pre-defined questionnaire with the selected criteria.
  • Calculation of triangular fuzzy numbers, in accordance with the method proposed by [20]. Each fuzzy number represents a score (through a scale from 1. “very unimportant” to 9. “very important”) for each sub-indicator given by each expert in a particular DSI (Table 2).
  • Application of deffuzification to identify the importance of each sub-indicator in the corresponding DSI. The reciprocal method in order to convert the triangular fuzzy values into an exact valorisation of the corresponding sub-indicator weight is the deffuzification process. In this case, the most widely method, Centre of Gravity [21] is used.
  • Application of minimum threshold values, in order to remove useless weights when they are 25-percentile above and below respect the mean value.
To identify what can be considered as the optimum solution to the design of the retrofitting project, the values of the indicators for each calculated scenario are used to feed the evaluation matrix, being normalised and weighting according to the normalisation equations and weights obtained through the methods here depicted. Thus, each candidate scenario is accompanied by a global index that allows ranking and compare the solutions.

3.5. Final Assessment: Concept Design

When deciding the best alternative the end of the process of decision making is reached. The subsequent selection process is quite simple, since the PMT simply choose the alternative that had the highest rating. Thus, the final decision must:
  • Meet the project targets.
  • All risks, barriers and/or consequences of choice are known. It also has to be clear all criteria and all possible alternatives.
  • The preference is clear: numerical values are assigned and an order of preference for all criteria and alternatives is established.
  • In all cases, the final decision shall be equal or similar to main ranked scenarios. If the final decision does not match the primary results of the calculated indicators, the deviations must be justified.
Once the decision is made, a detailed design and the execution phase are launched where the uncertainties and modifications should be drastically reduced against business as usual practices thanks to the early involvement of stakeholders in the previous phases and the decision making process based on consensus among these parties.

4. Results

4.1. Generation of the Evaluation Matrix to Support the Decision Making

As a result of the application of this methodology, an evaluation method was developed, which provides support to the decision making process when addressing district retrofitting projects in terms of evaluating different criteria.
Apart of the methodology itself, the main result is the matrix that allows the comparison of the candidate retrofitting scenarios. The normalisation values and weights obtained through the application of this method are included within this matrix, and the Global District Sustainability Index to compare the alternative scenarios can be obtained through its use. The values taken as minimum and maximum for the normalisation have been obtained in three case studies where this methodology has been tested [22] being one of them the case presented in the following section.
The following Table 3 includes the results obtained for the weights and ranges of the indicators that form the evaluation matrix to compare the retrofitting scenarios.

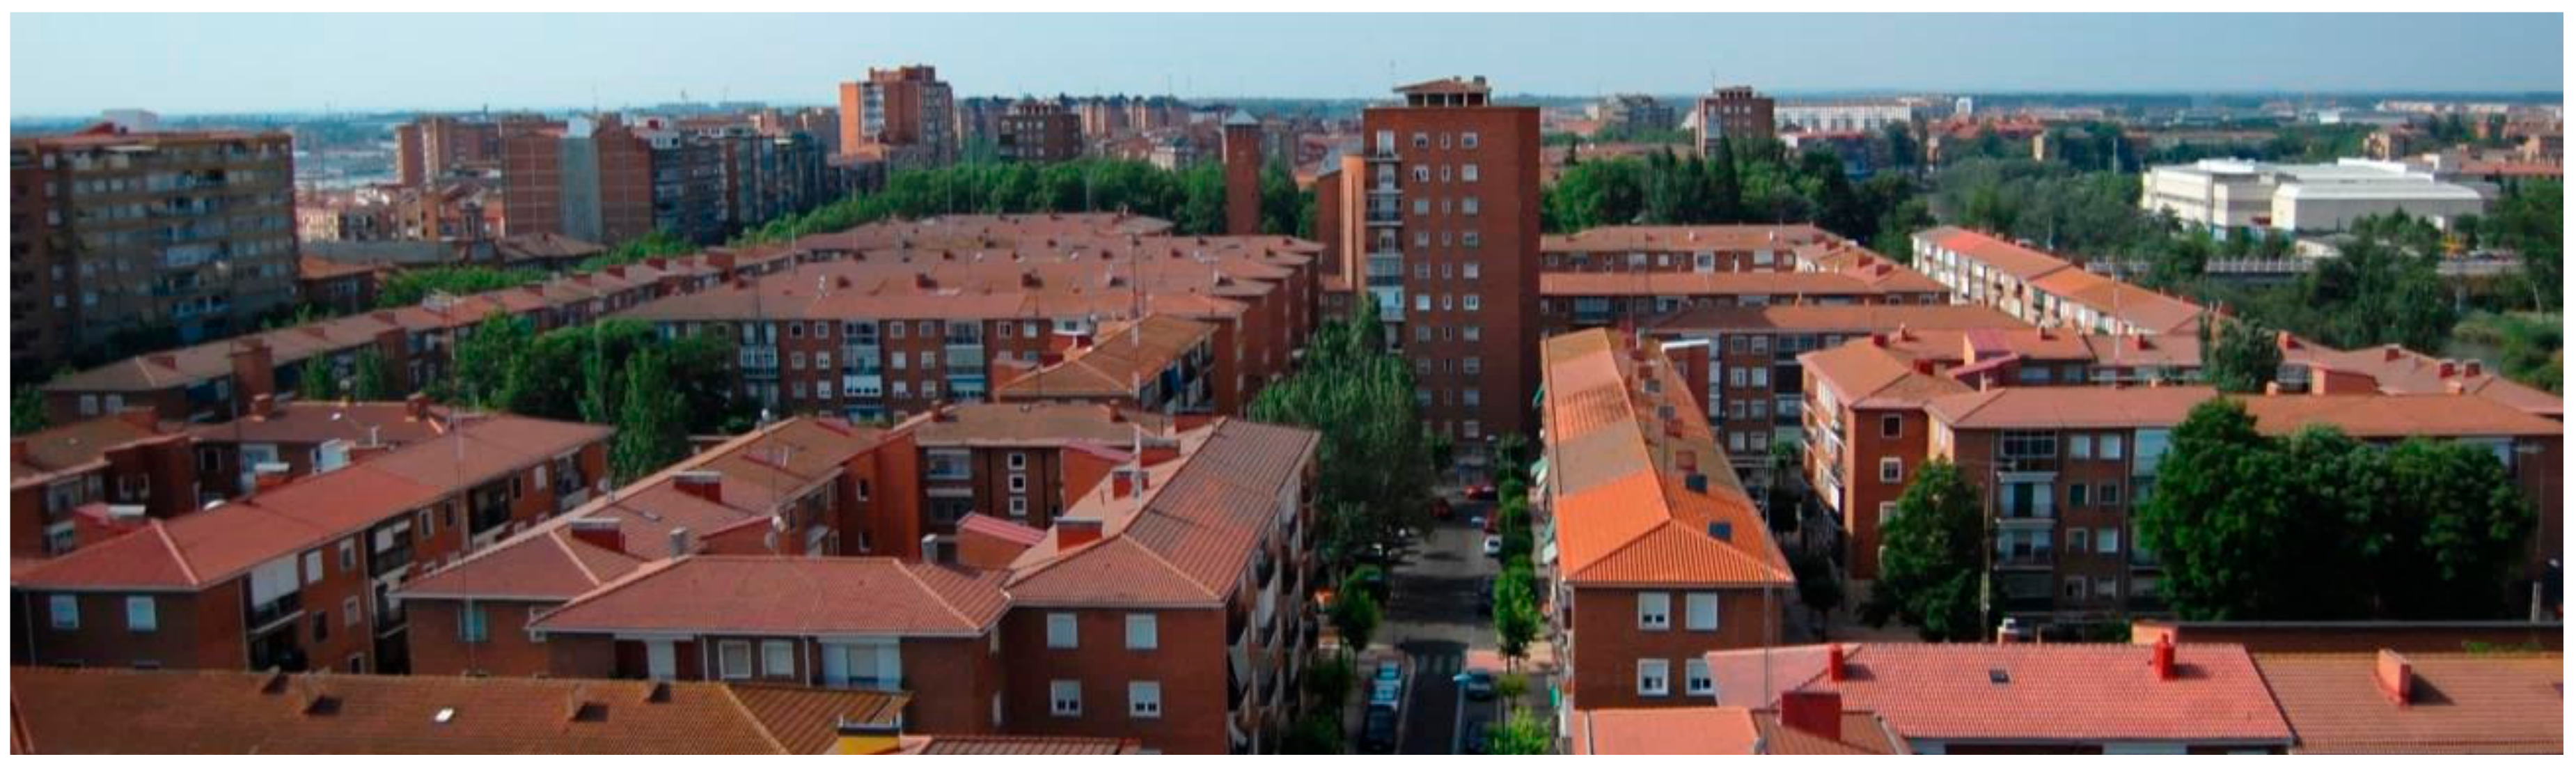
4.2. Implementation to a Case Study: Cuatro de Marzo (Valladolid)

The methodology proposed within this paper, and more specifically the evaluation matrix, has been implemented to three case studies in order to validate its suitability and to assess its workability. One of these case studies is the Cuatro de Marzo district, in the city of Valladolid (Spain).
This district (Figure 3) belongs to one of the areas built in the city to solve the drastic demand of new buildings that occurred in the 50–80 s in Spain as a consequence of a delayed industrialization process. As the other districts promoted in that years, it was executed in a very short time and following the same project. These integrated projects followed the principles of the hygienic housing and recurrent constructive and aesthetic solutions, resulting in homogeneous areas with typologies that are always of open blocks and towers. All these issues, along with the application of the International Style language and the technological and materials precariousness, allow explaining the great amount of deficiencies that are present in these buildings [23].
Projected in 1955 at the periphery, “Cuatro de Marzo” district is currently located at the end of the main boulevard of Valladolid. The district is part of 6473 dwellings promoted in Valladolid between 1940 and 1967 by the National Housing Institute (INV) and the Housing Union (OSH). Characterized by a high population density (200 inh./Ha.) and high construction density (100 dw./Ha), buildings are multifamily and multi-property. Also, a residential commonhold exists among all the flat-owners in each building to manage the common parts of the buildings [24].
The following sections show how the design methodology was implemented in the district and the main results obtained that led to the design of the retrofitting intervention that has been carried out in the district [25].

4.2.1. Procedure and Outcomes of the Diagnosis

Several methods and tools were used in order to carry out the diagnosis of the current conditions of the district as basis for the design of the retrofitting project. Surveys and data gathering processes where implemented. Thus, IR thermographs (to identify thermal bridges), blower door tests (to identify air tightness), surveys to inhabitants and analysis of energy bills were carried out.
The main source of information used was a BIM tool (Autodesk Revit, AutodeskTM, California, CA, USA) to model the buildings and their surroundings and capture relevant information about materials, use profiles, occupancy, etc. Taking this information, an energy performance simulation tool (Design Builder, DesingBuilder Software Ltd., Stroud, UK) was used to calculate the main energy, comfort and environmental indicators, while the processes used to gather information served to fed the rest of indicators (economic, social and urban). Also, relevant data was collected to identify the main barriers that prevented the implementation of certain technologies.

4.2.2. Identification and Definition of the Decision Maker

A collaborative project delivery committee was created in order to carry out the decision making process. This committee had representatives from the owners and a design team. The owners were represented through the municipal promoter (supporting the retrofitting through grants) and representatives from the inhabitants. The design team was composed by a BIM expert, an Energy expert, a LCA consultant and a LCC consultant. All these representatives counted on equal weights in the decision making process.
The biggest efforts to implement this collaboration framework was required to involve the owners of the flats of this district within the decision making process where a high number of meetings to inform and gather feedback were required. However, this process led to understand the expectations and barriers from their perspective which, at the end, resulted into their acceptance.
Regarding the technical collaboration and the use of tools, there is still a lack of interoperability that provokes in certain occasions the need to duplicate information, resulting into errors of the process. In this particular case, the BIM models actuated as the backbone of information, while the energy models were created based on the information contained on the previous. The additional effort required to create the BIM models during this stage is then compensated in the subsequent stages where uncertainties and costs derived from late modifications are drastically reduced.

4.2.3. Definition of the Decision Project Objective

All the stakeholders mentioned above established the main barriers based on technology, legal or economic aspects, as well as the main project objectives as basis for the pre-selection of ECMs to generate the candidate retrofitting scenarios to be evaluated.
Thus, the objectives in terms of energy savings, maximum investment as well as the identification of non-suitable technologies to be implemented were the main outcome of this stage in which the collaboration among stakeholders was essential to fix these boundary conditions.

4.2.4. Scenarios Formulation and Criteria Selection

As a result of the previous, a set of 16 ECMs where preliminary selected and then reduced to 8 EMCs after the implementation of the filters that allowed eliminating those measures non-compliant with the expectations or existing barriers. Measures were selected in the three application fields (passive measures, active measures, and renewable energy sources). These 16 ECMs where combined in a set of four different scenarios that combined them in an additive process. The selected ECMs were the following:
  • ECM1—Passive—external thermal insulation composite system 60 mm
  • ECM2—Passive—external thermal insulation composite system 100 mm
  • ECM3—Passive—replacement of windows
  • ECM4—Passive—insulation below top slab
  • ECM5—Active—replacement of existing lighting systems
  • ECM6—Active—replacement of existing boilers with condensation low temperature
  • ECM7—RES—solar thermosiphon collectors
  • ECM8—RES—PV installation in parking lot
The combination of ECMs in the scenarios is summarized in the following Table 4.

4.2.5. Multi-Criteria Decision Making

For all these four scenarios the values of the DSIs where calculated through the use of EnergyPlus [26] for the calculation of the energy and comfort indicators and a set of algorithms to calculate the social, economic, environmental and urban indicators. These indicators where then introduced into the evaluation matrix that normalizes them based on the min-max values indicated in Table 3, allowing establishing a ranking of the scenarios based on the District Sustainability Index. The following Table 5 shows the results of these scenarios:
As the table shows, scenario 4 was the ranked with the highest Global District Sustainability Index based on the evaluation against the DSIs in the six categories of energy, economic, comfort, social, environmental and urban.

4.2.6. Concept Design

Based on the previous, the scenario 4 was the one finally selected, providing the results that are shown in Table 6 that compares the predicted values after the retrofitting with the baseline values calculated during the diagnosis stage.

5. Discussion and Conclusions

The methodology proposed, based on the use of a Multi-criteria Decision Making approach and combined with enhanced collaboration processes, can improve the whole value chain, aiming at reducing the costs and timing of the whole process. These benefits, added to a wider scale, allow addressing feasible and bankable the interventions to retrofit buildings at district scale.
The use of this holistic and integrated methodology to support designing energy efficient district retrofitting projects creates efficiency in the whole design and execution processes. At the same time, it can ensuring that the different users along the whole value chain will get several benefits, through cut down on rework, saving in resources, and improved process efficiency.
This methodology is able to evaluate the district complexity in terms of the specific features associated to each component of its morphology (buildings, urban areas, energy systems) providing integrated solutions to implement the best combination of Energy Conservation Measures according to buildings’ typology, barriers, standards and regulations, etc.
One of its features relies on the fact that it can help building consensus among the overall retrofitting project, also with external players not directly involved in it. Using BIM-based tools can greatly increase the impact and clarity of presenting proposed modifications to stakeholders and decision makers in legal, procurement, and finance departments.
Furthermore, the adoption of this holistic method based on a collaborative design approach can also help in increasing investor confidence and trust. This can be achieved through making smart investments in building improvements, reducing inherent uncertainty that funding will be used appropriately to support optimised performance of the district and buildings for a long and sustained life.
Holistic solutions, with a joint vision for the district renovation, contribute to make the investments, public and private, more attractive. This helps contributing to build capacity of local authorities across Europe through providing holistic solutions for sustainable renovation of districts, leading to better understanding of district performance after the intervention and also to improved decision making procedures based on consensus through the implementation of the IPD approach.
Based on these principles, this work presents a design support method based on capturing expert knowledge to create a comparison matrix to evaluate design alternatives for district retrofitting projects. This evaluation matrix is fed through the calculation of a set of performance indicators for the district for each of the candidate alternatives, using a normalisation and aggregation method that allows ranking the scenarios against the criteria utilised.
It is a useful method that can support the decision making process, which, however, presents as weaknesses a relatively low flexibility and a certain level of uncertainty through the establishment of a fixed weighting scheme and the minimum and maximum values for the criteria which may not capture all the cases.
However, the method that has led to establishing this normalisation and weighting scheme can easily be replicated by the stakeholders of any retrofitting process, leading to an adapted scheme to the specific criteria of the concrete retrofitting project.
At the same time, the potential for standardising this method is certainly high. This could lead to integrating tools that can automate some of the processes to generate the candidate scenarios or feed the calculation of indicators. This can finally derive into to new developments that can add a high value to the retrofitting process value chain.
At the same time, the methodology could be further expanded to include not only energy efficiency related actions, but also other aspects that could contribute to balance the district sustainability. Some of these fields as transportation, water or waste management could also be evaluated by expanding the methodology to add the appropriate indicators and evaluation tools.
The implementation of this methodology within the case study that is shown within this paper has allowed evaluating and assessing a range of scenarios formulated by the stakeholders, and selecting among them the most suitable in terms of a Global District Sustainability Index.
This validation has shown that the methodology is certainly useful and flexible to adapt to grant or procurement methods and that can support stakeholders to make more informed decisions based on a wide range of indicators that are balanced at district level. However, the strong lack of interoperability among tools still makes that the process to evaluate the candidate scenarios or to capture the information about the technologies is tedious and time consuming.
These weaknesses can be reduced through further working on an improved interoperability framework among tools that can support the interaction among stakeholders, their processes and their objectives within the retrofitting value chain.

Author Contributions

Conceptualization, M.Á.G.-F.; Data curation, R.G.-P.; Formal analysis, M.Á.G.-F.; Investigation, M.Á.G.-F. and A.M.; Methodology, M.Á.G.-F., R.G.-P., C.S. and A.M.; Project administration, R.G.-P. and C.S.; Resources, M.Á.G.-F.; Validation, M.Á.G.-F., R.G.-P. and C.S.; Writing—original draft, M.Á.G.-F.; Writing—review & editing, M.Á.G.-F.

Funding

This research work has been partially funded by the European Commission through the 7th Framework Programme; under the research project R2CITIES, Renovation of Residential urban spaces: towards nearly zero energy CITIES, Grant Agreement nº314473.

Acknowledgments

The authors would like to thank the rest of the R2CITIES consortium partners for their help and support and especially to those who responded to the questionnaires and to those involved in the retrofitting works in the Cuatro de Marzo neighborhood.

Conflicts of Interest

The authors declare no conflict of interest.

References

  1. European Commission. Final Proposal for a Directive of the European Parliament and of the Council on Energy Efficiency and Repealing Directives; COM(2011) 370; European Commission: Brussels, Belgium, 2011. [Google Scholar]
  2. European Commission. Strategic Energy Technology (SET) Plan. Towards an Integrated Roadmap: Research and Innovation Challenges and Needs of the EU Energy System; COM(2013)253; European Commission: Brussels, Belgium, 2013. [Google Scholar]
  3. Gee, L.; Dijol, J. Financing Nearly Zero Energy Housing Projects. Power House Nearly Zero Energy Challenge; NHF & CECODHAS Housing Europe: Brussels, Belgium, 2013. [Google Scholar]
  4. Multi-Criteria Analysis: A Manual; Communities and Local Government Publications: Wetherby, UK, 2009.
  5. Ma, Z.; Cooper, P.; Daly, D.; Ledo, L. Existring building retrofits: Methodology and state-of-the-art. Energy Build. 2012, 55, 889–902. [Google Scholar] [CrossRef]
  6. Al Ahbabi, M. Process Protocol for the Implementation of Integrated Project Delivery in the UAE: A Client Perspective. Ph.D. Thesis, University of Salford, Salford, UK, 2014. [Google Scholar]
  7. Kapogiannis, G.; Gaterell, M.; Oulasoglou, E. Identifying uncertainties toward sustainable projects. Procedia Eng. 2015, 118, 1077–1085. [Google Scholar] [CrossRef]
  8. Bryde, D.; Broquetas, M.; Volm, J.M. The Project benefits of Building Information Modelling (BIM). Int. J. Proj. Manag. 2013, 31, 971–980. [Google Scholar] [CrossRef]
  9. García-Fuentes, M.A.; Pujols, C.; García-Pajares, R.; Vasallo, A.; Martín, A. Metodología de Rehabilitación Energética hacia Distritos Residenciales de Energía Casi Nula. Aplicación al Barrio del Cuatro de Marzo (Valladolid); II Congreso EECN: Madrid, Spain, 2013. [Google Scholar]
  10. Efficient Valuation Organisation. International Performance Measurement and Verification Protocol: Core Concepts; Efficient Valuation Organisation: Washington, DC, USA, 2016. [Google Scholar]
  11. R2CITIES Consortium Partners. D4.1: Report of the M&V Protocol Analysis; R2CITIES: Boecillo, Spain, 2013. [Google Scholar]
  12. Rowley, H.V.; Peters, G.M.; Lundie, S.; Moore, S.J. Aggregating sustainability indicators: Beyond the weighted sum. J. Environ. Manag. 2012, 111, 24–33. [Google Scholar] [CrossRef] [PubMed]
  13. Roy, B. Multicriteria Methodology for Decision Aiding; Kluwer Academic Publishers: South Holland, The Netherlands, 1996. [Google Scholar]
  14. Roy, B. Paradigms and Challenges. In Multiple-Criteria Decision Analysis. State of the Art Surveys; Figeira, J., Greco, S., Ehrgott, M., Eds.; Springer: New York, NY, USA, 2005; pp. 3–24. [Google Scholar]
  15. R2CITIES Consortium Partners. D2.2: Report on High-Value Energy Products; R2CITIES: Boecillo, Spain, 2016. [Google Scholar]
  16. Garrido, A.; Etminan, G.; Möller, S. Key Performance Indicator Guide; Smart Cities Information System: Brussels, Belgium, 2017. [Google Scholar]
  17. Barba-Romero, S.; Pomerol, J.-C. Decisiones Multicriterio: Fundamentos Teóricos y Utilización Práctica; Universidad de Alcalà: Madrid, Spain, 1995. [Google Scholar]
  18. Ebert, U.; Welsch, H. Meaningful environmental indices: A social choice approach. J. Environ. Econ. Manag. 2004, 47, 270–283. [Google Scholar] [CrossRef]
  19. Linstone, H.A.; Turoff, M. (Eds.) The Delphi Method: Techniques and Applications; Wesley Publishing Company: Boston, MA, USA, 2002; ISBN 0-201-04294-0. [Google Scholar]
  20. Chang, P.T.; Hung, L.T. Discussion on fuzzy decision making based on fuzzy number and compositional rule of interference. Yugoslav J. Oper. Res. 2015, 25, 271–282. [Google Scholar] [CrossRef]
  21. Van Leekwijck, W.; Kerre, E.E. Defuzzification: Criteria and classification. Fuzzy Set Syst. 1999, 108, 159–178. [Google Scholar] [CrossRef]
  22. R2CITIES Consortium Partners. Available online: http://r2cities.eu/demos/the_case_studies.kl (accessed on 6 September 2018).
  23. Meiss, A.; Del Caz, R.; Álvaro, A. Rehabilitación de barrios de vivienda social. El ARI de la Rondilla en Valladolid. In Ciudad y Territorio: Estudios Territoriales; Ministerio de Fomento: Madrid, Spain, 2013; Volume 175, pp. 65–80. [Google Scholar]
  24. García-Fuentes, M.A.; Pujols, C.; García-Pajares, R. Residential areas retrofitting towards nearly Zero Energy Districts (nZED). A case study: Valladolid-Cuatro de Marzo. In Proceedings of the World Sustainable Buildings 2014 Conference, Barcelona, Spain, 28–30 October 2014. [Google Scholar]
  25. R2CITIES Consortium Partners. D3.2: Optimum Integral Schematic Design; R2CITIES: Boecillo, Spain, 2016. [Google Scholar]
  26. Crawley, D.; Lawrie, L.; Pedersen, C.; Winkelmann, F. EnergyPlus: Energy Simulation Program. ASHRAE J. 2000, 42, 49–56. [Google Scholar]
Figure 1. Proposed methodology for district retrofitting [9].
Energies 11 02368 g001
Figure 2. (a) Decision making support steps; (b) Technology description [15].
Energies 11 02368 g002
Figure 3. Picture of the Cuatro de Marzo district.
Energies 11 02368 g003
Table 1. District Sustainability Indicators.
IndexDistrict Sustainability Indicator (DSI)DiagnosisEvaluationAssessment
Energy IndexDENDensity of final energy demand (electric and thermal)XXX
EfesuMaximum annual efficiency of energy supply unitsXXX
PesuMaximum annual power of energy supply unitsXXX
PEEPeak load of electricity demandXXX
PTHPeak load of thermal energy demandXXX
DADegree of accordance with national laws and standardsXXX
DCDegree of congruence of calculated annual final energy demand and monitored consumptionXXX
ESSDegree of energetic self-supplyXXX
NFECNet fossil energy consumedXXX
MSTMarket share of the technology in order to measure the degree of innovation X
TPCTemporal predictability and controllability of energy supply XX
VTVisibility of technology XX
ECONOMIC INDEXINVInvestments XX
GRAGrants XX
LCCLife cycle cost XX
LCPPLife cycle payback period XX
TARTotal annual costs, sum of discounted total annual costs and annuity XX
EPCEnergy production costsXXX
NPVNet present value X
IRRInternal rate of return XX
ROIReturn of investment XX
DPPDynamic payback period XX
ARIAchieved rents incl. ancillary costs XX
AREAchieved rent increase (excl. ancillary costs) XX
COMFORT INDEXPMVPredicted Mean Vote XXX
PPDPredicted percentage of dissatisfiedXXX
LTCLocal thermal comfortXXX
CAVComfort parameter average valueXXX
PORPercentage outside rangeXXX
VISVisual comfort in reading areasXXX
IAQIndoor air quality (CO2 concentration)XXX
SOCIAL INDEXSDFSocio-demographic featuresX
HOTHousing tenureX
GDPGDP levelX
EPAEmployment rateX
DSADegree of satisfaction/acceptance by inhabitants/tenants/owners X
LIPLevel of information X
LCPLevel of civil participation X
HBEActive/proactive householders behaviour X
ICPInternal comfort perceptionX X
QBUQuality of the building as a place to live and workXXX
ACCAbility of users with physical impairments to use the facilityXXX
IEPImpact on Energy PovertyXXX
ENVIRONM.
INDEX
FENFinal energy consumptionXXX
PENPrimary energy consumptionXXX
GHGGreenhouse gas emissionsXXX
EHSEco-efficiency of hybrid systemsXXX
EFPEcological footprintXXX
URBAN INDEXEfImpact of the refurbished district: efficiency of the urban system XX
HUrban complexity: enterprises, civil organisation/ associations XX
PEEImpact on pedestrian public spaces XX
iTImpact on transport XX
Table 2. Fuzzy questionnaire distributed to the experts.
Stakeholders QuestionnaireVery UnimportantQuite UnimportantUnimportantNearly UnimportantNeutralNearly ImportantImportantQuite ImportantVery ImportantGraphical Representation
Low importance (very clear)cd Energies 11 02368 i001
Normal
(clear)
abd Energies 11 02368 i002
Very important (not so clear) a bcEnergies 11 02368 i003
Normal importance (not so clear) a b d Energies 11 02368 i004
Not so important
(not very clear)
bc d Energies 11 02368 i005
Normal importance
(not clear at all)
a bc d Energies 11 02368 i006
Quite or very important
(very clear)
abcEnergies 11 02368 i007
Table 3. Evaluation matrix for candidate scenarios.
Criteria
DSIUnitsWeightingRangeObjective Value
XminXmax
EN1DENthkWh/m2a10.00%601500
EN2DENekWh/m2a9.00%10800
EN3Efesu%8.00%01001
EN4PesuW/m28.00%101500
EN5PEEW/m29.00%102500
EN6PTHW/m28.00%102500
EN7DA%8.00%01001
EN8ESSkWh/kWh8.00%011
EN9NFECkWh/m29.00%01000
EN10TPCN/A7.00%051
EN11VTN/A9.00%05*
ENERGY INDEX20.00%
ECO1INV€/m210.00%02500
ECO2GRA€/m29.00%02001
ECO3LCC€/m210.00%−50025000
ECO4LCPPa10.00%0300
ECO5TAR€/a8.00%50002 × 1061
ECO6EPC€/kWh10.00%−0.050,150
ECO7IRR%11.00%11001
ECO8ROI%10.00%11000
ECO9DPPa7.00%102000
ECO10ARI€/m2a7.00%15600
ECO11ARE€/m2a7.00%02000
ECONOMIC INDEX19.00%
CO1PMVn/a13.00%0±30
CO2PPD%14.00%01000
CO3LTCh/year14.00%01001
CO4CAVscale17.00%01001
CO5POR%13.00%01000
CO6VISlux14.00%01501
CO8IAQppm CO215.00%3005001
COMFORT INDEX16.00%
SO1QBUn/a50.00%051
SO2IEP%50.00%01000
SOCIAL INDEX15.00%
ENV1FENkWh/m2a21.00%03000
ENV2PENkWh/m2a21.00%05000
ENV3GHGt/m2a21.00%010
ENV4EFP%18.00%01001
ENV5EPFHa/m2a19.00%00,020
ENVIRONMENTAL INDEX17.00%
UR1Efn/a26.00%01001
UR2Hn/a23.00%01001
UR3PEE%25.00%01001
UR4iT%26.00%01001
URBAN INDEX14.00%
GLOBAL DISTRICT SUSTAINABILITY INDEX (GDSI)100.00%
* It will depend on the specific interests of the buildings’ users that have to be identified during the diagnosis stage, although generally high visibility can represent a barrier to implement the technology.
Table 4. Generation of scenarios for Cuatro de Marzo.
ScenarioFaçadeWindowsRoofHeating and DHWLightingThermal RESElectricity RES
1ECM1
2ECM1ECM4
3ECM3ECM4ECM5 ECM5
4ECM3ECM4ECM5ECM6ECM5ECM8ECM9
Table 5. Result of the indexes for the scenarios in Cuatro de Marzo.
ScenarioEnergy IndexEconomic IndexComfort IndexSocial IndexEnvironmental IndexUrban IndexGlobal District Sustainability IndexRanking
10.4090.620.3420.540.010.4090.3214th
20.4370.5770.4250.540.240.4370.4023rd
30.5080.5720.3450.5410.5430.5080.5332nd
40.4630.5110.3470.5410.7140.4630.5661st
Table 6. District Sustainability Indicators.
District Sustainability Indicator (DSI)UnitsBaseline ValuePost Value
ENERGY INDEXDENthDensity of final energy consumption (thermal)kWh/m2a123.0547.03
DENeDensity of final energy consumption (electric)kWh/m2a5.223.13
EfesuMaximum annual efficiency of energy supply units%16.636.64
PesuMaximum annual power of energy supply unitsW/m20.530.76
PEEPeak load of electricity demandW/m211.954.56
PTHPeak load of thermal energy demandW/m281.8469.44
DADegree of accordance with national laws and standards%461.20117.83
ESSDegree of energetic self-supplykWh/kWh0.0095
NFECNet fossil energy consumedkWh/m2128.2729.91
TPCTemporal predictability and controllability of energy supplyn/a0.001.67
VTVisibility of technologyn/a0.001.80
ECONOMIC INDEXINVInvestments€/m20.00132.34
GRAGrants€/m200
LCCLife cycle cost€/m2−286−84
LCPPLife cycle payback perioda−704−223
TARTotal annual costs, sum of discounted total annual costs and annuity€/an.a.7.7
EPCEnergy production costs€/kWh0109,037
IRRInternal rate of return%0.1070.015
ROIReturn of investment%n.a.11.6
DPPDynamic payback periodan.a.85.2
ARIAchieved rents incl. ancillary costs€/m2an.a.23.7
AREAchieved rent increase (excl. ancillary costs)€/m2a4560
COMFORT INDEXPMVPredicted Mean Vote n/a−1.92−1.47
PPDPredicted percentage of dissatisfied%72.9449.14
LTCLocal thermal comforth/year22192010
CAVComfort parameter average valuescaleCC
PORPercentage outside range%76.0168.84
VISVisual comfort in reading areaslux208.72231.91
IAQIndoor air quality (CO2 concentration)ppm CO2300.2300.2
SOCIAL INDEXACCAbility of users with physical impairments to use the facilityn/a71.6392.50
IEPImpact on Energy Poverty%4.432.53
ENVIRONM.
INDEX
FENFinal energy consumptionkWh/m2a128.2750.16
PENPrimary energy consumptionkWh/m2a137.9048.37
GHGGreenhouse gas emissionst/m2a0.03830.0201
EHSEco-efficiency of hybrid systems%n.a.481
EFPEcological footprintHa/m2a130.2369.02
URBAN INDEXEfImpact of the refurbished district: efficiency of the urban systemn/a0.00145.47
HUrban complexity: enterprises, civil organisation/associationsn/a13.4913.49
PEEImpact on pedestrian public spaces%43.3643.27
iTImpact on transport%30.930.9

