Improved Fuzzy C-Means Clustering for Transformer Fault Diagnosis Using Dissolved Gas Analysis Data

School of Electrical Engineering, Wuhan University, Wuhan 430072, China
*
Author to whom correspondence should be addressed.
Energies 2018, 11(9), 2344; https://doi.org/10.3390/en11092344
Submission received: 11 July 2018
/
Revised: 31 August 2018
/
Accepted: 3 September 2018
/
Published: 5 September 2018
Abstract
:Dissolved gas analysis (DGA) of the oil allows transformer fault diagnosis and status monitoring. Fuzzy c-means (FCM) clustering is an effective pattern recognition method, but exhibits poor clustering accuracy for dissolved gas data and usually fails to subsequently correctly classify transformer faults. The existing feasible approach involves combination of the FCM clustering algorithm with other intelligent algorithms, such as neural networks and support vector machines. This method enables good classification; however, the algorithm complexity is greatly increased. In this paper, the FCM clustering algorithm itself is improved and clustering analysis of DGA data is realized. First, the non-monotonicity of the traditional clustering membership function with respect to the sample distance and its several local extrema are discussed, which mainly explain the poor classification accuracy of DGA data clustering. Then, an exponential form of the membership function is proposed to obtain monotony with respect to distance, thereby improving the dissolved gas data clustering. Likewise, a similarity function to determine the degree of membership is derived. Test results for large datasets show that the improved clustering algorithm can be successfully applied for DGA-data-based transformer fault detection.
1. Introduction
In power systems, gas chromatography is widely used to detect mineral-oil-immersed transformer insulation defects, allowing timely discovery of different latent faults in preventive tests of electric equipment [1,2,3,4,5,6]. Specifically, dissolved gas analysis (DGA) is the most common method of transformer fault diagnosis. Since the role of dissolved gases in determining the behavior of mineral insulating oils was first discussed in 1933 [1], various methods of dissolved gas interpretation have been proposed, including the Doernenburg ratio method, the International Electrotechnical Commission (IEC) ratio method, the key gas method, Duval triangles, Duval pentagons, and the Mansour pentagon [2,3]. These conventional methods have gained worldwide acceptance among electrical utility companies as the main fault diagnosis methods for transformers. However, because of the objective uncertainty regarding the cause-and-effect relationship of transformer faults themselves, as well as the uncertainty of the subjective judgment boundary of the test data, it is difficult for the above conventional methods to meet the requirements for engineering applications [4,5].
With technological development, considerable progress has been made with regard to intelligent approaches towards dissolved gas data interpretation, with application of theories such as expert systems [6,7,8], artificial neural networks [9,10,11], fuzzy theory [12,13,14,15], rough set theory [16], grey system theory [17,18], and support vector machines [19,20]. Other intelligent diagnosis tools [21] such as swarm intelligence algorithms, wavelet analysis, Bayesian networks, and the evidential reasoning approach have also been introduced to DGA interpretation research. These intelligent methods partially compensate for the deficiencies of the conventional methods and provide new techniques for transformer fault diagnosis. In particular, fuzzy clustering algorithms are integral components of artificial intelligence, being unsupervised classification algorithms with a wide range of applications in areas such as data mining and pattern recognition [22]. The primitive principle behind these algorithms is that “birds of a feather flock together.” That is, similarities exist between the same fault datasets inside the transformer, and DGA data processing with unsupervised fuzzy clustering algorithms is promising. However, these algorithms have relatively low fault diagnosis accuracy when processing DGA data, and the outcomes are sensitive to the initial values. Hence, different initial values often yield different results and unsatisfactory evaluations. Since the development of the fuzzy c-means (FCM) algorithm in 1973 [23,24], numerous FCM variants have been proposed, including the possibilistic c-means algorithm [25], the possibilistic FCM clustering algorithm [26,27], the kernel clustering algorithm [28], and the generalized entropy-based clustering algorithm [29]. All these FCM-based algorithms use the norm to describe the distance between the sample and cluster center, and the reciprocal distance to characterize sample membership of a class. However, different clustering results are obtained for different iteration starting points on the same dataset. Further, test sample datasets for different faults are always divided into the same subclass. These defects limit the application of fuzzy clustering algorithms.
Based on the transformer fault characteristics of dissolved gases, this article proposes an improved FCM clustering algorithm to analyze and investigate transformer fault diagnosis using dissolved gas data. The improved algorithm has reduced sensitivity to initial values, allowing application of this algorithm for successful DGA data processing. Further, the proposed formulation can be straightforwardly applied in the context of the other FCM-based clustering techniques mentioned above. The remainder of this paper is organized as follows: the DGA data clustering process is discussed in Section 2. Section 3 describes the non-monotonicity of the traditional clustering membership function. In addition, an exponential form of the membership function is proposed. Then, Section 4 reports a detailed verification of the effectiveness of the proposed algorithm.
2. FCM Clustering of DGA Data
The internal structure of an oil-filled power transformer is highly complex, and has temporally and spatially varying electrical and thermal field distributions. Under normal operation, the insulating oil and solid insulating materials deteriorate at different rates with increased operation time under catalysis of copper, iron, and other materials, as well as the actions of the electric field, thermal field, moisture, and oxygen. Besides some non-gaseous deteriorating products, small amounts of hydrogen (H2), low-molecular-weight hydrocarbons, and carbon oxides are produced over time. Then, inceptive faults in oil-filled equipment produce increasing amounts of gases, the accumulation of which gradually becomes apparent. In fact, the gases accumulate in the oil and are continuously dissolved by convection and diffusion until they saturate and form bubbles. The processes of gas production and dissolution in insulating oil are also complex. Nevertheless, some gases allow determination of internal faults in oil-filled equipment, including H2, methane (CH4), ethane (C2H6), ethylene (C2H4), acetylene (C2H2), carbon monoxide (CO), and carbon dioxide (CO2). The concentrations of these gases are closely related to the type and severity of the fault. Hence, DGA data can be processed using the unsupervised FCM clustering algorithm, which classifies DGA data samples by distance and aims to discriminate different types of faults by increasing their separability.
Fuzzy clustering algorithms treat clustering as a constrained optimization problem and determine the fuzzy partition of the dataset as the solution. Fuzzy clustering optimally classifies DGA data samples through an iterative objective function that can be the square sum of the weighted error within the class, i.e.,:
where is the fuzzy partition matrix; represents the c fault cluster center vectors, ; is the Euclidean distance between DGA data sample xi and cluster center vj; and m is a weight index. The clustering criterion is the minimum value of J(U,V), and the constraint of this extreme value is .
The abovementioned optimization problem can be solved using the method of Lagrange multipliers, and the iterative formula of the FCM clustering algorithm is obtained as
The FCM clustering algorithm can process DGA data, where the components of sample xk are the concentrations of various dissolved gases (such as those mentioned above) in the oil. The basic algorithm consists of the following steps:
- (1)
- Normalize and preprocess the DGA data.
- (2)
- Select the initial cluster center, V(0).
- (3)
- Calculate the initial membership matrix, U(0).
- (4)
- Calculate the cluster centers Vj(L + 1), where L represents the iteration number:
- (5)
- Calculate the membership matrix, U(L + 1), with elements given bywhere i = 1, 2, …, N, j = 1, 2, …, c, , and dij is the distance from the ith sample to the jth cluster center.
- (6)
- Repeat steps (4) and (5) until the convergence criterion is met. The convergence criterion is , where ε is a predefined threshold.
3. Improved FCM Clustering Algorithm
3.1. Local Extremum Problem of (Conventional) Membership Function
The following equations hold:
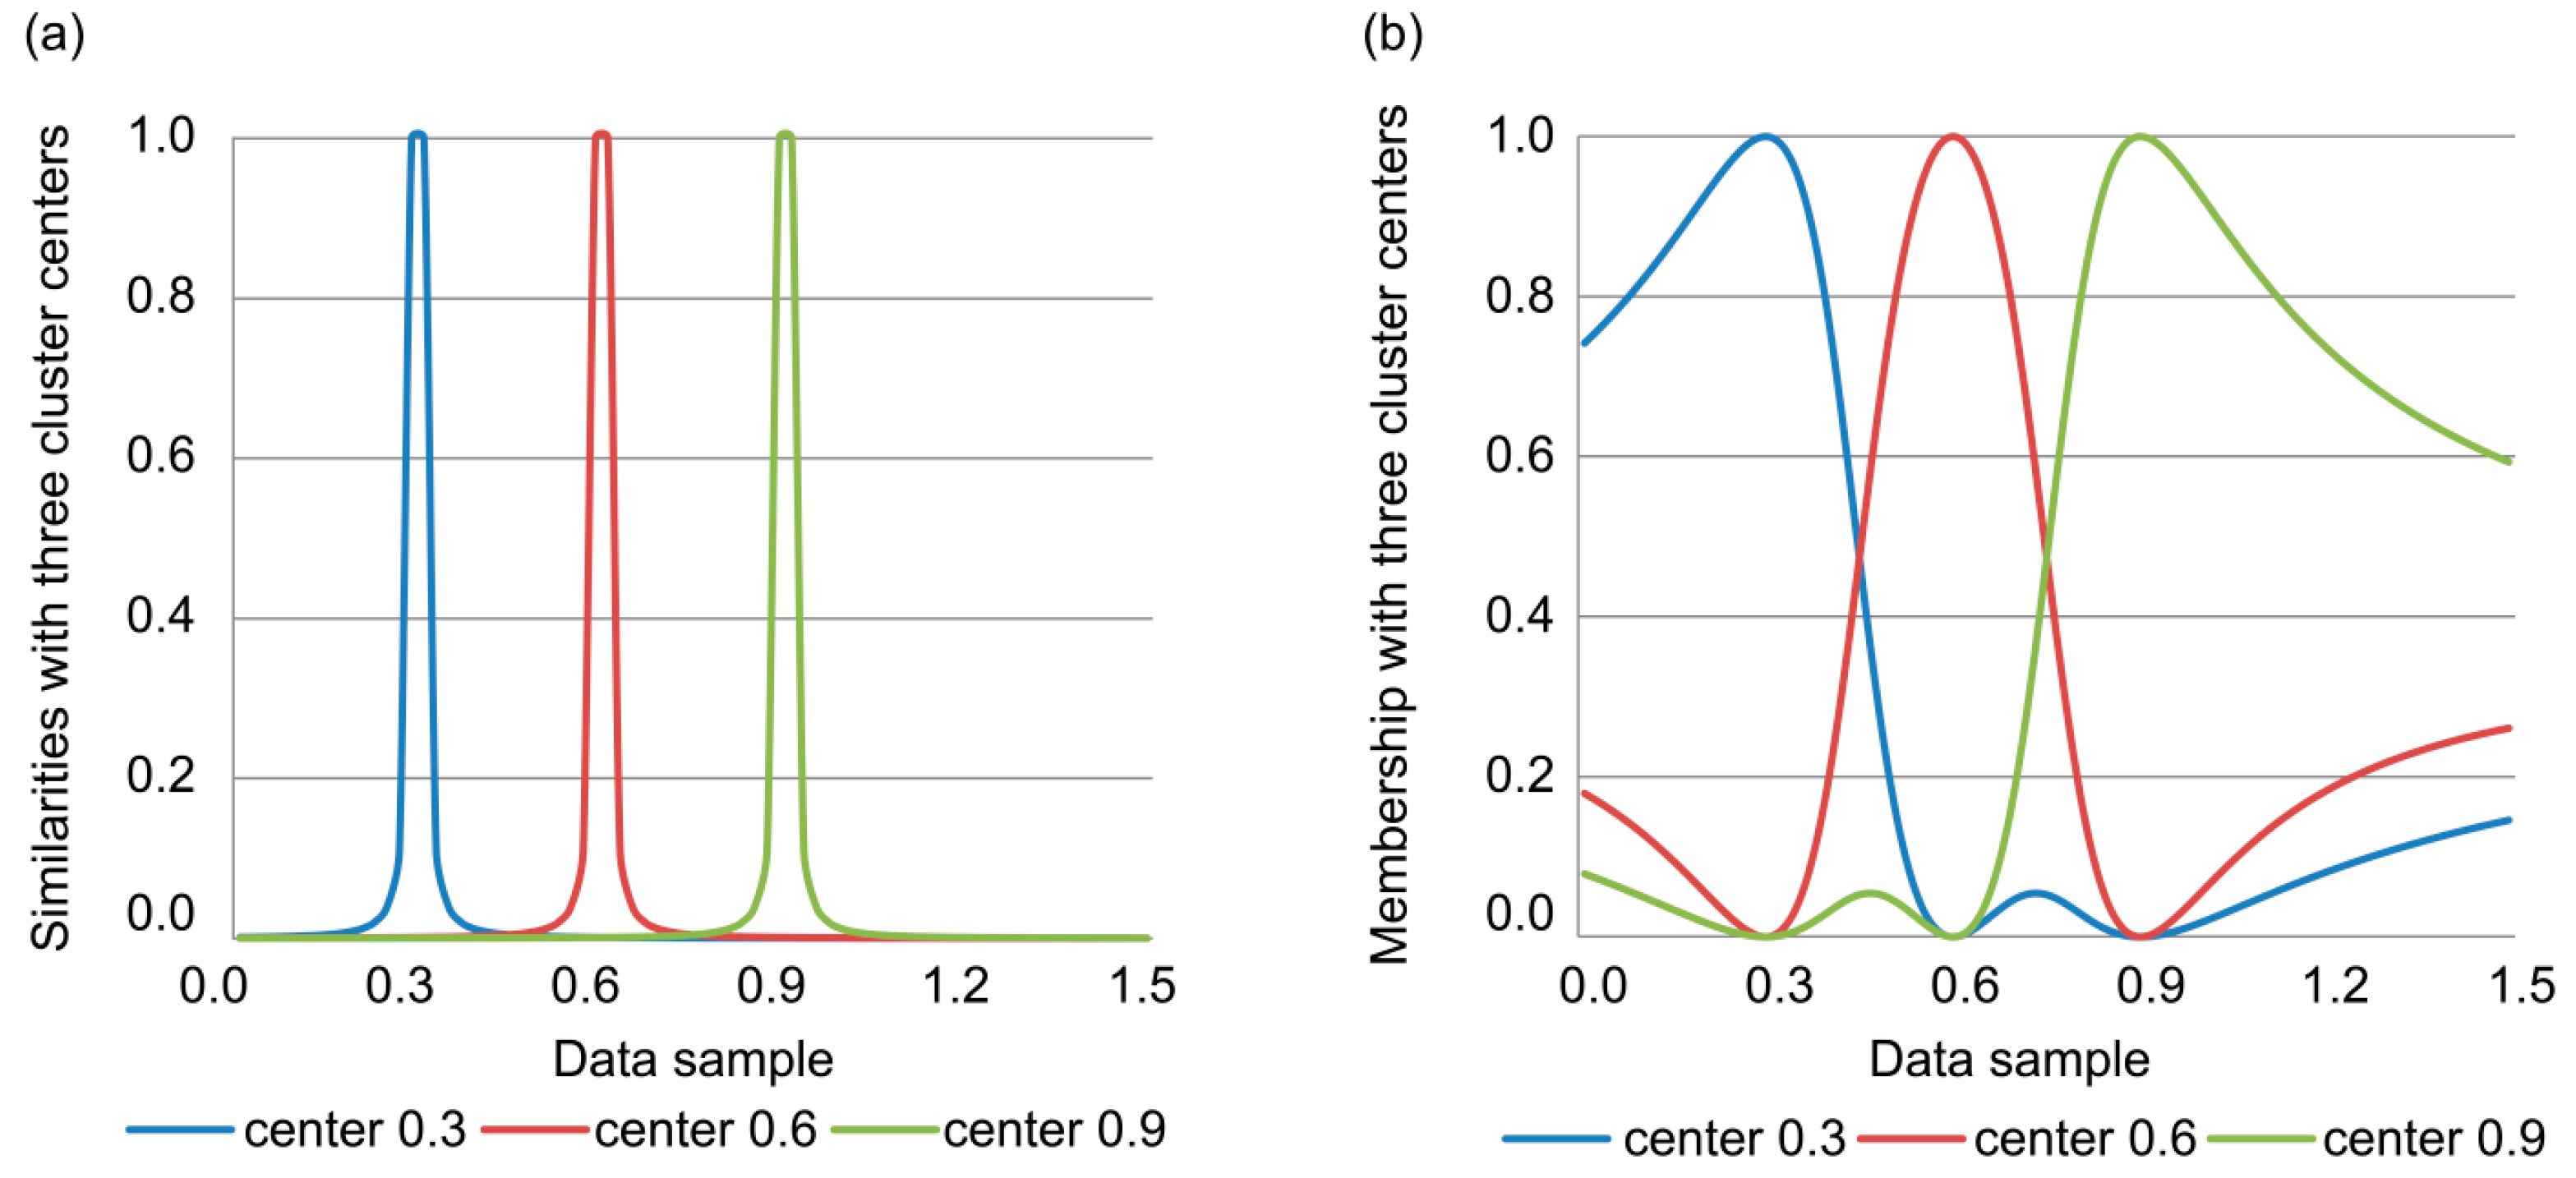
where pij is the similarity between sample xi and cluster center vj, and uij represents the degree of membership of the sample to the cluster. Use of Equation (3) to describe the similarity between the sample and cluster center yields extremely high values as the sample approaches the cluster center, i.e., as dij approaches zero. Likewise, pij decreases rapidly as the samples separate from the cluster center, as shown in Figure 1a. Moreover, the membership function uij in Equation (4) has many local extrema, as shown in Figure 1b. In Figure 1, , , and m = 2. Overall, the membership function of the original FCM clustering algorithm has several local extrema and the cluster space is irregular.
Consider the red line in Figure 1b, which represents the membership function for the cluster center at 0.6. The function does not monotonically decrease as the data samples become more distant from the center. In fact, two minima appear at 0.3 and 0.9, affecting the function monotonicity. The same behavior can be seen for the blue and green lines in Figure 1b (for cluster centers at 0.3 and 0.9, respectively). Hence, for some data samples xm and xn, as well as cluster center vp, the situation that dmp > dnp with ump > unp can arise. Furthermore, as the FCM clustering optimization essentially corresponds to the hill-climbing technique for local searching, the existence of local extrema can yield different clusters depending on the initial values of the search process.
In the abovementioned problem, the one-dimensional case of FCM clustering is analyzed. Therefore, it is reasonable to believe that the non-monotonicity of the membership function is more severe for high-dimensional data. Likewise, as transformer oil chromatography usually considers five-dimensional datasets containing H2, CH4, C2H6, C2H4, and C2H2 content measurements, the local extrema and non-monotonicity of the membership function can cause low accuracy for transformer fault diagnosis when FCM clustering is used for DGA data processing.
3.2. Exponential Membership Function
Based on the local extremum problem, novel similarity and membership functions are proposed in this paper, with the former being expressed as:
and the latter as:
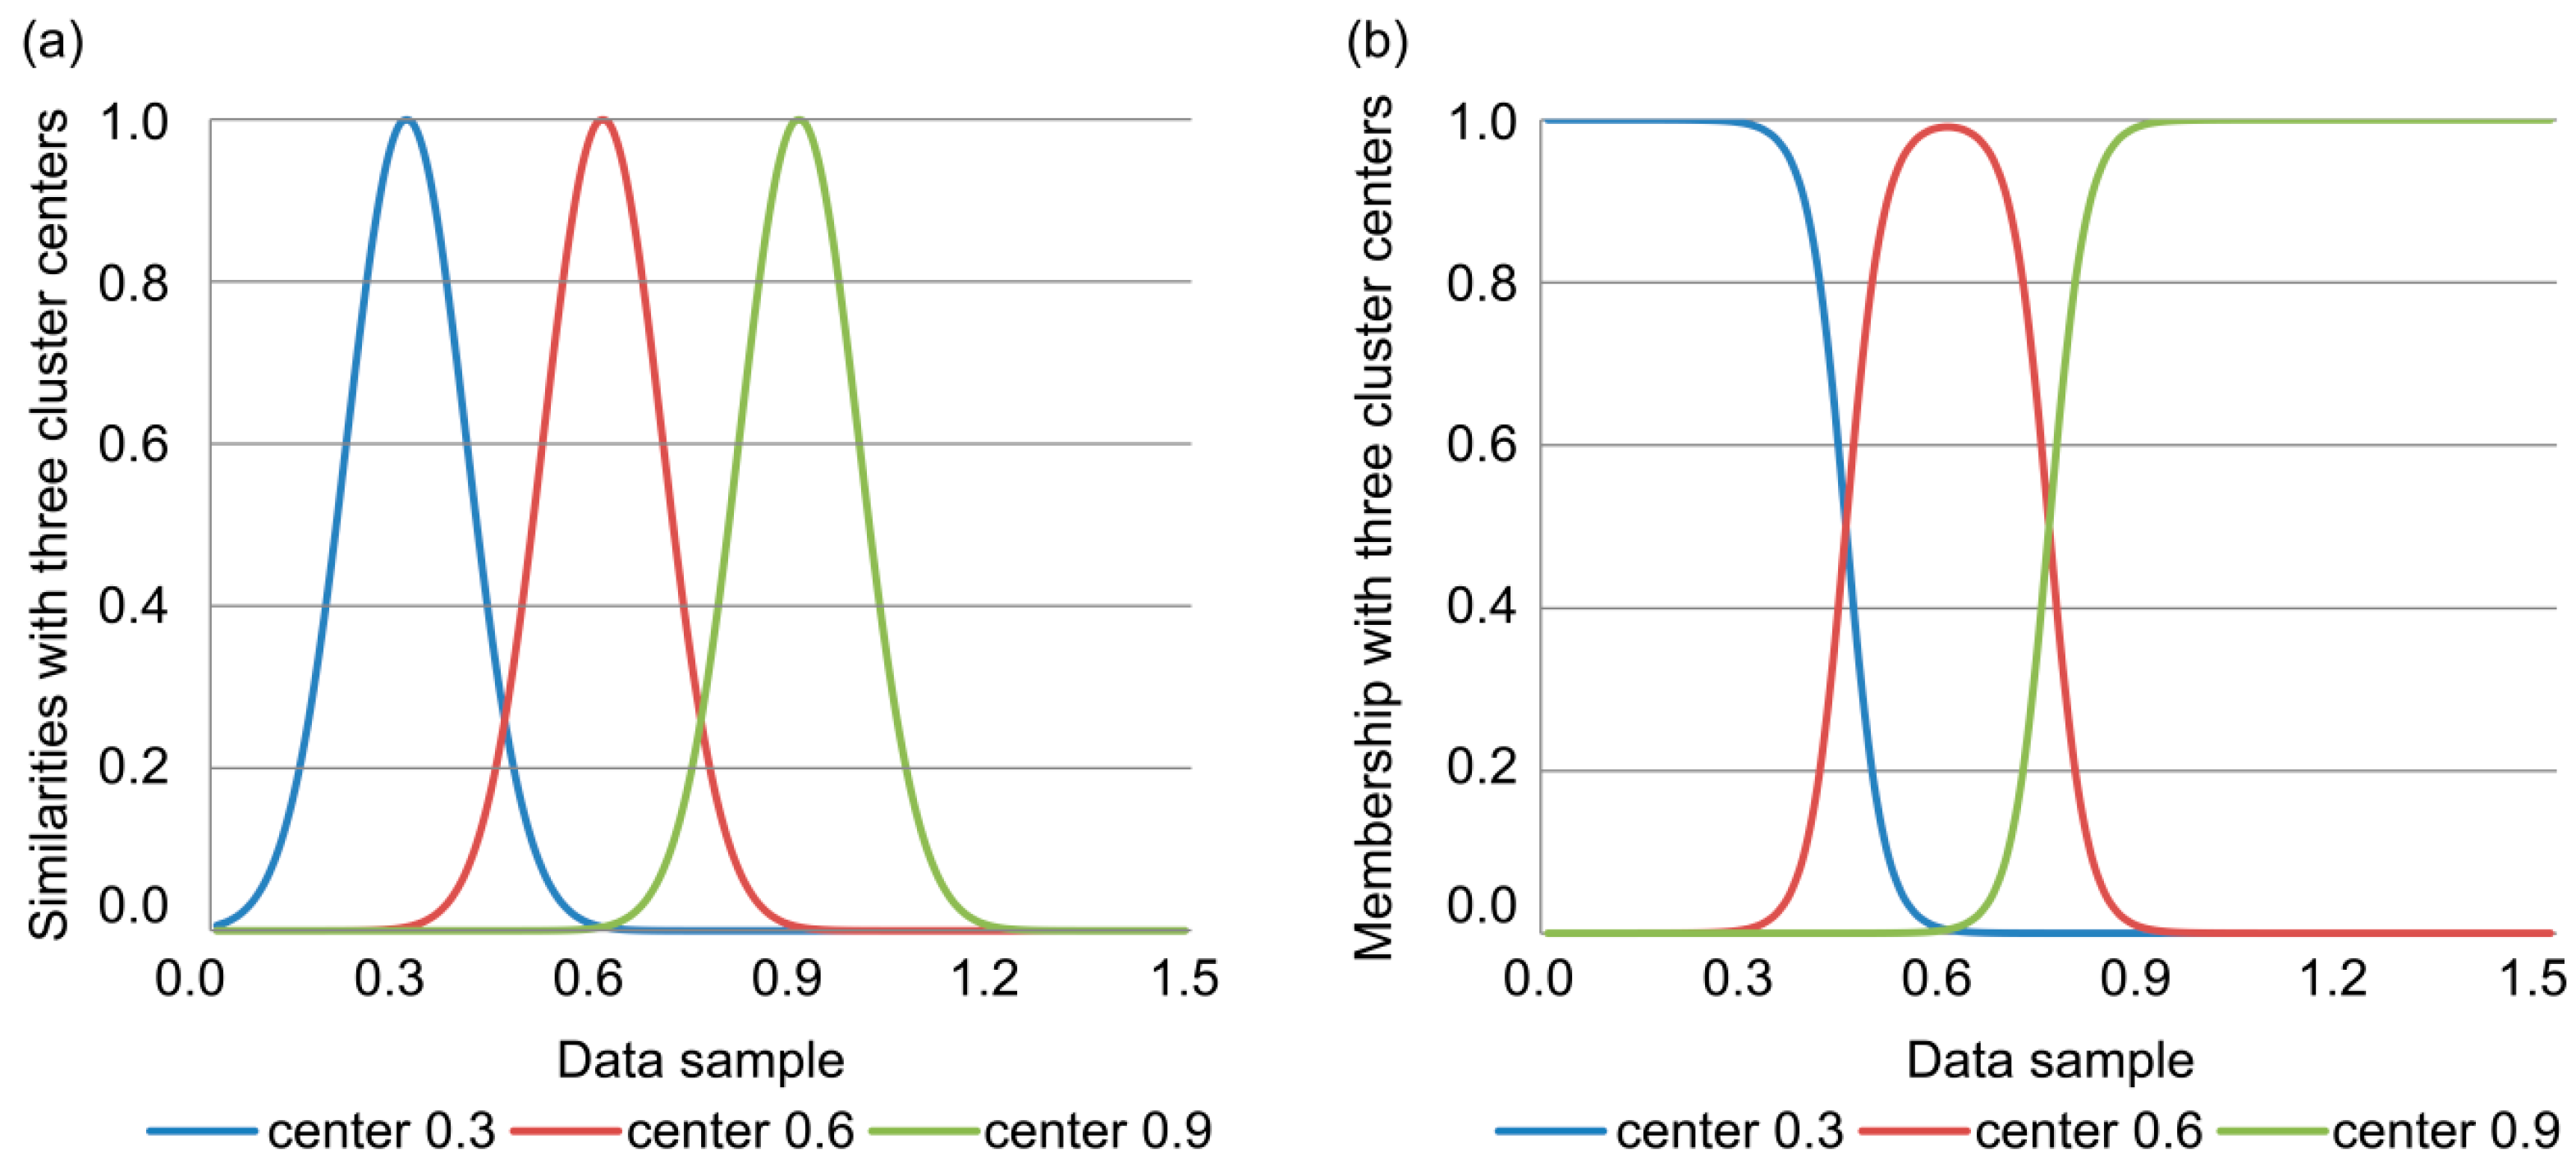
Here, pij represents the similarity between sample xi and cluster center vj, uij represents the degree of membership of the sample to the cluster, and γ is a factor that adjusts the sensitivity of the similarity function. The proposed similarity and membership functions are illustrated in Figure 2a,b, respectively.
Comparing Figure 2 to Figure 1, it is apparent that the improved similarity function (Figure 2a) is smooth, unlike the traditional function (Figure 1a) which exhibits asymptotic points. Likewise, the improved membership function (Figure 2b) does not exhibit local minima, and the degree of membership monotonously decreases with distance between the samples and any cluster center. In fact, the improved membership function smoothly divides the cluster space into three classes, as shown in Figure 2b.
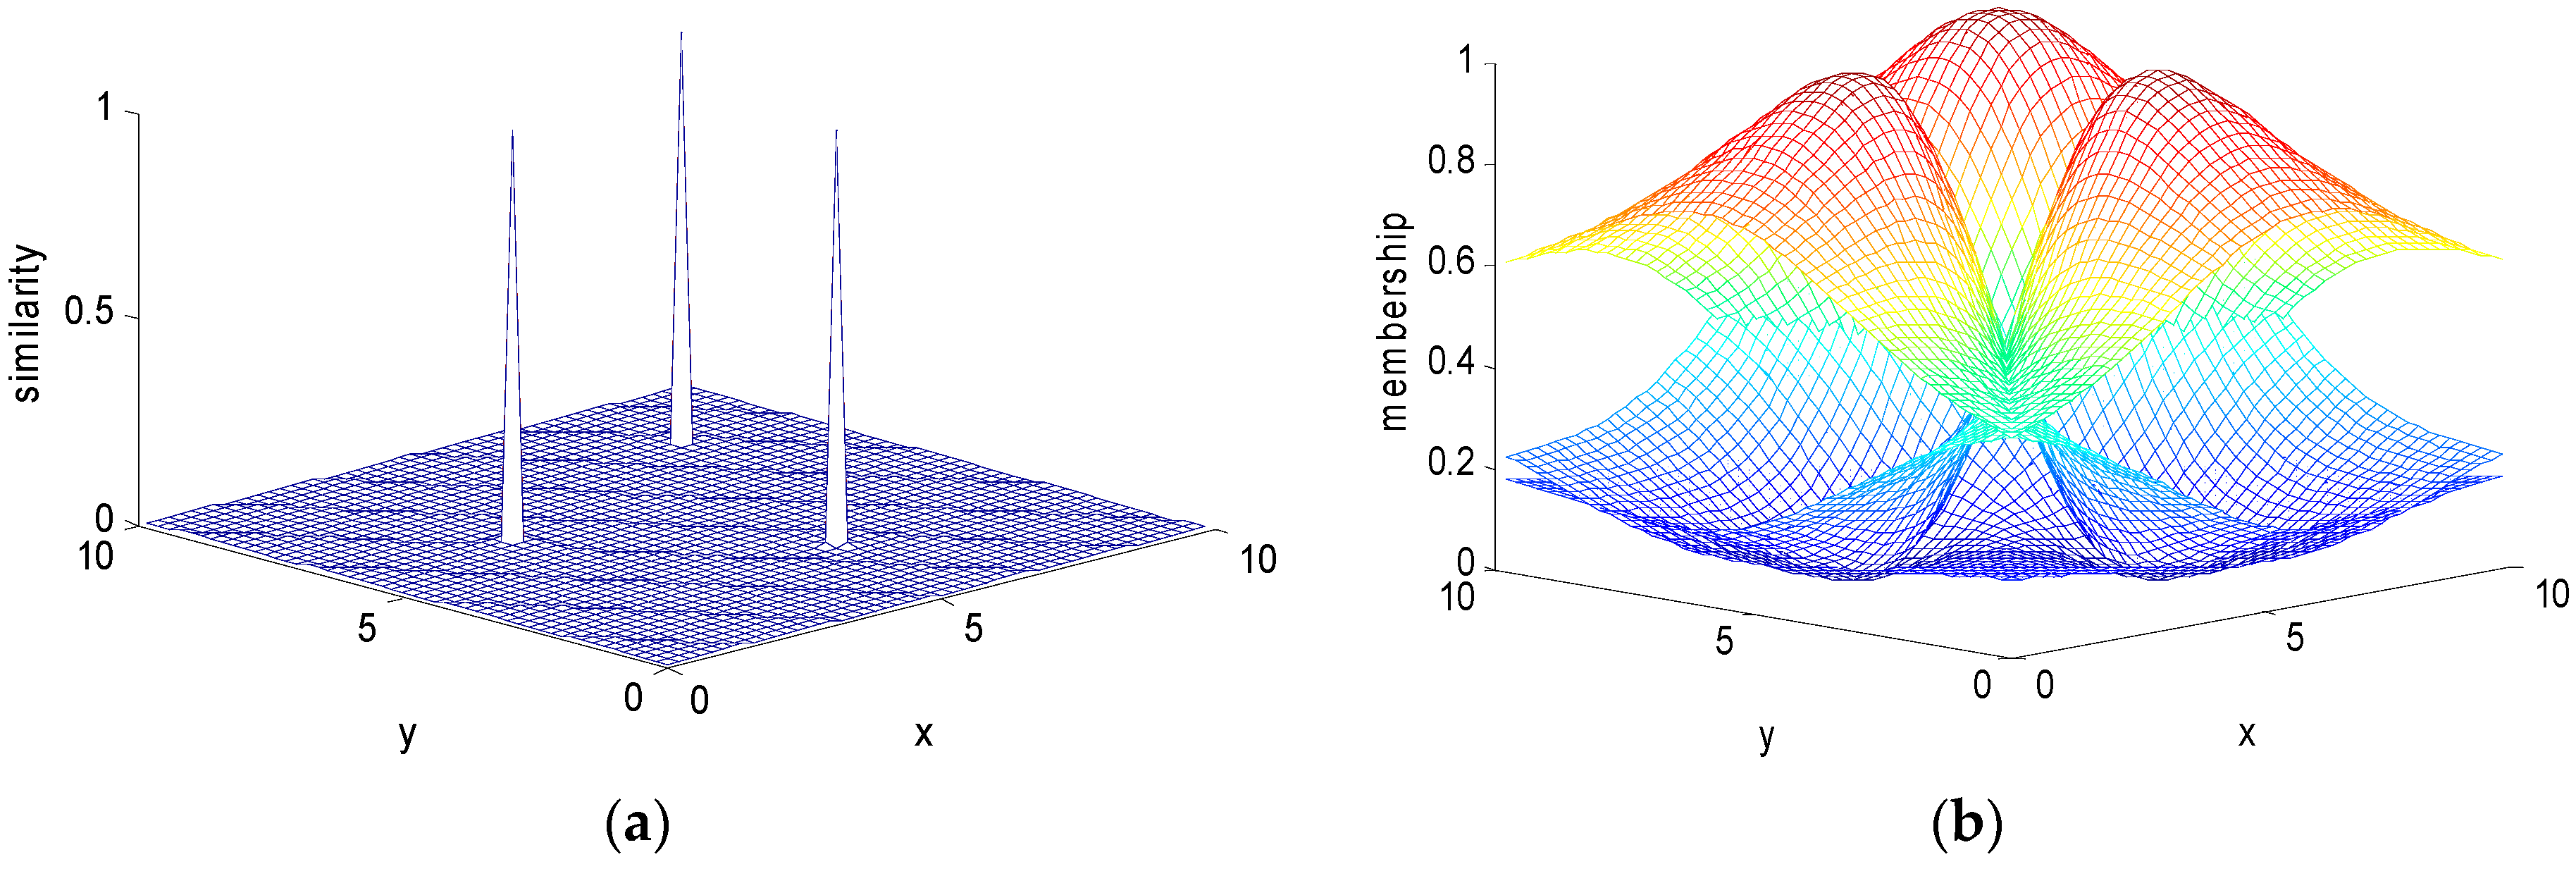
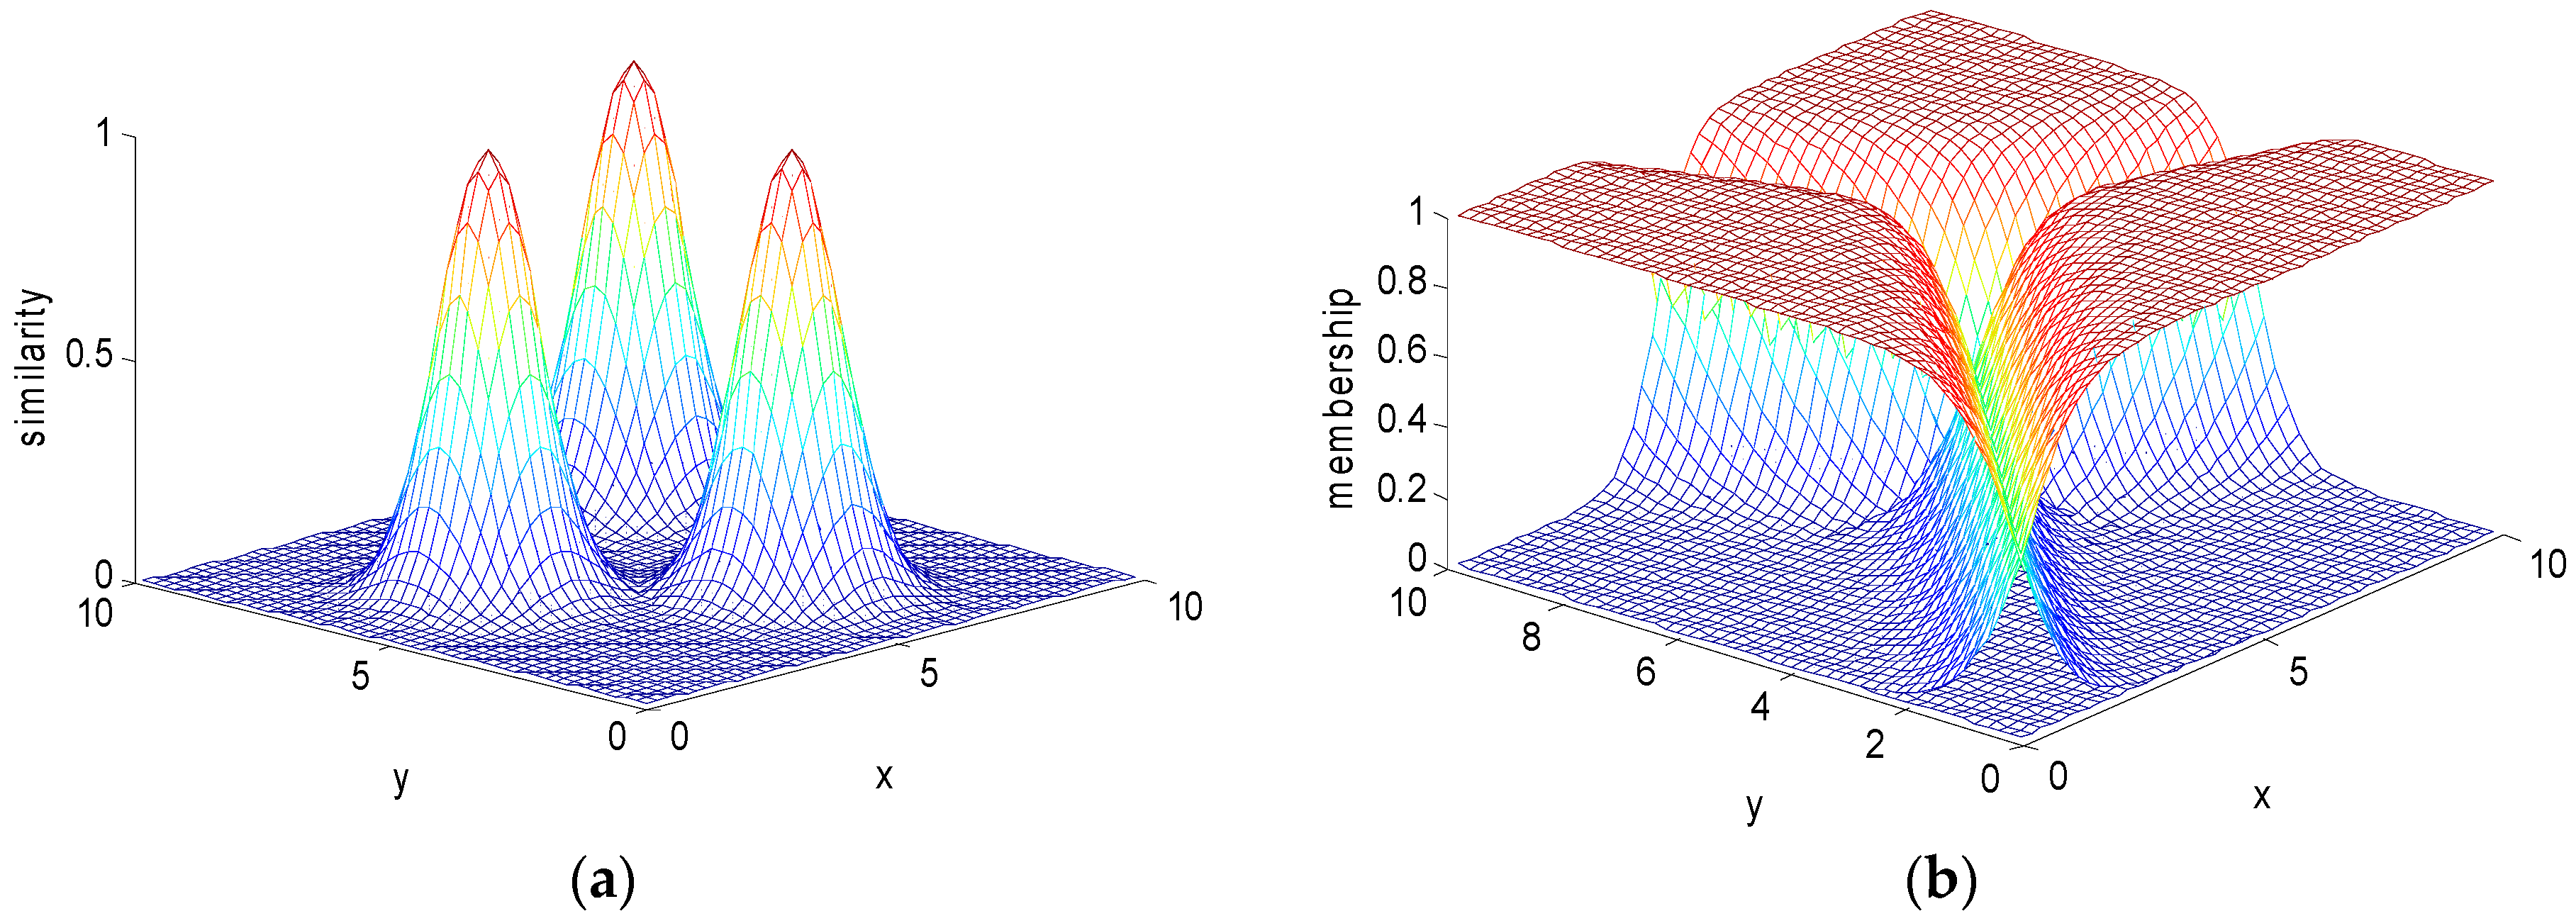
Figure 3 and Figure 4 show the two-dimensional data membership obtained with the transitional and improved FCM, respectively. Similar to Figure 1 and Figure 2, the membership function shown in Figure 3b has many local minima, and the spatial structure of the division is complex. The newly proposed membership function in Figure 4b has no local extremum, which clearly reflects the membership of the three classes on the two-dimensional plane. The improved membership function has superior mathematical properties, which is beneficial to the clustering algorithm classification.
3.3. Sub-Similarity Function
In FCM clustering, the distance between data samples and cluster centers is measured by the vector norm . Hence, information on dimensions with small values can be uncovered using that for dimensions showing relatively high values. In addition, DGA usually considers the Euclidean distance:
where represents the gas numerical difference between the DGA data samples xi and xj. Given the large differences in the H2, CH4, C2H6, C2H4, and C2H2 contents, the contribution of the gases with small concentrations to the distance calculation is negligible, resulting in loss of DGA information. For instance, the H2 content is considerably larger than that of the other gases; thus, the sample membership of each class is mainly determined by the H2 content, with the concentrations of gases such as C2H6 and C2H4 being disregarded.
Furthermore, different gases generally exhibit different features in DGA. For instance, simulations and several field tests [4] have shown that C2H2, H2, and C2H4 allow characterizing discharge, partial discharge, and overheating failures, respectively. However, the contribution of the low-concentration gases is disregarded in Equation (7); thus, proper fault characterization is hindered. Therefore, the following method to calculate the degree of membership is proposed in this paper. First, for DGA data sample xi and cluster center vj, the sub-similarity pijk is calculated for each kth gas, where:
Then, the similarity:
is calculated. Finally, the degree of membership of sample xi to the cluster with center vj is calculated from:
By introducing the sub-similarity function, pijk, the contribution of each gas can be suitably represented for different faults, and addition and subtraction of different gas concentrations can be avoided. Therefore, the membership function reflects the physical characteristics of the different gases more clearly.
3.4. Flow of Improved FCM Clustering Algorithm
The improved FCM clustering algorithm is expressed as follows:
- (1)
- Initialize dataset X.
- (2)
- Select initial cluster center U.
- (3)
- Calculate cluster center V(L + 1) and membership matrix U(L + 1) iteratively using Equations (2) and (10), respectively.
- (4)
- When the iteration accuracy is within the predefined threshold, stop the iterative process and retrieve the clustering results.
4. Application Example
4.1. Clustering of University of California, Irvine (UCI) Iris Dataset
The UCI Iris Dataset is a widely used database in the pattern recognition literature [30,31,32,33,34], and is used to validate the improved clustering algorithm in this paper. The dataset contains three classes of 50 instances each, where each class refers to a type of iris plant; namely, setosa, versicolor, and virginica. Each iris plant has four attributes: its sepal length, sepal width, petal length, and petal width in centimeters. The dataset is collected in the UCI Machine Learning Repository (http://archive.ics.uci.edu/ml) [35]. The conventional and improved FCM algorithms were tested 100 times with clustering of 100 sets of initial point pairs randomly selected from the 150 iris data elements. The convergence criterion was and the fuzzy exponent m = 2. The clustering results are listed in Table 1.
The improved FCM algorithm successfully divided the iris plant data into three classes with a high accuracy rate. The conventional FCM misclassified 16 data elements, numbered 51, 53, 78, 102, 107, 114, 120, 122, 124, 127, 128, 134, 139, 143, 147, and 150. After improvement, eight of these data elements (51, 53, 102, 114, 134, 143, 147, and 150) were correctly clustered, and the accuracy rate increased to 94.67%. The improved clustering algorithm achieved superior performance, a larger partition coefficient, and smaller separation entropy, as apparent from Table 1. This application shows that the improved clustering algorithm successfully achieves classification and exhibits superior performance to the traditional technique.
4.2. Verification Process for DGA Data
Based on data available from different sources [2,3,4], a large amount of transformer DGA data was compiled to validate the method proposed in this article. Note that the faults in large-scale oil-filled power transformers are diverse and involve different levels of complexity. Therefore, the IEC has divided these faults into six categories: low-, middle-, and high-temperature failures, and partial, spark, and arc discharges. These six faults were contained in the considered DGA data, and each data element xi had five attributes; namely, the H2, CH4, C2H6, C2H4, and C2H2 content (unit: µL/L).
Ten data for each of the six faults were selected from the collected DGA data and the dataset was obtained. Further, six samples were randomly selected from the dataset as initial clustering values. A total of 10,000 sets of initial data points for clustering were selected. In addition, the clustering convergence was set to 10−3, where the convergence of each cluster was defined by the difference in the center of each cluster for two consecutive iterations.
In this study, the performance of the FCM clustering algorithm was verified before and after the proposed improvement for DGA data processing. The verification process for both algorithms is summarized as follows:
- (1)
- Initialize DGA dataset X by calculating the proportion of gases related to the various faults. The H2 content in the DGA is usually large. During the initialization process, the percentage of H2 to H2 and hydrocarbons, and the percentage of each hydrocarbon to the total hydrocarbons, are calculated.
- (2)
- Select six DGA data samples to be classified as the starting points for cluster analysis.
- (3)
- Use the (original or improved) FCM clustering algorithm to classify the DGA data, and divide the dataset into six classes.
- (4)
- Determine the fault type that each class represents using statistics, as follows. Determine the number of samples belonging to each fault type in classified subset X. The fault type associated with the largest number of samples defines the subset class. For instance, subset X represents arc discharge if the subset contains more samples classified as this fault type.
- (5)
- Validate the classification with the condition that no subset should be assigned to two fault types, and no fault type should be represented by two different subsets; i.e., the subsets and fault types must form a bijective mapping for the classification process to be considered valid.
- (6)
- Statistically analyze the algorithm accuracy.
4.3. Verification Results
Overall, the verification test showed that the traditional FCM clustering algorithm did not achieve suitable clustering. Specifically, the clustering process either yielded overlapping clusters or assigned two fault types to the same subset. Despite invalid clustering of some initial values, however, the proposed FCM clustering algorithm could effectively classify the DGA data for most initial values and discriminate between the six types of transformer fault. In the following, the detailed quantitative results for each algorithm are presented.
4.3.1. Improved FCM Clustering Algorithm
Six patterns (labeled A–F) were obtained from the 10,000 sets of initial data points for clustering using the improved FCM clustering algorithm. One of the six patterns (pattern A) returned a valid result according to the verification process described in Section 4.2. The cluster centers of the gases according to the six fault types for the six patterns are listed in Table 2. Note that the H2 value is expressed as the percentage of H2 relative to the total gas concentration, whereas the other gas values are expressed as the percentage of their concentrations relative to the total hydrocarbon concentration.
Of the six obtained patterns, only pattern A provided suitable DGA data classification into six classes corresponding to the fault types. In contrast, patterns B to F yielded classification of different subsets to repeated classes, or allocation of different classes to the same subset (denoted “invalid classification” according to the rule in Section 4.2).
The abovementioned classification patterns were obtained from the randomly selected 10,000 sets of initial data points for clustering. From Table 3, 8359 of the sets returned the valid classification pattern A, whereas the remaining 1641 sets returned the other patterns (B to F). The classification accuracy of pattern A reached 93.3%.
Fuzzy clustering algorithms treat clustering as a constrained optimization problem and determine the fuzzy partition of the dataset as the solution. Although the improved algorithm proposed in this paper eliminates the local extrema of the membership function, local extrema may still exist in the objective function, J(U,V). The iterative solution method in the fuzzy clustering algorithm is essentially a hill-climbing method, and the iterative process may terminate at local extrema. Therefore, from the mathematical perspective, the invalid patterns are the results of local extrema for J(U,V).
In addition, Table 3 indicates that the patterns obtained from the proposed FCM clustering algorithm have fast convergence (the average number of iterations is 9.33) and suitable clustering performance. In fact, the separation coefficients are all above 0.8, and the fuzzy entropies remain below 0.3. The FCM clustering algorithm aims to retrieve the minimum value of the objective function through the iterative process. However, Table 3 reveals that the objective function value of the valid pattern A does not correspond to the minimum value among the patterns. In fact, the parameters of patterns B and E are superior to those of pattern A; i.e., they have higher separation coefficients and smaller fuzzy entropy values, and pattern E has a smaller objective function value. Hence, pattern A reflects the local extrema of the objective function rather than the global optimal solution.
4.3.2. Traditional FCM Clustering Algorithm
From the 60 DGA datasets, 10,000 sets of initial data points were also randomly selected for clustering using the traditional algorithm. Six clustering patterns were also obtained with this algorithm, all of which presented overlapping, thus failing to identify the transformer fault types. In fact, the clustering repeatedly returned overlapping centers or mapped two fault types to the same dataset. The patterns with their classes and cluster centers are listed in Table 4. For brevity, only the two patterns with the highest occurrence frequency are presented (see Table 5).
From Table 4, the traditional FCM clustering algorithm always returned overlapping classes; hence, there was no valid pattern. Specifically, the cluster centers of the spark discharge and arc discharge faults were almost identical for pattern 1, as well as those for low-temperature overheating and “invalid classification.” Likewise, the cluster centers for partial discharge, arc discharge, and “invalid classification” were almost identical for pattern 2. The patterns not listed in Table 4 also yielded overlapping; thus, the traditional FCM clustering algorithm cannot correctly identify transformer fault types from DGA data.
Table 5 lists the clustering performance results for the traditional FCM clustering algorithm. The classification rate is 0%. Further, compared with the proposed algorithm, the separation coefficient is small for all patterns, whereas the average fuzzy entropy is high. Moreover, the convergence rate is slow, taking an average of 53.8 iterations.
4.4. Fault Diagnosis
The fault diagnosis steps for DGA dataset x with FCM are as follows:
- (1)
- Normalize x by calculating the gas proportion. Calculate the percentage of H2 to H2 and hydrocarbons, and the percentage of each hydrocarbon to the total hydrocarbons.
- (2)
- Using Equations (8)–(10), calculate the degree of membership between x and cluster centers vj, presented as Pattern A in Table 2.
- (3)
- The degree of membership is the extent to which the dataset belongs to each fault, and the fault type with the highest membership is the diagnosed fault.
For the 60 DGA datasets used in this paper, the improved FCM correctly identified 55 faults, with an accuracy rate of 91.7%. When those data were analyzed with the widely used IEC ratio method, the accuracy rate was 78.3%. As the traditional FCM failed to obtain valid cluster centers, the fault diagnosis accuracy rate was as low as 45%. In general, the overall accuracy of the improved FCM method is as effective as that of IEC ratio method. Moreover, the improved method retains all fault information and is free of the shortcomings of the IEC ratio method with respect to the coding boundary error and code absence.
To further verify the applicability of the improved FCM, a total of 28 field DGA datasets with actual fault details were adopted, as detailed in Table 6. These data were from the book—Typical Cases: Application of Grid Equipment Status Detection Technology (2011–2013) [36], published by the Operation and Maintenance Department of the Chinese State Grid Corporation, which details actual faults found after transformer disassembly.
The degrees of membership of the 28 DGA datasets to each cluster center vj of Pattern A in Table 2 are listed in Table 7.
Twenty-one of the twenty-eight DGA datasets had diagnostic results that matched the actual faults in Table 6. Among the other seven datasets, the DGA datasets numbered 6 and 9 were falsely diagnosed as arc discharge, when their actual faults were high-temperature overheating. However, the diagnosis results for the remaining five DGA datasets were close to the true states of the transformers. Although the thermal faults were divided into low-, mid-, and high-temperature overheating with divisions of 300 °C and 700 °C, the differences between them are not physically clear, and neither is the difference between spark and arc discharge (also known as low- and high-energy discharge, respectively). Therefore, fuzzy clustering can be applied to interpret DGA data, rather than simply being employed for a single fault. The fault of the DGA dataset numbered 28 was 44.95% spark discharge and 45.79% arc discharge. In view of the relevance of the spark and arc discharge, the diagnosis result for dataset 28 is valid. This conclusion also holds for datasets 26, 25, 15, and 3 (highlighted in Table 7), with their diagnosis results also being valid. Therefore, the diagnosis results are highly consistent with the actual faults.
The IEC ratio method codes for these DGA datasets are also listed in Table 7. According to the diagnostic rules, 10 datasets (numbered 6, 8, 9, 13, 15–18, 26, and 28) were misdiagnosed. The accuracy rate was relatively low and the fault severity could not be obtained.
4.5. Discussion
4.5.1. Dissolved Gas Analysis
Detection of certain gases generated in an oil-filled transformer in service is frequently the first available indication of a malfunction that may eventually lead to failure if not corrected. Arcing, partial discharge, low-energy sparking, severe overloading, pump motor failure, and overheating of the insulation are some possible mechanisms. Occurrence of these conditions singly, or as several simultaneous events, can result in decomposition of the insulating materials and formation of some gases. Many techniques for detection and measurement of these gases have been established. However, analysis of these gases and interpretation of their significance is a complex subject involving many factors, such as the transformer type, fault location, oil circulation type and rate, and variables associated with the sampling and measuring procedures. Therefore, the following principal points require special attention:
(1) Gas sources
The gases dissolved in the oil can originate from different sources, and in some cases the gases are not generated by transformer faults. When a transformer is overhauled, the oil exposed to the air can absorb CO2 with content as high as 300 μL/L [2]. If the insulating oil has not been completely degassed after the fault is repaired, the residual gases may remain in the oil. In fact, these gases do not generally affect normal transformer operation. Therefore, these cases should be considered when DGA is used to determine transformer faults.
(2) Gas measurement
Accurate measurement of the dissolved gas content in the oil is a very important DGA analysis step, and itself involves many steps, such as oil sampling from the transformer, degassing from the oil samples, and gas content measurement. The errors of each step must be reduced. Oil sampling from a transformer should be performed in a fully sealed state and the sample should be analyzed as soon as possible. To prevent gas escape, the sample must be sealed and shielded from light. Severe vibration should also be avoided during transportation. Degassing is the main contributor to gas content error; therefore, the degassing result repeatability must be ensured. According to the provisions of IEC 60599-1999 [2], the gas content results for all measurements of the same gas sample should be within ±1.5% of the average value. When the composition and content are measured with a gas chromatograph, the column resolution must meet the quantitative analysis requirements; i.e., the instrument must have stability at baseline and sufficient sensitivity. According to IEC 60599-1999, the minimum detectable gas component concentrations are as follows: , , , and .
(3) Warning values
In normal operation, the insulating oil and organic insulating materials inside the oil-filled transformers generate gases under the actions of heat and electricity. Therefore, warning values are set in practice [3], including gas content and gas growth-rate warning values, which are 150 μL/L and 6 mL/d, respectively, for the total hydrocarbon; 1 μL/L and 0.1 mL/d, respectively, for C2H2; and 150 μL/L and 5 mL/d, respectively, for H2. Fault diagnostics with improved FCM clustering are enabled only when the gas properties exceed the warning values and the gas content continues to increase, indicating that the transformer has a fault.
(4) Comprehensive diagnosis
As the transformer structure is complex, DGA should be combined with other tests to obtain a comprehensive diagnosis of whether the transformer is faulty according to the DGA result. These tests usually include measurement of the winding DC resistance, no-load testing, insulation testing, partial discharge testing, and trace moisture measurement [4]. The structure, operation, maintenance, etc., of the equipment are also factors to be considered. Different measures are implemented depending on the comprehensive fault diagnosis, such as test period shortening, monitoring strengthening, load limiting, scheduling of an internal inspection in the near future, or immediate operation termination.
4.5.2. Improved FCM Performance
In this study, an exponential form of the membership function was proposed that exhibits monotony with respect to distance and, thus, improves the FCM clustering of DGA data. The improved FCM exhibits highly superior performance compared to the traditional technique:
- (1)
- The improved FCM reduces the algorithm sensitivity. In the experiment performed in this study, the traditional FCM algorithm was not suitable for valid transformer fault classification using DGA data, as it could not return a valid pattern containing the six fault types. Different clustering results were obtained for different iteration starting points of the same dataset. In contrast, the improved algorithm could effectively identify the fault types, and a valid pattern for classification appeared for 83.59% of the sets of initial data points for clustering. Thus, the improved algorithm dramatically outperforms the traditional algorithm.
- (2)
- The improved FCM yielded six types of DGA fault. As expected, data samples corresponding to the same fault data were categorized into the same subclass, and different fault data samples were classified into different subclasses.
- (3)
- A total of 28 field DGA datasets with actual fault details were considered to verify the applicability of the improved FCM. The diagnosis results of the improved FCM were highly consistent with the actual faults. The fault diagnosis accuracy rate was considerably higher than that of the IEC ratio method.
- (4)
- The proposed algorithm corresponds to hill-climbing iterative optimization, and convergence to local minima was found; this is an inherent defect of the iterative optimization algorithm.
- (5)
- Disregarding the pattern validity, when converging with the same accuracy (i.e., 10−3), the proposed algorithm required only 9.33 iterations on average compared to the 53.8 required by the traditional algorithm; the separation coefficients of the proposed and traditional algorithms were 0.87 and 0.38, respectively; and the average fuzzy entropies of the proposed and traditional algorithms were 0.23 and 1.26, respectively. Consequently, the proposed algorithm considerably improves the convergence speed of FCM clustering and outperforms the traditional algorithm.
5. Conclusions
FCM clustering is an effective pattern recognition method, but the traditional algorithm is not suitable for transformer fault detection using DGA data. The traditional FCM is prone to misclassification, and the clustering analysis effect may not meet the desired requirements. The iterative solution of the optimization problem essentially corresponds to the “mountain climbing” method of local searching. In that approach, however, the solution can easily fall into the local extrema owing to the initial value sensitivity. In addition, different clustering results are obtained for different iteration starting points of the same dataset, which seriously affects the clustering effect. This article explored the characterization of similarity between samples performed by traditional FCM clustering algorithm using the inverse Euclidean distance, the membership function of which has several extrema. In addition, the degree of membership is not monotonic with respect to distance; therefore, the traditional algorithm does not provide suitable classification of transformer fault types. To overcome this problem, a novel exponential similarity function and membership function were proposed for FCM clustering. Tests on a large DGA dataset showed that the proposed algorithm can effectively identify transformer faults and classify DGA data. Moreover, the proposed algorithm has excellent convergence and clustering performance, which are essential factors for its practical application. In addition, it is worth noting that the objective function of the fuzzy clustering function is nonlinear, and although the proposed technique eliminates the local extremum of the membership function, local extrema may still exist in the objective function. Therefore, the iterative process may terminate at the local extrema, as observed for the invalid patterns discussed in this article. If severely isolated classes exist in the dataset, this defect can be very serious. Therefore, good knowledge of the dataset is necessary before clustering.
Author Contributions
Conceptualization: E.L. and L.W.; Methodology: E.L.; Software: B.S.; Validation: E.L.; Formal Analysis: E.L.; Investigation: E.L.; Data Curation: S.J.; Writing—Original Draft Preparation: E.L.; Writing—Review & Editing: S.J.; Visualization: B.S.
Funding
This research received no external funding.
Conflicts of Interest
The authors declare no conflict of interest.
Nomenclature
| J(U,V) | Square sum of weighted error within class |
| Fuzzy partition matrix | |
| Fault cluster left vectors | |
| DGA dataset | |
| Euclidean distance between sample xi and cluster left vj | |
| m | Weight index |
| pij | Similarity between |
| uij | Degree of membership of xi to vj |
| γ | Factor adjusting similarity function sensitivity |
References
- Clark, F.M. The role of dissolved gases in determining the behavior of mineral insulation oils. J. Franklin Inst. 1933, 215, 39–67. [Google Scholar] [CrossRef]
- British Standards Institute Staff. Mineral Oil-Impregnated Electrical Equipment in Service—Guide to the Interpretation of Dissolved and Free Gases Analysis; IEC: Geneva, Switzerland, 2006. [Google Scholar]
- IEEE. IEEE Guide for the Interpretation of Gases Generated in Oil-Immersed Transformers; IEEE Standard C57.104; IEEE: New York, NY, USA, 2009. [Google Scholar]
- Bakar, N.; Abu-Siada, A.; Islam, S. A review of dissolved gas analysis measurement and interpretation techniques. IEEE Electr. Insul. Mag. 2014, 30, 39–49. [Google Scholar] [CrossRef]
- Faiz, J.; Soleimani, M. Dissolved gas analysis evaluation in electric power transformers using conventional methods a review. IEEE Trans. Dielectr. Electr. Insul. 2017, 24, 1239–1248. [Google Scholar] [CrossRef]
- Mani, G.; Jerome, J. Intuitionistic fuzzy expert system based fault diagnosis using dissolved gas analysis for power transformer. J. Electr. Eng. Technol. 2014, 9, 2058–2064. [Google Scholar] [CrossRef]
- Lin, C.E.; Ling, J.M.; Huang, C.L. An expert system for transformer fault diagnosis using dissolved gas analysis. IEEE Trans. Power Deliv. 1993, 8, 231–238. [Google Scholar] [CrossRef]
- Boczar, T.; Cichon, A.; Borucki, S. Diagnostic expert system of transformer insulation systems using the acoustic emission method. IEEE Trans. Dielectr. Electr. Insul. 2014, 21, 854–865. [Google Scholar] [CrossRef]
- Lin, J.; Sheng, G.; Yan, Y.; Dai, J.; Jiang, X. Prediction of dissolved gas concentrations in transformer oil based on the KPCA-FFOA-GRNN Model. Energies 2018, 11, 225. [Google Scholar] [CrossRef]
- Yi, J.H.; Wang, J.; Wang, G.G. Improved probabilistic neural networks with self-adaptive strategies for transformer fault diagnosis problem. Adv. Mech. Eng. 2016, 8, 1–13. [Google Scholar] [CrossRef]
- Zhang, Y.; Ding, X.; Liu, Y.; Griffin, P.J. An artificial neural network approach to transformer fault diagnosis. IEEE Trans. Power Deliv. 1996, 11, 1836–1841. [Google Scholar] [CrossRef] [Green Version]
- Huang, Y.C.; Yang, H.T.; Huang, C.L. Developing a new transformer fault diagnosis system through evolutionary fuzzy logic. IEEE Trans. Power Deliv. 1997, 12, 761–767. [Google Scholar] [CrossRef]
- Huang, Y.C.; Sun, H.C. Dissolved gas analysis of mineral oil for power transformer fault diagnosis using fuzzy logic. IEEE Trans. Dielectr. Electr. Insul. 2013, 20, 974–981. [Google Scholar] [CrossRef]
- Abu-Siada, A.; Hmood, S. A new fuzzy logic approach to identify power transformer criticality using dissolved gas-in-oil analysis. Int. J. Electr. Power Energy Syst. 2015, 67, 401–408. [Google Scholar] [CrossRef]
- Noori, M.; Effatnejad, R.; Hajihosseini, P. Using dissolved gas analysis results to detect and isolate the internal faults of power transformers by applying a fuzzy logic method. IET Gener. Transm. Distrib. 2017, 11, 2721–2729. [Google Scholar] [CrossRef]
- Cai, J.D.; Wang, S.F. Application of decision rules for IEC-60599 three-ratio fault diagnosis based on rough set theory. Proc. CSEE 2015, 25, 134–139. [Google Scholar]
- Cheng, L.; Yu, T.; Wang, G.; Yang, B.; Zhou, L. Hot spot temperature and grey target theory-based dynamic modelling for reliability assessment of transformer oil-paper insulation systems: A practical case study. Energies 2018, 11, 249. [Google Scholar] [CrossRef]
- Zeng, F.; Cheng, X.; Guo, J.C.; Tao, L.; Chen, Z.X. Hybridising human judgment, AHP, grey theory, and fuzzy expert systems for candidate well selection in fractured reservoirs. Energies 2017, 10, 447. [Google Scholar] [CrossRef]
- Li, Y.; Shu, N. Transformer fault diagnosis based on fuzzy clustering and complete binary tree support vector machine. Trans. China Electrotech. Soc. 2016, 31, 64–70. [Google Scholar]
- Bigdeli, M.; Vakilian, M.; Rahimpour, E. Transformer winding faults classification based on transfer function analysis by support vector machine. IET Electr. Power Appl. 2012, 6, 268–276. [Google Scholar] [CrossRef]
- Cheng, L.; Yu, T. Dissolved gas analysis principle-based intelligent approaches to fault diagnosis and decision making for large oil-immersed power transformers: A survey. Energies 2018, 11, 913. [Google Scholar] [CrossRef]
- Jain, A.K.; Duin, R.P.; Mao, J. Statistical pattern recognition: A review. IEEE Trans. Pattern Anal. Mach. Intell. 2000, 22, 4–37. [Google Scholar] [CrossRef]
- Dunn, J.C. A fuzzy relative of the ISODATA process and its use in detecting compact well-separated clusters. J. Cybern. 1973, 3, 32–57. [Google Scholar] [CrossRef]
- Bezdek, J.C. Pattern Recognition with Fuzzy Objective Function Algorithms; Springer: New York, NY, USA, 1981. [Google Scholar]
- Krishnapuram, R.; Keller, J.M. A possibilistic approach to clustering. IEEE Trans. Fuzzy Syst. 1993, 2, 98–110. [Google Scholar] [CrossRef]
- Pal, N.R.; Pal, K.; Keller, J.M.; Bezdek, J.C. A possibilistic fuzzy c-means clustering algorithm. IEEE Trans. Fuzzy Syst. 2005, 13, 517–530. [Google Scholar] [CrossRef]
- Qu, F.; Ma, S.; Hu, Y. Generalized possibilistic c-means clustering based on differential evolution algorithm. In Proceedings of the International Workshop on Intelligent Systems and Applications, Wuhan, China, 23–24 May 2009. [Google Scholar]
- Filippone, M.; Camastra, F.; Masulli, F.; Rovetta, S. A survey of kernel and spectral methods for clustering. Pattern Recognit. 2008, 41, 176–190. [Google Scholar] [CrossRef] [Green Version]
- Askari, S.; Montazerin, N.; Zarandi, M.F.; Hakimi, E. Generalized entropy based possibilistic fuzzy c-means for clustering noisy data and its convergence proof. Neurocomputing 2017, 219, 186–202. [Google Scholar] [CrossRef]
- Yuab, Z.; Wong, H.S.; Han, G. From cluster ensemble to structure ensemble. Inf. Sci. 2012, 198, 81–99. [Google Scholar]
- Carvalho, F.; Lechevallier, Y. Partitioning hard clustering algorithms based on multiple dissimilarity matrices. Pattern Recognit. 2012, 45, 447–464. [Google Scholar] [CrossRef]
- Ma, L.; Destercke, S.; Wang, Y. Online active learning of decision trees with evidential data. Pattern Recognit. 2016, 52, 33–45. [Google Scholar] [CrossRef] [Green Version]
- Lu, N.; Lu, J.; Zhang, G. A concept drift-tolerant case-base editing technique. Artif. Intell. 2016, 230, 108–133. [Google Scholar] [CrossRef] [Green Version]
- Vega, C.; Escalante, H.J. An online and incremental GRLVQ algorithm for prototype generation based on granular computing. Soft Comput. 2016, 21, 3931–3944. [Google Scholar] [CrossRef]
- Lichman, M. UCI Machine Learning Repository; University of California, School of Information and Computer Science: Irvine, CA, USA, 2013; Available online: http://archive.ics.uci.edu/ml (accessed on 1 June 2018).
- State Grid Corporation Operation and Maintenance Department. Typical Cases: Application of Grid Equipment Status Detection Technology; China Electric Power Press: Beijing, China, 2014; pp. 76–191. [Google Scholar]
Figure 1.
Fuzzy c-means (FCM) clustering algorithm for one-dimensional data: (a) similarity and (b) membership functions.
Figure 1.
Fuzzy c-means (FCM) clustering algorithm for one-dimensional data: (a) similarity and (b) membership functions.

Figure 2.
Proposed FCM clustering algorithm for one-dimensional data: (a) similarity and (b) membership functions.
Figure 2.
Proposed FCM clustering algorithm for one-dimensional data: (a) similarity and (b) membership functions.

Figure 3.
Two-dimensional dataset with three centers (traditional FCM): (a) similarity function; (b) membership function.
Figure 3.
Two-dimensional dataset with three centers (traditional FCM): (a) similarity function; (b) membership function.

Figure 4.
Two-dimensional dataset with three centers (improved FCM): (a) similarity function; (b) membership function.
Figure 4.
Two-dimensional dataset with three centers (improved FCM): (a) similarity function; (b) membership function.


Table 1.
Iris cluster results obtained with conventional and improved FCM.
| Accuracy Rate | Number of Misclassifications | Partition Coefficient | Separation Entropy | Iterations * | |
|---|---|---|---|---|---|
| Conventional FCM | 89.33% | 16 | 0.783 | 0.40 | 7/16.5/47 |
| Improved FCM | 94.67% | 8 | 0.954 | 0.074 | 6/16.6/28 |
* The values indicate the minimum/average/maximum number of iterations required to determine the clusters.
Table 2.
Cluster centers obtained from dissolved gas analysis (DGA) data using proposed FCM clustering algorithm.
Table 2.
Cluster centers obtained from dissolved gas analysis (DGA) data using proposed FCM clustering algorithm.
| Pattern A (Valid) | |||||
| H2 | CH4 | C2H6 | C2H4 | C2H2 | |
| Low-temperature overheating | 0.3244 | 0.5087 | 0.1779 | 0.3129 | 0.0005 |
| Mid-temperature overheating | 0.0946 | 0.3636 | 0.2065 | 0.4275 | 0.0024 |
| High-temperature overheating | 0.1504 | 0.2764 | 0.1241 | 0.5943 | 0.0052 |
| Partial discharge | 0.9079 | 0.5055 | 0.2884 | 0.1915 | 0.0147 |
| Spark discharge | 0.4344 | 0.2520 | 0.0565 | 0.1483 | 0.5433 |
| Arc discharge | 0.4704 | 0.2540 | 0.0451 | 0.3202 | 0.3807 |
| Pattern B | |||||
| H2 | CH4 | C2H6 | C2H4 | C2H2 | |
| Low-temperature overheating | 0.3253 | 0.5080 | 0.1770 | 0.3133 | 0.0017 |
| Mid-temperature overheating | 0.0946 | 0.3636 | 0.2065 | 0.4275 | 0.0024 |
| High-temperature overheating | 0.1504 | 0.2764 | 0.1241 | 0.5943 | 0.0052 |
| Partial discharge | 0.8918 | 0.5549 | 0.3469 | 0.0967 | 0.0015 |
| Invalid classification | 0.4548 | 0.2449 | 0.0518 | 0.2314 | 0.4669 |
| Partial discharge | 0.9412 | 0.4078 | 0.1728 | 0.3783 | 0.0411 |
| Pattern C | |||||
| H2 | CH4 | C2H6 | C2H4 | C2H2 | |
| Low-temperature overheating | 0.3258 | 0.5081 | 0.1770 | 0.3133 | 0.0017 |
| Mid-temperature overheating | 0.0934 | 0.3744 | 0.2067 | 0.4171 | 0.0019 |
| High-temperature overheating | 0.1477 | 0.3061 | 0.1045 | 0.5848 | 0.0046 |
| Partial discharge | 0.9079 | 0.5055 | 0.2884 | 0.1915 | 0.0147 |
| Invalid classification | 0.4548 | 0.2499 | 0.0518 | 0.2313 | 0.4670 |
| Invalid classification | 0.1488 | 0.2391 | 0.1658 | 0.5892 | 0.0059 |
| Pattern D | |||||
| H2 | CH4 | C2H6 | C2H4 | C2H2 | |
| Low-temperature overheating | 0.3210 | 0.5072 | 0.1781 | 0.3143 | 0.0005 |
| Spark discharge | 0.3311 | 0.2578 | 0.0510 | 0.1462 | 0.5450 |
| High-temperature overheating | 0.1249 | 0.3112 | 0.1613 | 0.5234 | 0.0041 |
| Partial discharge | 0.9079 | 0.5055 | 0.2884 | 0.1915 | 0.0147 |
| Spark discharge | 0.5193 | 0.2589 | 0.0592 | 0.1591 | 0.5228 |
| Arc discharge | 0.4645 | 0.2566 | 0.0444 | 0.3277 | 0.3713 |
| Pattern E | |||||
| H2 | CH4 | C2H6 | C2H4 | C2H2 | |
| Low-temperature overheating | 0.3210 | 0.5072 | 0.1781 | 0.3143 | 0.0005 |
| Partial discharge | 0.8918 | 0.5549 | 0.3469 | 0.0967 | 0.0015 |
| High-temperature overheating | 0.1249 | 0.3112 | 0.1613 | 0.5234 | 0.0041 |
| Partial discharge | 0.9412 | 0.4078 | 0.1728 | 0.3783 | 0.0411 |
| Spark discharge | 0.4344 | 0.2520 | 0.0565 | 0.1483 | 0.5433 |
| Arc discharge | 0.4645 | 0.2566 | 0.0444 | 0.3277 | 0.3713 |
| Pattern F | |||||
| H2 | CH4 | C2H6 | C2H4 | C2H2 | |
| Low-temperature overheating | 0.3253 | 0.5080 | 0.1770 | 0.3133 | 0.0017 |
| Mid-temperature overheating | 0.0946 | 0.3636 | 0.2065 | 0.4275 | 0.0024 |
| High-temperature overheating | 0.1504 | 0.2764 | 0.1241 | 0.5943 | 0.0052 |
| Partial discharge | 0.9079 | 0.5055 | 0.2884 | 0.1915 | 0.0147 |
| Partial discharge | 0.9079 | 0.5055 | 0.2884 | 0.1915 | 0.0147 |
| Invalid classification | 0.4548 | 0.2499 | 0.0518 | 0.2313 | 0.4669 |
Table 3.
Performance of proposed FCM clustering algorithm.
| Separation Coefficient | Fuzzy Entropy | Objective Function | Iterations * | Frequency | |
|---|---|---|---|---|---|
| Pattern A | 0.8658 | 0.2402 | 0.9437 | 6/9/38 | 8359 |
| Pattern B | 0.9111 | 0.1613 | 0.9498 | 5/7.3/20 | 812 |
| Pattern C | 0.8342 | 0.2889 | 1.1786 | 12/22.8/71 | 16 |
| Pattern D | 0.8758 | 0.2184 | 1.0556 | 9/15.6/69 | 644 |
| Pattern E | 0.9232 | 0.1379 | 0.878 | 8/12.1/15 | 73 |
| Pattern F | 0.8381 | 0.2604 | 1.0032 | 5/7.5/16 | 96 |
| General scores | Classification rate: 83.59%; average separation coefficient: 0.87; average fuzzy entropy: 0.23; average number of iterations: 9.33 | ||||
* The values indicate the minimum/average/maximum number of iterations required to determine the clusters.
Table 4.
Cluster centers obtained from DGA data using traditional FCM clustering algorithm *.
| Pattern 1 | |||||
| H2 | CH4 | C2H6 | C2H4 | C2H2 | |
| Low-temperature overheating | 0.3372 | 0.4218 | 0.1659 | 0.3507 | 0.0617 |
| Invalid classification | 0.3373 | 0.4216 | 0.1658 | 0.3507 | 0.0619 |
| High-temperature overheating | 0.1783 | 0.3329 | 0.1682 | 0.4752 | 0.0291 |
| Partial discharge | 0.7620 | 0.4629 | 0.2525 | 0.2197 | 0.0649 |
| Spark discharge | 0.4637 | 0.2848 | 0.0829 | 0.2583 | 0.3740 |
| Arc discharge | 0.4634 | 0.2852 | 0.0831 | 0.2589 | 0.3728 |
| Pattern 2 | |||||
| H2 | CH4 | C2H6 | C2H4 | C2H2 | |
| Low-temperature overheating | 0.3660 | 0.4250 | 0.1694 | 0.3414 | 0.0642 |
| Invalid classification | 0.4853 | 0.3831 | 0.1622 | 0.2929 | 0.1618 |
| High-temperature overheating | 0.2011 | 0.3428 | 0.1654 | 0.4562 | 0.0355 |
| Partial discharge | 0.4872 | 0.3825 | 0.1619 | 0.2920 | 0.1635 |
| Spark discharge | 0.4751 | 0.2850 | 0.0852 | 0.2579 | 0.3719 |
| Arc discharge | 0.4872 | 0.3825 | 0.1619 | 0.2920 | 0.1636 |
* The highlighted classes sharing the same gray tone exhibit overlapping.
Table 5.
Performance of traditional FCM clustering algorithm.
| Separation Coefficient | Fuzzy Entropy | Objective Function | Iterations * | Frequency | |
|---|---|---|---|---|---|
| Pattern 1 | 0.3867 | 1.2389 | 1.0367 | 27/53/121 | 8500 |
| Pattern 2 | 0.3426 | 1.4034 | 1.3387 | 25/58/153 | 1488 |
| Pattern 3 | 0.3398 | 1.3878 | 1.3099 | 17/35.8/48 | 6 |
| Pattern 4 | 0.3715 | 1.2568 | 1.0375 | 29/43/49 | 4 |
| Pattern 5 | 0.3186 | 1.4501 | 1.3628 | 54 | 1 |
| Pattern 6 | 0.3669 | 1.3383 | 1.2571 | 48 | 1 |
| General scores | Classification rate: 0%; average separation coefficient: 0.38; average fuzzy entropy: 1.26; average number of iterations: 53.8 | ||||
* The values indicate the minimum/average/maximum number of iterations required to determine the clusters.
Table 6.
Field DGA data with actual faults.
| Num | H2 | CH4 | C2H6 | C2H4 | C2H2 | Code ++ | Actual Fault ** |
|---|---|---|---|---|---|---|---|
| 1 | 54.54 | 71.93 | 9.72 | 97.37 | 6.58 | 022 | High heat |
| 2 | 116.17 | 180.83 | 52.48 | 278.18 | 5.36 | 022 | High heat |
| 3 | 5760 | 540 | 40.5 | 1000 | 2760 | 112 | Arc discharge |
| 4 | 50.18 | 171.12 | 74.7 | 148.69 | 0 | 021 | Mid heat |
| 5 | 20 | 80.2 | 24.6 | 68.6 | 0 | 021 | Mid heat |
| 6 # | 28.97 | 10.94 | 1.64 | 6.96 | 4.36 | 102 | High heat |
| 7 | 15.9 | 55.98 | 22.33 | 137.25 | 0.21 | 022 | High heat |
| 8 # | 47.6 | 19.1 | 4.21 | 27 | 0.72 | 002 | Low heat |
| 9 # | 40 | 102.6 | 32.3 | 183.3 | 0.2 | 022 | Arc discharge |
| 10 | 50.35 | 65.58 | 21.05 | 99.13 | 0.96 | 022 | High heat |
| 11 | 2.369 | 119.69 | 21.891 | 20.15 | 0 | 020 | Low heat |
| 12 | 120.45 | 210.91 | 35.7 | 285.39 | 15.86 | 022 | High heat |
| 13 # | 87.17 | 17.26 | 3.94 | 12.87 | 32.81 | 102 | Spark discharge |
| 14 | 5.48 | 48.82 | 96.81 | 489.57 | 0.3 | 022 | High heat |
| 15 # | 605 | 1586 | 655 | 1901 | 2.3 | 021 | High heat |
| 16 # | 1.96 | 2.1 | 0.5 | 0.67 | 1.59 | 121 | Spark discharge |
| 17 # | 462 | 212.4 | 31.6 | 0 | 0 | 000 | Partial discharge |
| 18 # | 25.4 | 54.97 | 8.72 | 77.84 | 10.47 | 122 | High heat |
| 19 | 131.7 | 116.55 | 19.4 | 183.97 | 0.32 | 002 | High heat |
| 20 | 7911.85 | 947.43 | 96.93 | 907.19 | 4844.48 | 202 | Spark discharge |
| 21 | 21 | 2.01 | 0.46 | 1.48 | 5.61 | 212 | Spark discharge |
| 22 | 676.74 | 969.55 | 570.57 | 2483.26 | 17.48 | 022 | High heat |
| 23 | 7238.97 | 695.16 | 231.6 | 2394.3 | 2308.92 | 112 | Arc discharge |
| 24 | 101.5 | 24.45 | 8.97 | 128.37 | 0 | 002 | High heat |
| 25 | 73.8 | 148 | 38.9 | 181 | 1.76 | 022 | High heat |
| 26 # | 34.76 | 5.52 | 2.09 | 4.97 | 10.36 | 101 | Spark discharge |
| 27 | 18.19 | 21.99 | 6.58 | 46.92 | 3.97 | 022 | High heat |
| 28 # | 1.6 | 1 | 0.1 | 0.9 | 1.6 | 102 | Spark discharge |
++ IEC ratio method code; # The DGA data were misdiagnosed by the IEC ratio method. ** Low-, mid-, high-temperature overheating are abbreviated to low-, mid-, and high heat, respectively.
Table 7.
Degree to which 28 DGA datasets are associated with each fault.
| Num | Low Heat | Mid Heat | High Heat | Partial Discharge | Spark Discharge | Arc Discharge | Diagnosis Result |
|---|---|---|---|---|---|---|---|
| 1 | 0.2281 | 0.3140 | 0.4022 | 0.0009 | 0.0055 | 0.0494 | High heat |
| 2 | 0.1759 | 0.3506 | 0.4404 | 0.0004 | 0.0030 | 0.0297 | High heat |
| 3 | 0.0018 | 0.0005 | 0.0006 | 0.0008 | 0.6078 | 0.3884 | Spark discharge |
| 4 | 0.2795 | 0.4668 | 0.2310 | 0.0005 | 0.0035 | 0.0186 | Mid heat |
| 5 | 0.2787 | 0.4553 | 0.2446 | 0.0004 | 0.0031 | 0.0178 | Mid heat |
| 6 | 0.3422 | 0.0517 | 0.0369 | 0.0975 | 0.1168 | 0.3549 | Arc discharge |
| 7 | 0.0606 | 0.3298 | 0.5978 | 0.0000 | 0.0008 | 0.0110 | High heat |
| 8 | 0.3823 | 0.1645 | 0.2761 | 0.0278 | 0.0118 | 0.1375 | Low heat |
| 9 | 0.1112 | 0.3650 | 0.5056 | 0.0001 | 0.0015 | 0.0166 | High heat |
| 10 | 0.1990 | 0.3411 | 0.4222 | 0.0007 | 0.0034 | 0.0337 | High heat |
| 11 | 0.5685 | 0.3759 | 0.0443 | 0.0006 | 0.0036 | 0.0071 | Low heat |
| 12 | 0.2006 | 0.3483 | 0.4108 | 0.0005 | 0.0041 | 0.0357 | High heat |
| 13 | 0.0142 | 0.0027 | 0.0021 | 0.0067 | 0.5265 | 0.4477 | Spark discharge |
| 14 | 0.0135 | 0.2212 | 0.7604 | 0.0000 | 0.0002 | 0.0046 | High heat |
| 15 | 0.2080 | 0.4343 | 0.3341 | 0.0004 | 0.0028 | 0.0204 | Mid heat |
| 16 | 0.2046 | 0.0857 | 0.0271 | 0.0049 | 0.3504 | 0.3274 | Spark discharge |
| 17 | 0.3046 | 0.0050 | 0.0006 | 0.6729 | 0.0058 | 0.0110 | Partial discharge |
| 18 | 0.1677 | 0.3624 | 0.4220 | 0.0003 | 0.0057 | 0.0421 | High heat |
| 19 | 0.2242 | 0.2697 | 0.4516 | 0.0016 | 0.0039 | 0.0490 | High heat |
| 20 | 0.0008 | 0.0002 | 0.0002 | 0.0003 | 0.7415 | 0.2570 | Spark discharge |
| 21 | 0.0031 | 0.0004 | 0.0003 | 0.0066 | 0.6176 | 0.3720 | Spark discharge |
| 22 | 0.0824 | 0.3229 | 0.5744 | 0.0001 | 0.0014 | 0.0188 | High heat |
| 23 | 0.0192 | 0.0088 | 0.0198 | 0.0046 | 0.2656 | 0.6819 | Arc discharge |
| 24 | 0.0601 | 0.1300 | 0.7574 | 0.0007 | 0.0016 | 0.0501 | High heat |
| 25 | 0.2245 | 0.3828 | 0.3624 | 0.0005 | 0.0032 | 0.0266 | Mid heat |
| 26 | 0.0191 | 0.0035 | 0.0030 | 0.0138 | 0.4644 | 0.4962 | Arc discharge |
| 27 | 0.1142 | 0.3027 | 0.5392 | 0.0002 | 0.0037 | 0.0400 | High heat |
| 28 | 0.0416 | 0.0292 | 0.0210 | 0.0008 | 0.4495 | 0.4579 | Arc discharge |
© 2018 by the authors. Licensee MDPI, Basel, Switzerland. This article is an open access article distributed under the terms and conditions of the Creative Commons Attribution (CC BY) license (http://creativecommons.org/licenses/by/4.0/).
Share and Cite
MDPI and ACS Style
Li, E.; Wang, L.; Song, B.; Jian, S. Improved Fuzzy C-Means Clustering for Transformer Fault Diagnosis Using Dissolved Gas Analysis Data. Energies 2018, 11, 2344. https://doi.org/10.3390/en11092344
AMA Style
Li E, Wang L, Song B, Jian S. Improved Fuzzy C-Means Clustering for Transformer Fault Diagnosis Using Dissolved Gas Analysis Data. Energies. 2018; 11(9):2344. https://doi.org/10.3390/en11092344
Chicago/Turabian StyleLi, Enwen, Linong Wang, Bin Song, and Siliang Jian. 2018. "Improved Fuzzy C-Means Clustering for Transformer Fault Diagnosis Using Dissolved Gas Analysis Data" Energies 11, no. 9: 2344. https://doi.org/10.3390/en11092344
Note that from the first issue of 2016, this journal uses article numbers instead of page numbers. See further details here.