Planning of Electric Vehicle Charging Infrastructure for Urban Areas with Tight Land Supply

State Key Laboratory of Alternate Electrical Power System with Renewable Energy Sources, North China Electric Power University, Changping District, Beijing 102206, China
*
Author to whom correspondence should be addressed.
Energies 2018, 11(9), 2314; https://doi.org/10.3390/en11092314
Submission received: 26 August 2018
/
Revised: 29 August 2018
/
Accepted: 30 August 2018
/
Published: 3 September 2018
(This article belongs to the Section I: Energy Fundamentals and Conversion)
Abstract
:Motivated by the development of electric vehicles (EVs), this paper addresses the planning of EV charging infrastructures (EVCIs). Considering that the optimal locations for EVCIs in most cities with a tight land supply are difficult to obtain, it is significant to study the planning of EVCIs in such cities. This paper proposes a planning method and model of EVCIs under the condition that alternative locations of centralized charging infrastructures (CCIs) are known. Firstly, based on the principle of energy equivalence, the sales volume of the fuel of gas stations in the planned area is converted into the equivalent electric quantity (EEQ) and the EEQ is divided according to the demands of different EVs for charging. Then, an equal product of the load and distance (EPLD) criterion is used to distribute the EEQ to CCIs and distributed charging infrastructures (DCIs) located in areas for load forecasting. The final plan is given out after checking the constraints and planning rationality. In addition, the net present value (NPV), the average charging distance, and the total harmonic distortion (THD) rate are used to evaluate the planning scheme. Finally, the feasibility and practicability of the proposed method are verified by a case study in Beijing.
1. Introduction
With the continuous worldwide shortage of fossil fuels and environmental pollution problems, the electric vehicle (EV) is regarded as an effective way to reduce carbon emissions by many countries [1,2,3]. However, the imperfection of the charging infrastructures has always been one of the key factors that hinder the development of EVs [4,5,6,7]. The way EVs replenish power is significantly different from traditional fuel vehicles. Researches show that EV charging relies mainly on EV charging infrastructures (EVCIs) located at home or at work [8]. But such charging infrastructures are large in scale and geographically dispersed, which poses great challenges for the planning of charging infrastructures [9].
In recent years, the issues of charging infrastructure planning have been extensively studied. Most papers are concentrated on the coordination and optimization of the economy of power grids and centralized charging infrastructures (CCIs), power quality, the capture of traffic flow, and users’ convenience [10,11,12]. In Reference [13], the size and location of the charging station considering the users’ convenience, power loss, and voltage deviation are determined by the data-envelopment analysis method and the cross-entropy method. A multi-objective planning model for coupled charging infrastructure and distribution network is proposed in Reference [14] to reduce investment and operating costs and capture traffic as much as possible. In Reference [15], the collaborative optimization of integrated power distribution and EV charging systems is proposed and focuses on the performance of the solution method. In Reference [16], a two-step screening method considering environmental factors and the service radius to choose the optimal sites of charging stations are used and a mathematical model to optimize the size of charging stations is given.
Application scenarios of charging infrastructures and long-term planning issues are discussed in some papers [17]. In Reference [18], two capacity planning frameworks are proposed, in which the total social welfare is maximized in large-scale networks and the best quality of service for each level of customers is ensured in small-scale networks. Reference [19] studies the multi-period optimal charging station location problem for electric cars based on a real dataset of the Korean expressway network. Based on the uncertainties brought about by the development of EVs, a scenario-based multistage charging facility planning framework is proposed in Reference [20]. The optimization model proposed in Reference [21] will help us determine the optimal location of level 3 chargers as well as the number of charging modules at each station over multiple time periods.
Some papers also discuss the impact of the time scale on the charging station planning. Reference [22] deals with the design of a recharge area for EVs at the main campus of the University of Palermo under the condition of considering the users’ charging behaviors and then discusses solutions to the peak demand. Reference [23] determines the optimal site and the size of EVCIs in the distribution networks in taking account of the time-of-use demand response programs and load values. The methods to divide the position for the urban charging station and the range of power supply combining with the traditional Voronoi diagram and the real-time traffic flow map information are proposed in Reference [24].
However, as part of all EVCIs planning in the region, the planning method of CCIs is not suitable for that. The regional overall planning is supposed to take into account the distributed charging infrastructures (DCIs) located in different areas. In addition, considering the short supply of the urban land, the optimal locations of CCIs may not be met and there should be a more realistic charging infrastructure planning method for such cities. Table 1 shows the main features of the model proposed in this paper compared to several related papers [25,26,27,28], in terms of the planning area, the method of determining locations of CCIs, load forecasting method, and the feasibility of parameter acquisition.
Based on the above analysis, this paper proposes a charging infrastructure planning method under the condition of limited urban land supply. The contributions mainly include the following aspects.
- (1)
- A charging infrastructure load forecasting model is established. In the model, the sales volume of the fuel of gas stations in the planned area is converted into the quantity of charging electric energy by the notion of energy equivalence. Then the power is allocated to CCIs and DCIs located in different areas according to the equal product of load and distance (EPLD) criterion. This method has excellent feasibility because it is based on the data of current gas stations that are easy to get.
- (2)
- The means to determine the load capacity and check the whole planning scheme are proposed. Many important constraint conditions are considered including the different demands of EV consumers and the power utility.
- (3)
- The basic method to evaluate the planning scheme in terms of the economy and convenience is proposed, which is used to increase the satisfaction of consumers and obtain favorable investment income at the same time.
The remainder of the paper is organized as follows. In Section 2, the general method of EVCI planning is introduced. Section 3 describes the selection principle of the primary scheme of CCIs. Section 4 details the load prediction method. Section 5 is devoted to determining and checking the result scheme and the evaluation of the planning scheme is introduced in Section 6. In Section 7, the case is presented and analyzed. Finally, the conclusion is drawn in Section 8.
2. General Method for the Planning of Charging Infrastructures
2.1. Divisions of Charging Mode
The main charging modes of EVs are AC charging by an embedded car charger, DC charging by an external charger (called quick charging mode), and replacement of the batteries (battery swap). For the planning of charging infrastructures, the matters that should be considered are the amount and distribution of charging load and charging infrastructures. The different needs of slow charging or quick charging can be met by choosing different equipment during construction.
2.2. The Flow of Charging Infrastructure Planning
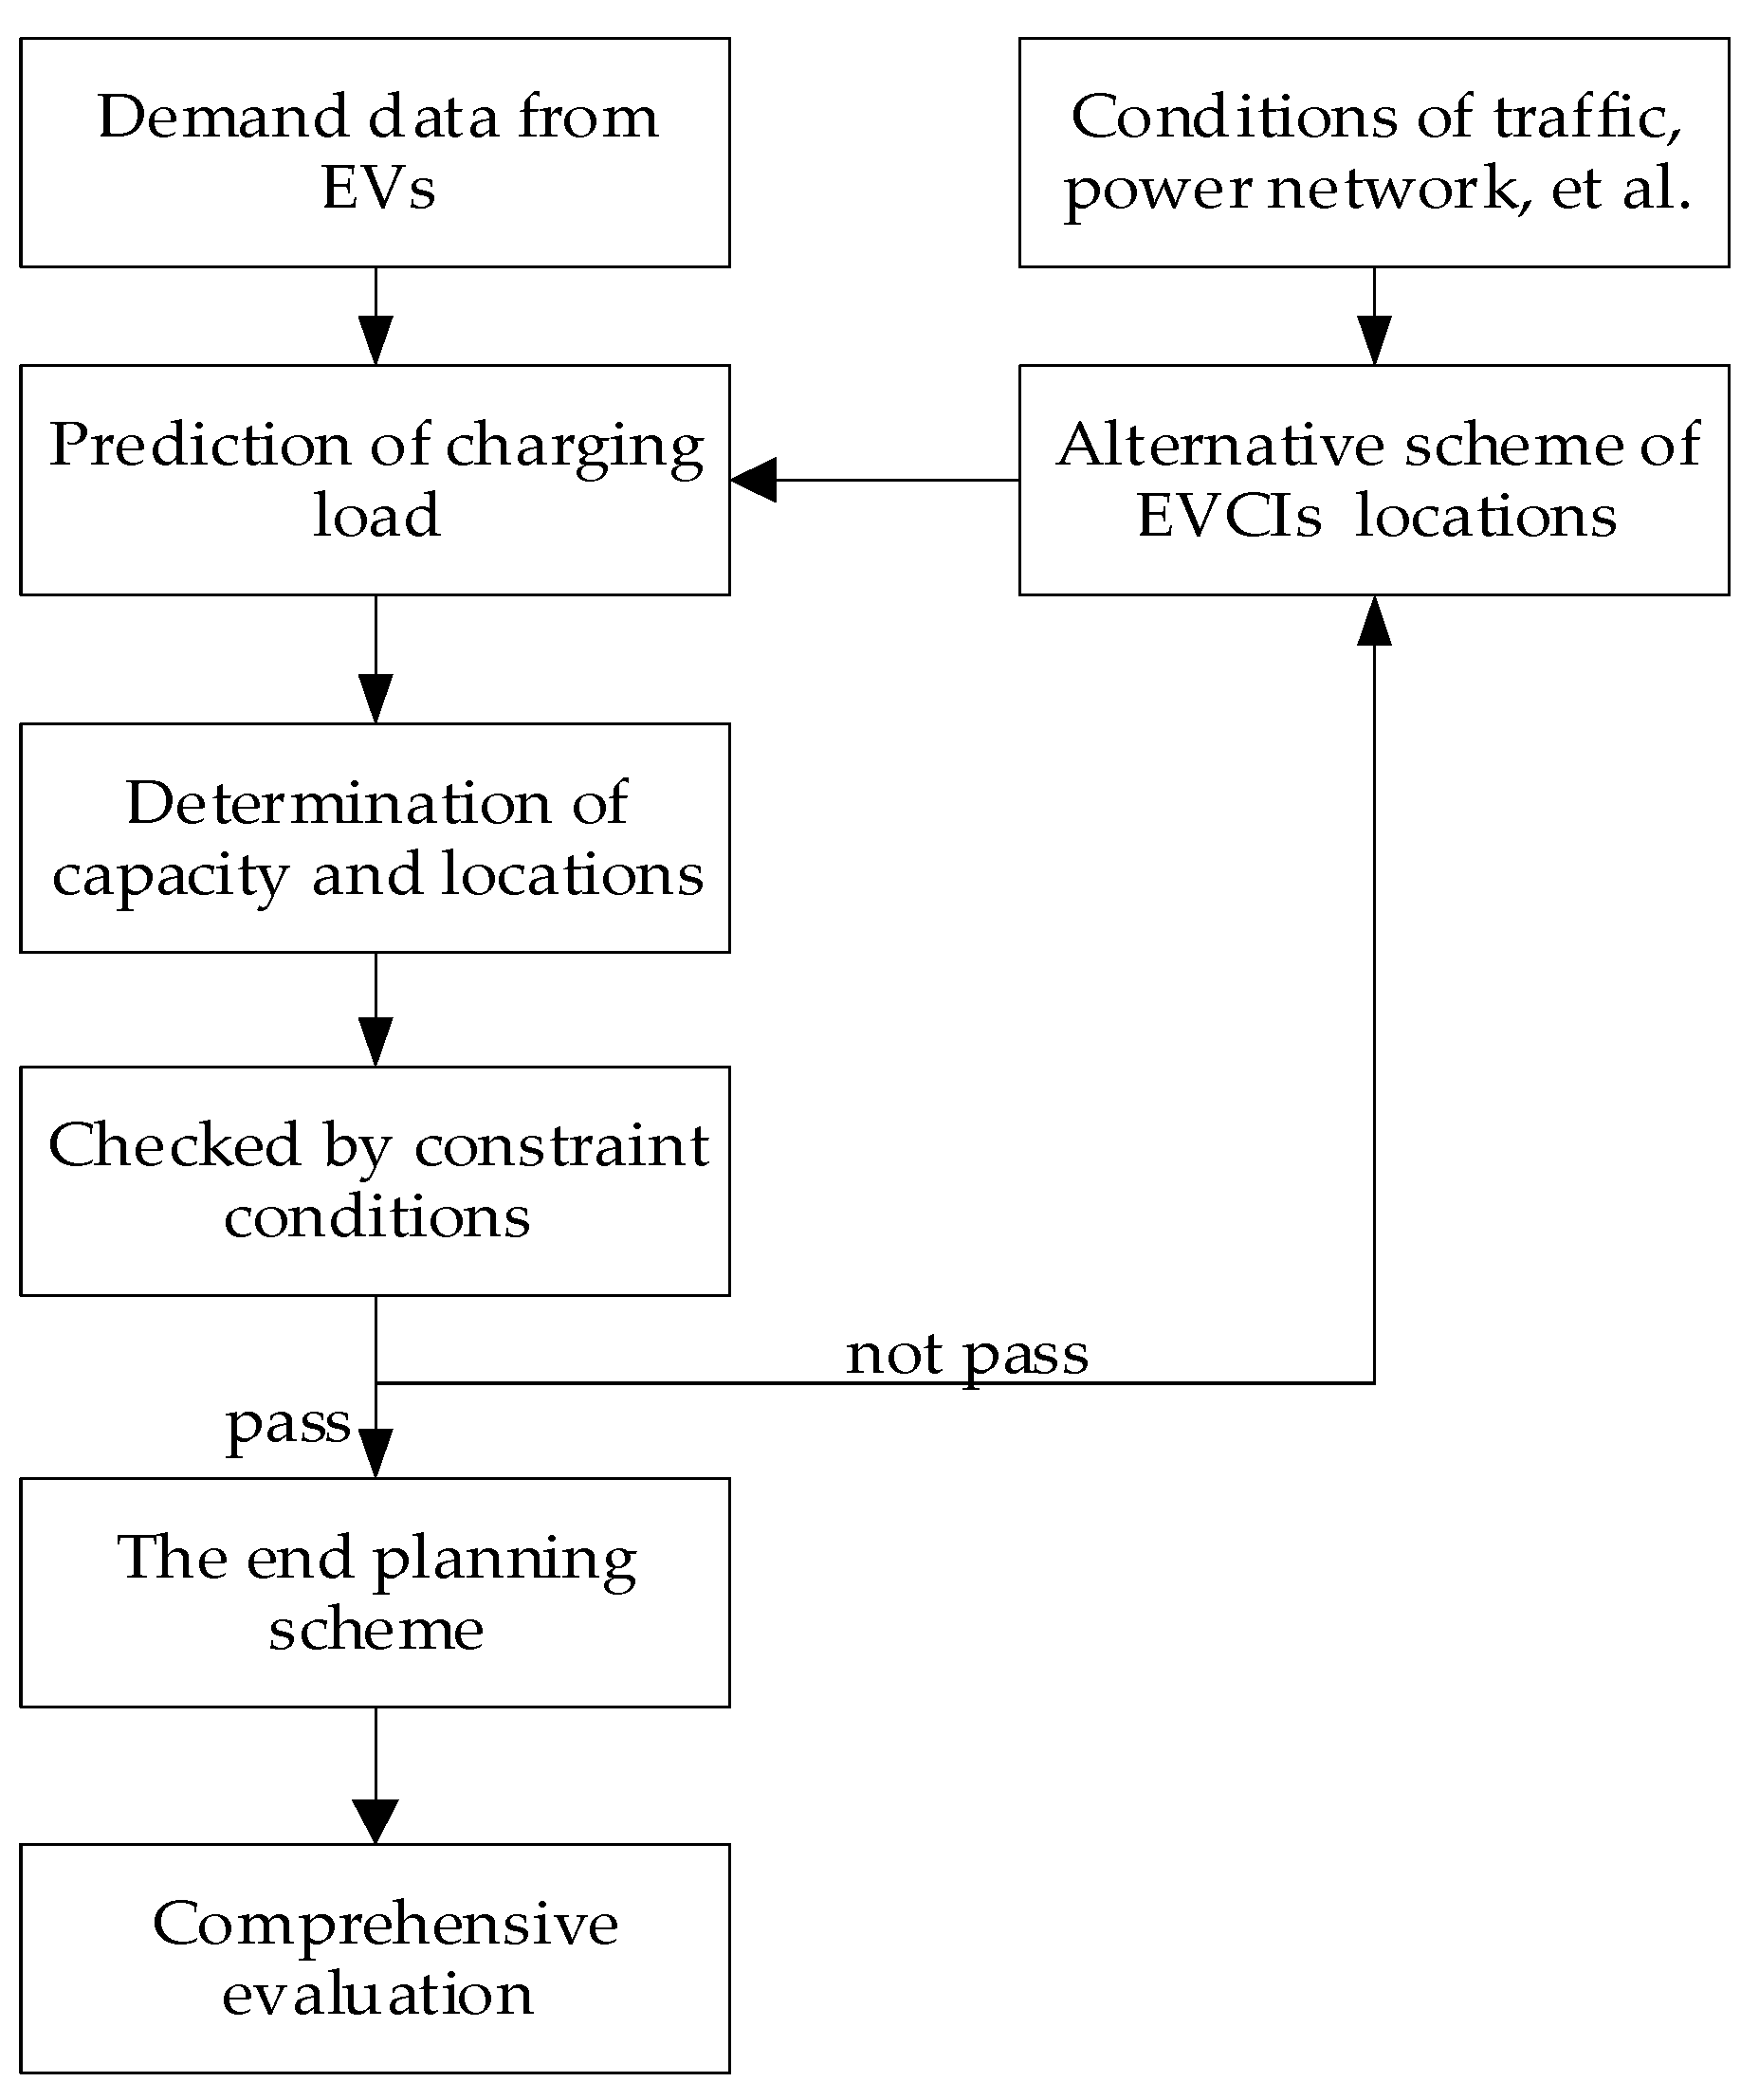
This paper focuses on the planning of EVCIs for urban areas with limited land supply. Therefore, the analysis is based on the known alternative locations of EVCIs, and finally, a feasible planning scheme is formulated. Figure 1 gives the flow chart of the planning of EVCIs. The main steps are explained as follows:
- (1)
- Present status investigation and data collection. Here many kinds of data in the planned region should be collected such as vehicles, power network, traffic, geography, and so on.
- (2)
- Load prediction. Give an alternative scheme of locations of CCIs, and predict the amount of electric energy and the maximum loads of CCIs and DCIs.
- (3)
- Determination of the address and capacity. Based on the result of load prediction, determine all the addresses and capacity of CCIs and DCIs.
- (4)
- Checking the result scheme. Check the rationality of the result scheme and calculate its influence on the power network. Adjust the alternative scheme of locations of CCIs and re-implement step (2) and (3) until the result scheme reaches the demand.
- (5)
- Comprehensive evaluation. Here the economics and consumer convenience of the planning scheme are confirmed.
3. Choosing of Primary Scheme of CCIs
Because CCIs are usually large in scale and the urban supply is insufficient, the alternative schemes of CCIs can be proposed according to the actual demand and constraints. The main factors that should be considered to obtain the alternative scheme are given as follows.
3.1. Traffic and Utilization Constraints
The charging infrastructure must satisfy the running demands of EVs, so as to form the constraints from charging demands, traffic conditions, utilization convenience, which are showed in the following sections [29].
- (1)
- Charging demand constraint. A rough estimate must be done by the sales volume of fuel of the gas stations nearby (or by vehicle distribution or utilization data). The rate of charging stations must meet with a minimum demand level.
- (2)
- Traffic condition constraint. The optional locations of CCIs must be near the main road in the region so as to meet traffic convenience.
- (3)
- Constraint to overlay the service area. The service radius and area of the CCI are limited, and the combination of all the service areas should cover the planned district as much as possible.
- (4)
- Construction condition constraint. There must be enough land for the arrangement of parking space, charging devices, monitoring equipment, and office. Because many of these are concerned with the amount of charging load, this kind of constraint must be verified again after the prediction of charging load.
3.2. Constraints from Power Network
The main problems for construction of charging infrastructures include the capacity of the supply source, length of power supply feeders, and so on [30].
- (1)
- Supply source constraint. CCIs usually are supplied by 10 kV, and the supply source of it must have sufficient spare capacity and outlet interval.
- (2)
- Length constraint of distribution feeder. According to the standards of city distributed network, the length of the distribution line for CCIs should be 3–5 km, and it is unsuitable to be supplied by a source too far.
- (3)
- Power supply corridor constraint. Because of the increasing shortage of city land, the power supply corridor becomes one of the severe constraints in the charging infrastructure construction.
4. Load Prediction Based on Energy Equivalence
Different from the planning of a traditional distributed power network, the planning of EVCIs must solve the key problem of charging load prediction. Only when the loads of CCIs and DCIs are calculated, can the locations and capacity of EVCIs can be determined. The main idea of the load prediction method is to convert the current sales volume of fuel of all gas stations in the planned region into the equivalent electric quantity (EEQ) needed by EV charging based on the energy equivalence rule. Then EEQ is divided into rigid equivalent electric quantity (REEQ) and flexible equivalent electric quantity (FEEQ). After the alternative scheme of locations of CCIs is defined, the maximum loads of CCIs and DCIs located in different areas can be further calculated. The proposed method is applicable to the charging load prediction of private vehicles in the large-scale stage of EVs. The means and parameters are shown in Figure 2 and discussed in detail as follows.
4.1. Computation of Equivalent Electric Quantity
From the statistical sales volume of a given gas station, its EEQ is calculated by the following equation.
where is EEQ of the k-th gas station, is the penetration ratio of EV in the planning year at this area, K is the average electric energy consumed by EV each ton·100 km, W is the average weight of EV, is the current sales volume of fuel, is the growth rate of it, n is the number of planning year, and H is the average fuel volume consumed by traditional vehicle each 100 km.
4.2. Two-Stage Equivalent Electric Quantity Allocation Principle
EVs and traditional fuel vehicles have fundamentally different ways of replenishing energy. Traditional fuel vehicles can only obtain fuel at the centralized gas stations, while EVs are mainly charged at home or at work. Based on the above characteristics, the total EEQ is first divided into REEQ and FEEQ. REEQ refers to the amount of charging required by EV users living or working in the planned area. The corresponding charging infrastructures are distributed in residential areas and office areas. Such charging infrastructures are usually owned by individuals or companies and are not used for public services. FEEQ refers to the amount of power required by the public charging infrastructures. This type of public charging infrastructures provides an emergency charging solution for EV owners who cannot go to CCIs or a fault alternative for EV owners with personal charging equipment damage and serves EV users passing the planned region. Such charging infrastructures managed by the operation business are usually distributed in commercial areas, residential areas, office areas, and centralized charging stations. Then, EEQ distribution is performed in two stages: FEEQ is allocated after REEQ is allocated.
4.3. Computation of Rigid Equivalent Electric Quantity
Based on the two-stage EEQ allocation principle, REEQ of the k-th gas station is:
where is rigid factor that expresses the proportion of REEQ of the k-th gas station in its EEQ.
It is assumed that EV owners replenish fuel at the gas stations near their residential areas or office areas before replacing EV. The gas station in the planned area allocates REEQ to the charging infrastructures in the nearby office and residential areas, and the distribution method adopts the EPLD criterion. The EPLD criterion means that the gas station only allocates electricity to the charging infrastructures in office areas and residential areas within the maximum distance from it and the allocated electricity is inversely proportional to the distance. If the distance is larger than the maximum value, the charging infrastructure will share no consumption from this gas station. The REEQ distribution is shown in Figure 3.
The scale factor which expresses the influence of the population and vehicles in this area must also be taken into account when assigning REEQ. Summing up REEQ of the j-th residential area or office area shifted from gas stations in the planned area, the total REEQ of the j-th residential area or office area can be obtained.
where is the distance from the k-th gas station to the j-th DCI located in the residential area or office area. stands for and . indicates the REEQ required by the j-th DCI in the residential area and indicates the REEQ required by the j-th DCI in the office area.
4.4. Computation of Flexible Equivalent Electric Quantity
FEEQ of the k-th gas station can be used for distribution is
4.4.1. Computation of Flexible Equivalent Electric Quantity at Centralized Charging Infrastructures
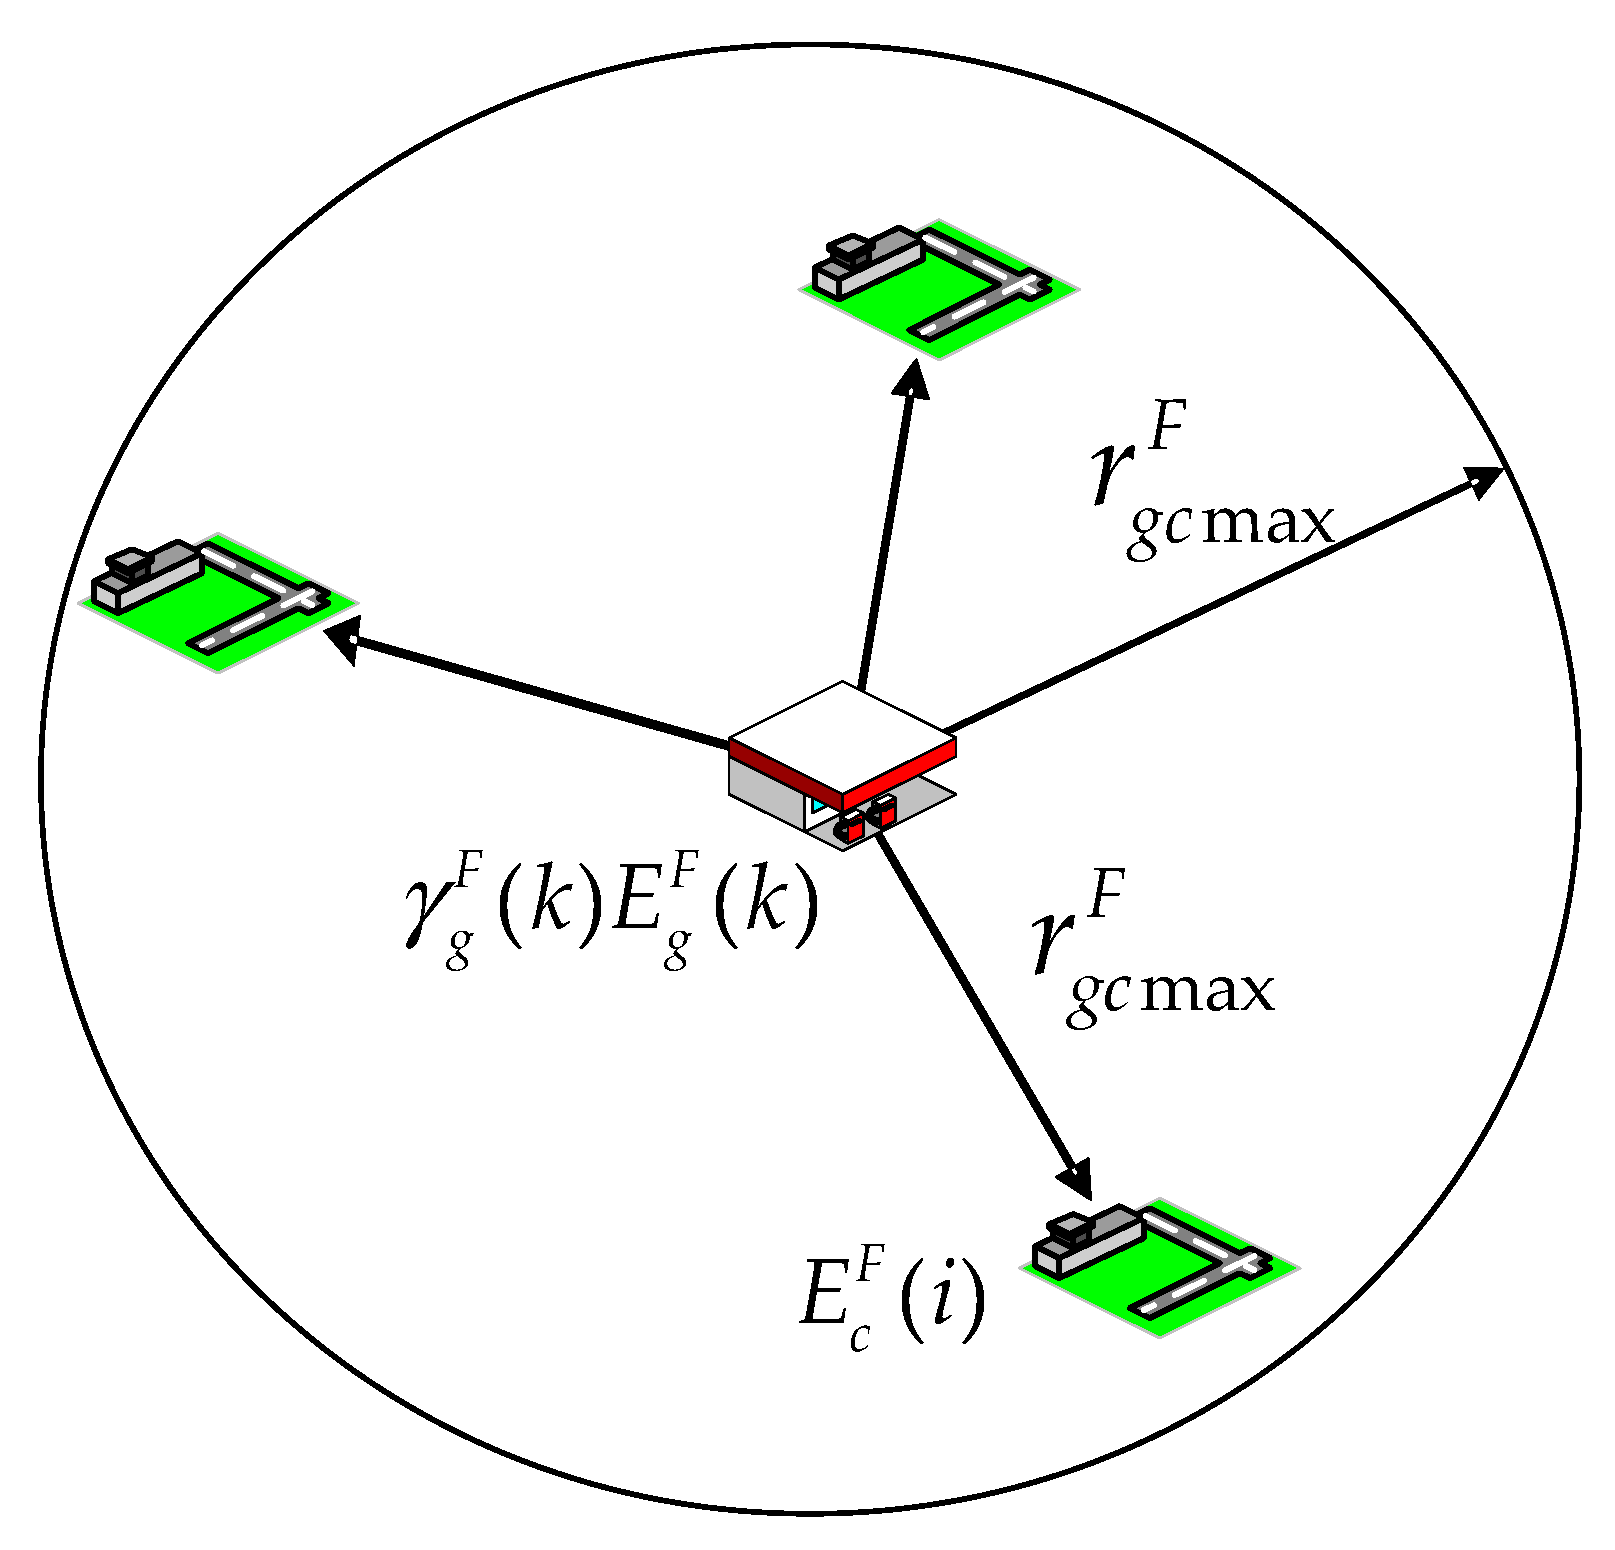
The centralized charging ratio (CCR) denotes the proportion of FEEQ of the k-th gas station shifted to CCIs, so there is a volume of FEEQ will be allotted to nearby CCIs. As shown in Figure 4, the power distribution method still adopts the EPLD criterion.
Therefore, the centralized charging apportionment ratio from the k-th gas station to the i-th CCI can be given as Equation (5):
where is the distance from the k-th gas station to the i-th CCI.
Summing up all the FEEQ shifted from each gas station, the total FEEQ of the i-th CCI can be calculated.
Divided by its maximum load utilization hour (MLUH), the maximum load of the i-th CCI is:
4.4.2. Computation of Flexible Equivalent Electric Quantity at Distributed Charging Infrastructures
The distributed charging ratio (DCR) denotes the proportion of FEEQ of the k-th gas station shifted to DCIs in various areas including residential areas, office areas, and other areas. So, the volume of FEEQ will be allotted to nearby DCIs. As shown in Figure 5, the power distribution method still adopts the EPLD criterion.
Therefore, the distributed charging apportionment ratio from the k-th gas station to the j-th DCI can be given as Equation (8):
where is the distance from the k-th gas station to the j-th DCI.
Summing up all the FEEQ shifted from each gas station, the total FEEQ of the j-th DCI can be calculated.
Divided by the MLUH, the maximum load of the j-th DCI in the residential area or office area is:
The maximum load of the j-th DCI in the commercial area is:
5. Determination and Check of Result Scheme
Because the conditions of traffic, power network and consumption are only considered to get the alternative scheme of locations of CCIs, but not used during load prediction and determination of capacity, it is necessary to check the result scheme including the locations and capacity. The check methods of CCIs and DCIs are as follows.
5.1. Centralized Charging Infrastructures
Because the load prediction is based on the preliminary scheme of CCIs, the locations are known, so the only thing needed to be determined is the rated capacity. The maximum electric load of the transformer for the CCI is:
The rated capacity of the transformer needed to install is:
where is the rated capacity of the transformer, is the maximum centralized charging load, is the maximum normal load which will be zero if using an independent transformer, is the power of the auxiliary equipment, μ is the simultaneity factor of loads, is the power factor, and is the load factor of the transformer.
5.2. Distributed Charging Infrastructures
The load of DCI includes the charging load and the normal load . If their simultaneity factor is μ, then the peak load of the transformer in this area is:
The rated capacity of the transformer can be also determined by Equation (14).
If the result is passed, the entire detailed planning scheme can be determined. Otherwise, the alternative scheme must be adjusted or sometimes even replaced by a new one, and the load prediction and capacity determination must be carried out once again.
6. Evaluation of the Planning Scheme
The evaluation method is employed to reflect whether the result corresponds to a good planning scheme or a bad one. For the charging infrastructure, the power utilities are concerned about its economic performance, and the EV consumers care for the convenience much more. Therefore, an evaluation method based on economy and convenience is given as follows.
6.1. Economical Performance
The economic character of EVCIs can be evaluated by the net present value (NPV) that the investor will obtain.
where, is the initial outlay, Y is the life cycle and its unit is years, is the operating income of the y-th year, is the expenditure of the y-th year, and r is the discount rate.
The operating income in the y-th year can be expressed as:
where, is the unit price of charging at CCIs, and is that of charging at DCIs.
The expenditure in the y-th year can be expressed as:
where, is the maintenance cost, is the principal and interest of the loan, and is the tax.
6.2. Consumer Convenience
As a public utility, the social benefit of EVCIs mainly lies on the convenience offered [31] and it can be evaluated by the average distance of the charging electric energy, which can be calculated by the following equation.
where is the average distance of the charging electric energy, is the average distance to charge EV in the i-th CCI, and is the average distance to charge EV in the j-th DCI. If is assumed to be zero, then Equation (18) can be reduced to the following equation.
6.3. Effects on the Network’s Performance
In the planning, only the capacity and the maximum load of EVCIs that the power grid can hold are considered. Even if the corresponding constraints are met, EVCIs of different sizes may have a negative impact on the network [32,33,34]. The EV charger that contains a large amount of power electronic equipment will inject harmonics into the power grid during EV charging, which will endanger the operation of the power system [35]. Therefore, the total harmonic distortion (THD) rate of the voltage and current is used to evaluate the effect of EVCIs on the network’s performance.
where and refer to h-th harmonic current and voltage; and are the fundamental current and voltage.
7. Case Study
7.1. Basic Data
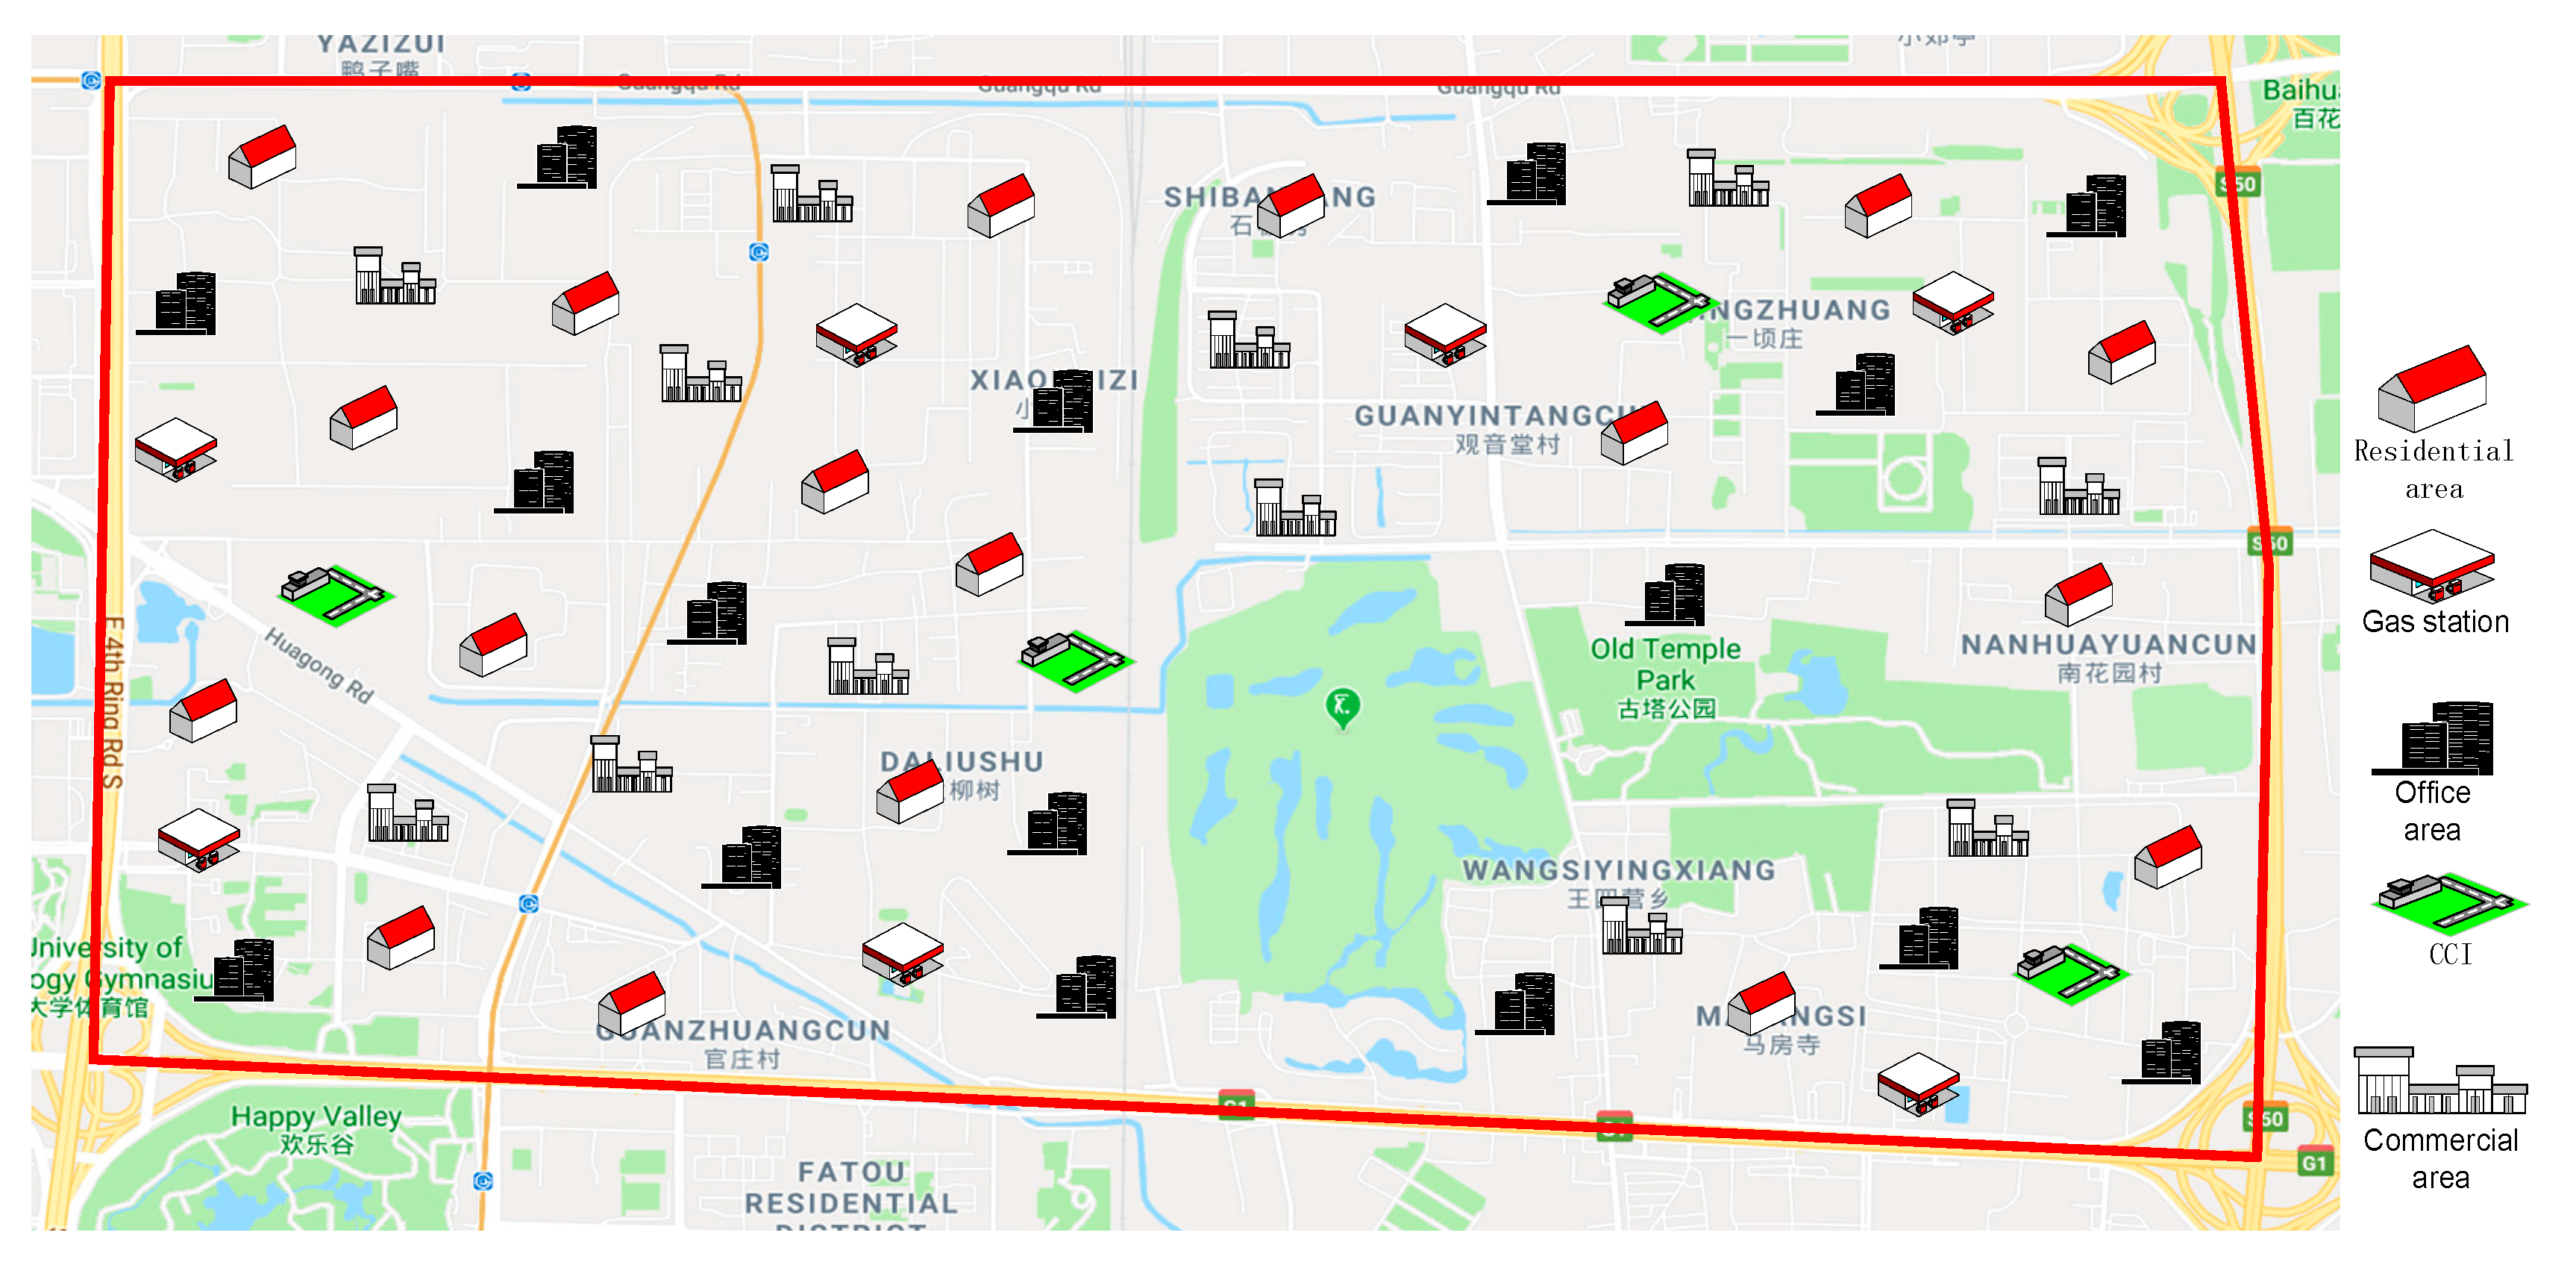
Based on the current level of development of EVs, the following figures and tables give an illustration of charging load prediction by the energy equivalence method. The planned area with a maximum horizontal width of 5 km, a vertical maximum width of 2.7 km, and a total area of approximately 12 square kilometers is located in the middle of four main roads in Beijing. There are 46 typical load regions, 7 gas stations and 4 optional locations of CCIs. The region has a relatively high economic level, a large number of EVs, adequate spare capacity, and the highly reliable power supply. The geographical locations of different areas, gas stations and CCIs are shown in Figure 6.
The parameters in the load forecasting model are set in Table 2.
The maximum shift distances from the gas station to CCIs and DCIs are related to the power supply and the demand of the charging infrastructures, the driving range of EV, and so on. The maximum shift distances can be given combined with the planning purposes and the convenience of the EV consumer, such as 2–3 km. Table 3 gives the main influence factors of the key parameters including the penetration ratio, CCR, DCR, MLUH of CCI and DCI, in which the number of △ indicates the closeness between the parameters and the influence factors.
The above parameters can be determined by estimation. The CCR and DCR are determined based on local construction conditions and subjective design, which reflects the planning function. The penetration rate can be accurately obtained from local EV sales data or by measuring the proportion of EVs in traffic flow. The MLUH is estimated based on the regional load type. Besides, the government as a city planner can easily obtain more accurate statistics from the relevant departments. So, the acquisition of these parameters is not difficult.
Table 4 gives the coordinates, regional types, scale factor, and MLUH of each area. The origin of the coordinate here is the lower left quarter of Figure 6. R represents the residential area, O represents the office area, and C represents the commercial area.
Table 5 gives the coordinates, sales volume, penetration ratio, rigid factor, the DCR and CCR of each gas station.
Table 6 gives the coordinates and MLUH of the CCI.
7.2. Results Analysis
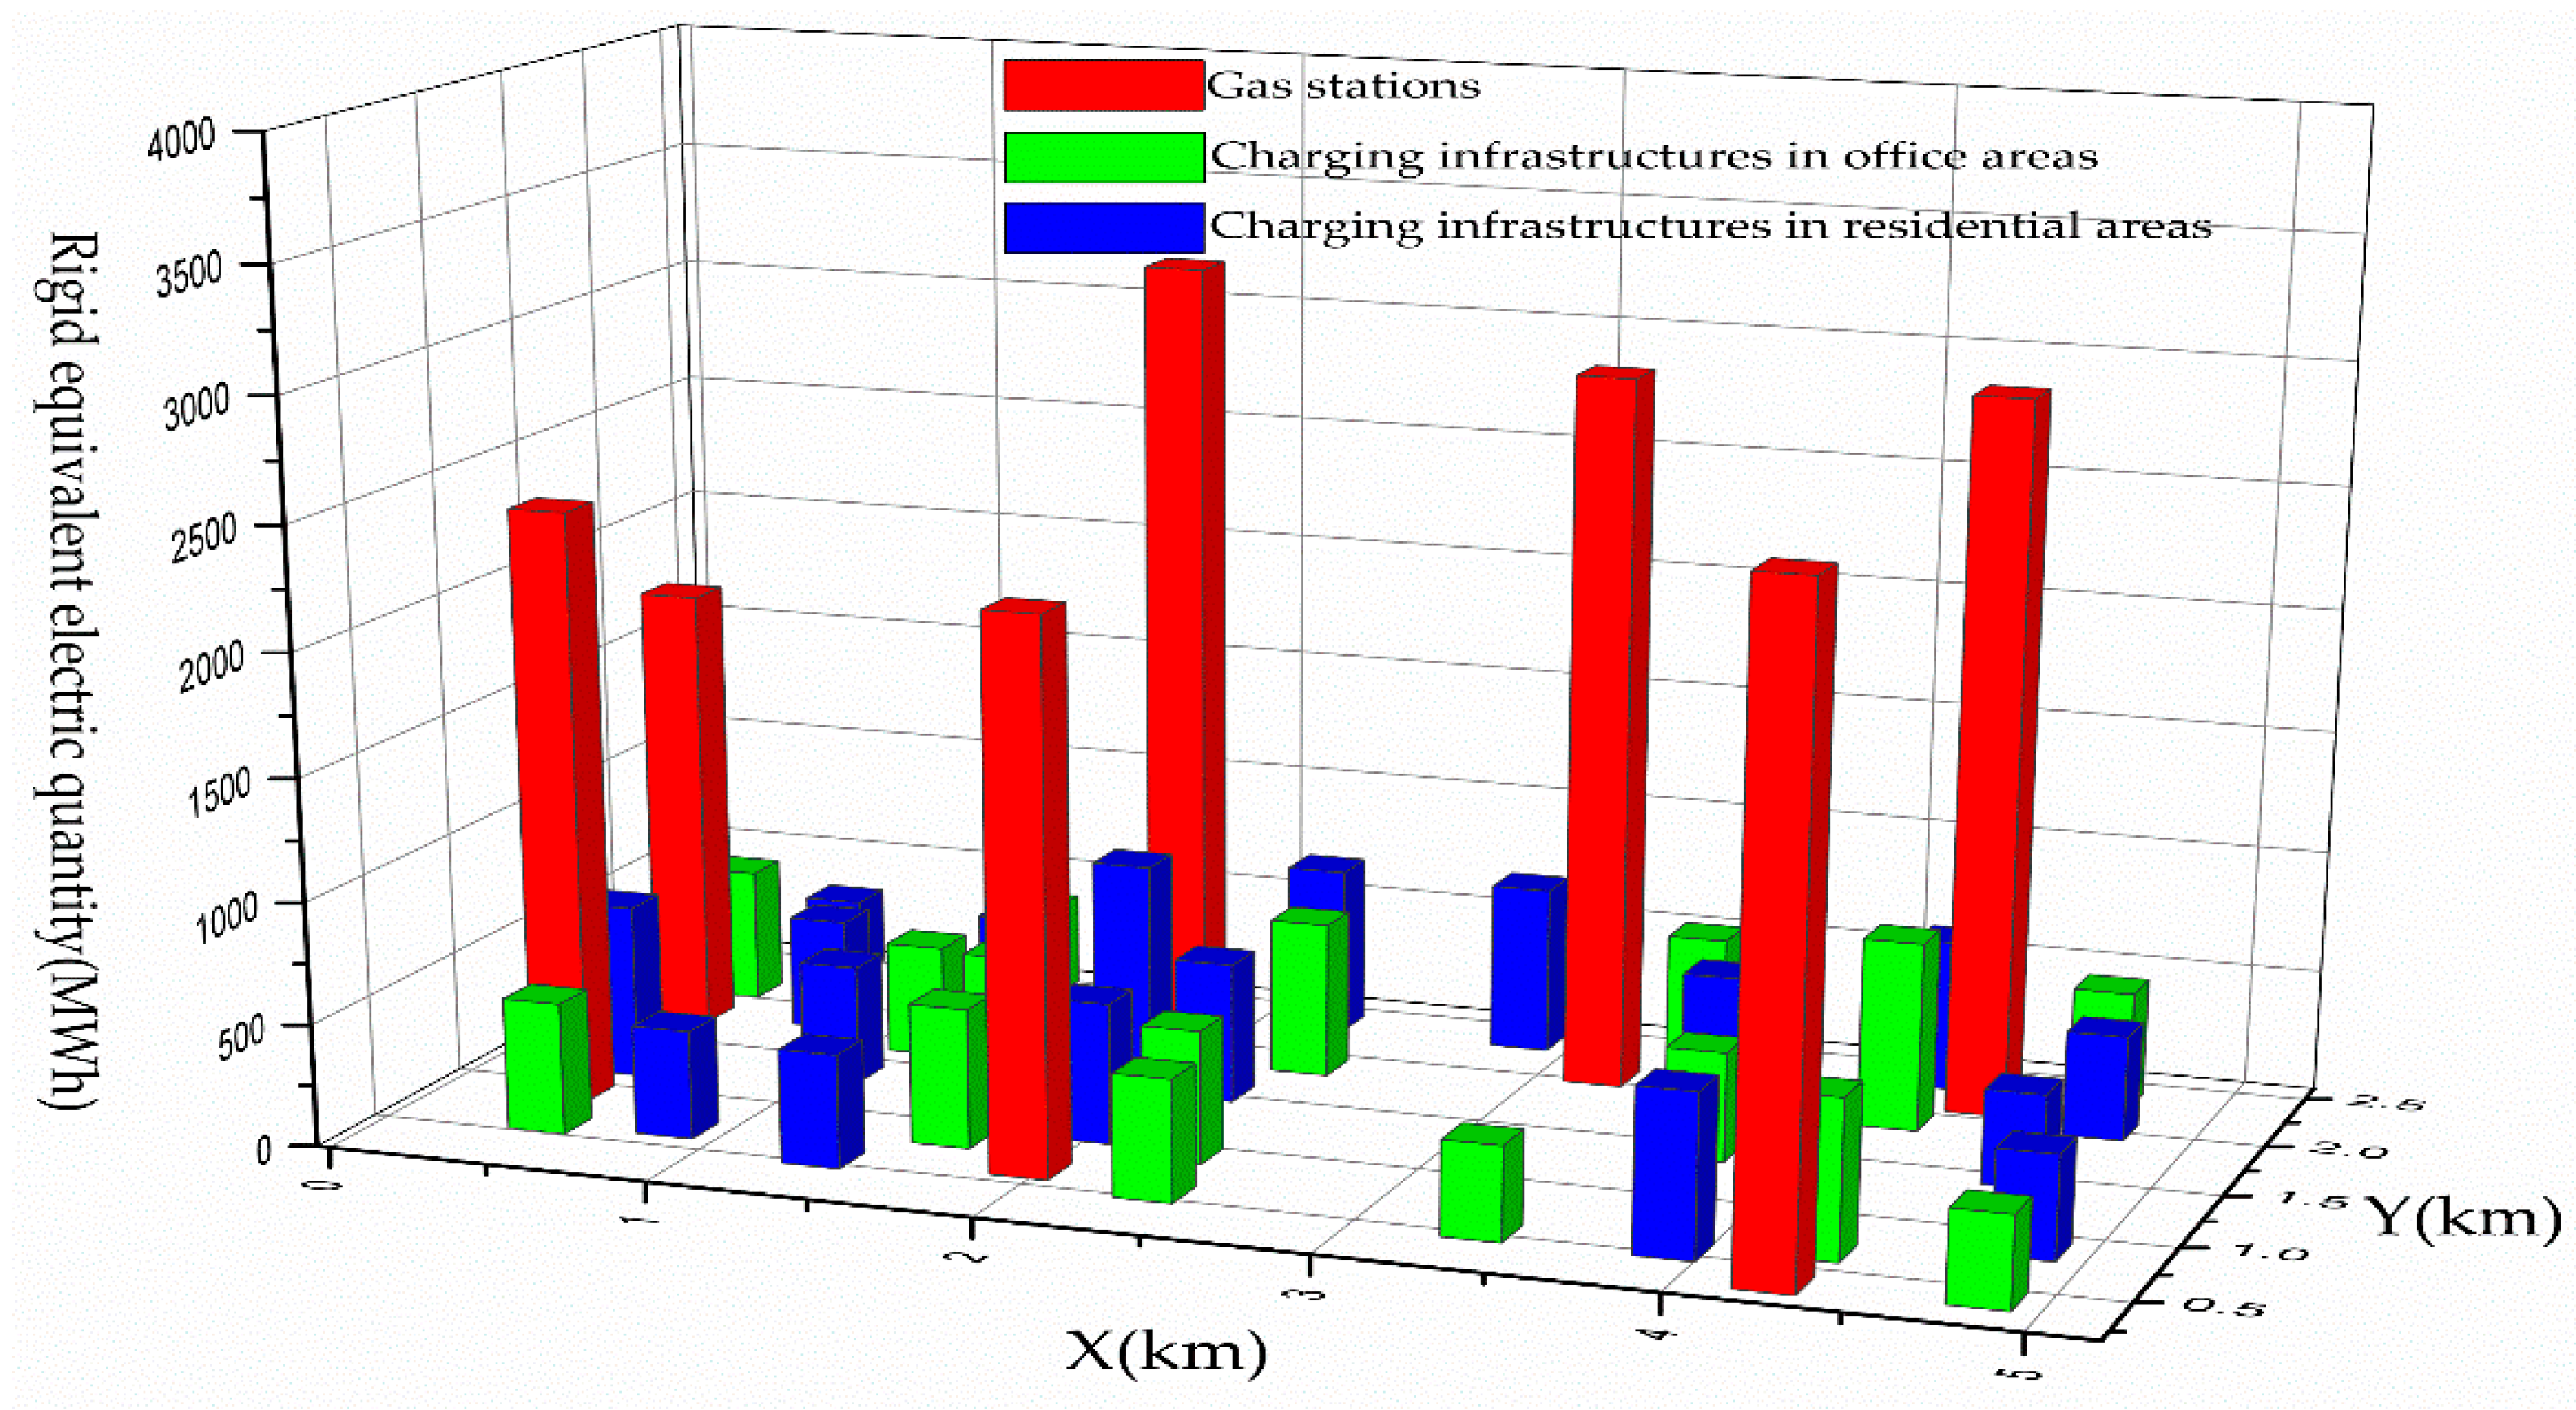
REEQs allocated to DCIs in the residential areas and office areas are calculated by the load forecasting method. Concrete values are shown in the fifth column of Table 4 and geographical locations of REEQ are shown in Figure 7.
As shown in Figure 7, the REEQ of each gas station in the planned area is distributed to the DCIs in the residential area and the office area under the condition that the scale factor and the distance are taken into account. So REEQ is rationally distributed, which can guarantee the charging demand of each region.
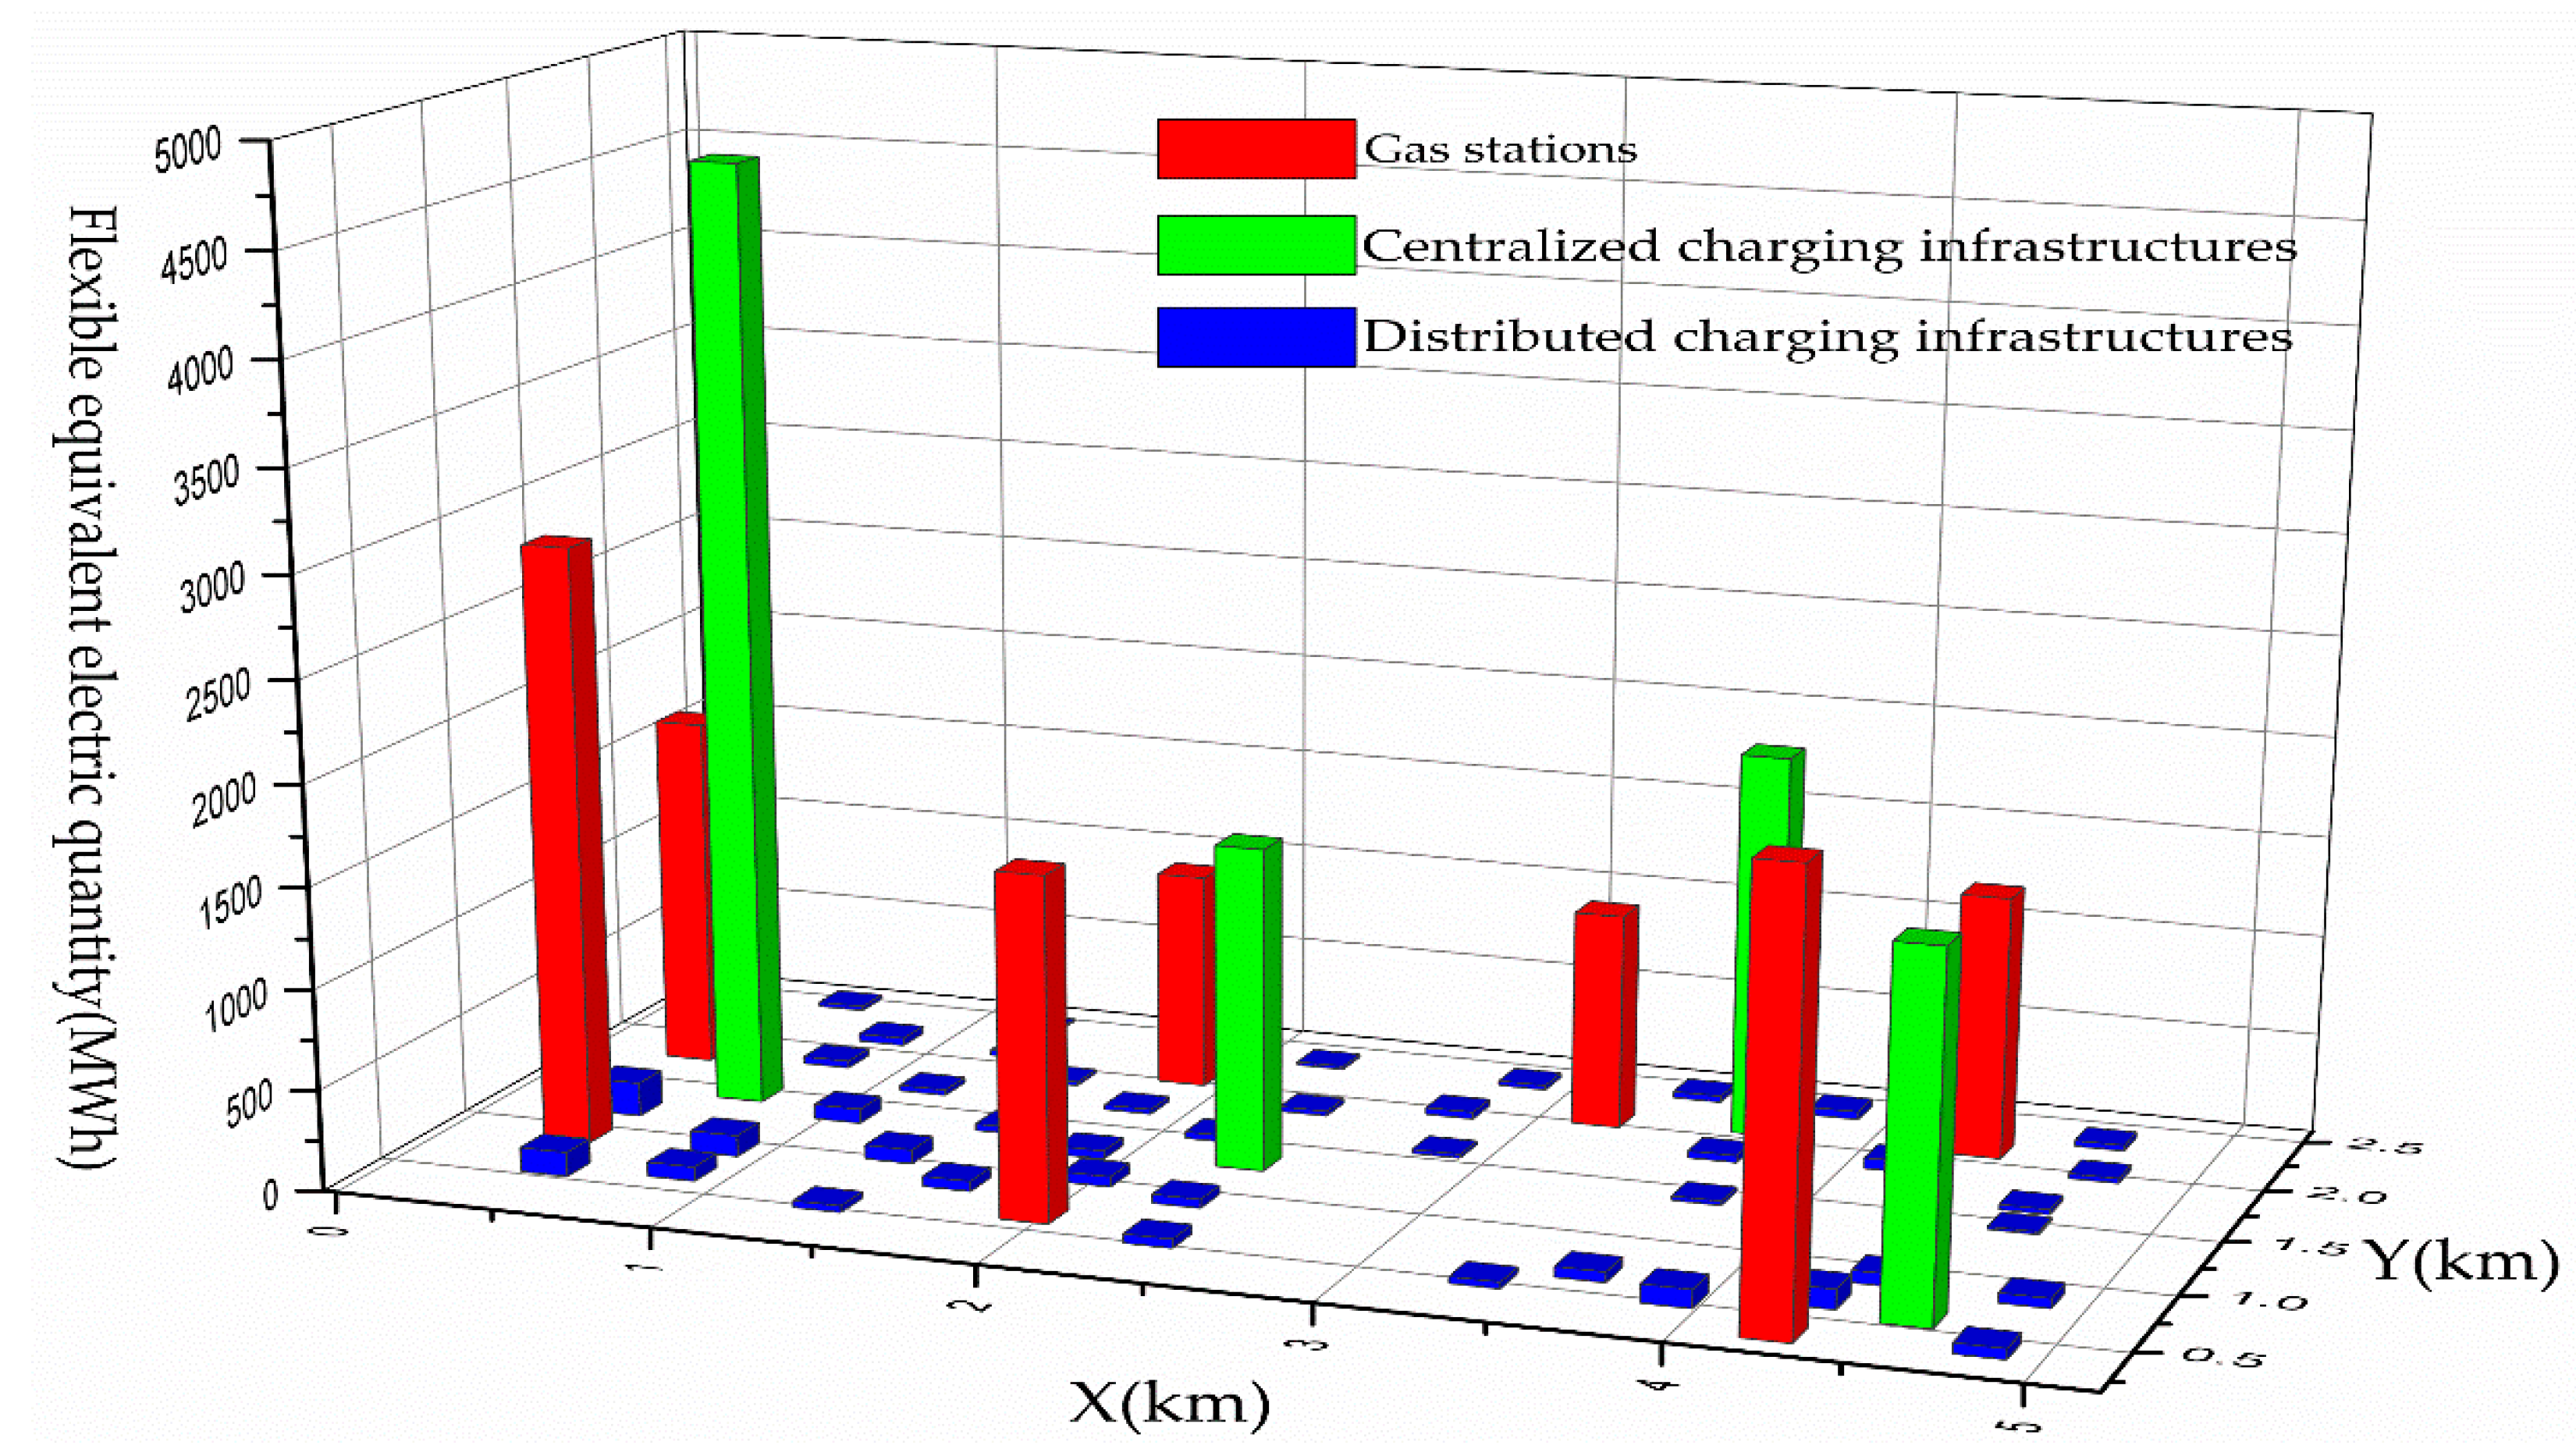
After the load forecasting calculation, the FEEQ allocated to DCIs in different areas is shown in the sixth column of Table 4. The FEEQ allocated to CCIs is shown in the third column of Table 6. The geographical locations of FEEQ are shown in Figure 8.
As shown in Figure 8, the FEEQ of gas stations is distributed to CCIs and DCIs.
- (1)
- Because CCIs have better construction conditions than DCIs, the CCR is far greater than the DCR during planning and design. So the FEEQ allocated to CCIs is much greater than that allocated to DCIs located in different areas, which makes CCIs the primary responsibility for public services and makes it beneficial to facilitate the operation business to obtain greater economic benefits by improving equipment utilization and management level.
- (2)
- The FFEQ of DCIs provides an emergency charging solution for EV users who cannot go to CCIs or a fault alternative for EV owners with personal charging equipment damage. Although the FEEQ of DCIs is low because of its function orientation, DCIs are indispensable for public services.
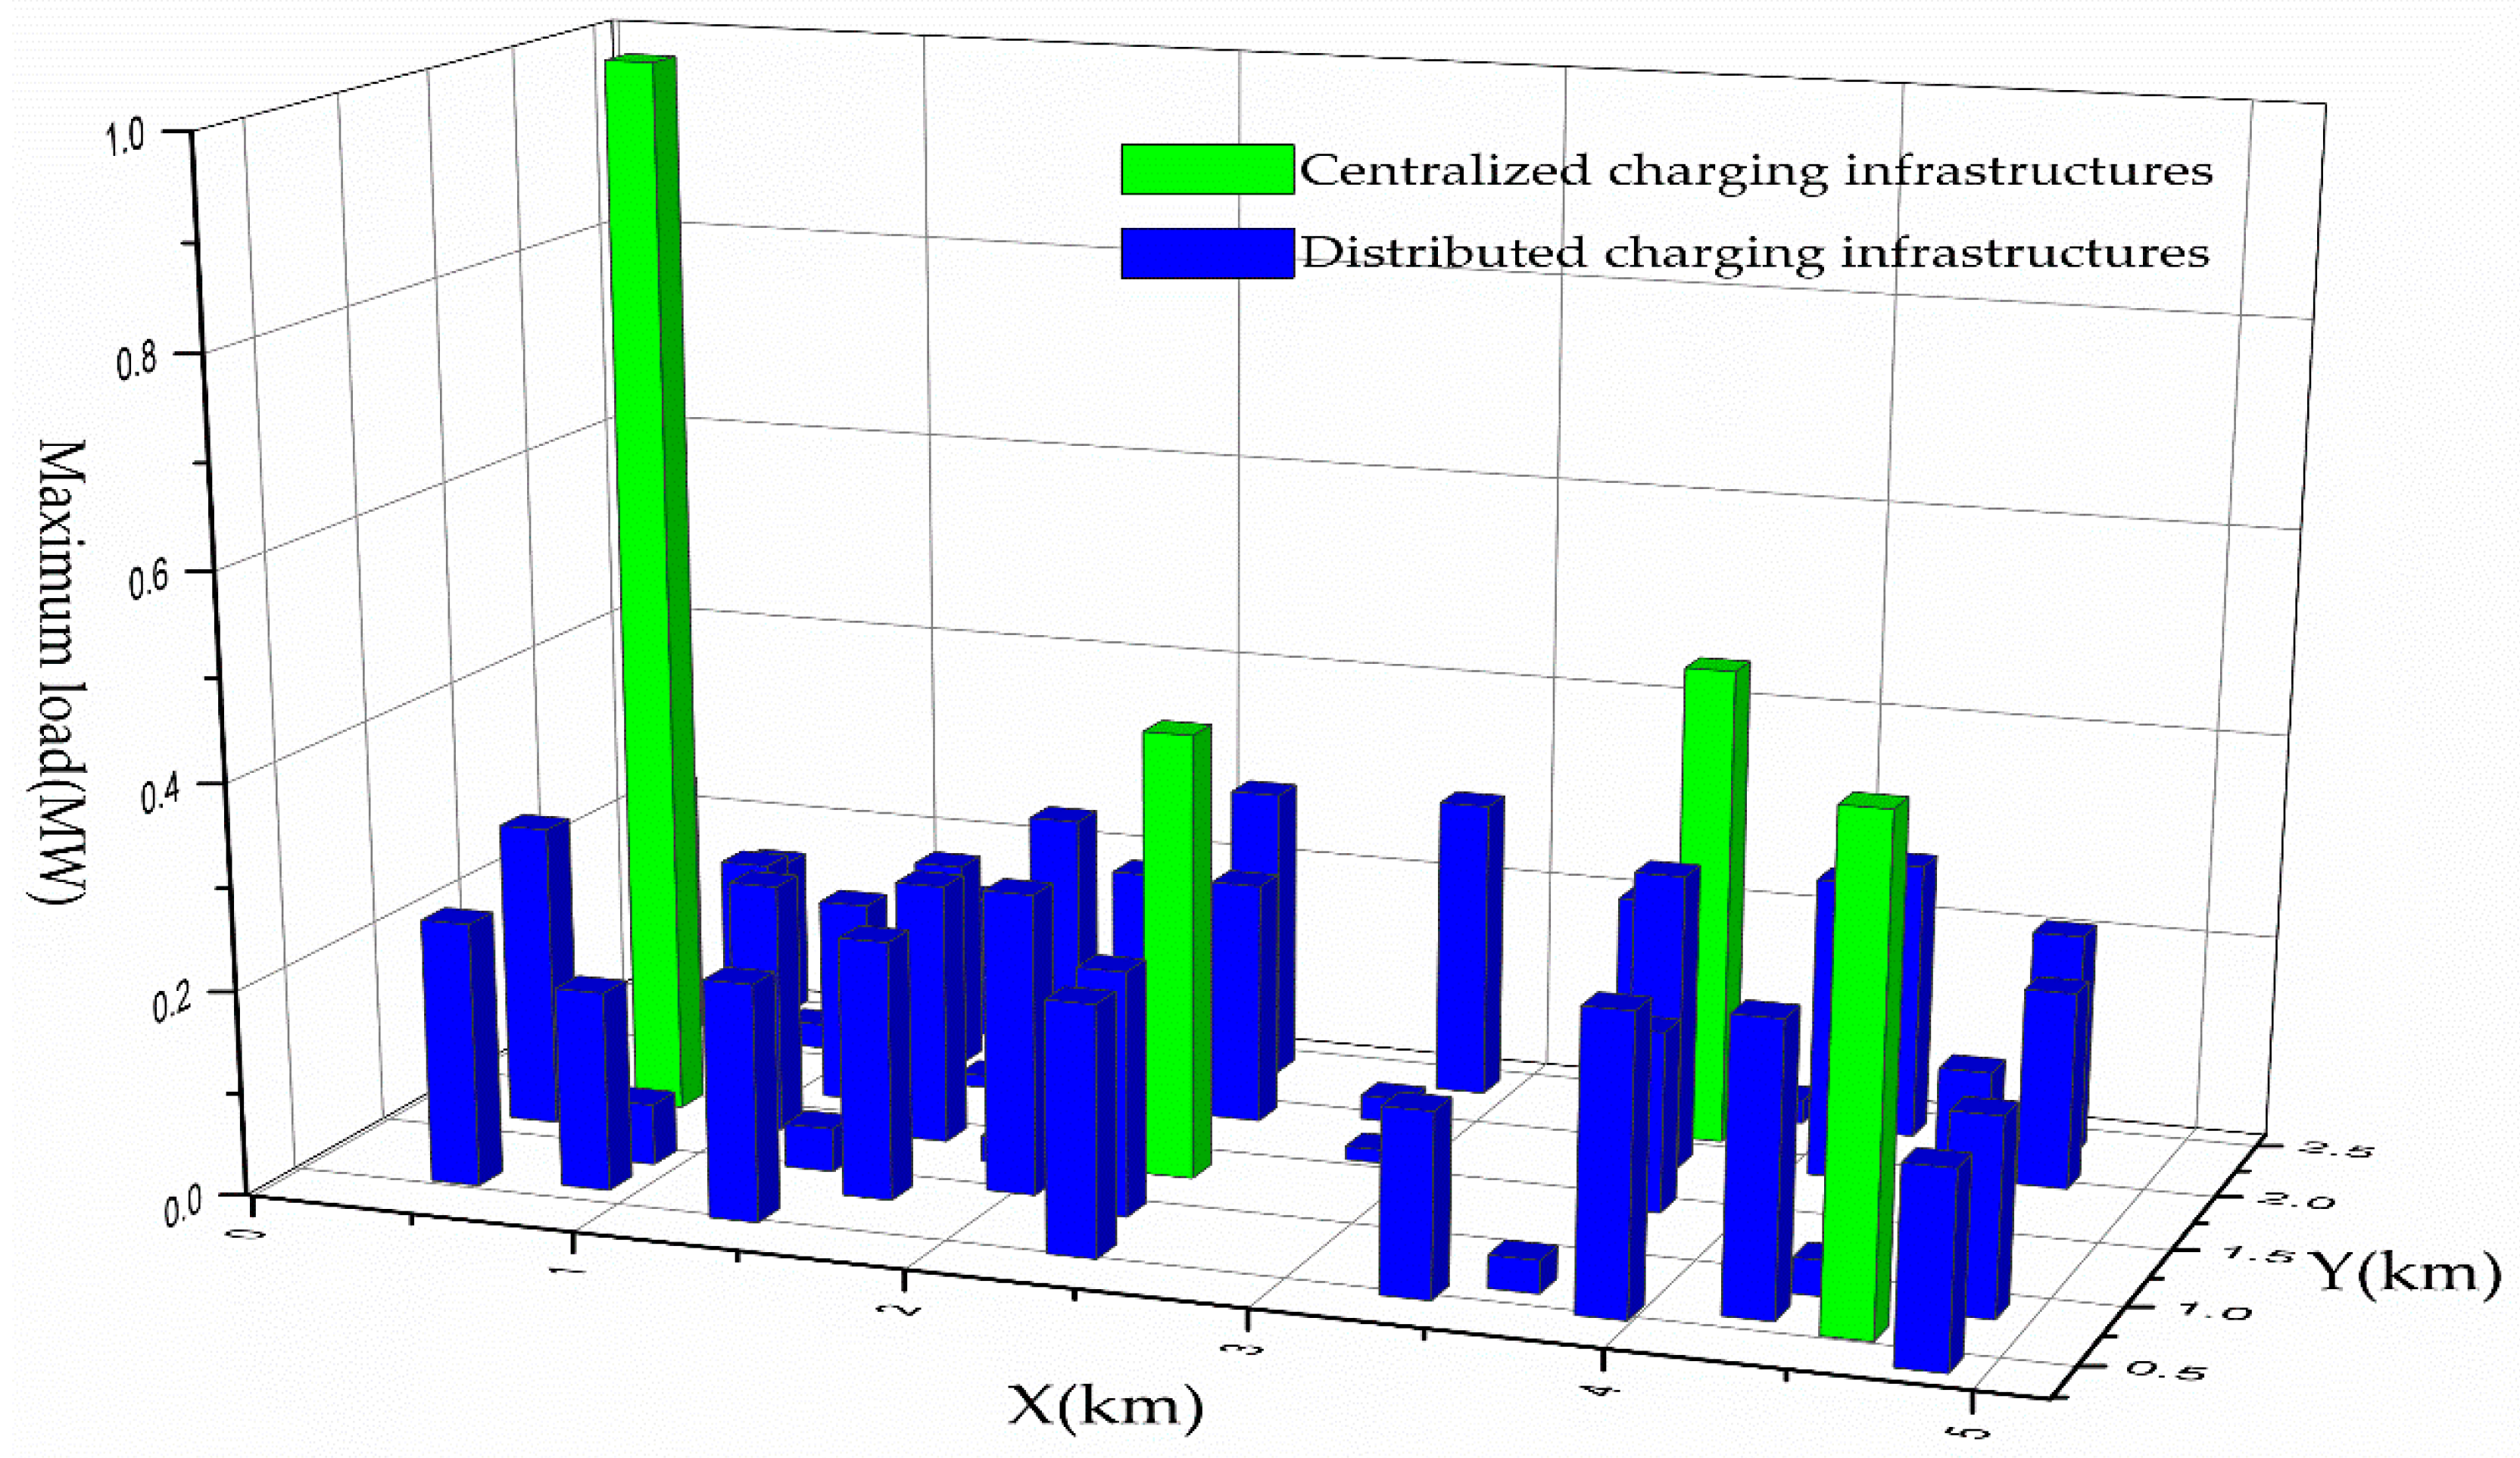
The maximum loads of DCIs in different areas are shown in the seventh column of Table 4. The maximum loads of CCIs are shown in the fourth column of Table 6. The geographical locations of the maximum loads are shown in Figure 9.
As shown in Figure 9,
- (1)
- The maximum loads of CCIs are greater than that of DCIs because the high-power fast charging equipment is extensively used at CCIs. Besides, CCIs with better construction conditions can withstand greater peak loads. So, the result shown in Figure 9 is consistent with reality.
- (2)
- Because DCIs in the commercial area are limited in scale and have no REEQ, the maximum loads are low. In addition, the maximum load distribution of DCIs is uniform and not high, which is beneficial to reduce the impact of EV charging on the regional power grid.
8. Conclusions
Research on the planning of EVCIs is of significance for promoting the development of EVs. This paper systematically proposes a planning method and a model of EVCIs under the condition of limited urban land supply. The method is based on the sales volume of the gas stations in the planned region, including the site selection principle of CCIs, load forecasting, determination and check of the result scheme, economic analysis and convenience analysis, method of assessing the effect on the network’s performance, and so on. The parameters in the model are easy to obtain.
The results of the case show that REEQ and FEEQ can meet the charging demands of different EV consumers. Besides, the maximum load distribution of CCIs and DCIs is reasonable, which does not cause serious impacts on the local power grid. So, the method and model described in this paper are effective and feasible.
However, only the allocation of EEQ and the maximum load prediction are discussed in this paper. There are no specific configuration recommendations of EVCIs, such as the ratio of fast charging equipment to slow charging equipment, which deserves further study.
Author Contributions
The paper was a collaborative effort between the authors. C.G., J.Y., and L.Y. contributed collectively to the theoretical analysis, modeling, case study, and manuscript preparation.
Funding
This research was funded by [Ministry of Industry and Information Technology of the People’s Republic of China] grant number [2017BJ0156].
Conflicts of Interest
The authors declare no conflict of interest.
References
- Hannan, M.A.; Azidin, F.A.; Mohamed, A. Hybrid electric vehicles and their challenges: A review. Renew. Sustain. Energy Rev. 2014, 29, 135–150. [Google Scholar] [CrossRef]
- Parliament, E. Directive 2009/28/EC of the European Parliament and of the Council of 23 April 2009 on the promotion of the use of energy from renewable sources. Off. J. Eur. Union 2009, L120, 5–12. [Google Scholar]
- Rezvani, Z.; Jansson, J.; Bodin, J. Advances in consumer electric vehicle adoption research: A review and research agenda. Transp. Res. Part D Transp. Environ. 2015, 34, 122–136. [Google Scholar] [CrossRef]
- Rahman, I.; Vasant, P.M.; Singh, B.S.M.; Abdullah-Al-Wadud, M.; Adnan, N. Review of recent trends in optimization techniques for plug-in hybrid, and electric vehicle charging infrastructures. Renew Sustain. Energy Rev. 2016, 58, 1039–1047. [Google Scholar] [CrossRef]
- Chung, B.D.; Park, S.; Kwon, C. Equitable distribution of recharging stations for electric vehicles. Soc.-Econ. Plan. Sci. 2017, 63, 1–11. [Google Scholar] [CrossRef]
- Lam, A.Y.S.; Leung, Y.W.; Chu, X. Electric vehicle charging station placement. IEEE Trans. Smart Grid 2013, 5, 2846–2856. [Google Scholar] [CrossRef]
- Xiong, Y.; Gan, J.; An, B.; Miao, C.; Bazzan, A.L. Optimal Electric Vehicle Fast Charging Station Placement Based on Game Theoretical Framework. IEEE Trans. Intell. Transp. Syst. 2017, 99, 1–12. [Google Scholar] [CrossRef]
- Yang, J.; Hao, W.; Chen, L.; Jin, J.; Wang, F. Risk Assessment of Distribution Networks Considering the Charging-Discharging Behaviors of Electric Vehicles. Energies 2016, 9, 560. [Google Scholar] [CrossRef]
- Abdalrahman, A.; Zhuang, W. A Survey on PEV Charging Infrastructure: Impact Assessment and Planning. Energies 2017, 10, 1650. [Google Scholar] [CrossRef]
- Luo, C.; Huang, Y.F.; Gupta, V. Placement of EV Charging Stations—Balancing Benefits among Multiple Entities. IEEE Trans. Smart Grid 2018, 99, 1–10. [Google Scholar] [CrossRef]
- Boysen, N.; Briskorn, D.; Emde, S. Scheduling electric vehicles and locating charging stations on a path. J. Sched. 2018, 21, 111–126. [Google Scholar] [CrossRef]
- Zheng, Y.; Dong, Z.Y.; Xu, Y.; Meng, K.; Zhao, J.H.; Qiu, J. Electric Vehicle Battery Charging/Swap Stations in Distribution Systems: Comparison Study and Optimal Planning. IEEE Trans. Power Syst. 2013, 29, 221–229. [Google Scholar] [CrossRef]
- Wang, G.; Xu, Z.; Wen, F.; Wong, K.P. Traffic-Constrained Multiobjective Planning of Electric-Vehicle Charging Stations. IEEE Trans. Power Deliv. 2013, 28, 2363–2372. [Google Scholar] [CrossRef]
- Wang, S.; Dong, Z.Y.; Luo, F.; Meng, K.; Zhang, Y. Stochastic Collaborative Planning of Electric Vehicle Charging Stations and Power Distribution System. IEEE Trans. Ind. Inform. 2016, 14, 321–331. [Google Scholar] [CrossRef]
- Yao, W.; Zhao, J.; Wen, F.; Dong, Z.; Xue, Y.; Xu, Y.; Meng, K. A Multi-Objective Collaborative Planning Strategy for Integrated Power Distribution and Electric Vehicle Charging Systems. IEEE Trans. Power Syst. 2014, 29, 1811–1821. [Google Scholar] [CrossRef]
- Liu, Z.; Wen, F.; Ledwich, G. Optimal Planning of Electric-Vehicle Charging Stations in Distribution Systems. IEEE Trans. Power Del. 2012, 28, 102–110. [Google Scholar] [CrossRef]
- Colmenar-Santos, A.; Palacio, C.D.; Borge-Diez, D.; Monzón-Alejandro, O. Planning Minimum Interurban Fast Charging Infrastructure for Electric Vehicles: Methodology and Application to Spain. Energies 2014, 7, 1207–1229. [Google Scholar] [CrossRef] [Green Version]
- Bayram, I.S.; Tajer, A.; Abdallah, M.; Qaraqe, K. Capacity Planning Frameworks for Electric Vehicle Charging Stations with Multiclass Customers. IEEE Trans. Smart Grid 2015, 6, 1934–1943. [Google Scholar] [CrossRef]
- Chung, S.H.; Kwon, C. Multi-period planning for electric car charging station locations: A case of Korean Expressways. Eur. J. Oper. Res. 2015, 242, 677–687. [Google Scholar] [CrossRef] [Green Version]
- Wang, G.; Zhang, X.; Wang, H.; Peng, J.-C.; Jiang, H.; Liu, Y.; Wu, C.; Xu, Z.; Liu, W. Robust Planning of Electric Vehicle Charging Facilities with Advanced Evaluation Method. IEEE Trans. Ind. Inform. 2017, 14, 866–876. [Google Scholar] [CrossRef]
- Zhang, A.; Kang, J.E.; Kwon, C. Incorporating demand dynamics in multi-period capacitated fast-charging location planning for electric vehicles. Transp. Res. Part B Methodol. 2017, 103, 5–29. [Google Scholar] [CrossRef]
- Miceli, R.; Viola, F. Designing a Sustainable University Recharge Area for Electric Vehicles: Technical and Economic Analysis. Energies 2017, 10, 1604. [Google Scholar] [CrossRef]
- Shojaabadi, S.; Abapour, S.; Abapour, M.; Nahavandi, A. Optimal planning of plug-in hybrid electric vehicle charging station in distribution network considering demand response programs and uncertainties. IET Gener. Transm. Distrib. 2016, 10, 3330–3340. [Google Scholar] [CrossRef]
- Yin, X.; Zhao, X. Planning of Electric Vehicle Charging Station Based on Real Time Traffic Flow. In Proceedings of the 2016 IEEE Vehicle Power and Propulsion Conference, Hangzhou, China, 17–20 October 2016; pp. 1–4. [Google Scholar]
- Xie, F.; Liu, C.; Li, S.; Huang, Y. Long-term strategic planning of inter-city fast charging infrastructure for battery electric vehicles. Transp. Res. Part E Logist. Transp. Rev. 2018, 109, 261–276. [Google Scholar] [CrossRef]
- Wu, Y.; Xie, C.; Xu, C.; Li, F. A Decision Framework for Electric Vehicle Charging Station Site Selection for Residential Communities under an Intuitionistic Fuzzy Environment: A Case of Beijing. Energies 2017, 10, 1270. [Google Scholar] [CrossRef]
- He, F.; Yin, Y.; Zhou, J. Deploying public charging stations for electric vehicles on urban road networks. Transp. Res. Part C Emerg. Technol. 2015, 60, 227–240. [Google Scholar] [CrossRef]
- Dong, X.; Mu, Y.; Jia, H.; Wu, J.; Yu, X. Planning of Fast EV Charging Stations on a Round Freeway. IEEE Trans. Sustain. Energy 2016, 7, 1452–1461. [Google Scholar] [CrossRef]
- He, S.Y.; Kuo, Y.H.; Wu, D. Incorporating institutional and spatial factors in the selection of the optimal locations of public electric vehicle charging facilities: A case study of Beijing, China. Transp. Res. Part C Emerg. Technol. 2016, 67, 131–148. [Google Scholar] [CrossRef]
- Awasthi, A.; Venkitusamy, K.; Padmanaban, S.; Singh, A.K.; Raj, A.-D.-V.; Perumal, K.M. Optimal Planning of Electric Vehicle Charging Station at the Distribution System Using Hybrid Optimization Algorithm. Energy 2017, 133, 70–78. [Google Scholar] [CrossRef]
- Su, S.; Li, H.; Gao, D. Optimal Planning of Charging for Plug-In Electric Vehicles Focusing on Users’ Benefits. Energies 2017, 10, 952. [Google Scholar] [CrossRef]
- Clement-Nyns, K.; Haesen, E.; Driesen, J. The impact of charging pug-in hybrid electric vehicles on a residential distribution grid. IEEE Trans. Power Syst. 2010, 25, 371–380. [Google Scholar] [CrossRef] [Green Version]
- Staats, P.T.; Grady, W.M.; Arapostathis, A.; Thallam, R.S. A statistical analysis of the effect of electric vehicle battery charging on distribution system harmonic voltages. IEEE Trans. Power Deliv. 2010, 13, 640–646. [Google Scholar] [CrossRef]
- Wu, D.; Aliprantis, D.C.; Gkritza, K. Electric energy and power consumption by light-duty plug-in electric vehicles. IEEE Trans. Power Syst. 2011, 26, 738–746. [Google Scholar] [CrossRef]
- Hao, C.C.; Tang, Y.J.; Shi, J. Study on the Harmonic Impact of Large Scale Electric Vehicles to Grid. Appl. Mech. Mater. 2014, 443, 273–278. [Google Scholar] [CrossRef]
Figure 1.
The charging infrastructure planning flowchart.

Figure 2.
The block diagram of load forecasting based on energy equivalence.
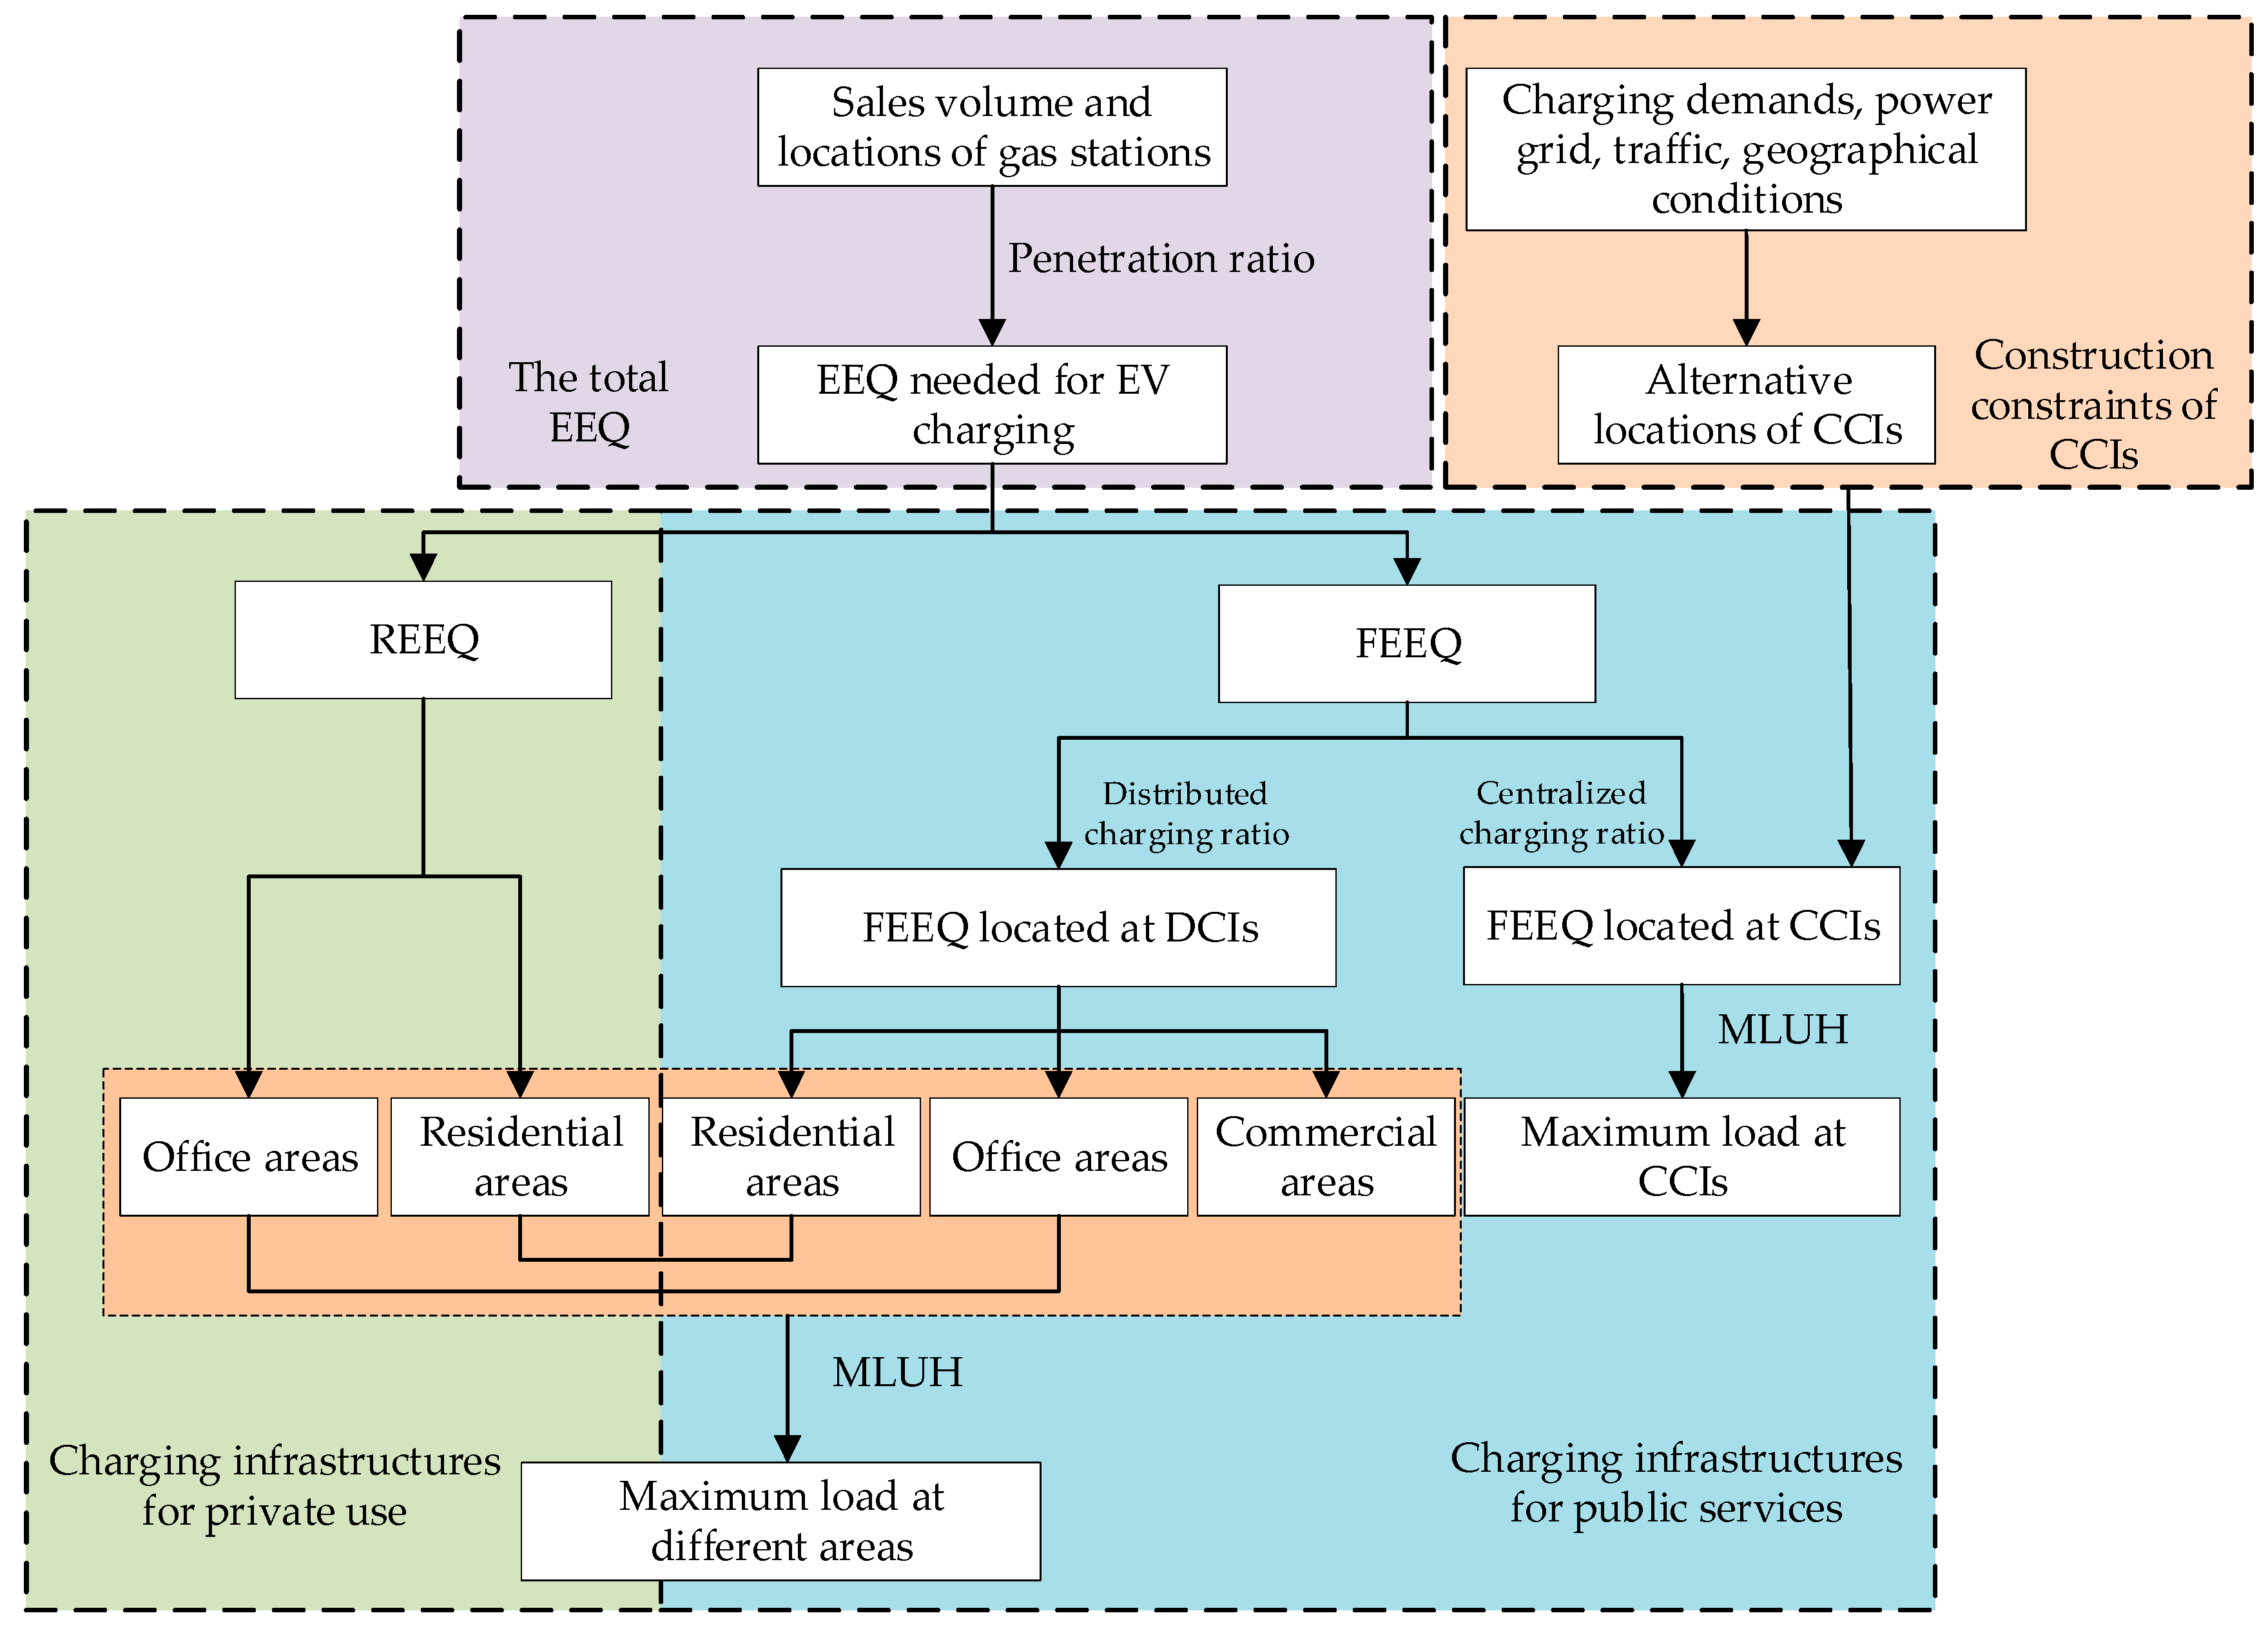
Figure 3.
The transfer of REEQ from gas stations to DCIs in office areas and residential areas.
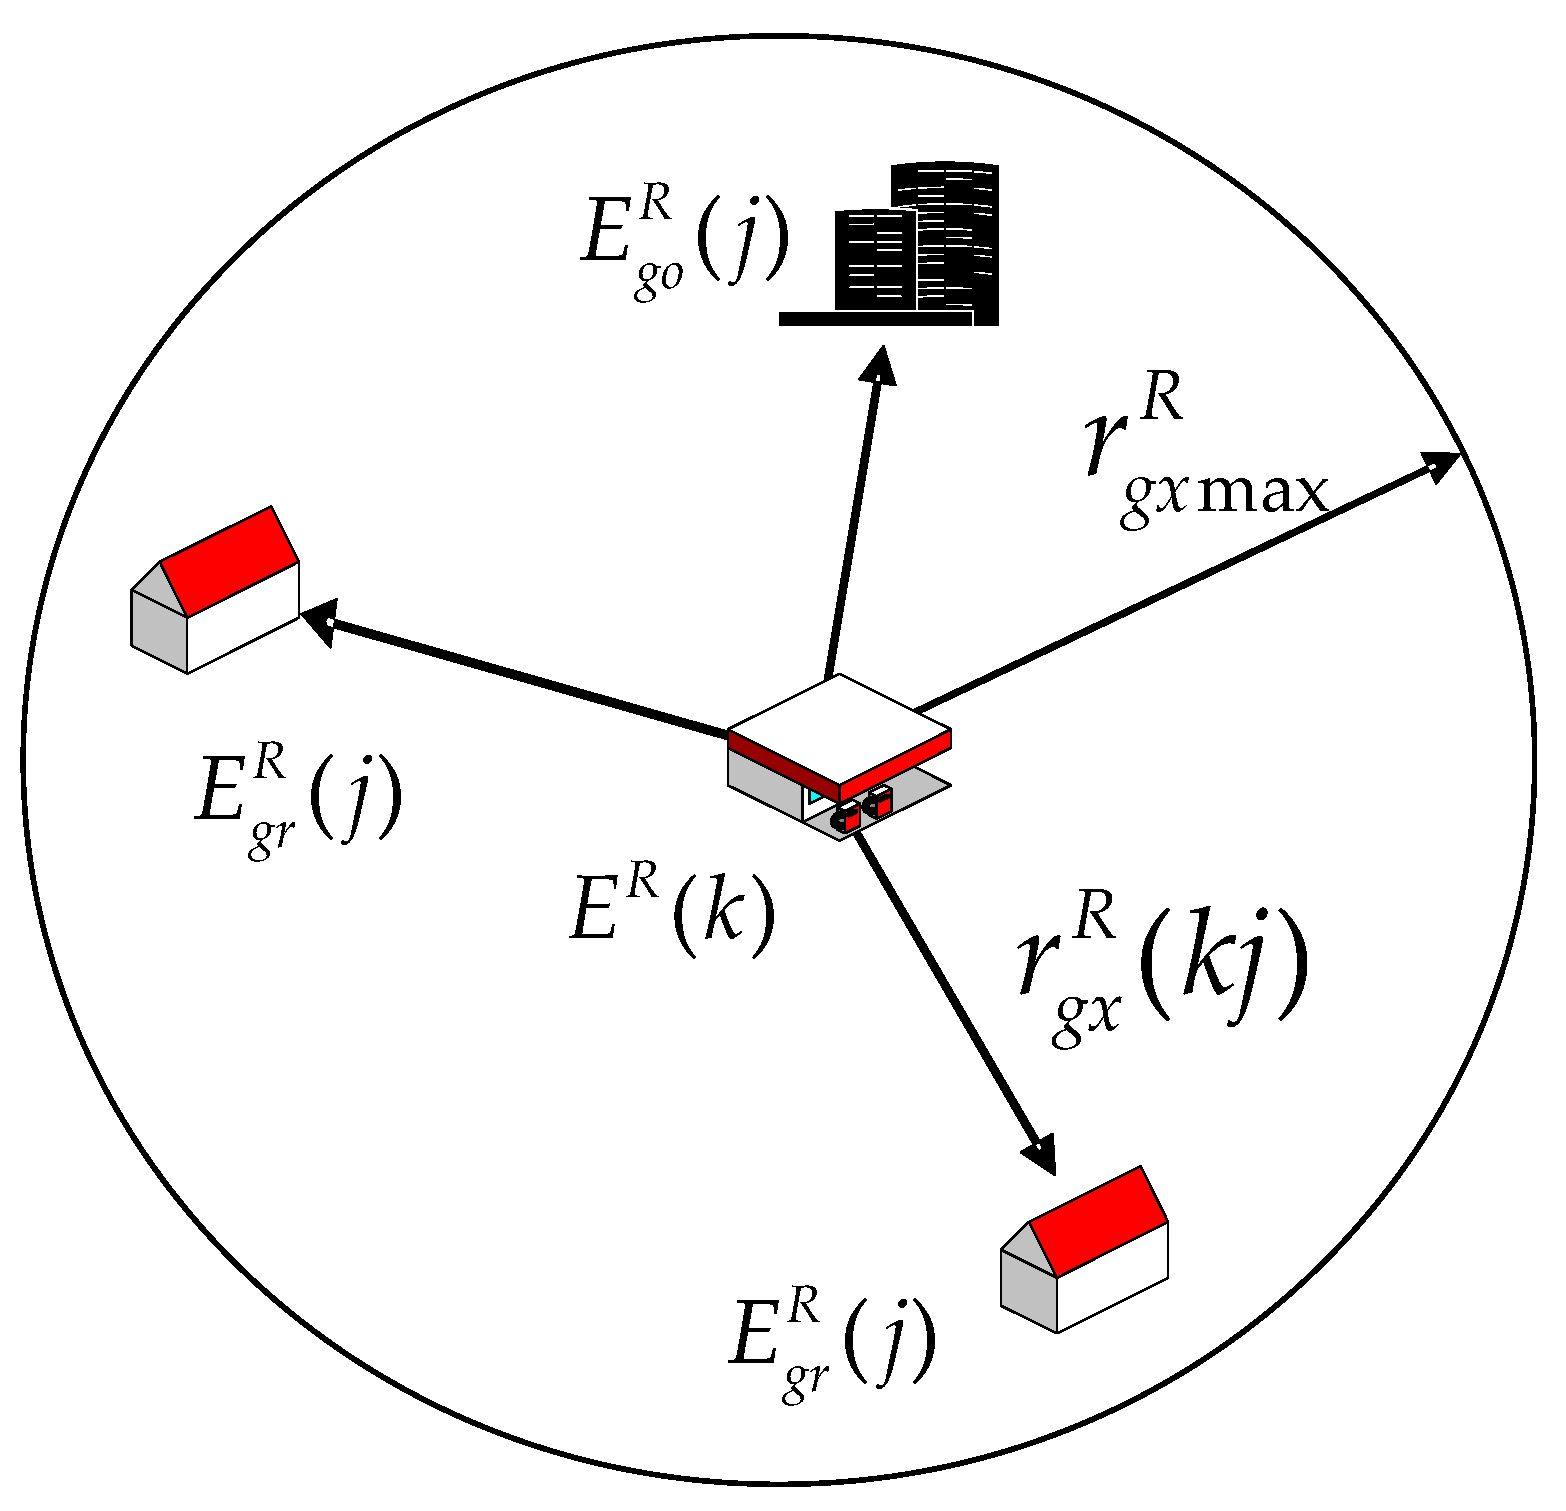
Figure 4.
The transfer of FEEQ from gas stations to CCIs.

Figure 5.
The transfer of FEEQ from gas stations to DCIs in different areas.
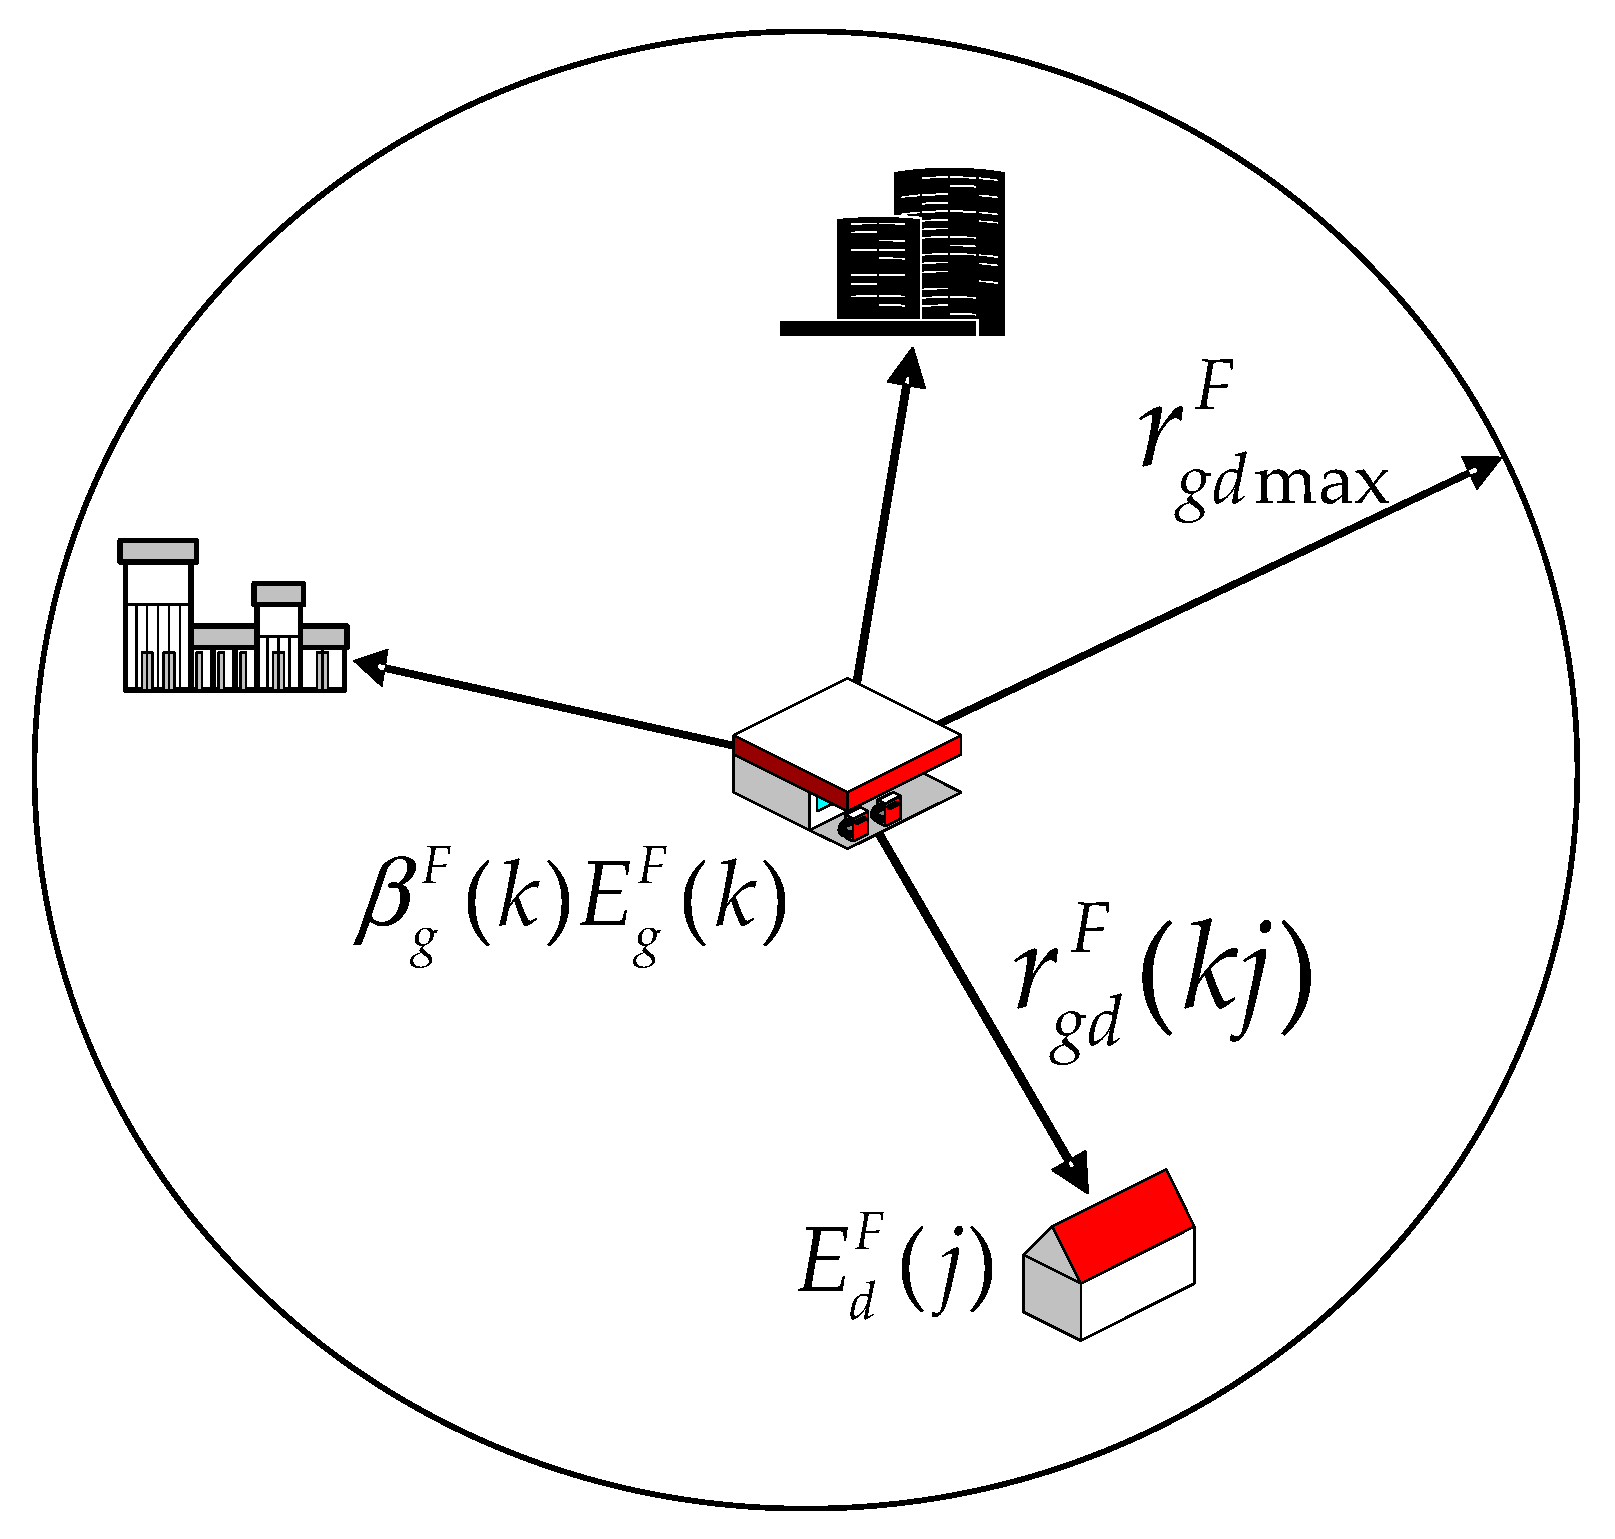
Figure 6.
The geographical locations of typical load regions, gas stations and CCIs.

Figure 7.
The geographical locations of REEQ.

Figure 8.
The geographical locations of FEEQ.

Figure 9.
The geographical locations of the maximum load.


Table 1.
Comparison with several related papers.
| Properties | [25] | [26] | [27] | [28] | This Paper |
|---|---|---|---|---|---|
| Planning area | Inter-city fast charging infrastructure | Residential communities | Urban road networks | Round freeway | Urban with tight land supply |
| Method of determining locations of CCIs | Genetic algorithm | Comprehensive EV charging station site selection decision framework | Tour-based equilibrium framework, genetic algorithm | Shared nearest neighbor (SNN) clustering algorithm | Give optional locations first and check constraints |
| Load forecasting method | Mixed integer programming model | None | None | Queuing theory | Energy equivalence method, equal product of load and distance criterion |
| Feasibility of parameter acquisition | Easy | Difficult | Easy | Difficult | Easy |
Table 2.
The parameters in the load forecasting model.
| Model Parameters | Value |
|---|---|
| K (kWh·(100 km)−1·T−1) | 10 |
| W (T) | 2 |
| H (L·(100 km)−1) | 8 |
| Unit conversion of fuel sales (L·T−1) | 1378 |
| (km) | 3 |
| (km) | 3 |
| (km) | 2 |
| (km) | 1 |
Table 3.
The influence factors of each parameter for energy equivalence.
| Parameters | Penetration Ratio | CCR/DCR | DCI MLUH | CCI MLUH |
|---|---|---|---|---|
| Influence Factors | ||||
| Economy/income | △ △ | − | − | − |
| EV price | △ △ △ | − | − | − |
| Drive range | △ △ | △ | − | − |
| Regularity of use & charge | − | − | △ △ | △ △ |
| Charging price | △ | △ | − | − |
| Abundance of charging infrastructures | △ △ △ | △ △ △ | △ △ | △ △ |
Table 4.
The data of each area.
| Coordinates (km) | Regional Type | Scale Factor | MLUH (h) | REEQ (kWh) | FEEQ (kWh) | Maximum Lode (kW) |
|---|---|---|---|---|---|---|
| (0.85,0.67) | R | 0.91 | 2659 | 444,643.45 | 72,150.32 | 194.36 |
| (0.40,1.20) | R | 0.98 | 2986 | 713,117.80 | 169,849.83 | 295.70 |
| (1.05,1.34) | R | 1.00 | 2290 | 488,028.03 | 73,183.07 | 245.07 |
| (0.77,1.85) | R | 0.89 | 2346 | 465,238.58 | 36,465.62 | 213.86 |
| (0.53,2.44) | R | 0.86 | 2155 | 319,634.10 | 22,725.55 | 158.87 |
| (1.27,2.12) | R | 0.94 | 2295 | 441,517.26 | 27,652.05 | 204.43 |
| (1.37,0.54) | R | 0.98 | 2170 | 467,117.57 | 34,608.37 | 231.21 |
| (2.20,2.34) | R | 1.12 | 2462 | 689,697.31 | 16,837.70 | 286.98 |
| (1.83,1.71) | R | 1.20 | 2998 | 878,445.83 | 24,528.93 | 301.19 |
| (2.16,1.52) | R | 0.95 | 2230 | 576,214.22 | 33,213.39 | 273.29 |
| (2.00,1.01) | R | 0.91 | 2150 | 579,726.01 | 52,300.58 | 293.97 |
| (2.85,2.34) | R | 1.10 | 2426 | 689,584.43 | 23,895.10 | 294.10 |
| (3.62,1.83) | R | 1.00 | 2173 | 593,022.67 | 35,520.46 | 289.25 |
| (4.17,2.34) | R | 0.88 | 2430 | 622,207.07 | 36,969.23 | 271.27 |
| (4.72,2.00) | R | 0.85 | 2364 | 431,430.77 | 24,951.32 | 193.06 |
| (4.63,1.47) | R | 0.89 | 2456 | 388,663.81 | 14,570.37 | 164.18 |
| (4.83,0.85) | R | 1.18 | 2487 | 425,649.67 | 49,392.17 | 191.01 |
| (3.91,0.53) | O | 1.14 | 2646 | 670,019.19 | 92,825.86 | 288.30 |
| (0.35,2.09) | O | 0.98 | 2303 | 548,846.95 | 58,993.70 | 263.93 |
| (1.21,2.42) | O | 0.95 | 2730 | 383,282.02 | 8499.01 | 143.51 |
| (1.17,1.69) | O | 0.96 | 2460 | 461,767.22 | 28,907.09 | 199.46 |
| (1.55,1.39) | O | 0.99 | 2363 | 570,672.06 | 33,959.61 | 255.87 |
| (2.33,1.87) | O | 1.00 | 2798 | 641,540.74 | 24,672.64 | 238.10 |
| (2.32,0.91) | O | 0.93 | 2486 | 547,983.13 | 45,223.29 | 238.62 |
| (2.38,0.55) | O | 0.90 | 2253 | 502,742.51 | 45,761.06 | 243.45 |
| (3.39,2.39) | O | 0.89 | 2660 | 521,511.99 | 32,235.41 | 208.18 |
| (3.71,1.43) | O | 0.91 | 2669 | 449,246.45 | 22,468.56 | 176.74 |
| (3.37,0.52) | O | 0.95 | 2356 | 387,664.96 | 33,507.98 | 178.77 |
| (4.28,0.65) | O | 0.96 | 2668 | 652,188.10 | 99,495.59 | 281.74 |
| (4.83,0.40) | O | 0.96 | 2286 | 376,894.97 | 53,517.77 | 188.28 |
| (4.66,2.31) | O | 0.93 | 2355 | 486,307.18 | 29,422.26 | 218.99 |
| (0.48,0.59) | O | 0.99 | 2575 | 540,775.57 | 121,501.55 | 257.19 |
| (1.63,0.84) | O | 0.94 | 2480 | 574,579.81 | 51,539.58 | 252.47 |
| (4.14,1.90) | O | 1.10 | 2853 | 777,569.41 | 54,135.20 | 291.52 |
| (0.82,2.13) | C | 1.30 | 1593 | 0.00 | 39,312.89 | 24.68 |
| (0.85,0.93) | C | 1.21 | 1786 | 0.00 | 106,364.31 | 59.55 |
| (1.76,2.33) | C | 1.10 | 1572 | 0.00 | 24,256.35 | 15.43 |
| (1.50,1.91) | C | 1.05 | 1493 | 0.00 | 18,529.70 | 12.41 |
| (1.36,1.03) | C | 0.99 | 1654 | 0.00 | 70,775.76 | 42.79 |
| (1.87,1.25) | C | 0.98 | 1663 | 0.00 | 42,237.50 | 25.40 |
| (2.75,1.98) | C | 1.20 | 1465 | 0.00 | 35,429.99 | 24.18 |
| (2.85,1.60) | C | 1.15 | 1523 | 0.00 | 20,286.15 | 13.32 |
| (3.83,2.36) | C | 1.16 | 1698 | 0.00 | 40,096.12 | 23.61 |
| (4.61,1.65) | C | 1.21 | 1598 | 0.00 | 26,215.95 | 16.41 |
| (4.41,0.89) | C | 1.08 | 1773 | 0.00 | 61,404.94 | 34.63 |
| (3.62,0.66) | C | 1.18 | 1653 | 0.00 | 52,977.30 | 32.05 |
Table 5.
The data on the gas stations.
| Coordinates (km) | Sale Volume (t·d−1) | Penetration Ratio | Rigid Factor | DCR | CCR |
|---|---|---|---|---|---|
| (0.39,0.91) | 28.56 | 15% | 45% | 18% | 82% |
| (0.33,1.79) | 23.78 | 12% | 51% | 14% | 86% |
| (1.97,0.64) | 24.19 | 13% | 57% | 20% | 80% |
| (1.86,2.04) | 21.54 | 16% | 75% | 15% | 85% |
| (3.19,2.03) | 22.73 | 14% | 73% | 15% | 85% |
| (4.26,0.34) | 30.12 | 13% | 55% | 20% | 80% |
| (4.34,2.12) | 22.44 | 15% | 69% | 18% | 82% |
Table 6.
The data on CCIs.
| Coordinates (km) | MLUH (h) | FEEQ (kWh) | Maximum Load (kW) |
|---|---|---|---|
| (0.68,1.45) | 4576 | 4,680,899.21 | 1022.92 |
| (2.35,1.30) | 3705 | 1,607,062.38 | 433.76 |
| (3.66,2.11) | 4096 | 1,914,856.98 | 467.49 |
| (4.58,0.58) | 3682 | 1,786,537.75 | 485.21 |
© 2018 by the authors. Licensee MDPI, Basel, Switzerland. This article is an open access article distributed under the terms and conditions of the Creative Commons Attribution (CC BY) license (http://creativecommons.org/licenses/by/4.0/).
Share and Cite
MDPI and ACS Style
Guo, C.; Yang, J.; Yang, L. Planning of Electric Vehicle Charging Infrastructure for Urban Areas with Tight Land Supply. Energies 2018, 11, 2314. https://doi.org/10.3390/en11092314
AMA Style
Guo C, Yang J, Yang L. Planning of Electric Vehicle Charging Infrastructure for Urban Areas with Tight Land Supply. Energies. 2018; 11(9):2314. https://doi.org/10.3390/en11092314
Chicago/Turabian StyleGuo, Chunlin, Jingjing Yang, and Lin Yang. 2018. "Planning of Electric Vehicle Charging Infrastructure for Urban Areas with Tight Land Supply" Energies 11, no. 9: 2314. https://doi.org/10.3390/en11092314
Note that from the first issue of 2016, this journal uses article numbers instead of page numbers. See further details here.