Smart Power Meters in Augmented Reality Environment for Electricity Consumption Awareness
by
 , , , and
Leopoldo Angrisani
1,† ,
,
Francesco Bonavolontà
1,†,
Annalisa Liccardo
1,*,†,
Rosario Schiano Lo Moriello
2,† and
Francesco Serino
3,† 1
Dipartimento di Ingegneria Elettrica e delle Tecnologie dell’Informazione, Università di Napoli Federico II, 80125 Naples, Italy
2
Dipartimento di Ingegneria Industriale, Università di Napoli Federico II, 80125 Naples, Italy
3
Nexus Tlc, Via Salvo D’Acquisto 1, 80010 Quarto, Italy
*
Author to whom correspondence should be addressed.
†
These authors contributed equally to this work.
Energies 2018, 11(9), 2303; https://doi.org/10.3390/en11092303
Submission received: 11 August 2018
/
Revised: 29 August 2018
/
Accepted: 29 August 2018
/
Published: 1 September 2018
(This article belongs to the Section A: Sustainable Energy)
Abstract
:Reducing or optimizing electrical power consumption is one of the most fundamental goals within the current frameworks of smart energy management. This approach would be spread from the industrial plants, characterized by high consumptions often well distributed throughout the day, down to the domestic utilities, typically discontinuous and with limited consumption at the single user level. More specifically, it is desirable for the latter case to be able to control in a simple and effective way the power consumption of typical household appliances by means of technologies that are already used and spread (such as tablets and smartphones) to become aware of their actual impact, both economic and environmental. To this aim, the authors present the proof-of-principle of user-friendly monitoring system for power consumption awareness based on the recent technologies of Internet of Things (IoT) and Augmented Reality (AR). In particular, common devices such as smartphones associated along with appropriate measurement nodes and a suitable app, developed to the purpose, allow consumers to view in AR environment electrical consumption of their domestic electrical loads to consciously decide whether to switch them off. Performance of both sensor nodes and AR environment were preliminarily assessed in either laboratory experiments or actual household context, highlighting the promising effectiveness of the proposed approach.
1. Introduction
Measuring is the first step to be aware about electrical consumption and, consequently, adopting virtuous behaviors in terms of energy savings and efficiency [1]. In many countries, traditional energy meters for billing the users’ energy consumption have been replaced by so-called Smart Meters that, besides allowing billing based on real consumption, enable consumers to continuously monitor their energy demand [2]. Smart meters can be, in fact, considered as the first link of an intelligent data mining chain designated to acquire, analyze, forecast and visualize time series of energy to detect and analyze different patterns of energy consumption. Recognized patterns are key factors to infer and analyze the impact of consumers’ energy consumption behavior and energy forecasting trend [3,4]. Moreover, recognized patterns can be used to integrate the smart meters with the possibility of adapting domestic consumption according to an optimizing pattern [5].
This way, smart meters are considered the cornerstone to promote smart consumption of electrical power, as demonstrated by several conducted surveys. As an example, in 2017, Smart Energy GB [6] asked Populus [7] to conduct a survey of energy behavior before and after upgrading to a smart meter [8], to better understand if and how smart meters could involve changes or improvements. The sample of survey has been divided in three different groups based on: (i) users who do not understand what a smart meter is; (ii) users who understand what a smart meter is, but do not have one; and (iii) users who have a smart meter. According to this survey, users who have a smart meter are more likely than others to say they understand how much energy they use and how to save energy.
However, there are still barriers that limit benefit arising from smart meter use [9]. In this regard, two important statewide surveys conducted in Vermont in 2015 and 2016 have highlighted that having a smart meter has not reduced the electricity of many Vermont residents [10]. In particular, the survey conducted in 2015 reports that, among users who knew that they have a smart meter, only 2.2% have significantly reduced their electricity use, and 9.6% have reduced their electricity use a little bit. In 2016, the percent of users who have significantly reduced their electricity use grew to 3.6% and to 14.1% for those who have reduced their electricity use a little bit. According to the authors of this study, one reason relies on the difficulty of users in accessing the information that smart meters provide and they are not changing their behavior as a result [11]. From the technological point of view, the complexity of the information displayed, the lack of a simple interface, and the way in which the data are reported on the invoice certainly limit the interaction between the consumer and the smart meter [12]. Therefore, smart meter technology appears to be underutilized.
It would be necessary to equip buildings with devices capable of ensuring a straightforward interaction between the energy meter and the consumer to enable the consumer to know the household consumption [13]. As an example, the Commission for Regulation of Utilities (CRU) of Ireland, in the “Annual Survey of Residential and Small-to-Medium Enterprise (SME) Customers in the Gas and Electricity Markets in Ireland, December 2017”, reports that replies suggest mobile app as the most popular method for viewing usage (48% of survey respondents) with respect to 42% for access via website and 10% for physical device.
It would also be important for the consumers to be aware of the consumption of their individual loads, in addition to the overall consumption of their own home. Indeed, the average consumer does not know, for example, the consumption of domestic appliances when they are in standby mode [14]. Moreover, consumers do not know how much the power consumption is actually modified by changing the temperature of the washing machine or oven by 20 °C. If the information were immediate and easily accessible, the visualization of the lost power and its consequent cost would encourage consumers to pay greater attention towards good energy saving practices.
Augmented Reality (AR) can be a valuable solution in this context [15]. The term AR means an enrichment of the human sensory perception, through further information in the form of data, geographic maps and holograms, artificially added to reality. Elements that “increase” reality can be added through a mobile device, such as a smartphone, with the use of vision (smart glasses), listening (earphones) and manipulation (gloves) devices that add multimedia information to the reality already perceived [16]. Differently from Virtual Reality (VR), where additional information is prevalent and consumers are immersed in a fully simulated environment, in AR applications, people continue to live and experience the common physical reality, but enjoy and/or take advantage of additional information or manipulation of the reality itself. Moreover, several experiences in different application fields, from education to maintenance, highlight the better results achieved by means of AR-based presentation of information with respect to the traditional graphs and plots in terms of immediacy, directness and ease of use [17,18,19,20].
In this paper, the authors present the proof-of-concept of a user-friendly system, based on an AR interface, for household power consumption monitoring to make consumers aware of the consumption and the impact of their domestic loads on power demand. In particular, the system mainly relies upon
- A set of smart low-cost sensor nodes realized according to the current makers’ approach (i.e., with commercially available components). The nodes have to be installed between the power supply socket and a load or set of loads and measure the Root Mean Square (RMS) value of voltage and current, the demanded active power and the Power Factor (PF) of the load.
- An IoT-based communication layer for the transmission of the measured values to an adequate platform.
- A suitable app for smartphones and tablets capable of presenting and rendering measured values in AR environment to users for their “augmented power consumption awareness”. In particular, consumers can easily access to data by means of their device camera; when a load enters in the camera view, its electrical parameters appear as a label overlying the real object.
2. The Sensor Node
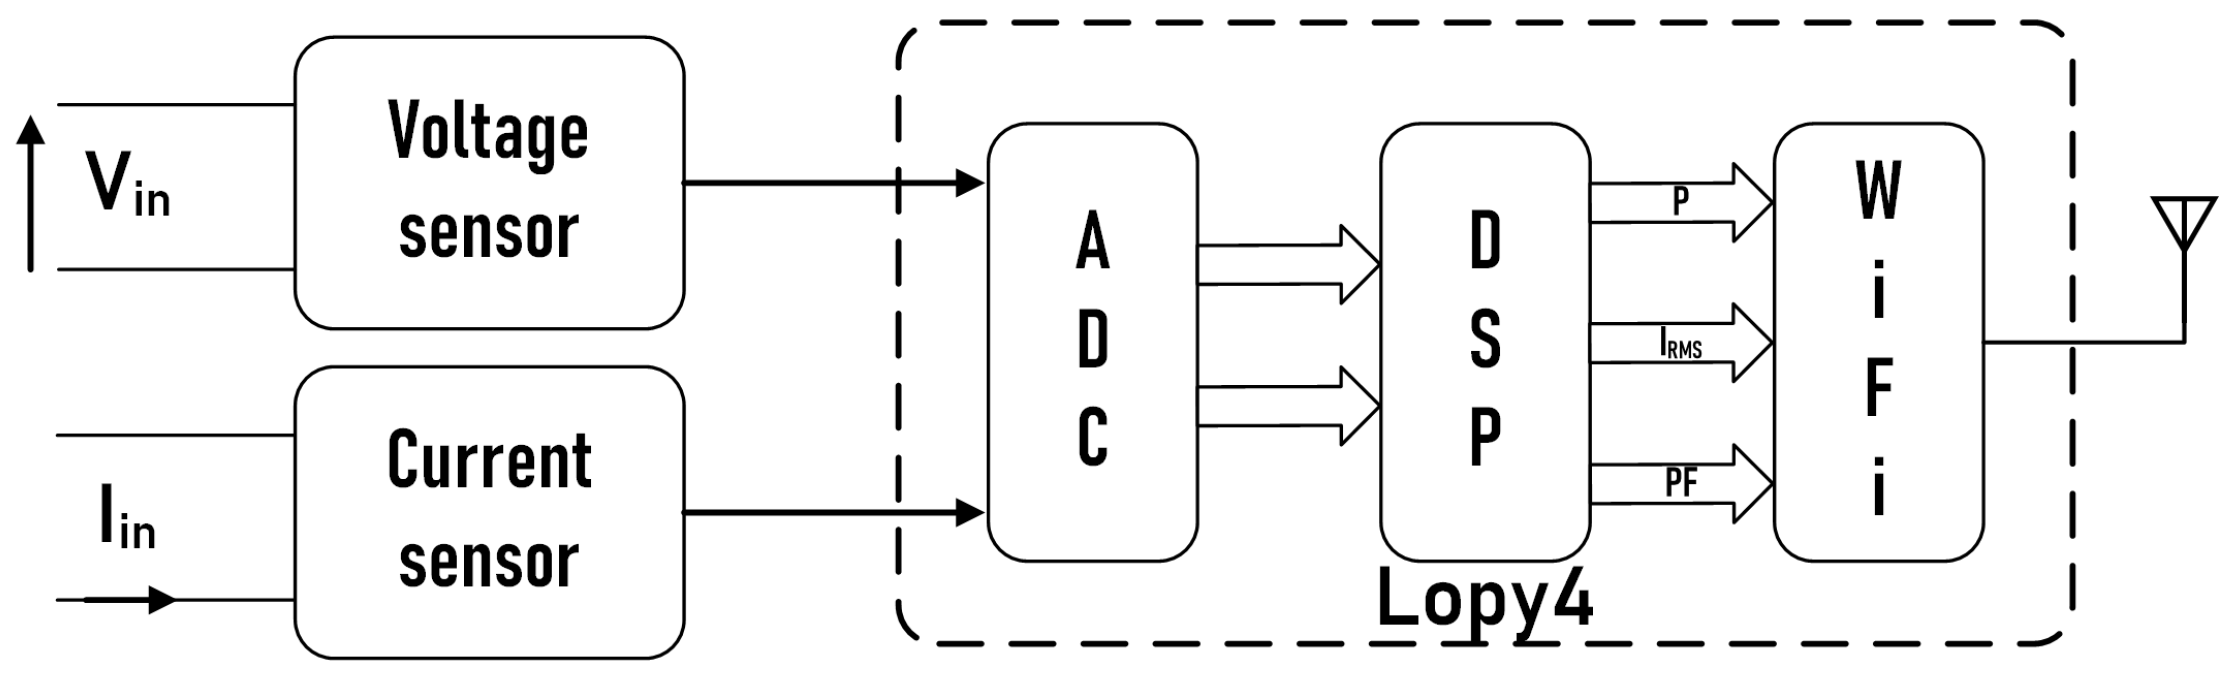
The main element of the user-friendly monitoring system consists of sensor nodes installed between power supply sockets and loads that have to be monitored [21]. Each sensor node (Figure 1) consists of three functional blocks: (i) analog front end, through which the voltage and current signals are adapted and connected to the next blocks; (ii) analog to digital conversion and numerical processing section, which digitizes the received signals and processes them to measure the active power; and (iii) transmission unit, which transmits the measured parameters from the processor to the IoT platform [22]. In the following, the three functional blocks are described in detail.
2.1. Analog Front End
According to the recent IoT and Do-It-Yourself (DIY) paradigms, the analog front-end has been realized by means of COTS (commercial off-the-shelf) components; in particular, two commercial cost-effective sensors have been adopted for acquiring the voltage and current waveforms.
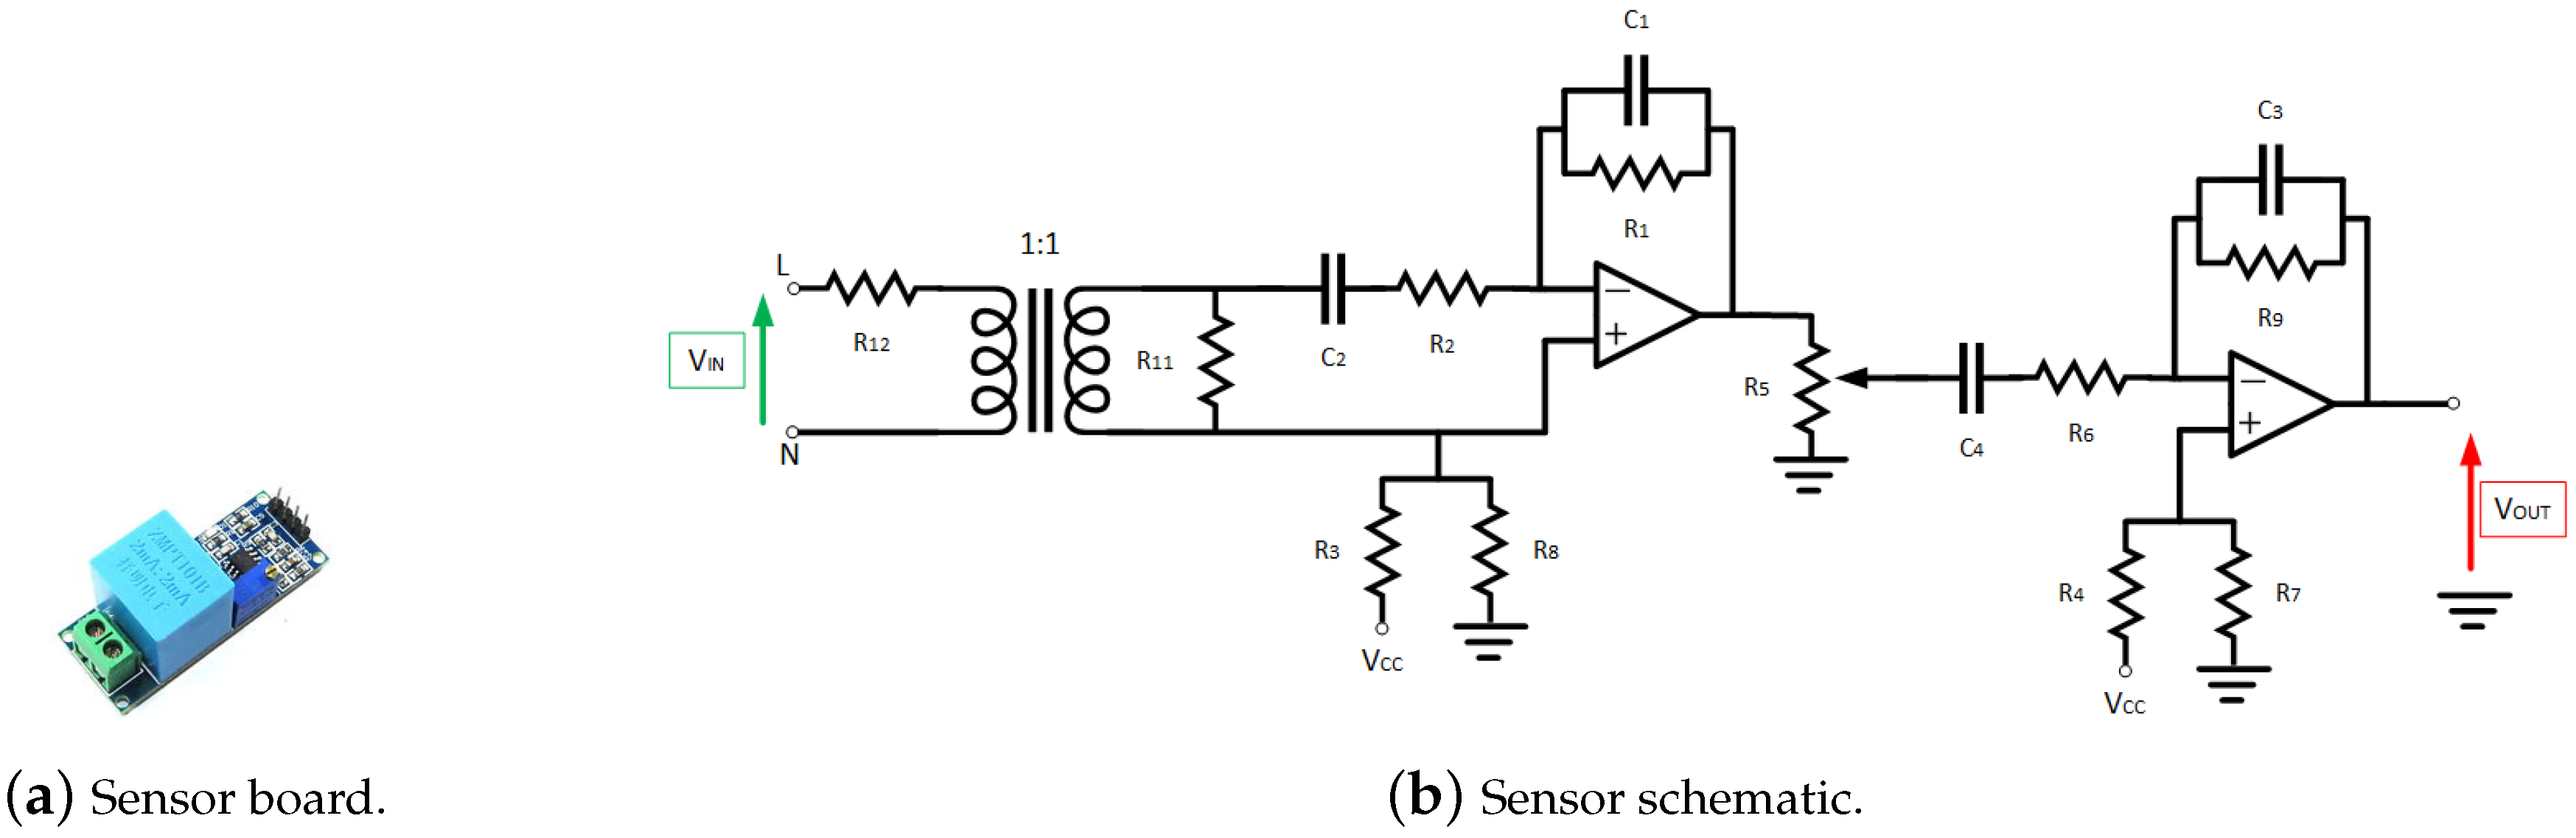
The voltage sensor board along and its circuit schematic are shown in Figure 2a,b, respectively. In particular, the voltage sensor is based on a high value resistance that limits the current flowing in the isolating transformer ZMPT101B. The transformer secondary current is converted to a voltage drop on the resistance , that is conditioned through two bandpass filters. To adapt the voltage levels to the range of the adopted Analog to Digital Converter (ADC), the voltage is amplified by a variable gain through the potentiometer and a DC offset equal to is added by means of an opamp, being the supply voltage of the next microcontroller section.
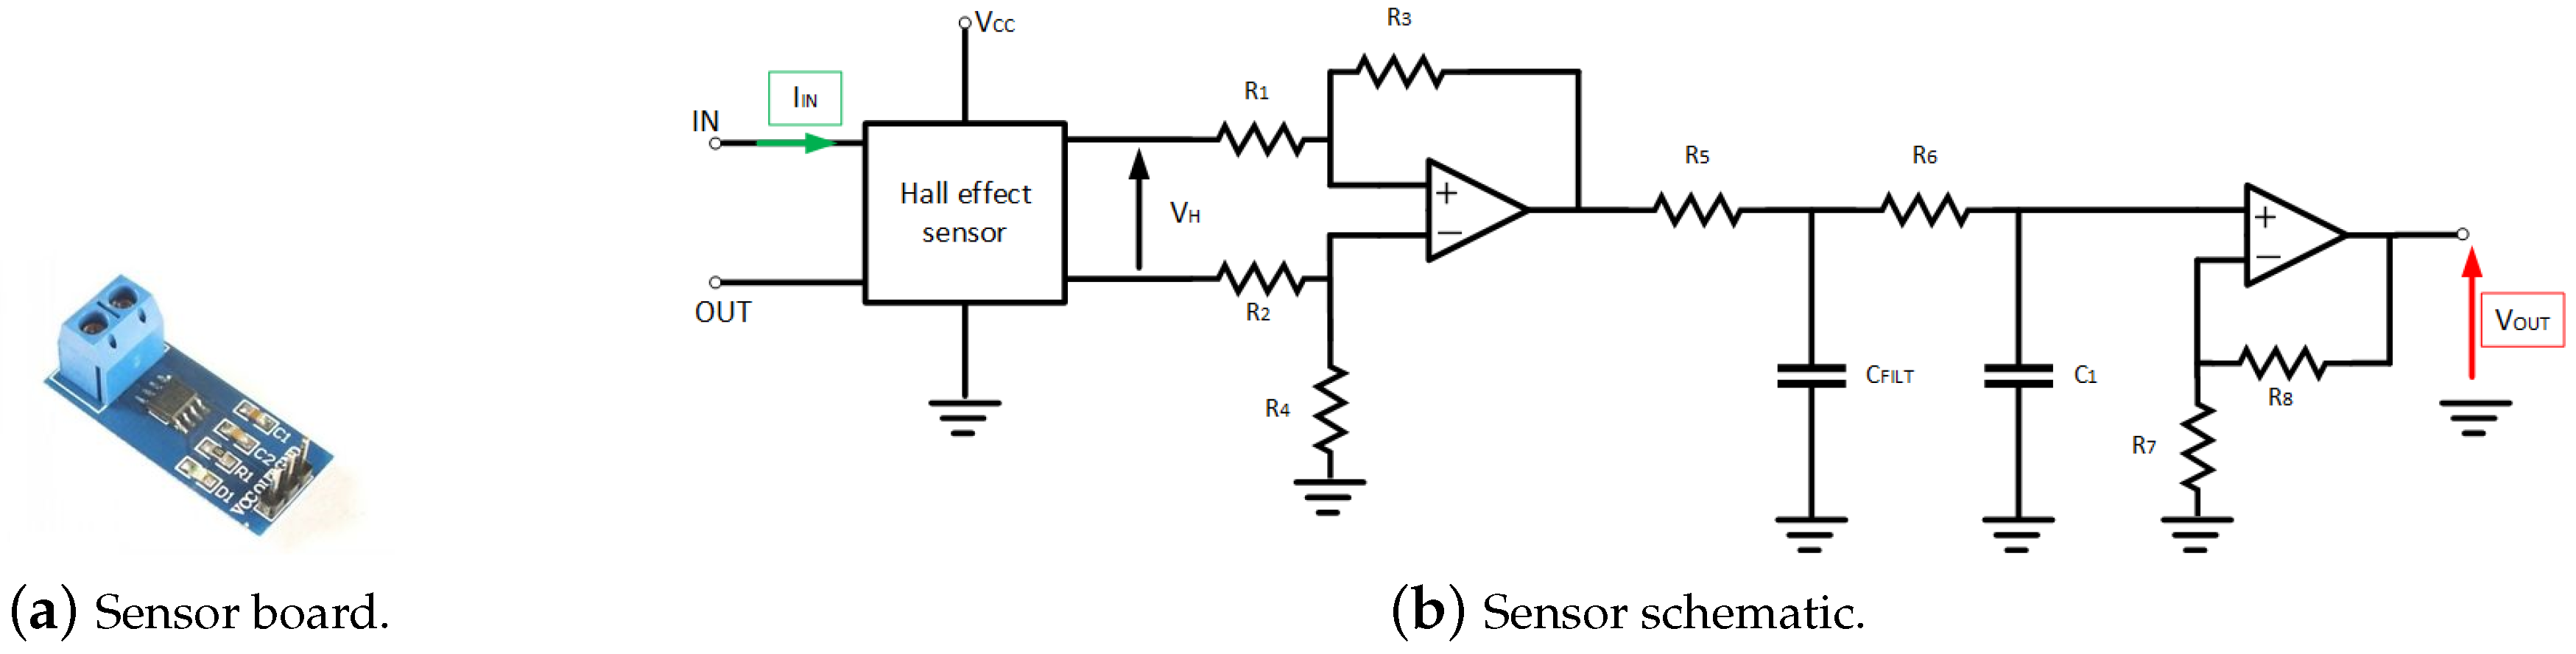
The current sensor, shown in Figure 3a, is the board ACS 712 [23], which is based on a Hall effect sensor, whose Hall voltage is amplified, filtered and added to a DC voltage according to the conditioning circuit depicted in in Figure 3b.
Both sensors stand out for their low cost, which makes them particularly suitable for deploying monitoring systems involving several sensors distributed on different electrical plants. The main drawback consists in the difficulty of achieving their specifications, since information about these low-cost devices is generally poor or even absent [24]. Due to the complete lack of either information or specifications about the adopted sensors, a preliminary stage of metrological characterization turned out to be necessary.
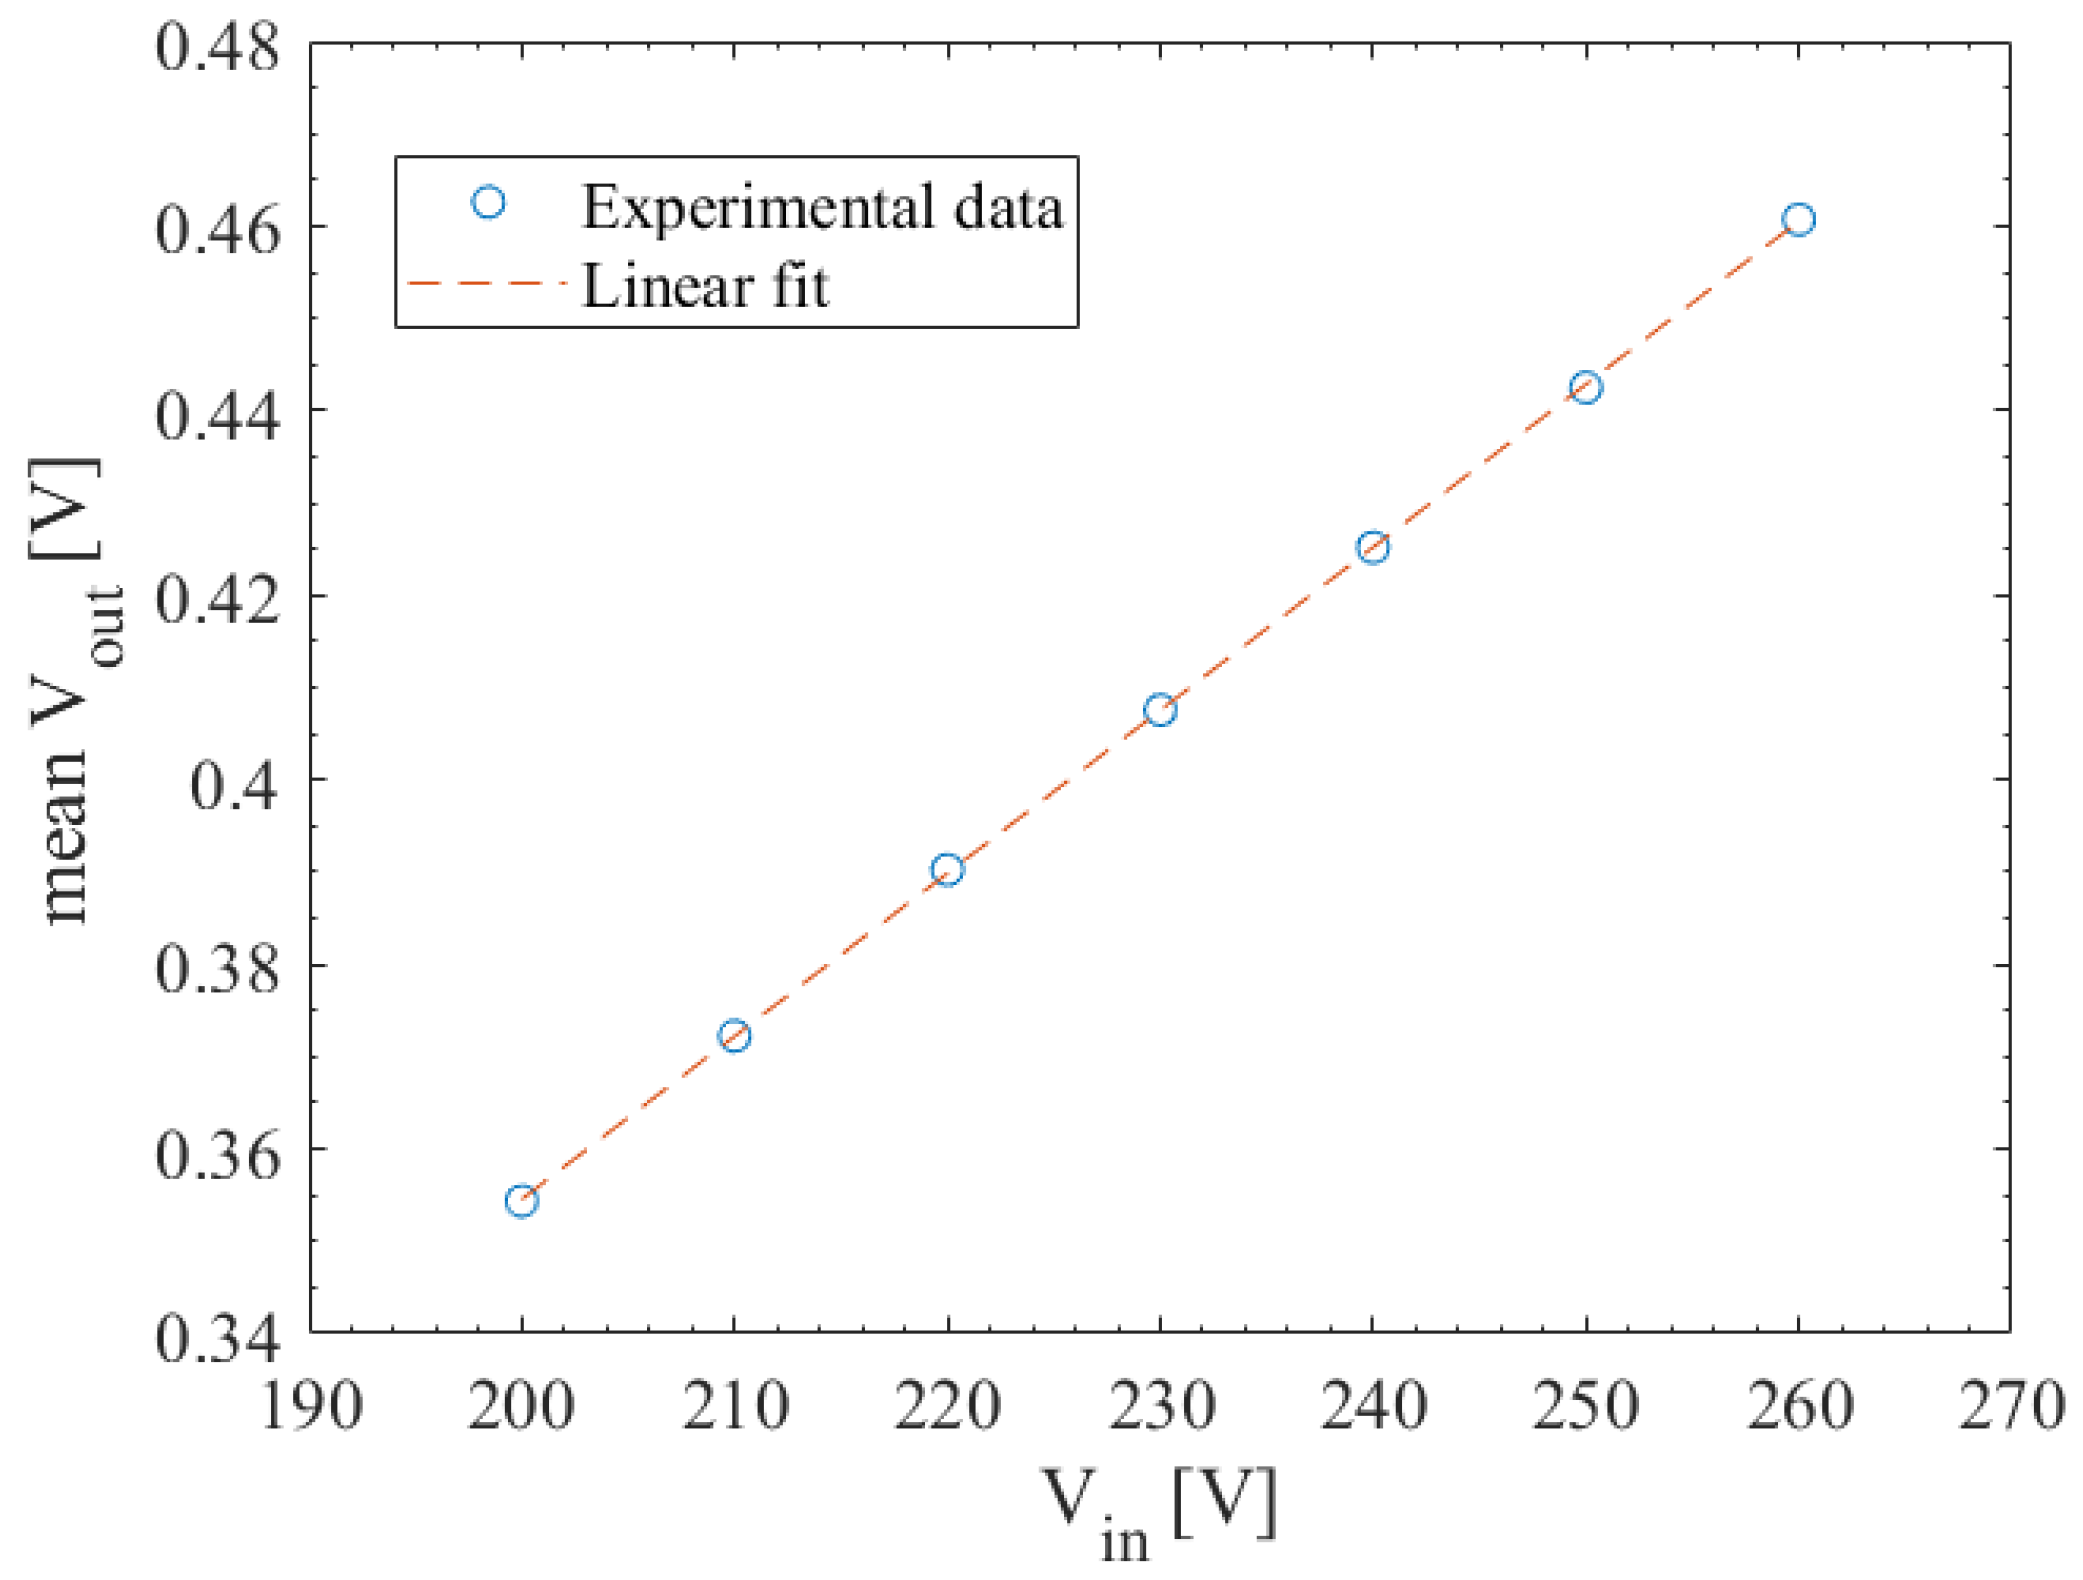
Performance of the voltage sensor has been assessed by means of a calibrator Fluke 5700A, whose relative uncertainty is lower than 2 ppm. In particular, the calibrator has been configured to generate a sinusoidal voltage, with frequency of 50 Hz and Root Mean Square (RMS) values within the range between 200 and 260 V, with a step of 10 V. This interval was chosen considering that the companies supplying electricity must guarantee, in Italy, a voltage whose RMS rated value is 230 V with a tolerance of 10%, according to the current CEI EN 50160 standard [25].
Both input and output signals of the voltage sensor were acquired through the two channels of a Tektronix TDS 5034B digital oscilloscope, configured to acquire five periods of the 50 Hz voltage, with a sampling rate equal to 25 kS/s. Through a Personal Computer, samples were transferred from the oscilloscope memory and, thanks to a straightforward algorithm, RMS value of the output voltage and the phase displacement between sensor output and input were measured. For each voltage value set on the calibrator, 100 repeated measurements were performed to estimate the mean value and standard deviation of the considered parameters.
The obtained results are shown in Figure 4. The blue circles represent the mean RMS values of the sensor output for different inputs; the red dashed line shows the linear fit of the experimental points. In the considered voltage range, the measured values remarkably fit a linear trend, with an estimated transduction function equal to
In Figure 5a,b, the estimated performance parameters are shown. In particular, Figure 5a shows the sensor non-linearity in terms of differences between mean RMS values of the output with respect to the interpolated ones of Figure 4. Furthermore, for each experimental point, 3 bounds of the observed RMS values are indicated to appreciate the repeatability of the sensor output. Figure 5b, instead, shows the means of the measured phase displacements between the output and the input waveforms. For this quantity, 3 bounds is also reported.
Differently from what can be expected for a low-cost sensor, experienced non-linearity and phase displacement are compatible with zero [26]. As regards the deviation , its absolute value remains lower than 0.4 mV, whereas the experimental standard deviation of 100 measures exhibits slight variations with respect to the input voltage, so that the 3 is always lower than 0.5 mV. With reference to the phase displacement , the mean value is always lower than 0.8 mrad, while the 3 is lower than 0.5 mrad.
Further tests were conducted to estimate the same performance factors on different sensors, thus gaining information similar to a B-type uncertainty approach. In particular, 10 voltage sensors were considered and the estimated performance factors are reported in Table 1. In addition, for these tests, the overall performance of the chosen sensor turned out to be satisfactory; as an example, experienced bounds for RMS voltage values corresponded to about 2 V expanded uncertainty on the input voltage if propagated according to Equation (1).
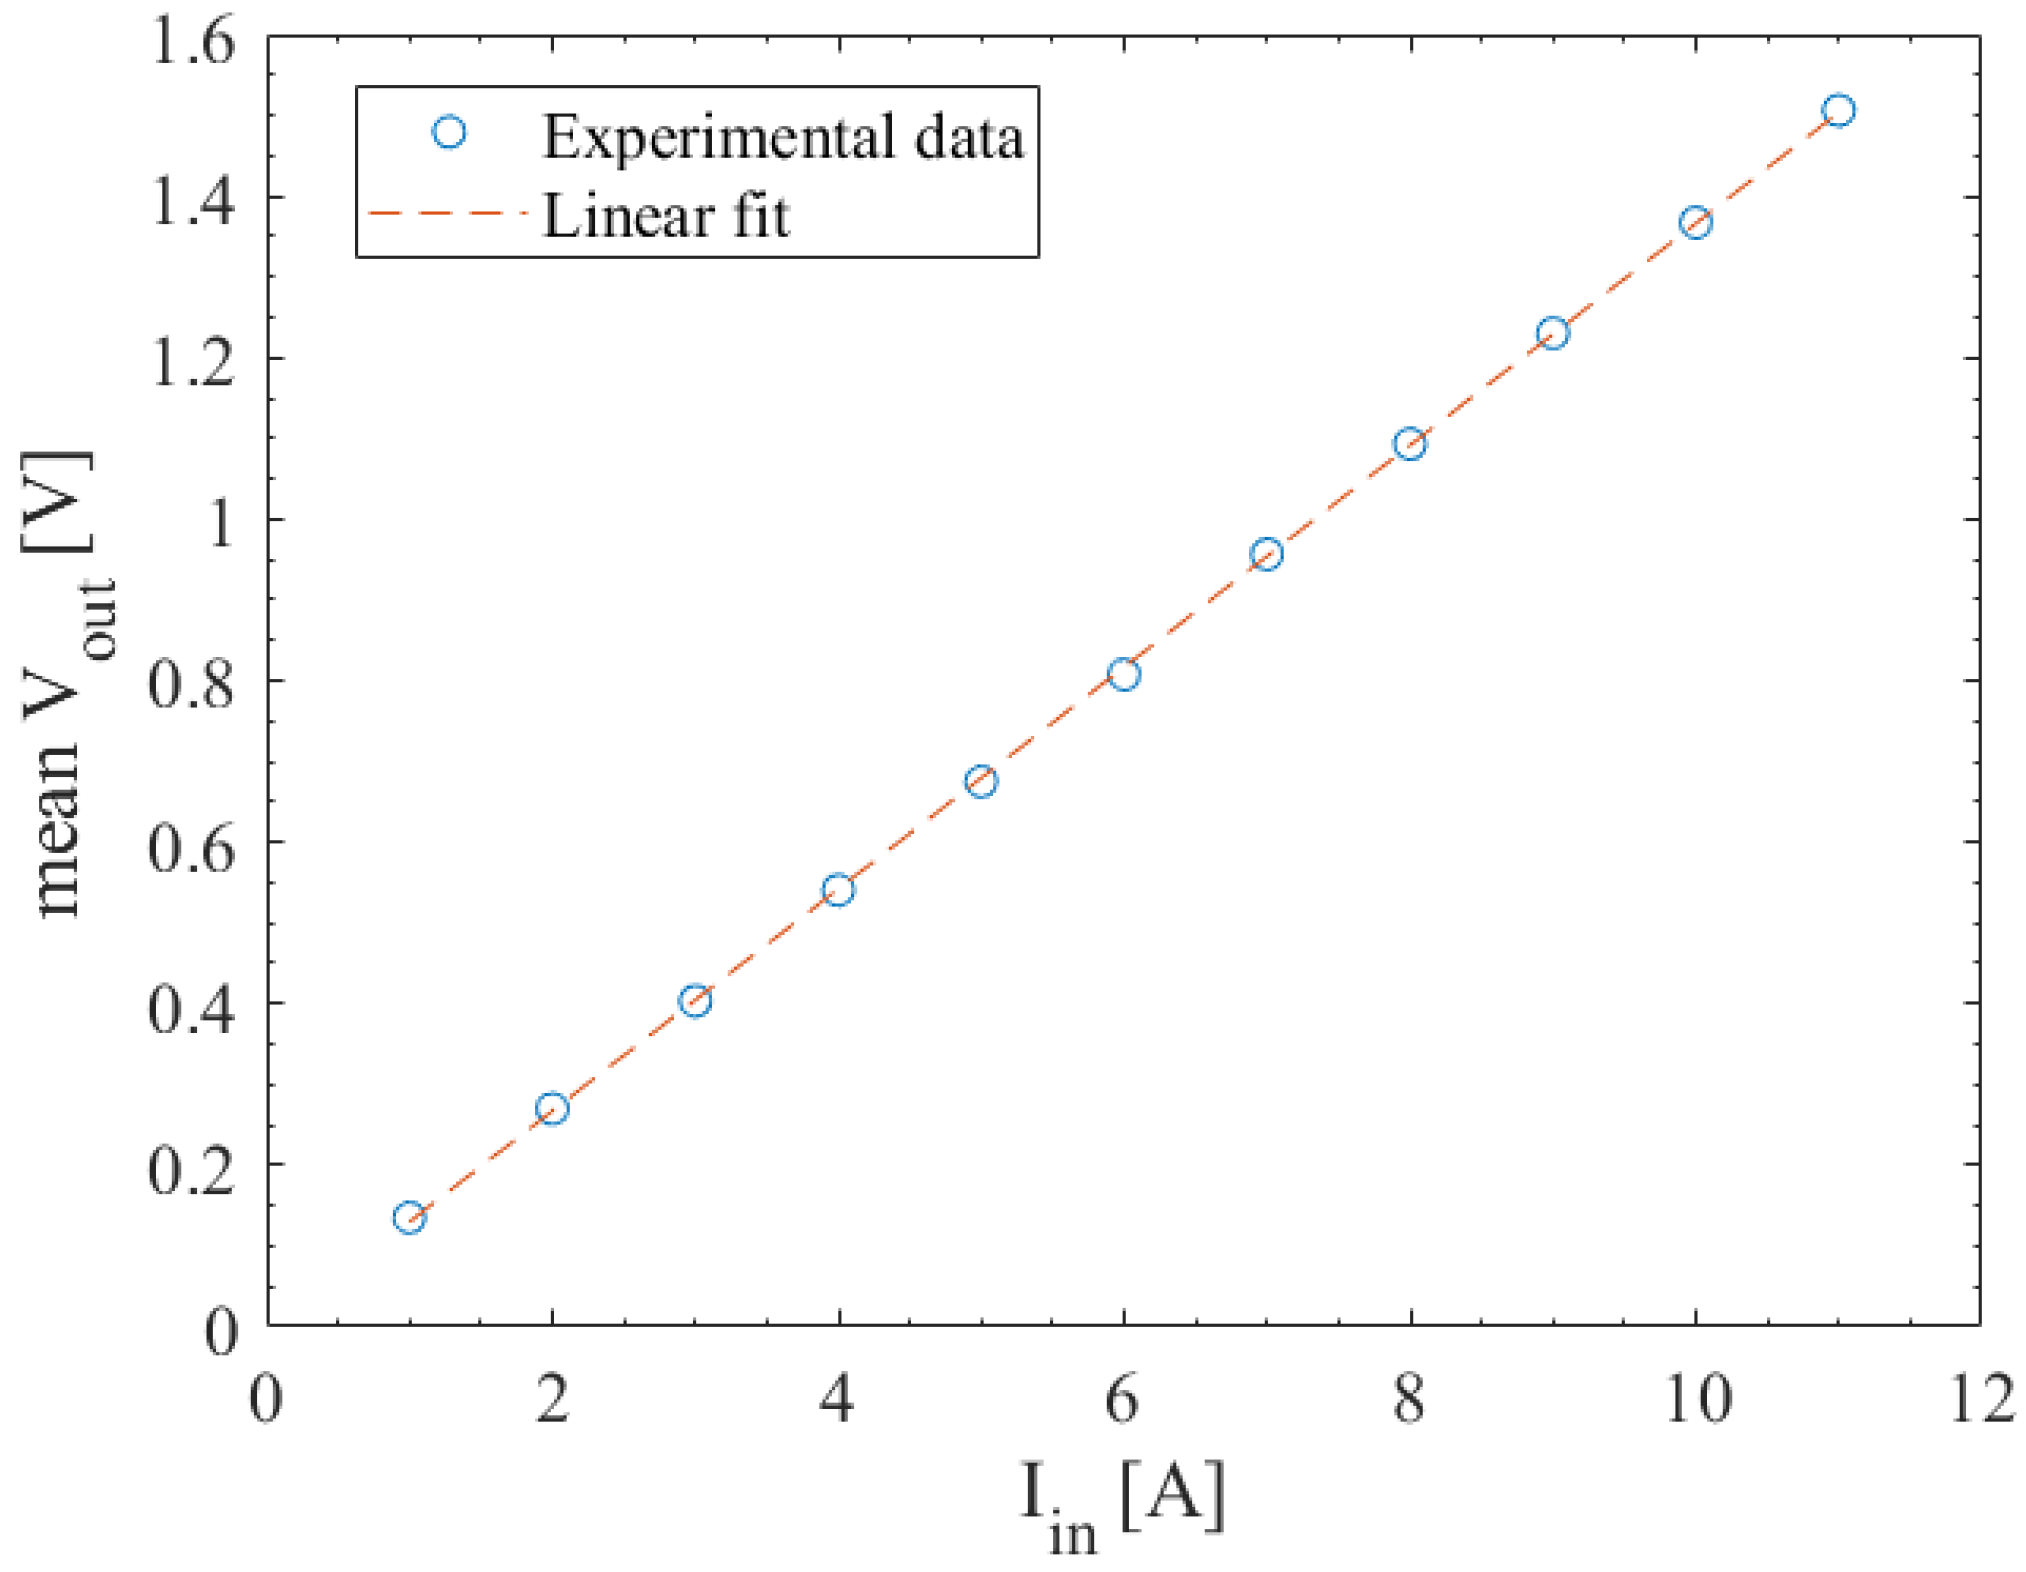
A similar characterization was performed for the current sensor. The reference current to be supplied to the sensor was obtained by coupling the Fluke 5700A calibrator with the Fluke 5725A current amplifier, whose maximum absolute uncertainty was equal to 5.23 mA. The input current was set with a sinusoidal shape, frequency equal to 50 Hz and RMS variable from 1 to 11 A, with a step of 1 A. In addition, in this case, the sensor input and output were acquired through the oscilloscope and, for each test condition, 100 repeated measurements of both RMS of the output voltage and phase displacement between output and input were carried out; the obtained results are shown in Figure 6.
In addition, the current sensor exhibits a quite linear characteristic, whose estimated transduction function is:
The experienced non-linearity and phase displacement are shown in Figure 7a,b.
In Figure 7a, the current sensor is characterized by a notable repeatability (3 lower than 2 mV); the deviation of the mean output RMS, on the contrary, reaches 9 mV (corresponding to about 12 mA according to Equation (2)). Sensor non-linearity usually has to be compensated; however, due to the specific measurement application, it was neglected since its effect on power measurements corresponds to about 2 W on purely resistive load (such as stoves and irons). As regards the phase displacement , its mean value is lower than 2 mrad. In addition, the standard deviation is characterized by very low values, except for the first experimental points, where the amplitude of the input and output signals were not adequate to obtain accurate phase measurements. Finally, performance factors associated with a set of 10 current sensors were estimated; obtained values, shown in Table 2, assured reliable results for the considered application.
2.2. Digitalization and Data Processing
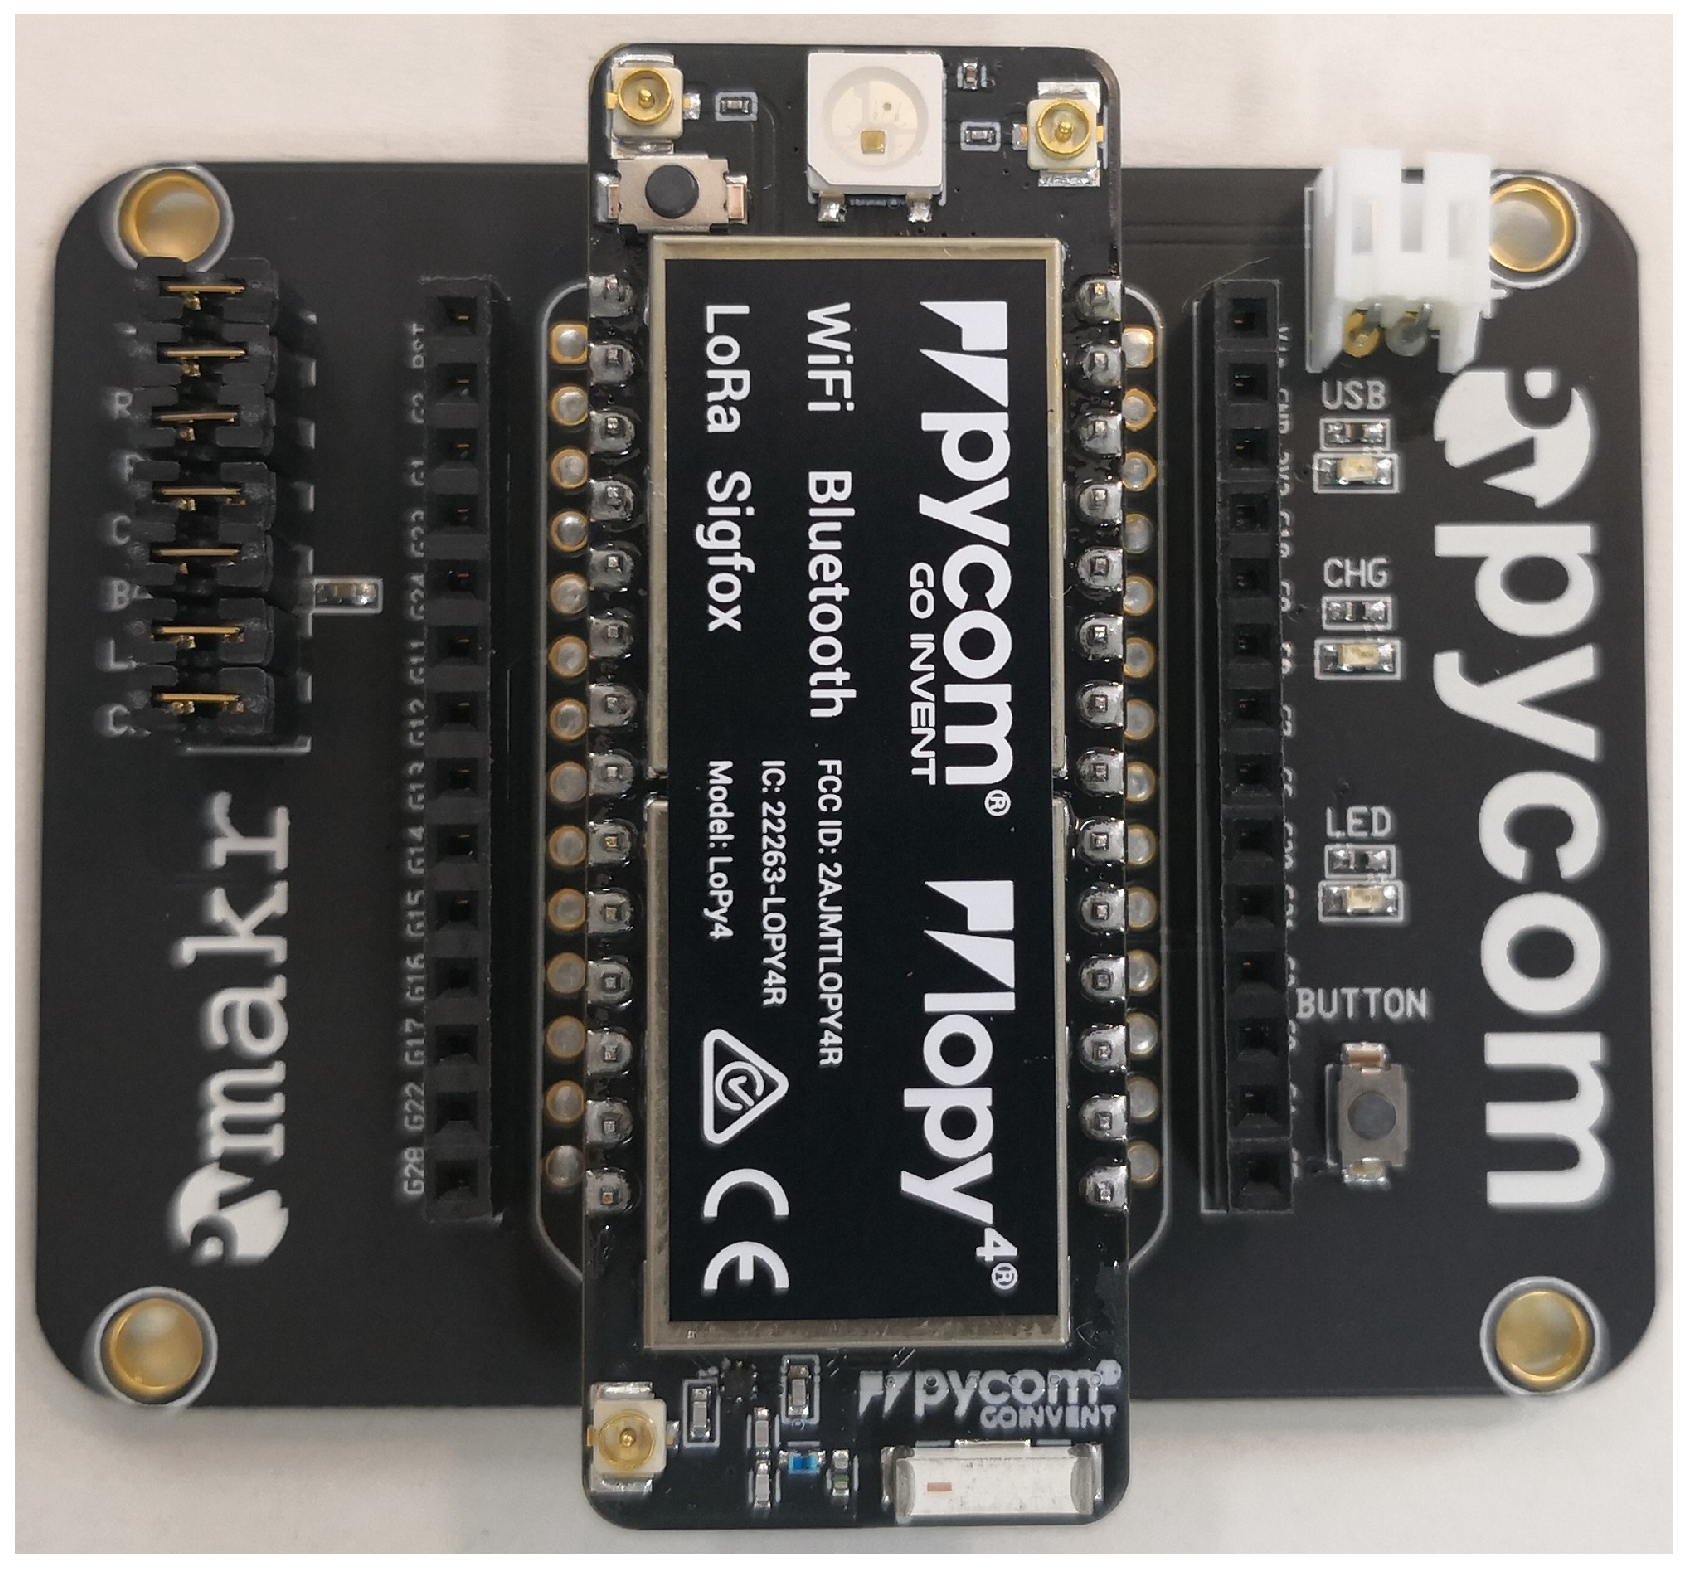
The analog front end is connected to a Lopy4 device from Pycom (Figure 8), an embedded system based on Espressif ESP32, a micropython enabled chip whose main characteristics are:
- CPU Xtensa dual-core 32-bit microprocessor, operating at 240 MHz and performing at up to 600 DMIPS;
- Hardware floating point acceleration; and
- 512 kB RAM memory and 4 MB flash memory.
The ESP32 integrates various peripherals such as General Purpose I/Os, 4 Timers and two 12-bit Successive Approximation Register (SAR) ADCs, each one equipped with nine analog channels. The Lopy was programmed in micropython to acquire and digitize, with a sampling rate of 1 kS/s, N = 100 samples from two analog channel CH1 and CH2 connected to the voltage and current sensor, respectively. Acquisitions were scheduled by a timer that generates interrupt events in which sampling and A/D conversion on both channels are started. In addition, in this case, the phase displacement associated with the sequential acquisition of 2 ADC channels was neglected due to the considered measurement application. The Lopy then stores the samples in two vectors that have to be processed to measure the electrical quantities of interest. In particular, the RMS values of both voltage and current signals are evaluated according to the well known formulas:
where N is the number of acquired samples, and and stand for the voltage and current sample, respectively. The measured active power P is estimated as:
The power factor is finally evaluated as the ratio between the active power and the apparent power S = :
Since these results have to be transmitted, another timer is used to wait 5 s before starting a new acquisition of other 100 voltage and current samples.
2.3. Data Transmission
An interesting feature that led the authors to chooce the Lopy microcontroller is the offered opportunity of realizing data digitization, processing and transmission on a single, low-cost board [27]. The Lopy is a multi-bearer microcontroller that is able to communicate via LoRa, Wi-Fi, and Bluetooth protocols. These features make it particularly suitable for the development of devices to be integrated into IoT platforms [28].
Given the proposed application, which involves the use of sensor nodes in the home environment, the Lopy was programmed to use a Wi-Fi connection, nowadays available in almost every home building; nevertheless, slight modifications in the code implemented on the Lopy would allow operating with the other protocols for long range coverage, thus making the WiFi connection not a mandatory requirement.
Regarding the communication protocol, although the ESP32 is able to exchange HTTP messages through the TCP/IP protocol over a Wi-Fi connection, it was preferred to use a lighter protocol, in accordance with the IoT approach [29]. IoT provides for the dissemination of a large number of devices, typically sensors, which must transmit data. It is therefore necessary to address protocols that require the transmission of short packets and are optimized to obtain the dual advantage of preserving the life of the sensors batteries and limiting the bandwidth consumption [30].
The adopted protocol was Message Queuing Telemetry Transport (MQTT) [31], standardized by ISO/IEC 20922:2016 and based on a publish/subscribe paradigm. Users concerned with the exchange of information are called Clients; Clients transmitting data are referred to as Publishers; and Clients interested in receiving data are called Subscribers. Differently from typical client–server model, transmitter and receiver are not directly connected and even one Client can ignore the existence of the others; the message exchange between them is managed by another component, referred to as the Broker. In particular, the Publisher sends information directly to the Broker. The Broker handles and distinguishes the data received from different Publishers by means of a particular associated topic. A Client wishing to receive data must subscribe to the Broker, specifying one or more topics he is interested in receiving the update on. The Broker, then, after receiving data from a Publisher, transmits the information to the Clients that are subscribed to that topic.
The Lopy has thus been programmed to perform the following operation:
- Searching for WiFi connections. If the Lopy joins an available Wi-Fi network, it receives an IP address. Usually, Wi-Fi routers function as a DHCP server and automatically assign dynamic IP addresses to any device that plugs into network.
- If a WiFi connection is successfully established, the Lopy has to start the MQTT Client which initiates connection with the Broker. Several free Brokers are available on the Internet; due to privacy and security policy, a proprietary Broker by Nexus TLC with identity access control was preferred to gather data and integrate them in the AR environment. The connection is configured as “robust”, so that the Lopy detects when the MQTT connection drops and tries the reconnection.
- If the MQTT connection is accepted, active power, current RMS values and power factor measured by the measurement algorithms are sent to the Broker for publication under a specific topic composed by the unique MAC address of the LoPy (for privacy and security issues) and PM (Power Meter) followed by an integer number (e.g., macaddress/PM3).
The steps described above are periodically repeated and published according to a delay time of 5 s. The Broker receives the data and updates all the Clients subscribed to the topic, so that all authenticated users can receive updated measurements using PC, Smartphone, Tablet.
The entire realized sensor node is shown in Figure 9, where the circuit that receive 230 V AC in input and provides the 5 V DC necessary to supply the Lopy and the sensors is also highlighted.
3. Augmented Awareness through Augmented Reality Approach
As stated above, consumption awareness improves if home consumers can easily visualize the actual and current load power. To this aim, power measures obtained by the sensor nodes have to be rendered in the environment as close as possible to the images of corresponding load. AR turned out to be the most promising solution, even though the traditional approaches based on markers for item recognitions typically dissuade users due to both preliminary stage of markers distribution and ecstatic deterioration of their home environment. The authors hence decided to move towards a fully markerless technology, based on object visual recognition, integrated in a mobile app. To implement a proof-of-concept of the proposed approach, a suitable AR app, namely Consumption AR, was realized in Android Studio [32] by Nexus TLC. The app exploited the framework MAXST AR SDK v3.5.2 [33], an all-in-one engine providing required features for the implementation of AR applications on mobile terminal. As already stated above, the proposed approach consists in rendering useful power measurements data when a domestic load is inside the camera’s view of a smartphone or tablet; this way, the consumers, through the display of their device, see a 3D virtual object containing the last power consumption measure and other useful information, overlapped to the load of interest in the actual environment. To this aim, a training session is preliminarily carried out to make AR app capable of recognizing the domestic loads and requesting the right updated data to the server.
MAXST AR SDK allows the detection of load of interest without markers or labels, but its tracking system uses natural features of the environment recognition. In particular, it exploits a Visual Simultaneous Localization and Mapping (VSLAM) technique [34], which collects feature points of 3D space (in this case, the space containing the domestic load that has to be monitored), only with a camera, then creates a virtual map of the environment and saves it as a file (Figure 10).
Feature points could be corners, lines, planes or blobs that are a region of a digital image in which some properties are almost constant; the environment has to provide sufficient feature points in a wide range of distance between the user and appliance to be monitored [35]. Features points should have the following characteristics:
- quickly recognizable;
- do not to vary significantly under different lighting conditions or with blurred image; and
- are robust for different viewing.
The AR app indicates to the user the number of key frames identified and added to the map. When desired, the mapping process can be stopped and the file saved. Mapping process has to be repeated for each domestic load that has to be monitored.
In principle, libraries based on machine learning and artificial neural networks (ANNs) for image recognition could be adopted; unfortunately, their use and implementation do not fit with the considered purposes. Training ANNs for several objects requires more time than the adopted approach based on VSLAM, thus increasing: (i) the risk of weighing down the app; and (ii) the possibility of making recognition errors due to incomplete/incorrect training. Moreover, unless very long training sessions are carried out, similar objects in different house positions should be mixed up. On the contrary, the adopted solution is very light and based on the collection of feature points of both objects of interest and environment, thus making not necessary the exact recognition of each object of interest. This way, similar objects located at different positions of the house are correctly considered as separate appliances.
On startup of the AR view module, smartphone camera is invoked from the Android Operating System and the live images acquired by the camera are continuously displayed; this way, user can observes the actual environment through the display. Features extraction module continuously extracts in background feature points from the image in the camera’s view to build the so-called virtual map, which is compared with those already saved on the smartphone by a proper features matching module. If the virtual map matches one of the stored map, an HTTPS request containing the identifier of the PM associated to the identified map is sent to the Server. Once the HTTPS request is received, the Server will: (i) extract the identifier number from the request; (ii) use the identifier number to access the proper data into the database; and (iii) return to the AR app an HTTPS response which contains the last available measures of PM corresponding to received identifier number (Figure 11). Finally, when AR app has received the HTTPS response from Server, it updates content of a text frame graphic model with received measures, rendering a 3D virtual object containing last values of active power, current and PF measured from the sensor node, overlapped to the domestic load in the actual home environment.
4. Platform Performance Assessment
The realized platform was assessed on an actual domestic environment as case study. Four sensor nodes, each of which characterized by its own MAC address, were installed to supply and monitor different loads: (i) a coffee machine; (ii) a toaster; (iii) an iron; and (iv) a satellite TV box-set. The sensor nodes were programmed so that they associate the measured electrical quantities to the topics from PM1 to PM4, respectively. With regard to their performance, comparisons of the values measured by the sensor nodes with those granted by a Voltech PM100 power meter assured the reliability of the realized PMs; differences were never greater than 20 W between the powers measured by sensor nodes and PM100.
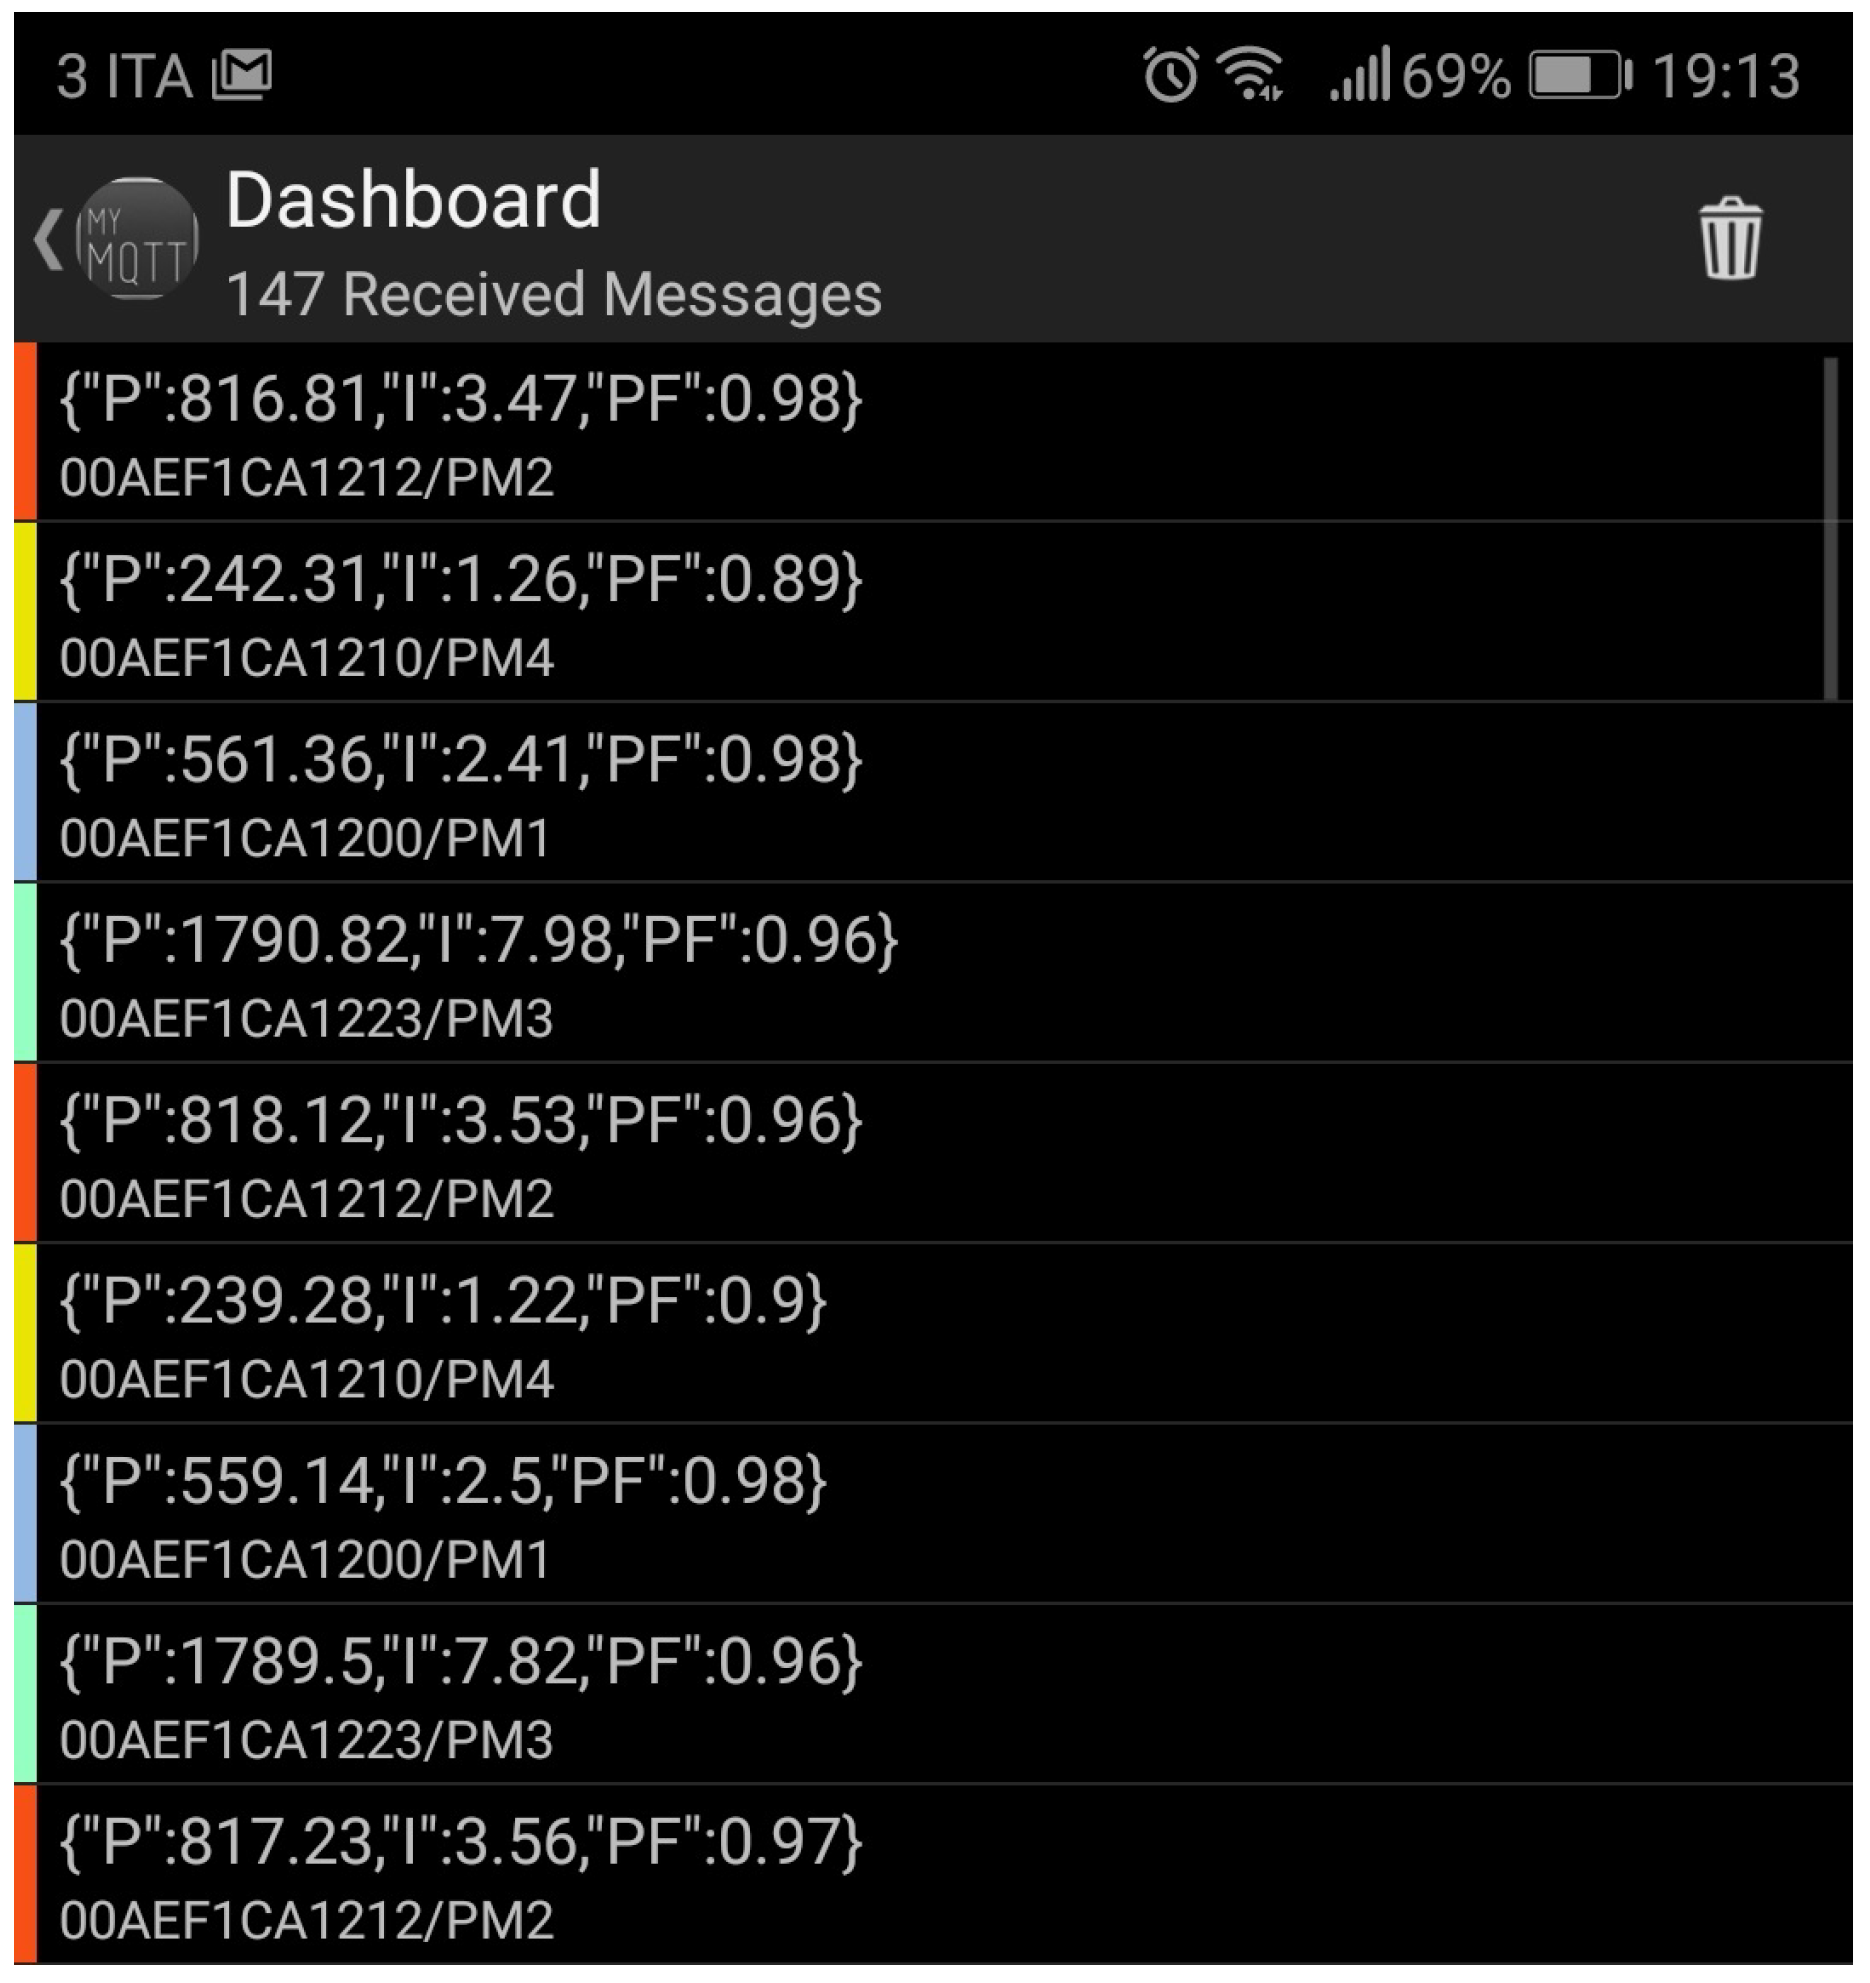
To test the sensor nodes connections, one MQTT Client among those already available on web or app stores has to be installed on PC, tablet or smartphone; in the considered case study, the free app MyMQTT was installed on a smartphone. Once information about Broker address, used port and security login parameters (username and password) is given to the MQTT Client app, it is possible to receive on the smartphone all the information related to the topics handled by the Broker to which the subscription has been made. As an example, Figure 12 shows the app dashboard after the user has subscribed to the topics of its interest. From an open access/source point of view, the payload format of the MQTT message is also reported to allow the use of the AR app also with smart meters different from those proposed by the authors. It should be noted that the measurement results now can be viewed from anywhere, provided an Internet connection is available. Moreover, the robustness of the connections, both WiFi and MQTT, was tested by randomly dropping them and verifying their automatic reconnection.
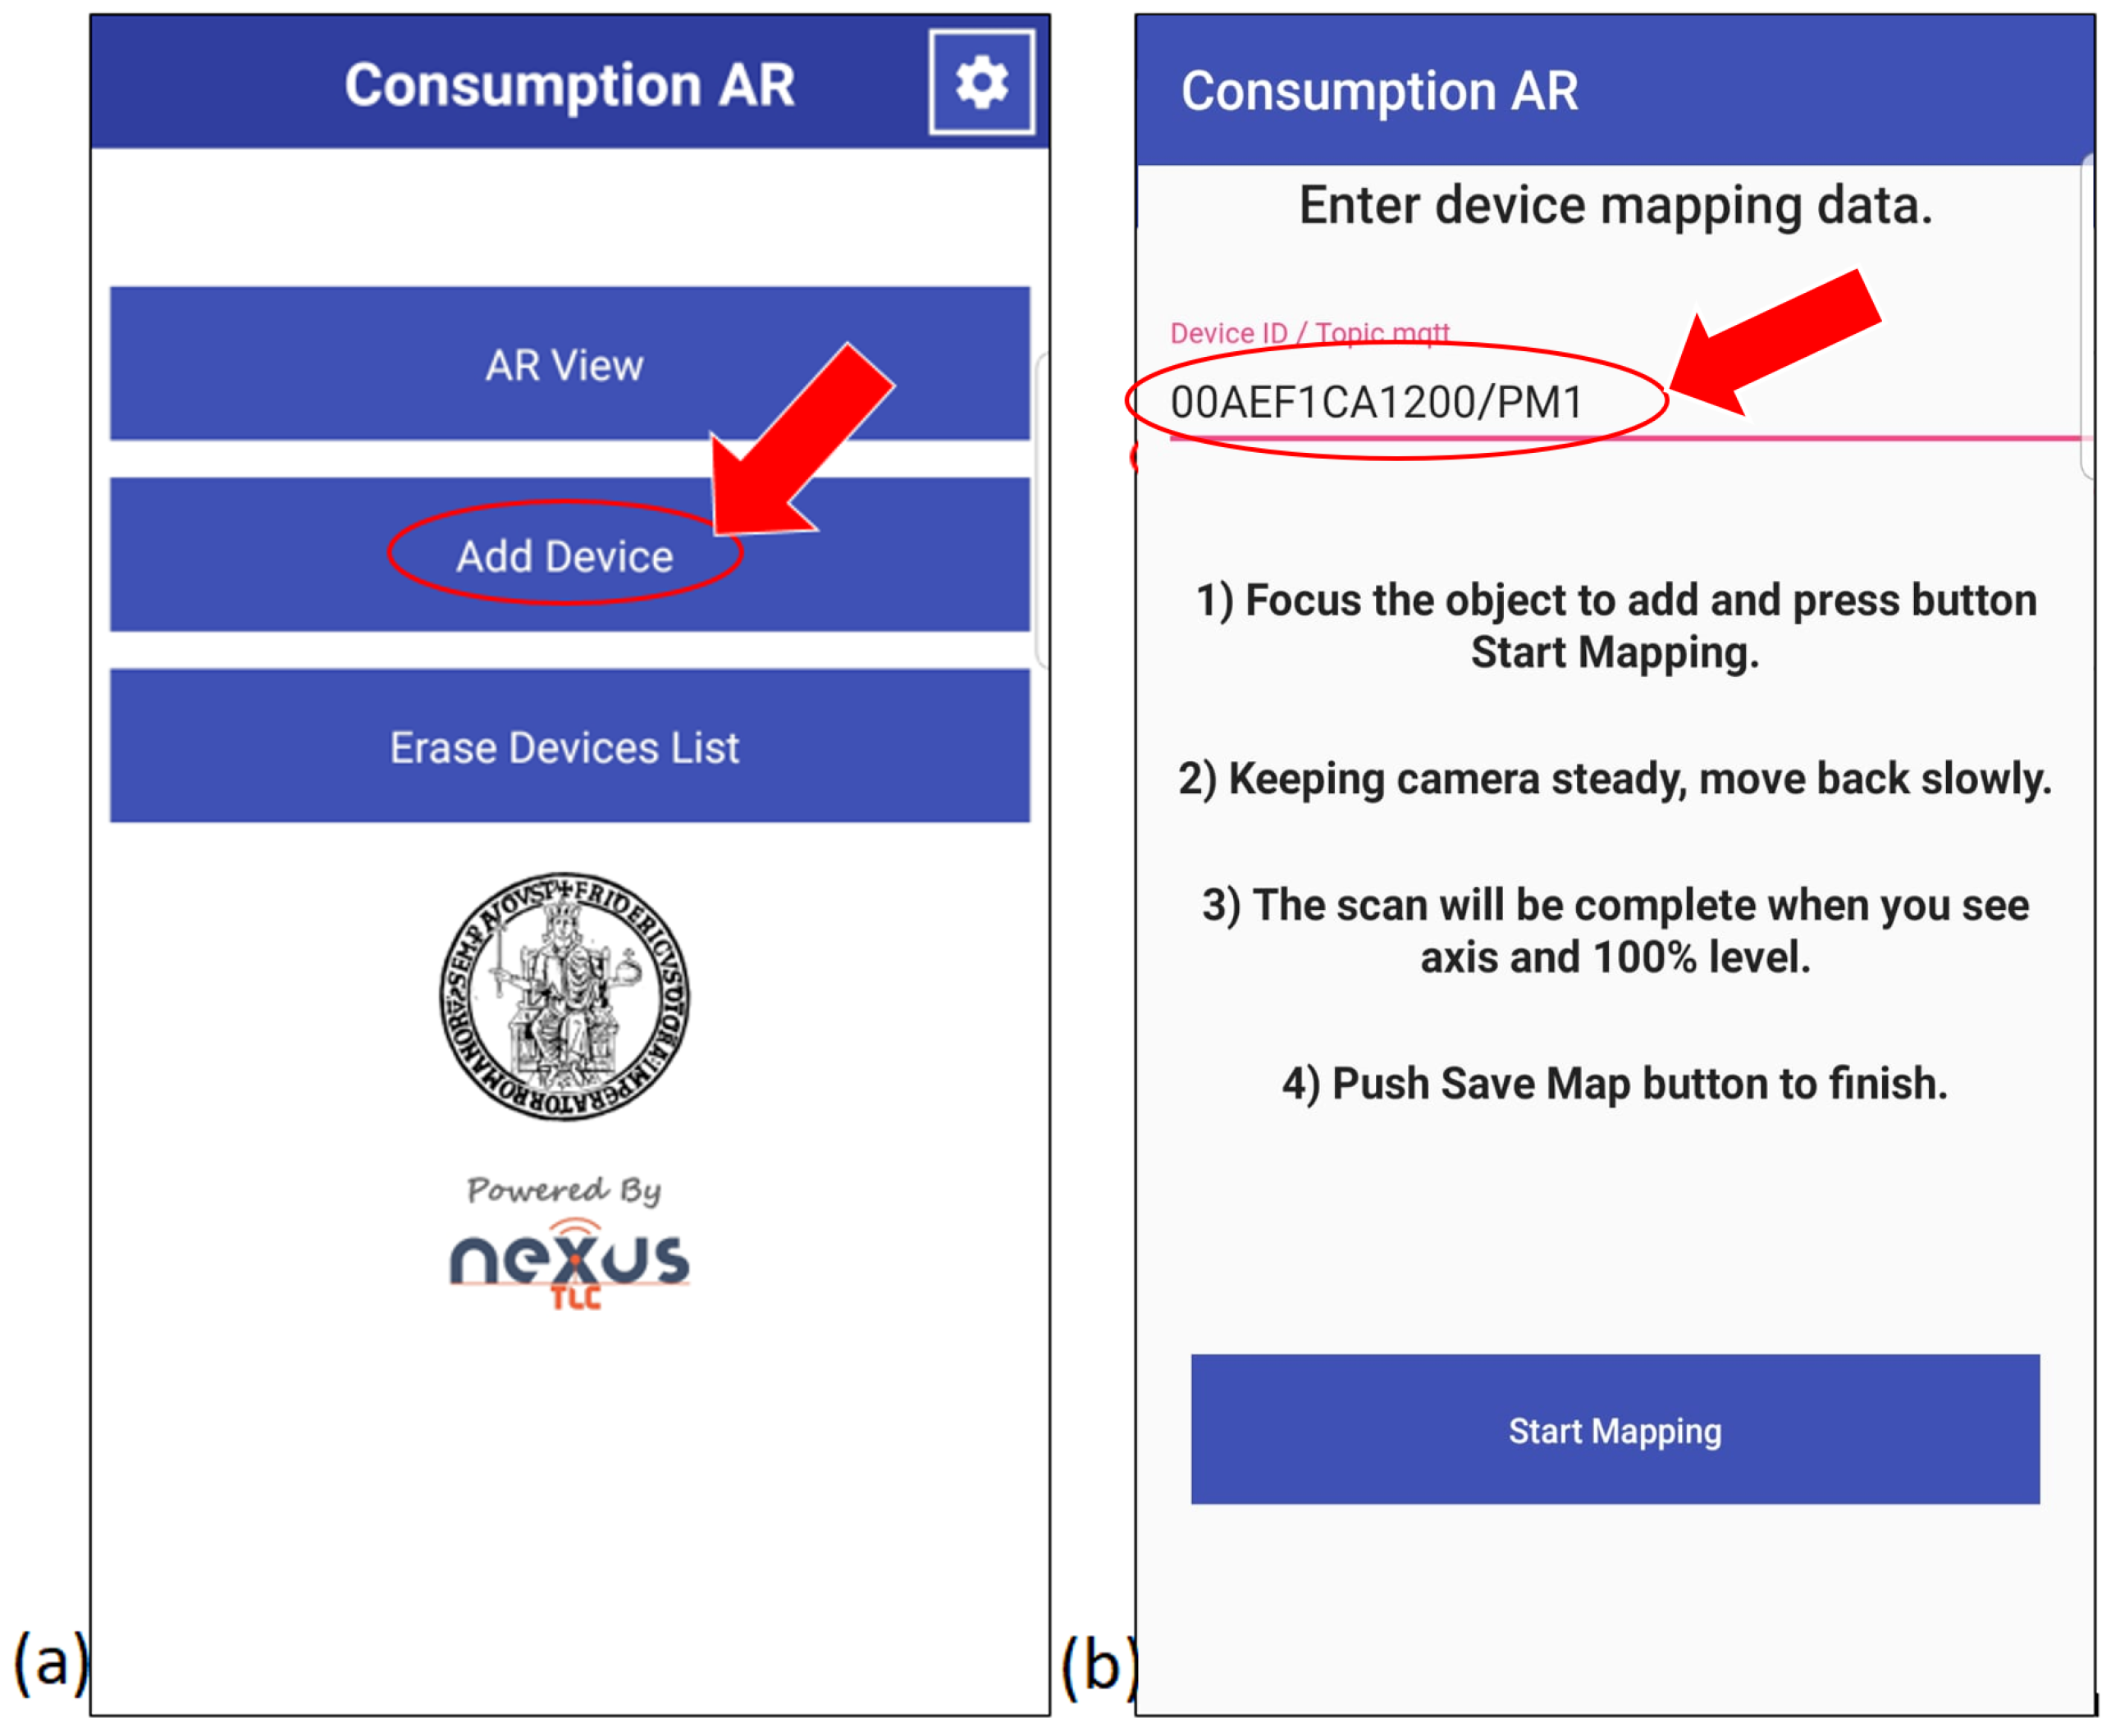
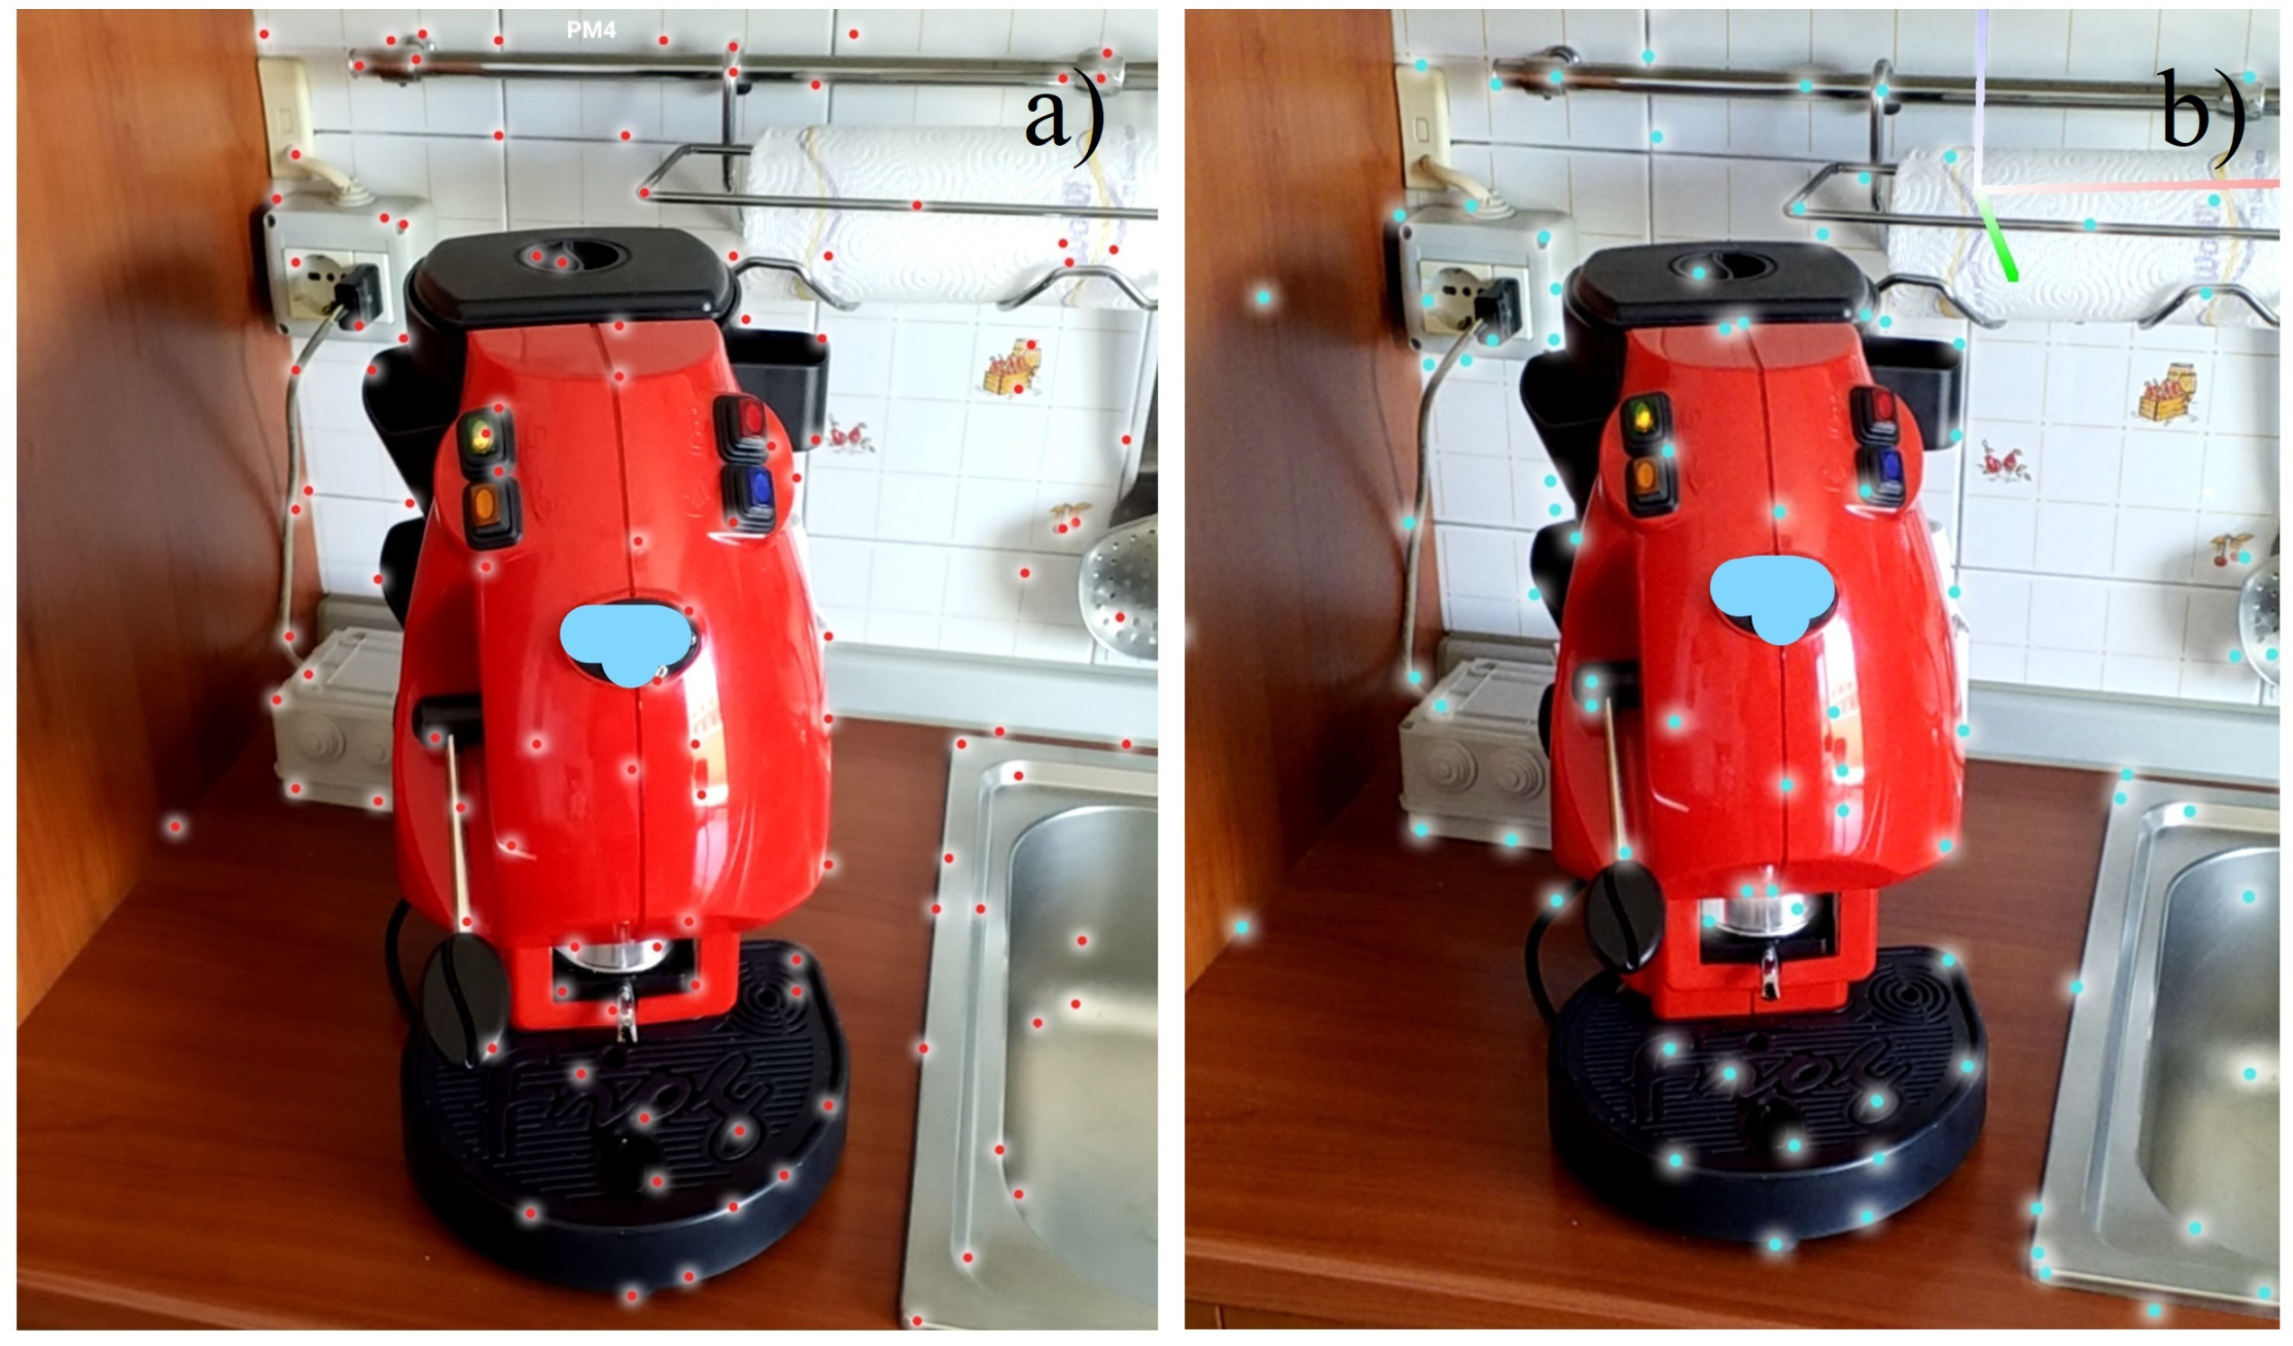
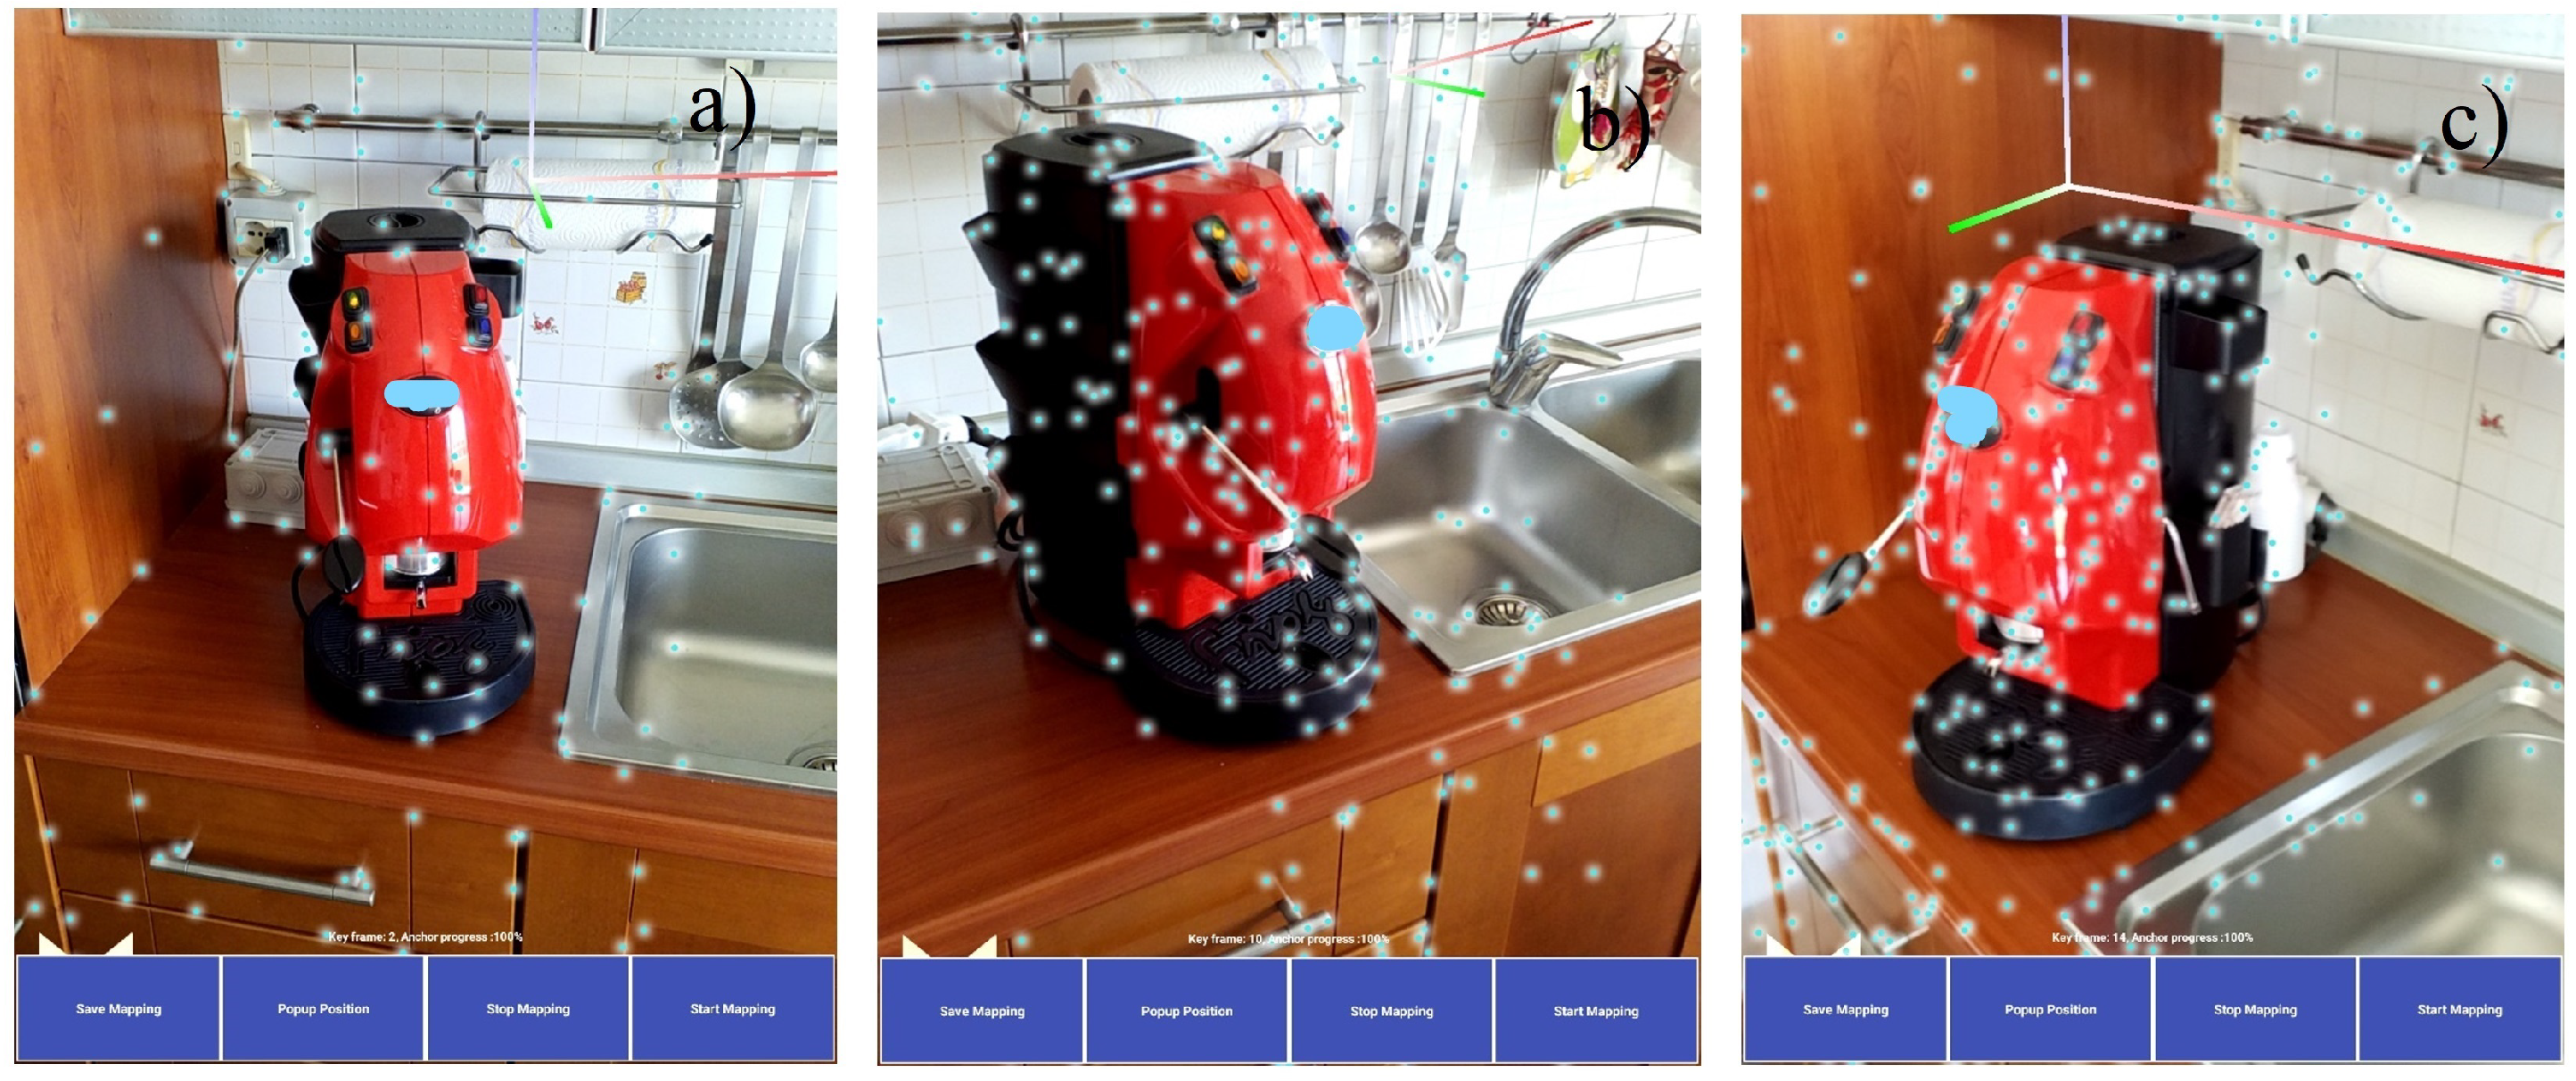
The successive step was the assessment of the AR app in both training and rendering operations. With regard to the first item, to start registration of a new device, the user has to push “Add Device” in the AR app main menu (Figure 13a). Before starting a new training operation, it is required that the user indicates the specific Device ID (the MAC address considered above) and MQTT topic used by the PM, associated with the domestic load, to publish measures on the Broker (Figure 13b). Once the Device ID and the topic are entered, the session for domestic load recognition can be started by pressing the “Start Mapping” button. AR app shows in real time the images captured from the camera and the features points identified by the detection algorithms, represented on the display by means of red dots (Figure 14a). When a sufficient number of feature points are detected, a key frame is identified [36]. In the AR App, this condition is highlighted by: (i) a color change of dots representing the features points from red to azure; and (ii) the anchor progress indicator that achieves 100% (Figure 14b). After the key frame 1 is detected, it is possible to detect new feature points by moving the smartphone slowly in different directions, but keeping the object in the camera’s view. This way, new key frames are added to enrich the map allowing to recognize the object of interest from different observation angles (Figure 15). Using a medium-performance smartphone with a 13 MPixel camera, the identification process takes 20–30 s.
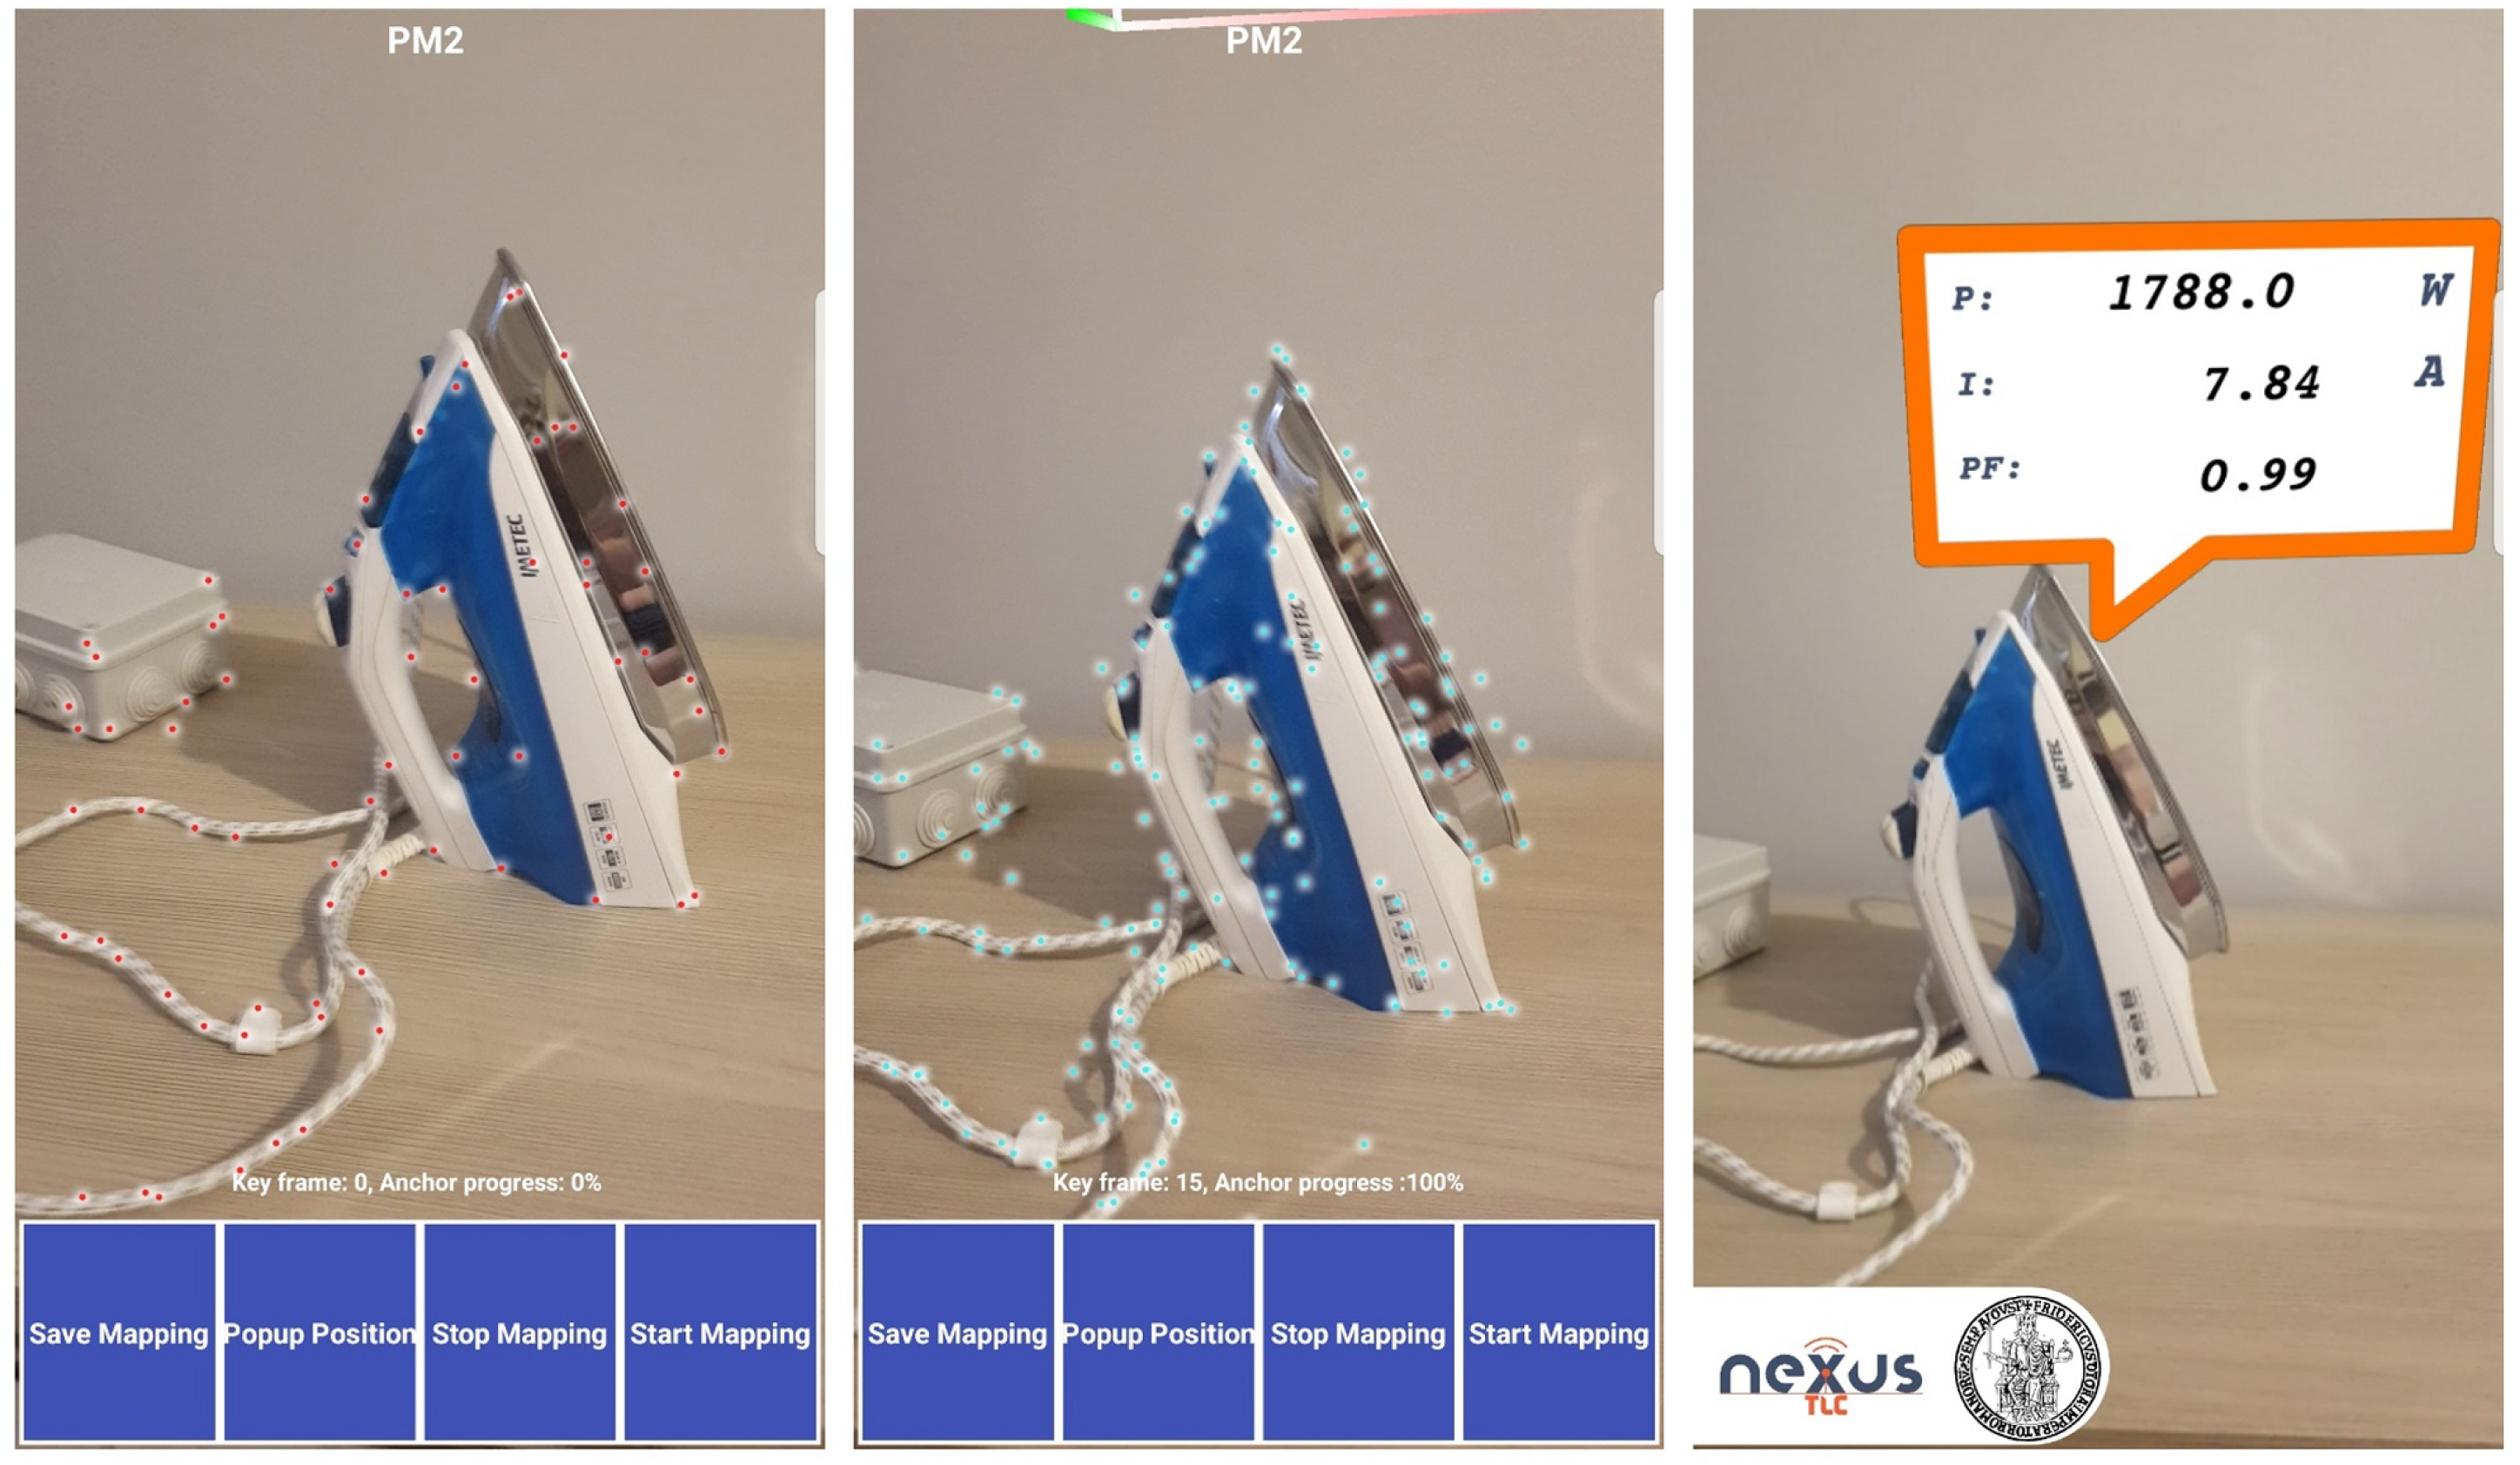
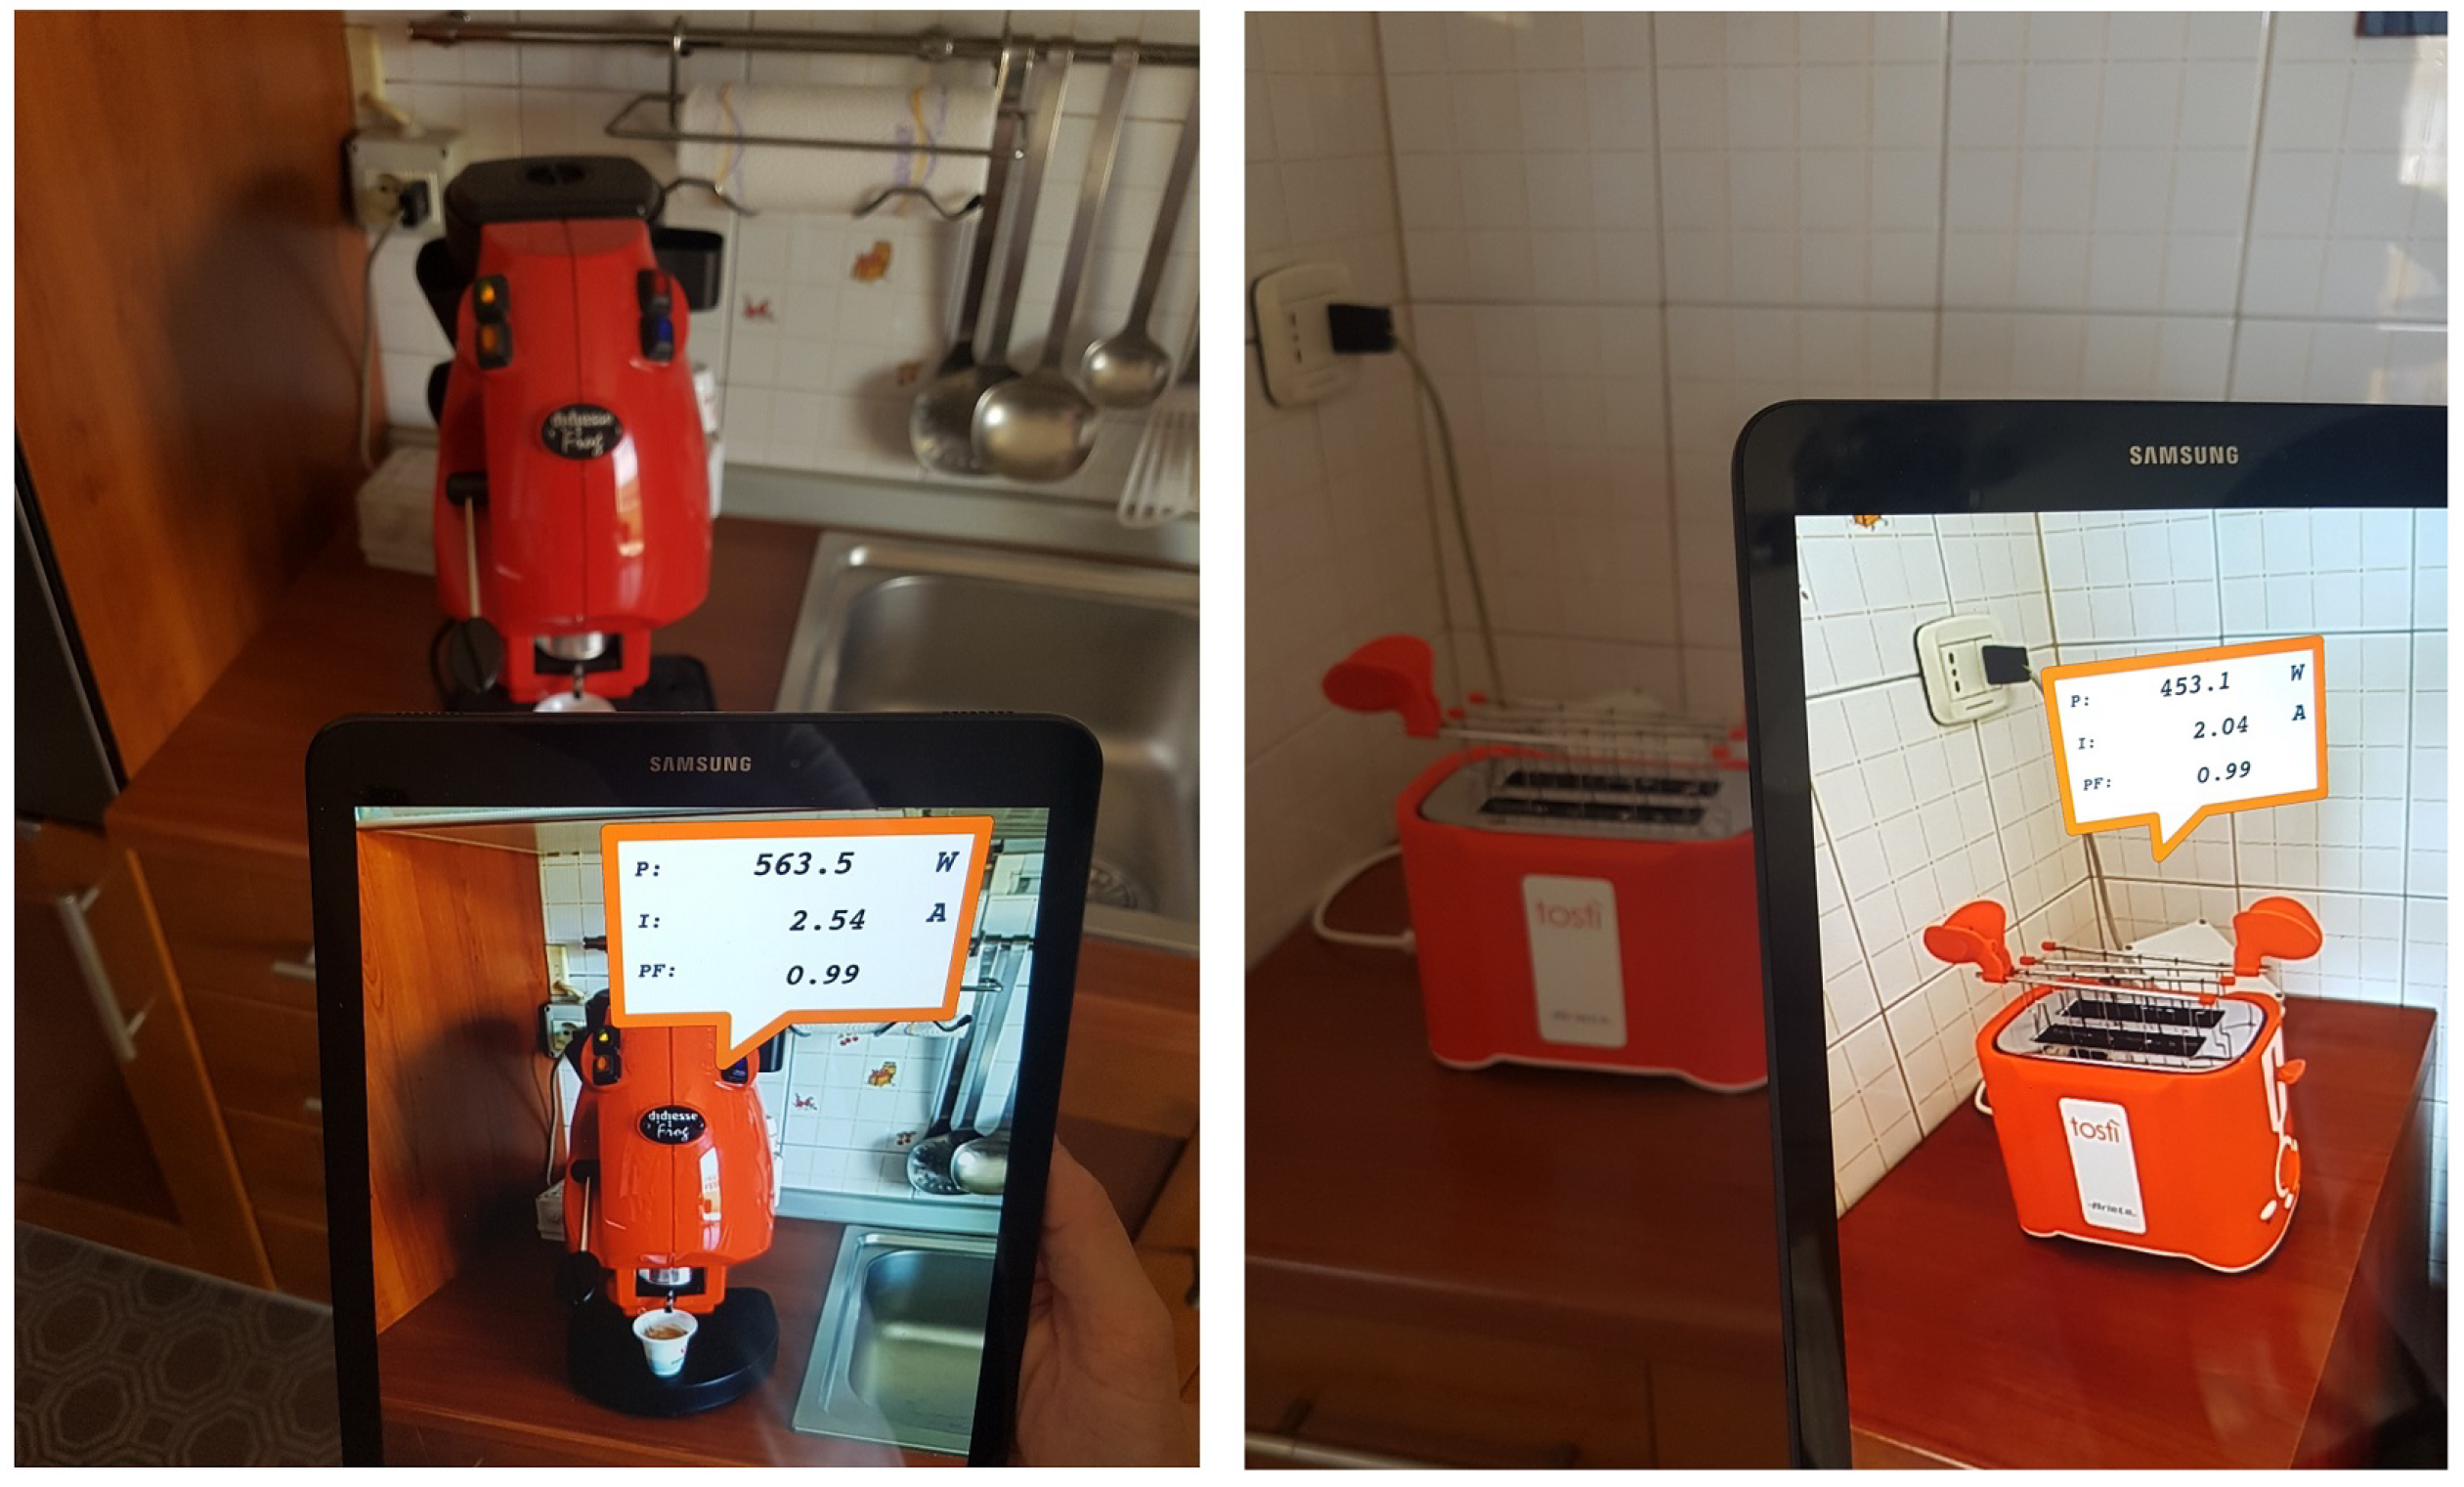
Once the feature extraction process is completed, it possible to run the AR view module, by pressing the “AR View” button in the main menu, and generating the AR environment. As an example, after defining a suitable number of key frames associated with the desired load, whenever the coffee machine is recognized in the image framed by the camera, a pop up window will appear, as shown in Figure 16, reporting the measures regarding the associated topic. In a similar way, all the considered loads can be taken into account; as an example, in Figure 17, recognition and rendering operations are shown for the load associated with the topic 00AEF1CA1212/PM2. Finally, the AR App was also tested on an Android-based tablet, thus assuring the application portability (Figure 18).
5. Conclusions
The study dealt with an AR based approach for improving consumers awareness about their home power consumption. In particular, the authors have presented a proof-of-concept of user-friendly system for the monitoring of the power consumption, based on an AR interface that exploits technological devices spread in every home as smartphone and tablet. The system is based on sensor nodes designated to measure power factor, current and active power absorbed by household appliances.
The node has been realized by means of low-cost COTS components, according to the recent paradigms of IoT and DIY. Nevertheless, preliminary metrological characterization conducted in laboratory experiments highlighted specifications in term of non-linearity and repeatability suitable for the considered application. The sensor node has been implemented in such a way as to transmit measured values every 5 s through MQTT protocol to a proprietary Broker realized by Nexus TLC; this way, all authenticated users who know the MQTT topic can easily access the power data.
To make the access to power information simple and easily associate it with the corresponding load, a proper AR environment has been adopted to render the measured power values on a smartphone or tablet when the load to be monitored is in the camera view. To this aim, a preliminary training stage is mandatory to associate the load of interest with the MQTT topic containing the related measures; a proper app has preliminarily been implemented for this purpose for Android platforms, due to the higher programming freedom with respect to iOS-based systems. The app was tested on different devices, to assess the reliability of the proposed approach.
Ongoing activities are mainly focused on the optimization of the AR App: (i) the label will be characterized by a color (green, yellow or red) to indicate the exceeding of a limit chosen by the consumer; (ii) the AR environment will be completed with a virtual button that allows to instantly disconnect or connect the load to the power supply; and (iii) data will be stored in a historical database that consumers can consult from the App to view their daily, monthly, or annual trend of consumption. Moreover, after the proof-of-concept about the proposed methodology presented here and implemented on Android platforms, authors and Nexus TLC are currently developing iOS version of the App and will support the application later to follow the evolution process of the mobile operating systems.
Author Contributions
Conceptualization, A.L.; Data curation, F.B. and R.S.L.M.; Investigation, F.S.; Methodology, A.L., F.B. and R.S.L.M.; Resources, F.S.; Software, F.S.; Supervision, L.A. and A.L.; Validation, A.L., F.B. and R.S.L.M.; Writing—original draft, F.B.; and Writing—review and editing, L.A., A.L. and R.S.L.M.
Funding
This research received no external funding.
Acknowledgments
Authors wish to thanks Vincenzo Canfora, expert Android developer at Nexus TLC, for his precious technical support provided in the development of the Augmented Reality Android App proposed in this paper.
Conflicts of Interest
The authors declare no conflict of interest.
References
- Ipsos MORI. Smart Meter Customer Experience Study: Post-Installation Survey Report; Department for Business, Energy & Industrial Strategy: London, UK, August 2017. Available online: https://assets.publishing.service.gov.uk/government/uploads/system/uploads/attachment_data/file/650970/Post-install_key_findings_report_FINAL_05102017_PUBLICATION.pdf (accessed on 11 August 2018).
- Hargreaves, T.; Nye, M.; Burgess, J. Making energy visible: A qualitative field study of how householders interact with feedback from smart energy monitors. Energy Policy 2010, 38, 6111–6119. [Google Scholar] [CrossRef]
- Singh, S.; Yassine, A. Big Data Mining of Energy Time Series for Behavioral Analytics and Energy Consumption Forecasting. Energies 2018, 11, 452. [Google Scholar] [CrossRef]
- Weron, R. Electricity price forecasting: A review of the state-of-the-art with a look into the future. Int. J. Forecast. 2014, 30, 1030–1081. [Google Scholar] [CrossRef]
- Gajowniczek, K.; Ząbkowski, T. Electricity forecasting on the individual household level enhanced based on activity patterns. PLoS ONE 2017, 12, e0174098. [Google Scholar] [CrossRef] [PubMed]
- Smart Energy GB. Available online: https://www.smartenergygb.org/en (accessed on 11 August 2018).
- Populus. Available online: https://www.populus.co.uk/ (accessed on 11 August 2018).
- Smart Meters and Energy Usage: A Survey of Energy Behaviour before and after Upgrading to a Smart Meter Published by Smart Energy GB. Available online: https://www.smartenergygb.org/en/resources/press-centre/press-releases-folder/smart-meters-and-energy-usage (accessed on 11 August 2018).
- De Almeida, A.; Fonseca, P.; Schlomann, B.; Feilberg, N. Characterization of the household electricity consumption in the EU, potential energy savings and specific policy recommendations. Energy Build. 2011, 43, 1884–1894. [Google Scholar] [CrossRef] [Green Version]
- Wang, Q.; Lewandowski, S. Examining Whether Smart Meters Have Been Used Smartly: A Case Study of Residential Electricity Customers in Vermont. Int. J. Sustain. Green Energy 2017, 6, 76. [Google Scholar] [CrossRef]
- Smith, R. “Smart Meter, Dumb Idea?” The Wall Street Journal, Last Modified 27 April 2009. Available online: http://www.wsj.com/articles/SB124050416142448555 (accessed on 11 August 2018).
- Karlgren, J.; Fahlén, L.E.; Wallberg, A.; Hansson, P.; Ståhl, O.; Söderberg, J.; Åkesson, K.P. Socially Intelligent Interfaces for Increased Energy Awareness in the Home. In Proceedings of the Internet of Things: First International Conference, IOT 2008, Zurich, Switzerland, 26–28 March 2008; Floerkemeier, C., Langheinrich, M., Fleisch, E., Mattern, F., Sarma, S.E., Eds.; Springer: Berlin/Heidelberg, Germany, 2008; pp. 263–275. [Google Scholar]
- Zipperer, A.; Aloise-Young, P.A.; Suryanarayanan, S.; Roche, R.; Earle, L.; Christensen, D.; Bauleo, P.; Zimmerle, D. Electric Energy Management in the Smart Home: Perspectives on Enabling Technologies and Consumer Behavior. Proc. IEEE 2013, 101, 2397–2408. [Google Scholar] [CrossRef]
- Pompermayer, D.C.; Có, M.A.; Donadel, C.B. Design and implementation of a low-cost intelligent device to standby mode consumption reduction in already existing electrical equipment. IEEE Trans. Consum. Electron. 2017, 63, 145–152. [Google Scholar] [CrossRef]
- Chatzopoulos, D.; Bermejo, C.; Huang, Z.; Hui, P. Mobile Augmented Reality Survey: From Where We Are to Where We Go. IEEE Access 2017, 5, 6917–6950. [Google Scholar] [CrossRef]
- Billinghurst, M.; Clark, A.; Lee, G. A survey of augmented reality. Found. Trends Hum. Comput. Interact. 2015, 8, 73–272. [Google Scholar] [CrossRef]
- Wang, S.; Parsons, M.; Stone-McLean, J.; Rogers, P.; Boyd, S.; Hoover, K.; Meruvia-Pastor, O.; Gong, M.; Smith, A. Augmented Reality as a Telemedicine Platform for Remote Procedural Training. Sensors 2017, 17, 2294. [Google Scholar] [CrossRef] [PubMed]
- Werner, P.A. Augmented Reality and Perception of Analogue and Digital Images and Maps. Proceedings 2017, 1, 56. [Google Scholar] [CrossRef]
- Webel, S.; Bockholt, U.; Engelke, T.; Peveri, M.; Olbrich, M.; Preusche, C. Augmented reality training for assembly and maintenance skills. Robot. Auton. Syst. 2013, 61, 398–403. [Google Scholar] [CrossRef]
- Odeh, S.; Shanab, S.A.; Anabtawi, M. Augmented reality internet labs versus its traditional and virtual equivalence. Int. J. Emerg. Technol. Learn. 2015, 10, 4–9. [Google Scholar] [CrossRef]
- Gubbi, J.; Buyya, R.; Marusic, S.; Palaniswami, M. Internet of Things (IoT): A vision, architectural elements, and future directions. Future Gener. Comput. Syst. 2013, 29, 1645–1660. [Google Scholar] [CrossRef] [Green Version]
- Angrisani, L.; Arpaia, P.; Bonavolontà, F.; Liccardo, A.; Moriello, R.S.L. First step towards a cost-effective lot platform for customers power consumption awareness. In Proceedings of the 2017 IEEE International Workshop on Measurement and Networking (M & N), Naples, Italy, 27–29 September 2017; pp. 1–5. [Google Scholar]
- Allegro MicroSystem, Current Sensor ACS712. Available online: https://www.allegromicro.com/es-ES/Products/Current-Sensor-ICs/Zero-To-Fifty-Amp-Integrated-Conductor-Sensor-ICs/ACS712.aspx (accessed on 11 August 2018).
- Bonavolontà, F.; D’Apuzzo, M.; Liccardo, A.; Vadursi, M. New approach based on compressive sampling for sample rate enhancement in DASs for low-cost sensing nodes. Sensors 2014, 14, 18915–18940. [Google Scholar] [CrossRef] [PubMed] [Green Version]
- Standard, I. CEI EN50160. Caratteristiche Della Tensione Fornita Dalle Reti Pubbliche di Distribuzione Dell’Energia Elettrica. Available online: https://my.ceinorme.it/index.html#detailsId=0000011266 (accessed on 11 August 2018).
- Angrisani, L.; Bonavolontà, F.; Tocchi, A.; Moriello, R.S.L. Frequency domain measurement node based on compressive sampling for sensors networks. In Proceedings of the 2015 IEEE International Workshop on Measurements Networking (M & N), Coimbra, Portugal, 12–13 October 2015; pp. 1–5. [Google Scholar]
- LoPy by Pycom. Available online: https://pycom.io/hardware/lopy-specs/ (accessed on 11 August 2018).
- Tocchi, A.; Roca, V.; Angrisani, L.; Bonavolontà, F.; Moriello, R.S.L. First step towards an IoT implementation of a wireless sensors network for environmental radiation monitoring. In Proceedings of the 2017 IEEE International Instrumentation and Measurement Technology Conference (I2MTC), Turin, Italy, 22–25 May 2017; pp. 1–6. [Google Scholar]
- Yokotani, T.; Sasaki, Y. Comparison with HTTP and MQTT on required network resources for IoT. In Proceedings of the 2016 International Conference on Control, Electronics, Renewable Energy and Communications (ICCEREC), Bandung, Indonesia, 13–15 September 2016; pp. 1–6. [Google Scholar]
- Bonavolontà, F.; Tedesco, A.; Moriello, R.S.L.; Tufano, A. Enabling wireless technologies for industry 4.0: State of the art. In Proceedings of the 2017 IEEE International Workshop on Measurement and Networking (M & N), Naples, Italy, 27–29 September 2017; pp. 1–5. [Google Scholar]
- Message Queuing Telemetry Transport (MQTT). Available online: http://mqtt.org/ (accessed on 11 August 2018).
- Android Studio and SDK Tool. Available online: https://developer.android.com/studio/ (accessed on 11 August 2018).
- MAXST AR SDK Tool. Available online: http://maxst.com/#/ (accessed on 11 August 2018).
- Engelhard, N.; Endres, F.; Hess, J.; Sturm, J.; Burgard, W. Real-time 3D visual SLAM with a hand-held RGB-D camera. In Proceedings of the RGB-D Workshop on 3D Perception in Robotics at the European Robotics Forum, Vasteras, Sweden, 8 April 2011; Volume 180, pp. 1–15. [Google Scholar]
- Daponte, P.; De Vito, L.; Picariello, F.; Riccio, M. State of the art and future developments of the augmented reality for measurement applications. Measurement 2014, 57, 53–70. [Google Scholar] [CrossRef]
- Endres, F.; Hess, J.; Engelhard, N.; Sturm, J.; Cremers, D.; Burgard, W. An evaluation of the RGB-D SLAM system. In Proceedings of the 2012 IEEE International Conference on Robotics and Automation (ICRA), Saint Paul, MN, USA, 14–18 May 2012; pp. 1691–1696. [Google Scholar]
Figure 1.
Block diagram of the realized sensor node.

Figure 2.
Adopted voltage sensor.

Figure 3.
Adopted current sensor.

Figure 4.
Estimated characteristic of the adopted voltage sensor.

Figure 5.
Performance parameters of the adopted voltage sensor.
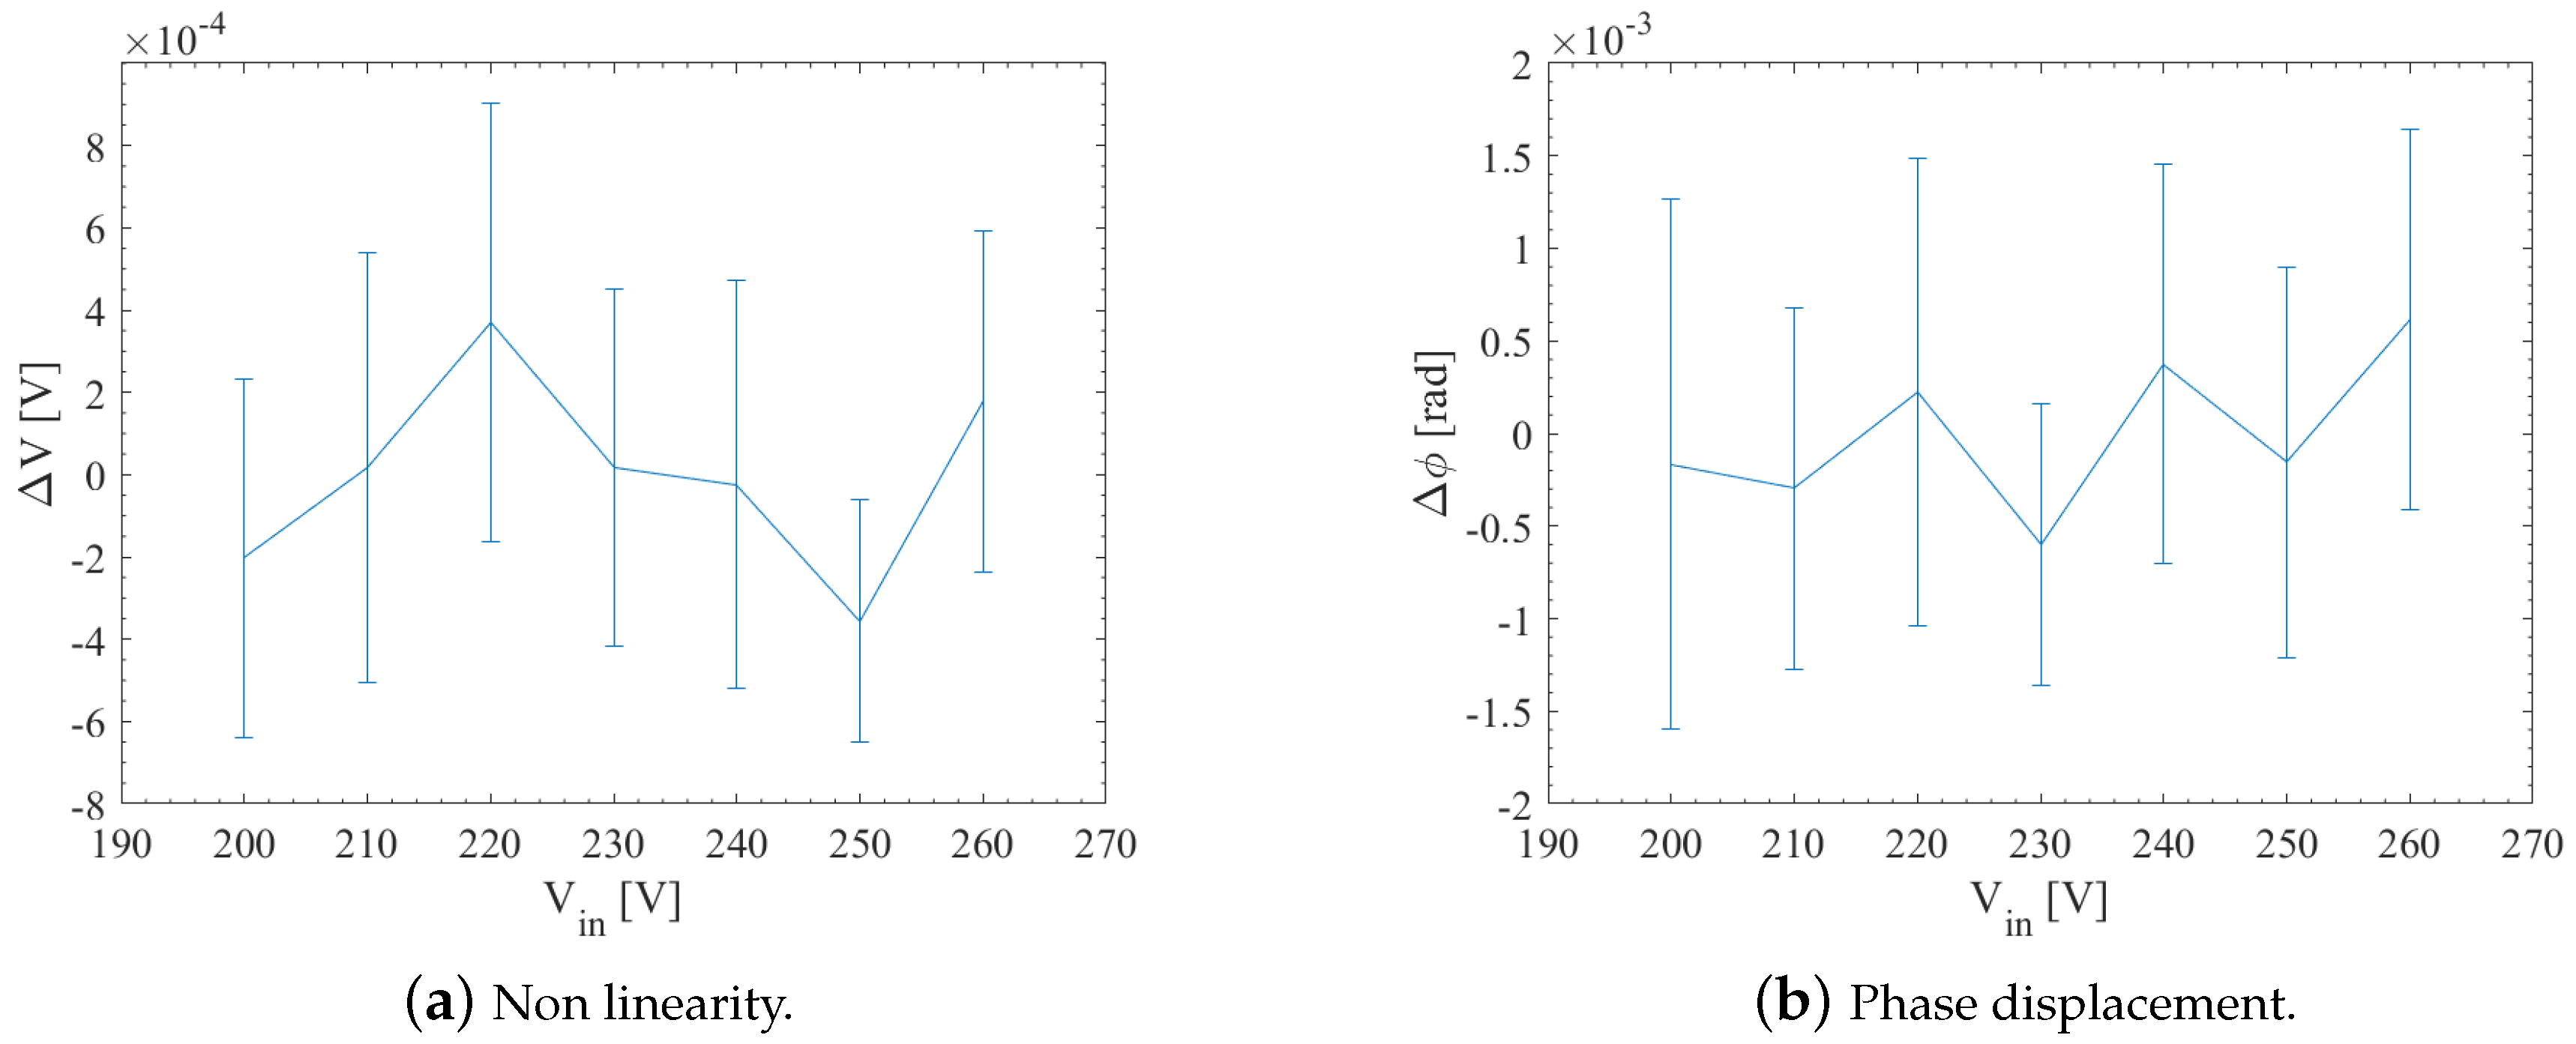
Figure 6.
Estimated characteristic of the adopted current sensor.

Figure 7.
Performance parameters of the adopted current sensor.
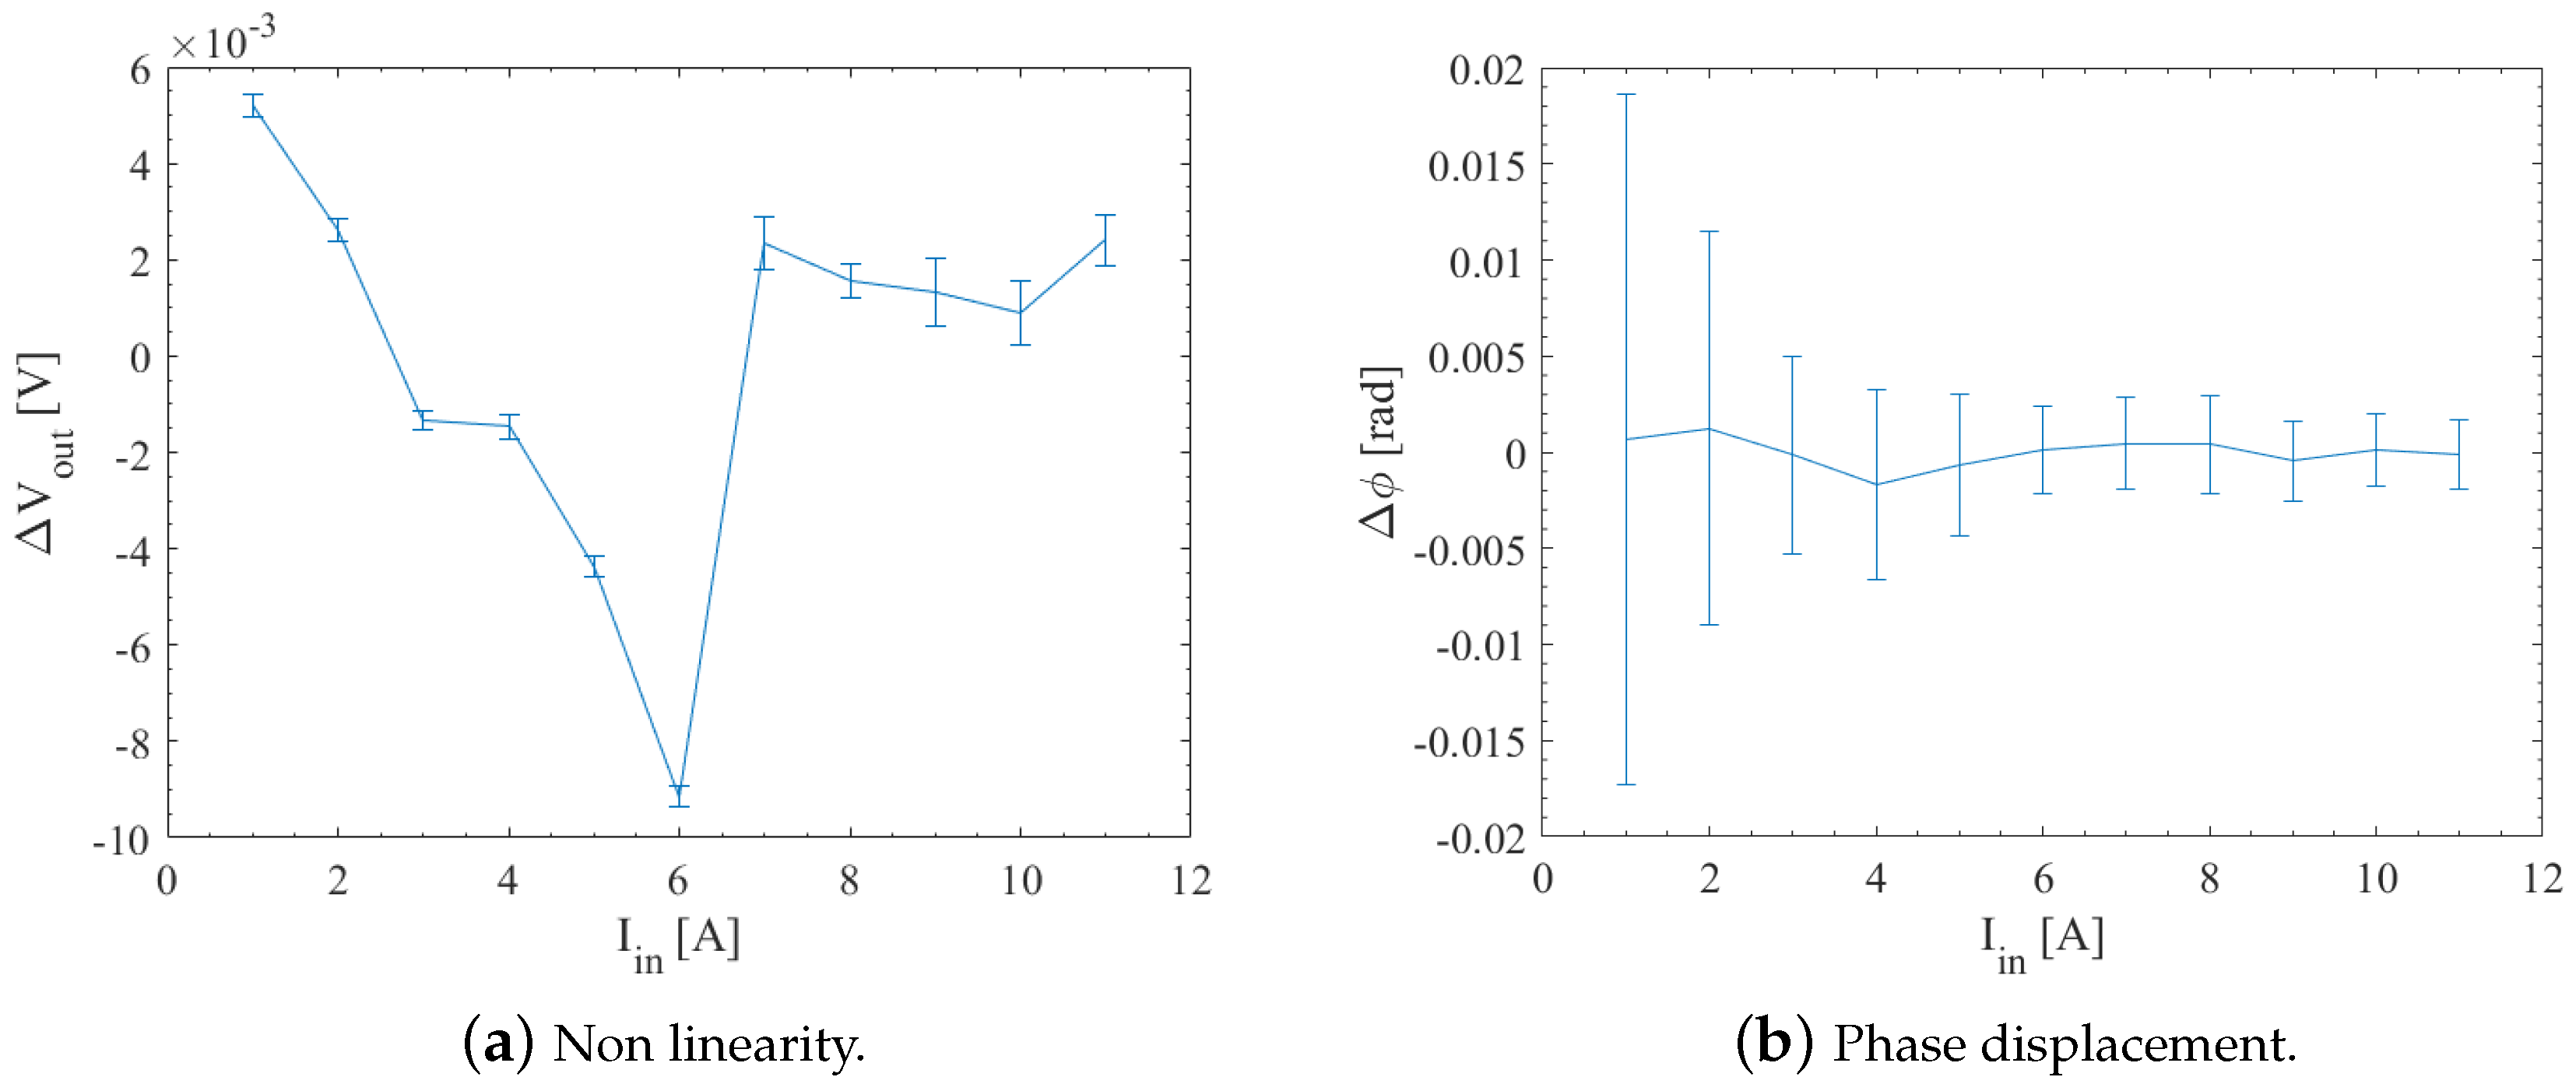
Figure 8.
Adopted embedded system for signal processing and measurement data transmission.

Figure 9.
Prototype of sensor node for power measurement of domestic load based on COTS.
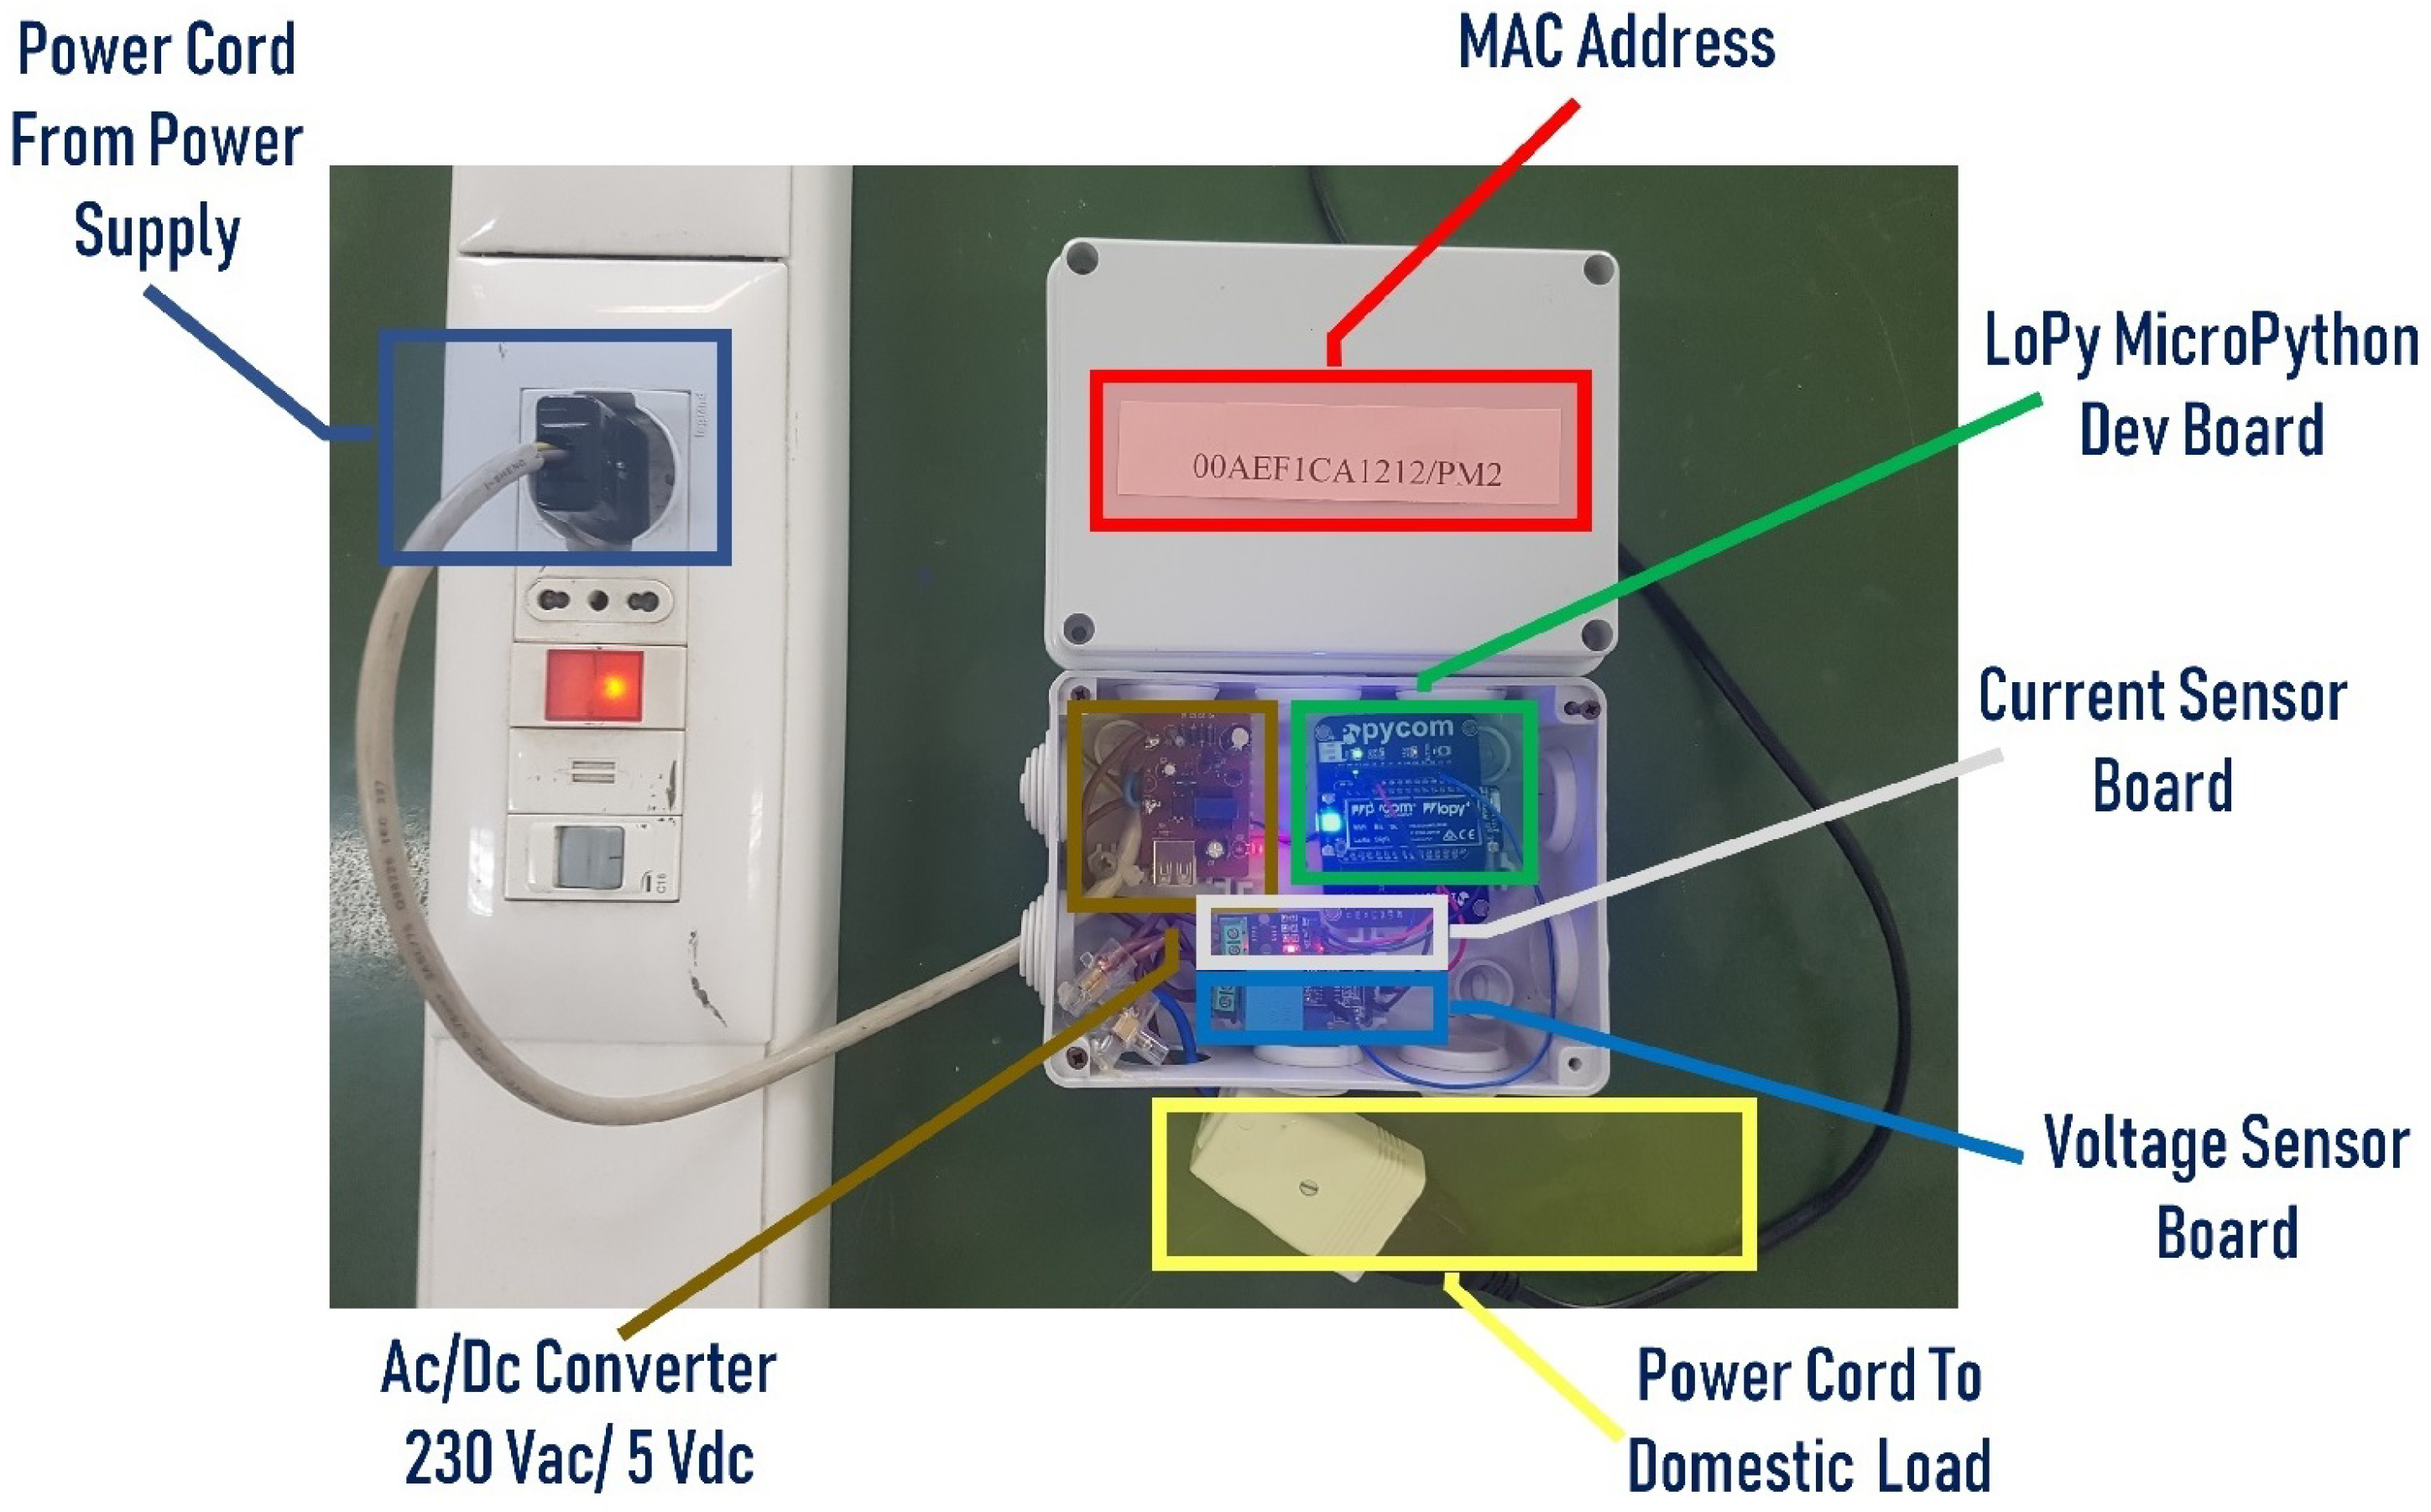
Figure 10.
Features extraction process based on VSLM.

Figure 11.
Proposed approach for power consumption awareness based on Augmented Reality.
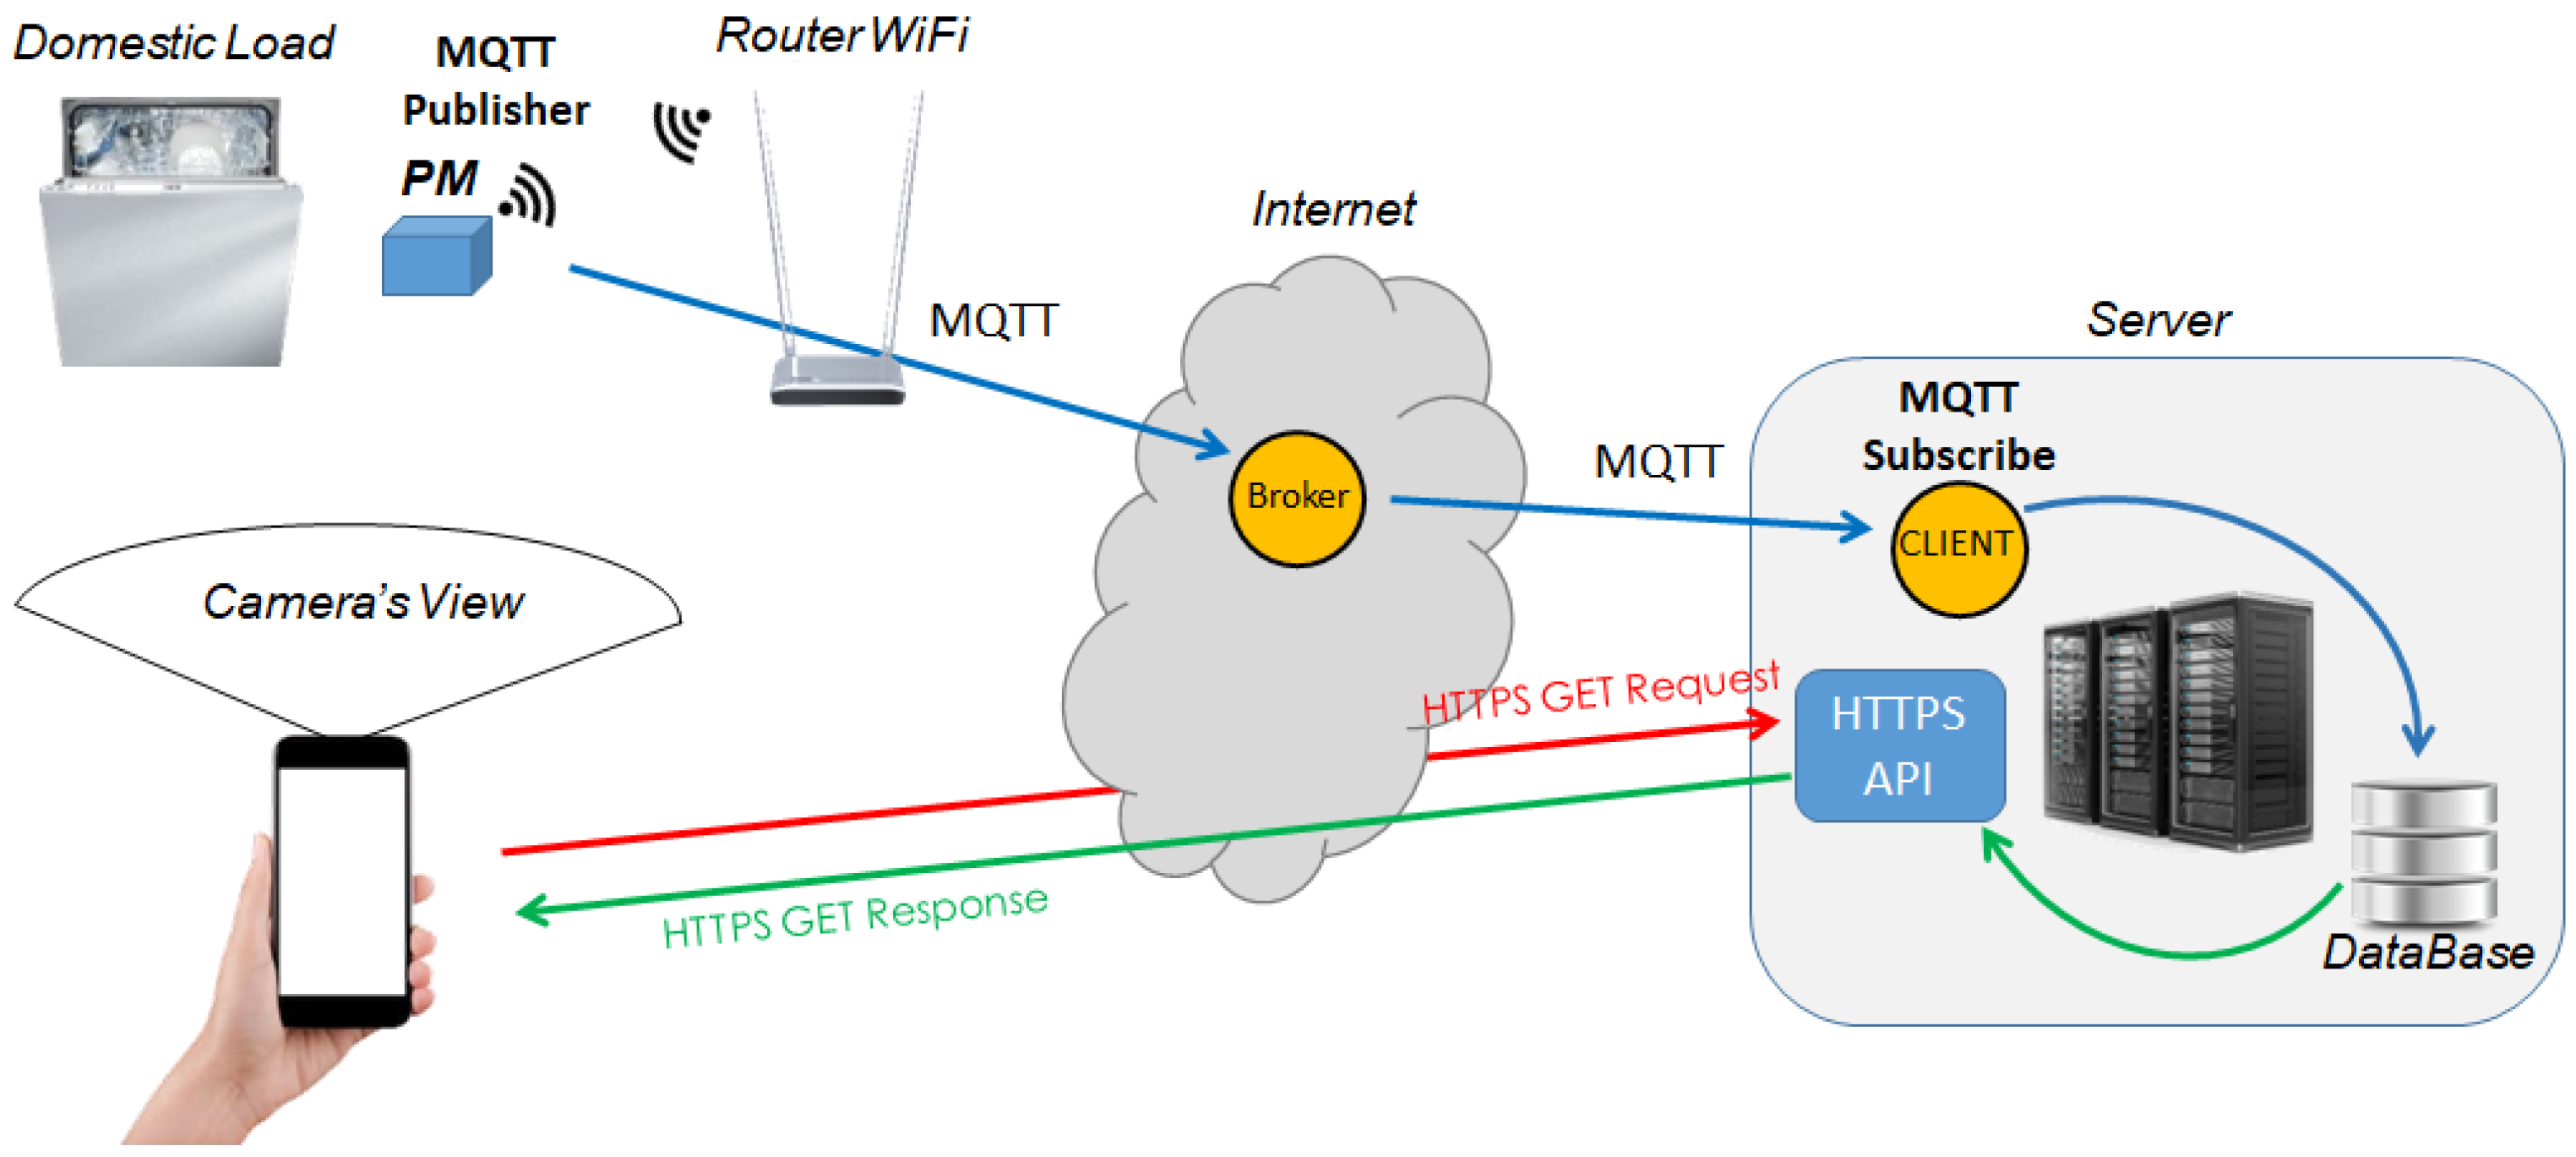
Figure 12.
Screenshot of received MQTT messages.

Figure 13.
Screenshot of AR app for topic association and features extraction.

Figure 14.
Features extraction process on an actual domestic appliance.

Figure 15.
Features extraction from different points of view for robust object recognition.

Figure 16.
Screenshots of the realized app while rendering power measures in AR.
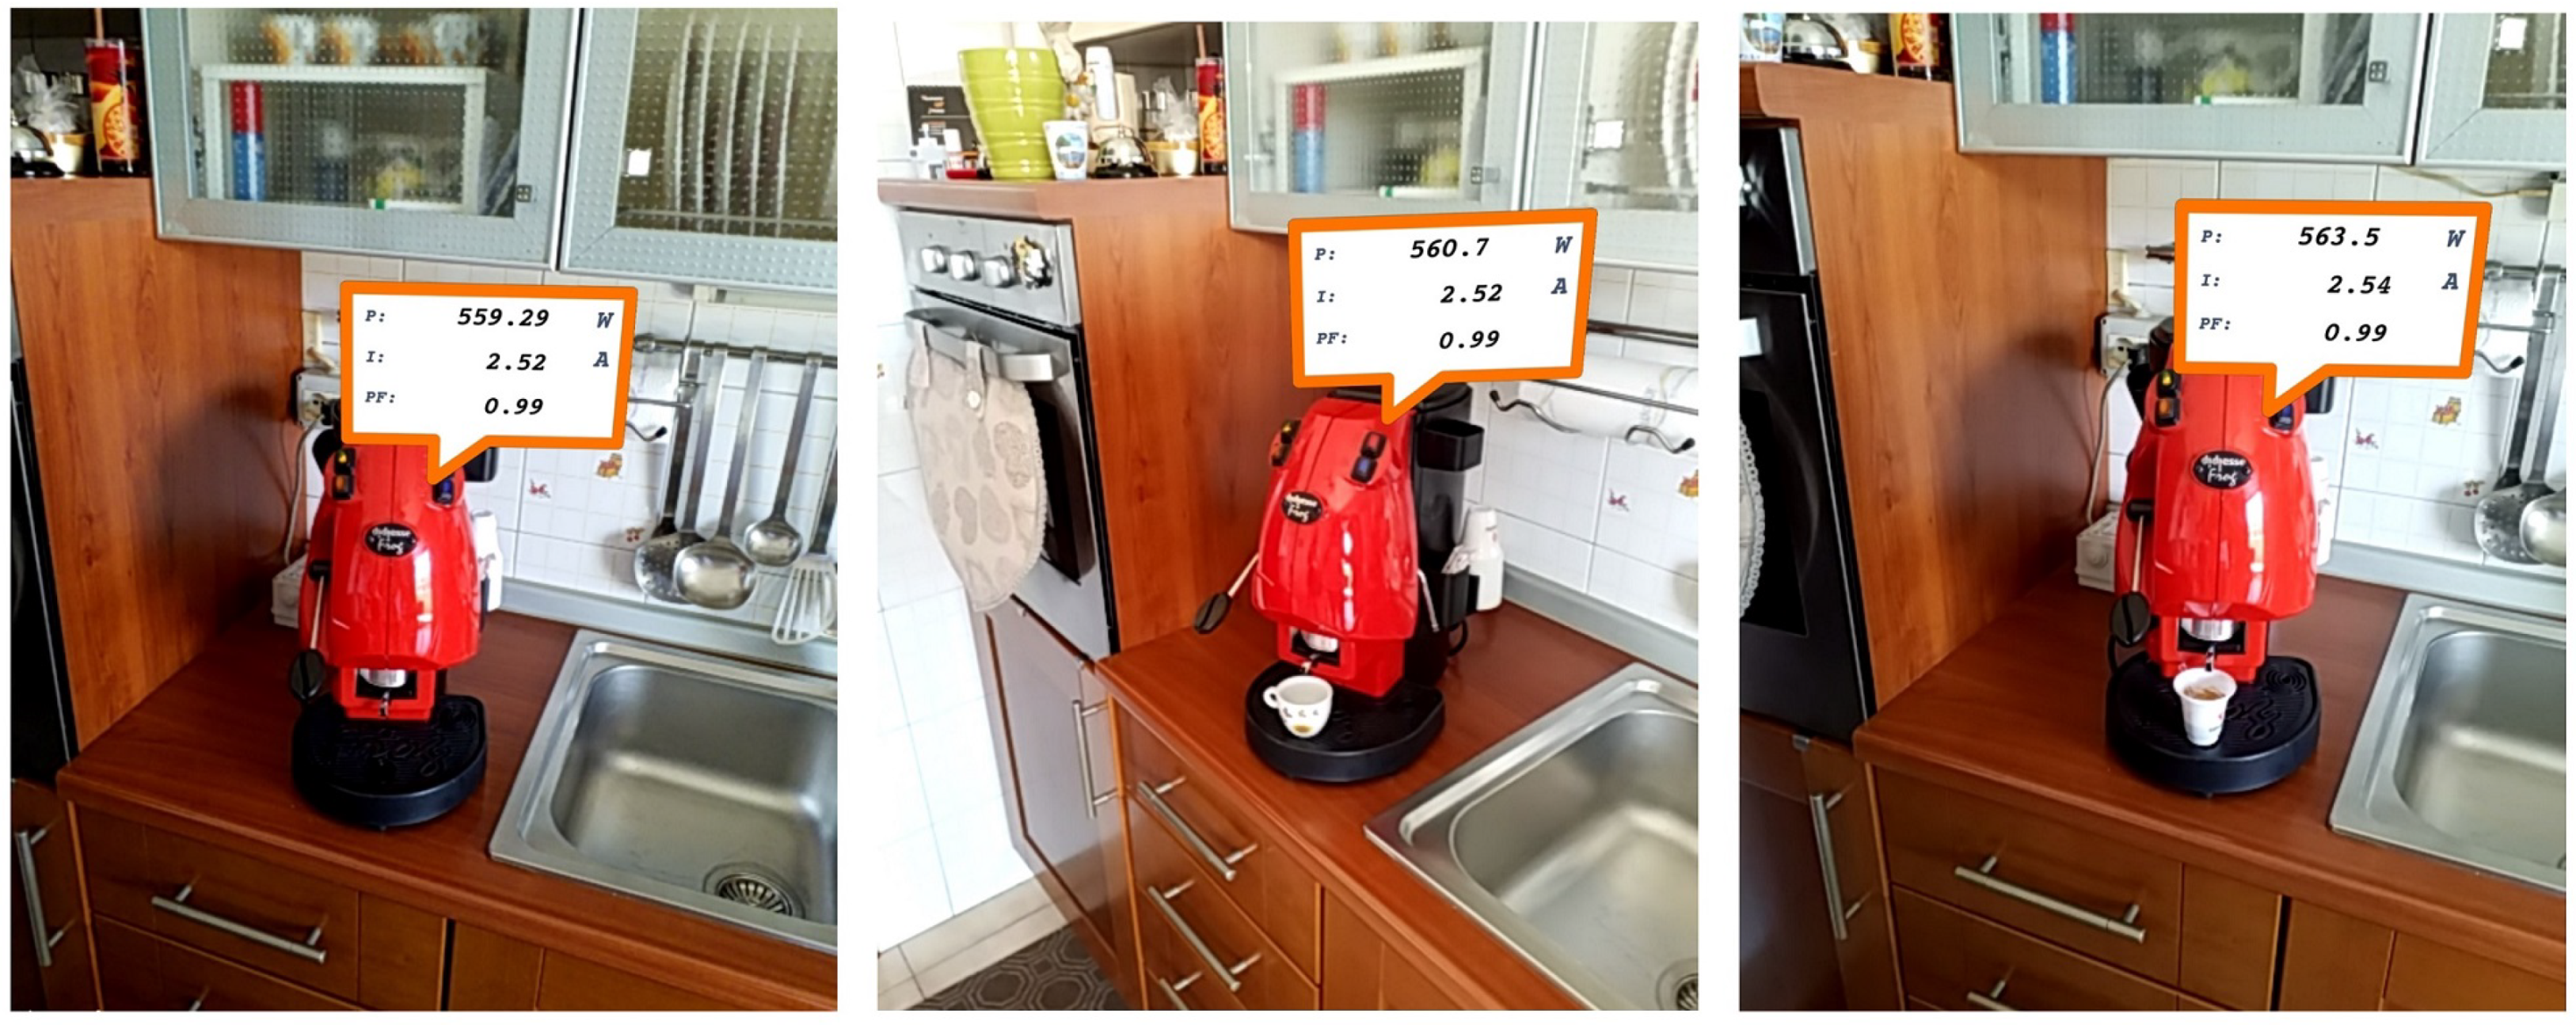
Figure 17.
Features extraction and AR data rendering for load associated with 00AEF1CA1212/PM2.

Figure 18.
Examples of AR data rendering by means of medium-level tablet.


Table 1.
Performance factors evaluated on a set of 10 voltage sensors.
| Input [V] | [mV] | [mV] | [mrad] | [mrad] |
|---|---|---|---|---|
| 200 | 0.6 | 4.5 | 0.3 | 6.9 |
| 210 | −0.7 | 4.5 | 0.7 | 5.6 |
| 220 | −0.1 | 3.3 | 0.9 | 6.1 |
| 230 | 0.8 | 3.9 | 0.1 | 5.4 |
| 240 | 0.5 | 3.8 | −0.7 | 6.5 |
| 250 | 0.9 | 4.2 | −0.7 | 5.5 |
| 260 | 0.3 | 4.4 | −0.4 | 6.0 |
Table 2.
Performance factors evaluated on a set of 10 current sensors.
| Input [A] | [mV] | [mV] | [mrad] | [mrad] |
|---|---|---|---|---|
| 1 | 0.7 | 8.3 | 1.1 | 32 |
| 2 | −1.6 | 9.1 | 1.2 | 22 |
| 3 | 0.1 | 8.5 | −0.3 | 15 |
| 4 | 0.1 | 8.0 | −2.8 | 13 |
| 5 | 1.4 | 9.5 | −1.0 | 11 |
| 6 | −0.1 | 8.4 | −0.4 | 8.2 |
| 7 | −0.4 | 8.8 | −1.3 | 6.4 |
| 8 | 0.6 | 9.3 | −1.8 | 7.8 |
| 9 | 0.9 | 8.7 | 1.9 | 7.8 |
| 10 | 0.1 | 9.4 | −0.4 | 4.7 |
| 11 | −0.6 | 8.7 | 2.3 | 5.6 |
© 2018 by the authors. Licensee MDPI, Basel, Switzerland. This article is an open access article distributed under the terms and conditions of the Creative Commons Attribution (CC BY) license (http://creativecommons.org/licenses/by/4.0/).
Share and Cite
MDPI and ACS Style
Angrisani, L.; Bonavolontà, F.; Liccardo, A.; Schiano Lo Moriello, R.; Serino, F. Smart Power Meters in Augmented Reality Environment for Electricity Consumption Awareness. Energies 2018, 11, 2303. https://doi.org/10.3390/en11092303
AMA Style
Angrisani L, Bonavolontà F, Liccardo A, Schiano Lo Moriello R, Serino F. Smart Power Meters in Augmented Reality Environment for Electricity Consumption Awareness. Energies. 2018; 11(9):2303. https://doi.org/10.3390/en11092303
Chicago/Turabian StyleAngrisani, Leopoldo, Francesco Bonavolontà, Annalisa Liccardo, Rosario Schiano Lo Moriello, and Francesco Serino. 2018. "Smart Power Meters in Augmented Reality Environment for Electricity Consumption Awareness" Energies 11, no. 9: 2303. https://doi.org/10.3390/en11092303
Note that from the first issue of 2016, this journal uses article numbers instead of page numbers. See further details here.