Article

Study on the Characteristics of a High Capacity Nickel Manganese Cobalt Oxide (NMC) Lithium-Ion Battery—An Experimental Investigation

1
Graduate School at Shenzhen, Tsinghua University, Shenzhen 518055, China
2
Sunwoda Electronic Co. Ltd., Shenzhen 518108, China
*
Author to whom correspondence should be addressed.
Energies 2018, 11(9), 2275; https://doi.org/10.3390/en11092275
Submission received: 27 July 2018 / Revised: 25 August 2018 / Accepted: 25 August 2018 / Published: 29 August 2018

Abstract

:
The use of high-capacity batteries as the battery pack of electric vehicles is the current development trend. In order to better design battery packages and battery management systems and develop related battery estimation technology, the related characteristics of high capacity battery cells need to be studied in depth. Capacity and pulse tests of batteries at different temperatures are carried out in this paper. Through these experimental data, the electrical characteristics of different parameters of the high capacity battery, such as capacity characteristic data, internal resistance characteristic data, OCV-SOC characteristic relation curve, power data and temperature rise are analyzed. The specific parameters of the battery in the second order equivalent circuit model are obtained by using the off-line parameter identification method. These parameters results can be used as comparison data and reference data. It is beneficial to the on-line parameter identification of battery model and the estimation of battery state, so as to shorten the development time and improve the quality of the development.

1. Introduction

Lithium-ion batteries have been widely used as the power supply source in various applications for approximately 40 years, since Goodenough created the first lithium-ion batteries in 1980 and Sony released the first commercial lithium-ion battery in 1991 [1,2,3,4]. Due to their superior energy density and power density, high open-circuit cell voltage, high efficiency, broad ambient temperature operating, light weight, and long lifespan, lithium batteries are widely applied in electric vehicles (EVs) and hybrid electric vehicles (HEVs) [5]. As a development of the technology, the electric vehicle market requires high energy density and specific power batteries to meet the operational needs of electric vehicles [6,7]. Thus, we need to constantly study the next generation of batteries, and keep understanding of the characteristics of the battery so that we can develop the good battery management systems to guarantee battery safety, extend battery operational life and enable them to meet the high demands of EVs.
The first practical battery was successfully developed by the Italian scientist Volta in the early nineteenth century [8], then batteries experienced the development of lead-acid batteries, silver oxide batteries, nickel cadmium batteries, zinc manganese batteries, fuel cells, lithium-ion batteries, lithium-sulfur batteries, and all solid state lithium-ion batteries [4,9,10,11,12,13,14,15,16]. Commercial lithium-ion batteries such as LCO (Lithium cobalt oxide), LFP (Lithium iron phosphate), LNO (Lithium nickel oxide), LTO (Lithium titanate oxide), NCA (Nickel cobalt aluminum), and NMC (Nickel manganese cobalt) are adopted by electric vehicles nowadays [4]. Although lithium-ion batteries have many advantages, they still suffer from some shortcomings, such as safety issues, strict charging protocols, and high cost, due to their material properties and electrical characteristics. In order to perform accurate state estimations and implement over charge/discharge protection, over temperature protection, and current/voltage control for lithium-ion batteries, their characteristics need to be studied in depth.
The early lithium-ion batteries used metal lithium as negative electrodes, it has the advantages of high energy density. However, the chemical activities of lithium metal are too strong. In the process of charging lithium batteries, there may be formation of lithium dendrite. With the accumulation of crystals, the internal short circuit of the battery may lead it to explode. Although the current battery industry uses graphite instead of lithium metal as negative electrode, lithium-ion batteries still have limitations of under-utilization of active materials, stress-induced material damage, capacity fade, and thermal runaway [17]. Another important characteristic of the battery that needs to be studied is the loss of battery capacity and the heat generation at low or high C-rates.
The battery cell tests include overcharge, over discharge, short circuit, heating, puncture, dropping, extrusion, low pressure, seawater immersion, and temperature cycling. The tests of puncture, extrusion, overcharge and short circuit are common items of current test failures. In the failure ratio of different material systems, NMC material batteries exceed 85%. The major challenge for the next generation of electric vehicles is how to manage battery pack heat generation according to its thermal characteristics [18].
In order to protect and manage the battery, it is most important to accurately estimate the various battery states such as state of charge (SOC) [19], state of health (SOH) [20], and state of power (SOP) [21,22]. Lavigne et al. [23] proposed a two stage lithium-ion battery open circuit voltage (OCV) curve model to estimate SOC. Ting et al. [24] used a battery management system (BMS) which includes a RC battery model. Ruifeng et al. [25] proposed a novel sliding mode observer for SOC estimation. Yatsui et al. [26] combined the outcomes of KF with OCV and Coulomb counting to compensate the non-ideal factors when the batteries are in operation. He et al. [27] presented the AEKF algorithm to obtain the online parameters of a battery model and estimate SOC based on OCV. Pei [28] proposed the online peak power prediction based on a parameter and state estimator for lithium-ion batteries in EVs. Wladislaw [22] presented a model-based power prediction algorithm for lithium-ion battery packs and the used model parameters are fully adaptable on-line to the given state of the battery. Zhang [29] presented a comparative study of particle filter improved algorithms based on a second-order RC equivalent circuit model (ECM). Among them, SOC estimation based on ECM with the Kalman filter family method is the most successful real world application. The equivalent circuit model uses resistors, capacitors, constant voltage sources and other circuit elements to form a circuit network to simulate the battery dynamic voltage characteristics. This kind of model is a centralized parameter model, which usually contains relatively few parameters and makes it easy to deduce the state space equation, so it is widely used in system simulation and real-time control. Various ECMs such as the Rint, the Thevenin, the RC, the PNGV or GNL model are now widely used in battery estimation algorithm in battery management system of EV [30,31,32]. In order to get the effectiveness and robustness of the models under different working conditions, a large time consumption and expensive calibration models are needed. In recent years, many new battery models have been put forward or improved such as improved equivalent-circuit model [21], fractional order PNGV model [33], invariant imbedding method [34], reduced order equivalent circuit battery models [35], fuzzy model [36], battery degradation model [37], kinetic battery model (KIBaM) [38], and electrochemical/electrical-thermal coupled model [37] and so on. In addition to the equivalent circuit model of integer order, the concept of fractional equivalent circuit models was also proposed recently in some references [39,40,41,42]. In this model, instead of standard capacitors, constant phase elements are used in the RC network to better simulate the semicircles (corresponding to charge transfer, SEI effect, etc.) in the impedance spectrum, and the fractional order element is used to describe the low frequency diffusion effect.
Commonly used parameter identification methods of ECMs include off-line and on-line methods. The off-line methods include the pulse charge/discharge method, impedance spectroscopy method, batch least squares method and all kinds of off-line optimization methods, such as genetic algorithm, particle swarm optimization (PSO), etc. This kind of method usually requires the test data of the battery under different conditions to establish the correlation between the model parameters and the working conditions (such as temperature, loading and so on), so as to ensure the robustness of the equivalent circuit model. Online methods include iterative least squares, Kalman filtering, adaptive observer and so on. These methods can identify model parameters in real time, so they have better ability to capture parameter changes, thereby enhancing the adaptability of the model. However, online computation makes such methods more demanding for computational efficiency, computation storage and algorithm stability.
Therefore, it is very important to understand and master the electrical characteristics of the battery, whether it is for battery development, battery cell selection for a battery pack, or battery management system development. This paper focused on the characteristics of a high capacity NMC lithium-ion battery. In Section 2, the specific parameters of a high capacity lithium-ion battery are given, and the test plan of the battery is designed, and the relevant test tests are carried out. In the Section 3, the battery capacity, the parameters of the battery model, the OCV-SOC relationship, the battery power limitation and the temperature rise result of the battery are obtained. In Section 4, the paper experiment and results are analyzed and discussed. At last, this paper gives the characteristic conclusion of high capacity lithium-ion battery. This research will be important for future research and development of new battery, battery model online identification and state estimation.

2. Experimental Method

2.1. Lithium-Ion Battery

2.1.1. Lithium-Ion Battery Specifications

In this paper, fresh lithium-ion battery cells which had left the factory not more than one month earlier and had undergone not more than five recharge cycles were chosen, the cathode material for the lithium-ion battery cell is made of NMC. The specification parameters of the lithium-ion battery cell supplied by the manufacturer are listed in Table 1.

2.1.2. Lithium-Ion Battery Performance Index

The performance indexes of lithium-ion batteries are as follows:
  • Battery capacity: The amount of electricity that the battery can release under certain discharge conditions is called the capacity of the battery, indicated by the symbol C ; the unit is Ah or mAh. The battery capacity is reflected in the mileage of an electric vehicle.
  • Theoretical capacity: The amount of electricity that can be supplied under the assumption that all the active substances of the battery participate in the reaction of the battery. It can be calculated according to Faraday's law. The symbol used is C F .
  • Actual capacity: it refers to the actual discharge of a battery under certain discharge conditions. The mathematical calculation for actual capacity is shown in Equation (1):
      C A = t 1   t 2 η c i ( t ) 3600 d t S O C ( t 2 ) S O C ( t 1 )
    where C A is the actual cell capacity in Ampere-hours. S O C ( t 1 ) and S O C ( t 2 )   refer to the estimated S O C at the times t 1 and t 2 , respectively. I ( t ) represents the cell current at the time t . η c is the Coulombic efficiency [43].
  • Battery energy: The energy of a battery refers to the power output of a battery in a certain discharge regime, usually expressed in Watt (W) or kilowatt (kW). The energy of the battery reflects the capacity of the battery to perform its work, and it is also a measure of the energy conversion in the current discharge process.
  • Theoretical energy: Assuming that the battery is always in a balanced state during the discharge process, the discharge voltage keeps the electromotive force constant, and the utilization ratio of the active substance is 100%, that is, the discharge capacity is equal to the theoretical capacity, and the energy output by the battery is the theoretical capacity under this condition.
  • Actual energy: Actual energy is the electrical energy that the battery can output under certain discharge conditions. The actual energy of the battery is the product of its actual capacity and the average voltage of the discharge process.
  • Specific energy: Specific energy is the energy output by unit mass or unit volume battery, which is called mass ratio energy or volume ratio energy, mass energy density abbreviated to specific energy, and volume energy density is called energy density for short.
  • Specific power: The power of a battery is the power that the battery can output at a unit time under a prescribed discharge condition. The unit is Watt (W) or kilowatt (kW). The output power of the unit mass cell is called the specific power, and the unit power output of the unit volume is the power density. The size of the specific power represents the working current that the battery can bear, and the power and specific power of the battery mainly affect the speed, acceleration and climbing performance of the electric vehicle.
  • C rate: C rate refers to the output value of the battery within the specified time, and the output value is equal to the multiple of the rated capacity. C rate represents the magnitude of charge/discharge current.

2.1.3. SOC Definition

According to the United States Advanced Battery Consortium (USABC), the traditional SOC defined as the ratio of the residual electricity to the rated capacity under the same condition, which describes the state of charge of the battery in the charge-discharge process. It is numerically defined as the ratio of battery remaining capacity to battery nominal capacity:
  S O C = Q r   Q n
where Q r is the remaining capacity of the battery, Q n is the nominal capacity of the battery for discharging at constant current.
The battery state of charge directly reflects the remaining battery capacity. The accurate SOC estimation of the electric vehicle is one of the key technologies and is the most basic and critical task in the battery management system. The battery state of charge cannot be directly measured from the battery itself, but can only be obtained by measuring the voltage, current, internal resistance, temperature and cycles of the battery. In order to make SOC more accurately reflect the state of charge of the battery, many scholars have revised the definition of SOC. The accurate SOC definition should meet the following requirements:
  • It can accurately reflect the battery real state of charge with different discharge C-rate, temperature, self-discharging and cycle life.
  • The SOC correction method should be simple and clear enough to correct the operating process of different kinds of batteries. The complexity of the correction method and the acquisition of correction parameters should be simple; thus the can meet the performance of embedded system in real use.
In this paper, the effect of battery discharge C-rate, temperature, cycle times and charge-discharge efficiency on battery capacity is considered. The revised definition of SOC is modified as follows:
  S O C [ I ( t )   , T ( t ) , n , t ] = 1 η [ I ( t ) ] Q n φ ( N ) 0 t α [ I ( t ) ] β [ T ( t ) ] I ( t ) d t
where S O C [ i ( t ) , T ( t ) , n , t ] is the revised SOC, Q n the nominal capacity of the battery, I ( t ) is the load current at time t , T ( t ) is the battery temperature at time t , N is the cycle number, α [ I ( t ) ] is the battery capacity change factor caused by the discharge ratio, β [ T ( t ) ] is the temperature caused by the capacity change factor, η is Coulombic efficiency, φ ( N ) is the capacity influence factor of the cycle number.

2.1.4. SOP Definition

According to [44], A battery’s SOP is defined as the ratio of peak power to nominal power. Generally speaking, the peak power of battery can be calculated by the following equations:
  P P c h   b a t = [ U c e l l , m i n · ( U O C c e l l , d i s U c e l l , m i n ) / R c e l l , d i s ]
  P P c h   b a t = [ U c e l l , m a x · ( U c e l l , m a x U O C c e l l , c h ) / R c e l l , c h ]
where P P c h b a t or P P d i s b a t is the peak power of the battery, U c e l l , m i n is the minimum battery cell voltage, U c e l l , m a x is the maximum battery cell voltage, U O C c e l l , d i s and U O C c e l l , c h   is the open circuit voltage of the battery under the discharge or charge state, R c e l l , d i s or R c e l l , c h is the resistance of the battery under the state.
However, the available power for charging or discharging the battery is then limited by the maximal or minimal charge current I and the maximal or minimal cell voltage U at the end of the charging or discharging pulse with duration T. Under the designed power constraints, current, voltage, SOC, and the maximum power that a battery can persistently provide for T seconds is defined as the battery’s peak power.
Taking multiple constraints of current, voltage, SOC, and power into account, we can obtain the final peak power during prediction time horizon T at the kth moment, as shown in follow equations:
  P P c h   = m i n ( P P c h i , P P c h v , P P c h S O C , P P c h b a t )
  P P d i s   = m a x ( P P d i s i , P P d i s v , P P d i s S O C , P P d i s b a t )
where P P c h is the final peak power under charge state,   P P d i s is the peak power under discharge state, P P c h i or P P d i s i is peak power under current constraint, P P c h v or P P d i s v is peak power under voltage constraint, P P c h S O C or P P d i s S O C is peak power under the SOC constraint.
As the peak power of the battery has been obtained, the state-of-power can be calculated by follow equations:
  S O P c h   = P P c h P n × 100 %
  S O P d i s   = P P d i s P n × 100 %
where P n represents the nominal power of the battery.

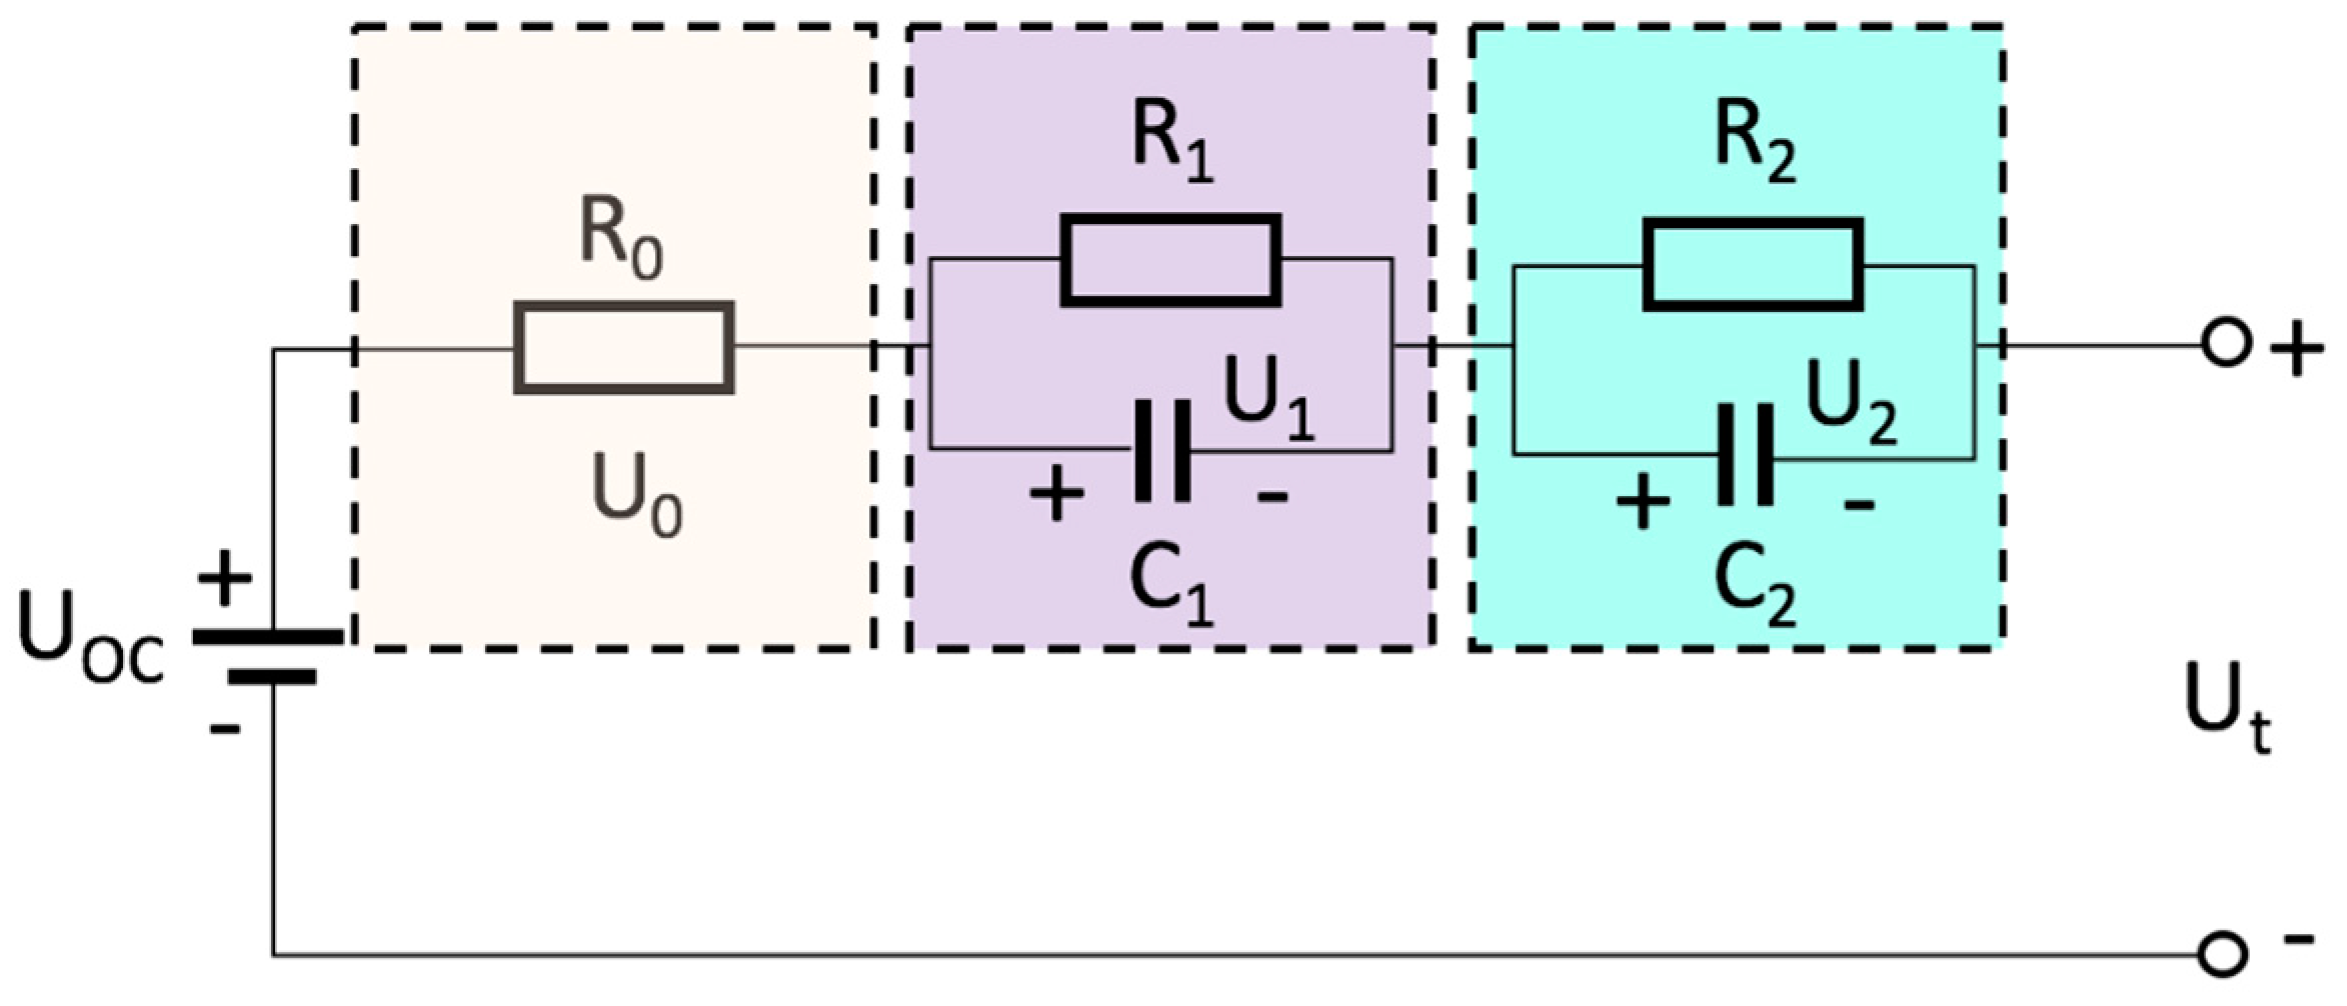
2.1.5. Lithium-Ion Battery Equivalent Circuit Model

ECMs are the most commonly used in lithium-ion batteries state of charge estimations for EV applications for their simple model structure. The 2RC model is a typical ECM battery model because of its special physical meaning compared with other models and the capacity realized in engineering. The dynamics of some battery cells are better predicted by a model with a second-order resistance-capacitance (RC) circuit network. The 2RC model is shown in Figure 1. It contains three parts besides the voltage source ( U o c ). The first part is the Ohmic resistance ( R 0 ). The second part R 1 C 1 circuit block which characterizes the diffusion of Li+ ions across the concentration gradient and the mass transport effects and dynamic voltage performances and the accumulation and dissipation of charge in the electrical double layer. It consists of a parallel equivalent resistance ( R 1 ) and capacitor ( C 1 ). The last R 2 C 2 circuits block part accounts for the elements described as the diffusion resistance and diffusion capacitance. It consists of a parallel equivalent resistance ( R 2 ) and capacitor ( C 2 ) [45].
From the circuit model shown in Figure 1, the battery ECM model relationship between polarization voltage and current can be obtained according to Kirchhoff’s law:
  U ˙ 1 = 1 R 1 C 1   U 1 + 1 C 1 I L
  U ˙ 2 = 1 R 2 C 2   U 2 + 1 C 2 I L
Terminal voltage U t could be written as follows:
  U t = U o c   U 1 U 2 I L R 0 + e
where I L is the current through the battery.   R 0 is the internal Ohmic resistance, R 1 is the charge transfer over-potential polarization resistance, C 1 for the double layer polarization capacitance, the R 2 C 2 circuits networks representing the transient dynamic voltage response and diffusion process during charging and discharging. U 1 and U 2 are the voltages across the RC blocks,   U o c is the open circuit voltage,   U t is the terminal voltage.   e is the measurement noise.

2.2. Experiment Tests for Battery Characterizations
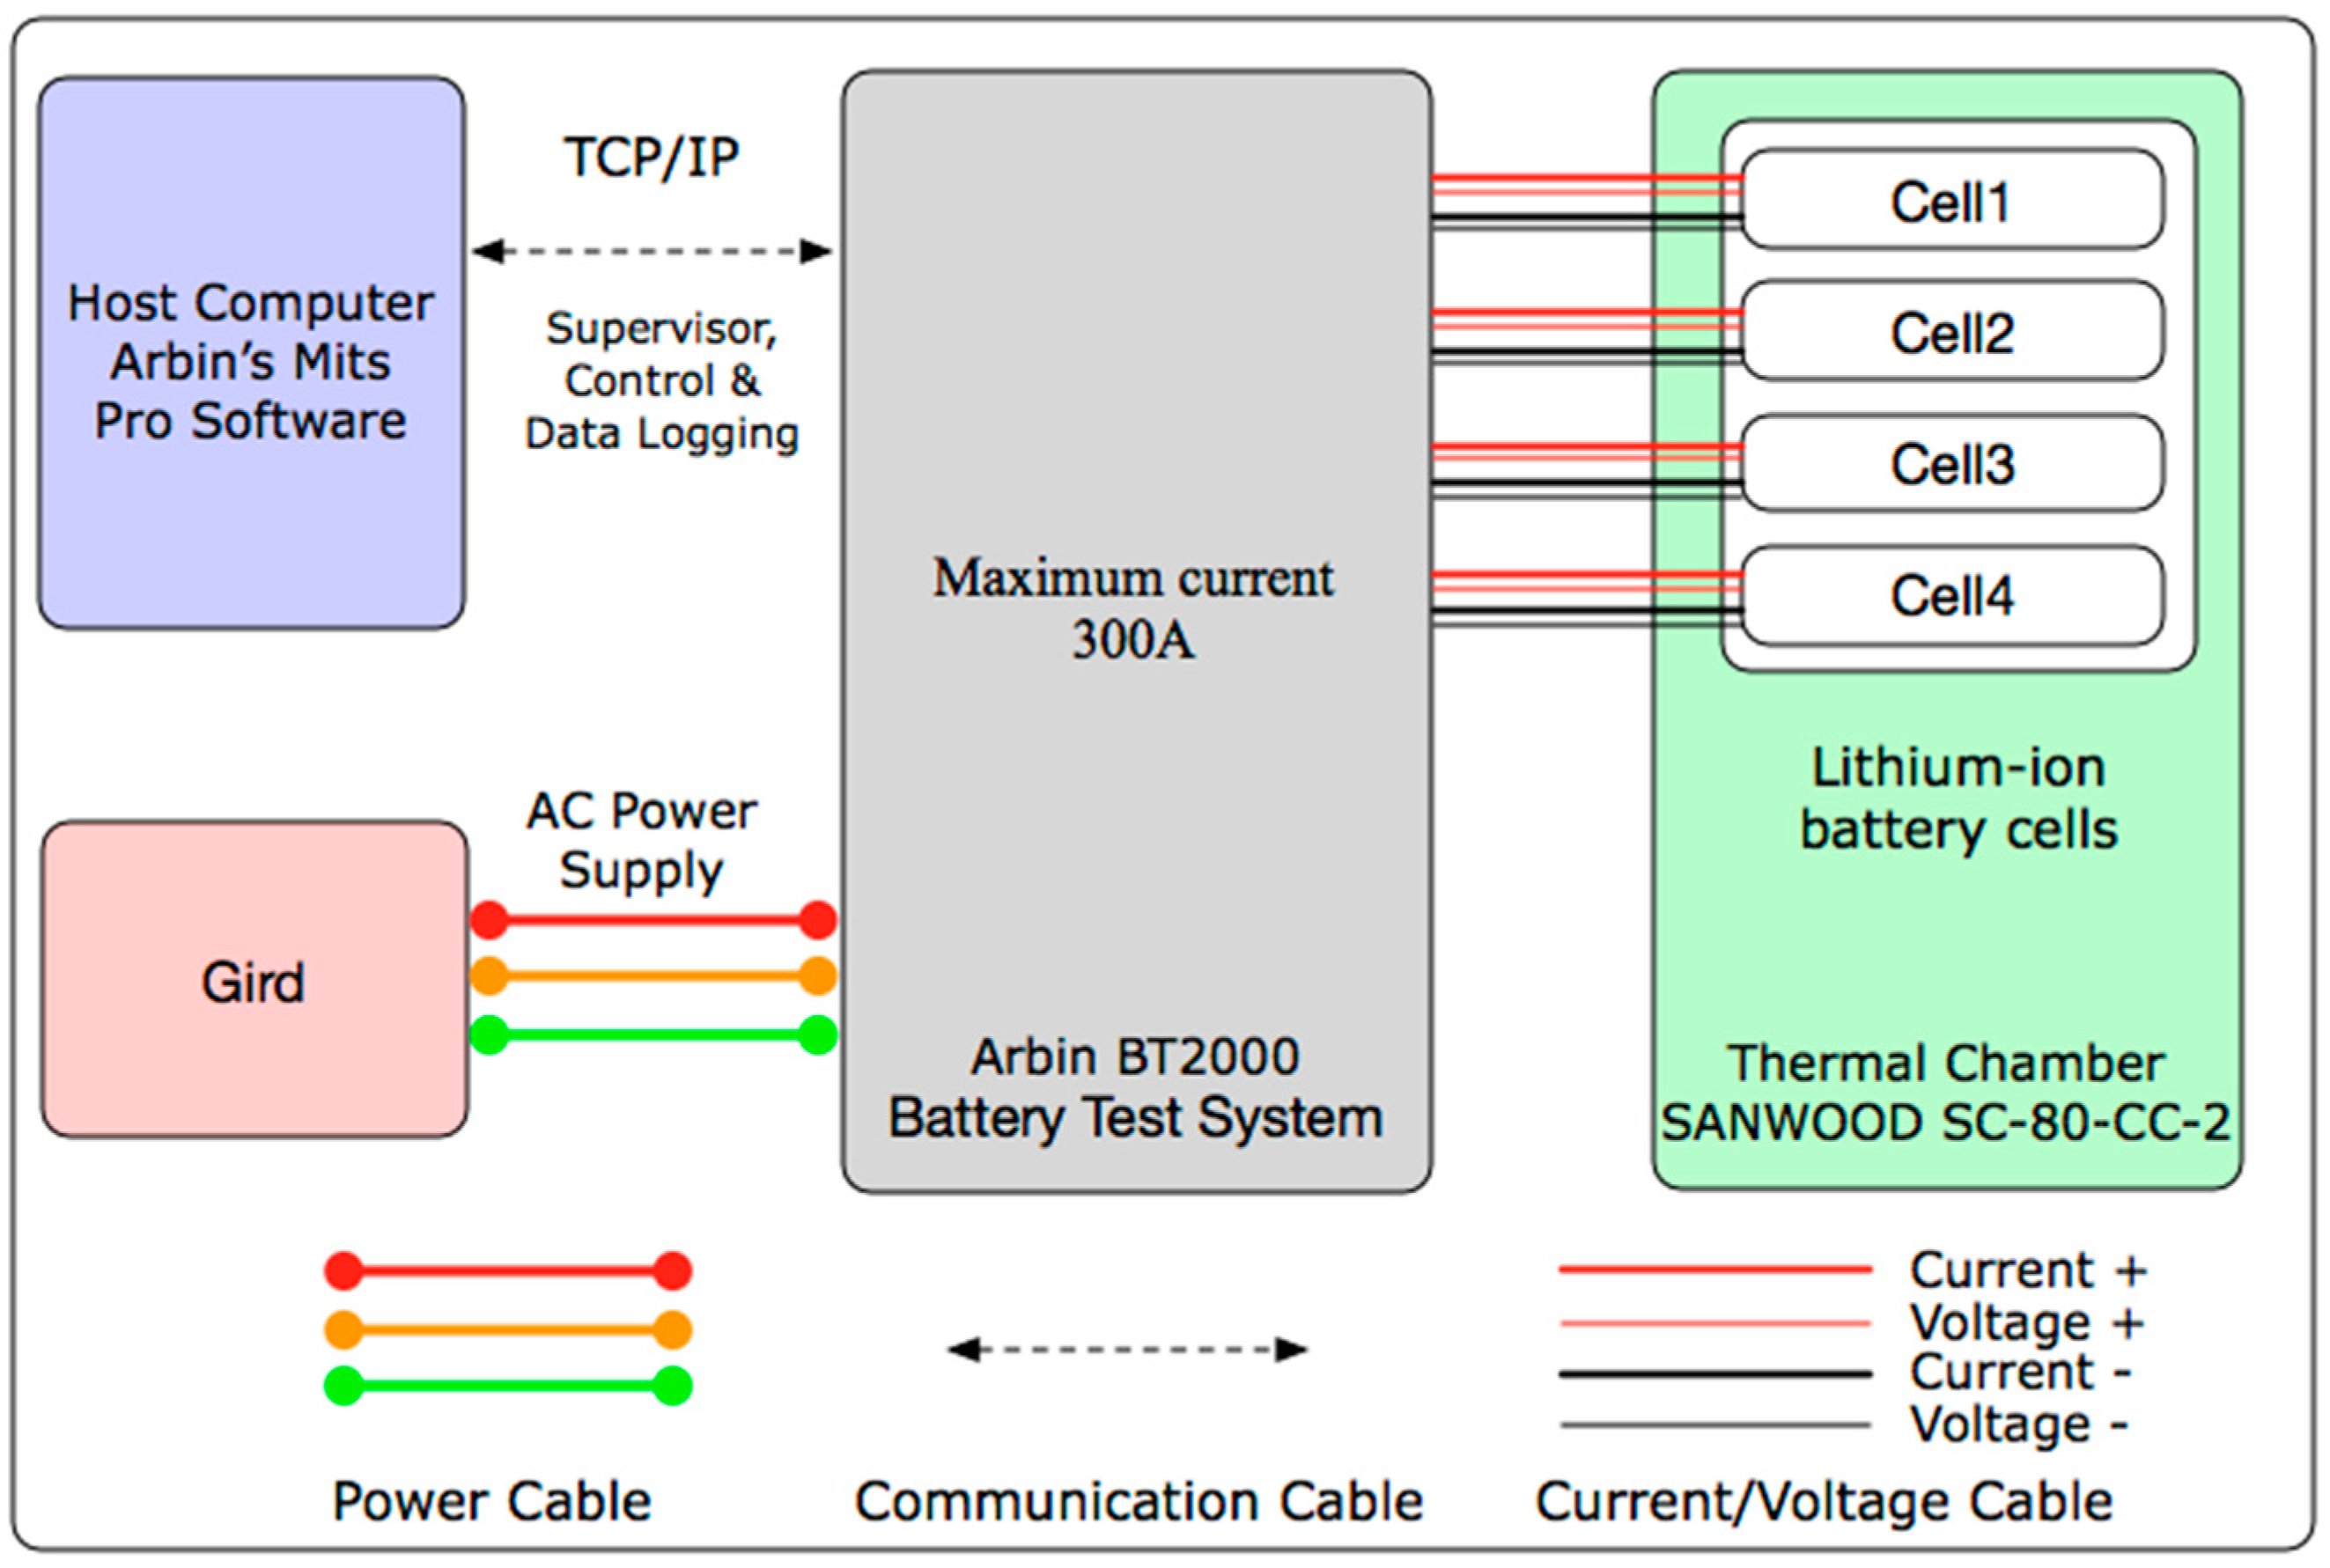
2.2.1. Test Bench

The schematic of the battery test bench for battery characterization built in the laboratory is as shown Figure 2. It consists of a BT2000 battery test system (Arbin, College Station, TX, USA) a host computer equipped with the MITS Pro software and a SC-80-CC-2 thermal chamber (SANWOOD, Dongguan, Guangdong, China) for environmental control. The measured data is transmitted to the host computer through TCP/IP ports. The BT2000 can charge/discharge a battery according to the designed program with maximum voltage of 60 V and maximum charge/discharge current of 300 A with three range (5 A/50 A/300 A), and its recorded data include current, voltage, temperature, charge/discharge Amp-hours (Ah) and Watt-hours (Wh) etc. The measurement error of the current and voltage sensors inside the Arbin BT2000 cycler is less than ±0.1%. The test was carried out under the conditions of standard temperature (25 ± 2 °C) and specific temperature, standard humidity (65 ± 20% RH) and atmospheric pressure (86~106 kPa). All tests were carried out in a clamping fixture with a clamping force of 100 ± 10 kgf/pcs.

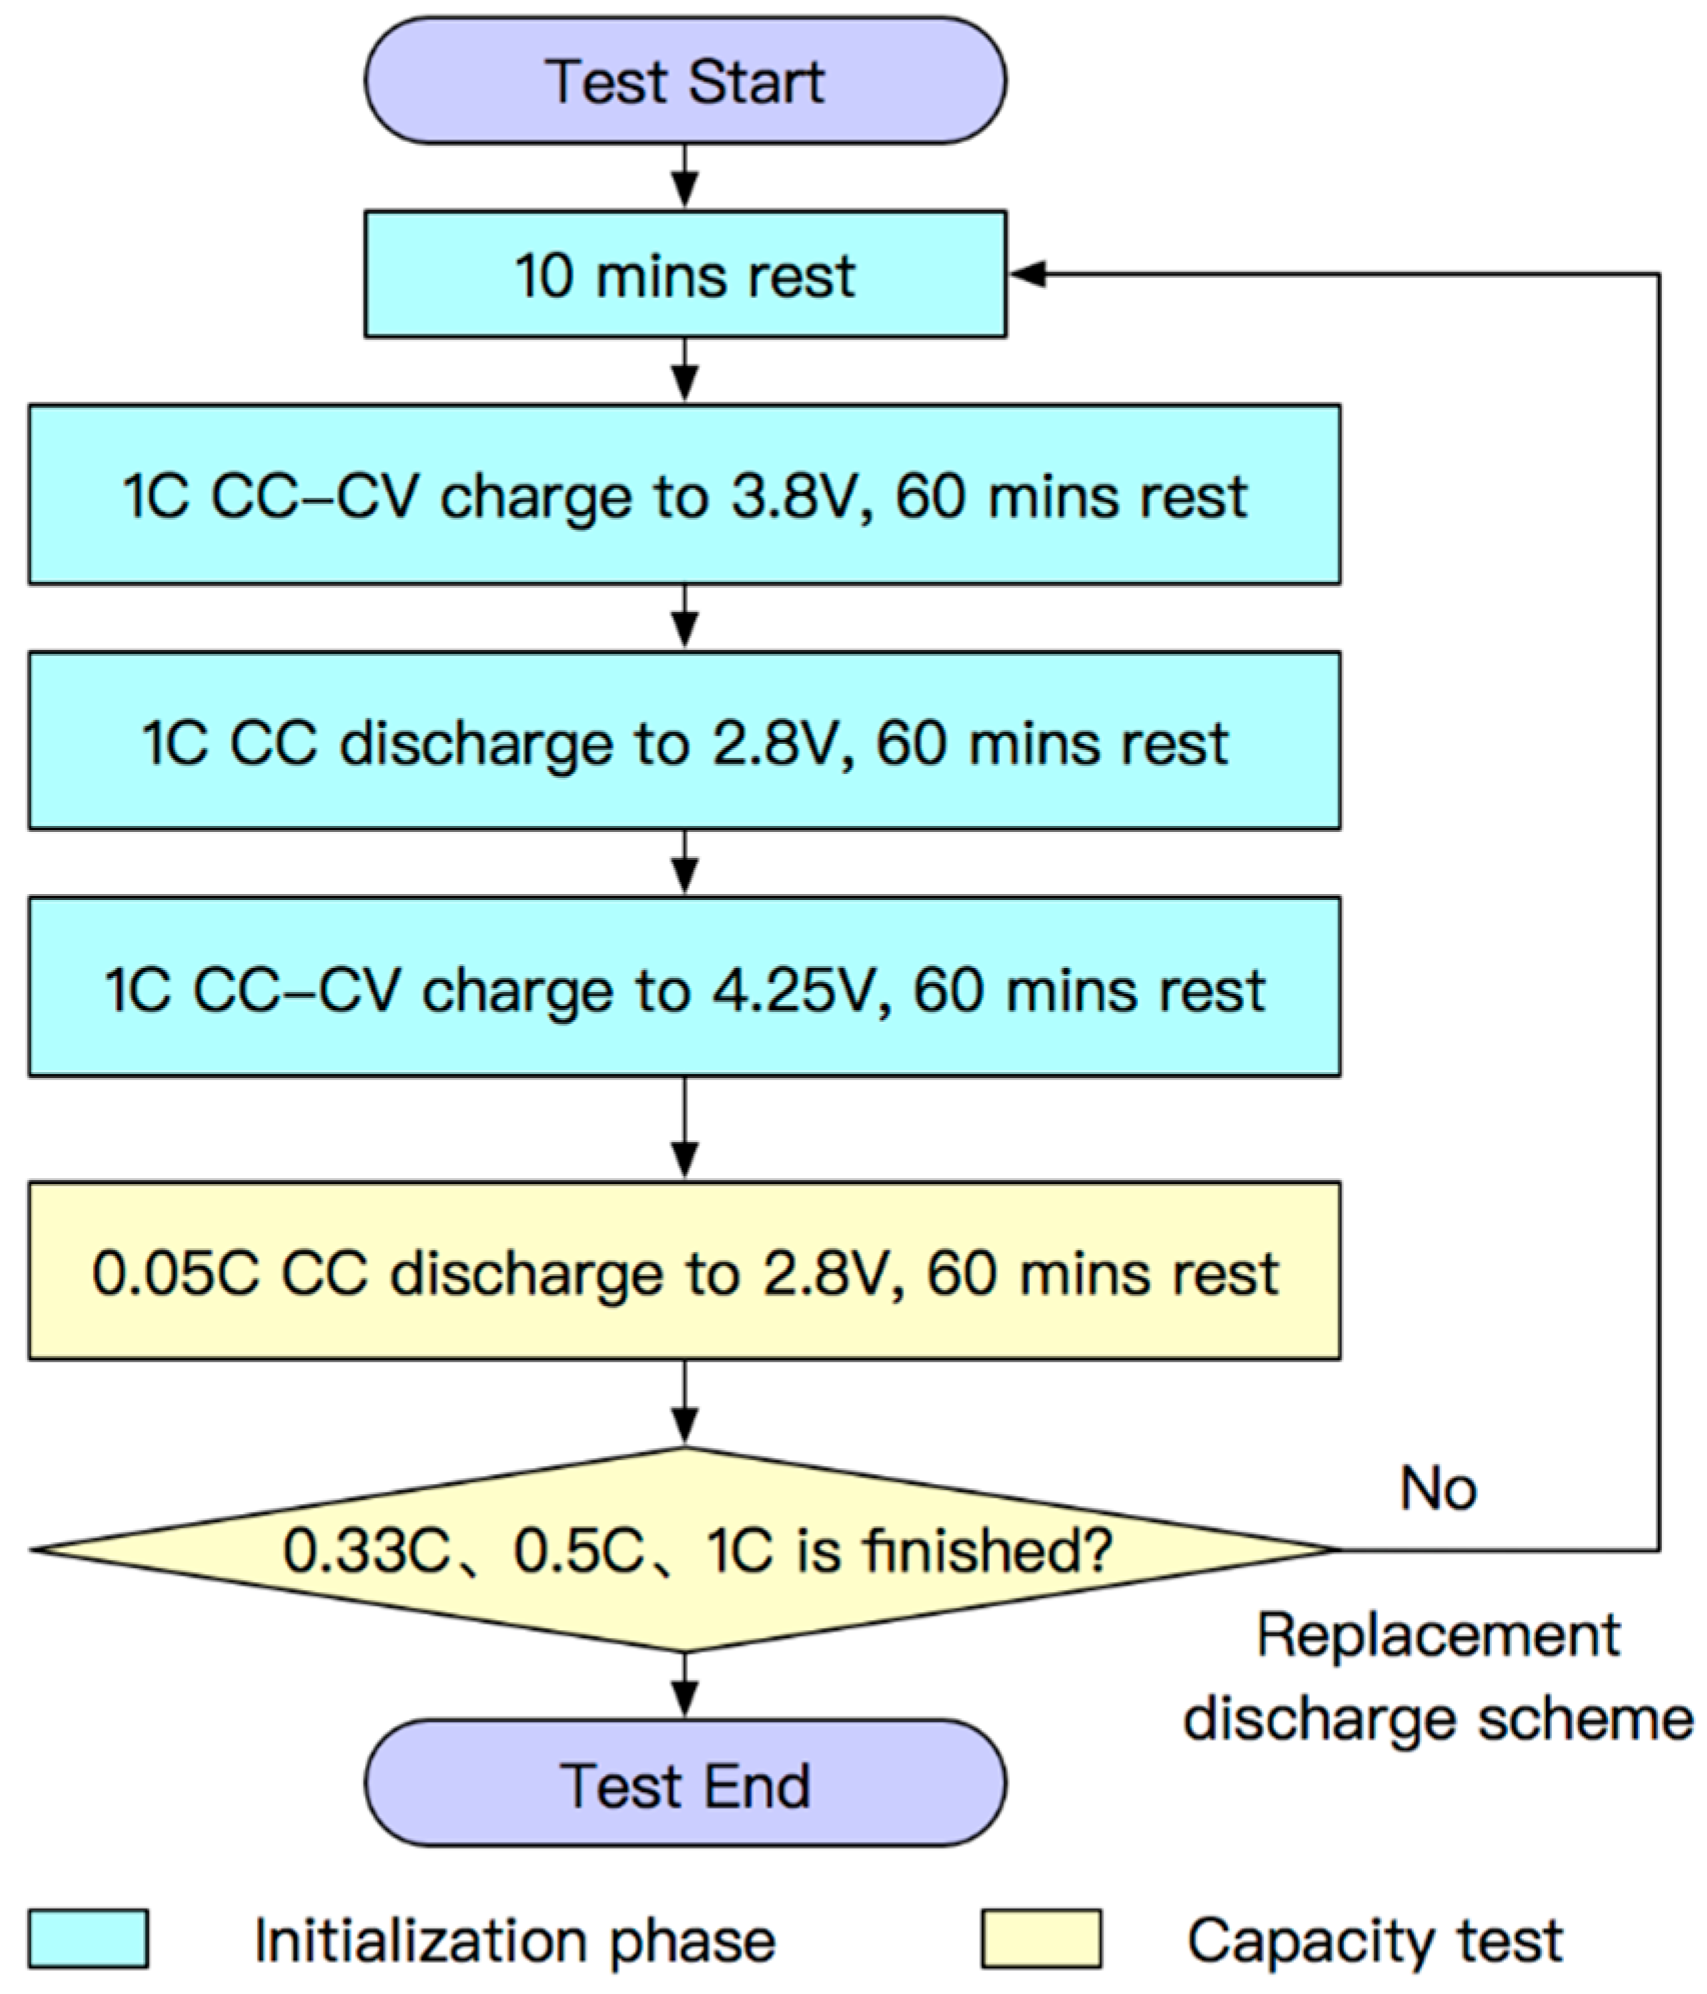
2.2.2. Static Capacity Test
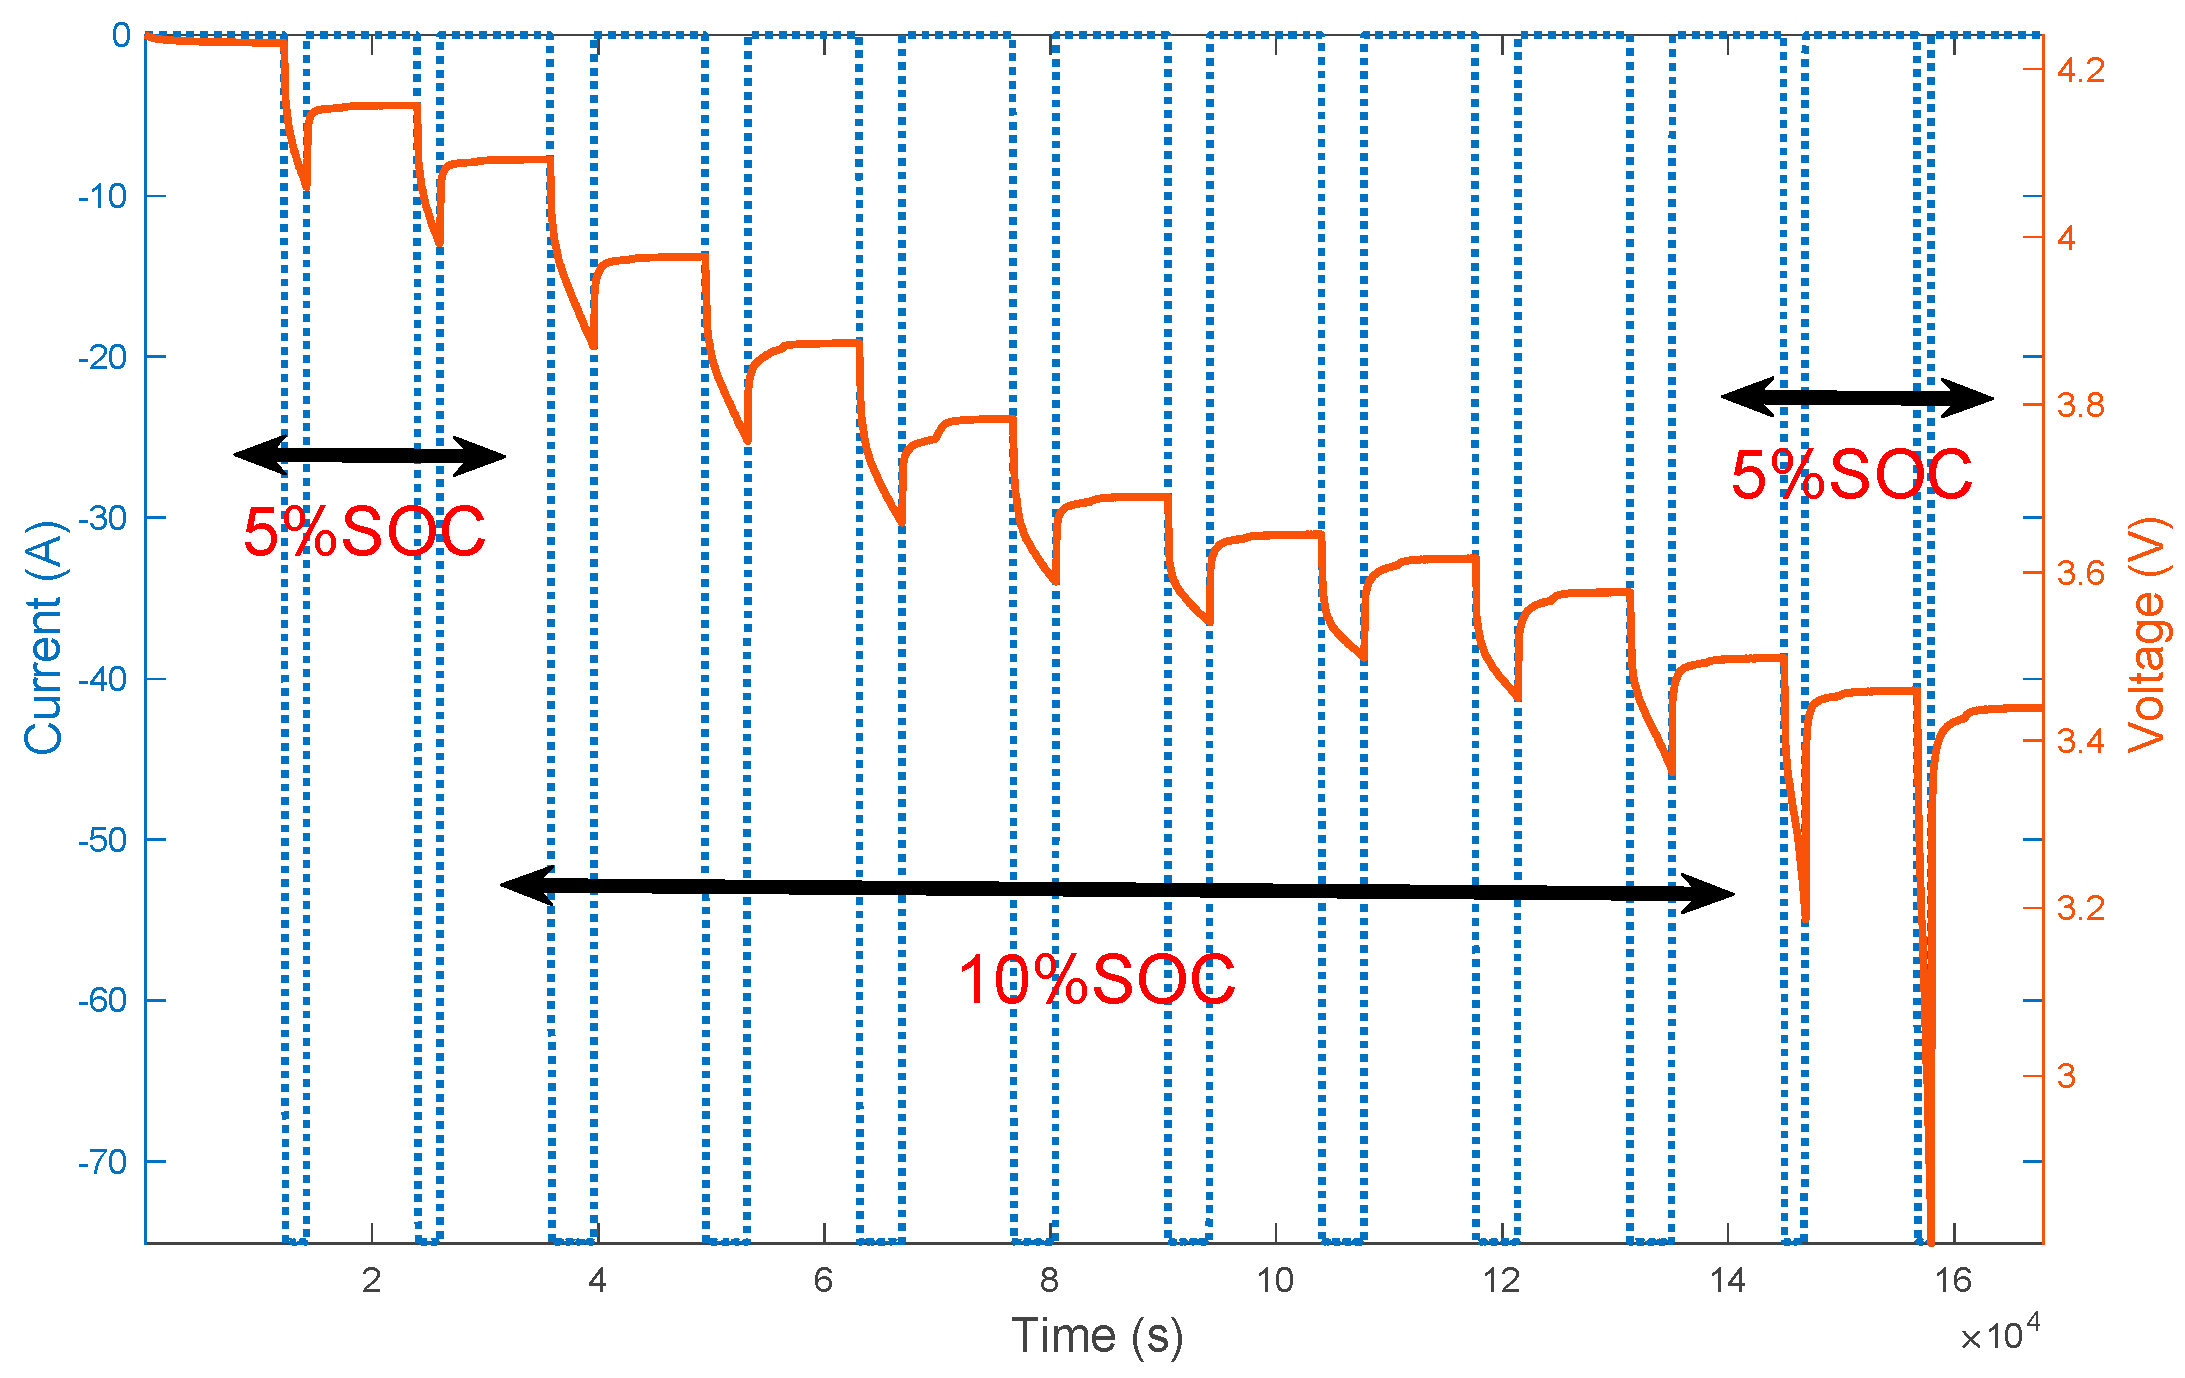
The battery capacity testing determines the battery cell capacity in Ampere-hours at a constant current (CC) discharge rate. The test procedure follows the constant current constant voltage (CC-CV) protocol and consists of the following steps [46].
The battery capacity test flow chart as shown in Figure 3. At first, we choose a new long relaxation period battery, install it and leave it for a 10 min’ relaxation period before discharging the battery cell. In the initialization phase, we charge the battery at 1 C rate (75 A) to 3.8 V, the fully charged state, using a constant current-constant voltage (CC-CV) mode under the specified temperature. The battery is fully charged to 3.8 V when the current reaches 1 mA. Then, we discharge the battery at 1 C rate (75 A) until the voltage reaches the battery minimum limit of 2.8 V, and rest for 60 min. Finally we charge the battery at 1 C rate (75 A) to 4.25 V the fully charged state using a CC-CV mode again. In the capacity test phase, take different measurements of the battery discharge capacity with 0.05 C, 0.33 C, 0.5 C and 1 C discharge rates. The test data is recorded every 20 s.

2.2.3. Pulse Test

The hybrid pulse power characterization (HPPC) test is a typical test method to conduct pulse tests. The pulse test is carried out in reference to the HPPC test. The pulse discharge test characterizes the battery cell voltage response (cell dynamics) at various SOCs and temperatures.
The test procedure is as follows: first, battery cells used the CC-CV charging protocol, a battery cell would be considered fully recharged to 100% SOC upon the completion of the charge regime and we leave them static for about one hour to reach the steady state; then, battery cells were discharged with constant current making sure to decrease SOC with 0.05 or 0.1, and we measure the OCV after one hour [47]. The data points in the range of 100~80% SOC and 20~0% SOC weres collected in 5% intervals; and, in the range of 80~20% SOC, at 80%, 70%, 50%, 30%, and 20%, respectively. During the battery test operation, the sampling time of current and voltage was 1 s. The battery ambient temperatures were set to −30 °C, −20 °C, −10 °C, 0 °C, 10 °C, 25 °C, 35 °C, 45 °C and 55 °C. The battery pulse test profile was as shown in Figure 4.

3. Results

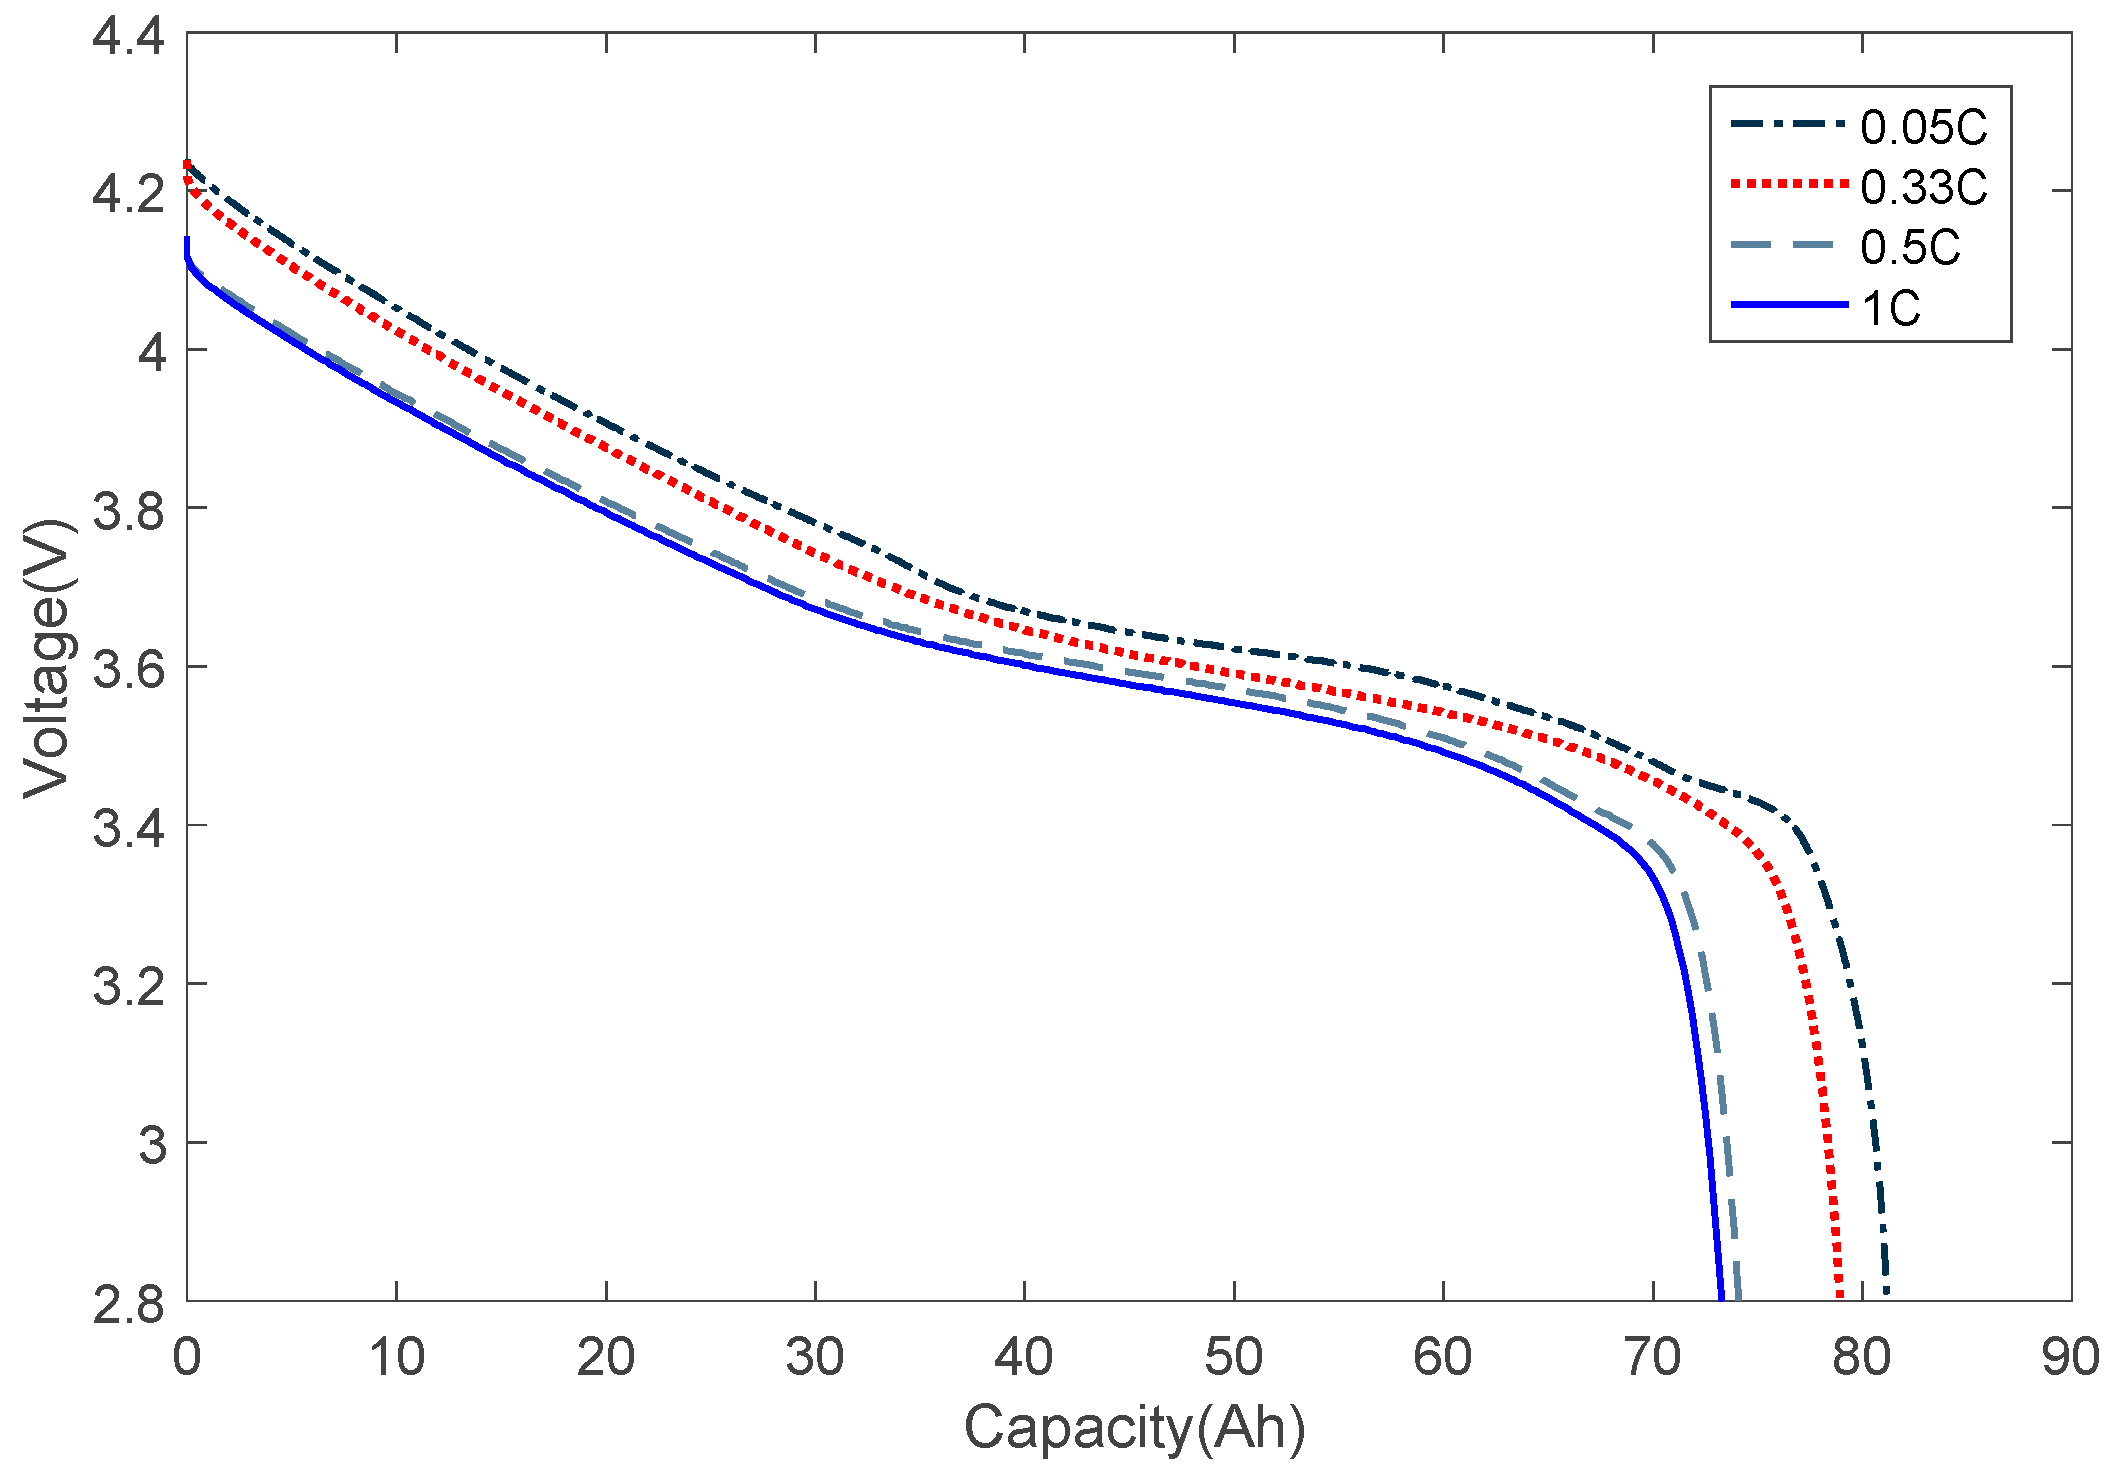
3.1. Battery Capacity

The accuracy of the battery rated capacity seriously influences the SOC estimation accuracy, which drives us to take different measurements of the battery discharge capacity with 0.05 C, 0.33 C, 0.5 C and 1 C discharge rates. The corresponding results are 73.3 Ah, 74.1 Ah, 78.9 Ah and 81.2 Ah, respectively. It is shown that the battery discharge capacity at higher rates is lower than that at low rates and it is different from the nominal value. The battery discharge capacity under different discharge rate as shown in Table 2. The discharge voltage curve at different C rate as shown in Figure 5. Due to the inconsistencies of the battery in the manufacturing and production process, and different battery charge-discharge rate will also affect the capacity of the battery. Besides, different battery cell capacity definitions and the value used for the SOC estimation will also lead to certain errors. Therefore, it is necessary to consider this phenomenon.
The amount of lithium ions released is affected by current (C-rate) factors. First of all, a high current will inevitably bring about polarization phenomena, and the direct impact is that the kinetic performance of diffusion is reduced, secondly, high current will bring about a reduction in the effective release time, because the larger the rate of charge and the less the discharge time is, then the effective diffusion distance is also affected to a certain extent. Therefore, the capacity of batteries under large current or large C-rate will be reduced.
The maximum discharge capacities under specified ambient temperatures as shown in Table 3. The correlation between battery capacity and temperature is shown in Figure 6. It is shown that the battery maximum discharge capacity at higher ambient temperature is higher than that at low ambient temperature. These changes in battery capacity need to be considered in SOC estimation.

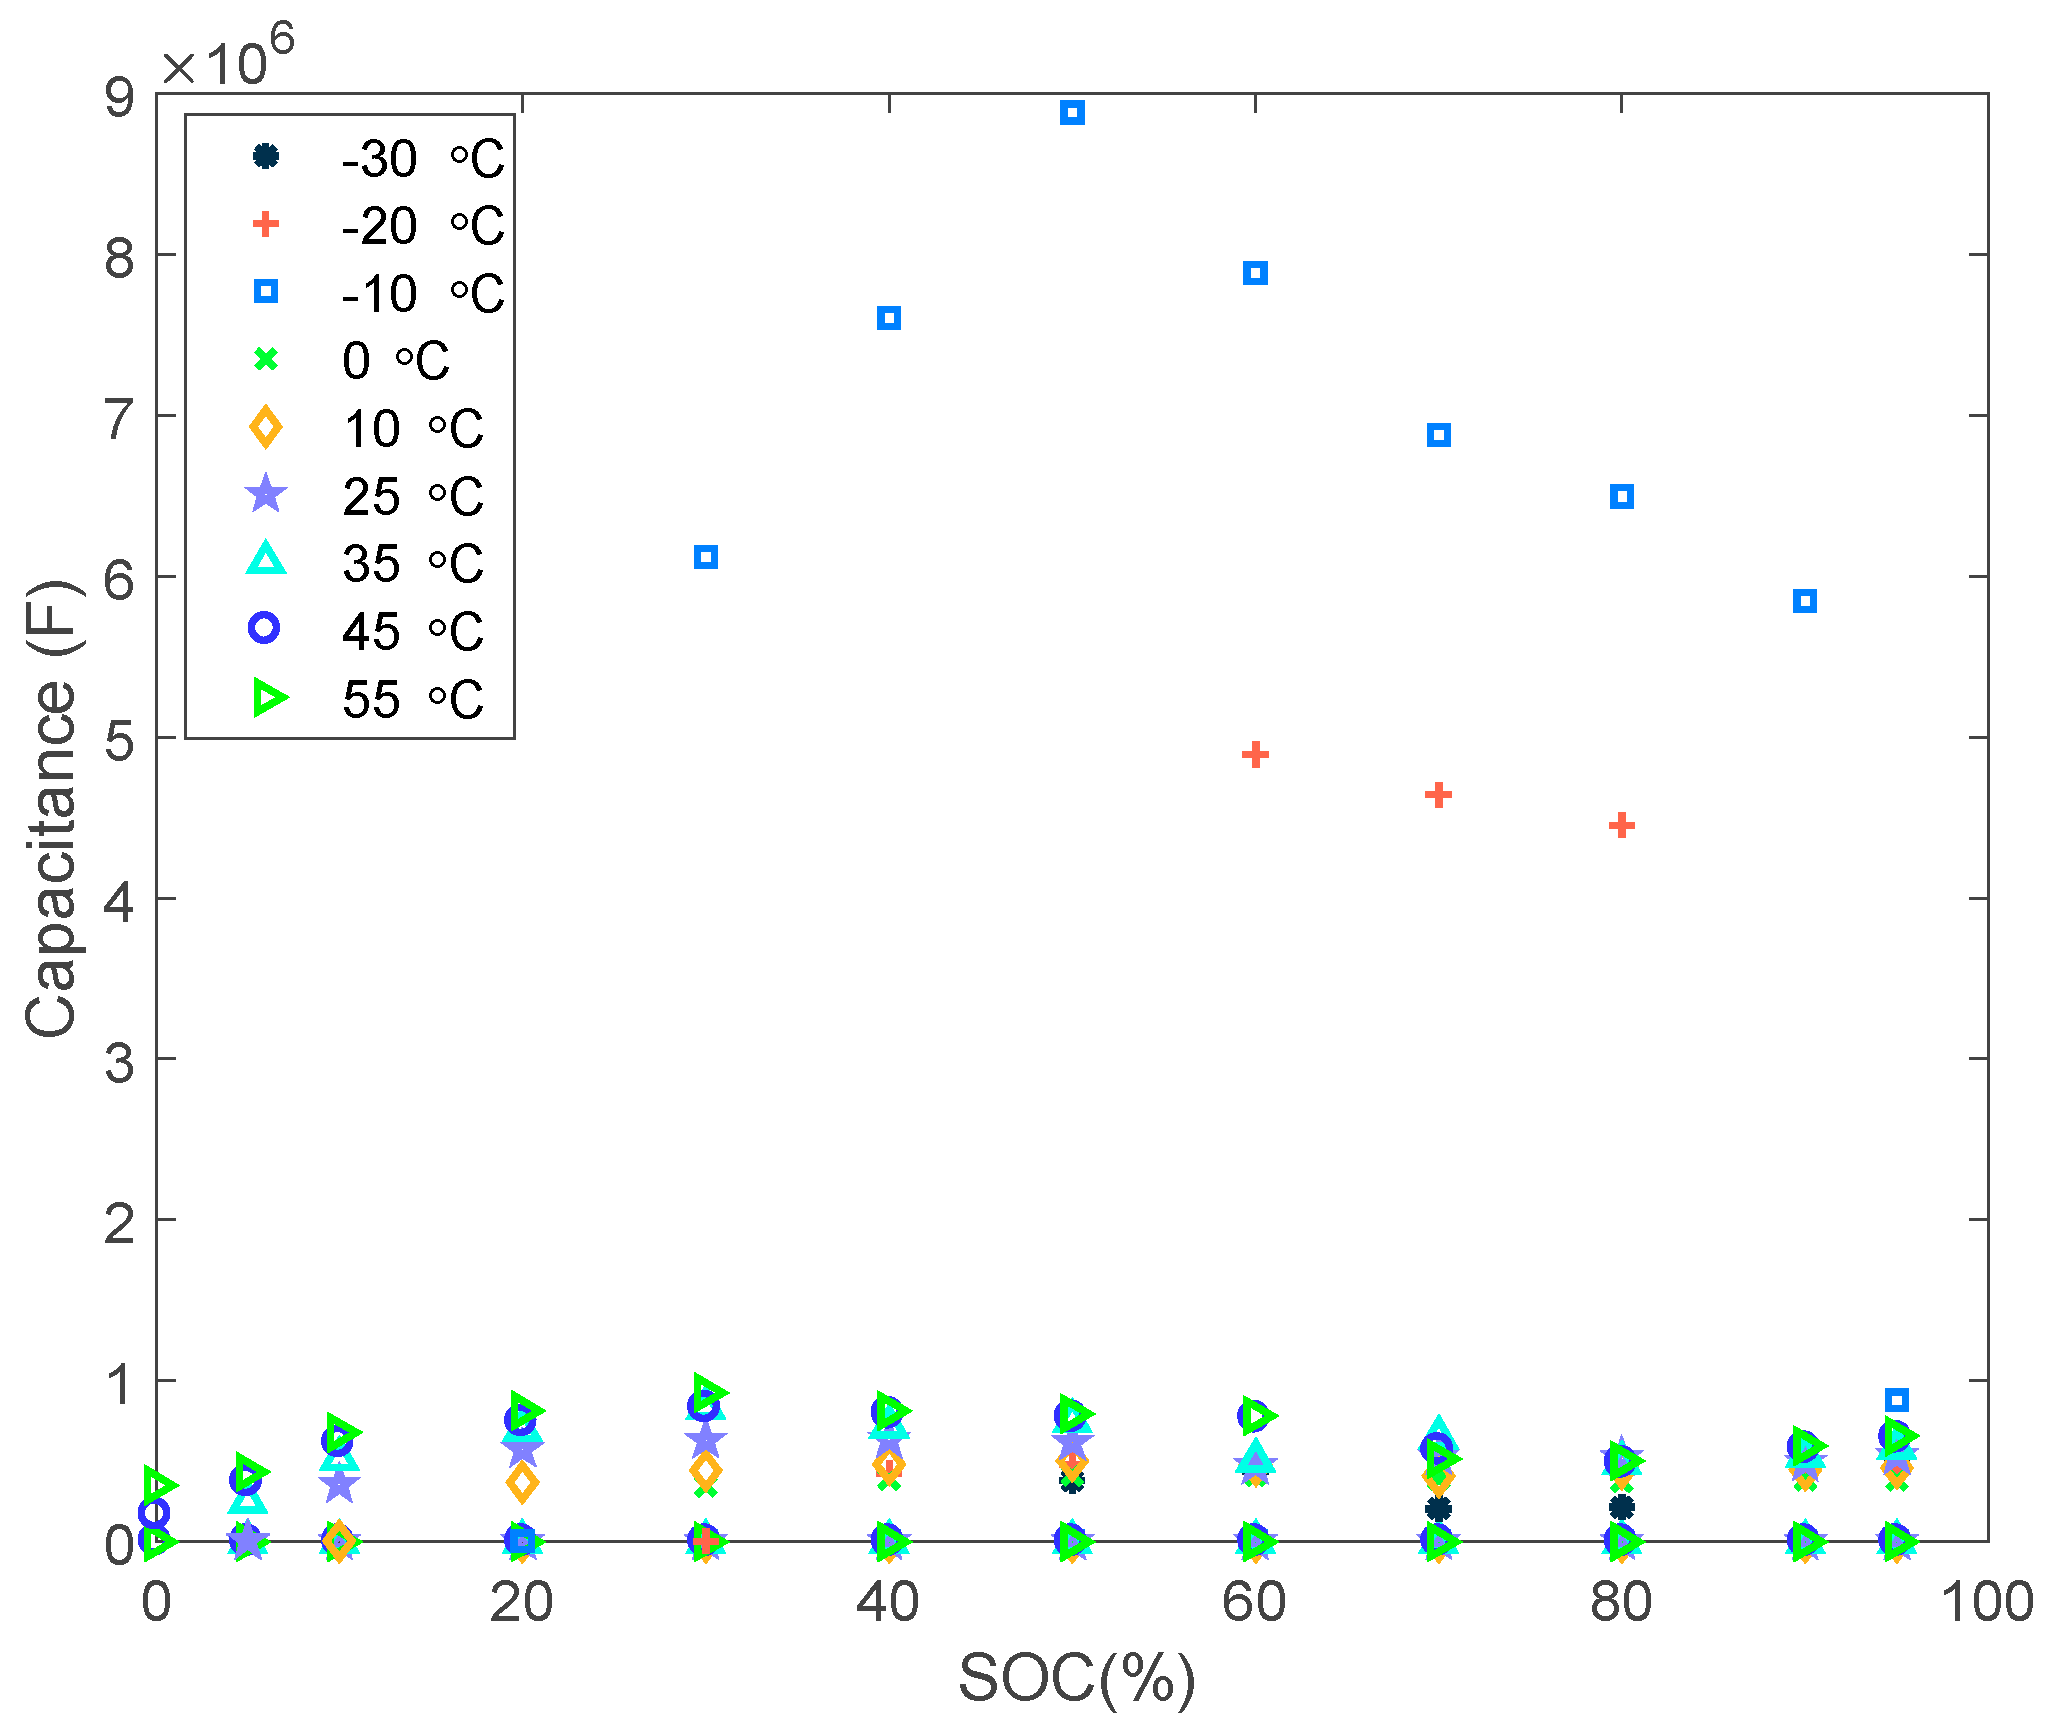
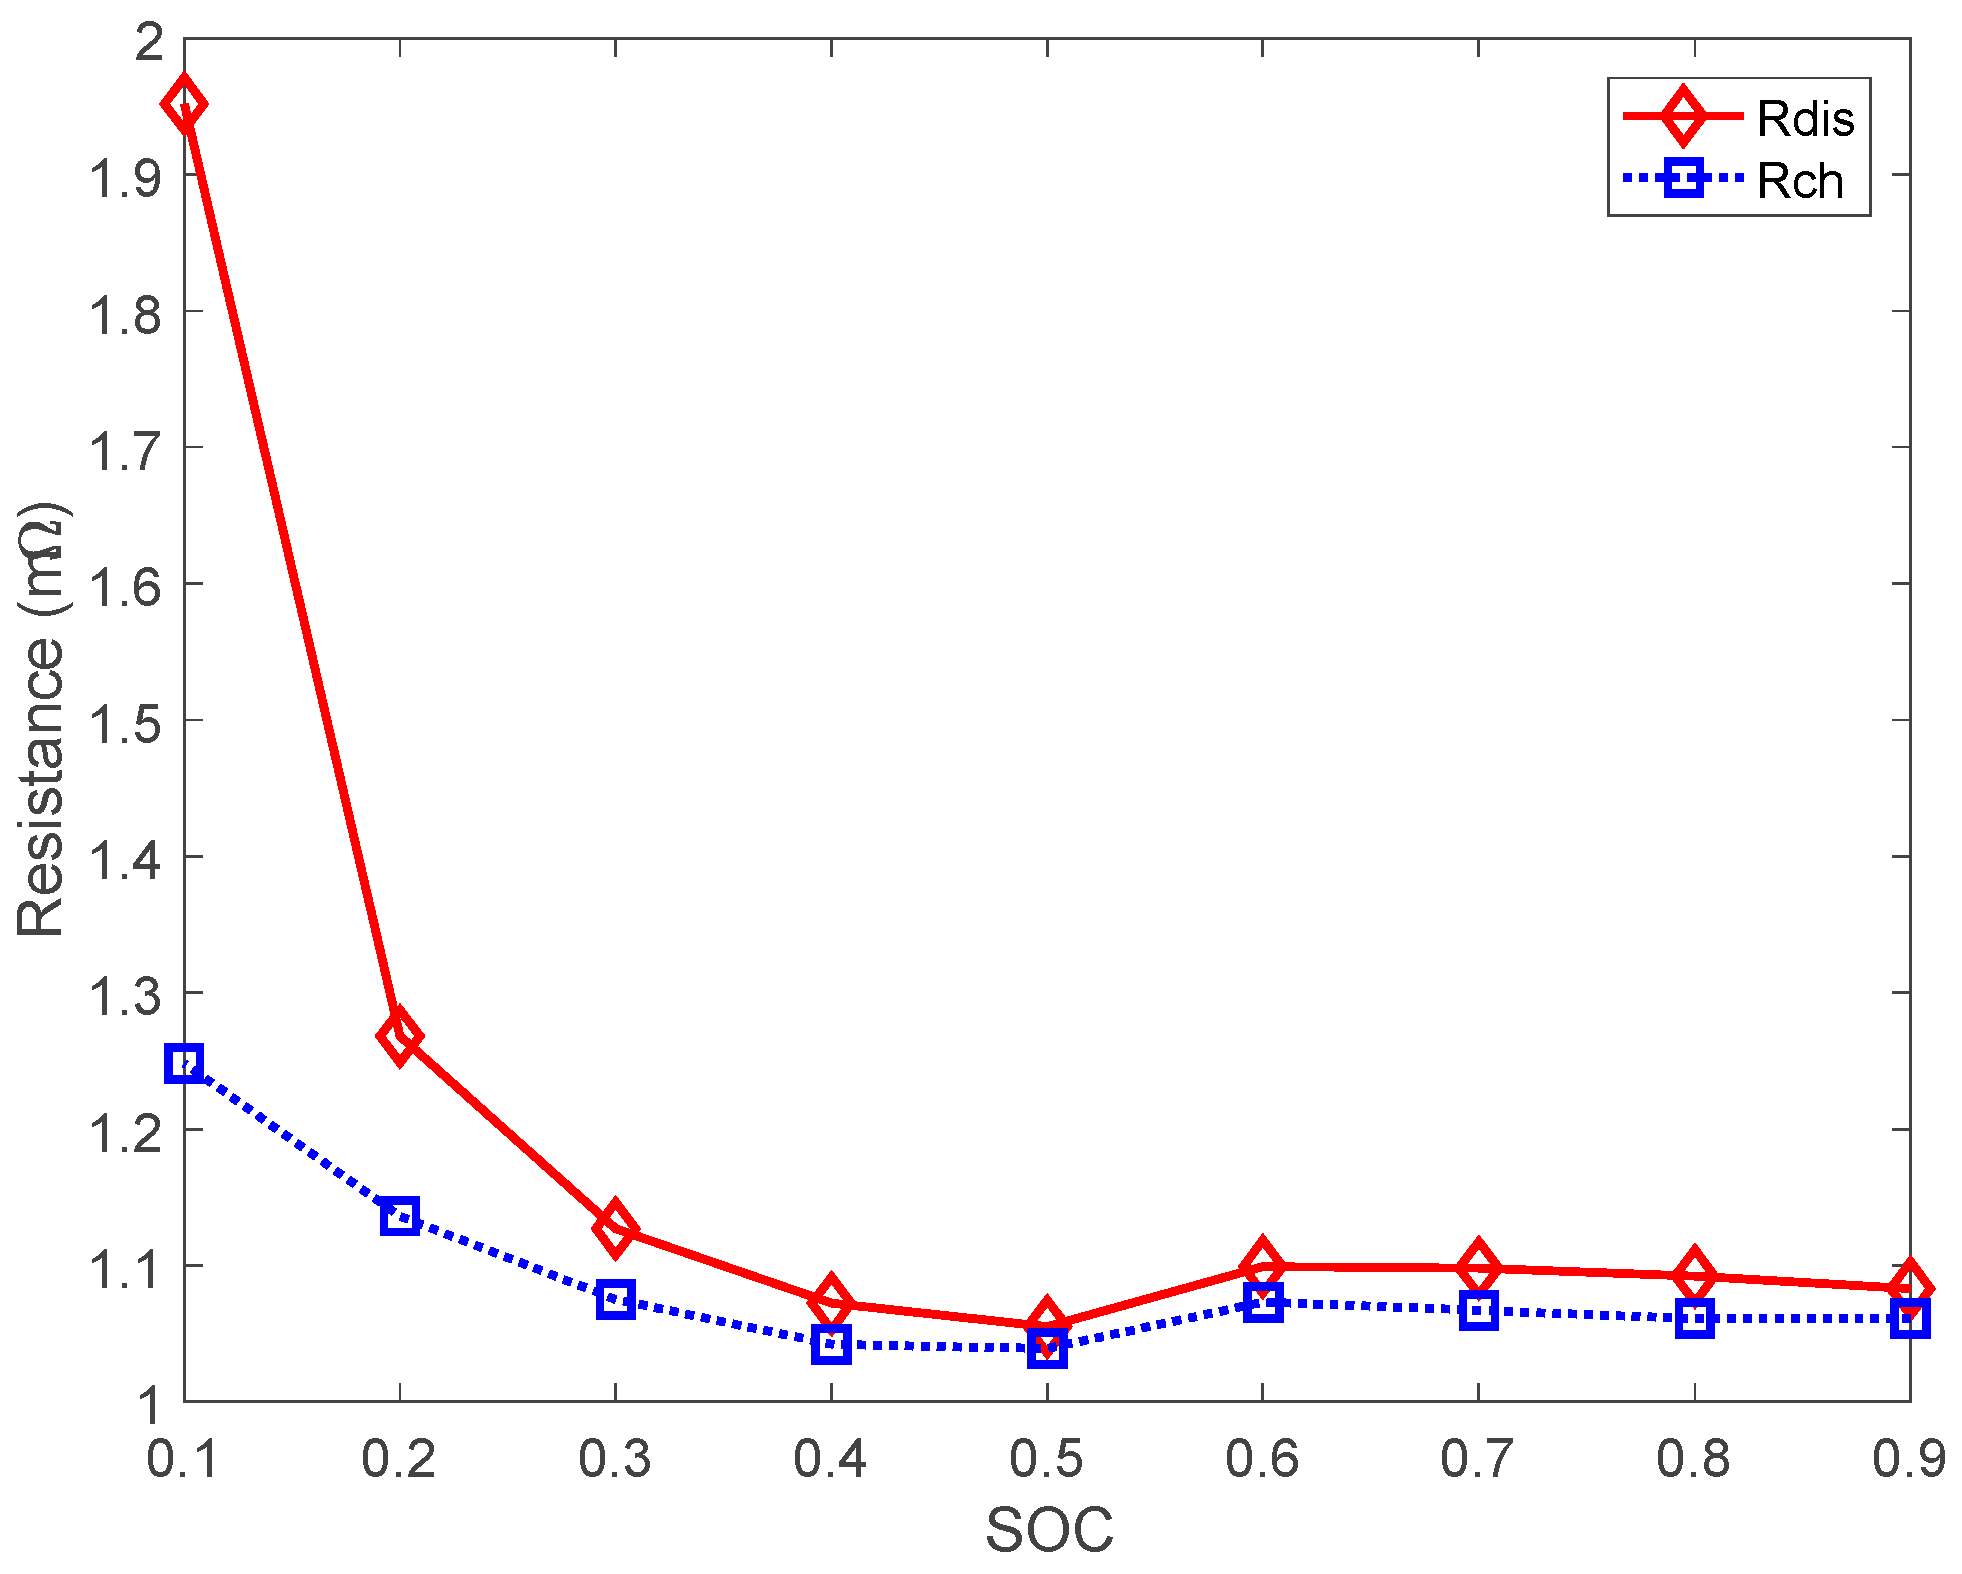
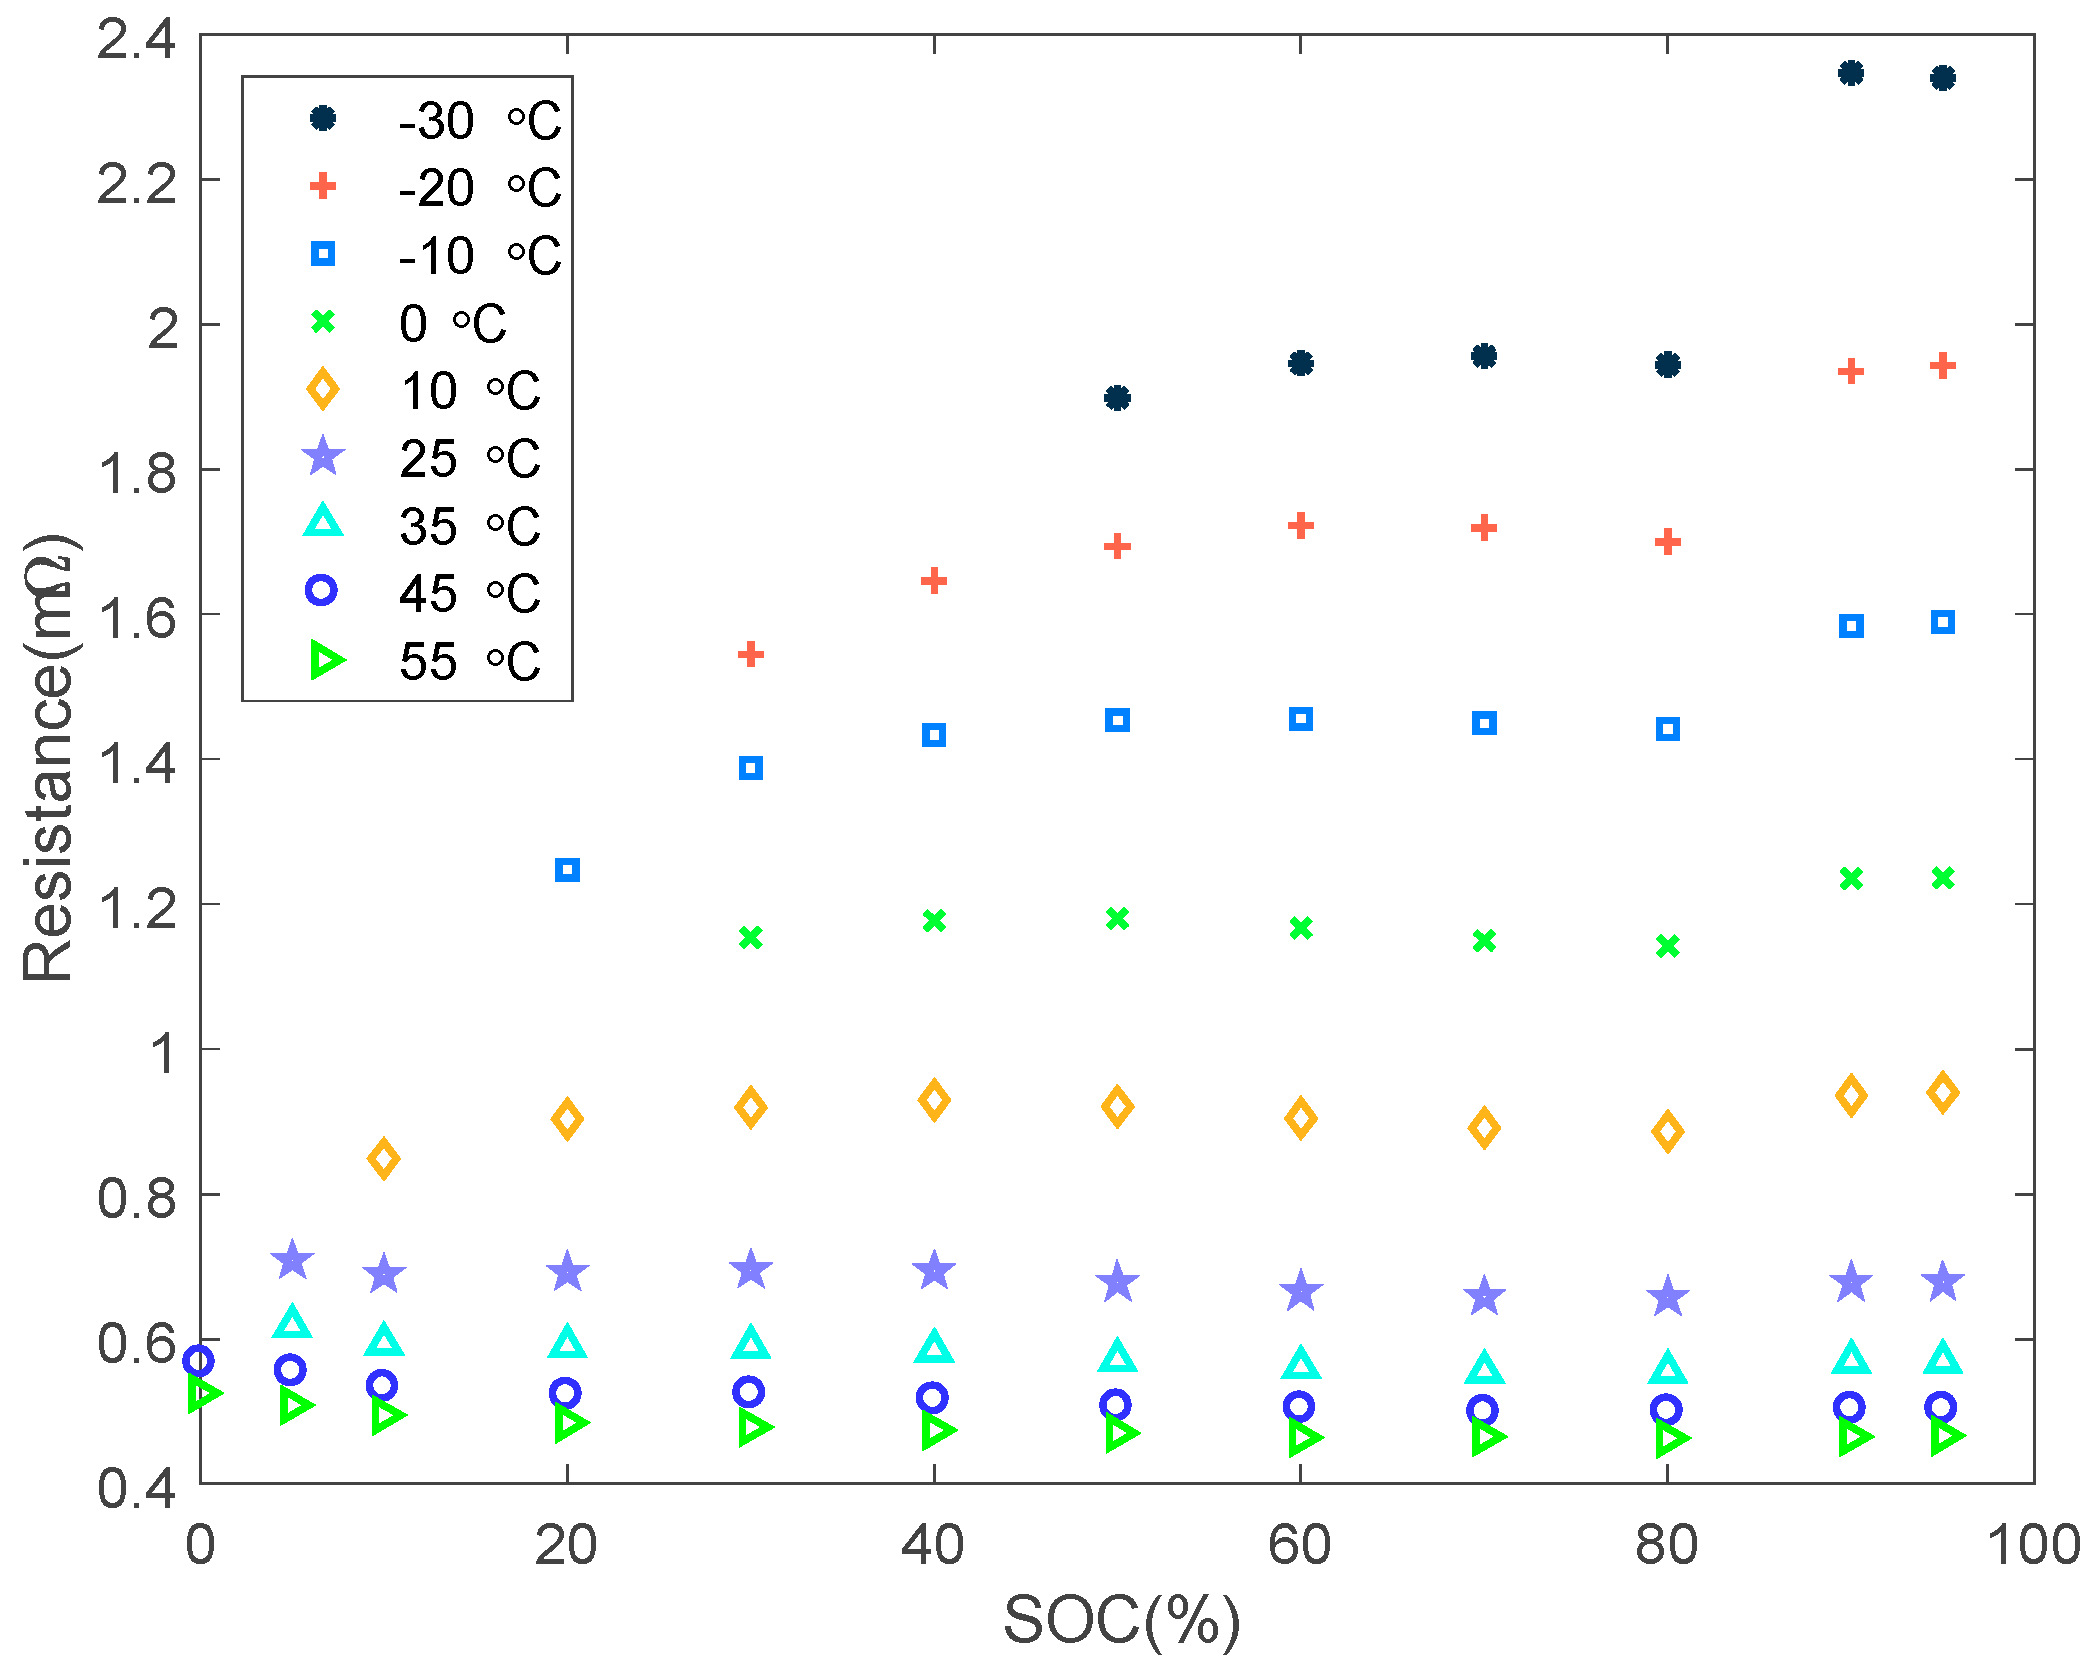
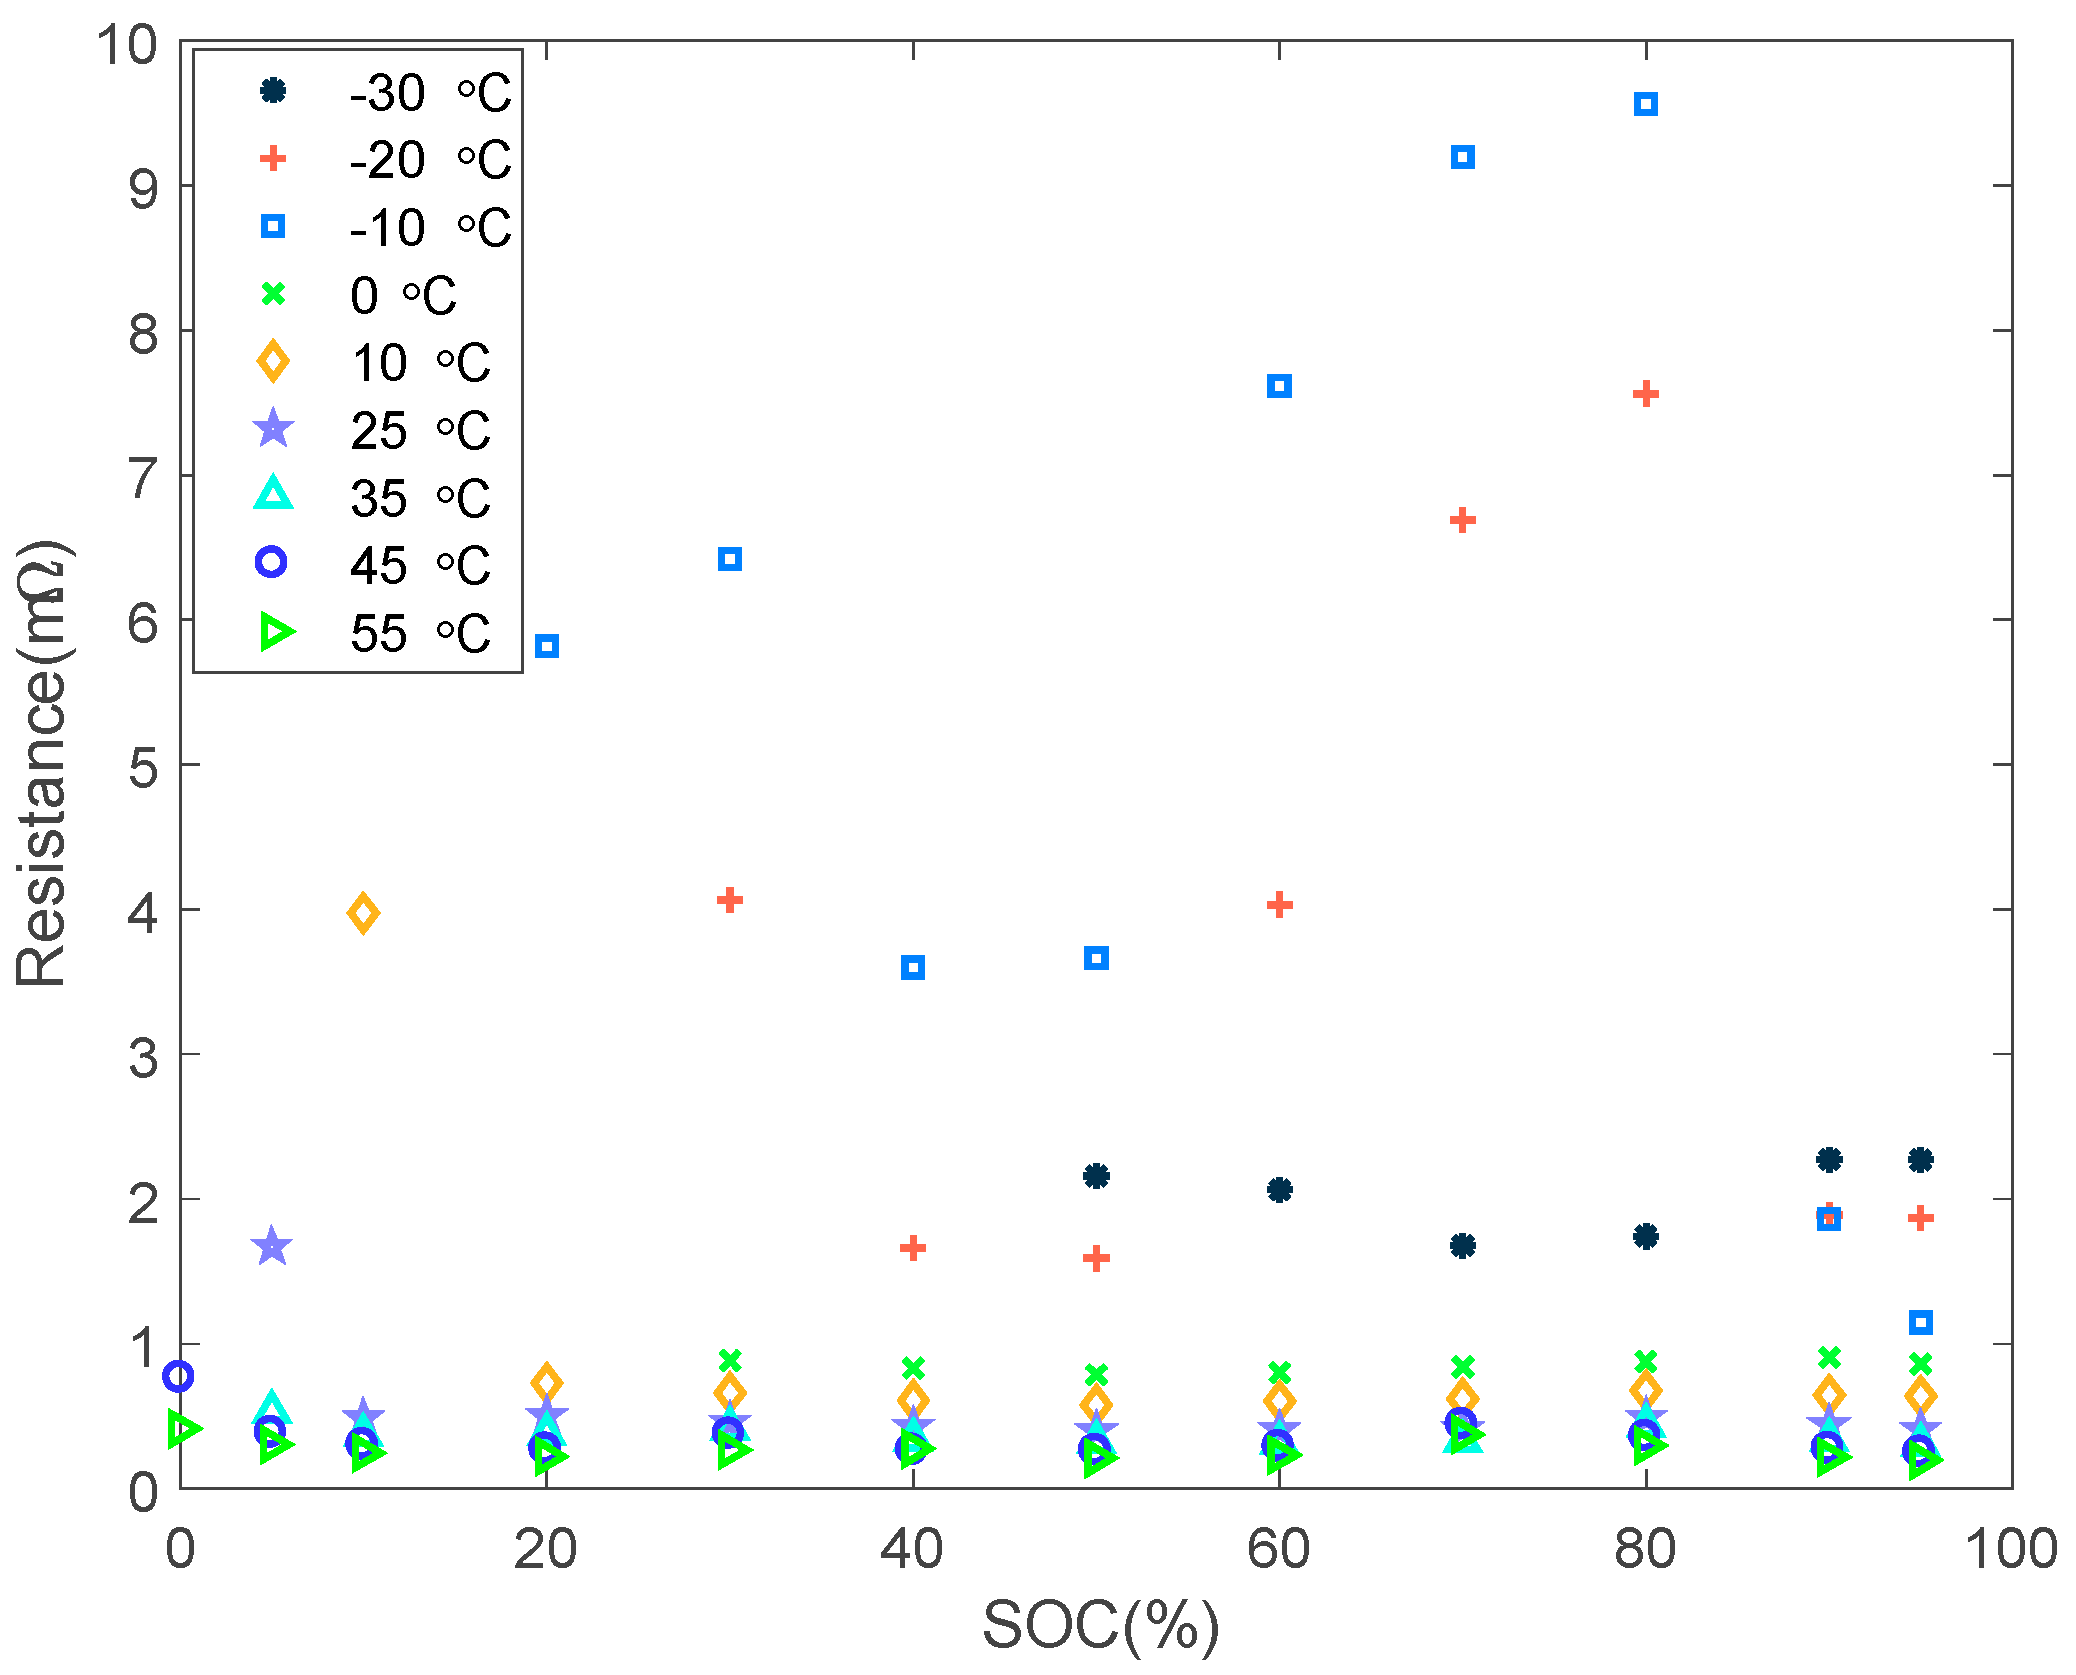
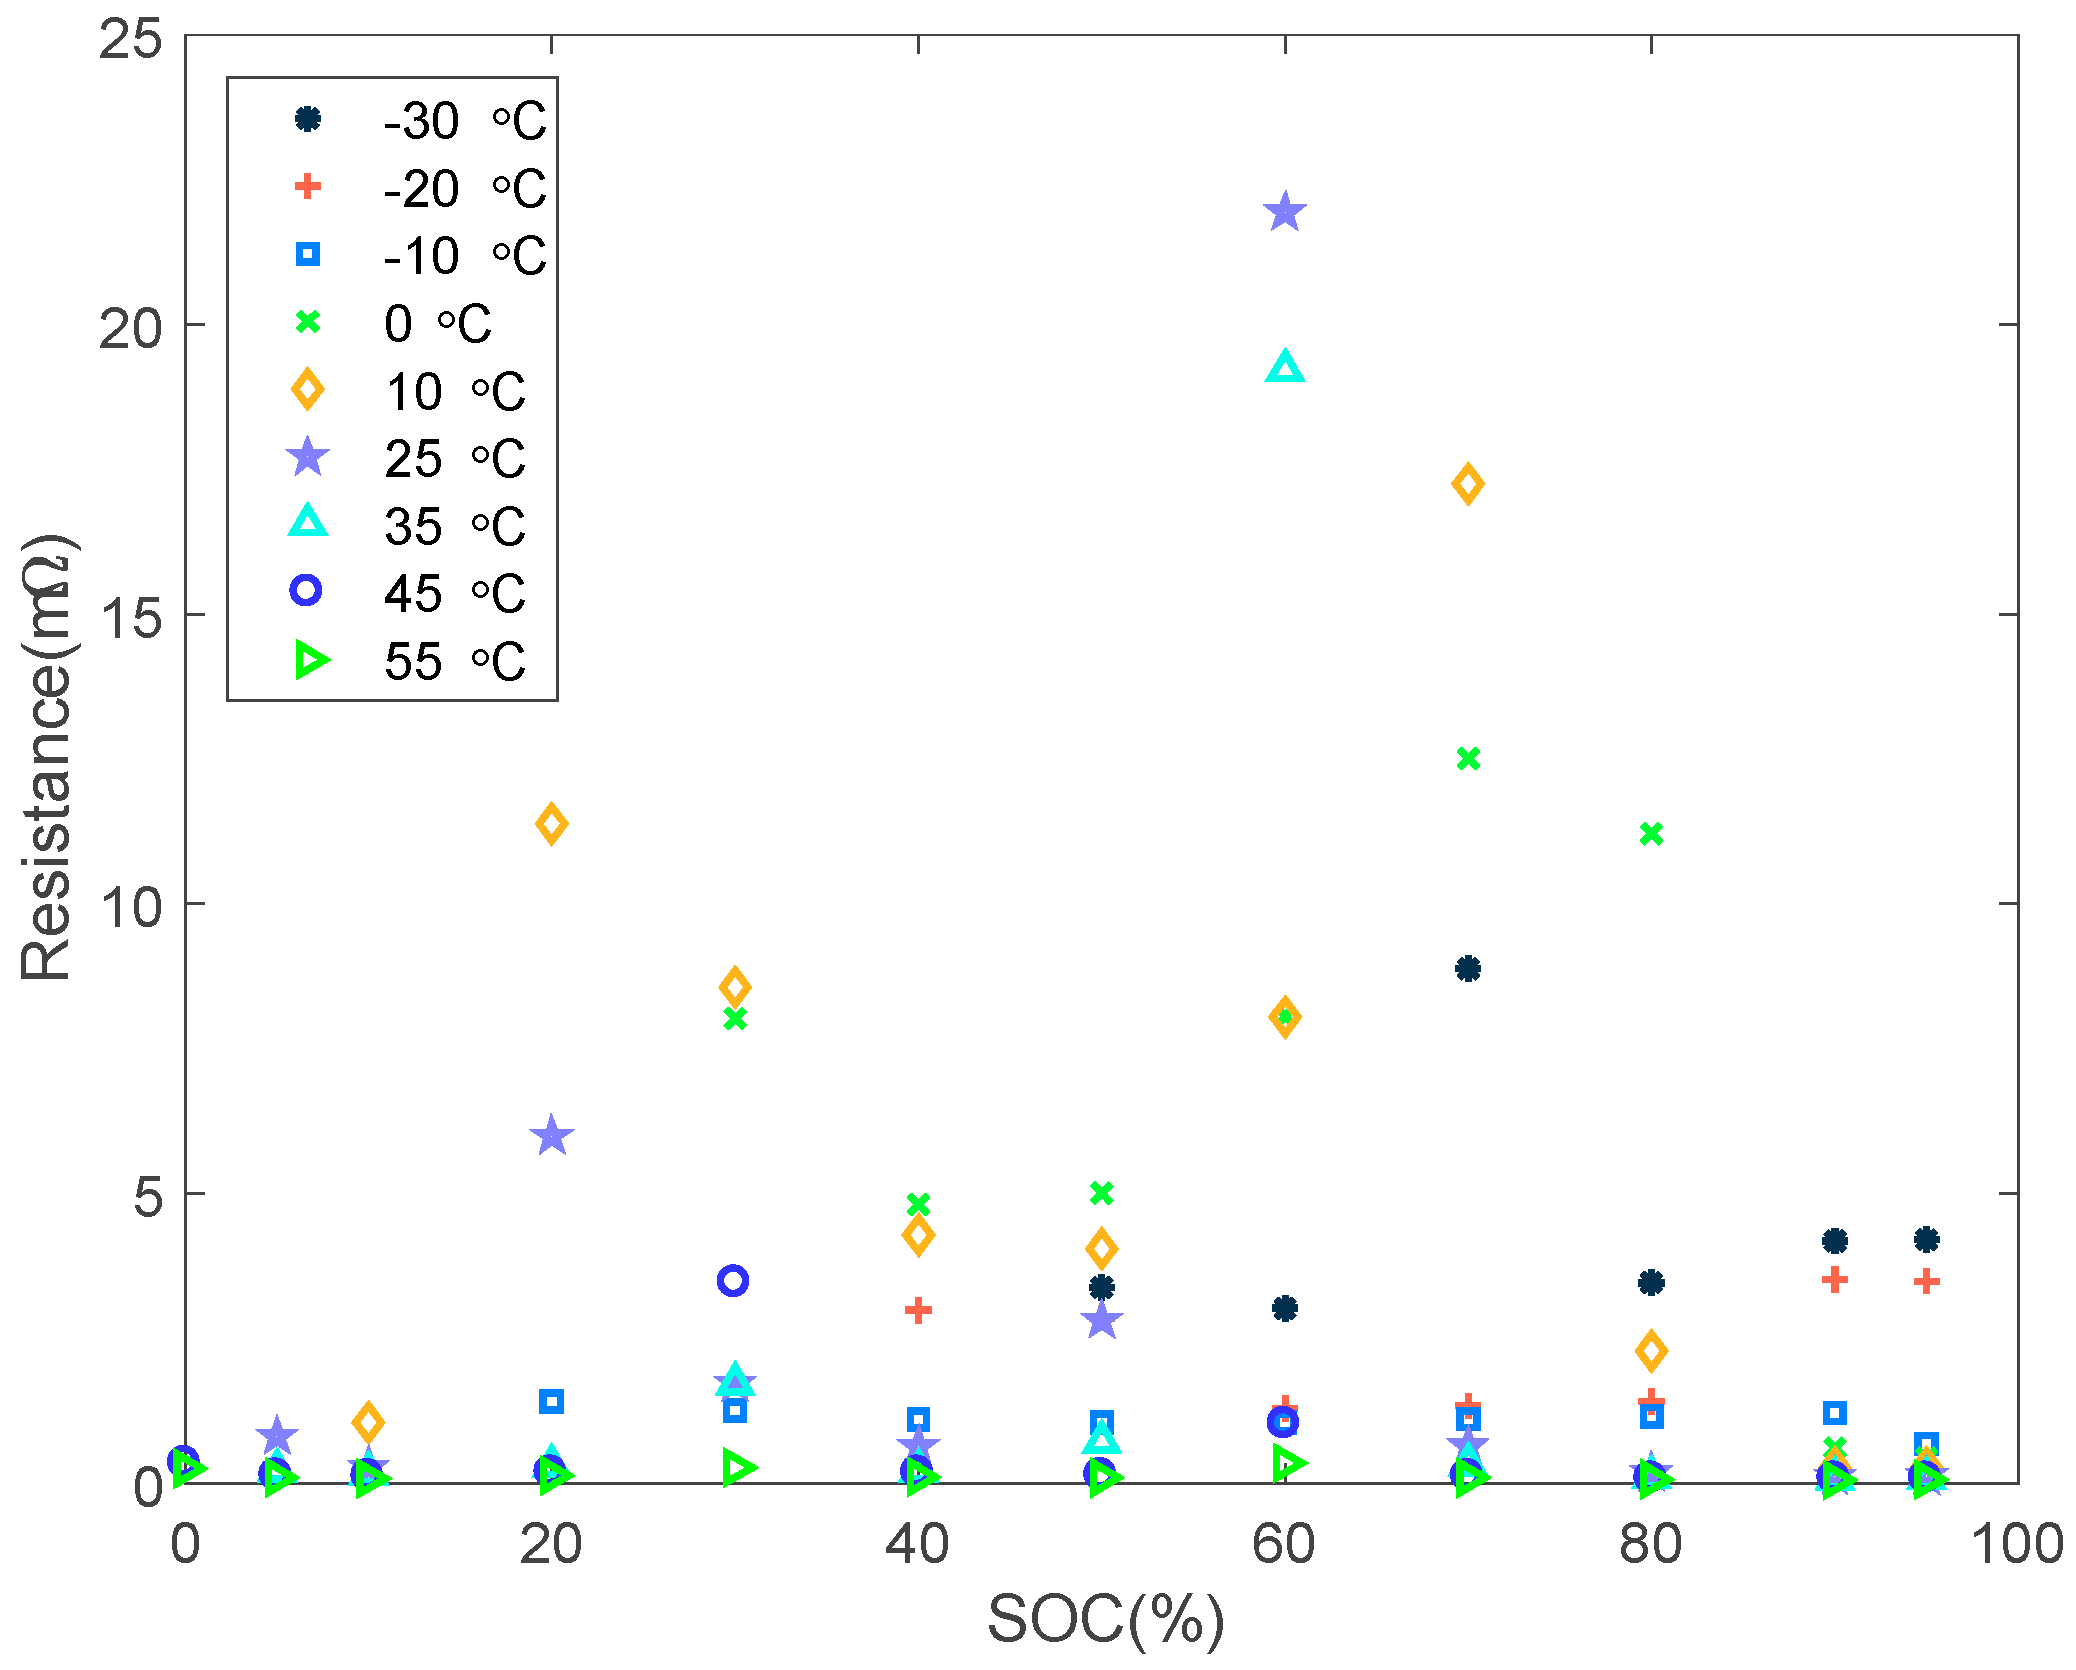
3.2. Battery Internal Resistance

Estimation based on internal resistance can be considered as a special case based on impedance estimation. Battery direct current (DC) internal resistance battery is usually defined as the ratio of voltage and current variation, which can represent the capacity and a special state of the battery in DC. But the value of estimated resistance may have error in the long sample time, so that a small interval less than 10 ms is needed to capture the Ohmic effect. Besides, the internal resistance changes slightly with a wide range of SOC which is difficult to observe [48].
The battery charge/discharge direct current internal resistance at room temperature is shown in Figure 7. From Figure 7, when SOC is low, the battery has a high internal resistance which maximum is about twice higher than in high SOC interval in discharge. This is because the activity of chemicals inside the battery decreases at the end of the battery discharge.
The experiment under 3 C pulse discharge 10 s is also carried out in this paper. The internal resistance value of the battery under the discharge of 3 C is shown in Table 4. The table shows the internal resistance of the battery under different SOC and different temperature conditions. Under the condition of high temperature, the internal resistance of the battery cell is relatively small. However, there are dozens of differences between high temperature and low temperature resistance.
The parameters of the two order RC model are identified by using pulse recovery curve and off-line parameter identification method. The parameter identification results of 2RC battery model identification under the different temperatures are shown in Figure 8, Figure 9, Figure 10, Figure 11 and Figure 12.

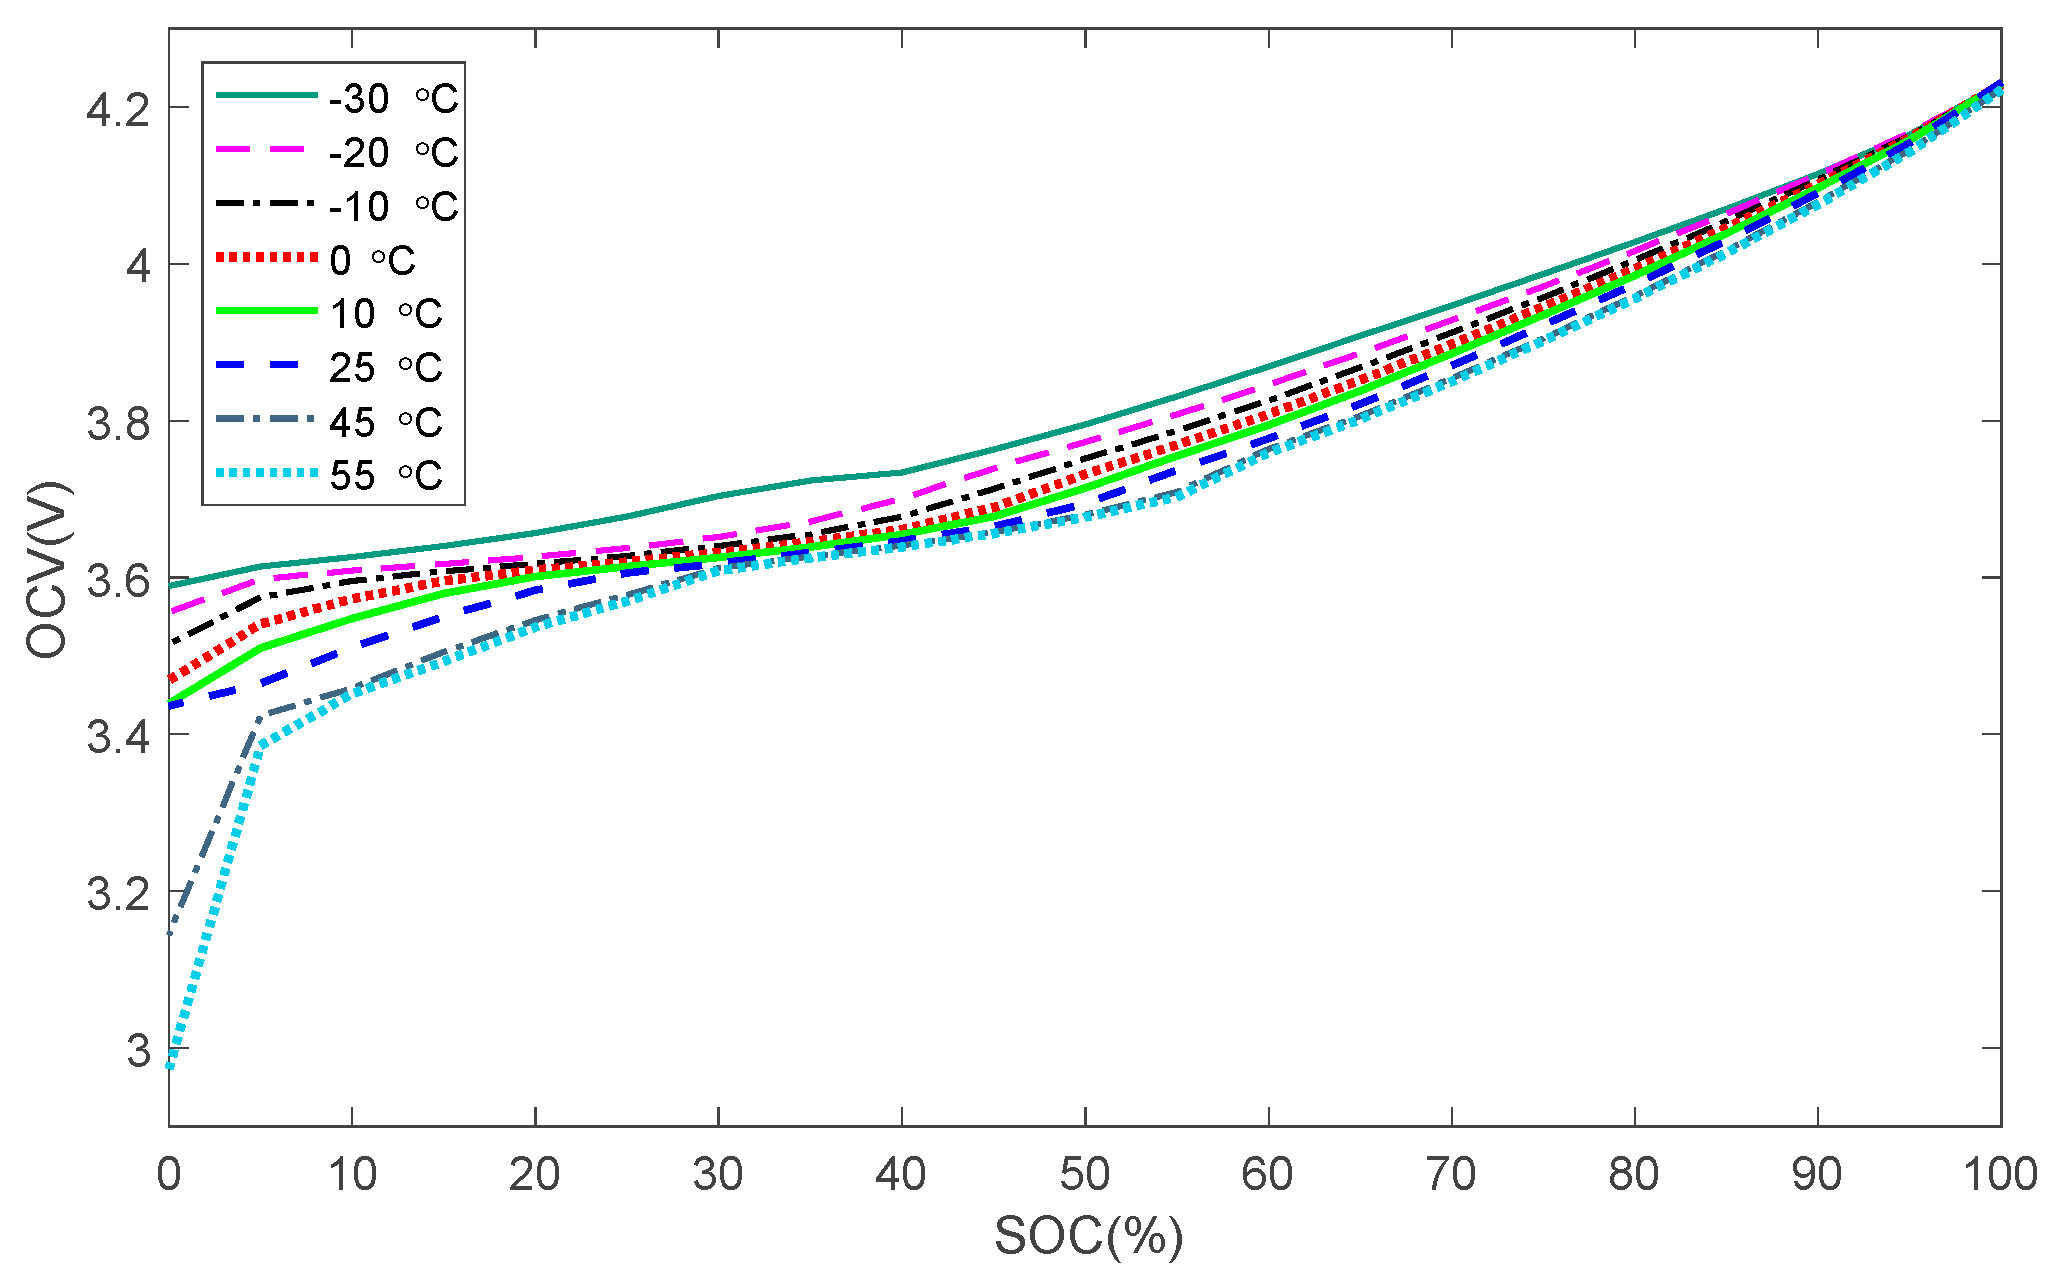
3.3. OCV-SOC Relationship

Open-circuit voltage is used to correct the estimated SOC, the SOC-OCV relationship could be very important not only in OCV-based estimation but also in model-based estimations [49]. For the battery discharge data, the battery SOC-OCV relationship at different temperatures as shown in Figure 13. The OCV-SOC function is very different, especially when the influence of severe environmental temperature changes.
Achieving an accurate OCV is the key issue for model-based estimation. The relationship depends on the battery capacity and material. For the obtained the OCV-SOC curve, we can fit the OCV-SOC curve with the OCV and SOC points, the OCV-SOC function can be determined by:
  U o c   ( s ) = a 1 s n + a 2 s n 1 + + a n s + a n + 1
where a n is the parameters to fit the relationship between the OCV and the SOC. s denotes the SOC of the battery.

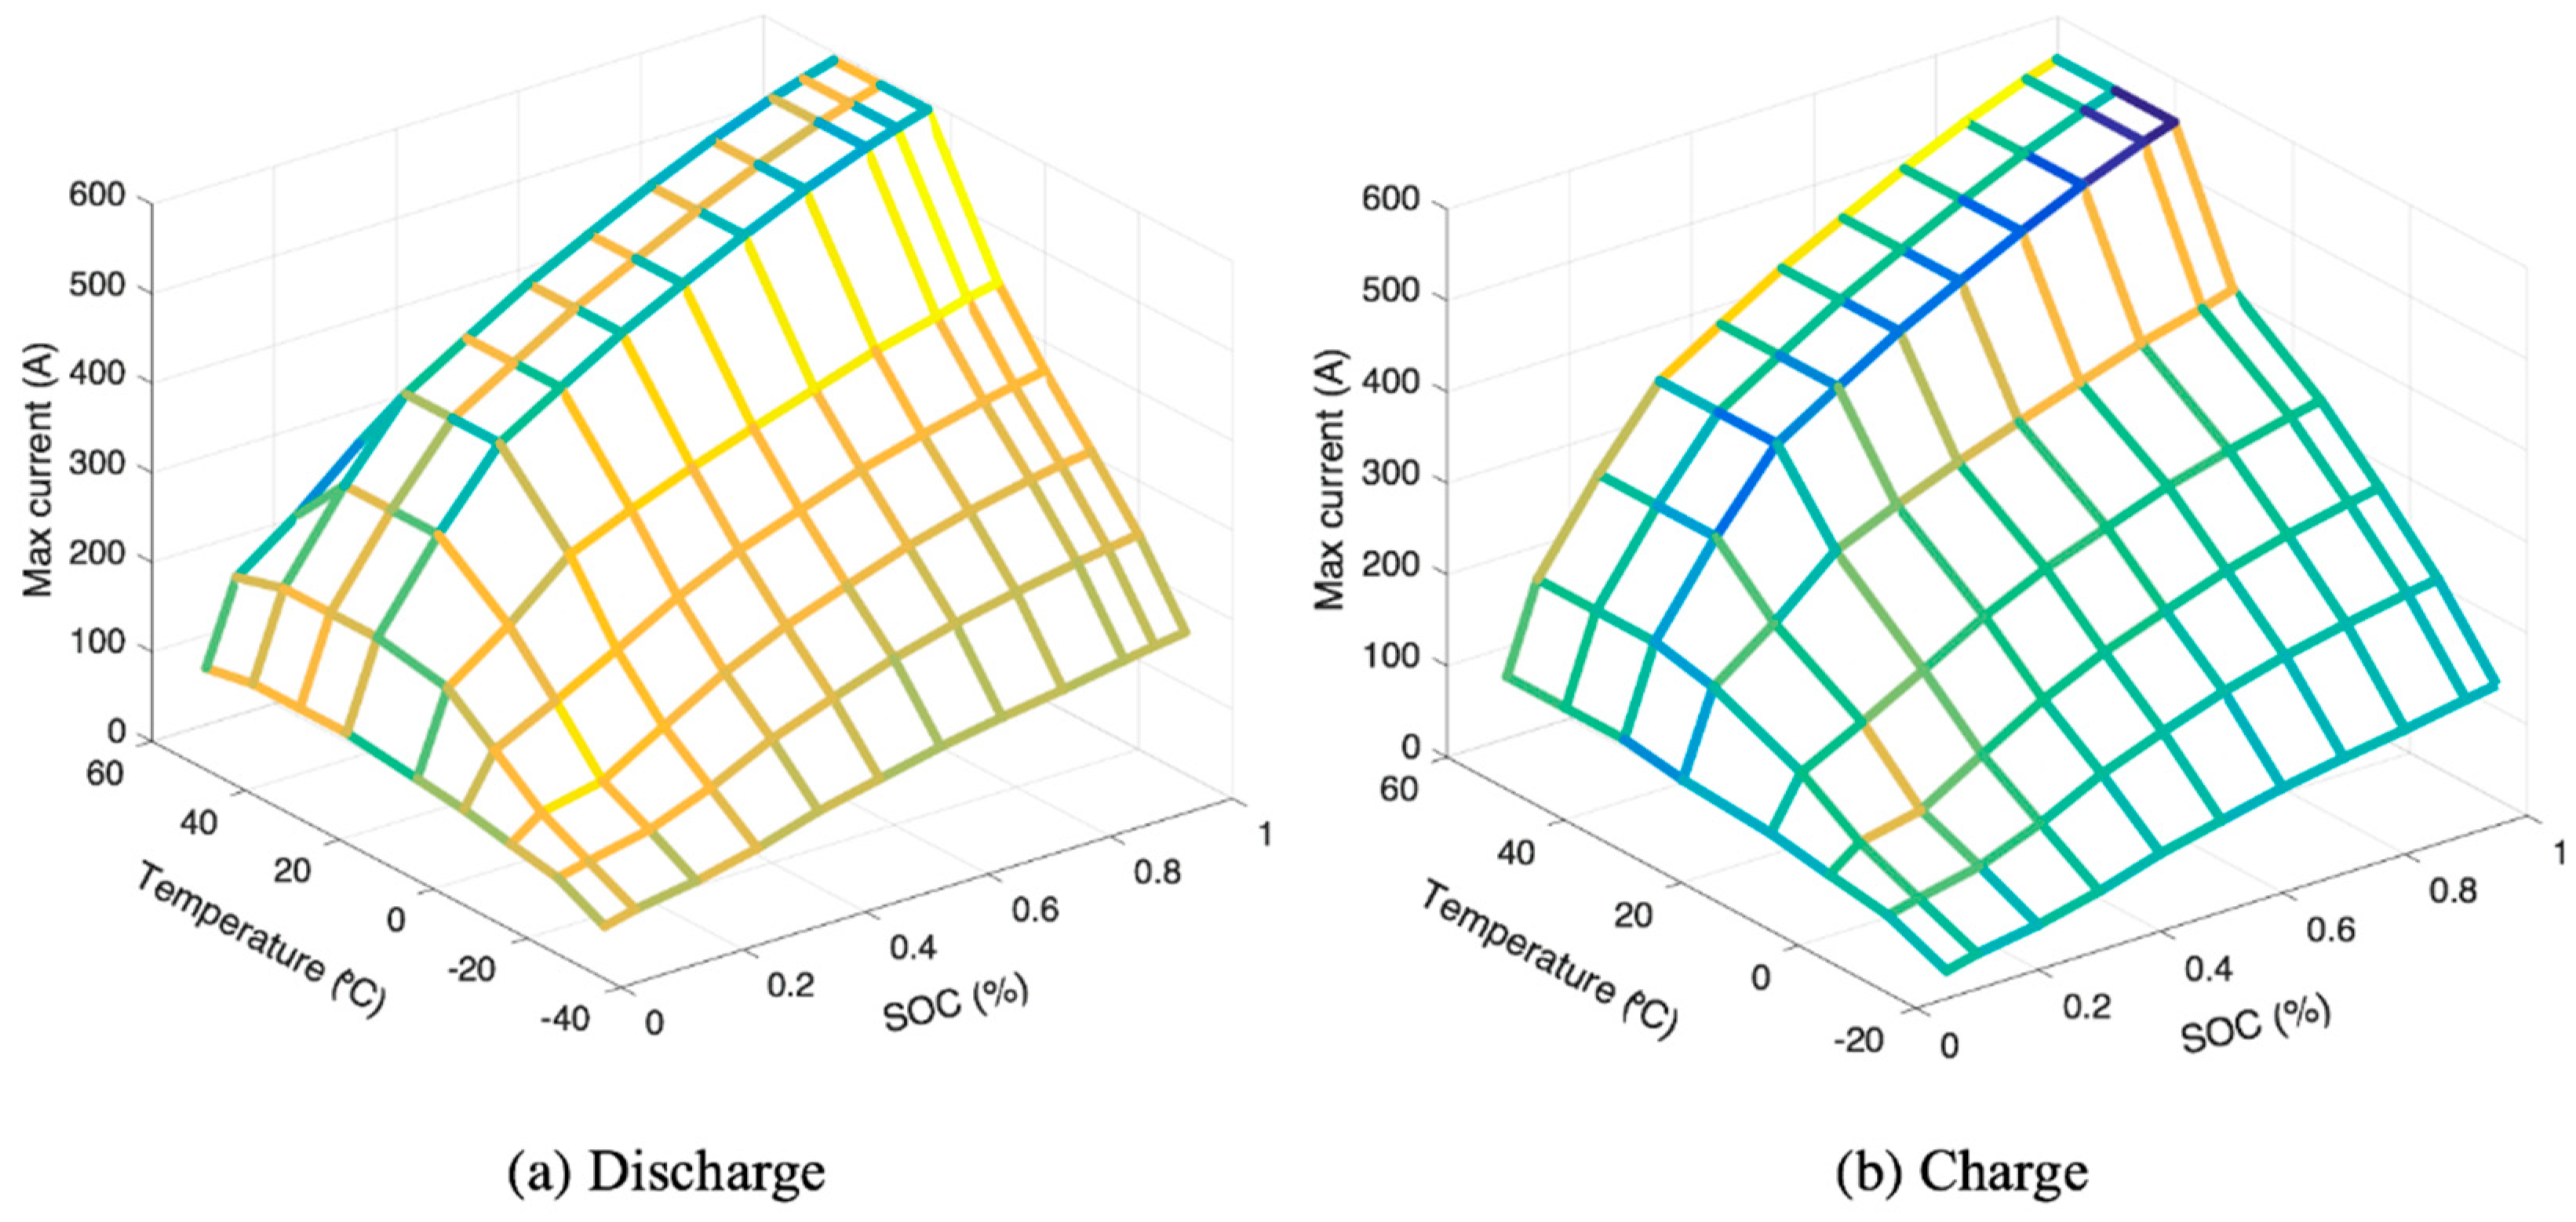
3.4. Battery Cell Power Limitation

In order to obtain a battery cell power data, firstly, we need to obtain the maximum charge or minimum discharge current of the battery. Battery discharge/charge current limitation obtained by testing as shown in Figure 14.
According to the test results, the maximum power limit of battery cell in 10 s is shown in the Figure 15. It can be seen clearly from the Figure 15, the output power of the battery is higher when the SOC and the battery temperature is a higher value during the discharge. The maximum power of the battery can reach to 2500 W. When the battery is in the charging process, the SOC is in the lower value and the temperature is at a higher value, the allow charging power is larger and the maximum charging power can reach 1900 W. With the increase of SOC, the maximum charging power should be gradually reduced to protect the battery cell.

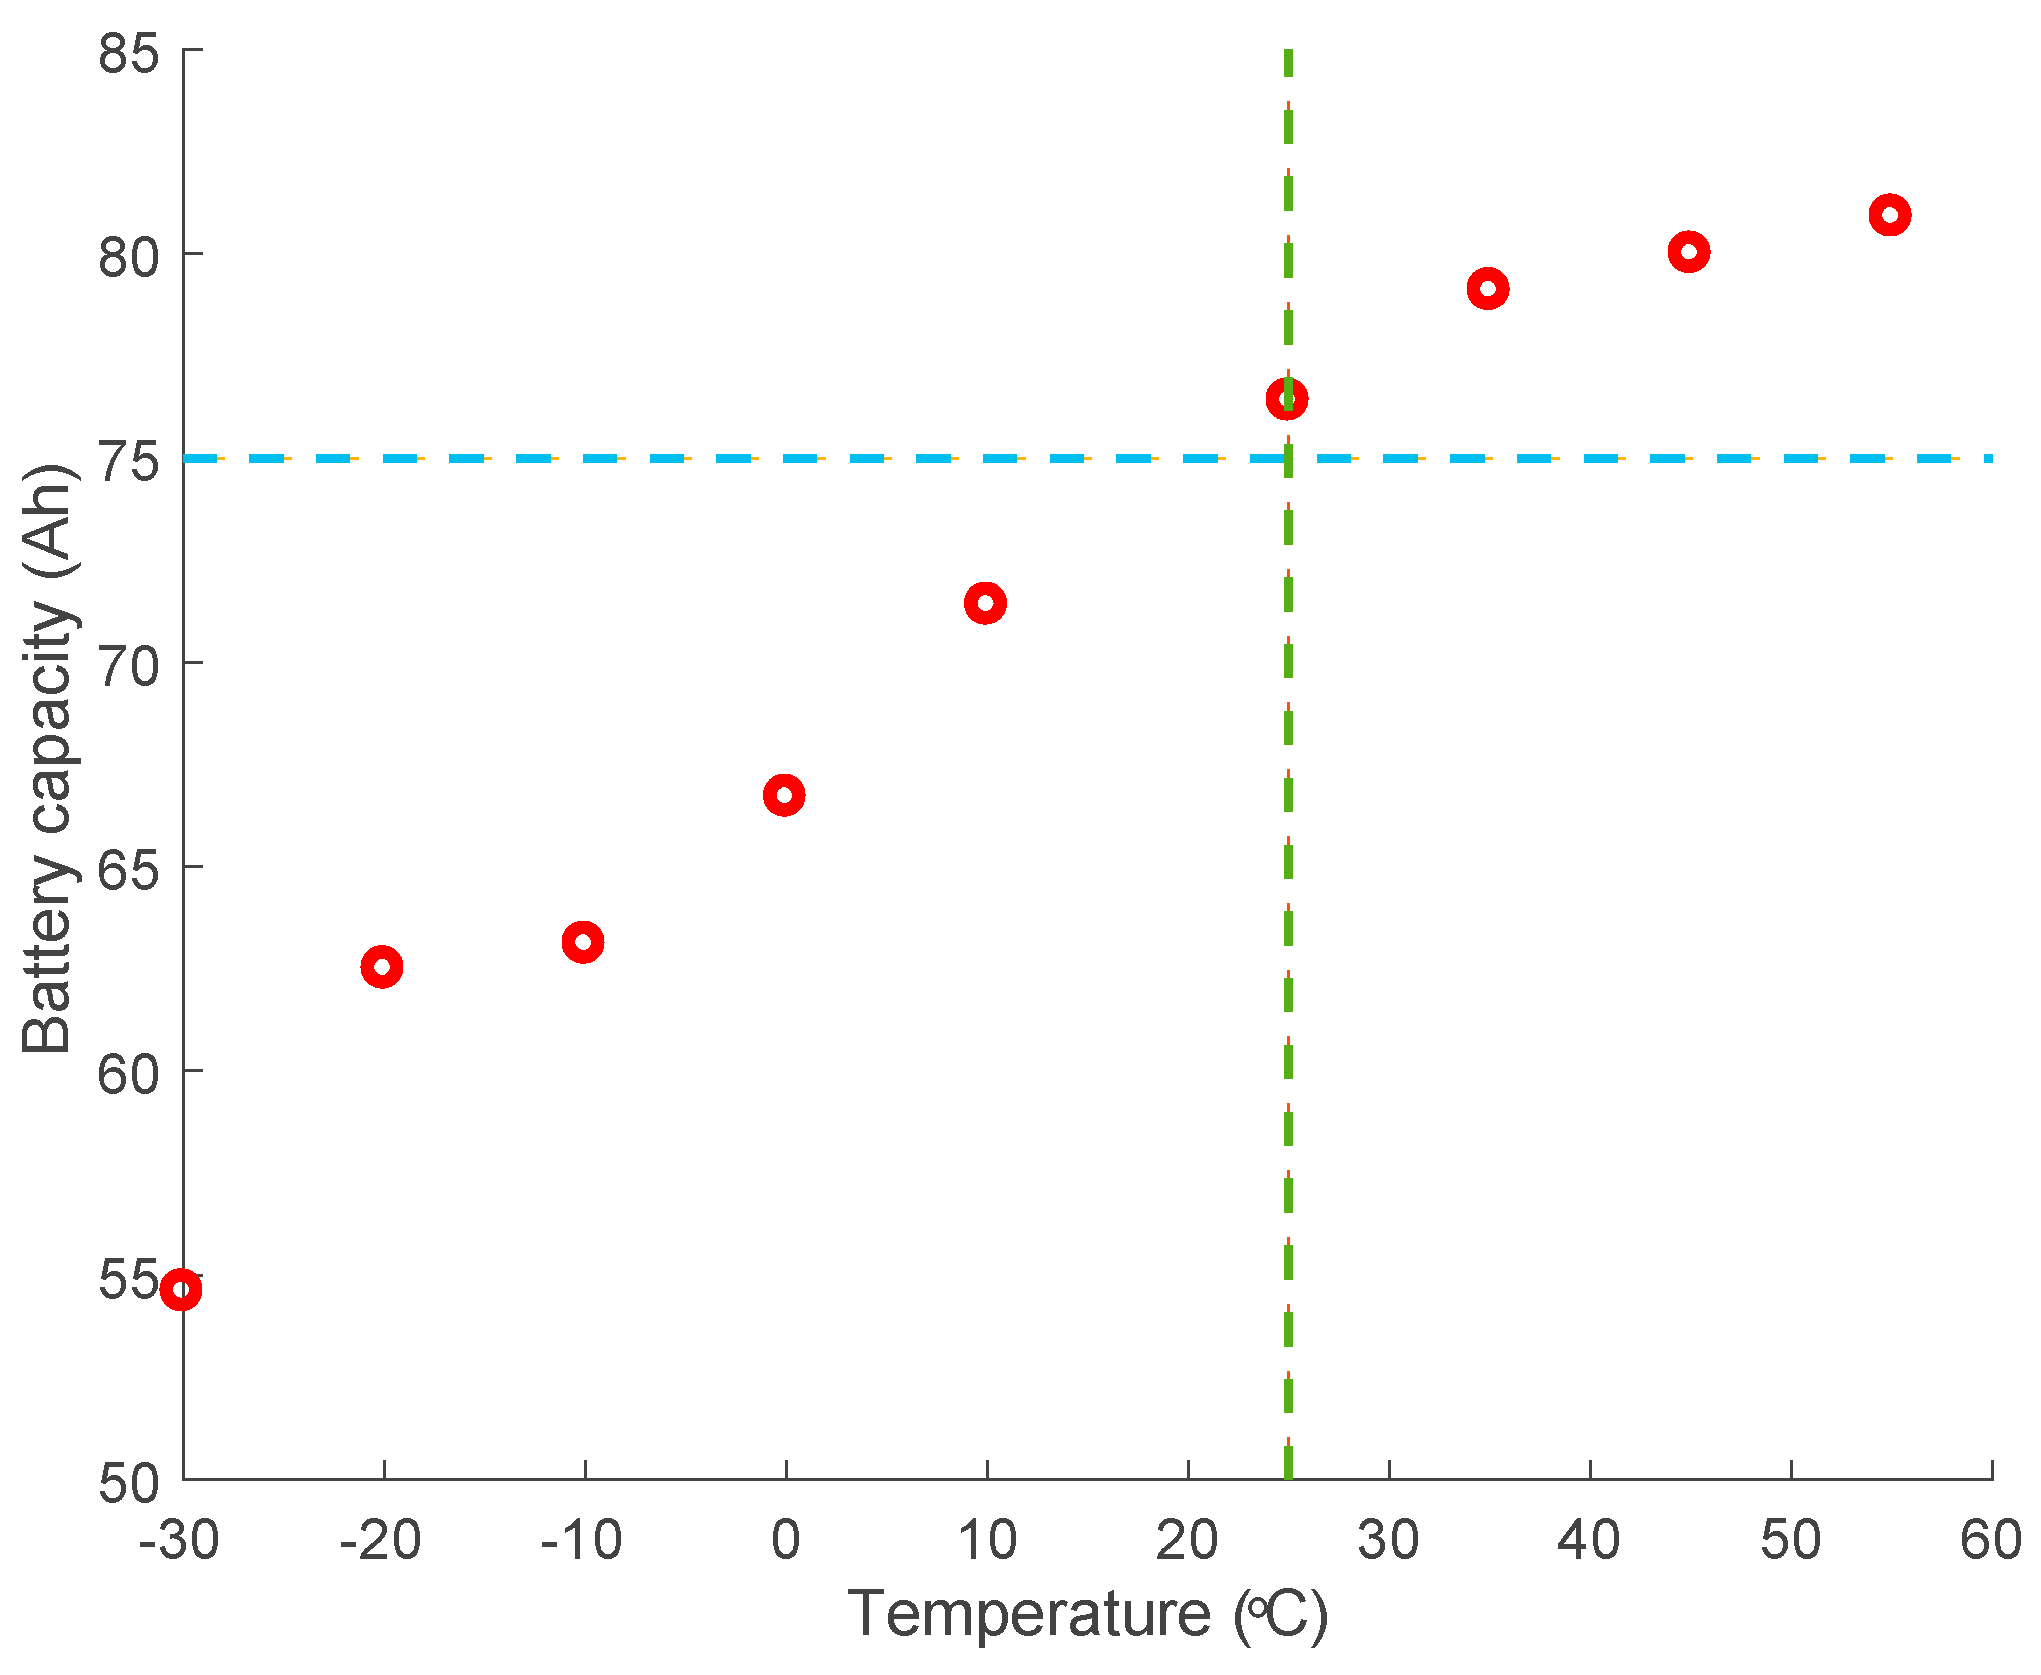
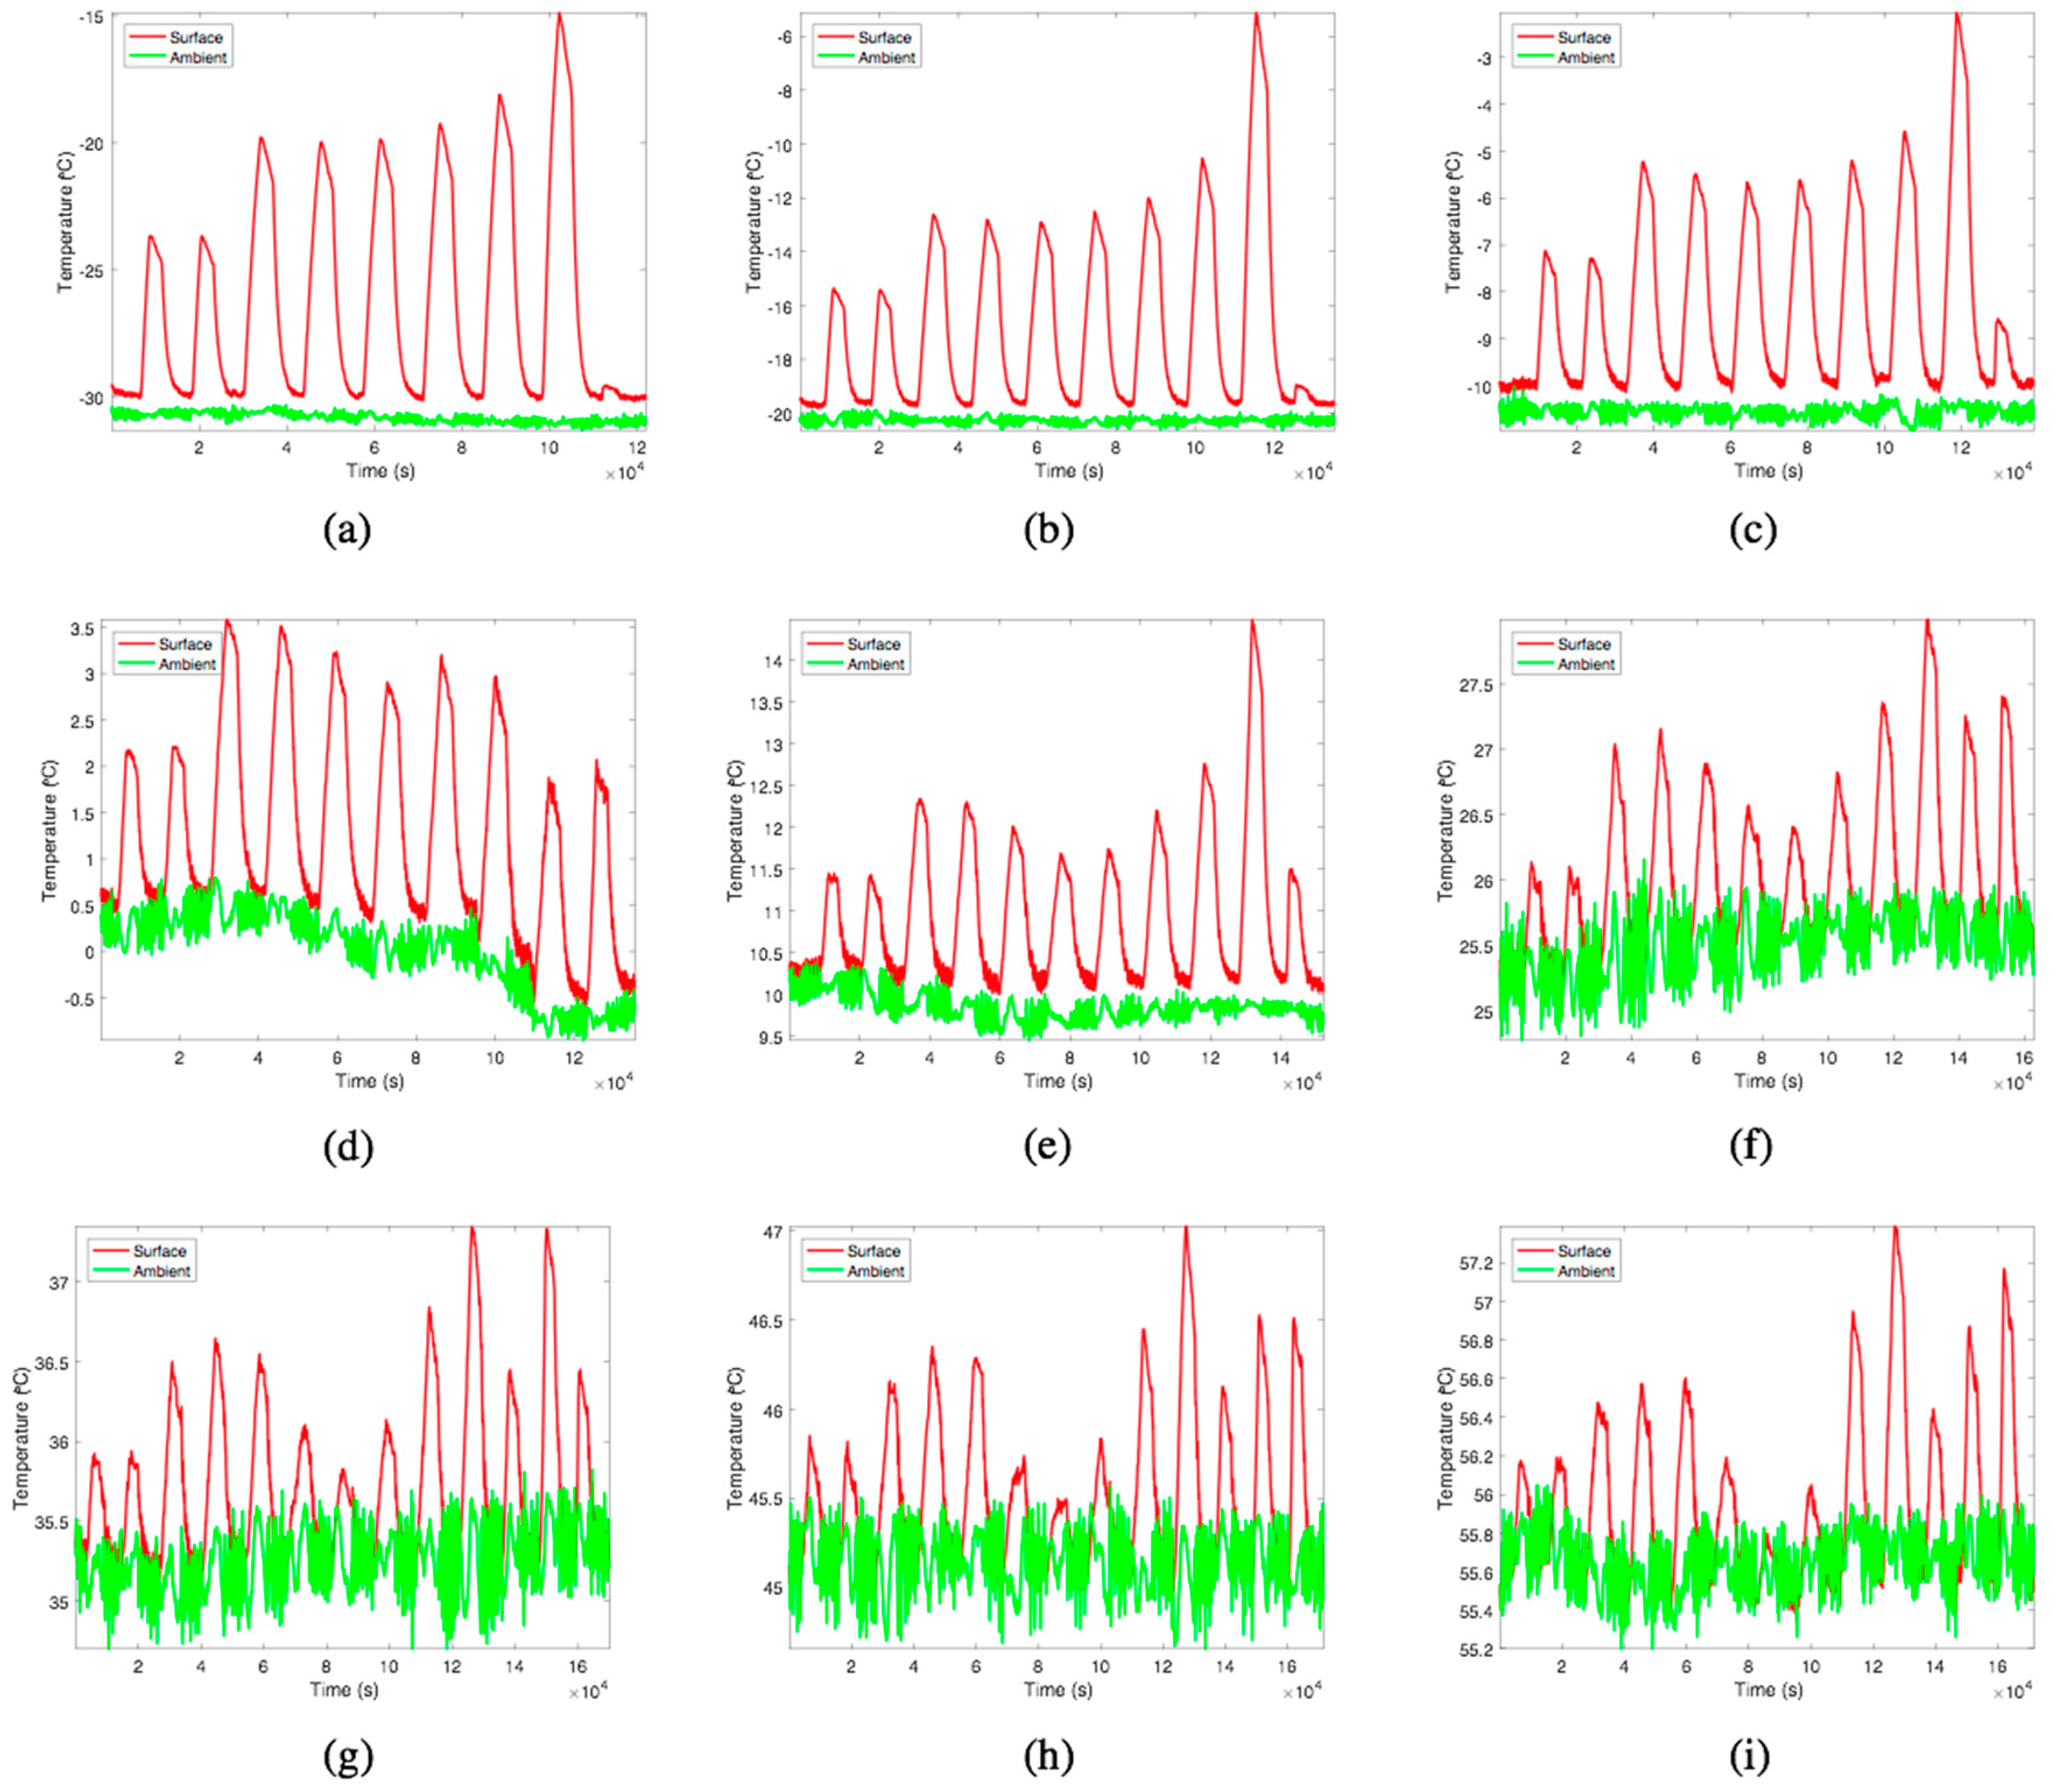
3.5. Battery Cell Temperature Limitation

As the NMC material lithium-ion battery has the problem of thermal runaway, it indicates that the battery will generate heat during the use of the battery. Furthermore, while the battery thermal change, the battery model parameter will also change. Therefore, it will affect the state estimation of the battery, thus exacerbating this reaction phenomenon. It is necessary to study the heat generation of the battery cell under pulse discharge at different temperatures. The changes of battery surface temperature during pulse discharge of lithium battery at different test temperatures as shown in Figure 16.
As we can be seen from the Figure 16, under the same conditions, the temperature rise of the battery at low SOC is significantly higher than that at high SOC. At room temperature, the temperature rise of the battery is about 0.8 degree during the 10% SOC discharging process in the high SOC while the surface temperature of the battery increases by about 1 degree during the 5% SOC discharging process in the low SOC. The maximum temperature rise occurs in the range of 20% in the SOC state. At cold temperature, the surface temperature of the battery increases sharply, the temperature will rise up to 15 degrees during the 5% SOC discharging. During the 30 to 50% SOC discharging, the battery surface temperature rise is minimized, which means this is the thermal safest phase in use. Figure 16a shows that the excess capacity of the battery can't be discharge because of the influence of low temperature, while the Figure 16i shows that the extra capacity has not been fully released due to the high temperature of the battery cell, so the battery test system did a couple more cycles.

4. Discussion

The capacity and pulse test of the battery at different temperatures are determined in this paper. Through these experimental data, the electrical characteristics of different parameters of the high capacity battery, such as capacity, internal resistance, OCV-SOC relation curve, power and temperature rise are analyzed.
In the process of developing the pulse test, a 5% SOC discharge is carried out according to battery 0~10% SOC and 90~100% SOC, and, 10% SOC discharge is carried out between 10% and 90% SOC. It can be seen that in the high temperature environment, the amount of capacity that can be released is greater than the capacity value of the defined 100% SOC. In the low temperature environment, the amount of capacity that can be released is much less than the corresponding capacity value of the 100% SOC. This indicates that the diffusion rate of lithium-ion battery cell is slow at low temperature while the activity of lithium-ion battery cell and the discharge capacity will increase with the rising temperatures. Besides, in different discharge rates, the capacity of the battery is also inconsistent. Therefore, if the change law of battery capacity is not master, it is obvious that the battery state of charge cannot be estimated correctly and the estimation error of the battery state of charge can be increased.
In the off-line parameter identification of the second order RC model, due to the difference in the partial hysteresis curve, the initialization parameters of the identification method in the high temperature and low temperature are different. The values shown by R 1 , R 2 , C 1 , and C 2 illustrate a time constant data problem, and cannot be completely used to analyze the values of polarization internal resistance and polarization capacitance. From the overall analysis, the larger temperature of the battery, the smaller the Ohmic internal resistance of the battery. And the temperature is too large will accelerate the thermal reaction and thermal runaway of the battery. On the other hand, in the process of applying the Kalman filter algorithm, the parameters of the battery model are generally set as constant. Through the study of this paper, it is found that the variation of the parameters of the battery model at different temperatures is quite different. What’s more, the SOC-OCV curve of the battery is not consistent with the discharge and charge. Even under the same charge/discharge conditions, the SOC-OCV curve is still affected by the ambient temperature and inside temperature of the battery. It shows that the relationship between the SOC and OCV is high nonlinear and changeable.
From the study of this paper, the dynamic characteristics of the battery are influenced by the internal temperature and discharge rate of the battery, and these effects will lead to a certain error if no attention is paid to the design process of the state estimation algorithm. There are many factors that affect the battery state estimation error, such as self-discharge rate, battery aging and so on. However, due to the limitations of the conditions, self-discharge, battery aging process has not been further studied, which will be carried out in the next stage. For example, The GNL nonlinear equivalent circuit model which takes into account the influence of the self-discharge on characteristics of battery [50]. Lavigne et al. [23] proposed a two stage OCV curve model to estimate lithium-ion battery SOC.
However, many of the current algorithms are developed based on the test data at normal temperature, and the influence of temperature is not considered. Therefore, it will have a greater impact on the results of the algorithm under the high temperature environment or the larger temperature difference region or under the management of the heat management system. Charging and discharging at different temperatures will also produce hysteretic effects. These phenomena and problems are also worthy to pay attention in future research.
In summary, it is necessary to study an on-line parameter identification method that can detect battery capacity change and battery model parameters in real time. On-line parameter identification methods combined with a Kalman filter can be used to estimate the state of charge of the battery, and the ideal results may be obtained.

5. Conclusions

This paper focuses on the study of the electrical characteristics of high capacity batteries under the influence of different temperatures. The characteristic data of the high lithium-ion power battery is obtained and shows that the battery capacity, the battery model parameters and the OCV-SOC characteristic curve are greatly influenced by temperature changes. At the same time, the quantitative results of battery power limitation and pulse discharge temperature rise are also obtained. These battery test data can be used as reference data for new battery development and verification, as comparison data and basic data for battery model on-line parameter identification and battery state estimation in the next stage, and these results can be used in battery management system design for electric vehicles.

Author Contributions

R.Z. designed the test experiment and carried on the test, studied scientific and technical literature, and wrote the technical paper. Y.L., W.Z., H.W., W.W. and M.W. provided the necessary materials and equipment support; B.L. and B.X. gave paper guidance.

Funding

This work was sponsored by the China Postdoctoral Science Foundation (Grant No. 2017M622799), The State Key Laboratory of Advanced Design and Manufacturing for Vehicle Body Open Fund (Grant No. 31715013), and Shenzhen Economic, Trade and Information Commission “Innovation Chain + Industrial Chain” Project (2017).

Acknowledgments

The authors thank the anonymous reviewers for providing useful comments and suggestions that resulted in the improved quality of this paper. The authors would like to thank the Shenzhen Economic, Trade and Information Commission, China Postdoctoral Science, The State Key Laboratory of Advanced Design and Manufacturing for Vehicle Body Open Fund, Qihay and Tan, for their technical and spirit support.

Conflicts of Interest

The authors declare that there is no conflict of interest regarding the publication of this paper.

Nomenclature

Acronyms:
AAmpere
BMSBattery management system
CCConstant current
CCCVConstant current-constant voltage
CKFCubature Kalman filter
CVConstant voltage
EKFExtend Kalman filter
ECMEquivalent circuit model
EVElectric vehicle
KFKalman filter
LCOLithium cobalt oxide
LMOLithium manganese oxide
LFPLithium iron phosphate
LTOLithium titanium oxide
NCANickel cobalt aluminum
NMCNickel manganese cobalt
OCVOpen circuit voltage
PFParticle filter
SMOSliding mode observer
SOCState of charge
SOHState of health
SOPState of power
SPKFSigma-point Kalman filter
STCEKFStrong tracking cubature extended Kalman filter
UKFUnscented Kalman filter
Symbols:
α [ I ( t ) ] Battery capacity change factor
φ ( N ) Capacity influence factor of the cycle number
β [ T ( t ) ] Capacity change factor caused by temperature
η Coulombic efficiency
C A Actual cell capacity
C n Capacity of the battery
C 1 Capacitor of the first circuits block of ECM
C 2 Capacitor of the second circuits block of ECM
k Time step
I L Load current
N Cycle times
P P d i s b a t Peak power of the battery during discharging
P P c h b a t Peak power of the battery during charging
P n Nominal power of the battery
Q r Remaining capacity of the battery
Q n Nominal capacity
R 0 Ohmic resistance
R 1 Resistance of the first circuits block of ECM
R 2 Resistance of the second circuits block of ECM
R c e l l , d i s ,   R c e l l , c h Resistance of the battery under the state
tTime
TSampling period
U c e l l , m i n Minimum of the battery cell voltage
U c e l l , m a x Maximum of the battery cell voltage
U O C c e l l , d i s U O C c e l l , c h   Open circuit voltage of the battery
U o c Open circuit voltage
U t Terminal voltage
Subscripts:
minMinimum value
maxMaximum value

References

  1. Goodenough, J.B.; Kim, Y. Challenges for Rechargeable Li Batteries. Chem. Mater. 2014, 22, 587–603. [Google Scholar] [CrossRef]
  2. Meng, J.; Luo, G.; Gao, F. Lithium polymer battery state-of-charge estimation based on adaptive unscented kalman filter and support vector machine. IEEE Trans. Power Electron. 2016, 31, 2226–2238. [Google Scholar] [CrossRef]
  3. Marongiu, A.; Nußbaum, F.; Waag, W.; Garmendia, M.; Sauer, D.U. Comprehensive study of the influence of aging on the hysteresis behavior of a lithium iron phosphate cathode-based lithium ion battery—An experimental investigation of the hysteresis. Appl. Energy 2016, 171, 629–645. [Google Scholar] [CrossRef]
  4. Ianniciello, L.; Biwolé, P.H.; Achard, P. Electric vehicles batteries thermal management systems employing phase change materials. J. Power Sources 2018, 378, 383–403. [Google Scholar] [CrossRef]
  5. Hannan, M.A.; Lipu, M.S.H.; Hussain, A.; Mohamed, A. A review of lithium-ion battery state of charge estimation and management system in electric vehicle applications: Challenges and recommendations. Renew. Sustain. Energy Rev. 2017, 78, 834–854. [Google Scholar] [CrossRef]
  6. Rao, Z.; Wang, Q.; Huang, C. Investigation of the thermal performance of phase change material/mini-channel coupled battery thermal management system. Appl. Energy 2016, 164, 659–669. [Google Scholar] [CrossRef]
  7. Cheng, K.W.E.; Divakar, B.P.; Wu, H.; Ding, K.; Ho, H.F. Battery-management system (BMS) and SOC development for electrical vehicles. IEEE Trans. Veh. Technol. 2011, 60, 76–88. [Google Scholar] [CrossRef]
  8. Mauro, A. The Role of the Voltaic Pile in the Galvani-Volta Controversy Concerning Animal vs. Metallic Electricity. J. Hist. Med. Allied Sci. 1969, 24, 140–150. [Google Scholar] [CrossRef] [PubMed]
  9. Kurzweil, P. Gaston Planté and his invention of the lead–acid battery—The genesis of the first practical rechargeable battery. J. Power Sources 2010, 195, 4424–4434. [Google Scholar] [CrossRef]
  10. Sun, Z.; Wang, S.; Yan, L.; Xiao, M.; Han, D.; Meng, Y. Mesoporous carbon materials prepared from litchi shell as sulfur encapsulator for lithium-sulfur battery application. J. Power Sources 2016, 324, 547–555. [Google Scholar] [CrossRef]
  11. Propp, K.; Auger, D.J.; Fotouhi, A.; Longo, S.; Knap, V. Kalman-variant estimators for state of charge in lithium-sulfur batteries. J. Power Sources 2017, 343, 254–267. [Google Scholar] [CrossRef]
  12. Urbonaite, S.; Novák, P. Importance of ‘unimportant’ experimental parameters in Li–S battery development. J. Power Sources 2014, 249, 497–502. [Google Scholar] [CrossRef]
  13. Huff, L.A.; Rapp, J.L.; Baughman, J.A.; Rinaldi, P.L.; Gewirth, A.A. Identification of lithium-sulfur battery discharge products through 6Li and 33S solid-state MAS and 7Li solution NMR spectroscopy. Surf. Sci. 2015, 631, 295–300. [Google Scholar] [CrossRef]
  14. Shen, X.; Liu, H.; Cheng, X.B.; Yan, C.; Huang, J.Q. Beyond lithium ion batteries: Higher energy density battery systems based on lithium metal anodes. Energy Storage Mater. 2018, 12, 161–175. [Google Scholar] [CrossRef]
  15. Sun, L.; Li, H.; Zhao, M.; Wang, G. High-performance lithium-sulfur batteries based on self-supporting graphene/carbon nanotube foam@ sulfur composite cathode and quasi-solid-state polymer electrolyte. Chem. Eng. J. 2018, 332, 8–15. [Google Scholar] [CrossRef]
  16. Manthiram, A.; Yu, X.; Wang, S. Lithium battery chemistries enabled by solid-state electrolytes. Nat. Rev. Mater. 2017, 2. [Google Scholar] [CrossRef]
  17. Oh, K.Y.; Samad, N.A.; Kim, Y.; Siegel, J.B.; Stefanopoulou, A.G.; Epureanu, B.I. A novel phenomenological multi-physics model of Li-ion battery cells. J. Power Sources 2016, 326, 447–458. [Google Scholar] [CrossRef] [Green Version]
  18. Panchal, S.; Mathewson, S.; Fraser, R.; Culham, R.; Fowler, M. Experimental Measurements of Thermal Characteristics of LiFePO4 Battery; Technical Report for SAE International: Warrendale, MI, USA, 14 April 2015. [Google Scholar]
  19. Zou, C.; Manzie, C.; Nešić, D.; Kallapur, A.G. Multi-time-scale observer design for state-of-charge and state-of-health of a lithium-ion battery. J. Power Sources 2016, 335, 121–130. [Google Scholar] [CrossRef]
  20. Li, Y.; Chattopadhyay, P.; Ray, A.; Rahn, C.D. Identification of the battery state-of-health parameter from input–output pairs of time series data. J. Power Sources 2015, 285, 235–246. [Google Scholar] [CrossRef]
  21. Feng, T.; Yang, L.; Zhao, X.; Zhang, H.; Qiang, J. Online identification of lithium-ion battery parameters based on an improved equivalent-circuit model and its implementation on battery state-of-power prediction. J. Power Sources 2015, 281, 192–203. [Google Scholar] [CrossRef]
  22. Waag, W.; Fleischer, C.; Sauer, D.U. Adaptive on-line prediction of the available power of lithium-ion batteries. J. Power Sources 2013, 242, 548–559. [Google Scholar] [CrossRef]
  23. Lavigne, L.; Sabatier, J.; Francisco, J.M.; Guillemard, F.; Noury, A. Lithium-ion open circuit voltage (OCV) curve modelling and its ageing adjustment. J. Power Sources 2016, 324, 694–703. [Google Scholar] [CrossRef]
  24. Ting, T.O.; Man, K.L.; Lim, E.G.; Leach, M. Tuning of Kalman filter parameters via genetic algorithm for state-of-charge estimation in battery management system. Sci. World J. 2014, 2014, 176052. [Google Scholar] [CrossRef] [PubMed]
  25. Xia, B.; Zheng, W.; Zhang, R.; Lao, Z.; Sun, Z.; Sciubba, E. A novel observer for lithium-ion battery state of charge estimation in electric vehicles based on a second-order equivalent circuit model. Energies 2017, 10, 1150. [Google Scholar] [CrossRef]
  26. Yatsui, M.W.; Bai, H. Kalman Filter Based State-of-Charge Estimation for Lithium-Ion Batteries in Hybrid Electric Vehicles Using Pulse Charging. In Proceedings of the 2011 IEEE Vehicle Power and Propulsion Conference, Chicago, IL, USA, 6–9 September 2011. [Google Scholar]
  27. He, H.; Xiong, R.; Guo, H. Online estimation of model parameters and state-of-charge of LiFePO4 batteries in electric vehicles. Appl. Energy 2012, 89, 413–420. [Google Scholar] [CrossRef]
  28. Pei, L.; Zhu, C.; Wang, T.; Lu, R.; Chan, C.C. Online peak power prediction based on a parameter and state estimator for lithium-ion batteries in electric vehicles. Energy 2014, 66, 766–778. [Google Scholar] [CrossRef]
  29. Xia, B.; Sun, Z.; Zhang, R.; Cui, D.; Lao, Z.; Wang, W. A Comparative Study of Three Improved Algorithms Based on Particle Filter Algorithms in SOC Estimation of Lithium Ion Batteries. Energies 2017, 10, 1149. [Google Scholar] [CrossRef]
  30. Nejad, S.; Gladwin, D.T.; Stone, D.A. A systematic review of lumped-parameter equivalent circuit models for real-time estimation of lithium-ion battery states. J. Power Sources 2016, 316, 183–196. [Google Scholar] [CrossRef] [Green Version]
  31. He, H.; Xiong, R.; Fan, J. Evaluation of lithium-ion battery equivalent circuit models for state of charge estimation by an experimental approach. Energies 2011, 4, 582–598. [Google Scholar] [CrossRef]
  32. Lin, C. Comparison of current input equvialent circuit models of electrical vehicle battery. Chin. J. Mech. Eng. 2005, 41, 76–81. [Google Scholar] [CrossRef]
  33. Liu, C.; Liu, W.; Wang, L.; Hu, G.; Ma, L.; Ren, B. A new method of modeling and state of charge estimation of the battery. J. Power Sources 2016, 320, 1–12. [Google Scholar] [CrossRef]
  34. Dong, G.; Wei, J.; Zhang, C.; Chen, Z. Online state of charge estimation and open circuit voltage hysteresis modeling of LiFePO4 battery using invariant imbedding method. Appl. Energy 2016, 162, 163–171. [Google Scholar] [CrossRef]
  35. Fleischer, C.; Waag, W.; Heyn, H.M.; Sauer, D.U. On-line adaptive battery impedance parameter and state estimation considering physical principles in reduced order equivalent circuit battery models part 2. Parameter and state estimation. J. Power Sources 2014, 262, 457–482. [Google Scholar] [CrossRef]
  36. Burgos, C.; Sáez, D.; Orchard, M.E.; Cárdenas, R. Fuzzy modelling for the state-of-charge estimation of lead-acid batteries. J. Power Sources 2015, 274, 355–366. [Google Scholar] [CrossRef]
  37. Yang, F.; Wang, D.; Xing, Y.; Tsui, K.L. Prognostics of Li (NiMnCo) O2-based lithium-ion batteries using a novel battery degradation model. Microelectron. Reliab. 2017, 70, 70–78. [Google Scholar] [CrossRef]
  38. Gandolfo, D.; Brandão, A.; Patiño, D.; Molina, M. Dynamic model of lithium polymer battery—Load resistor method for electric parameters identification. J. Energy Inst. 2015, 88, 470–479. [Google Scholar] [CrossRef]
  39. Li, X.; Fan, G.; Pan, K.; Wei, G.; Zhu, C.; Rizzoni, G. A physics-based fractional order model and state of energy estimation for lithium ion batteries. Part I: Model development and observability analysis. J. Power Sources 2017, 367, 187–201. [Google Scholar] [CrossRef]
  40. Mu, H.; Xiong, R.; Zheng, H.; Chang, Y.; Chen, Z. A novel fractional order model based state-of-charge estimation method for lithium-ion battery. Appl. Energy 2017, 207, 384–393. [Google Scholar] [CrossRef]
  41. Sabatier, J.; Francisco, J.M.; Guillemard, F.; Lavigne, L.; Moze, M.; Merveillaut, M. Lithium-ion batteries modeling: A simple fractional differentiation based model and its associated parameters estimation method. Signal Process. 2015, 107, 290–301. [Google Scholar] [CrossRef]
  42. Sabatier, J.; Aoun, M.; Oustaloup, A.; Grégoire, G.; Ragot, F.; Roy, P. Fractional system identification for lead acid battery state of charge estimation. Signal Process. 2006, 86, 2645–2657. [Google Scholar] [CrossRef]
  43. Li, S.; Pischinger, S.; He, C.; Liang, L.; Stapelbroek, M. A comparative study of model-based capacity estimation algorithms in dual estimation frameworks for lithium-ion batteries under an accelerated aging test. Appl. Energy 2018, 212, 1522–1536. [Google Scholar] [CrossRef]
  44. Xiang, S.; Hu, G.; Huang, R.; Guo, F.; Zhou, P. Lithium-Ion Battery Online Rapid State-of-Power Estimation under Multiple Constraints. Energies 2018, 11, 283. [Google Scholar] [CrossRef]
  45. Sun, F.; Xiong, R.; He, H. A systematic state-of-charge estimation framework for multi-cell battery pack in electric vehicles using bias correction technique. Appl. Energy 2016, 162, 1399–1409. [Google Scholar] [CrossRef]
  46. Gao, Z.; Chin, C.; Woo, W.; Jia, J. Integrated equivalent circuit and thermal model for simulation of temperature-dependent LiFePO4 battery in actual embedded application. Energies 2017, 10, 85. [Google Scholar] [CrossRef]
  47. Sun, B.; Jiang, J.; Zheng, F.; Zhao, W.; Liaw, B.Y.; Ruan, H. Practical state of health estimation of power batteries based on Delphi method and grey relational grade analysis. J. Power Sources 2015, 282, 146–157. [Google Scholar] [CrossRef]
  48. Zhang, R.; Xia, B.; Li, B.; Cao, L.; Lai, Y.; Zheng, W. State of the Art of Lithium-Ion Battery SOC Estimation for Electrical Vehicles. Energies 2018, 11, 1820. [Google Scholar] [CrossRef]
  49. Zheng, Y.; Ouyang, M.; Han, X.; Lu, L.; Li, J. Investigating the error sources of the online state of charge estimation methods for lithium-ion batteries in electric vehicles. J. Power Sources 2018, 377, 161–188. [Google Scholar] [CrossRef]
  50. Xing, S.; Chen, S.; Wei, Z.; Xia, J. Unifying Electrical Engineering and Electronics Engineering. In Proceedings of the 2012 International Conference on Electrical and Electronics Engineering, Shanghai, China, 18–19 August 2012. [Google Scholar]
Figure 1. 2RC circuit battery model.
Energies 11 02275 g001
Figure 2. The schematic of the battery test bench.
Energies 11 02275 g002
Figure 3. The battery capacity test flow chart.
Energies 11 02275 g003
Figure 4. The battery pulse test profile.
Energies 11 02275 g004
Figure 5. The discharge voltage curve at different C rate.
Energies 11 02275 g005
Figure 6. The correlation between battery capacity and temperature.
Energies 11 02275 g006
Figure 7. Characteristic Ohmic resistance curves of the battery.
Energies 11 02275 g007
Figure 8. R0 value of 75 Ah battery at different temperature.
Energies 11 02275 g008
Figure 9. R1 value of 75 Ah battery at different temperature.
Energies 11 02275 g009
Figure 10. C1 value of 75 Ah battery at different temperature.
Energies 11 02275 g010
Figure 11. R2 value of 75 Ah battery at different temperature.
Energies 11 02275 g011
Figure 12. C2 value of 75 Ah battery at different temperature.
Energies 11 02275 g012
Figure 13. The battery SOC-OCV relationship at different temperatures.
Energies 11 02275 g013
Figure 14. Battery current limitation.
Energies 11 02275 g014
Figure 15. The power requirement of the battery.
Energies 11 02275 g015
Figure 16. The changes of battery surface temperature during pulse discharge of lithium battery at different test temperatures. (a) tested at −30 °C; (b) tested at −20 °C; (c) tested at −10 °C; (d) tested at 0 °C; (e) tested at 10 °C; (f) tested at 25 °C; (g) tested at 35 °C; (h) tested at 45 °C; (i) tested at 55 °C.
Energies 11 02275 g016
Table 1. The lithium-ion battery cell specifications.
ItemSpecification Parameter
Battery DimensionL/mm: 148.40 ± 0.30
W/mm: 39.70 ± 0.30
H/mm: 95.00 ± 0.30
Nominal Capacity76.5 Ah (1/3 C)
75.0 Ah (1 C)
Nominal Voltage3.70 V (1/3 C)
3.65 V (1 C)
Weight1.32 kg
Internal Impedance0.65 mΩ @50% SOC, 1 kHz
Internal Resistance1.3 mΩ @10 s 200 A, 50% SOC
Upper Charge Cut-Off Voltage4.25 V
Lower Discharge Cut-Off Voltage2.80 V (T > −10 °C)
2.50 V (−20 °C ≤ T ≤ −10 °C)
2.10 V (T ≤ −20°C)
Continuous Charging Current75 A (25 °C)
Continuous Discharge Current75 A (25 °C)
Maximum Pulse Charging Current350 A @10 s, 50% SOC, 25 °C
Maximum Pulse Discharge Current350 A @10 s, 50% SOC, 25 °C
Charge Upper Limit Protection Voltage4.30 V
Charge Lower Limit Protection Voltage2.5 V (25 °C)
Working TemperatureDischarge temperature range: −30~55 °C
Charge temperature range: −20~55 °C
Table 2. The battery discharge capacity under different discharge rate.
Charge Rate (C)Discharge Rate (C)Total Charge Capacity (Ah)Total Discharge Capacity (Ah)   η [ I ( t )   ]
1171.373.3102.8%
10.572.074.1102.8%
10.3377.678.9101.6%
10.0576.781.2105.8%
Table 3. Maximum discharge capacities under specified ambient temperature.
Temperature (°C)−30−20−1001025354555
Maximum Discharge Capacity (Ah)54.662.563.166.771.476.479.180.080.8
Table 4. Battery ohmic resistance value under different battery internal temperature and SOC levels.
SOC−30 °C−20 °C−10 °C0 °C10 °C25 °C45 °C55 °C
100%14.6910.076.514.012.651.561.060.92
95%14.369.756.313.832.591.561.070.93
90%14.109.506.173.742.571.571.090.95
80%13.779.206.013.672.541.601.151.00
70%13.589.105.943.672.571.641.181.04
60%13.589.105.903.722.611.661.161.02
50%13.679.225.813.662.471.460.970.84
40%13.949.465.883.642.391.450.980.87
30%14.519.956.163.822.491.531.000.88
20%15.6610.906.694.162.761.671.060.92
10%18.3213.688.285.163.572.141.160.96
5%29.9827.8110.916.775.063.171.431.15

