A Hybrid Machine Learning Model for Electricity Consumer Categorization Using Smart Meter Data


State Key Laboratory of Networking and Switching Technology, Beijing University of Posts and Telecommunications, Beijing 100876, China
*
Author to whom correspondence should be addressed.
Energies 2018, 11(9), 2235; https://doi.org/10.3390/en11092235
Submission received: 30 July 2018
/
Revised: 22 August 2018
/
Accepted: 23 August 2018
/
Published: 26 August 2018
(This article belongs to the Collection Smart Grid)
Abstract
:Time-series smart meter data can record precisely electricity consumption behaviors of every consumer in the smart grid system. A better understanding of consumption behaviors and an effective consumer categorization based on the similarity of these behaviors can be helpful for flexible demand management and effective energy control. In this paper, we propose a hybrid machine learning model including both unsupervised clustering and supervised classification for categorizing consumers based on the similarity of their typical electricity consumption behaviors. Unsupervised clustering algorithm is used to extract the typical electricity consumption behaviors and perform fuzzy consumer categorization, followed by a proposed novel algorithm to identify distinct consumer categories and their consumption characteristics. Supervised classification algorithm is used to classify new consumers and evaluate the validity of the identified categories. The proposed model is applied to a real dataset of U.S. non-residential consumers collected by smart meters over one year. The results indicate that large or special institutions usually have their distinct consumption characteristics while others such as some medium and small institutions or similar building types may have the same characteristics. Moreover, the comparison results with other methods show the improved performance of the proposed model in terms of category identification and classifying accuracy.
1. Introduction
Smart grid system, which is developed for the electric power energy management, aims to enhance the efficiency, reliability and safety of energy consumption by automated control and modern communications technologies [1,2]. The large amount of smart meter data collected in smart grid system contain plenty of knowledge about electricity consumption behaviors so that information processing or machine learning algorithms are required for data analysis [3]. There are many studies of data analyses on smart meter data, such as load profiling, consumer categorization, load forecasting and anomaly detection [4,5,6,7]. Such smart meter data analyses are essential for achieving better understanding of electricity consumption behaviors, flexible demand management and effective energy control. For instance, electricity end consumers, especially smart buildings with multiple smart homes, optimize daily energy cost according to an understanding of their electricity consumption patterns so that they can achieve energy consumption and cost savings [8,9].
Consumer categorization based on load profiling is the focus of this paper. In the studies of load profiling [2,10,11], the typical electricity consumption behaviors, also called load patterns, of each consumer can be extracted by daily load curve clustering using smart meter data. For electricity consumers in various types, such as residential, commercial and industrial, it is supposed that they may have diverse load patterns, even for their same types [12,13]. For example, it is highly possible that restaurants and hotels, which are two types of commercial electricity consumers, have two distinct groups of load patterns. It is also possible that the load patterns of large hotels and small hotels are different from each other. Therefore, electricity consumers should be categorized based on their load pattern similarity rather than their types to further analyze their electricity consumption behaviors. Moreover, consumer categorization on the basis of load pattern similarity can also help electricity suppliers in terms of designing specific tariff options, efficient power supply plan, and even accurate load prediction for consumers in various categories, all of which can make effort towards the improvement of energy efficiency and sustainable transition [14].
This paper aims at categorizing electricity consumers on the basis of load pattern similarity and identifying the electricity consumption characteristic for each category. This is an unsupervised clustering problem on how to categorize the load patterns of all consumers. Some previous studies on this problem only select one or partial representative load patterns from each consumer when they conduct load pattern clustering [15,16,17,18]. Although these methods simplify the categorization problem, they may lead to information loss and accuracy decrease. On the other hand, selecting overall load patterns for the clustering can cause indistinct consumer categorization, in which one consumer may belong to several categories. Therefore, we not only adopt unsupervised clustering algorithm to extract the typical electricity consumption behaviors and perform fuzzy consumer categorization, but also propose a novel algorithm to identify distinct consumer categories and their consumption characteristics. In our method, all load patterns of each consumer are selected as inputs for load pattern clustering, and a parameter is set to select appropriate load patterns as consumer characteristics from shared clustering centers among different clusters. Moreover, to evaluate and utilize the obtained consumer categories, supervised classification algorithm is considered to perform new consumer classifications by regarding those identified characteristics as training samples.
The whole hybrid machine learning model for electricity consumer categorization is implemented on smart meter data which are 24-value daily load data over one year of totally 1168 non-residential electricity consumers. In the experiments, 80%, 60% and 40% of daily load data from each consumer are randomly and separately selected as training data for using in unsupervised clustering. The remaining data are used as testing data in new consumer classification. The main contributions of this work are summarized as follows:
- Extended problem. Electricity consumer categorization problem is extended from simplex clustering to characteristic identification and new consumer classification. The attention is moved to the further analysis and practical application of those load pattern clustering results.
- Novel methodology. A hybrid machine learning model is proposed to perform consumer categorization without information loss and with distinct characteristics, which can simplify unsupervised clustering problem by being used as labels for future supervised classification.
- Improved experimental results and significant findings. Extensive experiments on many real data prove that the proposed method outperforms other comparison methods in terms of the validity of identified characteristics and the accuracy of new consumer classification. The results also find that large or special institutions usually have their distinct characteristics while others such as some medium and small institutions or similar consumer types may have the same characteristics.
The rest of this paper is structured as follows. Section 2 discusses related work. Section 3 proposes the hybrid machine learning model and its algorithms for each phase. Then, we introduce data and experimental setups in Section 4, and present the results with further discussion in Section 5. Finally, we conclude our work in Section 6.
2. Related Work
Machine learning algorithms are widely applied to electricity data analysis. Capizzi et al. [19] adopted neural networks to predict both energy production and consumption. Anand and Suganthi [20] optimized artificial neural network (ANN) with a hybrid algorithm of genetic algorithm and particle swarm optimization to improve electricity demand forecasting. ANN and support vector machine (SVM) are also used for electricity price forecasting [21,22]. Rodrigues and Trindade [23] proposed a load forecasting methodology through ensemble learning and functional clustering which is used to group daily load curves based on similar phase and amplitude. Differing from electricity forecasting, most existing studies of load profiling and consumer categorization are based on unsupervised clustering algorithms.
Electricity consumer categorization is to divide various load patterns of different electricity consumers into categories on the basis of load pattern similarity. It plays an important role in load data mining as it is useful for both electricity suppliers and consumers [12]. Most existing works study algorithms for load pattern grouping such as ANN [24,25], self-organizing maps (SOM) [26], fuzzy model [27] and other clustering algorithms [28,29,30]. Meanwhile, some researchers focus on multi-stage categorization frameworks [15,16,17,18].
Panapakidis et al. [15] employed a two-stage approach to achieve consumer characterization that refers to the characteristics of consumer categories. The first stage is clustering daily load curves to obtain load patterns for each individual consumer. The second one is conducting a second clustering to form consumer categories. In this two-stage approach, three alternative load patterns are selected as representative for each consumer to perform the second clustering. The three load patterns are load pattern with the largest cluster, the maximum daily energy and the peak load. However, it does not guarantee that the representative load patterns can indicate consumer characteristics sufficiently due to the complexity of electricity consumption behaviors. Similarly, Mets et al. [18] proposed another two-stage load pattern clustering with fast wavelet transformation and g-means algorithm. They noticed the limitation of selecting one representative load pattern from each consumer as input for the second stage so that they employed all load patterns instead of a single one to keep as much information as possible. Generally, the similar stages mentioned in these works are the common procedure for electricity consumer categorization. However, these works mainly focus on clustering and evaluate the results only with certain clustering assessment index calculations. Some further analysis of those clustering results are not taken into account in these works.
On the other hand, Nasiakou et al. [31] introduced a three-stage scheme with hierarchical clustering algorithm to partition consumers. The first hierarchical clustering is performed on a three minute basis data in h hours to result in sets of k clusters, and the second one is performed on the average values of these clusters. After two clustering, consumers are assigned to the clusters with the minimum Euclidean distance between the load value of each consumer and the average value of each cluster. This scheme does not follow the common procedure of consumer categorization and adopts one-dimensional data points as the inputs of clustering, which cannot be appropriate to reveal the consumer characteristics that we require.
Extra factors are also taken into account in consumer categorization. Beckel et al. [32] adopted the sensitivity of a household to outdoor temperature and the times of sunset or sunrise to improve the performance of household classification. Viegas et al. [33] used a combination of load data and survey data, including information on age, employment and appliances, with model-based feature selection to perform new electricity consumer classification. Although the extra factors improve the accuracy of consumer classification, these works refer to supervised learning rather than unsupervised learning that load pattern clustering belongs to. Gouveia and Seixas [34] also combined load data from smart meters with door-to-door surveys to categorize electricity power consumption profiles into clusters. The consumption patterns that they focused on are coarse-grained yearly load patterns, while we pay more attention to fine-grained daily load patterns.
In recent years, some works consider classifying new consumers after consumer grouping. Khumchoo and Kongprawechnon [35] proposed a method combining two approaches: clustering and SVM classification. Clustering is applied in the first stage for customer categorization based on pattern similarity. SVM classification is applied in the second stage to assign separate consumers into those consumer categories. Although the authors aimed to categorize customers, the basis of clustering and classification is voltage correlation rather than load pattern. Buitrago et al. [25] achieved new consumer classification by using a hybrid system that consists of a parameter estimation model, a clustering model and an ANN model. The authors employed three parameters to identify the shape variability in the weekly demand profile of a consumer. In that case, the input of clustering and classification is the data combining the three parameters calculated for each consumer. However, the data used for clustering and classification in our work are daily load patterns rather than parameters that stand for weekly demand profile.
According to the literature review on related works and the analysis on electricity load data, we suppose that the electricity consumption characteristic of each consumer category can be described by several typical load patterns. The consumer characteristics can be identified after consumer categorization based on load pattern grouping. It is also able to achieve new consumer classification according to the identified consumer characteristics. Moreover, to provide consumer characteristics with as much information as possible, we should employ all load patterns rather than one or several selected representative for each consumer as the input in load pattern grouping.
3. Hybrid Model
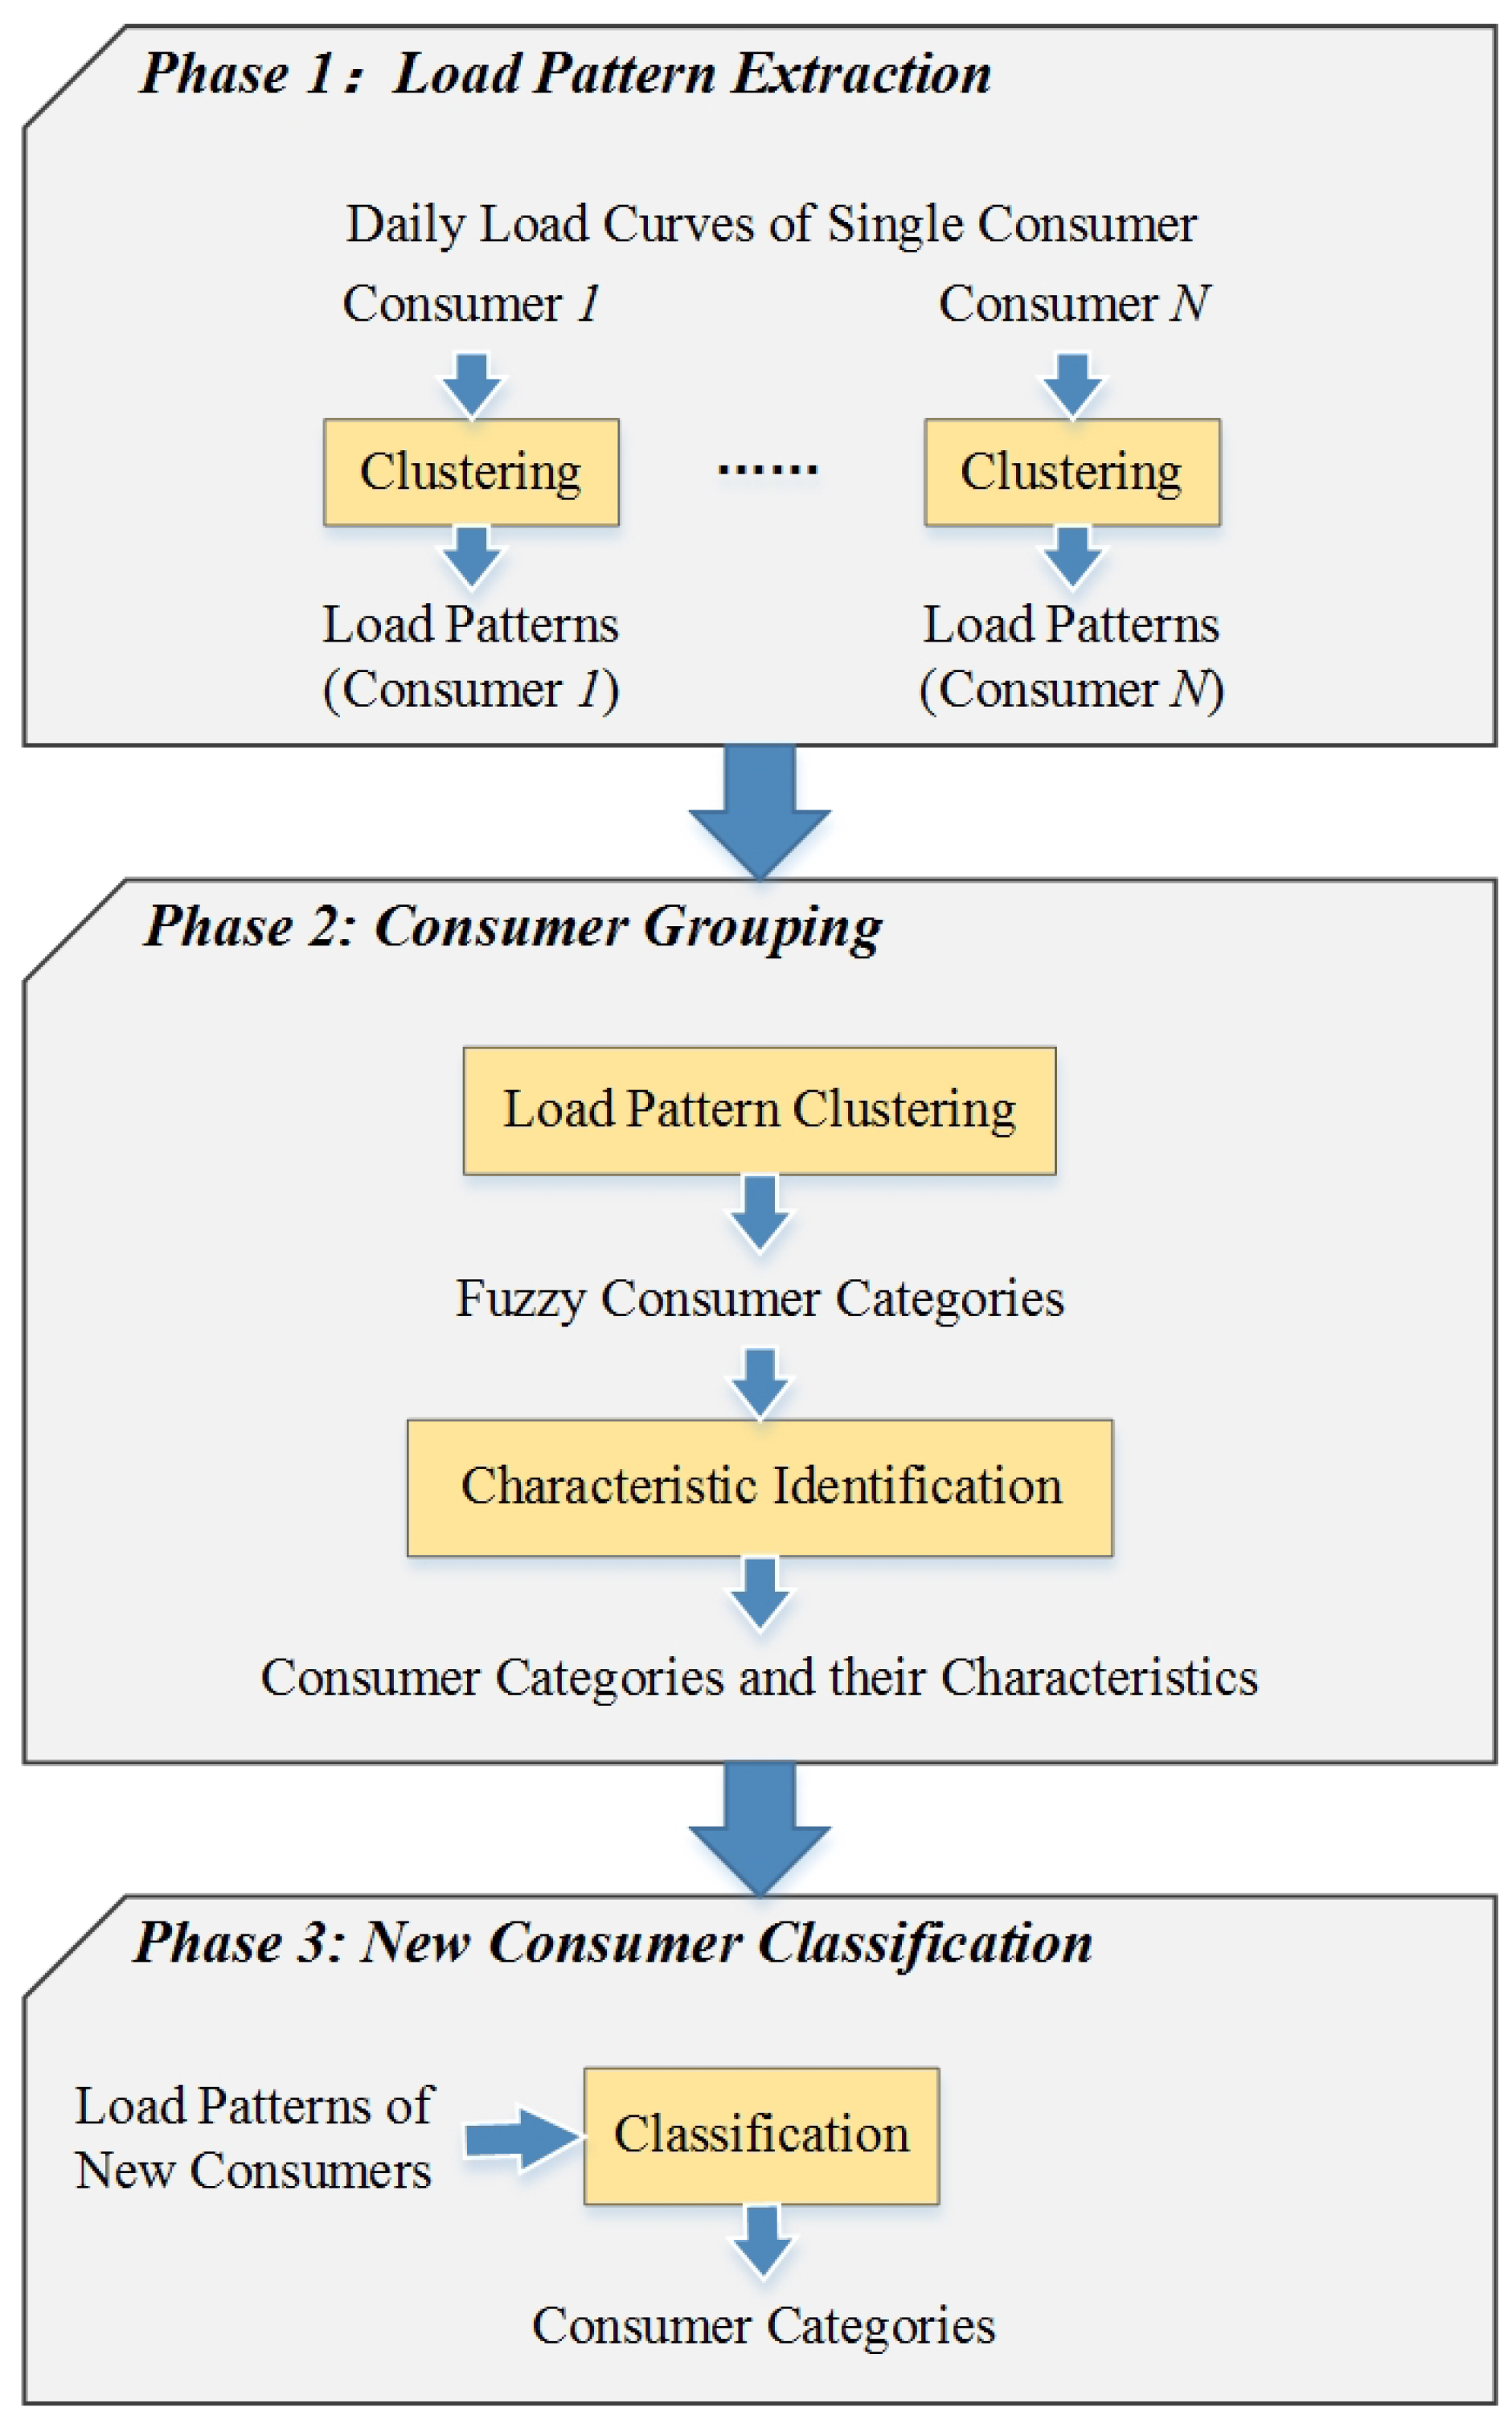
In this section, we introduce a hybrid machine learning model comprising three major phases, as illustrated in Figure 1, to achieve our purpose. The three phases are described briefly as follows:
- Load Pattern Extraction. First, given the daily load curves of N electricity consumers, we extract the load patterns by conducting daily load curve clustering individually for every consumer. Then, we obtain N groups of load patterns.
- Consumer Grouping. Second, overall load patterns of N consumers are clustered into diverse categories based on their similarity through two steps, which are load pattern clustering and characteristic identification. Each consumer category has its own identified electricity consumption characteristic.
- New Consumer Classification. Third, after the load patterns of unlabeled new consumers are extracted, these new consumers can be classified directly according to the identified characteristics of consumer categories.
Additionally, the main variables used in the three phases of the proposed model and their brief descriptions are summarized in Table 1.
3.1. Phase 1: Load Pattern Extraction
In Phase 1, we aim to extract the typical electricity load patterns of every consumer from her/his daily load curves in a certain period. It is generally an unsupervised classification problem because the daily load curves do not contain any prior knowledge of load patterns. As a result, we adopt a clustering algorithm designed specially for load curve clustering in our previous work [2], the details of which are described in Algorithm 1.
In the load pattern extraction of each consumer, n-dimensional daily load curves of this consumer are first reduced dimensionality by -level 1D Discrete Wavelet Transform (DWT) to generate two types of signals, approximation and detail. Then, we obtain two groups of clusters by applying K-means algorithm separately to the normalized approximation signals and the original detail signals. Finally, two groups of clusters are fused together to form the final clusters, the centers of which are the required load patterns. After applying Algorithm 1 individually to N electricity consumers, we obtain N groups of load patterns for the next phase.
3.2. Phase 2: Consumer Grouping
Phase 2 comprises two main steps: (1) clustering of overall load patterns generated by Phase 1; and (2) identification of consumer categories and their typical electricity consumption characteristics. A novel clustering procedure is proposed in Step 1 and another novel algorithm of characteristic identification is proposed in Step 2.
3.2.1. Load Pattern Clustering
This step also aims to solve a clustering problem which is to divide the overall load patterns into groups. The input for this step is the combination of the overall clustering outputs in Phase 1. Thus, we adopt the same clustering algorithm as the one used for load pattern extraction, shown in Algorithm 1.
| Algorithm 1: The algorithm of daily load curve clustering. |
 |
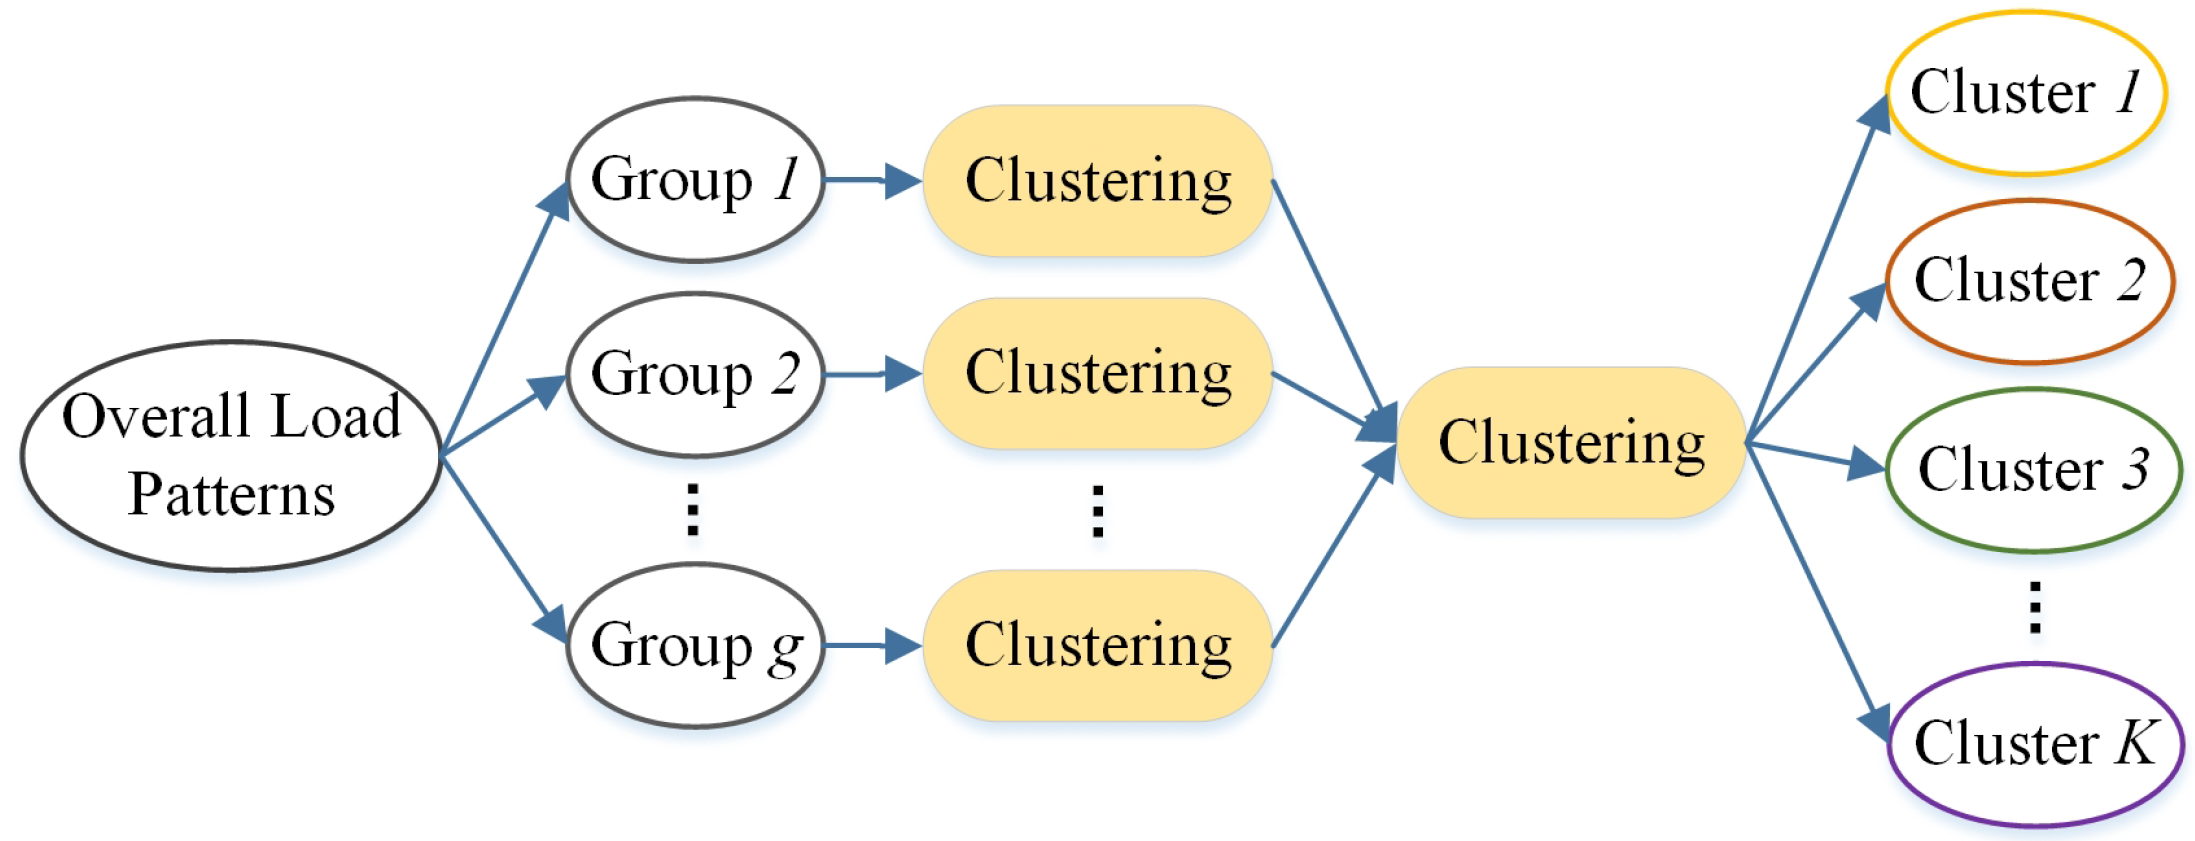
However, the clustering algorithm is not used directly due to the large number of overall load patterns. A novel procedure, shown in Figure 2, is proposed for load pattern clustering. Since clustering excessive objects may lead to few clusters, we should avoid clustering massive load patterns directly. An example that exists in the experiment can be used to explain this problem specifically. Although the best clustering result of thousands of load patterns may be only three clusters based on some assessment index calculations, there actually should be many more clusters. Thus, we randomly divide all load patterns into g groups before conducting load pattern clustering. Each group of load patterns is clustered individually, and then the clustering centers of these g groups are gathered and clustered.
Finally, we obtain K clusters and gain fuzzy consumer categories by mapping these clusters to the input consumers in Phase 1. Here, fuzzy means that a consumer may belong to several categories. Since every consumer has two or more load patterns, it is highly possible that her/his load patterns belong to different clusters.
3.2.2. Characteristic Identification
In this step, we propose an algorithm to identify consumer categories and their characteristics. The principle of this algorithm, shown in Algorithm 2, is selecting the consumers who are in the same several fuzzy categories simultaneously and assigning them to the same consumer category. In fact, this process is similar to finding all frequent itemsets by using minimum support in association rule mining [36,37]. After finding the shared fuzzy categories of the same consumers, the corresponding clustering centers of these shared fuzzy categories can be regarded as the characteristic of one consumer category, and then these consumers belong to this category. As the fuzzy categories refer to the outputs of load pattern clustering, the clustering centers mentioned here actually are curves that are similar to load patterns.
To gain the appropriate clustering centers that present typical characteristics of consumer categories, we propose a parameter to determine whether the clustering centers should be selected. The parameter denotes a percentage of consumers. For example, set the number of consumers and so that . In that case, the clustering centers of several fuzzy categories are selected if the number of consumers who are in the same categories simultaneously is greater than or equal to 45. Then these selected clustering centers can be identified as the consumer characteristic of one category.
3.3. Phase 3: New Consumer Classification
Regarding the identified consumer characteristics as labeled training samples, we can adopt supervised classification algorithm to classify new consumers into the identified categories. There are many algorithms for classification such as decision trees, random forests, support vector machines and neutral network. In this work, we adopt k nearest neighbors (kNN) because it is simple, easy to understand and has relatively high performance [38,39]. Another reason for adopting it is that this phase also aims to verify the accuracy of the identified consumer characteristics apart from classifying new consumers.
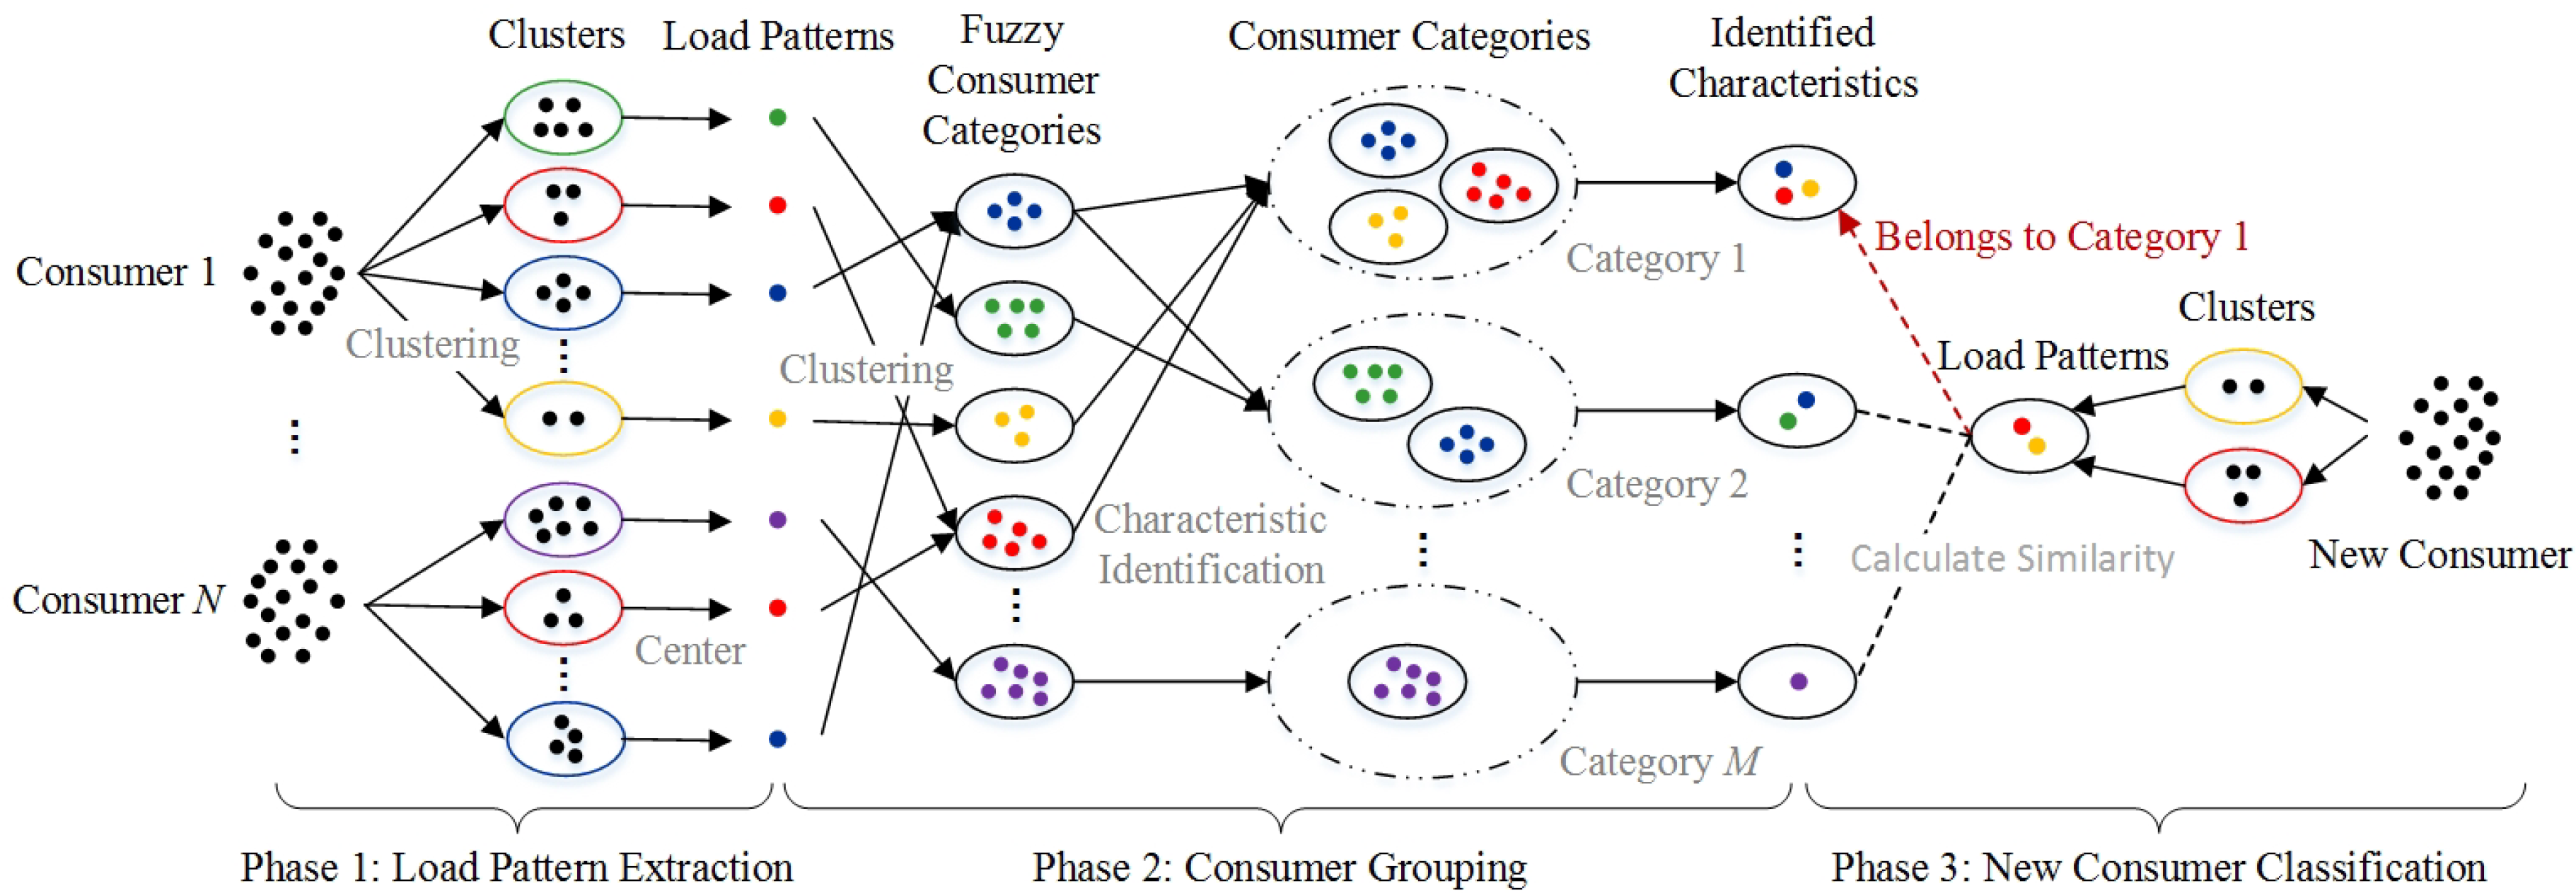
We employ the identified characteristics instead of all load patterns as training samples and set by considering computational efficiency. Figure 3 illustrates the diagram of new consumer classification. Every single spot in the diagram stands for one daily load curve or load pattern. At the right of the diagram, when a new consumer comes, we extract the load patterns of the consumer based on Algorithm 1. Then, we calculate the similarity between the load patterns of the consumer and the identified characteristic of each consumer category. Finally, we can determine that the new consumer belongs to the consumer category with the smallest similarity value. In Figure 3, the consumer belongs to Category 1. Additionally, Figure 3 also illustrates the whole procedure of the proposed model.
| Algorithm 2: The algorithm of characteristic identification. |
 |
For electricity consumers with n-dimensional daily load curves, let be the set of load patterns of a new consumer, and be the identified characteristic of the tth consumer category. Then, for one load pattern to the identified characteristic , we calculate the similarity between them as follows:
where is the Euclidean distance between and , and it is calculated as follows:
where and . The Euclidean distance is adopted because it is also used in the former clustering algorithm. We calculate the similarity between all load patterns and the identified characteristic as the average of over :
Since the similarity is based on the distance calculation, we suppose that, the smaller the value is, the more similar they are. After the calculations of similarity between the load patterns of the consumer and each identified characteristic, we assign this consumer to the most similar category with the smallest value.
4. Data and Experiment
Before presenting the experimental results, we introduce the experimental setups including dataset, comparison methods and evaluation criterion in this section. We conducted ten times experiments in each of three situations and adopted both example and the average result for further evaluation and comparison.
4.1. Dataset
The dataset we used in the experiment contains 24-value daily load data of 1168 non-residential electricity consumers in a one-year period. Available at: https://openei.org/datasets/files/961/pub/. The whole dataset contains 14,976 non-residential consumers in 936 locations. Only data in one state were selected and used in the experiments. These consumers locate in 73 locations of the same district and are labeled with their consumer types, including sixteen different types which are restaurant, school, office, supermarket, etc. However, these consumer types refer to their building types and are not equal to the consumer categories that we require [40]. They cannot be used as labels for assessing the accuracy of clustering and classification. Therefore, we regarded all data as unlabeled data in the experiments and only used the consumer types for further discussion.
Additionally, 80%, 60% and 40% of daily load data were randomly selected from each consumer as training data in clustering phase, respectively. The remaining 20%, 40% and 60% of data were used for testing in classification phase.
4.2. Comparison Methods
We compared the following methods on new electricity consumer classification with load pattern grouping. The clustering algorithm used in the former three methods is K-means, and data were normalized before clustering. We applied the same classification algorithm kNN for all methods in classification stage to compare the validity of consumer categories and their characteristics.
- LP-Max Energy: The load pattern with the maximum daily energy was selected as representative for each consumer as input for Phase 2 [15]. Normalization and clustering algorithm were the same as LP-Large Cluster.
- LP-Peak Load: The load pattern with the peak load was selected as representative for each consumer as input for Phase 2 [15]. Normalization and clustering algorithm were the same as LP-Large Cluster and LP-Max Energy.
- The proposed method: The method introduced in Section 3. All load patterns were selected for each consumer as input for Phase 2. Algorithms 1 and 2 were adopted in Phase 1 and 2. The identified characteristics of consumer categories in Phase 2 were used as the training samples in Phase 3.
4.3. Evaluation Criterion
A criterion is required to evaluate the performance of the identified consumer characteristics and new consumer classification. We adopted Accuracy for our multi-classification problem rather than Precision and Recall which are usually used for dualistic classification [5,41]. However, it is also necessary to take into account information loss because our comparison methods employ different representative load patterns for consumer categorization, some of which lead to the loss of load pattern information. Thus, we defined a new Accuracy with weight of information loss (WIL), called Accuracy-WIL, to evaluate our comparison methods. As the original simple Accuracy measures the percentage of correct classified data compared to pre-defined class labels, we added a weight of information loss for each new consumer. For new consumers, is the classified category of the ith consumer, is pre-defined category of this consumer, and is the weight of information loss calculated for this consumer. Then, the calculation of Accuracy-WIL follows the equation below:
where is indicator function and is defined as follows:
The weight of information loss for each consumer measures the percentage of daily load curves that are included in the selected representative load patterns for classification. As a result, the weight of information loss for the ith consumer is calculated as follows:
where denotes the total number of daily load curves that a consumer has for load pattern extraction, and denotes the number of daily load curves included in the cluster that the selected representative load pattern refers to. Since the proposed method selects all load patterns as input for load pattern clustering, its weight of information loss always equals 1.
In the experiment, we randomly selected 20%, 40%, or 60% of daily load data from each consumer as data of new consumers, respectively. In that case, the classification of a consumer is accurate if both clustering result and classifying result of this consumer refer to the same category. This is a strict rule to measure the accuracy and is highly possible to cause lower accuracy. However, it is more appropriate for massive unlabeled data than other common rules.
5. Results and Discussion
In this section, we present and discuss the experimental results of all three phase in our model, which are load pattern extraction, consumer grouping, and new consumer classification. As we conducted extensive experiments, only some examples or the optimal results are provided to understand the electricity consumption behaviors and identified consumer categories. Case examples, which are presented in Section 5.1 and Section 5.2, are from the same experiment with the optimal new consumer classification result. Moreover, comparison of the methods on consumer categories and new consumer classification evaluated the validity of the proposed method. We also estimated the parameter, as shown at the end of this section.
5.1. Load Pattern Extraction
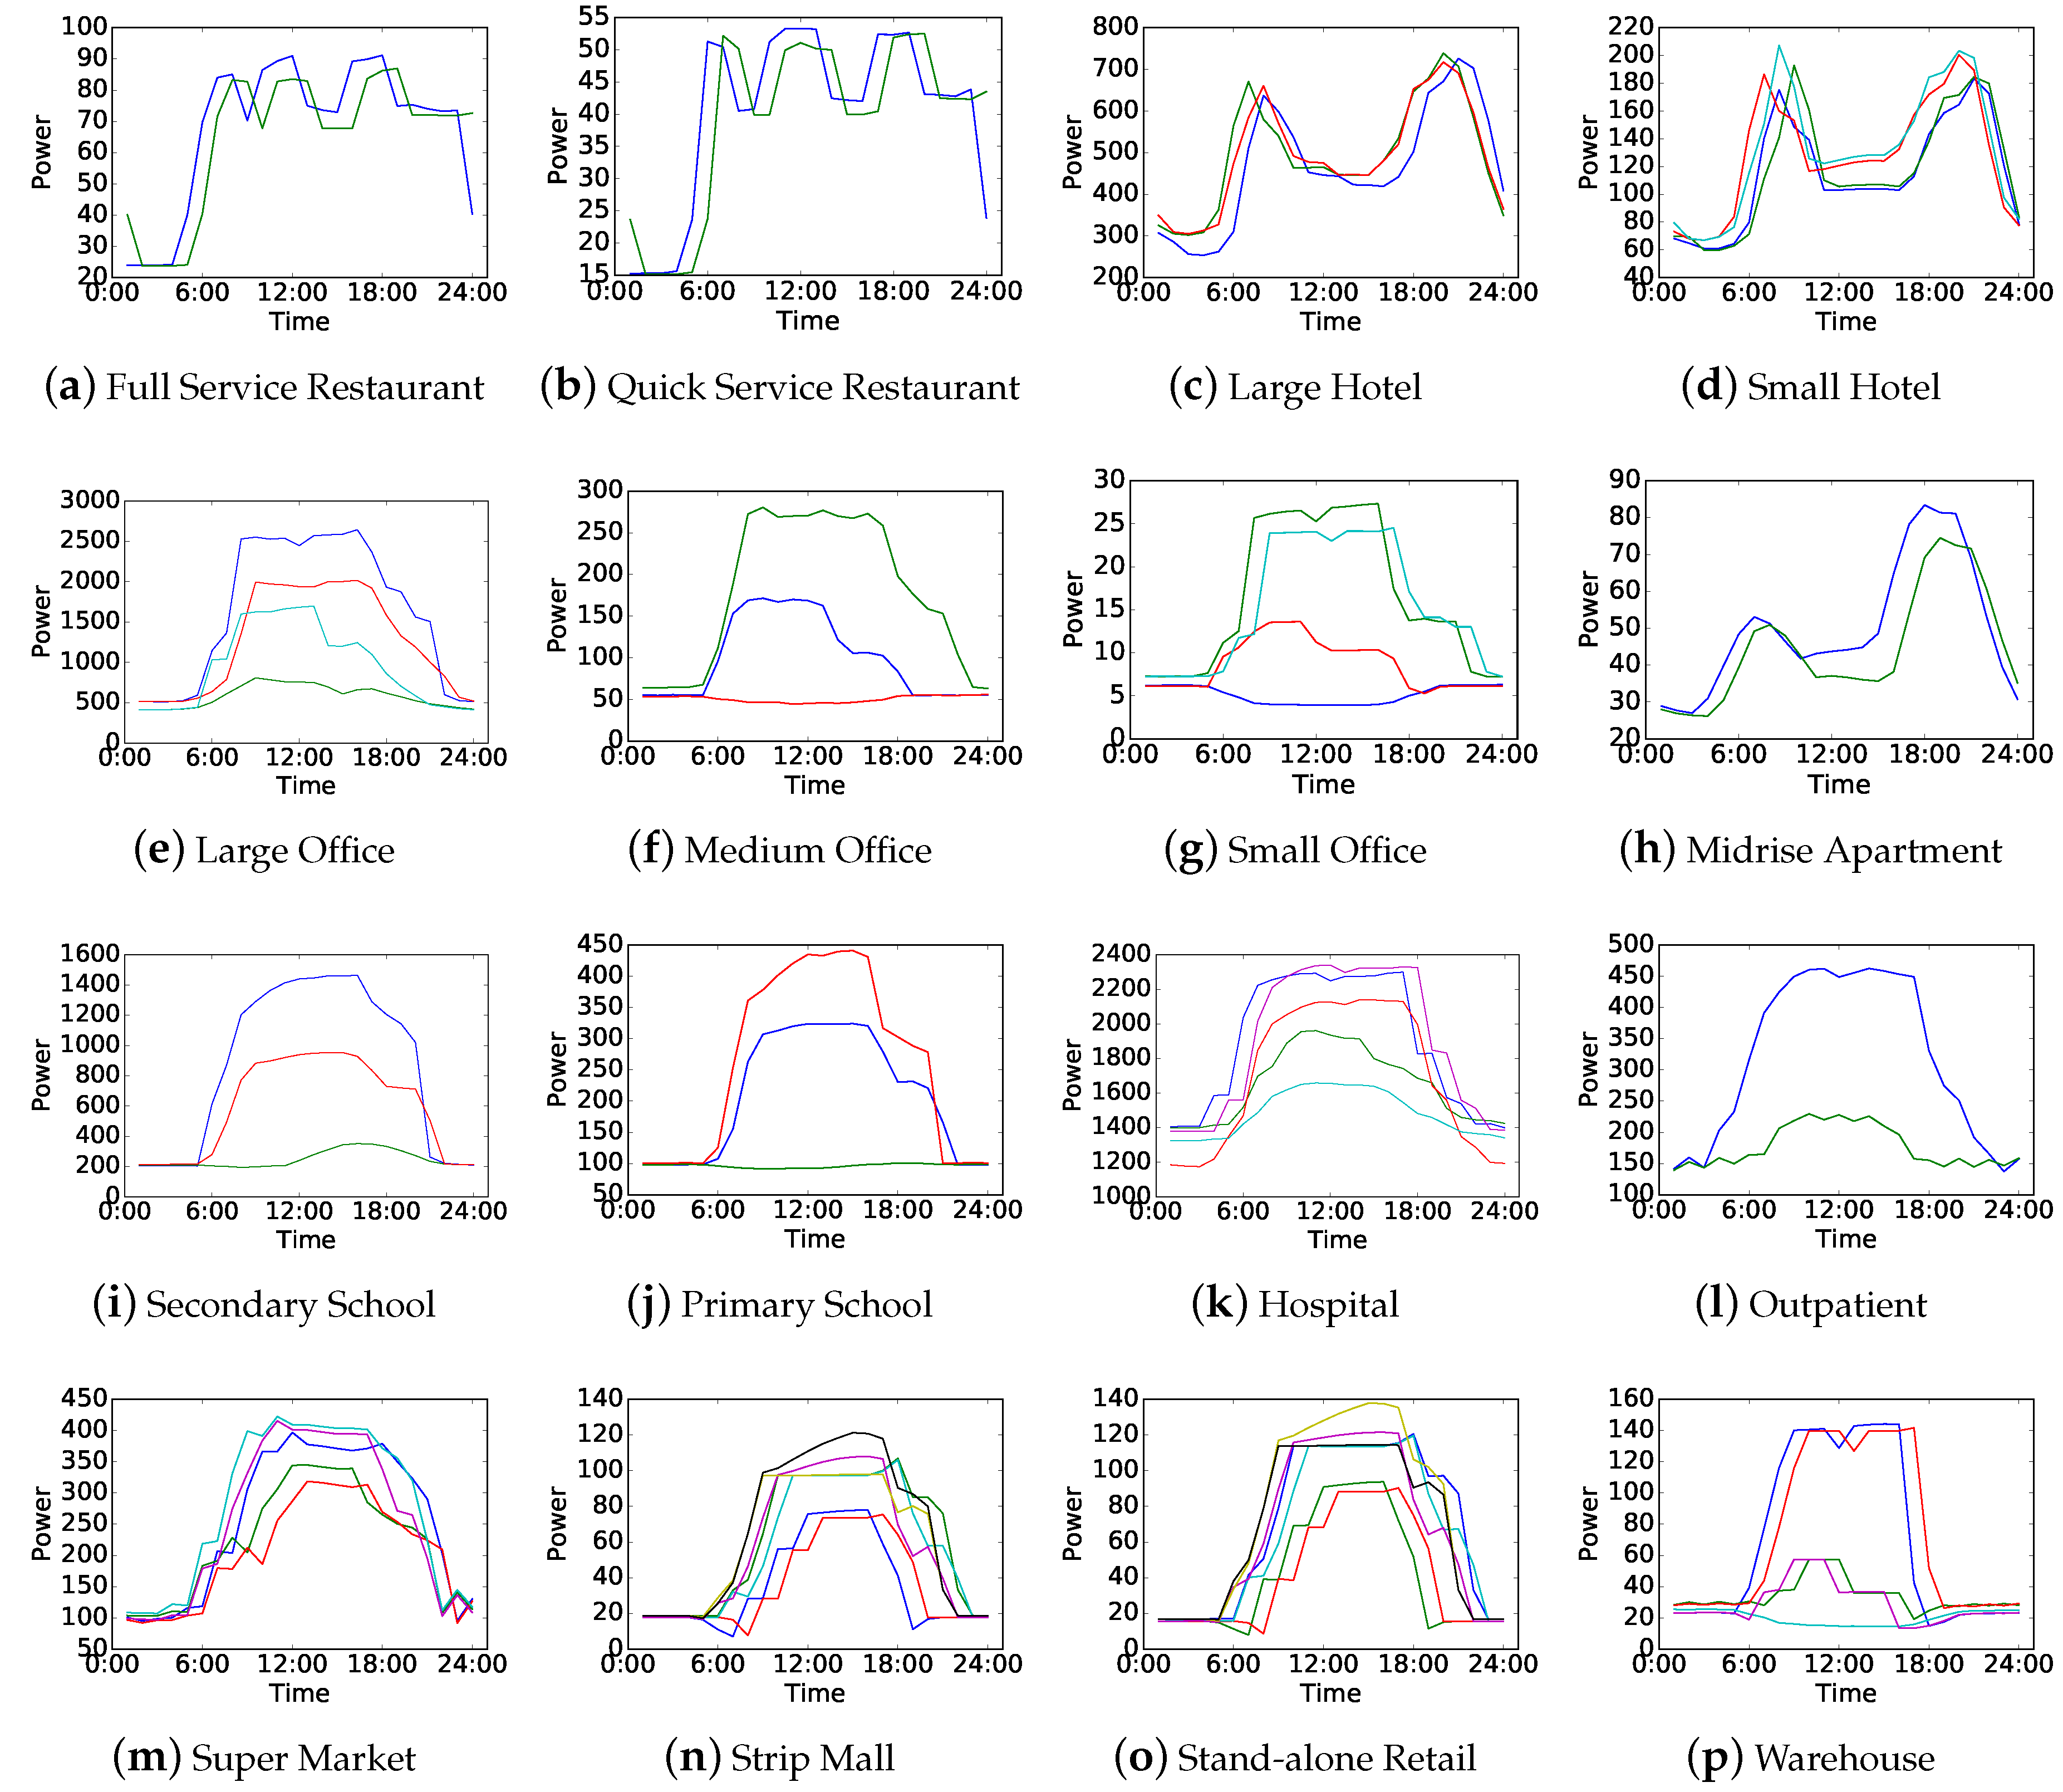
The daily load curves of 1168 electricity consumers in training dataset were clustered individually for every consumer to extract the load patterns. According to Algorithm 1, each consumer has load patterns with the number in the range of 2–10, and each load pattern indicates one typical electricity consumption behavior of a consumer. We selected sixteen electricity consumers in a district to provide one example of load patterns for every consumer type in the dataset, as shown in Figure 4. The load patterns were obtained from one of ten experiments with 60% training data and also used as the inputs in the following load pattern clustering shown in Figure 5.
Each subfigure in Figure 4 denotes the load patterns of one electricity consumer who refers to one consumer type, also called building type, in the dataset. Load patterns of the similar consumer types are displayed next to each other. Therefore, it can be noticed that similar consumer types may have similar load pattern curves without considering their power degrees, and different consumer types may also have similar load pattern curves. In that case, the consumers who have similar load pattern curves can be clustered into the same groups in the following consumer grouping.
5.2. Consumer Grouping
Consumer grouping consists of load pattern clustering and characteristic identification. The former one generates fuzzy consumer categories and the latter one is able to distinguish clear consumer categories from those fuzzy ones. We mainly present and discuss the experimental results of Phase 2 in the proposed method, comparing with the grouping results of other three comparison methods.
5.2.1. Load Pattern Clustering
In load pattern clustering, we first gather all load patterns of 1168 consumers into one group and randomly divide them into g equal subgroups. Here, we set optionally. Then, the load patterns in each subgroup are clustered individually and the clustering centers of these g subgroups are gathered together to form the final clustering.
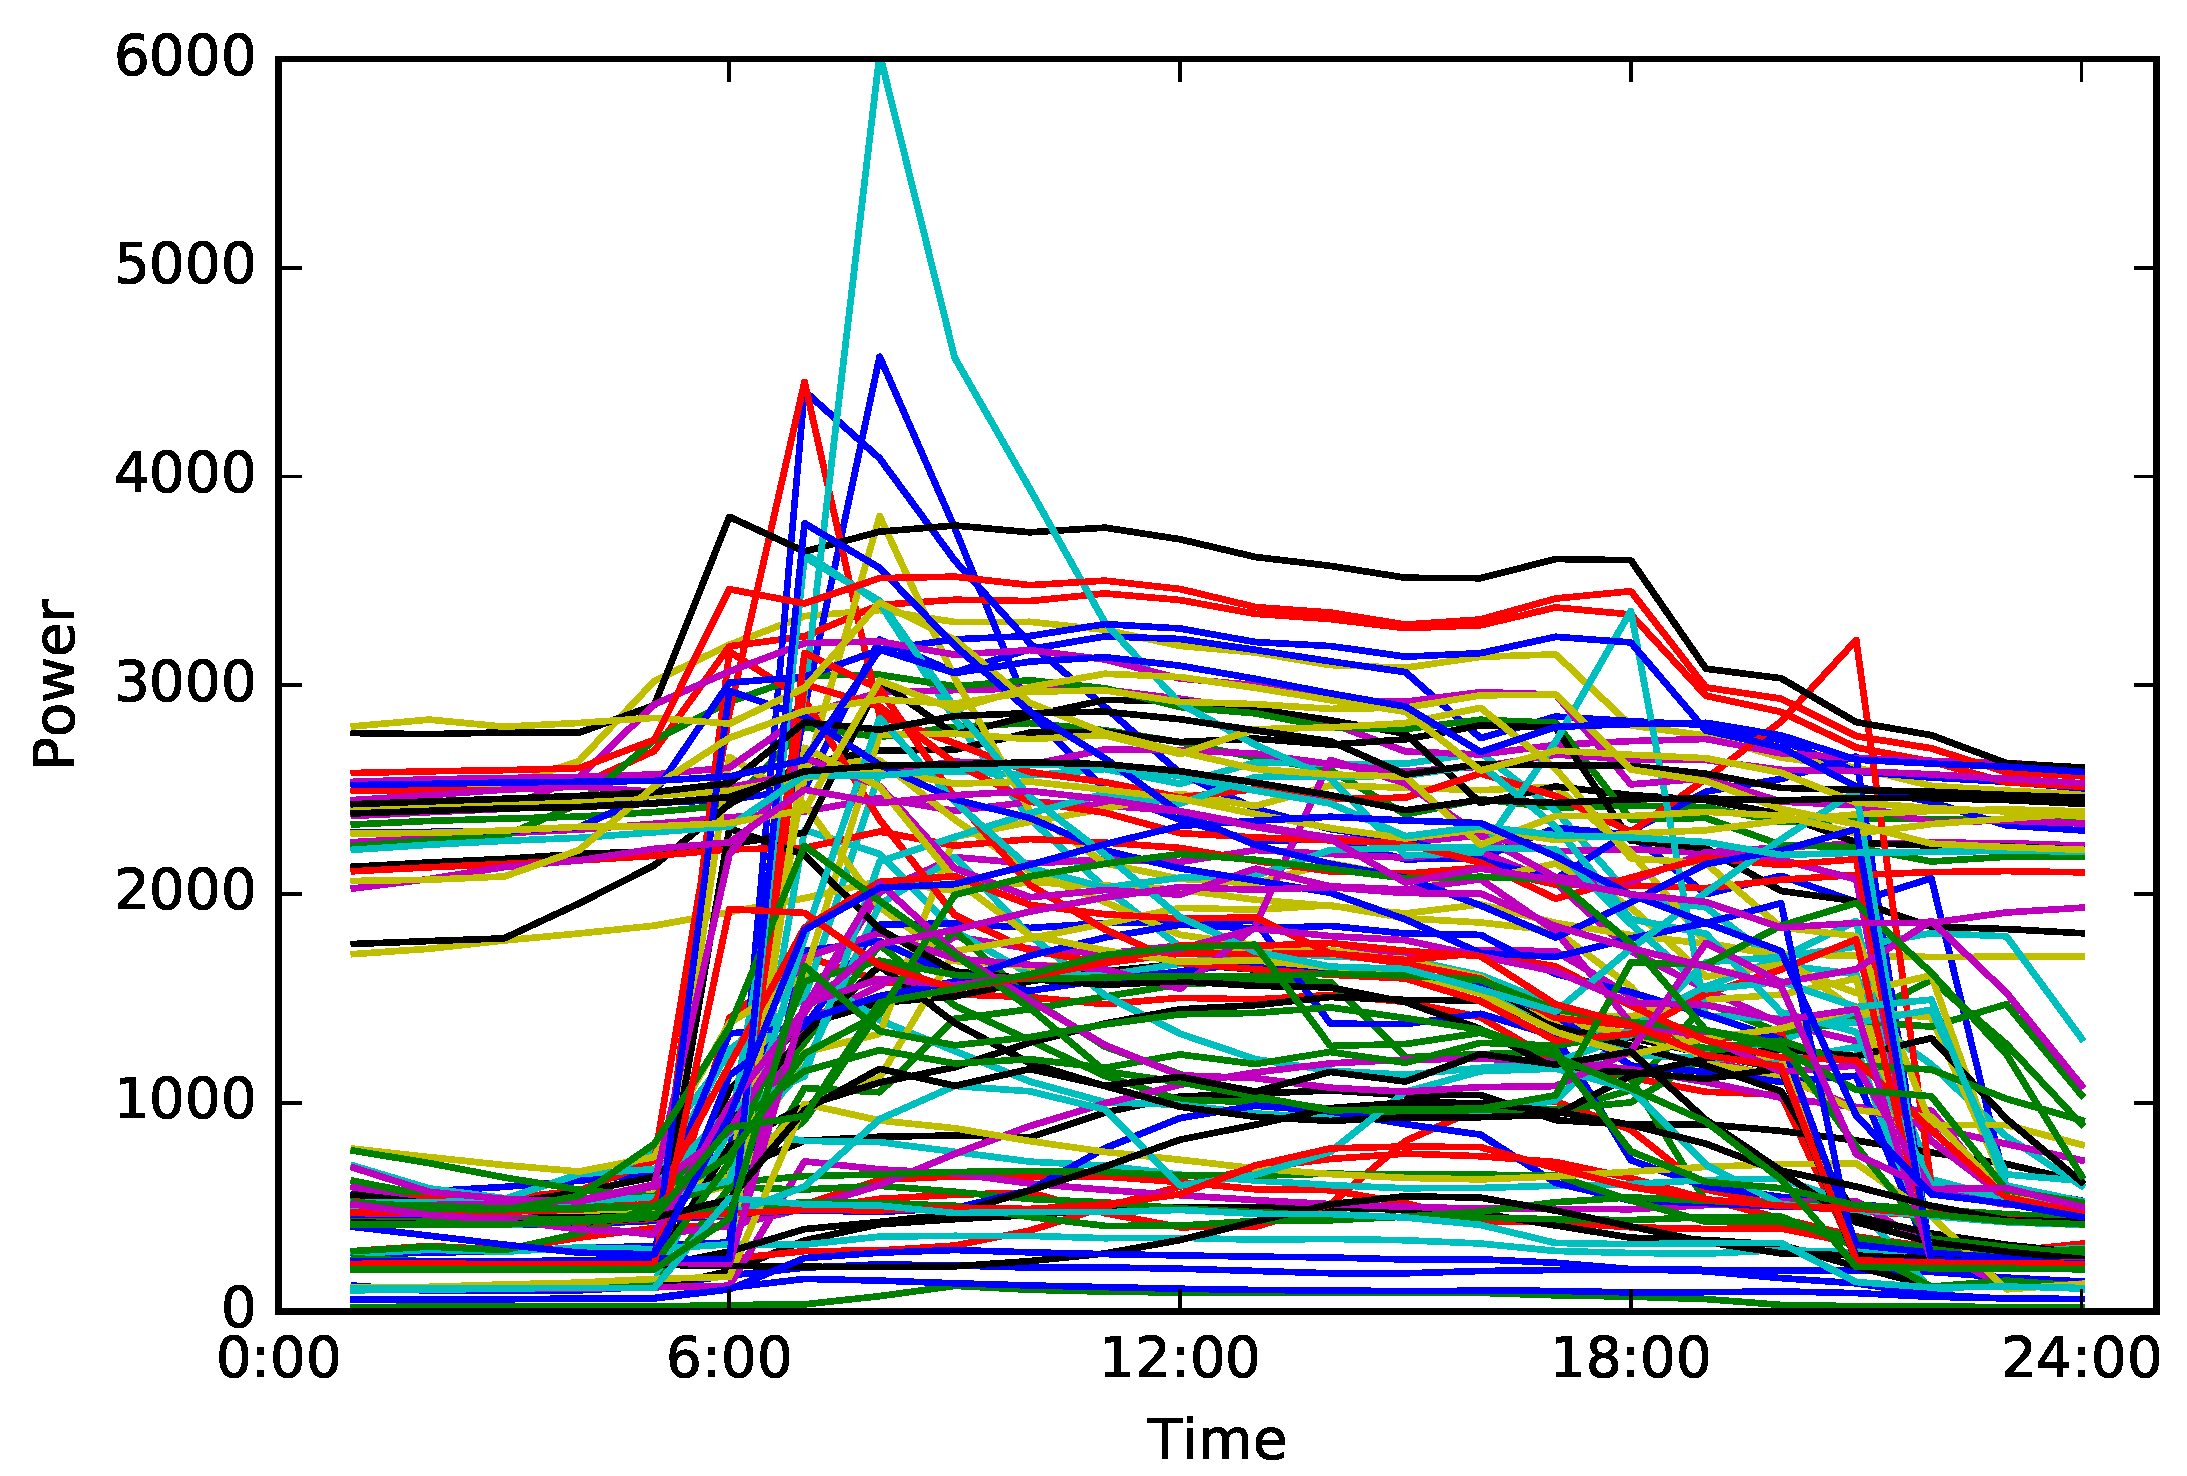
Figure 5 shows the load pattern clustering result, which is one example of ten experiments with 60% training data. There are 100 clustering centers in Figure 5, each of which refers to one fuzzy consumer category. It should be noticed that the number of fuzzy consumer category is relatively large and the category characteristics are indistinct. Only a few of category characteristics can be identified by visual observation. Therefore, it is essential to perform the following characteristic identification and gain distinct consumer categories.
5.2.2. Characteristic Identification
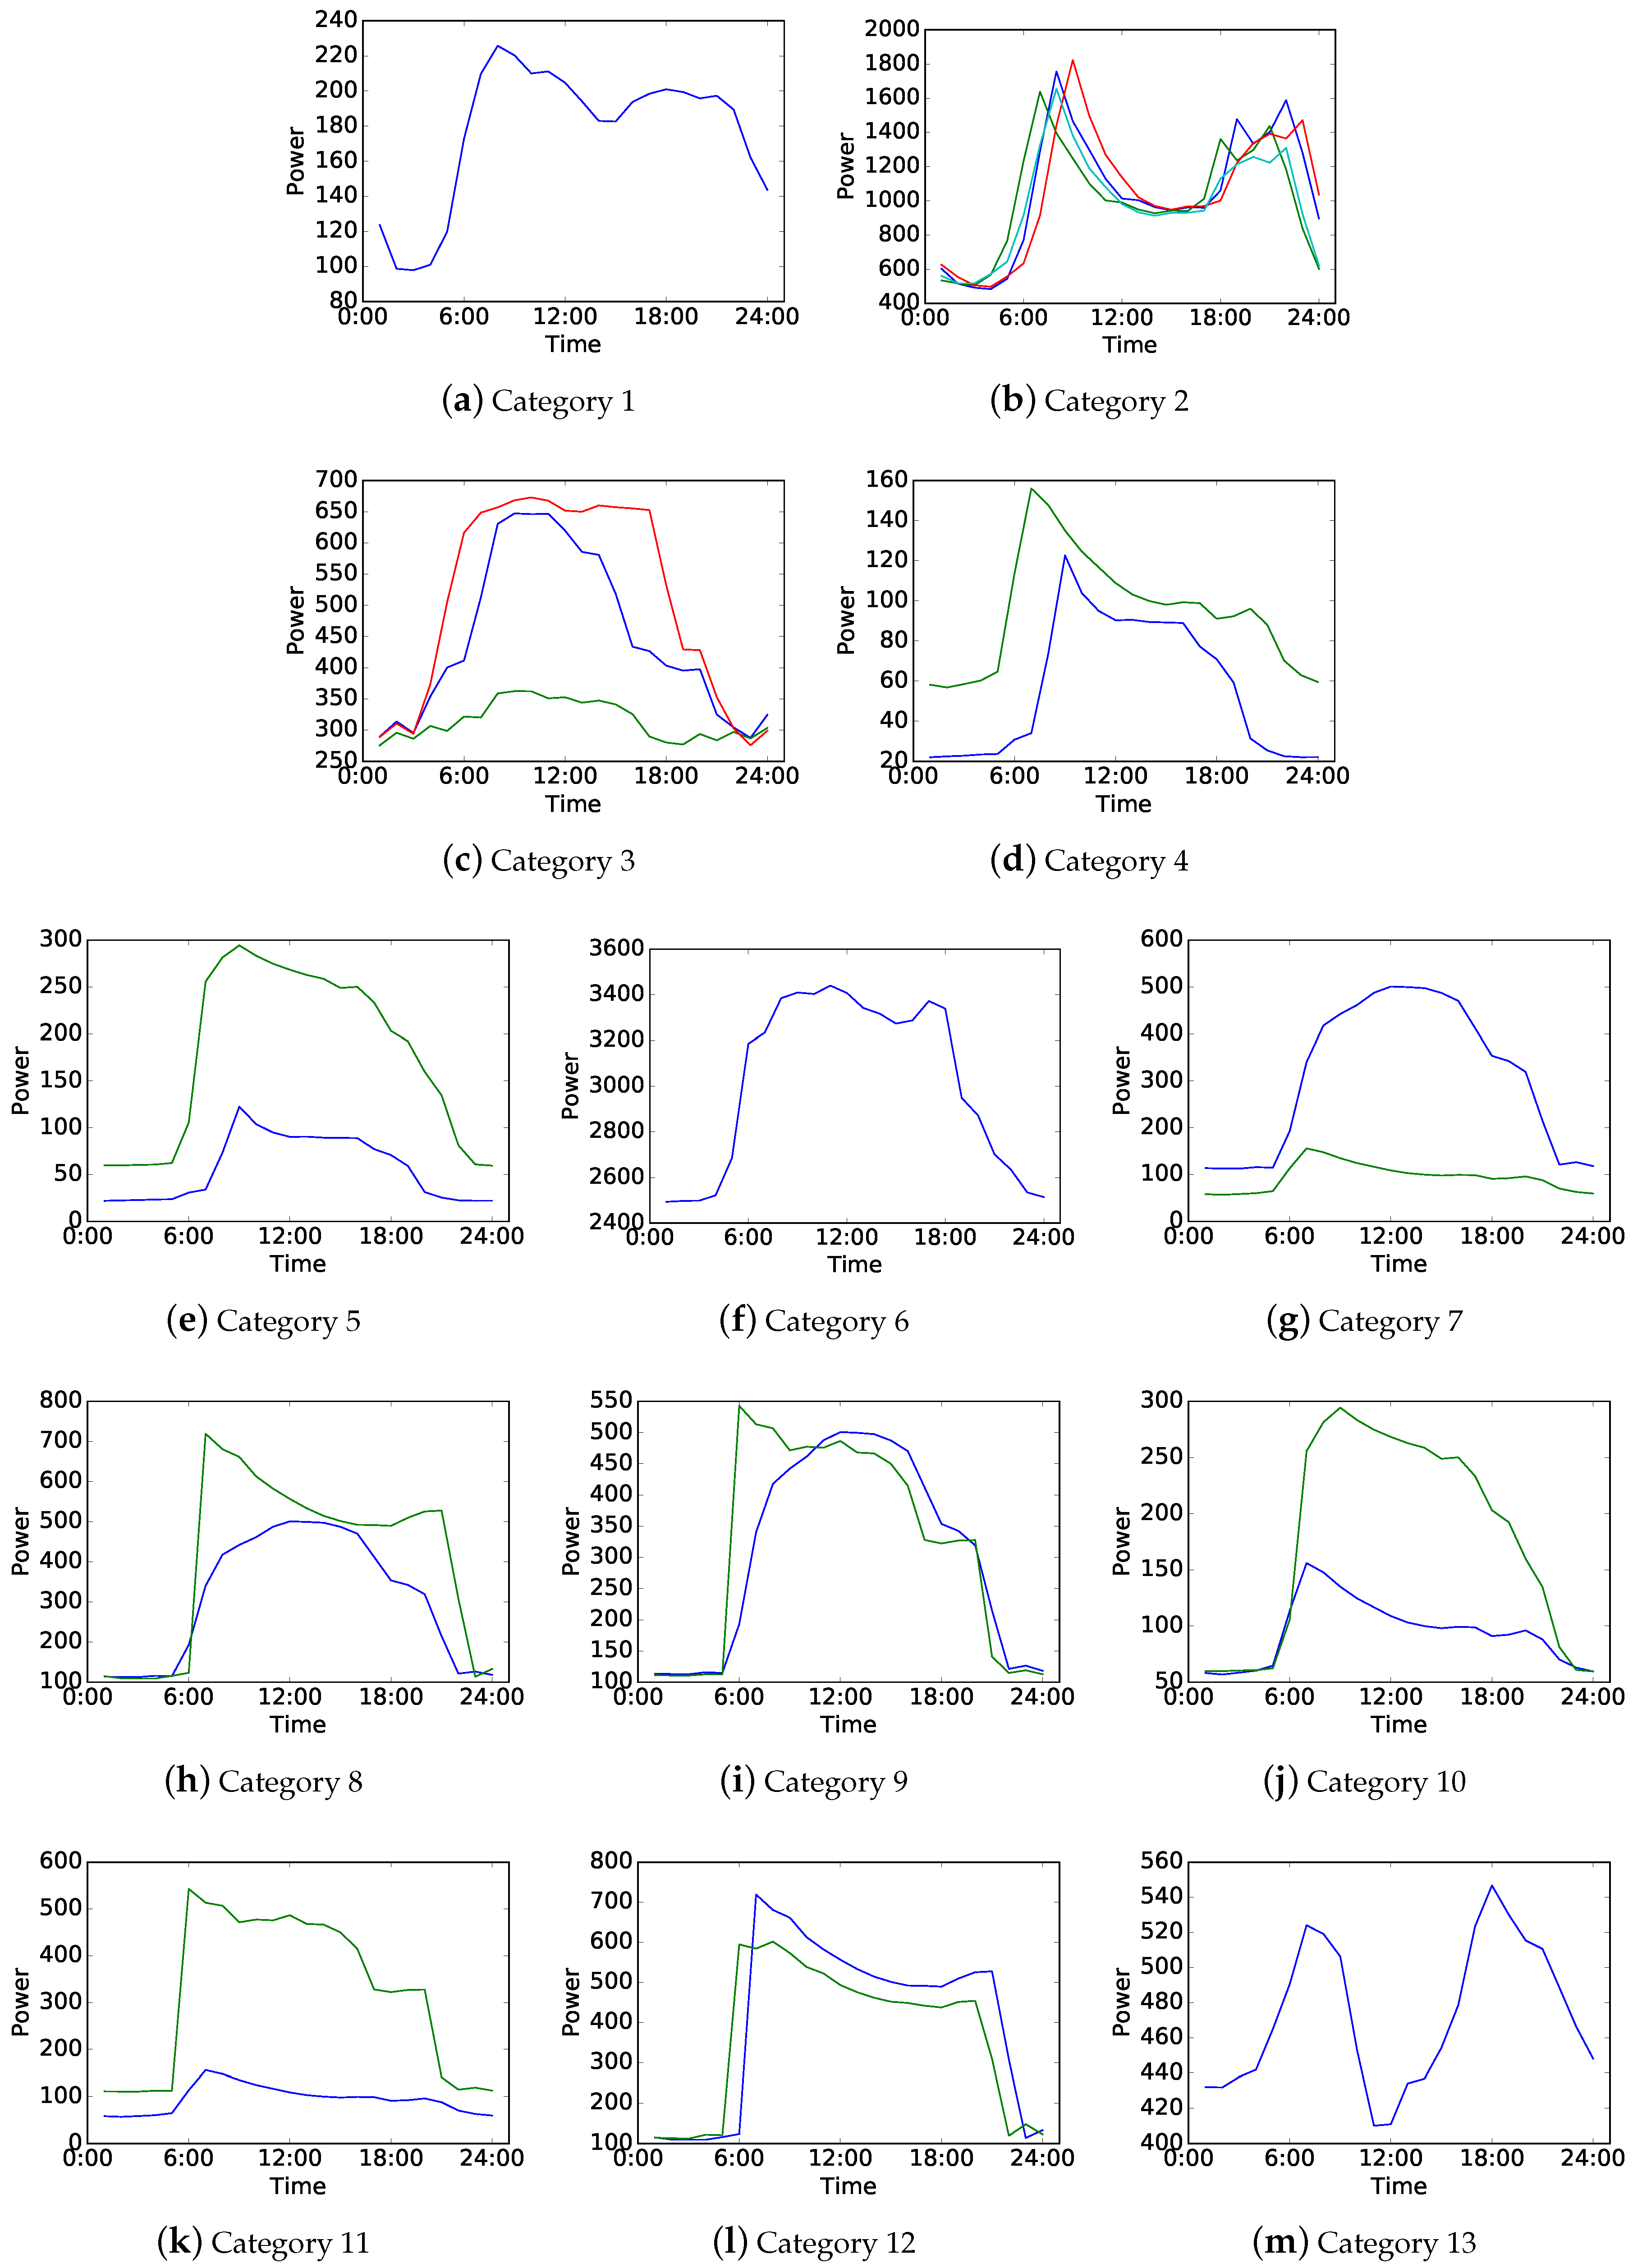
According to Algorithm 2, thirteen electricity consumer characteristics, shown in Figure 6, are identified from the load pattern clustering result shown in Figure 5 when . Here, is selected because it leads to the maximum accuracy of new consumer classification. We can regard each subfigure shown in Figure 6 as the characteristic of an electricity consumer category.
We analyze the final results of consumer grouping and find out some details on consume types, consumer categories and their characteristics. Some categories only contain one consumer type. Category 2, Category 3, Category 6, Category 12 and Category 13 refer to large hotel, outpatient, hospital, supermarket and large office, respectively. This means that such characteristics are unique for these consumers. Both Category 7 and Category 11 refer to primary school but show distinct characteristics. They contain day off with nearly the same low electricity consumption curve, but the other curves show different shape variations. In addition, Category 3 and Category 6 are two types of medical institution. The comparison between them indicates that outpatient has a more flexible working situation while hospital is relatively stable.
On the other hand, some categories contain several consumer types because these consumers have similar electricity consumption behaviors. For instance, both Category 8 and Category 9 refer to primary school and supermarket. Comparing them with Category 7, Category 11 and Category 12, we can find that some of them may share one similar curve but their characteristics are obviously distinguishable from each other. Furthermore, Category 1, Category 4, Category 5 and Category 10 all refer to medium office, strip mall and stand-alone retail. However, Category 4 also contains midrise apartment and warehouse, and Category 1 contains secondary school, warehouse, full service restaurant and small hotel.
It can be concluded that the electricity consumption situation of non-residential consumers are complicated based on the former analysis. Large or special institutions usually have their distinct characteristics (e.g., large hotel, large office, hospital, outpatient and supermarket). Others such as some medium and small institutions or similar consumer types may have the same characteristics (e.g., medium office and small office, strip mall and stand-alone retail).
Furthermore, power degrees may have slight influences on consumer grouping based on the comparison between Figure 6 and Figure 4, although the clustering algorithm adopted in the proposed method focuses on the different shape variation of load pattern curves rather than power degree difference. In that case, large or special institutions with high and distinct power degrees tend to be distinguished from other smaller institutions which are at close range of power degrees. This leads to the results that coincides with the above conclusion.
5.2.3. Comparison
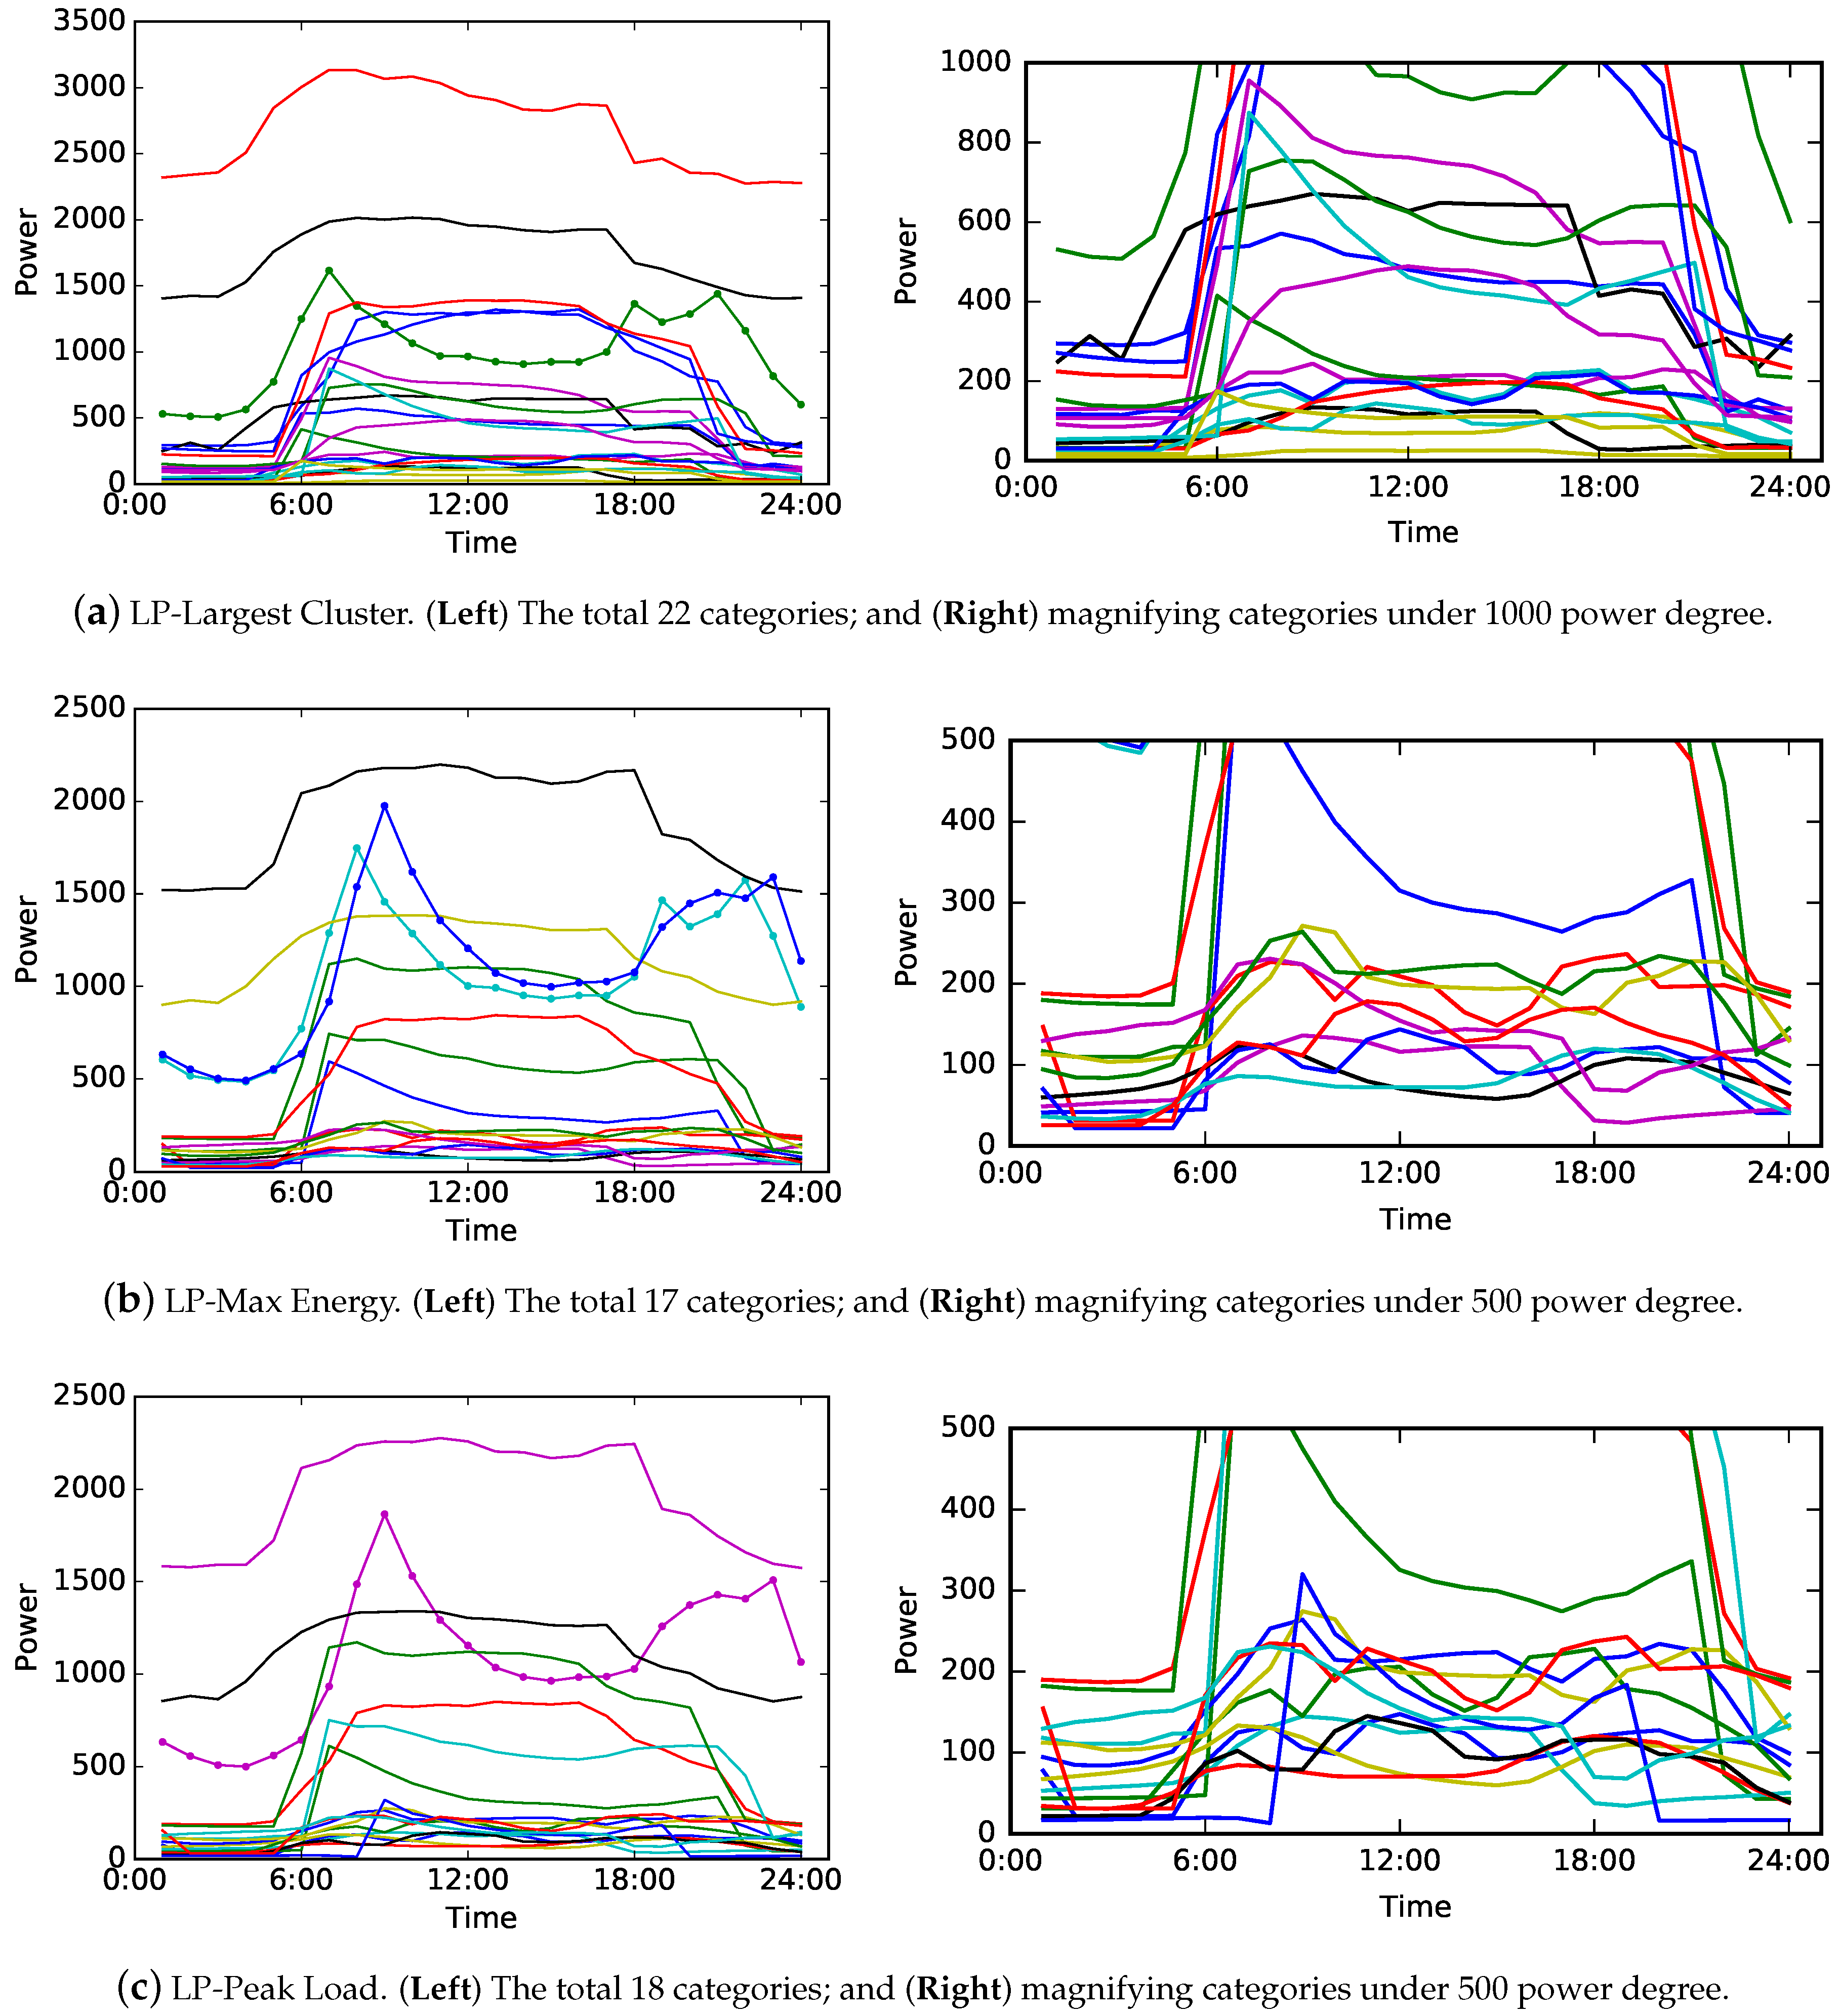
The consumer categories obtained by the three comparison methods are also shown in Figure 7 for further evaluation. Differing from the proposed method, three comparison methods only adopt one representative load pattern from the load patterns of every consumer. As a result, their load pattern clusterings can directly present the results that consumer grouping requires. Figure 7a–c show the group of electricity consumer characteristics obtained by one method, respectively. Each curve in every subfigure representatives one consumer category. Figure 7a–c (Left) show the characteristics of total consumer categories of methods, and Figure 7a–c (Right) magnify the characteristics of partial consumer categories which are dense under certain power degrees.
Specifically, Figure 7a presents twenty-two load pattern curves which denote the characteristics of twenty-two consumer categories obtained by LP-Largest-Cluster. The characteristics under 1000 power degree are magnified in order to be displayed explicitly. Figure 7b,c present the characteristics of seventeen and eighteen consumer categories obtained by LP-Max Energy and LP-Peak Load, respectively. Their characteristics under 500 power degree are magnified and displayed on the right part of the subfigures.
The results shown in Figure 7 are obtained based on the same training data as Figure 4 and Figure 6. In that case, we compare the result shown in Figure 6 with them to evaluate the performance of the proposed method. There are some similar characteristics that are shown in the results of four methods. For instance, Figure 7a–c reveal one or two curves with markers which are similar to the curves shown in Figure 6b. Figure 7a,c only reveal one such curve which simply represents the characteristic of one consumer category. Although Figure 7b reveals two such curves, they are separate and refer to two different consumer categories. However, this does not coincide with the actual characteristic of consumers. According to the analysis mentioned above, such characteristic with several curves shown in Figure 4c and Figure 6b refer to large hotel. LP-Largest Cluster and LP-Peak Load only identify one special load pattern curve for large hotel, and LP-Max Energy improperly divides large hotels into two different categories. Therefore, load pattern clustering with only one selected load pattern results in the insufficient characteristics of consumer categories or incorrect consumer grouping.
5.3. New Consumer Classification
The former comparison of four methods are based on visual observation. In this subsection, the accuracy of new consumer classification can provide a better comparison of these methods. Once we obtain the identified characteristics of every consumer category, we can perform new consumer classification by regarding those characteristics as training samples. Therefore, the accuracy of this new consumer classification can be used to evaluate the performance of the comparison methods.
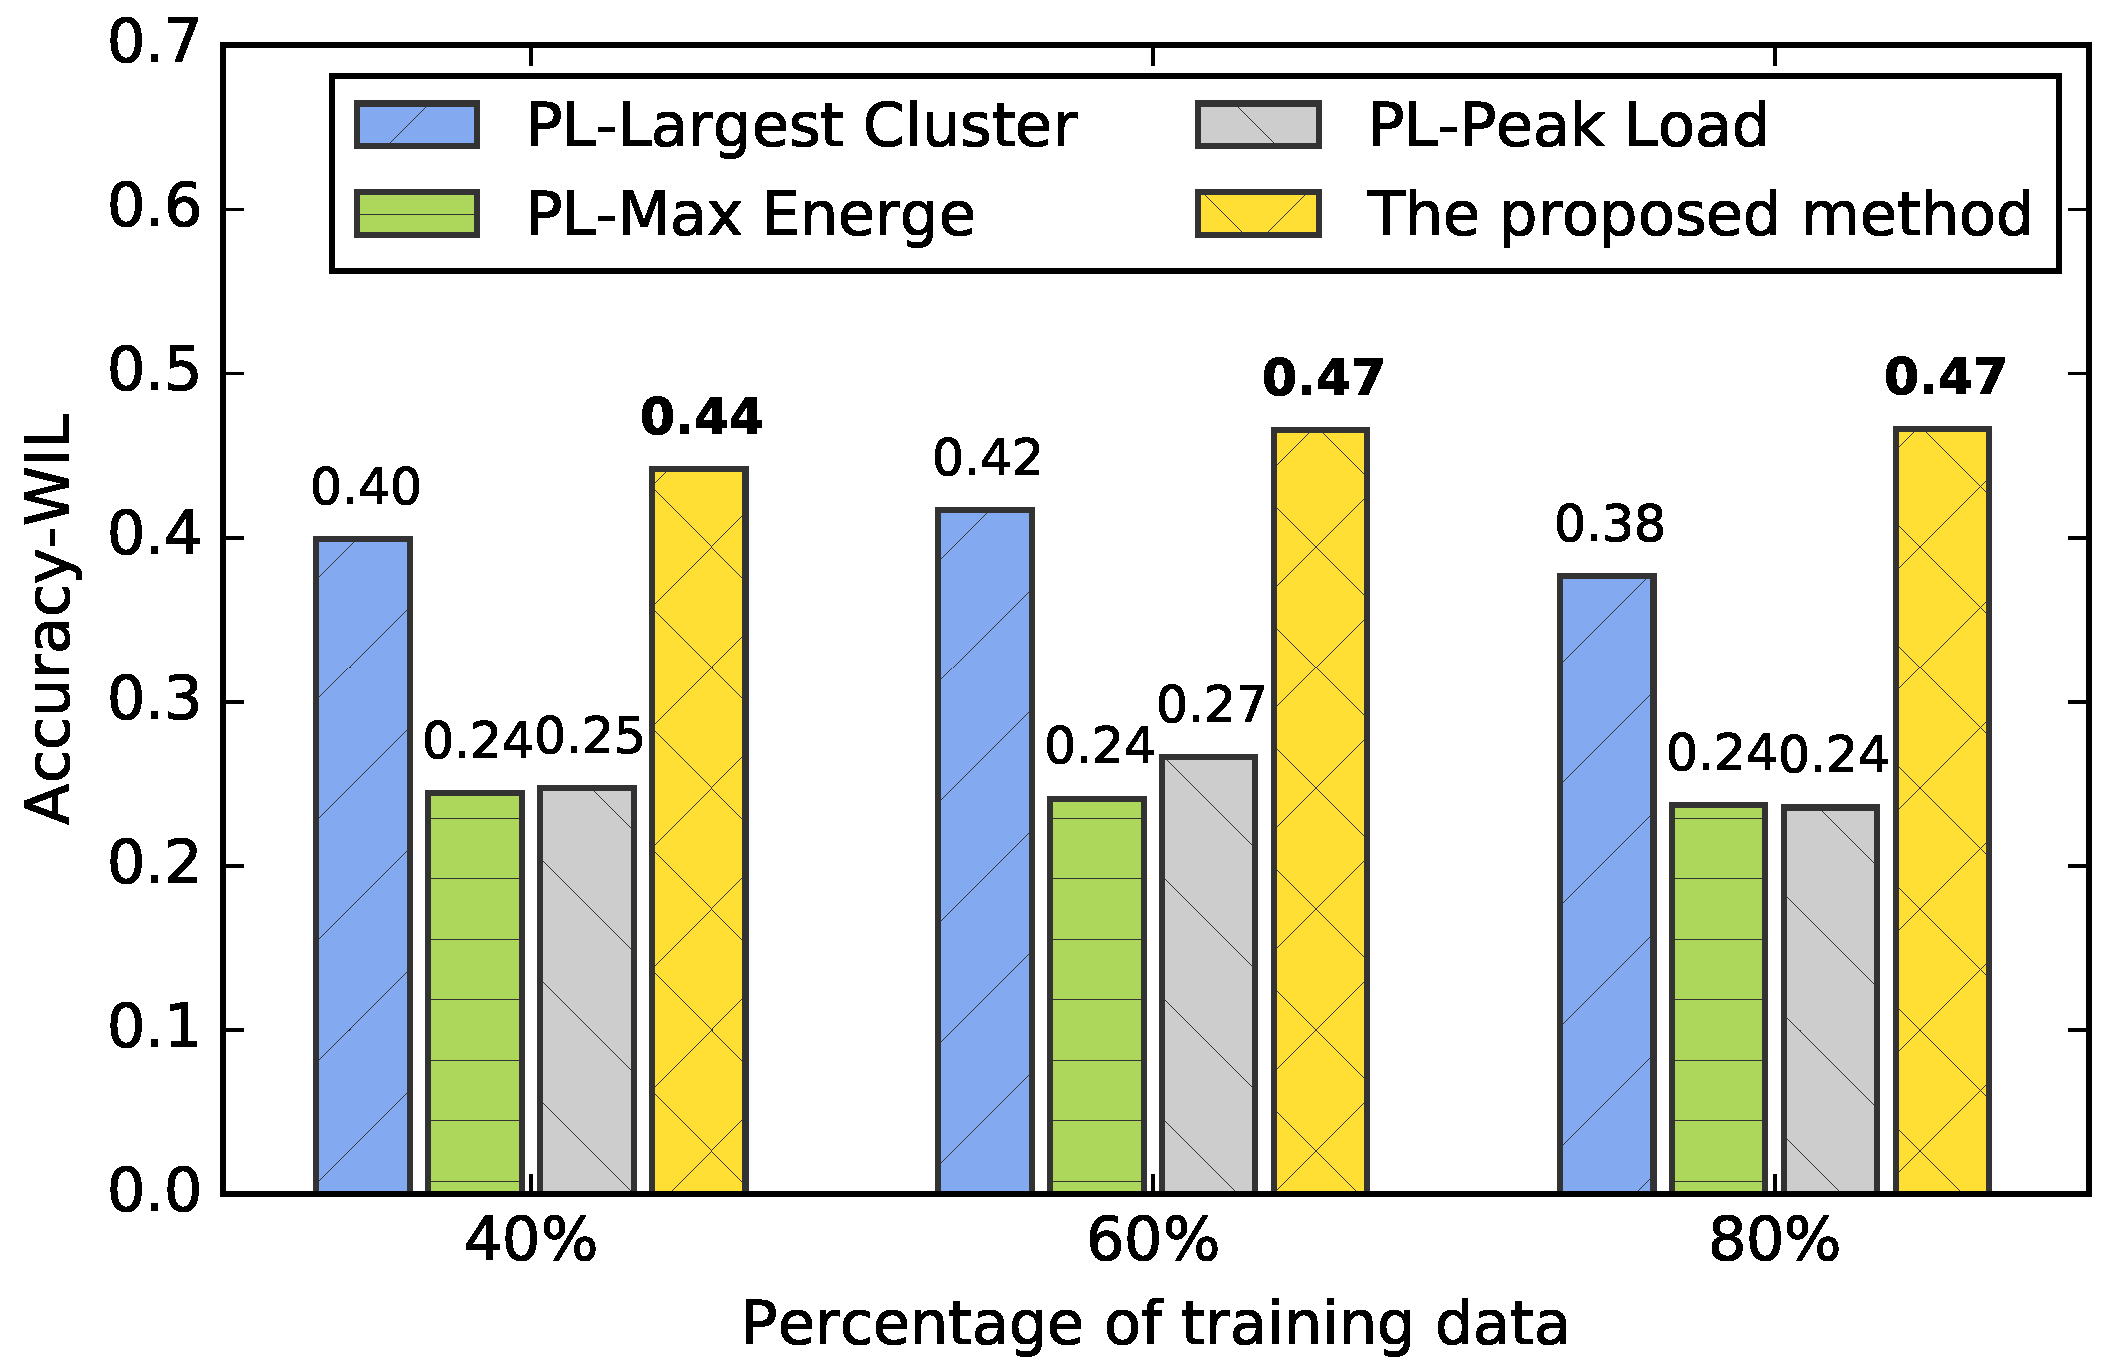
Figure 8 illustrates their average Accuracy-WIL of ten experiments based on 40%, 60% and 80% training data in new consumer classification. The proposed method shows a significant improvement of Accuracy-WIL in three situations. Sufficient training data can increase its average Accuracy-WIL based on the comparison of three situations. On the other hand, although PL-Largest Cluster shows the second highest average Accuracy-WIL, it is unable to identify consumer characteristics that the proposed method is able to achieve due to the one representative load pattern selection mechanism. In general, consumer characteristics with several distinct load patterns present their electricity consumption behavior features more sufficiently than those with only one load pattern. Therefore, the proposed method outperforms other comparison methods.
In addition, it should be noticed that all values of the Accuracy-WIL are relatively low because of the strict measuring rule mentioned in Section 4. The values will increase dramatically if we use consumer types as labels for measuring Accuracy-WIL in classification phase. Nevertheless, our previous work [40] proves that such consumer types are not appropriate for being labels because consumers in different types may have the similar electricity consumption behaviors which lead them to be assigned into the same consumer categories.
5.4. Parameter Estimation
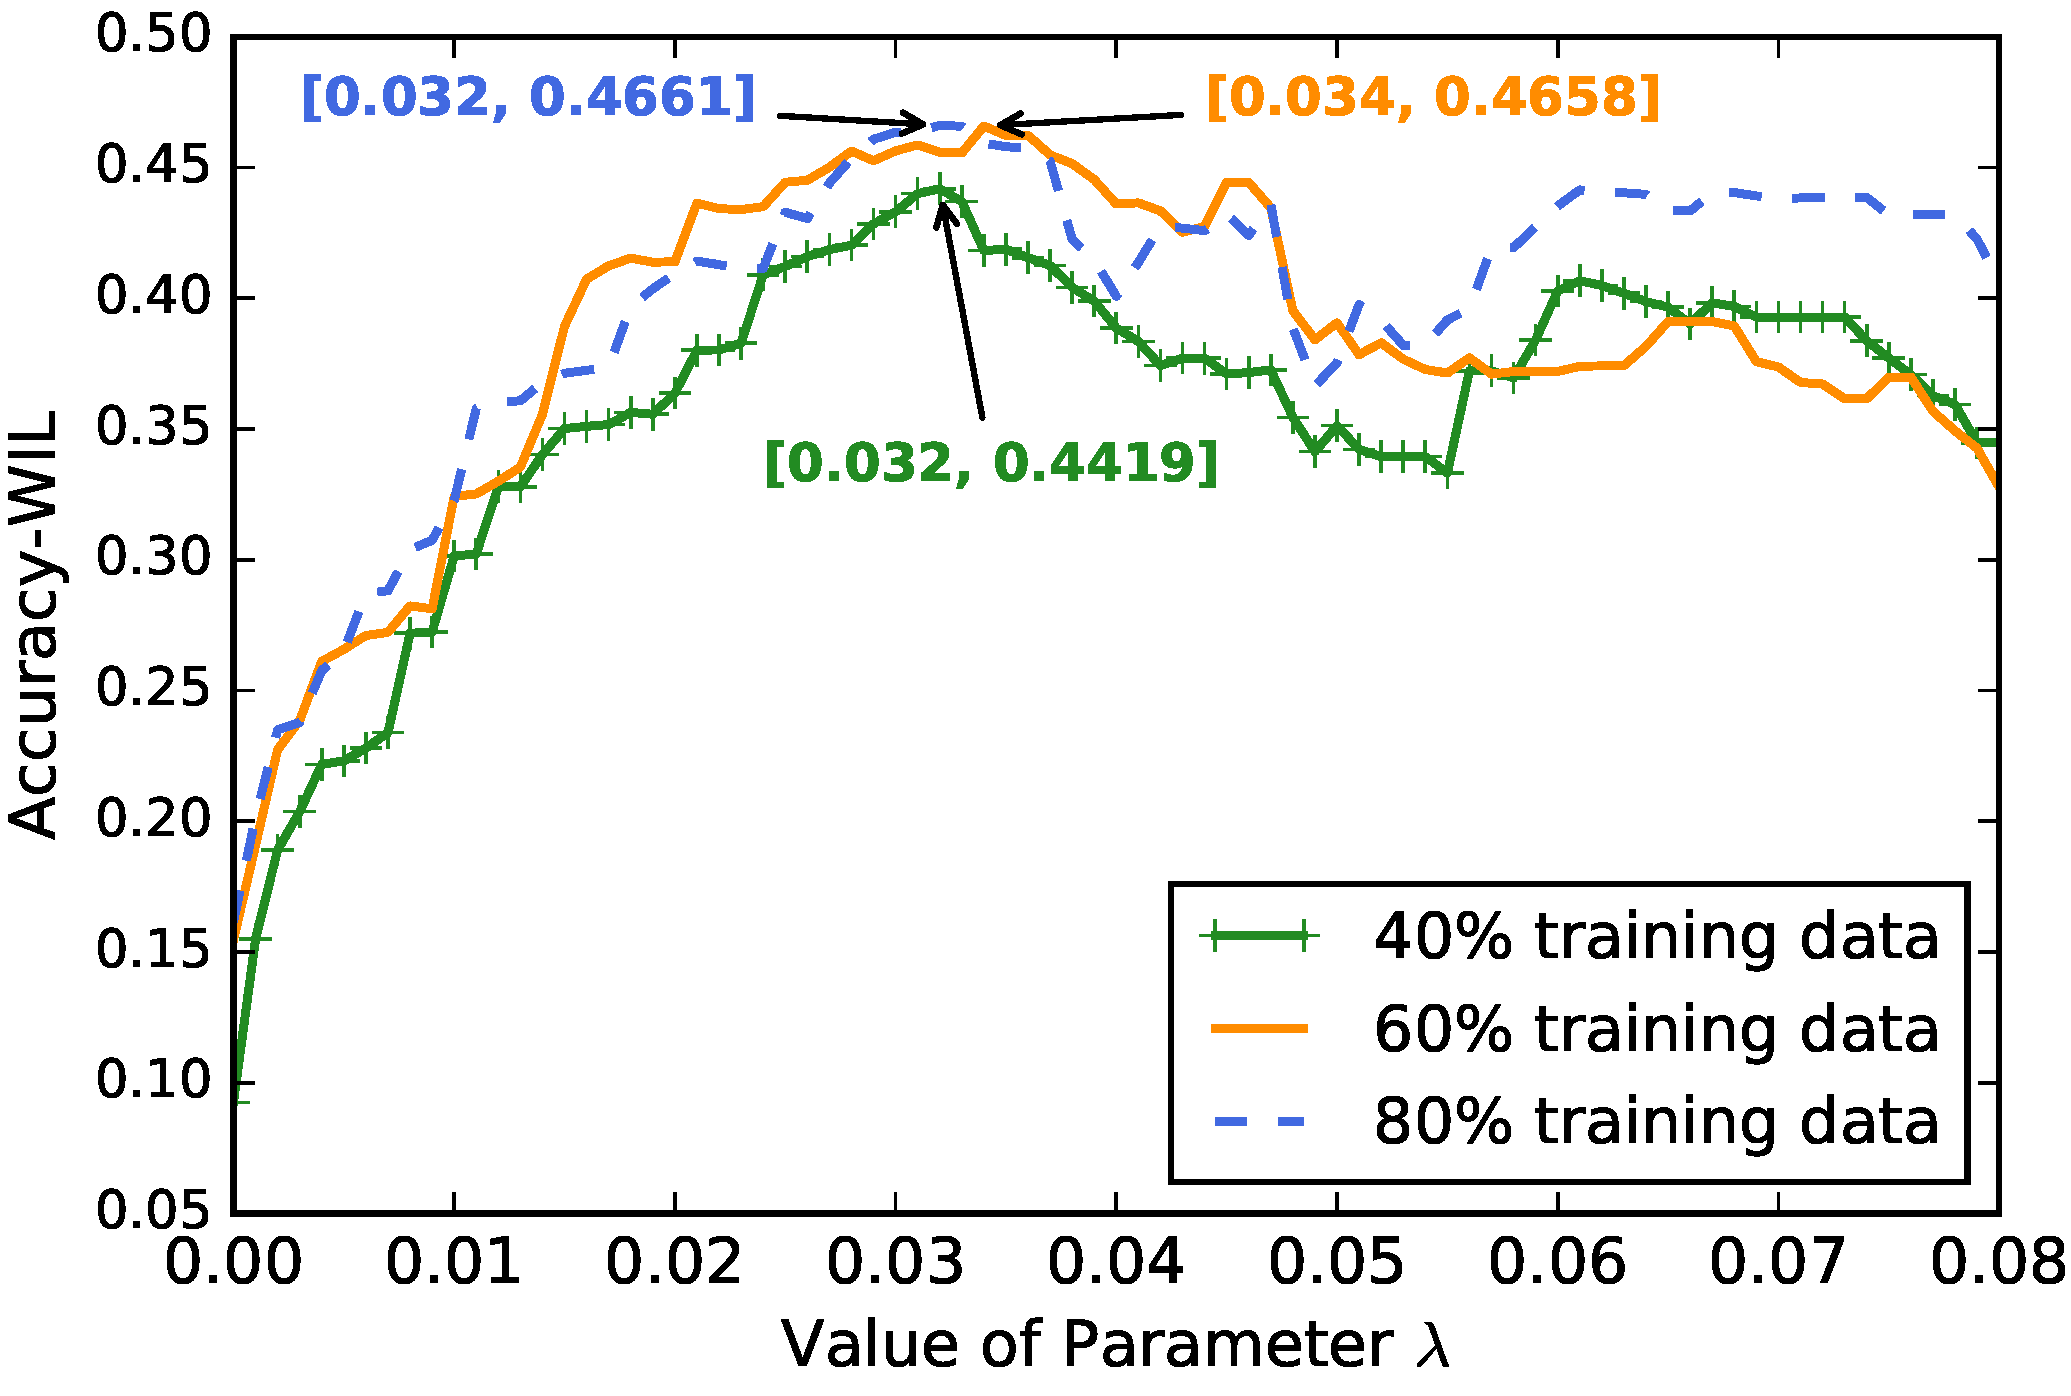
There is one parameter in the proposed method, which is the parameter in characteristic identification. We conducted characteristic identification and new consumer classification with the value of parameter ranging from 0 to 0.08 with a step size of 0.001. The result with the maximum Accuracy-WIL was selected as the optimal identified characteristics. Figure 9 shows the curves of average Accuracy-WIL of ten experiments based on parameter in three situations. The three curves have similar trends, in which their Accuracy-WILs first rise with the increase of value, decrease after they reach the peaks at around , and reveal another fluctuation with the second peaks when .
The optimal Accuracy-WIL in thirty experiments was reached by one of ten experiments with 60% training data when , whose results are shown in Figure 4, Figure 5, Figure 6 and Figure 7. Apart from the curve of 40% training data, the curves of 60% and 80% training data show similar optimal average Accuracy-WILs. This suggests that the optimal average Accuracy-WIL tends to be stable when the training data are sufficient.
6. Conclusions
In this work, we propose a three-phase model to categorize electricity consumers, identify their consumption characteristics and classify new consumers, which can benefit electricity suppliers in terms of flexible demand management and effective energy control. In the proposed model, all load patterns gathered from load pattern extraction are employed into consumer grouping to conduct load pattern clustering and characteristic identification. This strategy not only avoids the information loss caused by other methods but also achieves improved consumer categorization. Moreover, the identified characteristics are used directly as training samples in new consumer classification so that the clustering problem becomes a simpler classifying problem. For evaluation, we conducted extensive experiments on randomly grouped data with four comparison methods in diverse situations. Experimental results show that our method improves the accuracy of classification and provides more sufficient electricity consumer characteristics.
This paper is one part of the study on electricity consumer behaviors based on smart meter data. As consumer categories contain rich knowledge, it is essential for us to improve and continue this work in the future. Furthermore, we should take into account that electricity load data are time-series data which can be influenced by many other extra factors. Incremental learning and association analysis should be helpful for our future works on electricity consumer behaviors.
Author Contributions
All authors participated in the design of the proposed model. Z.J. performed the experiments and wrote the manuscript. Z.J and R.L. analyzed and discussed the results. R.L. and F.Y. reviewed and revised the manuscript. All authors read and approved the final manuscript.
Acknowledgments
This work was supported by the State Grid Corporation of China under the project title: “The Improved Core Analysis Algorithms and Utilities for Smart Grid Big Data” (520940180016) and the Beijing Natural Science Foundation (L171010).
Conflicts of Interest
The authors declare no conflict of interest.
References
- Gungor, V.C.; Sahin, D.; Kocak, T.; Ergut, S.; Buccella, C.; Cecati, C.; Hancke, G.P. Smart grid technologies: Communication technologies and standards. IEEE Trans. Ind. Inform. 2011, 7, 529–539. [Google Scholar] [CrossRef]
- Jiang, Z.; Lin, R.; Yang, F.; Wu, B. A fused load curve clustering algorithm based on wavelet transform. IEEE Trans. Ind. Inform. 2018, 14, 1856–1865. [Google Scholar] [CrossRef]
- Alahakoon, D.; Yu, X. Smart electricity meter data intelligence for future energy systems: A survey. IEEE Trans. Ind. Inform. 2016, 12, 425–436. [Google Scholar] [CrossRef]
- Chicco, G. Overview and performance assessment of the clustering methods for electrical load pattern grouping. Energy 2012, 42, 68–80. [Google Scholar] [CrossRef]
- Wang, Y.; Chen, Q.; Kang, C.; Zhang, M.; Wang, K.; Zhao, Y. Load profiling and its application to demand response: A review. Tsinghua Sci. Technol. 2015, 20, 117–129. [Google Scholar] [CrossRef]
- Gajowniczek, K.; Ząbkowski, T. Two-stage electricity demand modeling using machine learning algorithms. Energies 2017, 10, 1547. [Google Scholar] [CrossRef]
- Zheng, Z.; Yang, Y.; Niu, X.; Dai, H.N.; Zhou, Y. Wide and deep convolutional neural networks for electricity-theft detection to secure smart grids. IEEE Trans. Ind. Inform. 2018, 14, 1606–1615. [Google Scholar] [CrossRef]
- Capizzi, G.; Sciuto, G.L.; Cammarata, G.; Cammarata, M. Thermal transients simulations of a building by a dynamic model based on thermal-electrical analogy: Evaluation and implementation issue. Appl. Energy 2017, 199, 323–334. [Google Scholar] [CrossRef]
- Pooranian, Z.; Abawajy, J.H.; Vinod, P.; Conti, M. Scheduling distributed energy resource operation and daily power consumption for a smart building to optimize economic and environmental parameters. Energies 2018, 11, 1348. [Google Scholar] [CrossRef]
- Li, R.; Li, F.; Smith, N.D. Load characterization and low-order approximation for smart metering data in the spectral domain. IEEE Trans. Ind. Inform. 2017, 13, 976–984. [Google Scholar] [CrossRef]
- Tureczek, A.M.; Nielsen, P.S. Structured literature review of electricity consumption classification using smart meter data. Energies 2017, 10, 584. [Google Scholar] [CrossRef]
- Zhou, K.L.; Yang, S.l.; Shen, C. A review of electric load classification in smart grid environment. Renew. Sustain. Energy Rev. 2013, 24, 103–110. [Google Scholar] [CrossRef]
- Chicco, G. Customer behaviour and data analytics. In Proceedings of the 2016 International Conference and Exposition on Electrical and Power Engineering (EPE), Iasi, Romania, 20–22 October 2016; pp. 771–779. [Google Scholar]
- Ponta, L.; Raberto, M.; Teglio, A.; Cincotti, S. An agent-based stock-flow consistent model of the sustainable transition in the energy sector. Ecol. Econ. 2018, 145, 274–300. [Google Scholar] [CrossRef]
- Panapakidis, I.P.; Alexiadis, M.C.; Papagiannis, G.K. Electricity customer characterization based on different representative load curves. In Proceedings of the 2012 9th International Conference on the European Energy Market (EEM), Florence, Italy, 10–12 May 2012; pp. 1–8. [Google Scholar]
- Panapakidis, I.P.; Alexiadis, M.C.; Papagiannis, G.K. Three-stage clustering procedure for deriving the typical load curves of the electricity consumers. In Proceedings of the 2013 IEEE Grenoble Conference, Grenoble, France, 16–20 June 2013; pp. 1–6. [Google Scholar]
- Tsekouras, G.J.; Hatziargyriou, N.D.; Dialynas, E.N. Two-stage pattern recognition of load curves for classification of electricity customers. IEEE Trans. Power Syst. 2007, 22, 1120–1128. [Google Scholar] [CrossRef]
- Mets, K.; Depuydt, F.; Develder, C. Two-stage load pattern clustering using fast wavelet transformation. IEEE Trans. Smart Grid 2016, 7, 2250–2259. [Google Scholar] [CrossRef]
- Capizzi, G.; Sciuto, G.L.; Napoli, C.; Tramontana, E. Advanced and adaptive dispatch for smart grids by means of predictive models. IEEE Trans. Smart Grid 2017. [Google Scholar] [CrossRef]
- Anand, A.; Suganthi, L. Hybrid GA-PSO optimization of artificial neural network for forecasting electricity demand. Energies 2018, 11, 728. [Google Scholar] [CrossRef]
- Cincotti, S.; Gallo, G.; Ponta, L.; Raberto, M. Modeling and forecasting of electricity spot-prices: Computational intelligence vs. classical econometrics. AI Commun. 2014, 27, 301–314. [Google Scholar]
- Weron, R. Electricity price forecasting: A review of the state-of-the-art with a look into the future. Int. J. Forecast. 2014, 30, 1030–1081. [Google Scholar] [CrossRef]
- Rodrigues, F.; Trindade, A. Load forecasting through functional clustering and ensemble learning. Knowl. Inf. Syst. 2018. [Google Scholar] [CrossRef]
- De O. Saraiva, F.; Bernardes, W.M.; Asada, E.N. A framework for classification of non-linear loads in smart grids using Artificial Neural Networks and Multi-Agent Systems. Neurocomputing 2015, 170, 328–338. [Google Scholar]
- Buitrago, J.; Abdulaal, A.; Asfour, S. Electric load pattern classification using parameter estimation, clustering and artificial neural networks. Int. J. Power Energy Syst. 2015, 35, 167–174. [Google Scholar] [CrossRef]
- Hernández, L.; Baladrón, C.; Aguiar, J.M.; Carro, B.; Sánchez-Esguevillas, A. Classification and clustering of electricity demand patterns in industrial parks. Energies 2012, 5, 5215–5228. [Google Scholar] [CrossRef]
- Viegas, J.L.; Vieira, S.M.; Sousa, J.M. Mining Consumer Characteristics from Smart Metering Data through Fuzzy Modelling. In Proceedings of the 2016 International Conference on Information Processing and Management of Uncertainty in Knowledge-Based Systems (IPMU), Eindhoven, The Netherlands, 20–24 June 2016; pp. 562–573. [Google Scholar]
- Chicco, G.; Ionel, O.M.; Porumb, R. Electrical load pattern grouping based on centroid model with ant colony clustering. IEEE Trans. Power Syst. 2013, 28, 1706–1715. [Google Scholar] [CrossRef]
- Viegas, J.L.; Vieira, S.M.; Sousa, J.M. Fuzzy clustering and prediction of electricity demand based on household characteristics. In Proceedings of the 2015 Conference of the International Fuzzy Systems Association and the European Society for Fuzzy Logic and Technology (IFSA-EUSFLAT), Gijón, Asturias, Spain, 30 June–3 July 2015; pp. 1040–1046. [Google Scholar]
- De Greve, Z.; Lecron, F.; Vallee, F.; Mor, G.; Perez, D.; Danov, S.; Cipriano, J. Comparing time-series clustering approaches for individual electrical load patterns. CIRED, Open Access Proc. J. 2017, 2017, 2165–2168. [Google Scholar] [CrossRef]
- Nasiakou, A.; Alamaniotis, M.; Tsoukalas, L.H.; Karagiannis, G. A three-stage scheme for consumers’ partitioning using hierarchical clustering algorithm. In Proceedings of the 2017 8th International Conference on Information, Intelligence, Systems & Applications (IISA), Larnaca, Cyprus, 27–30 August 2017; pp. 1–6. [Google Scholar]
- Beckel, C.; Sadamori, L.; Santini, S.; Staake, T. Automated customer segmentation based on smart meter data with temperature and daylight sensitivity. In Proceedings of the 2015 IEEE International Conference on Smart Grid Communications (SmartGridComm), Miami, FL, USA, 2–5 November 2015; pp. 653–658. [Google Scholar]
- Viegas, J.L.; Vieira, S.M.; Melício, R.; Mendes, V.; Sousa, J.M. Classification of new electricity customers based on surveys and smart metering data. Energy 2016, 107, 804–817. [Google Scholar] [CrossRef] [Green Version]
- Gouveia, J.P.; Seixas, J. Unraveling electricity consumption profiles in households through clusters: Combining smart meters and door-to-door surveys. Energy Build. 2016, 116, 666–676. [Google Scholar] [CrossRef]
- Khumchoo, K.Y.; Kongprawechnon, W. Cluster analysis for primary feeder identification using metering data. In Proceedings of the 2015 6th International Conference of Information and Communication Technology for Embedded Systems (IC-ICTES), Hua-Hin, Thailand, 22–24 March 2015; pp. 1–6. [Google Scholar]
- Kaur, J.; Madan, N. Association Rule Mining: A Survey. Int. J. Hybrid Inf. Technol. 2015, 8, 239–242. [Google Scholar] [CrossRef] [Green Version]
- Rohit, S. Association rule mining algorithms: survey. Int. Res. J. Eng. Technol 2016, 3, 500–505. [Google Scholar]
- Deng, Z.; Zhu, X.; Cheng, D.; Zong, M.; Zhang, S. Efficient kNN classification algorithm for big data. Neurocomputing 2016, 195, 143–148. [Google Scholar] [CrossRef]
- Basu, K.; Debusschere, V.; Douzal-Chouakria, A.; Bacha, S. Time series distance-based methods for non-intrusive load monitoring in residential buildings. Energy Build. 2015, 96, 109–117. [Google Scholar] [CrossRef]
- Jiang, Z.; Lin, R.; Yang, F.; Liu, Z.; Zhang, Q. Comparing Electricity Consumer Categories Based on Load Pattern Clustering with Their Natural Types. In Proceedings of the 2017 17th International Conference on Algorithms and Architectures for Parallel Processing (ICA3PP), Helsinki, Finland, 21–23 August 2017; pp. 658–667. [Google Scholar]
- Fahad, A.; Alshatri, N.; Tari, Z.; Alamri, A.; Khalil, I.; Zomaya, A.Y.; Foufou, S.; Bouras, A. A survey of clustering algorithms for big data: Taxonomy and empirical analysis. IEEE Trans. Emerg. Top. Comput. 2014, 2, 267–279. [Google Scholar] [CrossRef]
Figure 1.
The model framework for electricity consumer categorization based on load pattern similarity.
Figure 1.
The model framework for electricity consumer categorization based on load pattern similarity.

Figure 2.
The procedure of load pattern clustering. The overall load patterns are randomly divided into g groups. Each group is clustered individually. The clustering centers of these g groups are gathered and clustered to form the final clusters.
Figure 2.
The procedure of load pattern clustering. The overall load patterns are randomly divided into g groups. Each group is clustered individually. The clustering centers of these g groups are gathered and clustered to form the final clusters.

Figure 3.
The diagram of new consumer classification. Every spot stands for one daily load curve or load pattern. When a new consumer comes (at right), we calculate the similarity between the load patterns of the consumer and each identified characteristic based on Equations (1)–(3). The consumer belongs to the consumer category with the smallest similarity value. Here, the new consumer belongs to Category 1.

Figure 4.
Sixteen examples of load patterns. Each subfigure denotes the load patterns of one electricity consumer referring to one consumer type (building type) in the dataset. The load patterns are obtained from one of ten experiments with 60% training data.
Figure 4.
Sixteen examples of load patterns. Each subfigure denotes the load patterns of one electricity consumer referring to one consumer type (building type) in the dataset. The load patterns are obtained from one of ten experiments with 60% training data.

Figure 5.
An example of load pattern clustering result in ten experiments with 60% training data, which is the same as Figure 4. This result includes 100 clustering centers that refer to 100 fuzzy consumer categories.
Figure 5.
An example of load pattern clustering result in ten experiments with 60% training data, which is the same as Figure 4. This result includes 100 clustering centers that refer to 100 fuzzy consumer categories.

Figure 6.
Thirteen electricity consumer characteristics identified from the load pattern clustering result shown in Figure 5 when λ = 0.032. The characteristic shown in each subfigure stands for a consumer category.
Figure 6.
Thirteen electricity consumer characteristics identified from the load pattern clustering result shown in Figure 5 when λ = 0.032. The characteristic shown in each subfigure stands for a consumer category.

Figure 7.
The electricity consumer characteristics obtained by three comparison methods. Each curve in every subfigure denotes the characteristic of one consumer category. These results are obtained based on the same training data as Figure 4, Figure 5 and Figure 6. (a–c) (Left) show the characteristics of total consumer categories of methods, and (a–c) (Right) magnify the characteristics of partial categories shown in the left subfigures.

Figure 8.
Accuracy with weight of information loss (Accuracy-WIL) of comparison methods in three situations, which are with 40%, 60% and 80% training data.
Figure 8.
Accuracy with weight of information loss (Accuracy-WIL) of comparison methods in three situations, which are with 40%, 60% and 80% training data.

Figure 9.
Average Accuracy-WIL vs. value of parameter ranging from 0 to 0.08 with a step size of 0.001. The curves reach their peaks when .
Figure 9.
Average Accuracy-WIL vs. value of parameter ranging from 0 to 0.08 with a step size of 0.001. The curves reach their peaks when .


Table 1.
Main variables used in the model.
| Variables | Description |
|---|---|
| n-dimensional daily load data of one electricity consumer | |
| C | the set of clustering result |
| the set of clustering centers of C, referring to load patterns | |
| N | the total number of electricity consumers |
| g | the number of groups that overall load patterns are divided into |
| the parameter used for characteristic identification | |
| I | the identified characteristics of consumer categories |
| the set of load patterns of a new consumer | |
| the similarity between and , , | |
| the similarity between and , |
© 2018 by the authors. Licensee MDPI, Basel, Switzerland. This article is an open access article distributed under the terms and conditions of the Creative Commons Attribution (CC BY) license (http://creativecommons.org/licenses/by/4.0/).
Share and Cite
MDPI and ACS Style
Jiang, Z.; Lin, R.; Yang, F. A Hybrid Machine Learning Model for Electricity Consumer Categorization Using Smart Meter Data. Energies 2018, 11, 2235. https://doi.org/10.3390/en11092235
AMA Style
Jiang Z, Lin R, Yang F. A Hybrid Machine Learning Model for Electricity Consumer Categorization Using Smart Meter Data. Energies. 2018; 11(9):2235. https://doi.org/10.3390/en11092235
Chicago/Turabian StyleJiang, Zigui, Rongheng Lin, and Fangchun Yang. 2018. "A Hybrid Machine Learning Model for Electricity Consumer Categorization Using Smart Meter Data" Energies 11, no. 9: 2235. https://doi.org/10.3390/en11092235
Note that from the first issue of 2016, this journal uses article numbers instead of page numbers. See further details here.