Low Carbon Energy Transitions in the Nordic Countries: Evidence from the Environmental Kuznets Curve

1
Centre for Development, Environment and Policy CeDEP, SOAS University of London, London WC1H0XG, UK
2
Department of Industrial Economics and Management INDEK, KTH Royal Institute of Technology, 11428 Stockholm, Sweden
3
Department of Political Science, Stockholm University, 10691 Stockholm, Sweden
*
Author to whom correspondence should be addressed.
Energies 2018, 11(9), 2209; https://doi.org/10.3390/en11092209
Submission received: 8 August 2018
/
Revised: 18 August 2018
/
Accepted: 23 August 2018
/
Published: 23 August 2018
(This article belongs to the Special Issue Energy and Environment)
Abstract
:Low carbon energy transitions are important to mitigate climate change, reduce air pollution, and reduce fossil fuel resource depletion. The Nordic countries (Denmark, Finland, Iceland, Norway, Sweden) are seen as leaders in low carbon energy transitions. This paper provides a comparative data analysis of low carbon energy transitions in the Nordic countries from the 1960s to 2015, and assesses evidence of the Environmental Kuznets Curve (EKC). The paper finds that the EKC has been observed in Denmark, Iceland, and Sweden in terms of total CO2 emissions, but not in Norway and Finland. For per capita CO2 emissions, there is evidence for the EKC in Denmark, Finland, Iceland, and Sweden, but not for Norway. For energy use per capita, the EKC is only observed for Denmark, while improvements are needed for the other countries. Norway is an outlier, in comparison with the other Nordic countries, hence the country should implement more stringent climate change mitigation policies to reduce its emissions. Overall, the research suggests that the Nordic countries, particularly Denmark, Iceland, and Sweden, can provide valuable lessons for national, regional, and global low carbon energy transitions.
Keywords:
low carbon energy; energy transition; Denmark; Finland; Iceland; Norway; Sweden; hydro; geothermal; wind; Environmental Kuznets Curve1. Introduction
The need for low carbon energy transitions is driven by rapidly growing energy demand, as well as environmental concerns like climate change, peak oil, natural resource depletion, and air pollution. The Nordic countries, Denmark, Finland, Iceland, Norway, and Sweden, are seen as global leaders in low carbon energy transitions. The Nordic countries are some of the world’s most developed countries, consistently ranking high on the United Nations’ Human Development Index (HDI), particularly Norway. They also achieved something that is highly desirable but difficult to attain; namely the decoupling of economic growth from carbon emissions. The Nordic countries have ambitious climate and energy policies in place, aiming to be fossil free by 2050 [1]. Iceland relies almost completely on geothermal energy for heating, including for district heating, and exclusively on hydropower and geothermal energy for electricity production [2]. Sweden relies heavily on hydropower and nuclear energy for electricity production and on biofuels for heating. Denmark reduced its reliance on fossil fuels over time and increased its share of renewable energy, particularly wind energy and biofuels. Finland has a more varied energy portfolio, but today relies predominantly on nuclear energy, hydropower, and biofuels [2]. While Iceland, Sweden, Denmark, and Finland experienced a decline in the reliance on fossil fuels between the 1970s and the 1990s, Norway still depends a lot on oil even today. As an oil-producing country, Norway has access to abundant domestic oil resources. Nevertheless, more than 95% of the country’s electricity came from hydropower in 2015 [2]. Norway hosts also about half of Europe’s hydropower reservoir capacity, according to Graabak et al. [3].
The Nordic countries can therefore serve as useful case studies for other countries worldwide to provide valuable lessons on how low carbon energy transitions can be achieved and on the dynamics and processes. This is particularly relevant in the wake of the Paris Agreement on climate change and the preparation of Nationally Determined Contributions (NDCs) for national and global mitigation action.
Against this backdrop, the paper aims to analyse low carbon energy transitions in the Nordic countries from the 1960s to 2015, by providing evidence from the Environmental Kuznets Curve (EKC). Low carbon transitions have been explored by an increasing number of leading scholars in recent years. Skea and Nishioka (2008) were some of the early applied thinkers of transitions to low carbon societies [4]. Their methodological approach focused particularly on integrated assessment modelling to simulate future low carbon transitions at a national, regional, and global level. Other more theoretical and conceptual work includes analyzing low carbon transitions from the perspective of socio-technical transitions [5,6] and the importance of expanding the framework from economic and technical perspectives to broader societal perspectives [7,8]. Bridge et al. (2013) argue that space and pace is important with regards to low carbon energy transitions and suggest that the geographies of energy transitions need to be taken into account more carefully [9]. Some of the recent research on low carbon transitions focused on developing countries, such as that by Delina [10] and Urban [11], who analyses these issues using an energy modelling methodology. Other scholars have focused on the global level such as Foxon [12,13], Mulugetta and Urban [14], Mundaca et al. [15], and Nordensvard [16], drawing on a range of qualitative and quantitative methodologies. Some scholars explored the dynamics of low carbon energy transitions in the Nordic countries, such as Araujo [17] for geothermal energy in Iceland and for wind energy in Denmark, as well as Sovacool’s comparative research on low carbon energy policy in the Nordic countries [1]. Yet, these studies do not evaluate Nordic low carbon energy transitions from the perspective of the EKC. This is where this paper adds new insights.
2. Materials and Methods
2.1. Methodology
This research is based on statistical analysis of quantitative data that is relevant to the Environmental Kuznets Curve. This paper uses statistical data from the World Bank and the International Energy Agency (IEA) for the years 1960 to 2015 for the five Nordic countries Denmark, Finland, Iceland, Norway, and Sweden. Selected data includes information about gross domestic product (GDP), CO2 emissions (total and per capita), energy use, electric power consumption, and data about the energy mix, including the share of low carbon energy sources and fossil fuels amongst the energy mix over the past 55 years for the selected countries. This data has been statistically analysed in Excel to examine whether or not the inverted U-shaped EKC pattern can be observed. Income as a function of GDP is plotted against CO2 emissions and energy use as indicators of pollution levels. This provides evidence for or against the EKC being observed in reality in the Nordic countries. The data also offers insights about the presence or absence of energy transitions, as well as their speed and direction of development.
This paper’s conceptual framing is rooted in low carbon energy transitions and the Environmental Kuznets Curve, as Section 2.2 and Section 2.3 elaborate.
2.2. Energy Transitions
Here, a transition is defined as a system’s change, rather than a neatly organised or orchestrated change. Energy transitions are shifts from a country’s economic activities based on one energy source to an economy based (partially) on another energy source. Fouquet and Pearson find that energy transitions are complex and rare events that have often taken place over very long periods of time, such as decades or centuries [18].
Several energy transitions have occurred in history:
- (1)
- the energy transition from manpower and animal power to traditional biomass (such as fuel wood, crop residues, and dung),
- (2)
- the energy transition from traditional biomass to coal (ca 1860),
- (3)
- the energy transition from coal to oil (ca 1880),
- (4)
- the energy transition from oil to natural gas (ca 1900),
- (5)
- the energy transition from natural gas to electricity and heat (ca 1900–10),
- (6)
- the large-scale commercial introduction of nuclear (ca 1965), and
- (7)
- the large-scale commercial introduction of renewable energy and large hydropower (ca 1995) [19].
These energy transitions are predominantly based on observations in developed countries. Historic transitions occurred at different paces too, for example, the energy transitions from traditional biomass to coal to oil were much faster in the Unites States (US) than in the United Kingdom (UK). This is because of several factors such as resource availability, government policy, industrial and household energy demands [18], as well as energy prices [20].
Energy transitions are characterised by changing patterns of energy use (e.g., from solid to liquid to electricity), changing energy quantities (from scarcity to abundance or the other way around), and changing energy qualities (e.g., from fuel wood to electricity) [19].
Bashmakov’s three laws of energy transitions suggest the following:
- (1)
- Energy transitions are often driven by changing energy costs in relation to income (the predominant energy form becomes too expensive).
- (2)
- Energy transitions are often driven by improving energy quality (e.g., higher energy efficiency like electricity in comparison to fuel wood).
- (3)
- Energy transitions are often driven by growing energy productivity (e.g., more industrial output can be obtained) [9].
The observed trend is that as economies become more developed and households have higher incomes, energy transitions happen from traditional biomass to fossil fuels. In the long-run, low carbon energy transitions may be possible. Sovacool argues that most energy transitions have been path-dependent and incremental [21], rather than revolutionary, while Fouquet stresses the complexity of actors and decisions involved in historic and potential future energy transitions [20].
Low carbon energy transitions are defined here as shifts from a country’s economic activities based on fossil fuels to an economy based (partially) on renewable and low carbon energy. This means that substitutions take place from fossil fuel-based technologies to low carbon technologies. Such transitions can take place in every sector of a country’s or a region’s economy.
Observations from history have shown that most energy transitions were rather slow, often lasting more than a century [22]. Grubler argues that historic energy transitions took about 80 to 130 years to fully happen [23]. Faced by a changing climate and fossil fuel depletion, many scholars suggest that a low carbon energy transition needs to be more rapid. Grubler and Fouquet & Pearson note that low carbon innovation, policies, and financing need to be more persistent, continuous, and balanced on a national and global level [18,23]. They suggest that current policy frameworks are insufficient and need to be changed for enabling a low carbon energy transition.
Nevertheless, achieving a low carbon energy transition will not only require new technology, adequate policies, and financing, but a system’s transition that requires a fundamental change in practices, behaviours, and politics. For example, shifting from oil-based cars to electric cars will not only require a change in car innovation and technology, but it will require a completely different infrastructure with electric charging stations and a radical change in consumer behaviour and individual and mass preferences [24]. Some Nordic countries have achieved such a radical change, for example, by putting large-scale district heating systems in place powered by geothermal energy in Iceland and biofuels in Sweden and Finland. This has essentially changed the public practices, behaviours, policies, and infrastructure in relation to heating. Similarly, electricity in Norway comes almost entirely from hydropower and electricity in Iceland comes from hydropower and geothermal energy [2]. This has fundamentally changed the energy systems of these countries, not only in terms of technologies, policies, and financing, but also in terms of practices and behaviours towards energy use and supply.
2.3. The Environmental Kuznets Curve (EKC)
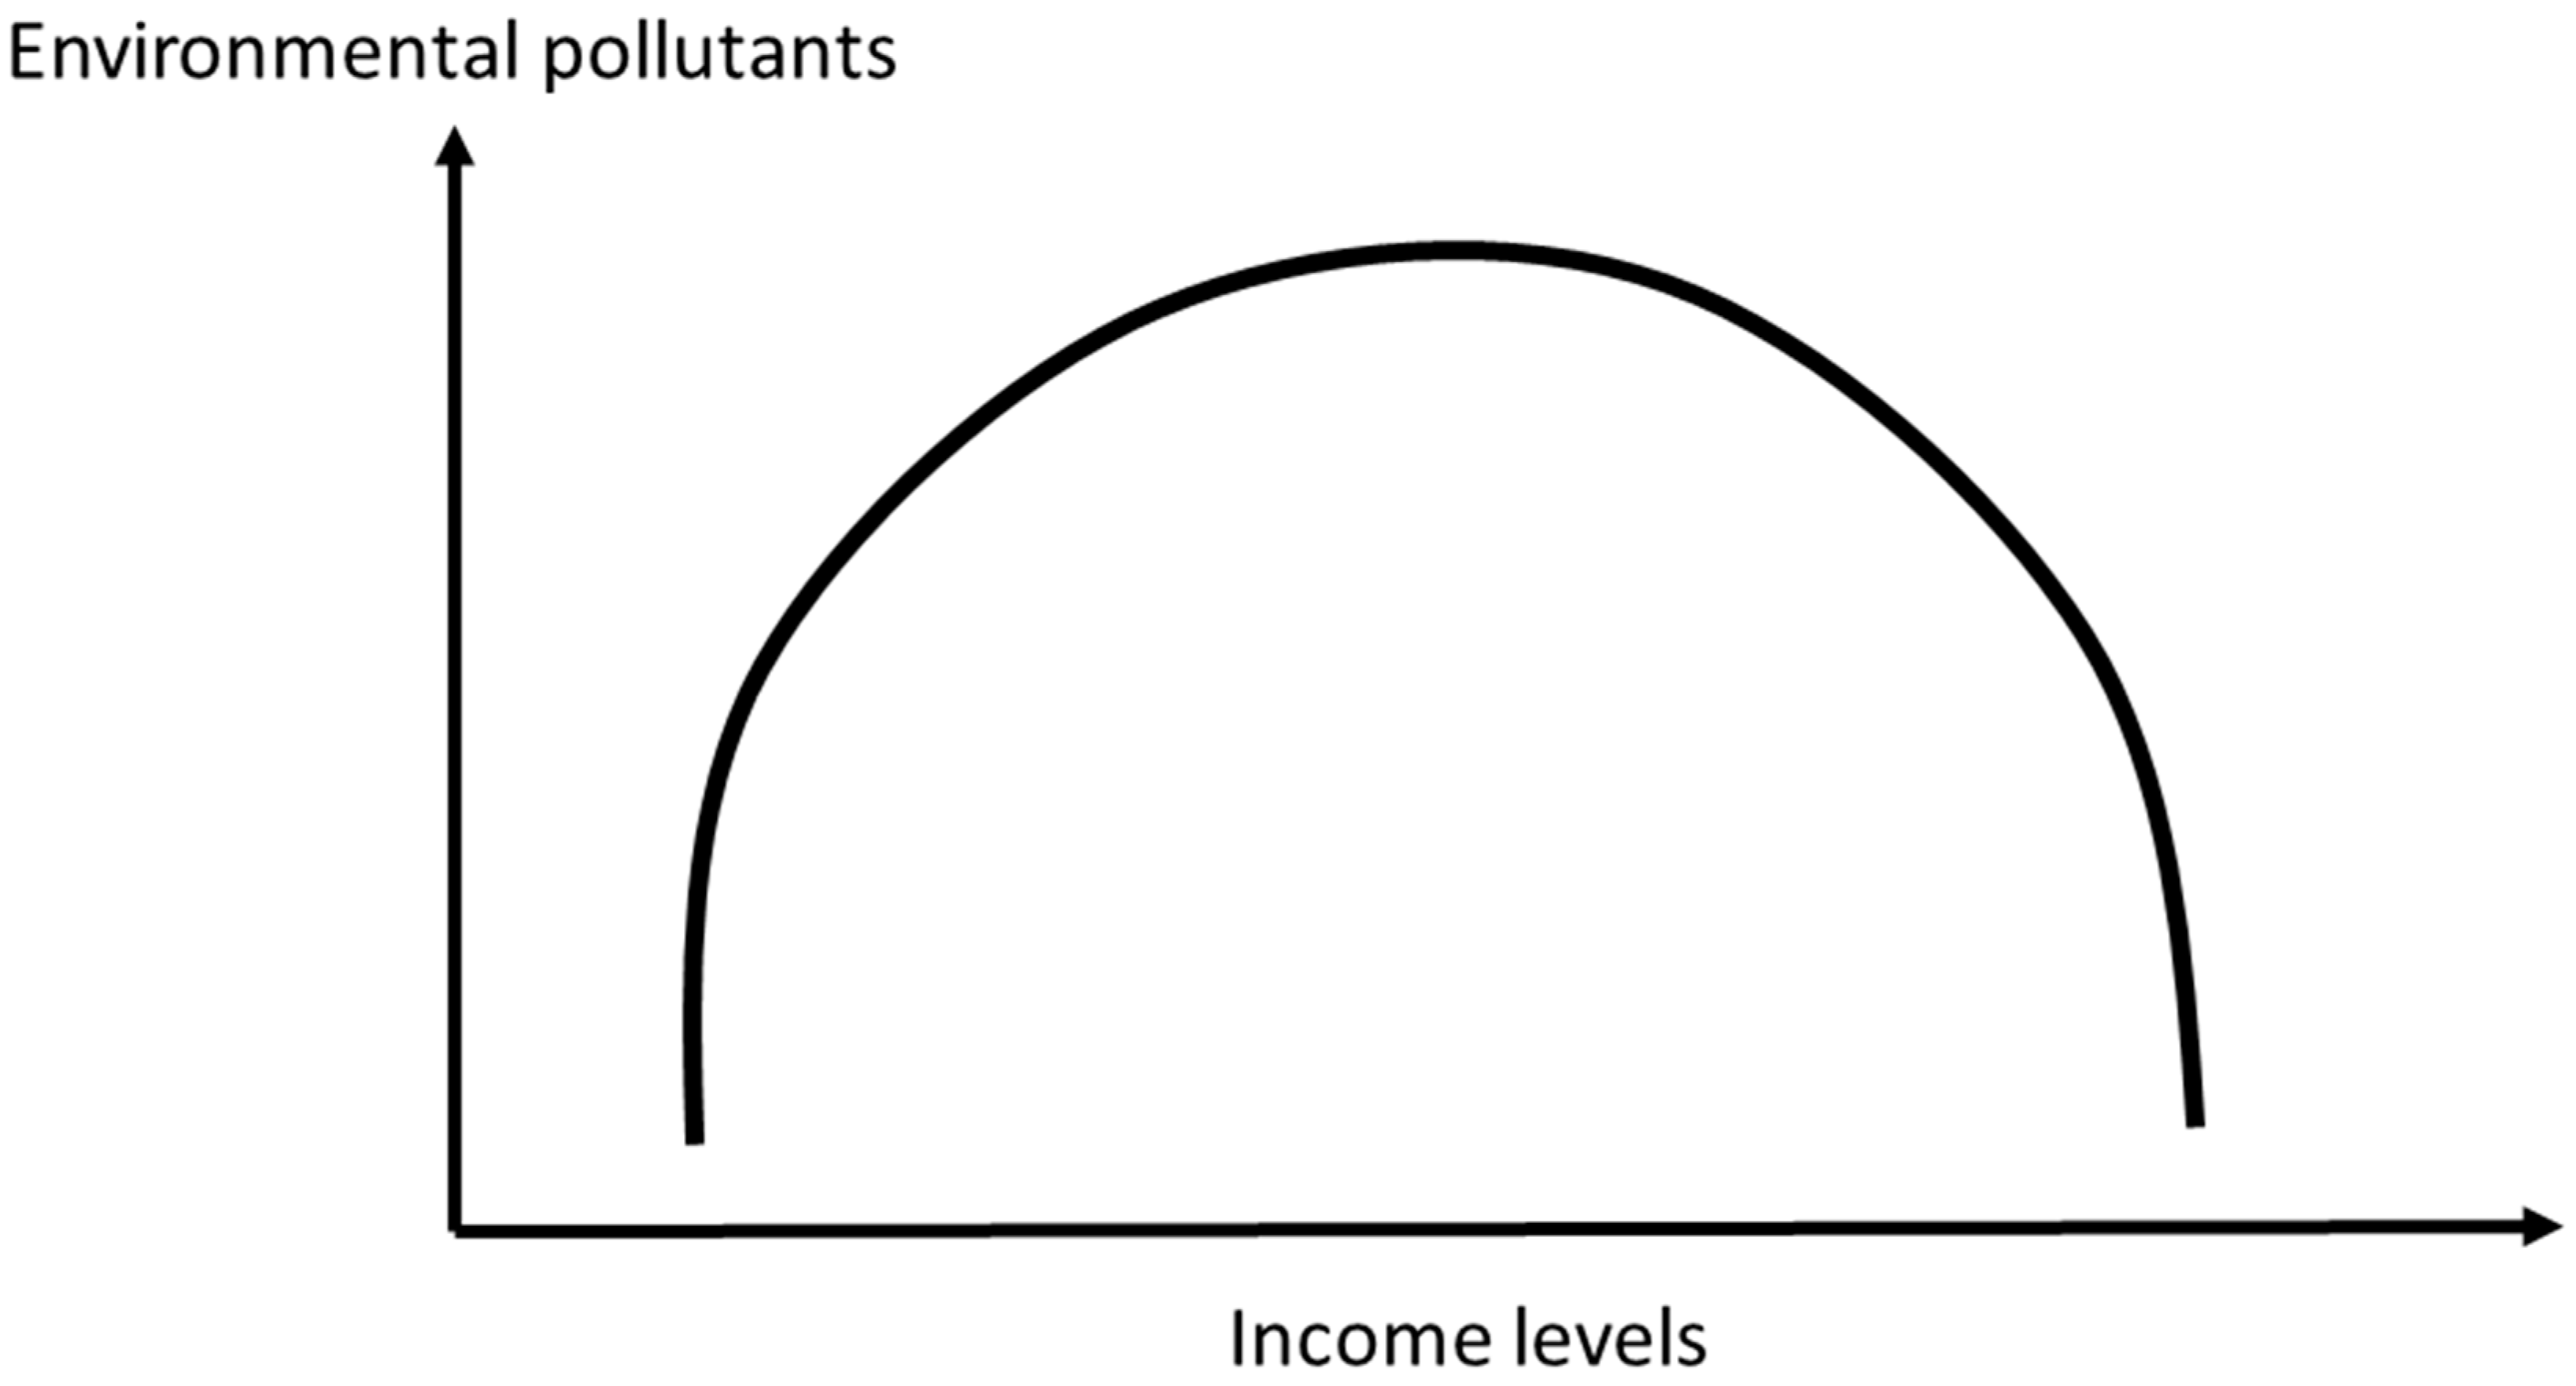
The EKC is an important concept relevant to understanding the process of development from an energy-related pollution perspective. The EKC is also important for understanding energy transitions, such as low carbon energy transitions, and for providing insights into how economic development relates to environmental pollution, on both an aggregate and per capita basis. The EKC has the shape of an inverted U-curve, similar to the income inequality curve described by Kuznets in the 1950s [25,26,27]. See Figure 1.
The hypothesis of the EKC is that environmental pollution is at a low level when countries have very low income and development levels, then it increases and peaks when mid-levels of incomes and development are reached, and pollution levels decrease again when income and development levels increase [26,28]. This is based on the assumption that pollution levels will increase when countries industrialise; however, pollution levels will decrease again when countries become more prosperous and can afford to invest in pollution control technologies, or have more advanced policies and financial instruments in place to enable cleaner development pathways. The EKC has also been applied to industrialised countries to map environmental pollution against economic growth. The EKC is closely related to the decoupling of economic growth from energy use and emissions, which is fiercely debated [29].
Some advocate that decoupling growth from energy use and emissions is only possible to some extent because of physical limits [30] and that instead, the structure of market economies has to be changed to achieve deep cuts in emissions [31,32]. Jackson of the U.K. Sustainable Development Commission even talks about the ‘myth’ of decoupling [31]. Others advocate that decoupling is possible when low carbon and energy-efficient technology is used [33].
Some of the controversy surrounding the EKC is related to whether the EKC can be observed in practice and how it can be measured; as various approaches to units and measurements exist. Nevertheless, the EKC has been historically observed in many countries for pollutants such as sulfur dioxide (SO2), where end-of-pipe technologies are relatively inexpensive and easy to add. However, for carbon emissions, the EKC provides more complex results [26]. It has rather been observed that carbon emissions increase with increasing levels of income and development and then either still continue to increase, such as in case of the United States, Australia, Canada, and many European countries, or level off, such as in the case of a few other European countries [2].
Some studies find evidence for the EKC, such as Dong et al., who find that the EKC can be observed when examining natural gas and renewable energy consumption in relation to CO2 levels in Brazil, Russia, India, China, and South Africa [34]. Olale et al. also find evidence for the EKC at an aggregate Canadian level, but only for half of the Canadian provinces [35]. Pablo-Romero and Sánchez-Braza further confirm evidence for the EKC in the residential sector in the EU-28, with particularly clear turning points for Denmark, Luxembourg, Finland, The Netherlands, and Sweden [36]. Xu finds complex relationships between economic growth and SO2 emission in China, and reports that the EKC cannot be observed when disaggregated data is being used [37]. Adu and Denkyirah analyse CO2 emissions and find that there is no evidence for the EKC for West Africa [38], while Zambrano-Monserrate et al. also find no evidence for the EKC in Peru [39]. Stern argues that the evidence for the EKC is not sufficient and that the dynamics that drive the EKC patterns are still contested [40,41]. Gill et al. further suggest that following the inverted U-shape of pollution levels according to the EKC concept is a development pathway that is too resource-intensive and not sufficiently viable; hence, they argue for more global government support for renewable energy, both financial and policy support, and increased taxation on fossil fuels [42].
Essentially, achieving the EKC requires decoupling of economic growth from emissions. For mitigating climate change in the long run, a decrease in emissions is needed, however, this proves to be difficult as the experience of the EKC and absolute decoupling of economic growth from emissions suggest [29].
Decoupling of economic growth from energy use and/or emissions requires that at some point in time, the growth rate for energy use and/or emissions is lower than the GDP growth rate.
Absolute decoupling requires an absolute cut in energy use and/or emissions, which has rarely been observed in reality yet [2,31]. Instead, there is a clear link between economic growth and greenhouse gas emissions. Both have strongly increased over the last 100 years [43], which shows that absolute decoupling has not happened on a global level [29,32]. This paper will show that some of the Nordic countries are exceptions here, particularly Sweden and Denmark, which did achieve absolute decoupling of economic growth from carbon emissions (especially Sweden) and energy use (especially Denmark) (see Section 3).
Relative decoupling means that more economic activity is possible with lower energy use and/or lower emissions. Relative decoupling in terms of carbon and energy intensity has been observed in a number of countries during the last few years, including in the Nordic countries. China and India are other examples of countries that have rapidly decreasing carbon and energy intensities [26,29,32].
3. Results
In this section, the findings of the data analysis will be presented. First, energy and emissions data will be analysed, followed by an evaluation of data to analyse the EKC.
3.1. Energy and Emission Trends in the Nordic Countries
The GDPs of the Nordic countries have increased almost exponentially between 1960 and 2015. Iceland’s GDP increase is particularly astonishing. Albeit being a small economy in comparison with the other countries, its GDP has increased more than 80-fold within the analysed time frame. This is followed by Norway, whose GDP increased more than 70-fold during 1960 to 2015. Denmark and Finland had GDP increases of nearly 50-fold and about 45-fold, respectively, between 1960 and 2015. The lowest GDP increase was in Sweden; however, in 2015, it was still at a remarkable increase of nearly 35-fold compared with the GDP of 1960 [44].
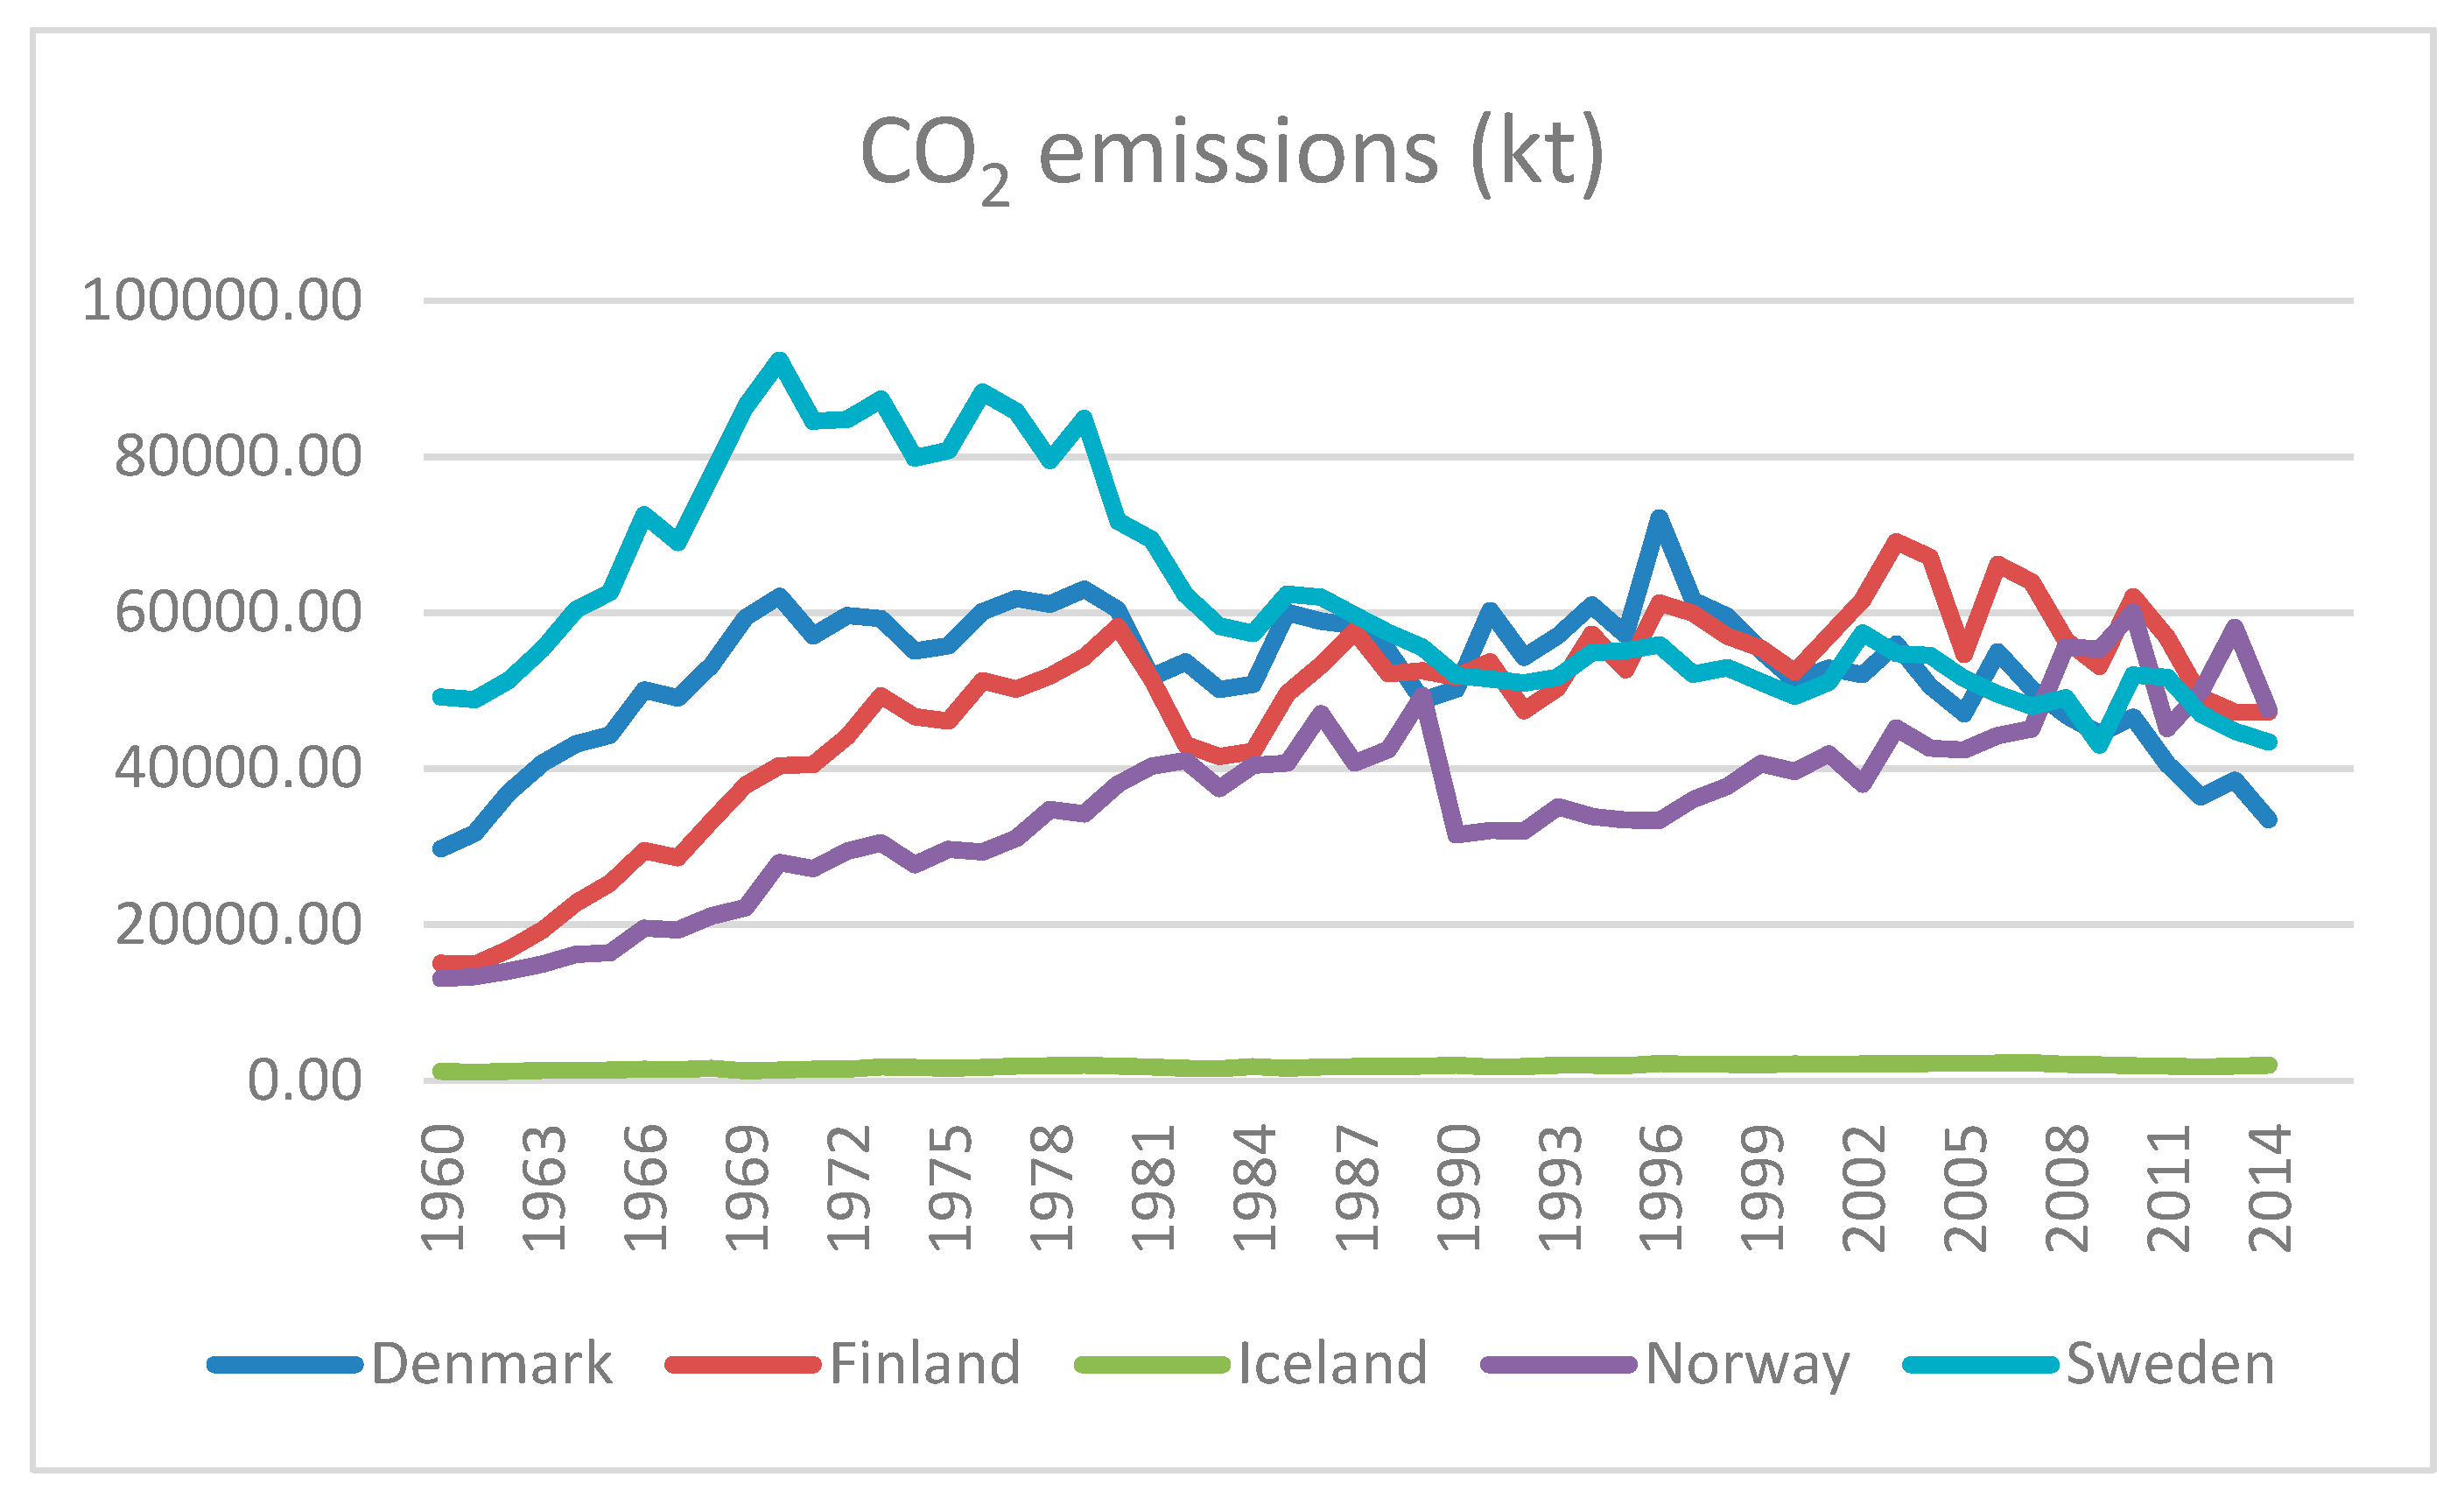
Figure 2 shows the CO2 emissions between 1960 and 2015 [44]. This is particularly striking, given the huge increase in GDP over the same time frame. Sweden stands out as a rapid increase in emissions has been observed between 1960s and the late 1970s, dampened by the oil crisis of the late 1970s. From about 1980, CO2 emissions declined rapidly and by 2015, the emission levels were below the 1960 levels, at about 0.85-fold. This is a remarkably case of absolute decoupling of economic growth from carbon emissions for Sweden. Denmark has about the same levels of CO2 emissions today as in the 1960s. Iceland’s CO2 emissions in 2015 are approximately 1.5-fold higher than in 1960s, despite its huge increase in national wealth. Finland and Norway fare less well, however, their CO2 emissions increase is limited to about 3.1- and 3.6-fold, respectively, of their 1960s emission levels. Overall these are remarkable climate change mitigation achievements given the massively increasing levels of GDP.
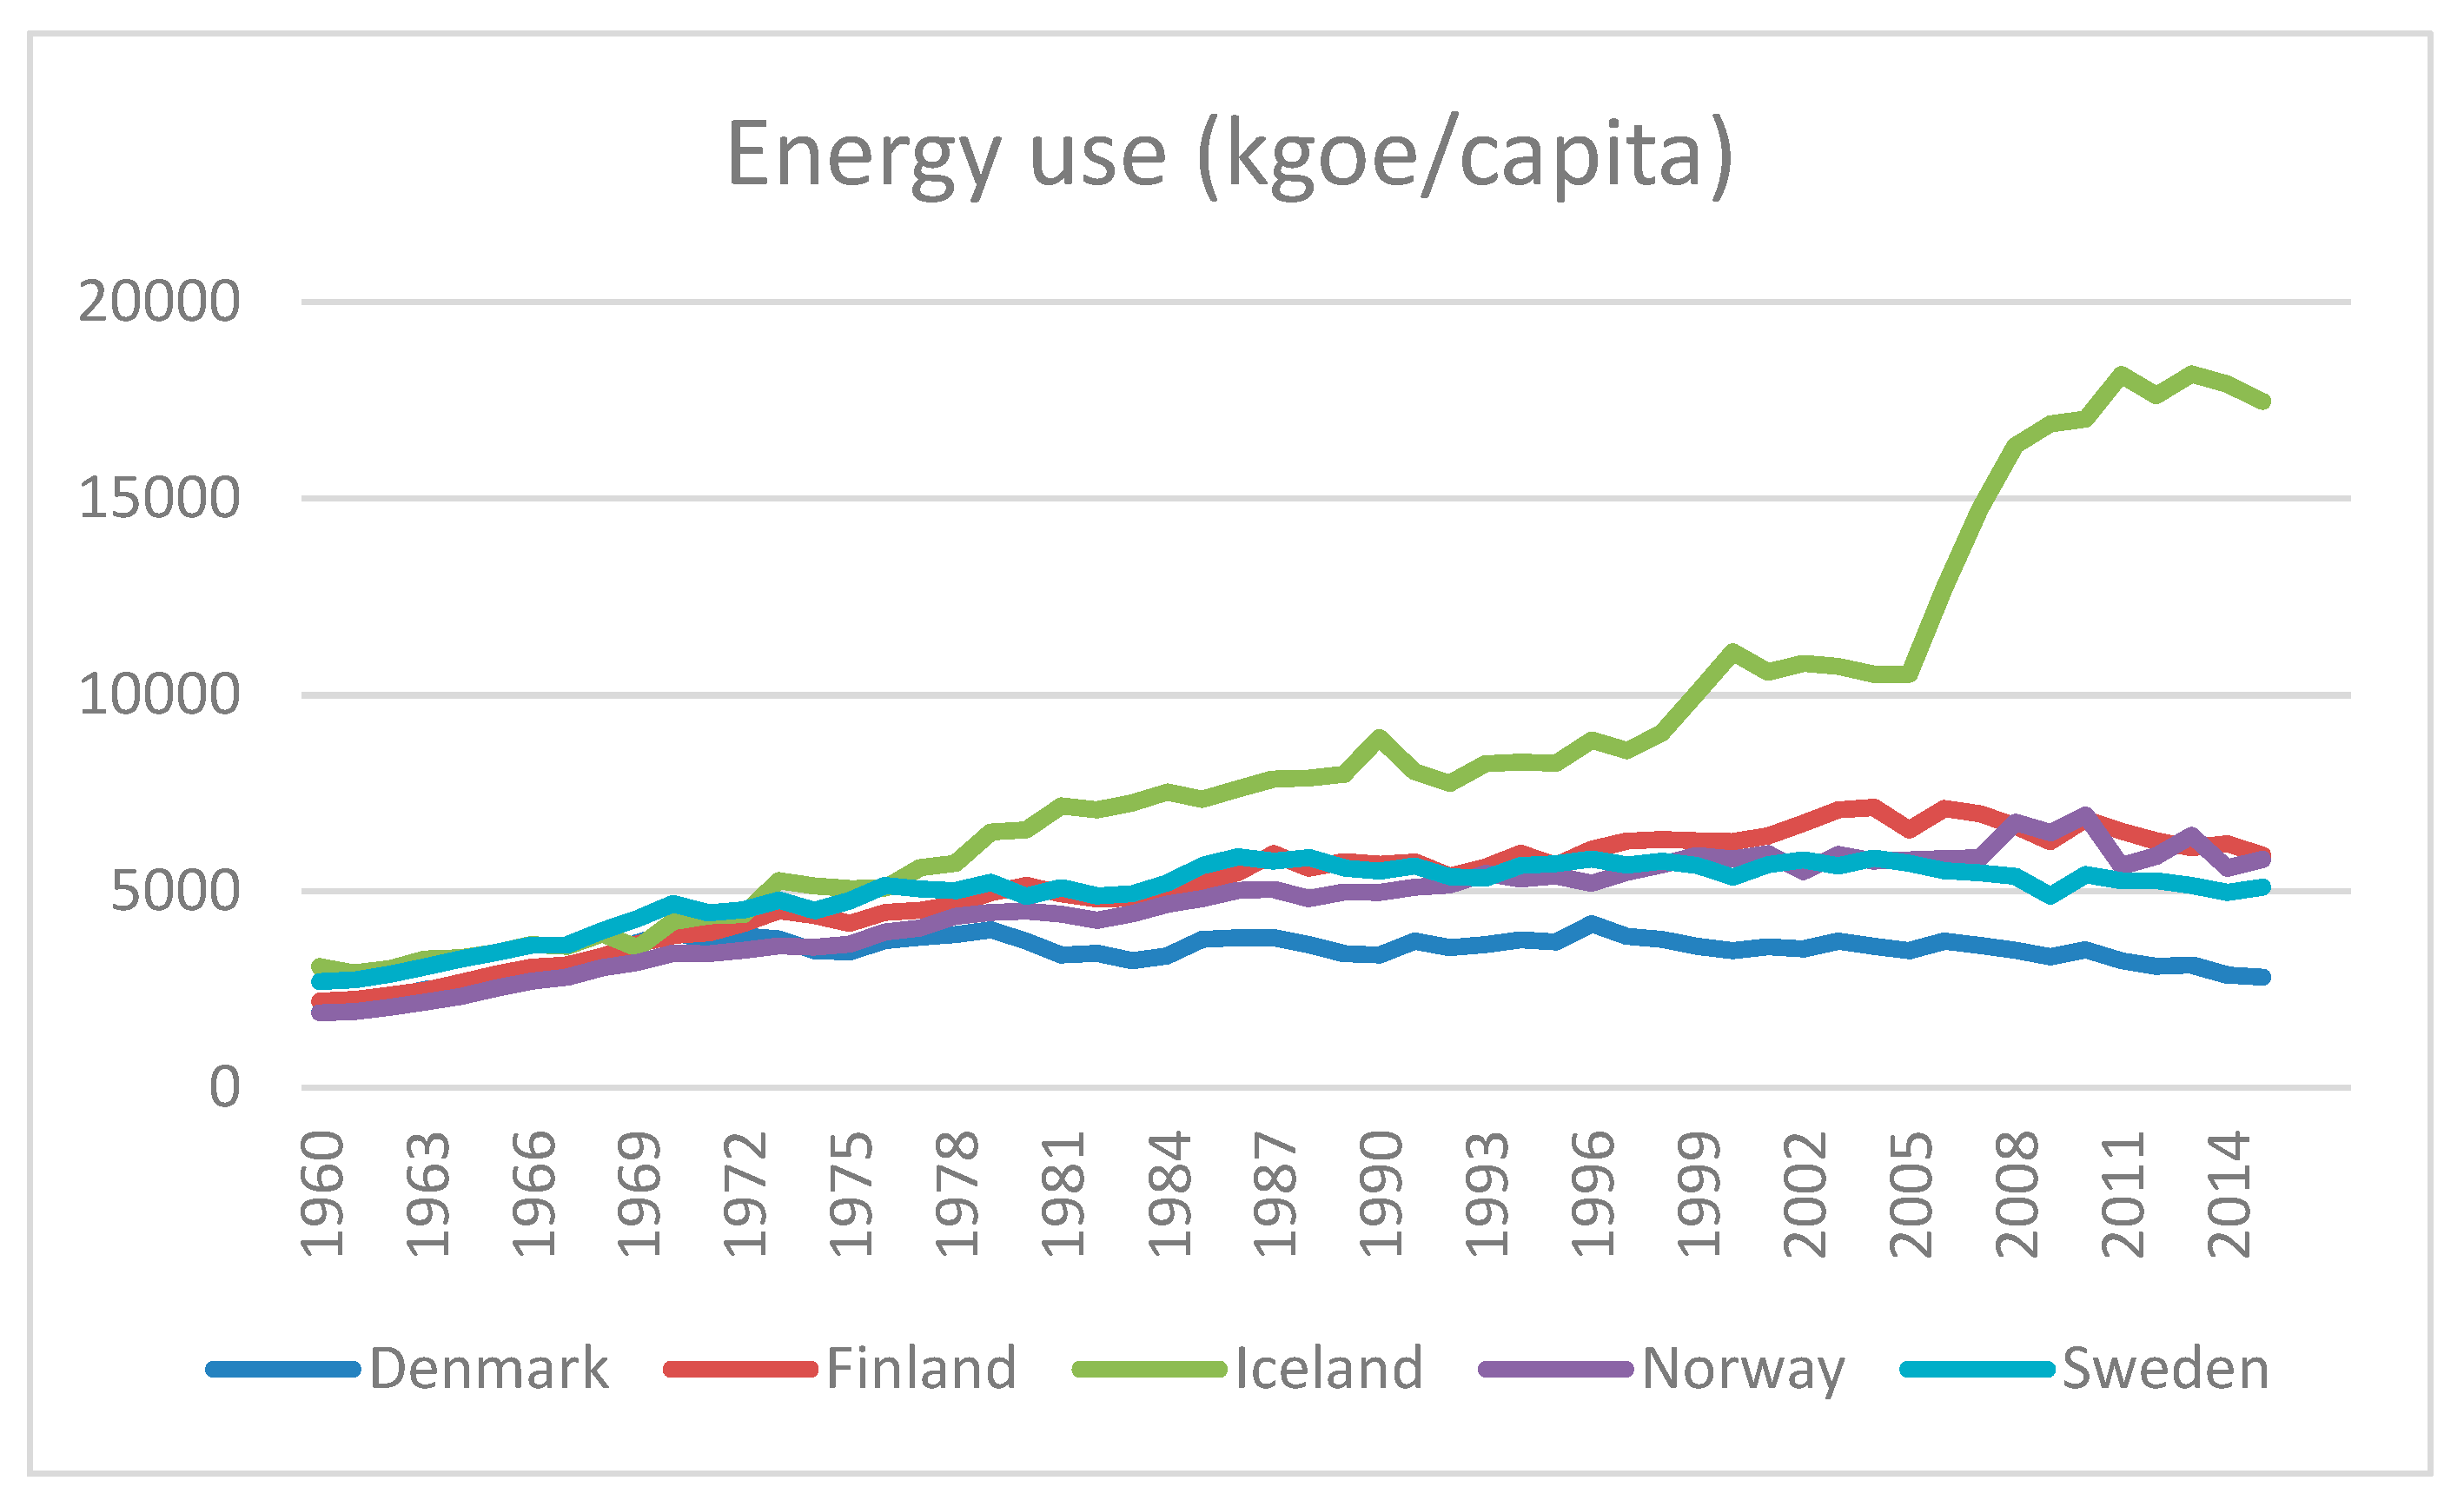
Figure 3 shows the increase in energy use on a per capita basis between 1960 and 2015. The figure shows a very interesting trend in Iceland’s energy use, which is actually similar to its electricity use, namely a relatively modest increase between the 1990s and the early 2000s, followed by a very steep and non-linear increase in energy and electricity use from about 2005 to today. Interestingly, the same trend cannot be observed in Iceland’s CO2 emissions. The data shows a relative decoupling of economic growth from emissions for Iceland, as well as a decoupling of energy use from emissions. This is because of the high share of geothermal energy and hydropower in the energy mix.
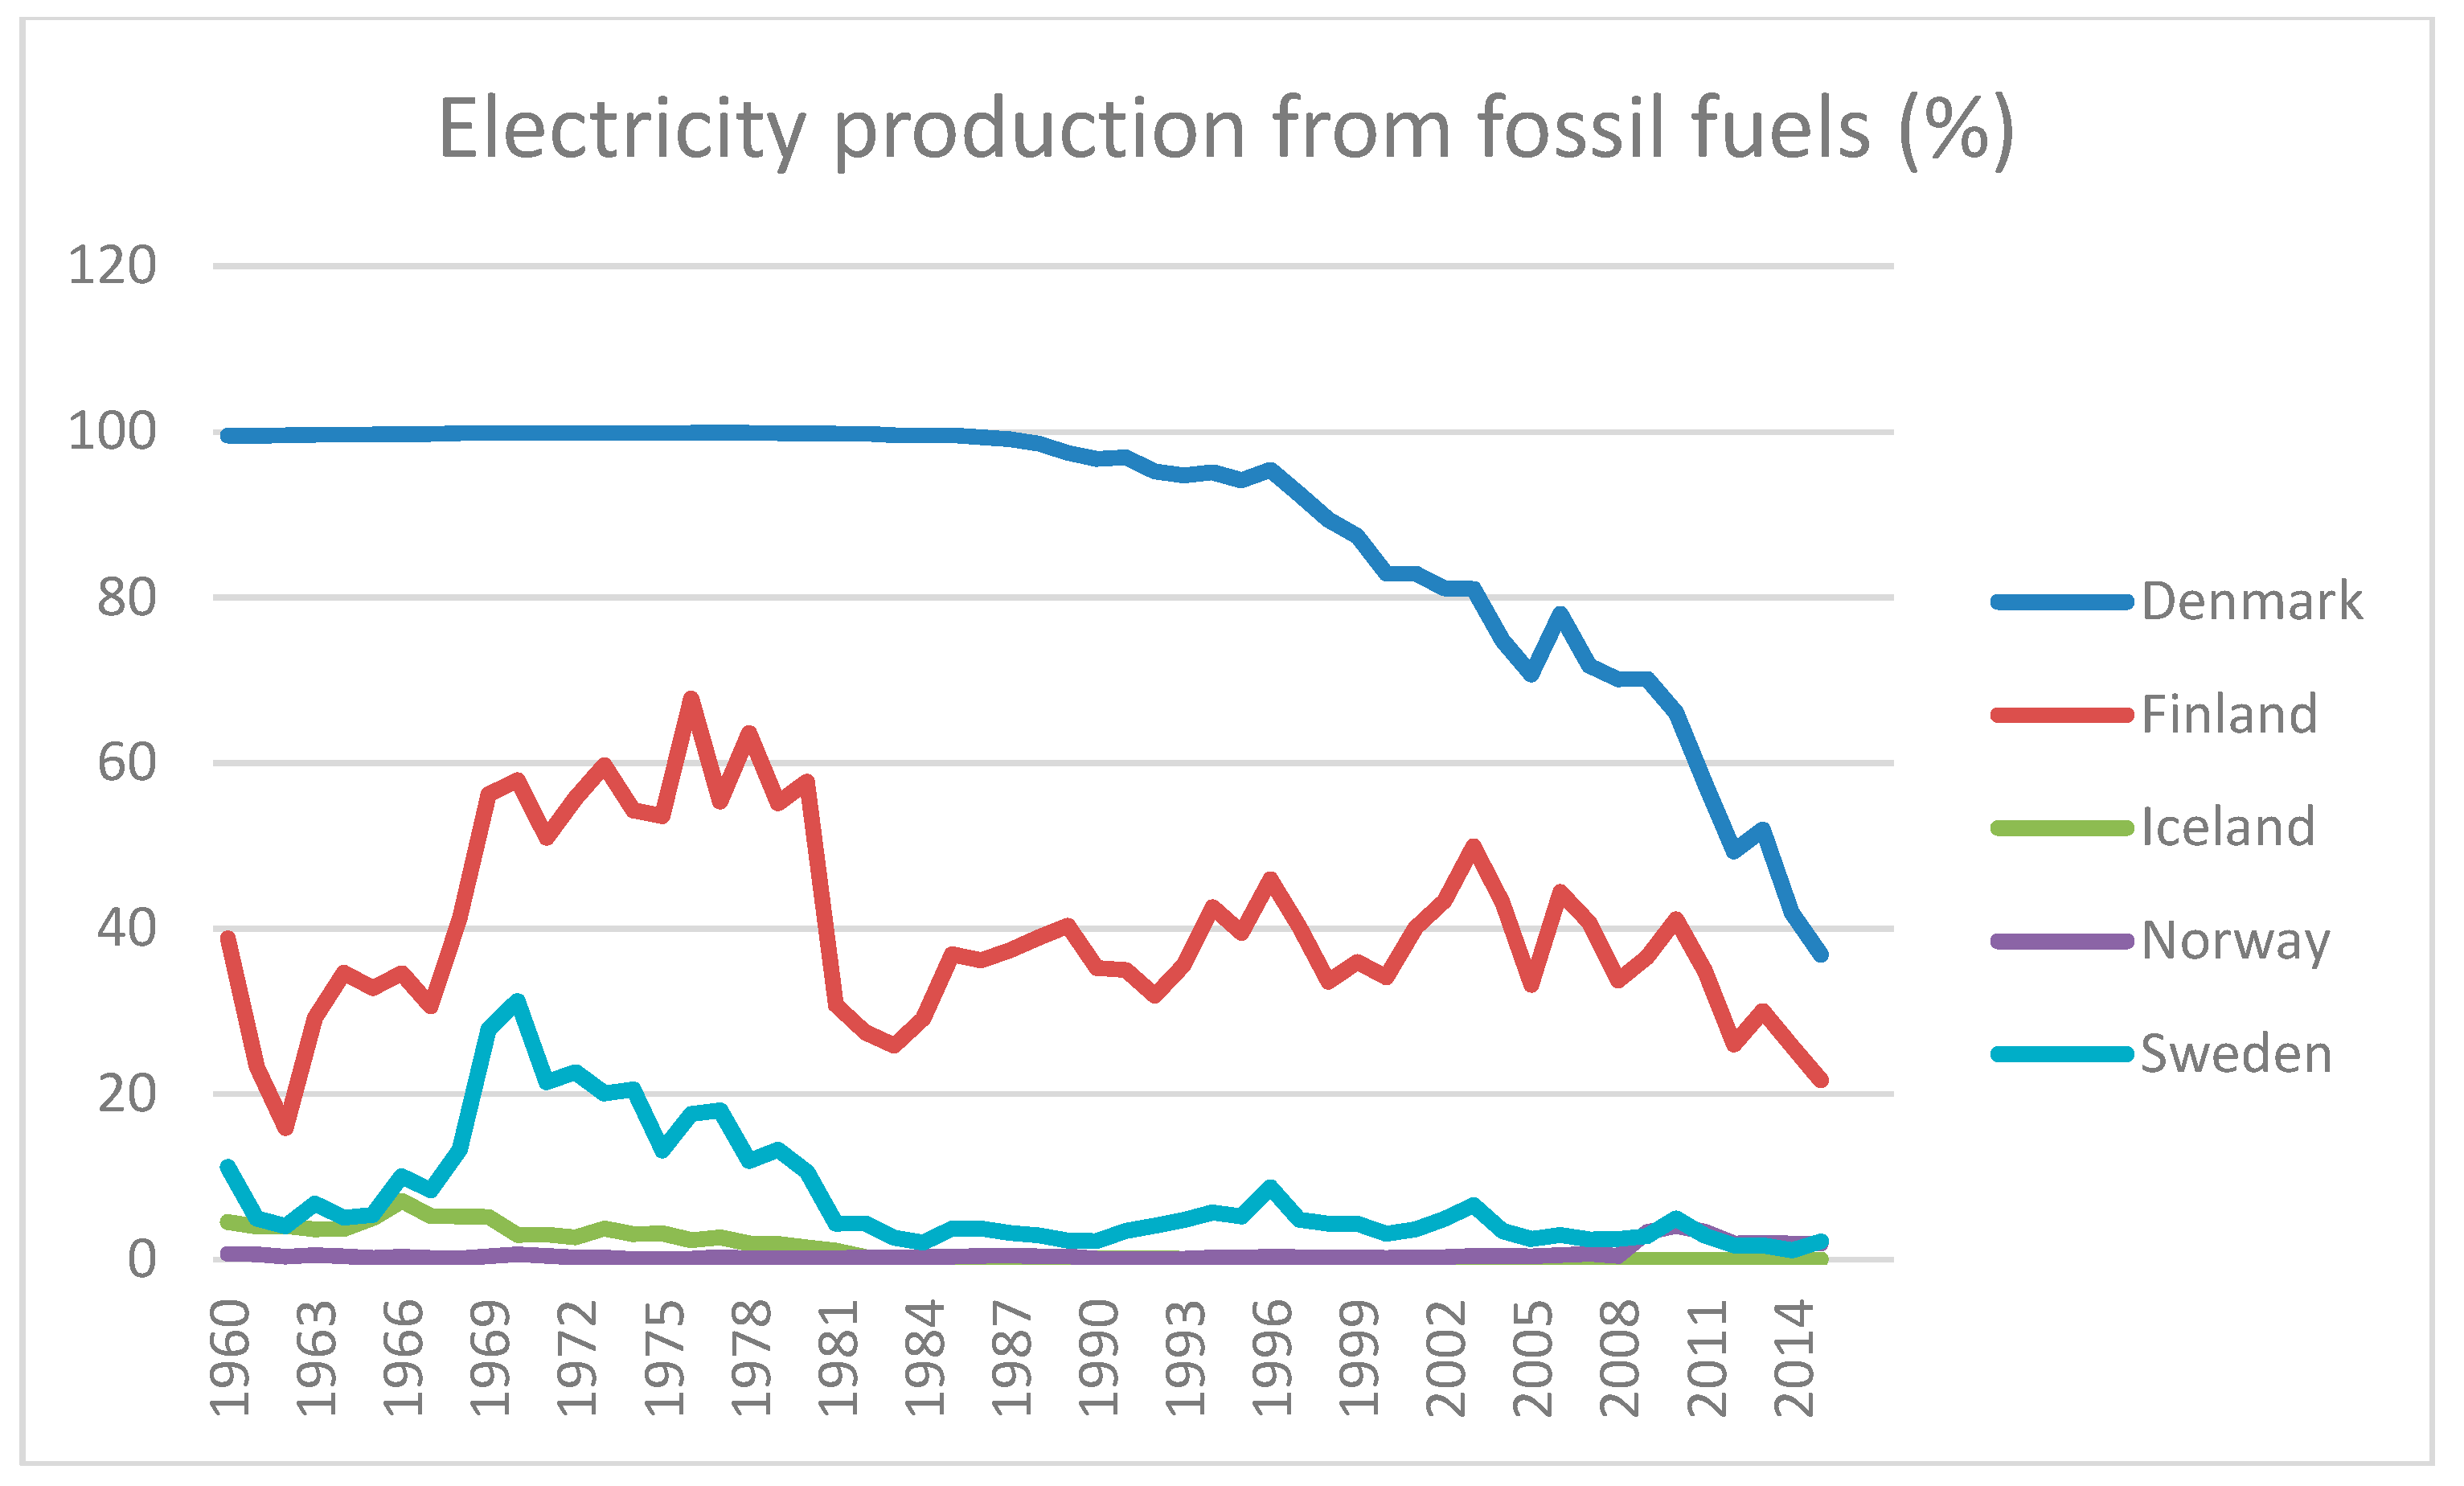
Figure 4 indicates the reducing share of fossil fuels amongst the electricity production in the Nordic countries over the last five decades and the increasing share of low carbon energy such as hydropower, wind, solar, biofuels, as well as nuclear energy (only relevant for Sweden and Finland). Denmark has seen a steep decrease in the reliance on fossil fuels in particular since the 1990s, as shown in Figure 4. Today, Denmark relies up to nearly 60% on non-hydro renewable energy for its total energy supply, most importantly, wind power. This is followed by Iceland, Finland, and Sweden, with Iceland generating nearly 30% of its electricity from geothermal energy. Norway’s electricity comes nearly exclusively from hydropower, followed by Iceland (about 70% hydropower) and Sweden (about 40% hydropower). Ninety percent of Iceland’s total energy comes from low carbon energy today, followed by Sweden with nearly 50% of its total energy coming from low carbon energy in 2015 [44].
3.2. The Environmental Kuznets Curve and the Nordic Countries
In this section, three indicators were used to assess whether or not the EKC can be observed in the Nordic countries: total CO2 emissions, per capita CO2 emissions, and per capita energy use. This has been plotted against income levels. This analysis is being presented per country to give more clarity to this complex issue.
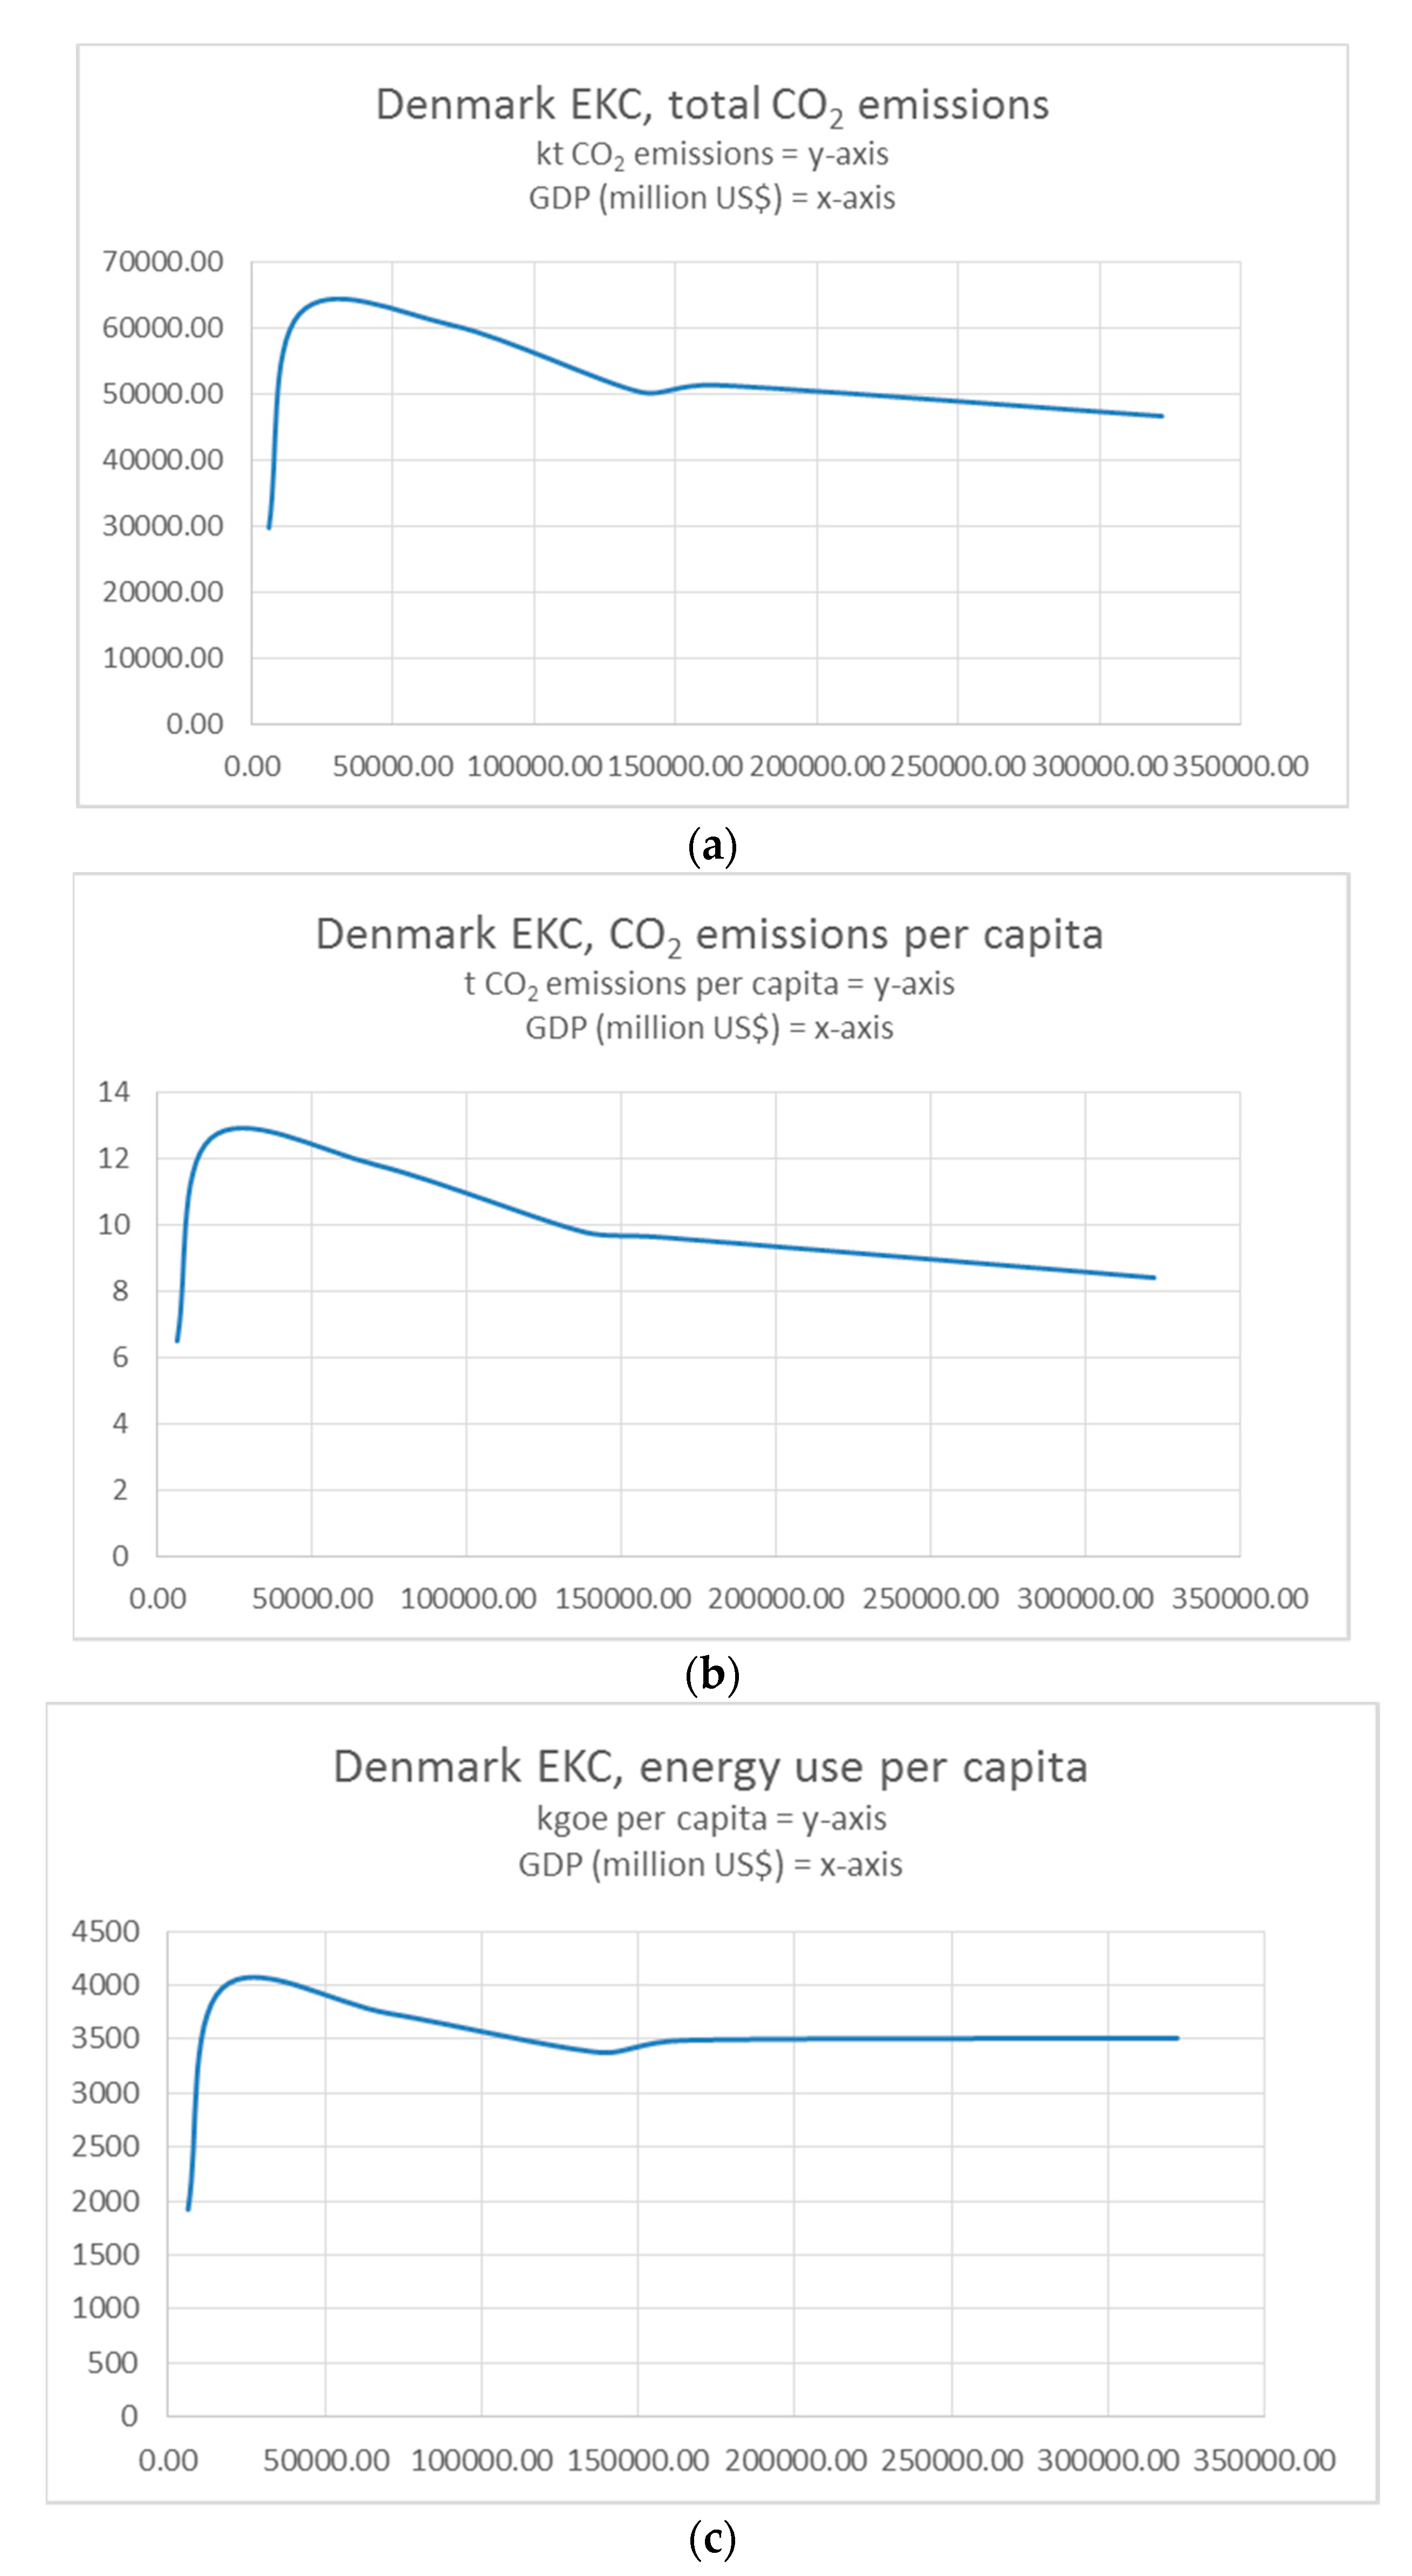
3.2.1. Denmark
Starting with total CO2 emissions, Figure 5 shows that clear evidence of the EKC has been found for Denmark. The inverted U-shaped curve has been observed at low levels of income, at about 50,000 million current US$ GDP, and the inverted U-shaped curve is nearly completed at rather modest income levels at around 100,000–150,000 million US$ GDP, followed by a steady levelling off and stabilising of emissions at low levels. Figure 5 also indicates decreasing capita CO2 emissions for Denmark. There is very clear evidence of the EKC with regards to per capita emissions. The analysis of energy per capita for Denmark reveals similar results to the analysis of emission levels. Figure 5 shows there is evidence for the EKC with regard to energy use per capita in Denmark. It has to be pointed out that Denmark is the only Nordic country that shows this pattern. A decline in energy use per capita could be observed at low levels of income, at about 50,000 million current US$ GDP, which then levels off and stabilises with further increases in income levels.
3.2.2. Finland
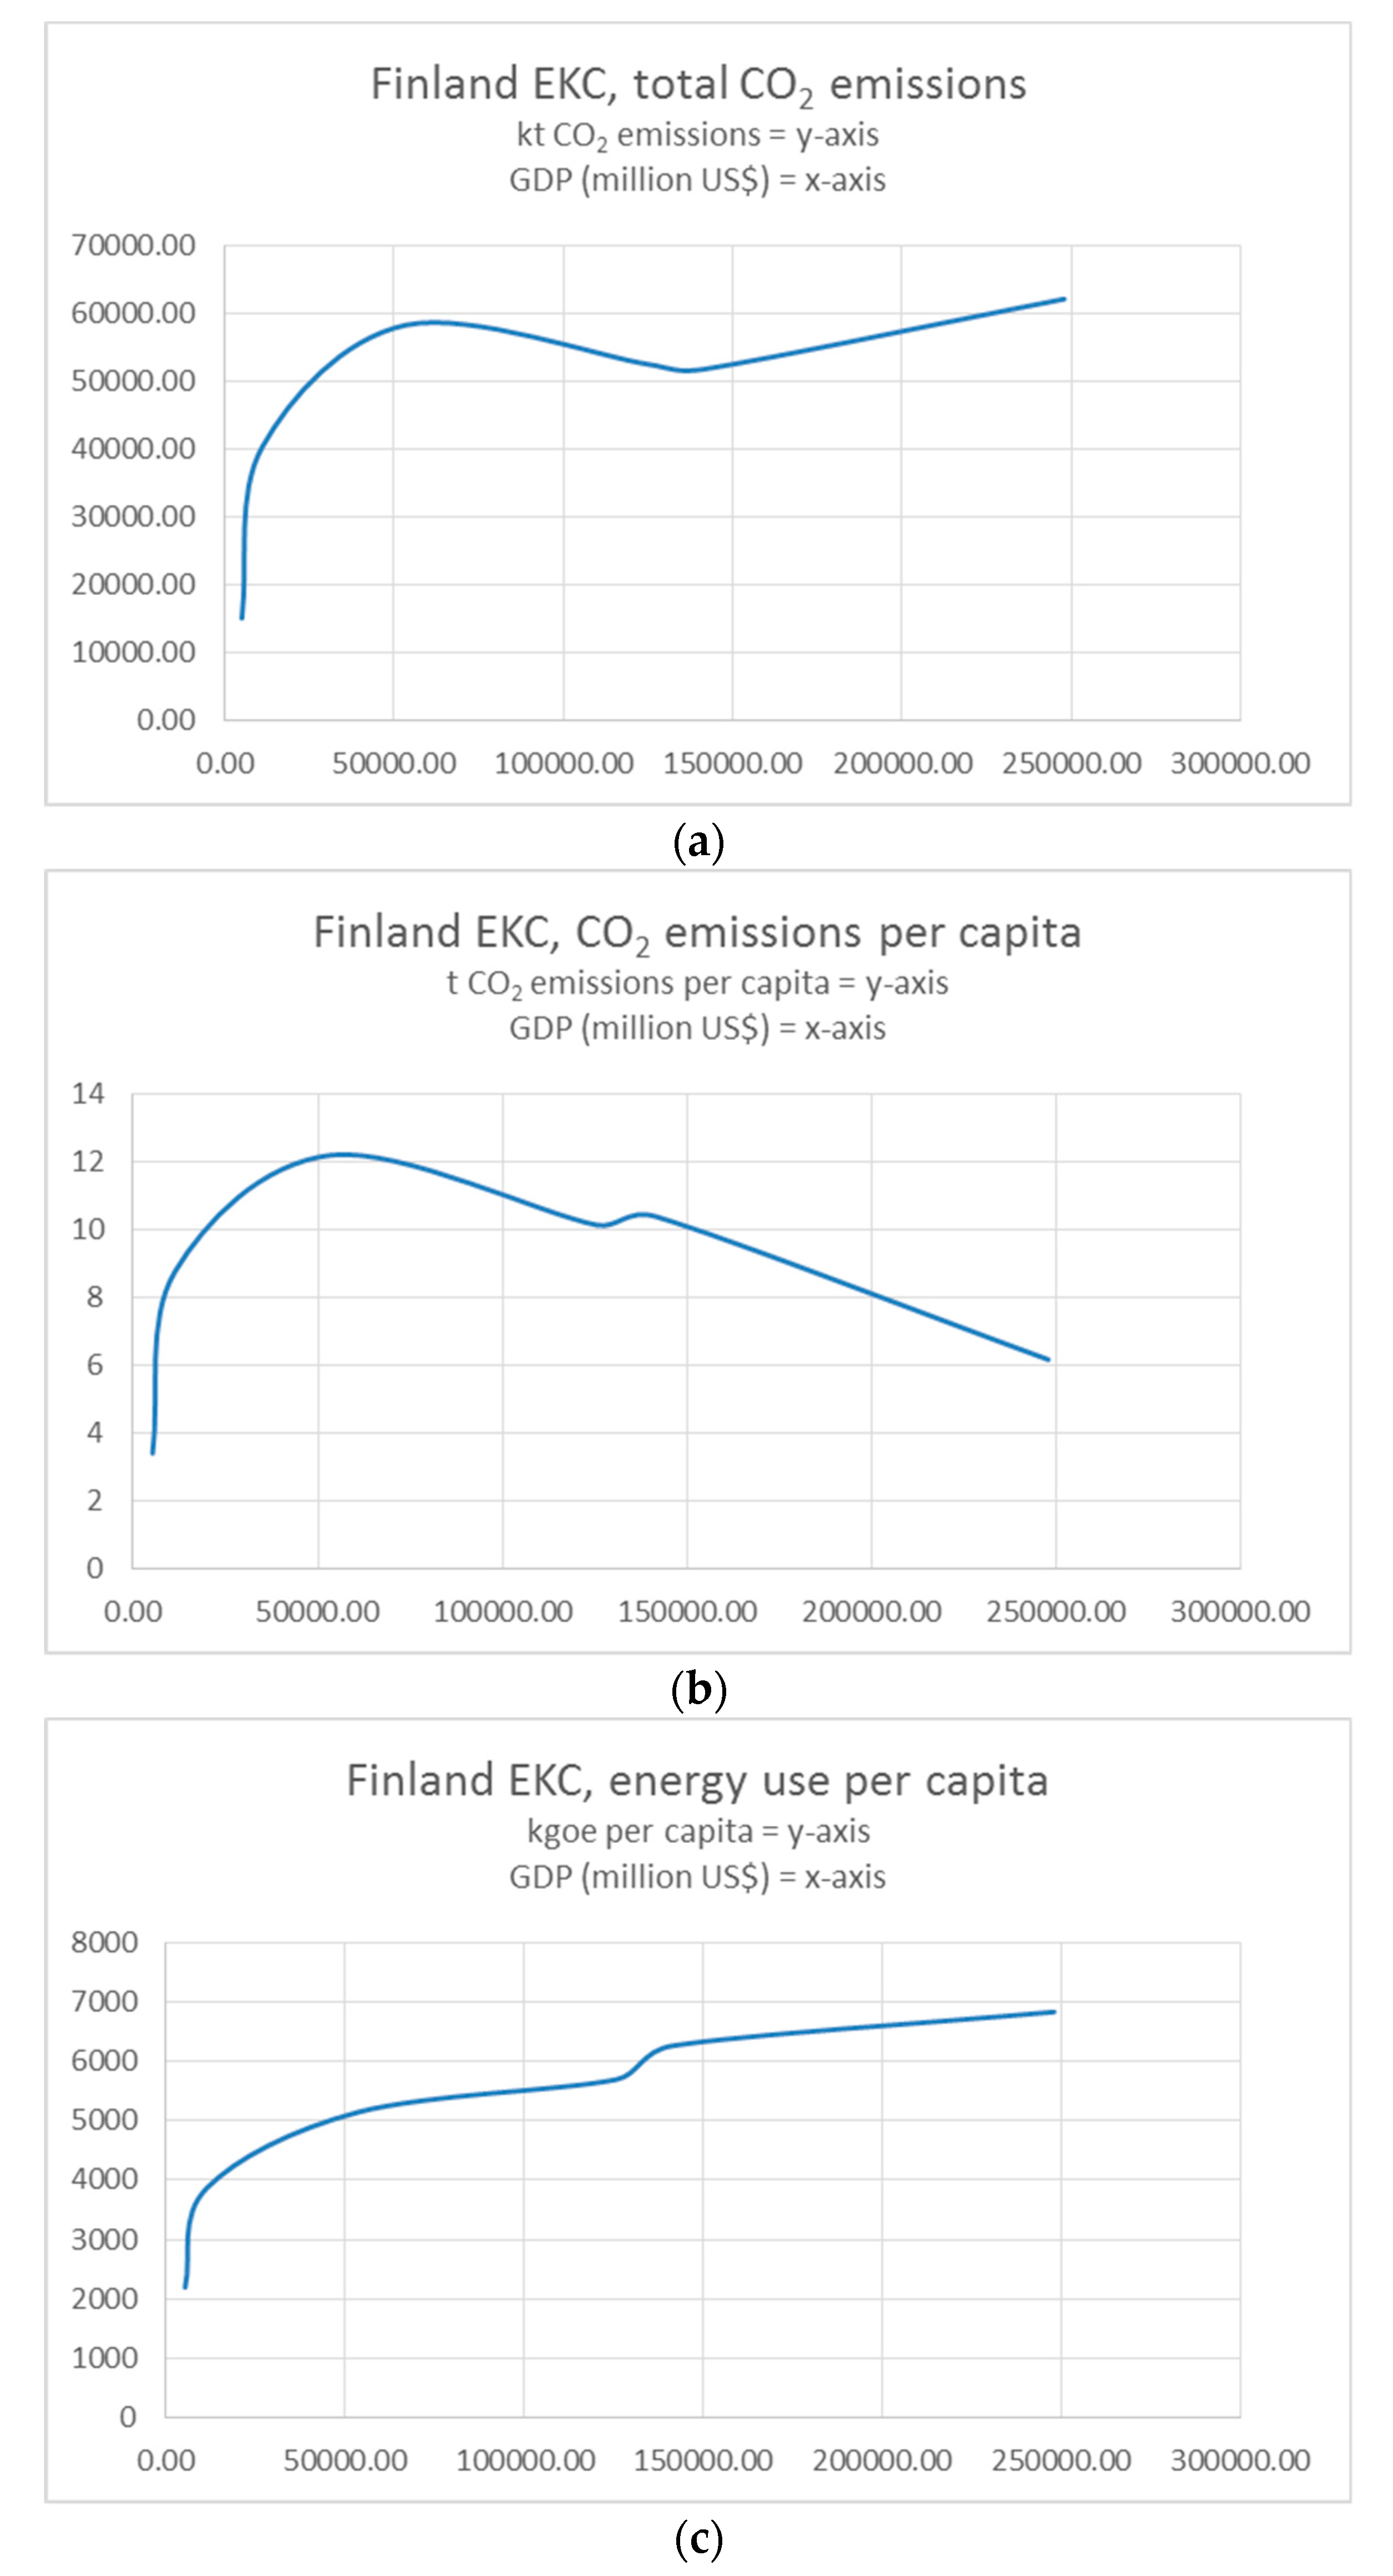
Starting with total CO2 emissions, Finland shows an interesting dynamic, as indicated in Figure 6. It showed indications for an EKC at about 100,000–150,000 million US$ GDP, and then pollution levels increased again with higher income levels. In Finland, there is clear evidence of declining per capita CO2 emissions with rising GDP over time, following a clear EKC. The analysis of energy per capita reveals very different results to the analysis of emission levels. Figure 6 shows that there is no EKC in Finland with regard to energy use per capita. Instead, energy use per capita is increasing in Finland, without any evidence of following an inverted U-shaped EKC. See Figure 6.
3.2.3. Iceland
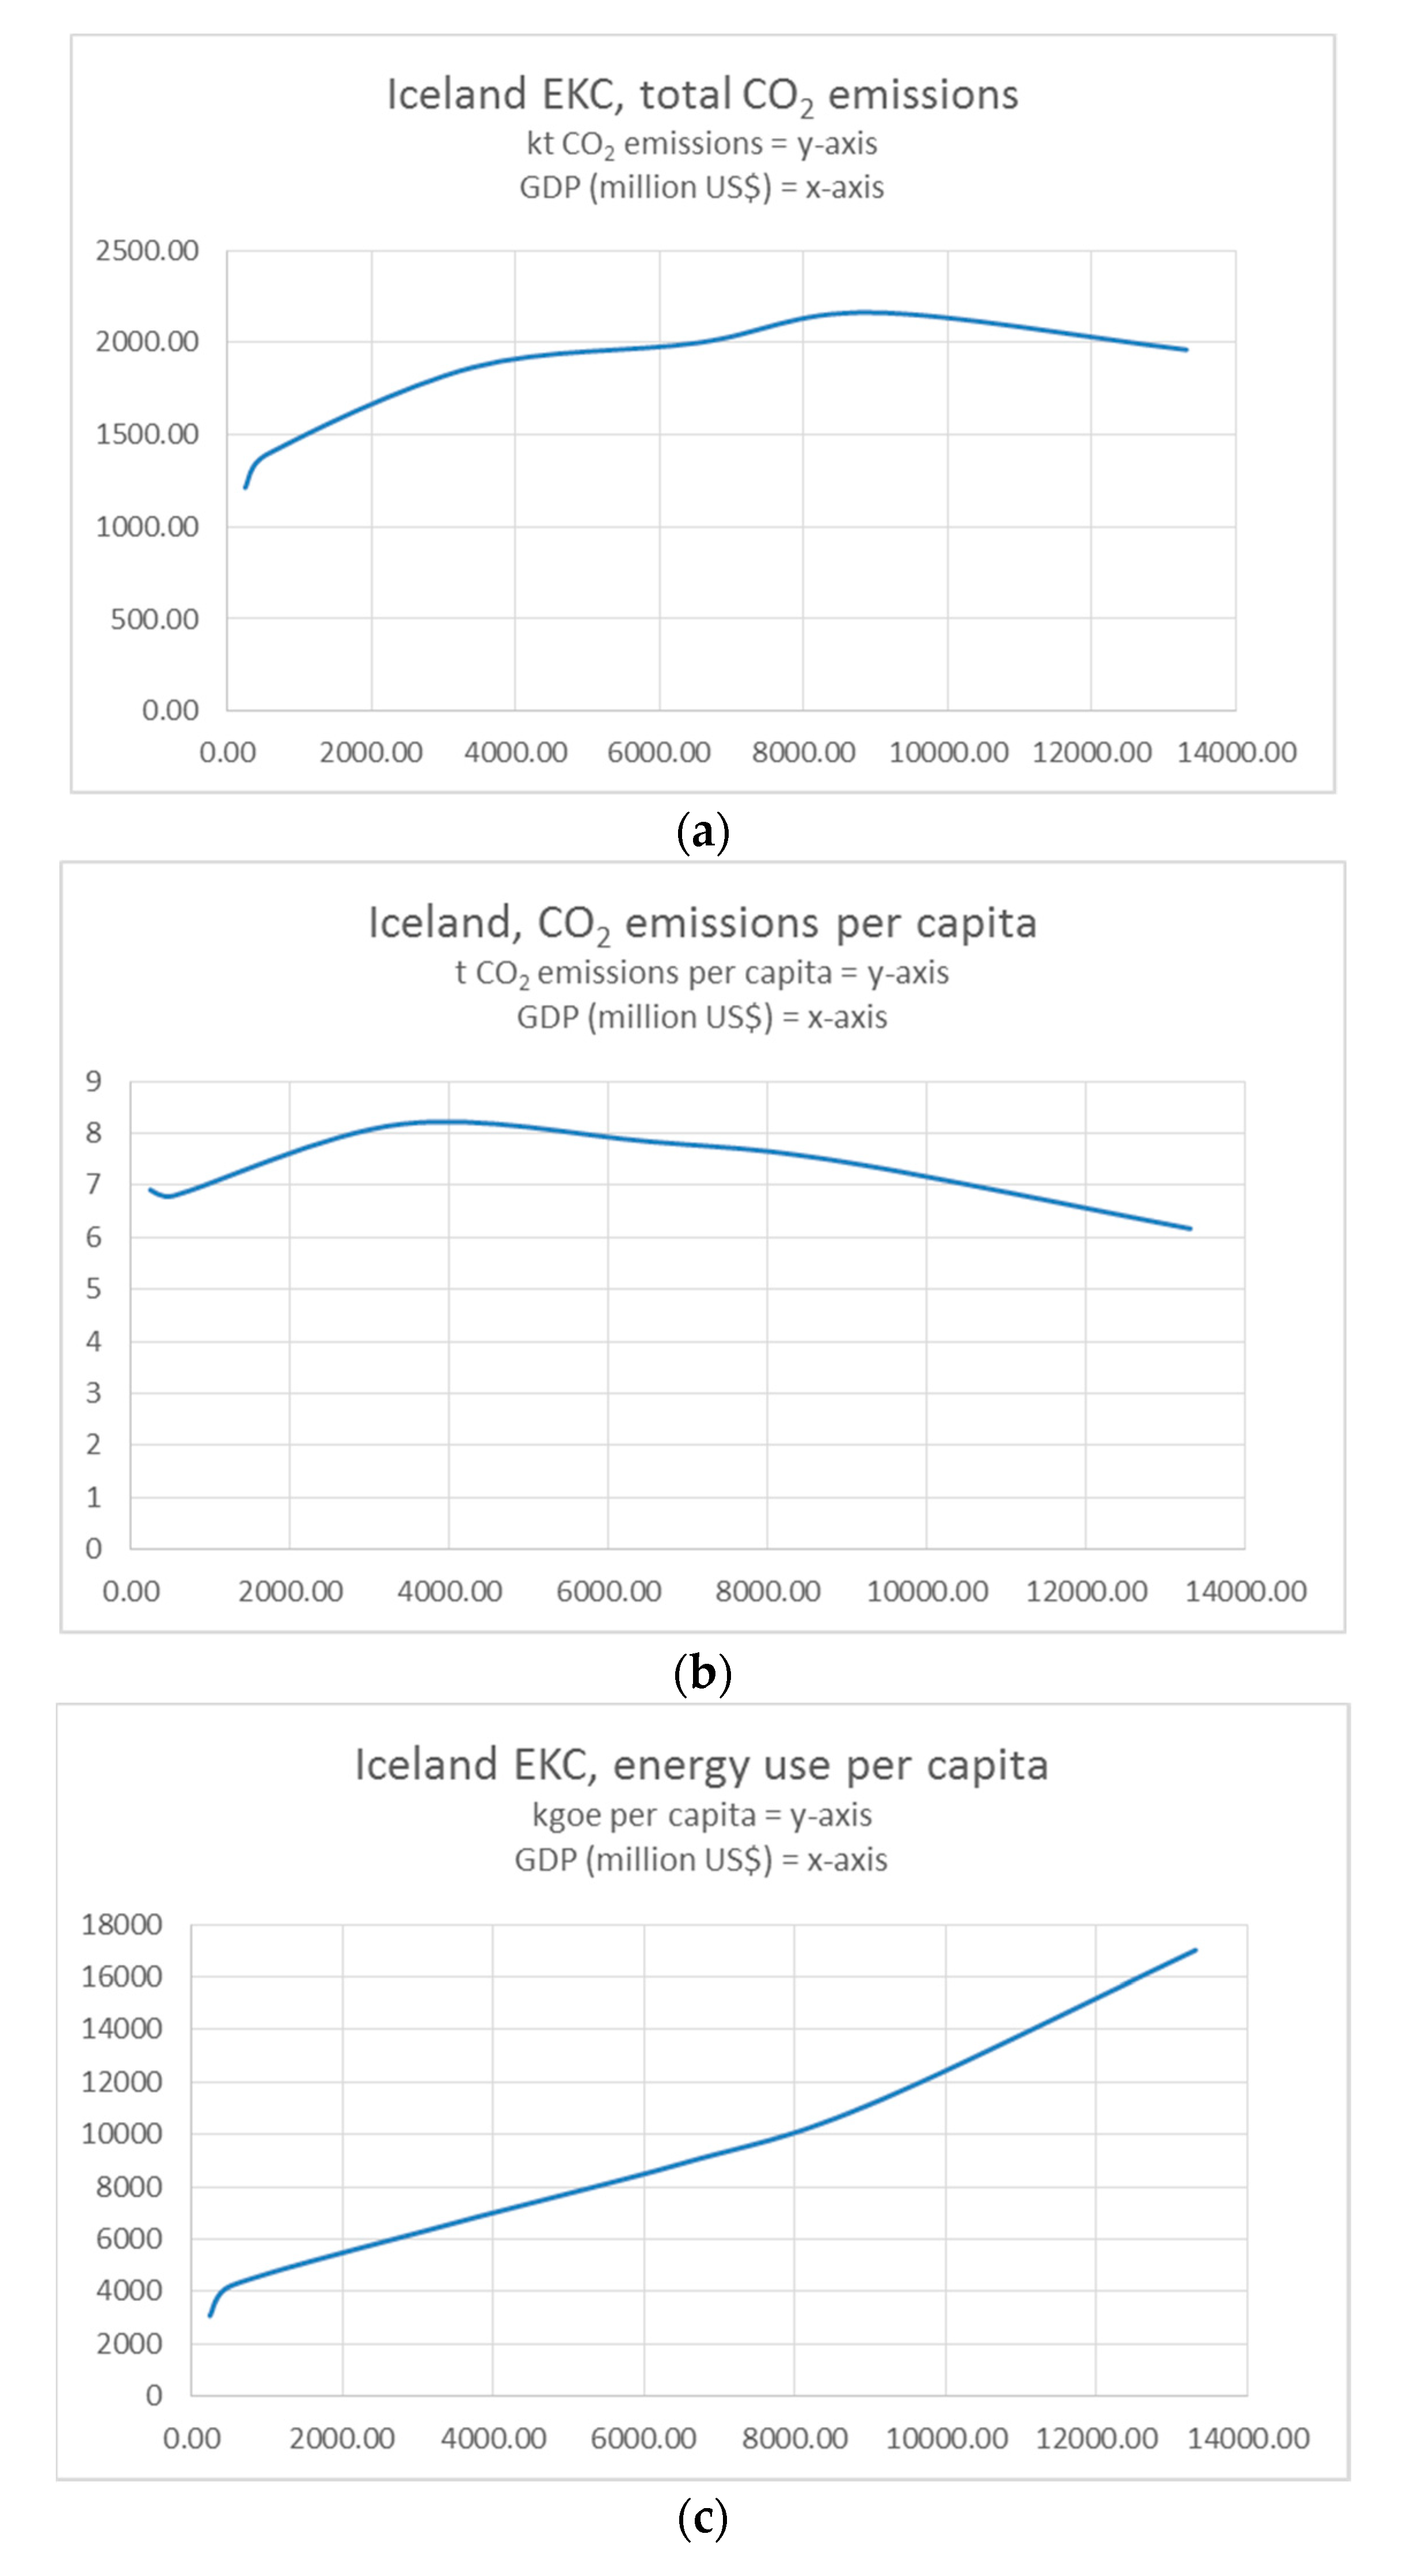
Starting with total CO2 emissions, Iceland shows indications of an EKC-shaped curve, as Figure 7 indicates; however, this is less clear than for Denmark. Iceland may be approaching a more clearly shaped inverted U-shape EKC over time or it may be stabilising at slightly lower than peak levels. Figure 7 also shows declining per capita CO2 emissions for Iceland. Iceland very clearly shows evidence of the EKC with regards to per capita emissions. The analysis of energy per capita reveals very different results to the analysis of emission levels. Figure 7 indicates that there is no EKC in Iceland with regard to energy use per capita. Instead, Iceland shows a steep increase in per capita energy use and no evidence for the EKC with regard to energy use.
3.2.4. Norway
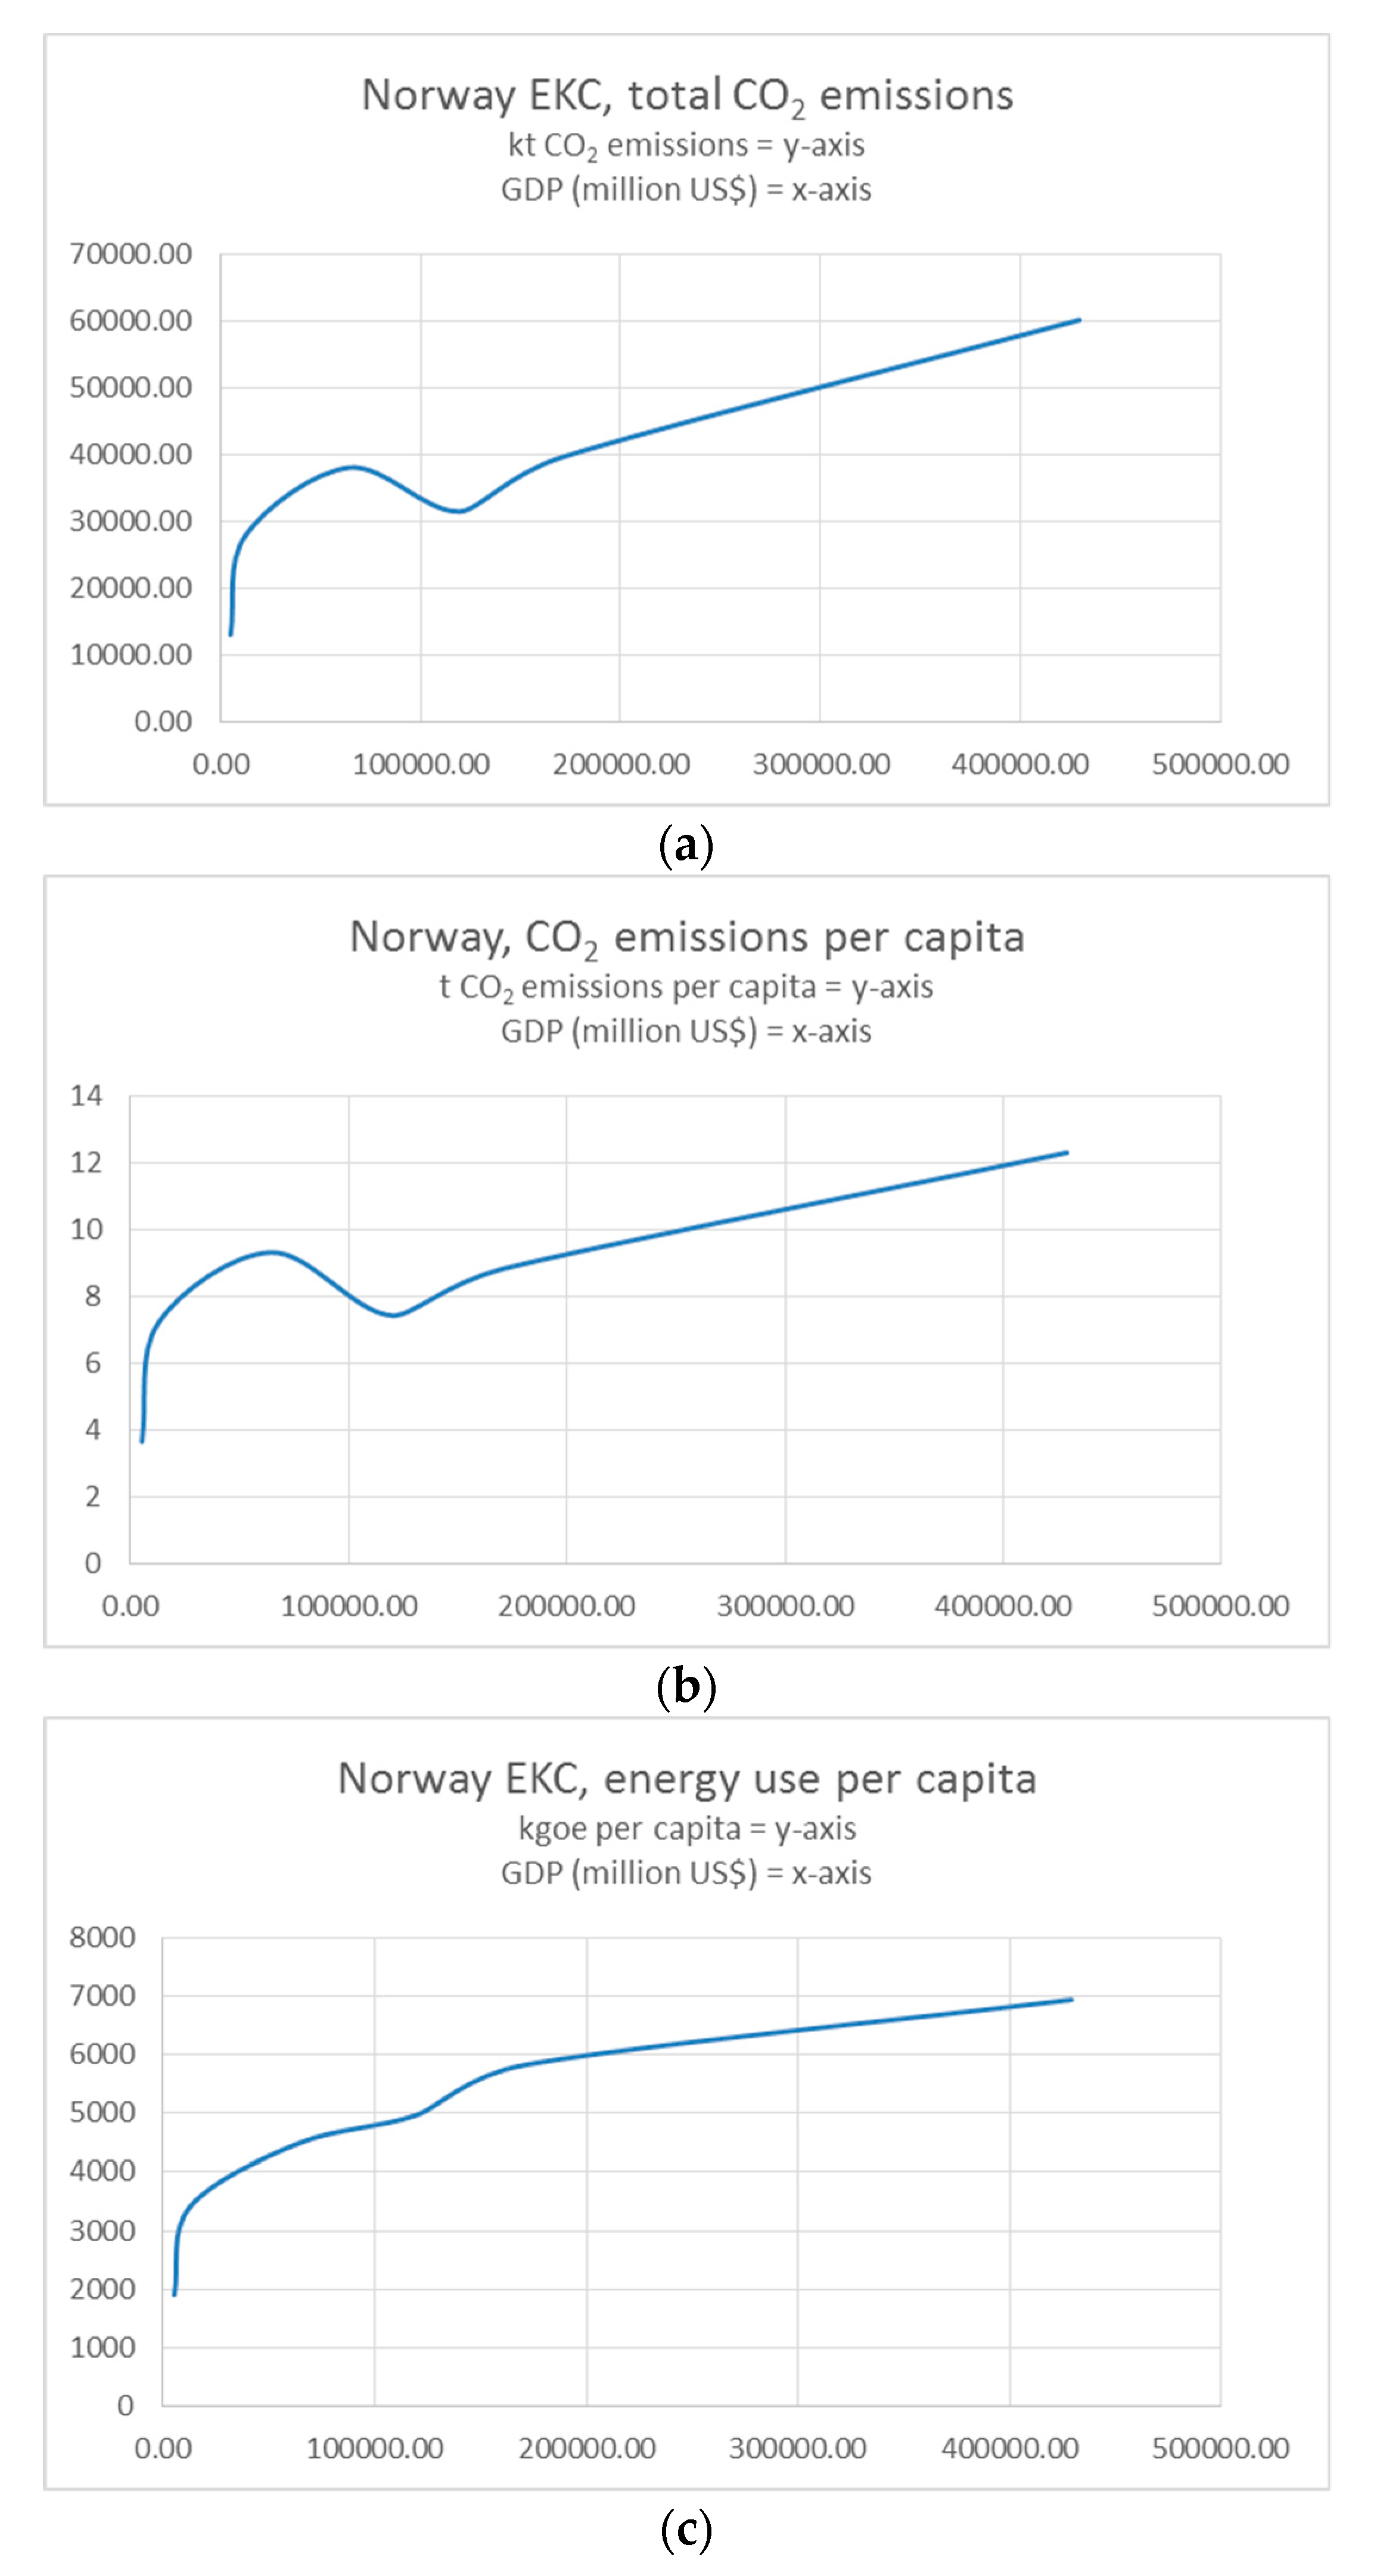
Norway lags behind the other Nordic countries with regards to its emissions performance. While all other Nordic countries show declining per capita CO2 emissions, and all countries except Finland show declining total CO2 emissions, the same development cannot be observed in Norway. Instead, total carbon emissions are rising. Norway showed a dip regarding total CO2 emissions at about 120,000 million US$ GDP, and then steeply increased its emissions with rising income levels, similar to Finland, albeit as a much more linear and steep trend for Norway. See Figure 8. For per capita CO2 levels, there is no evidence of an inverted U-shaped EKC. There is also no EKC visible in Norway with regard to energy use per capita, as Figure 8 indicates. Energy use per capita is instead increasing in Norway without any evidence of following an inverted U-shaped EKC.
3.2.5. Sweden
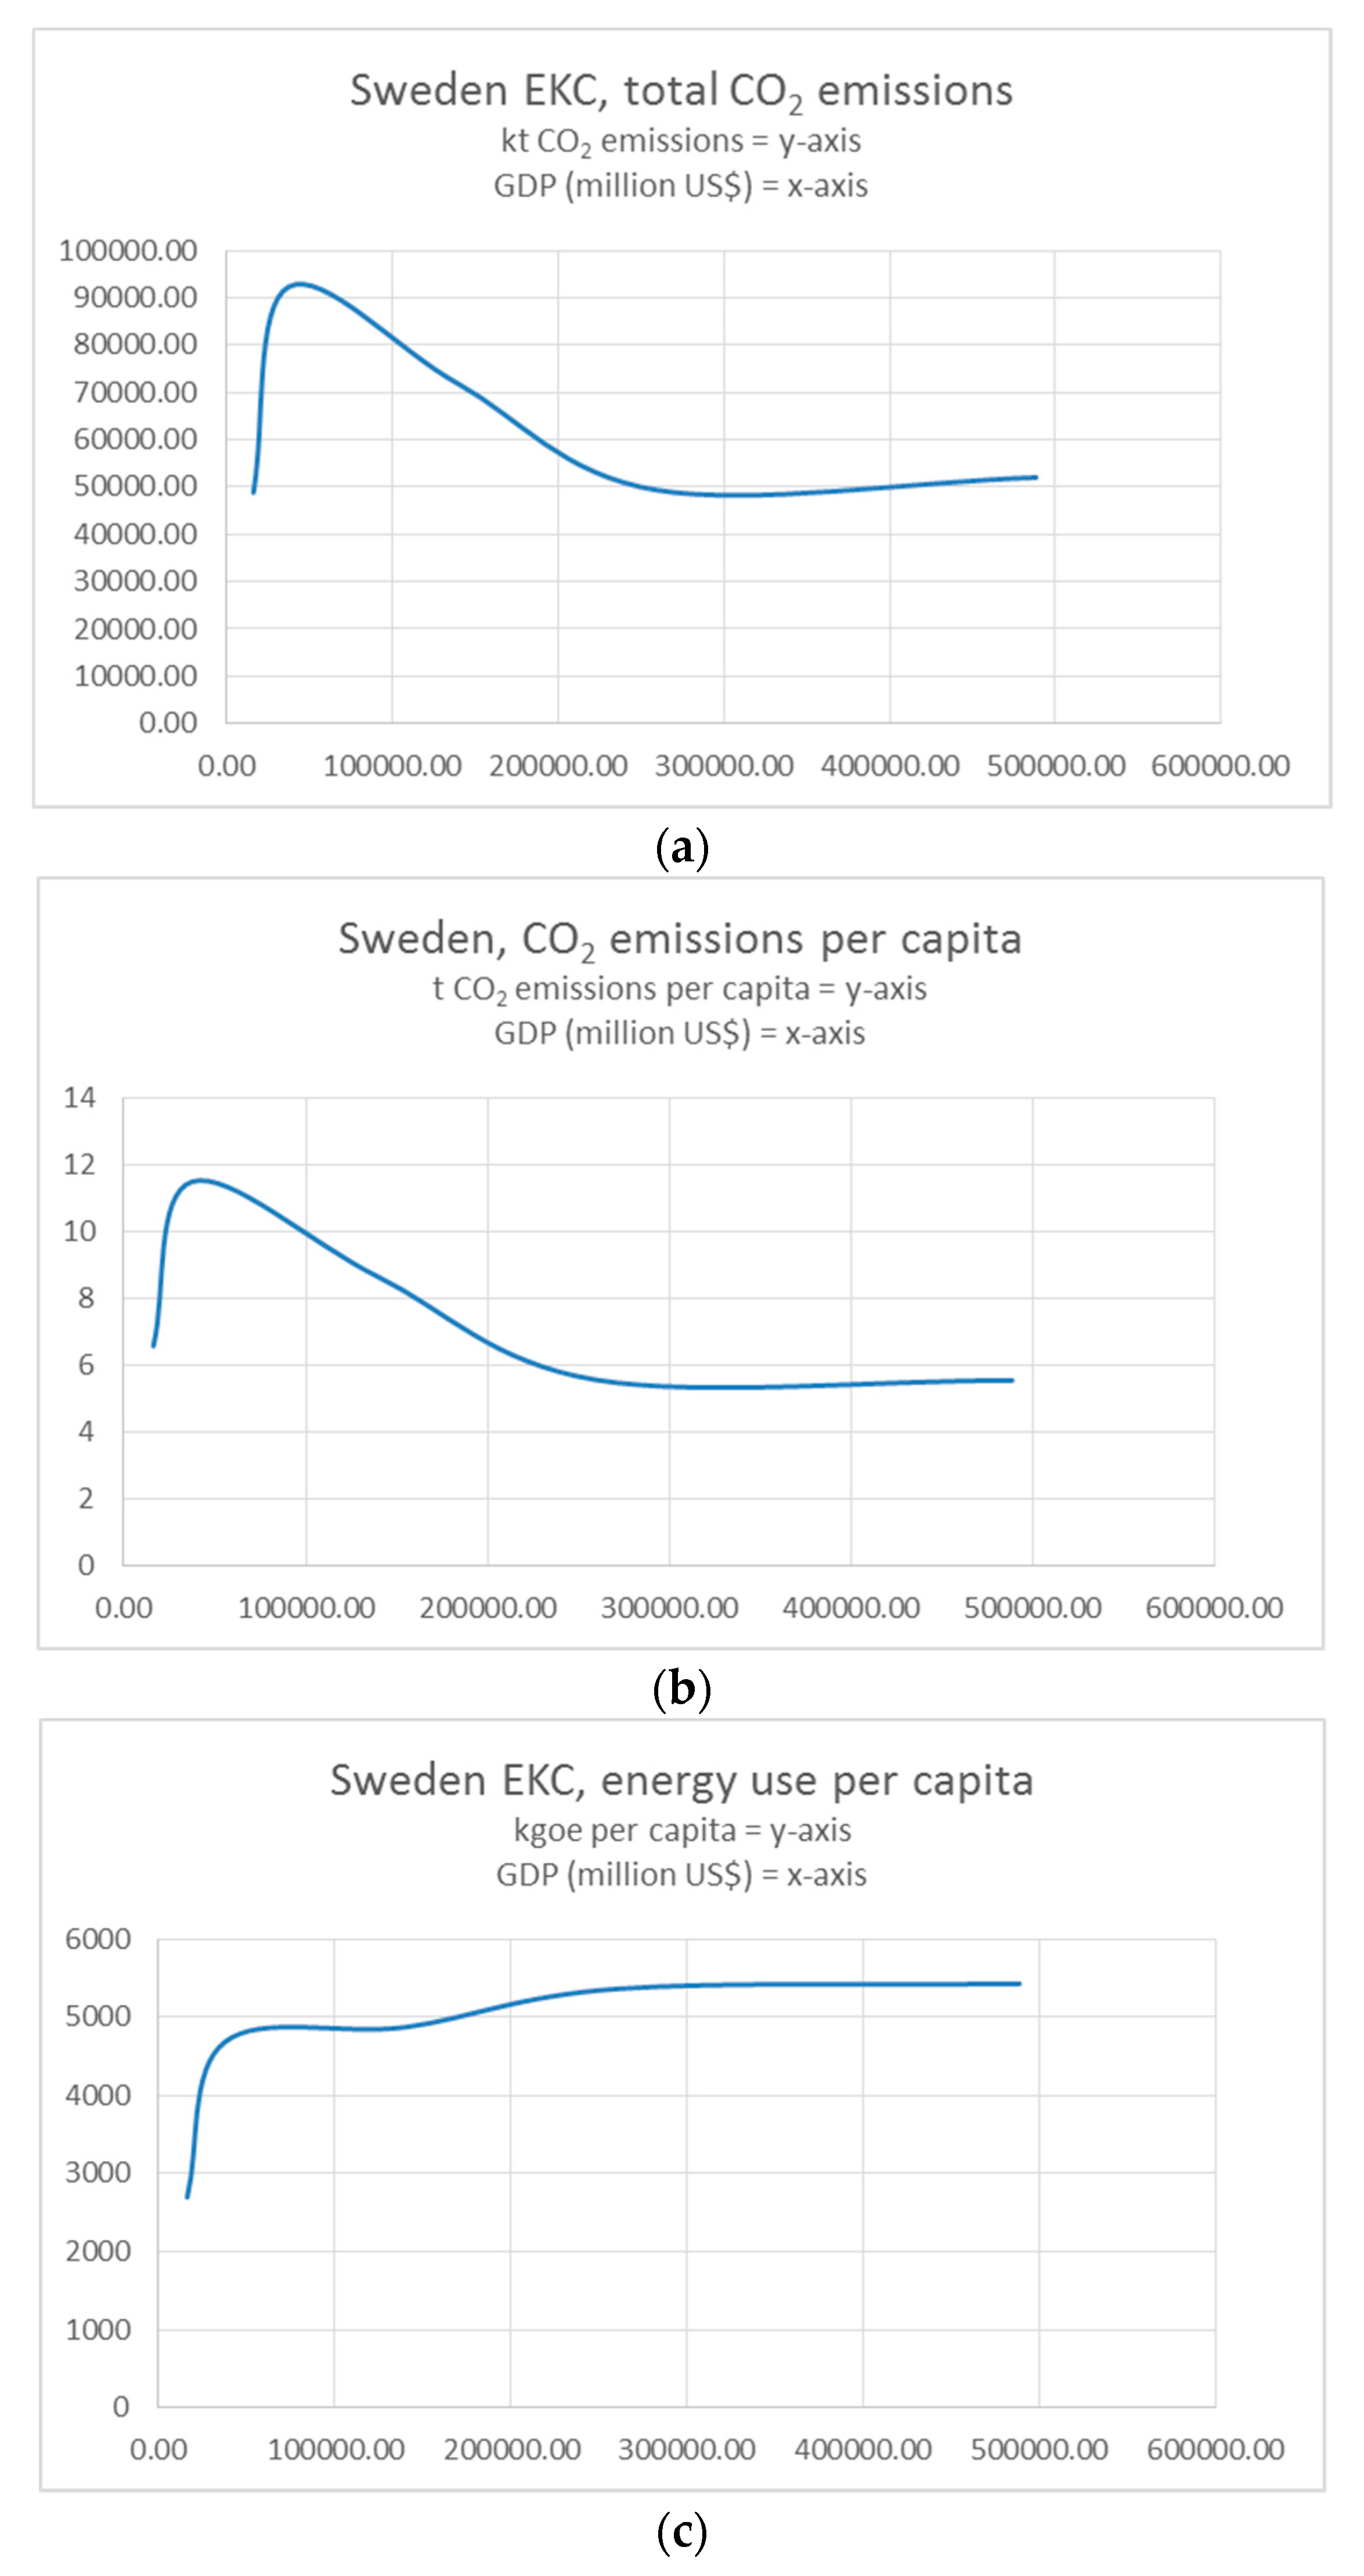
Sweden is the best performing Nordic country with regards to emission reductions. Starting with total CO2 emissions, there is clear evidence of an inverted U-shaped EKC, as Figure 9 indicates. Sweden also very clearly shows evidence of the EKC with regards to per capita emissions. In 2015, Sweden had per capita emissions of only 3.78 t CO2/capita, which is far below the EU-28 average of 6.38 t CO2/capita and even below the world average of 4.4 t CO2/capita [2]. Today, Sweden’s emissions are in fact lower than those in 1960. The analysis of energy per capita, however, reveals very different results to the analysis of emission levels. Figure 9 shows that there is no EKC in Sweden with regard to energy use per capita. Sweden shows a levelling off at a similar peaking point to Denmark; however, no decline in energy use can be seen.
4. Discussion
Araujo and Sovacool found that both historic and more recent energy transitions happened in the Nordic countries, notably in Iceland, Denmark, and Sweden [1,17]. Their research is mainly qualitative, including policy analysis, interviews, and field visits. While qualitative analysis of policy documents and primary fieldwork data from interviews are very useful, it is also beneficial to analyse quantitative data to examine certain trends and dynamics and to provide objective ‘hard facts’ to confirm or negate qualitative findings that can sometimes be subjective. Our results confirm the findings of earlier studies, although different methods have been used. This paper also adds value by examining the EKC for the Nordic countries with regards to national and regional emissions and energy performance, which is novel and has not been done before. The methodological approach in this study is based on a quantitative study that uses data analysis to analyse the EKC in the Nordic countries. Although there is some recent research on low carbon energy transitions in the Nordic countries (e.g., Araujo on Iceland and Denmark [17]; and Sovacool for a regional overview [1]), the current literature does not evaluate the Nordic low carbon energy transitions from the perspective of the EKC. This is where this paper adds new insights. The EKC is a useful concept for helping us understand the process of development from an energy-related pollution perspective. The EKC can shed further light on the dynamics and directions of low carbon energy transitions and can help provide insights into how economic development relates to environmental pollution, both on an aggregate and per capita basis.
The findings show that while there has been almost exponential economic growth over more than five decades in the Nordic countries, the CO2 emissions do not mirror the same trend. Emissions have first increased and then declined back to 1960 levels in Sweden from the 1980s and in Denmark from about 2010. Sweden’s emissions today are even slightly below those in 1960. The CO2 emissions have increased only slowly in Iceland, and seem to be in decline currently, while there have been more steep increases in Norway and Finland. There is, therefore, evidence of absolute decoupling of economic growth from emissions for Sweden and Denmark, possibly also for Iceland, although more long-term observation is needed here, as well as relative decoupling for the other Nordic countries. Energy use and electricity use have increased in each of these countries, particularly rapidly and steeply for Iceland.
Iceland’s energy and emissions profile is particularly interesting; energy use has sharply increased over the last few decades, while total CO2 emissions have increased at a much lower rate and then slightly declined recently, while per capita CO2 emissions are clearly declining. This is because of the very high share of geothermal energy and hydropower in the energy mix (about 90% of total energy use and about 100% of electricity use). Other Nordic countries have also high shares of low carbon energy among the total energy mix, such as Sweden where about 45% of total energy use comes from hydropower and nuclear power, Denmark where 60% of the electricity use comes from wind energy, and Norway where almost 100% of the electricity comes from hydropower (IEA, 2018). Yet, carbon emissions need to be tackled more effectively in Norway as its total CO2 emissions and its per capita emissions are still increasing, as is the country’s energy use.
There is, therefore, clear evidence of low carbon transitions in the energy sector in Sweden, Denmark, and Iceland between the 1960s and 2015, partly also in Finland and Norway. Low carbon energy transitions happened at the following times in the Nordic countries: for Denmark, in the mid-1990s when renewable energy, particularly wind energy, gained importance; for Finland, in the 1990s when a larger share of modern biofuels was introduced for electricity generation and in the 2000s when other renewable energy sources gained prominence; in Iceland, in the 1980s when the share of geothermal energy was increased for electricity generation and for heating; in Norway, in the mid-2000s when renewable energy was introduced; in Sweden, in the 1970s when nuclear energy was introduced, followed by the increasing importance of modern biofuels in the 1980s, and other renewable energy such as wind from about 2000. Historically, many of the Nordic countries relied on hydropower since about 1900, such as Norway, Sweden, and Iceland [2]. See also Figure 4. This helped to increase living standards, and power and modernise national economies.
For the Environmental Kuznets Curve, the analysis found the following:
The EKC, using energy use per capita as an indicator, has been observed for Denmark only. Iceland, Finland, and Norway have increasing energy use, while it levels off for Sweden at about 100,000 million US$ GDP. Fischer et al. (2018) argue that energy demand in the Nordic countries is increasing as a result of new investments in mining and other energy-intensive industries [45]. Improvements in energy reduction are thus still needed for Iceland, Finland, Norway, and Sweden in the future.
Using per capita CO2 emissions as an indicator, the inverted U-shaped EKC curve can be observed for Denmark, Sweden, Finland, and Iceland. Norway is the only Nordic country that does not show a decline in per capita CO2 emissions. A peak, followed by a decline, happened at around 100,000 million US$ GDP, followed by a steady increase in emissions afterwards in Norway. The situation is different when total CO2 emissions are analysed. Again, Denmark and Sweden show EKC-shaped emission trajectories, which see a sharp decline at about 100,000 million US$ GDP, while Finland and Norway do not follow the EKC patterns. Finland and Norway both show a dip at about 120,000–130,000 US$ GDP, followed by a steep increase. Iceland is slowly showing EKC patterns for total CO2 emissions, yet the peaking point seems to have only been reached recently, and it remains to be seen whether total CO2 emissions will continue to further decline or stabilise in the coming years and what this means for a long-term perspective.
For the future, this may mean the following:
First, other countries may learn from the experience of the Nordic countries, such as when a peak of per capita and total emissions might be achievable under certain conditions; for example, when certain development levels will be reached and when a higher share of low carbon energy will have been introduced. The current peaking point seems to be at approximately 100,000–150,000 US$ GDP for economies of a roughly similar size as Sweden, Denmark, and Finland.
Second, other countries can model their low carbon energy transitions on the basis of the experience of the Nordic countries. This obviously depends on the natural endowments of each country, the appropriateness of technologies in specific contexts and demographic factors (e.g., low population density for hydropower development to minimise resettlements). Yet, the Nordic countries offer opportunities for replication in terms of increasing the share of hydropower, biofuels, wind, and solar, as well as nuclear, if and when appropriate. The expansion of nuclear energy in Sweden clearly raises social concerns with regards to health and safety, yet it has substantially helped to lower emissions.
Third, lessons can be learned in terms of policy support, financial mechanisms, institutional arrangements, organizational change, behavioural change, and infrastructure provision. More research is needed in this field in the future to study transferable policy instruments and financial mechanisms for low carbon energy in general, as well as for specific technologies, such as district heating, for example.
Fourth, for the future, there is still room for improvement for the Nordic countries. Transportation and industries in particular need further low carbon energy transitions. Fossil fuel input is still rather high for industries, and the sector hence requires industrial transformations. For transportation, the majority of vehicles still depend on conventional combustion engines fuelled by oil products. Electric vehicle ownership is increasing in some Nordic countries, such as Sweden, and more charging stations are being made available. More policy and financial support is needed for low carbon energy transitions in the transport and industrial sector across the Nordic countries. More research in this field would also be insightful. There are also implications for the theory of dematerialisation, which is questionable but requires further research in the energy transitions context for the Nordic countries.
5. Conclusions
The Nordic countries of Denmark, Finland, Iceland, Norway, and Sweden are leaders in planning, implementing, and sustaining long-term low carbon energy transitions. This paper analysed low carbon energy transitions in the Nordic countries from 1960 to 2015 and assessed evidence from the Environmental Kuznets Curve (EKC). The paper finds that the EKC has been very clearly observed in Denmark and Sweden in terms of total CO2 emissions, a less clearly pronounced EKC has also been found for Iceland, but not for Norway and Finland. For per capita CO2 emissions, there is evidence for the EKC in Denmark, Finland, Iceland, and Sweden, but not for Norway. For energy use per capita, the EKC is only observed for Denmark. There are thus still improvements possible in the other Nordic countries with regards to reducing energy use per capita. This could be achieved, for example, by increasing energy efficiency and promoting other energy-saving measures. Norway in specific needs to implement more ambitious energy and climate mitigation measures as its emissions are still rising, both total and per capita CO2 emissions.
The decoupling of economic growth from carbon emissions has been observed, particularly for Sweden, Denmark, and Iceland. One major factor driving this dynamic is that all Nordic countries have high shares of low carbon energy. Iceland relies almost entirely on geothermal energy and hydropower for electricity generation and heating; Sweden has a high share of hydropower and nuclear energy; Denmark has a high share of wind energy; Finland has a varied energy mix that includes hydro, nuclear, and biofuels; while Norway depends almost completely on hydropower for electricity generation. Sweden’s per capita CO2 emissions are even lower than the world average [2]. Iceland has a massively growing energy consumption in recent years, yet per capita emissions have been declining and total emissions seem to follow the U-shaped EKC to some extent because of the heavy reliance on geothermal energy and hydropower. This paper also identified the approximate peaking points for the EKC and the time when low carbon energy transitions were achieved.
One remaining aspect to reflect upon, however, is that an economy-wide transition to low carbon energy may be hampered by a reliance on oil-based products for transportation, particularly for Norway as an oil-producing country. For the future, alternative strategies for transportation should be explored further to enable low carbon energy transitions in the transport sector, and thereby aim to reduce national and regional emissions even further.
Studying the Nordic countries and the dynamics of their energy transitions, including the policies, financial, and organisational settings and the political, societal, and technological drivers that enabled these transitions, can hold valuable information for other countries to learn from, especially countries that have similar natural endowments for hydropower, wind, and biofuels. Further research is needed both on historic energy transitions (e.g., hydropower) in these countries, as well as more recent low carbon energy transitions (geothermal, wind, biofuels). The expertise and experience of the Nordic countries, particularly Denmark, Iceland, and Sweden, can provide valuable lessons for national, regional, and global low carbon energy transitions. It can also provide an inspiration and indeed evidence that low carbon energy transitions are possible while maintaining economic growth and high levels of human wellbeing.
Author Contributions
Conceptualization, F.U.; Data curation, F.U.; Formal analysis, F.U.; Investigation, F.U.; Methodology, F.U.; Validation, J.N.; Visualization, F.U.; Writing—original draft, F.U.; Writing—review & editing, J.N.
Conflicts of Interest
The authors declare no conflict of interest.
References
- Sovacool, B. Contestation, contingency, and justice in the Nordic low-carbon energy transition. Energy Policy 2017, 102, 569–582. [Google Scholar] [CrossRef]
- Energy Statistics. Available online: www.iea.org/statistics/ (accessed on 7 August 2018).
- Graabak, I.; Jaehnert, S.; Korpås, M.; Mo, B. Norway as a Battery for the Future European Power System—Impacts on the Hydropower System. Energies 2017, 10, 2054. [Google Scholar] [CrossRef]
- Skea, J.; Nishioka, S. Policies and Practices for a Low-Carbon Society. Clim. Policy 2008, 8, 5–16. [Google Scholar] [CrossRef]
- Geels, F.W. Disruption and low-carbon system transformation: Progress and new challenges in socio-technical transitions research and the Multi-Level Perspective. Energy Res. Soc. Sci. 2018, 37, 224–231. [Google Scholar] [CrossRef]
- Geels, F.W.; Sovacool, B.K.; Schwanen, T.; Sorrell, S. The Socio-Technical Dynamics of Low-Carbon Transitions. Joule 2017, 1, 463–479. [Google Scholar] [CrossRef] [Green Version]
- Urry, J. A Low Carbon Economy and Society. Philos. Trans. R. Soc. A 2013, 371, 1–12. [Google Scholar] [CrossRef] [PubMed]
- Leggewie, C.; Messner, D. The low-carbon transformation—A social science perspective. J. Renew. Sustain. Energy 2013, 4. [Google Scholar] [CrossRef]
- Bridge, G.; Bouzarovski, S.; Bradshaw, M.; Eyred, N. Geographies of energy transition: Space, place and the low-carbon economy. Energy Policy 2013, 53, 331–340. [Google Scholar] [CrossRef] [Green Version]
- Delina, L. Accelerating Sustainable Energy Transition(s) in Developing Countries, 1st ed.; Routledge: London, UK, 2017. [Google Scholar]
- Urban, F. Low Carbon Transitions for Developing Countries, 1st ed.; Routledge: London, UK, 2014. [Google Scholar]
- Foxon, T. Energy and Economic Growth. Why We Need a New Pathway to Prosperity, 1st ed.; Routledge: London, UK, 2018. [Google Scholar]
- Foxon, T.; Kohler, J.; Oughton, C. Innovation for a Low Carbon Economy; Edward Elgar: Cheltenham, UK, 2008. [Google Scholar]
- Mulugetta, Y.; Urban, F. Deliberating on low carbon development. Energy Policy 2010, 38, 7546–7549. [Google Scholar] [CrossRef]
- Mundaca, L.; Markandya, A.; Nørgaard, J. Walking away from a low-carbon economy? Recent and historical trends using a regional decomposition analysis. Energy Policy 2013, 61, 1471–1480. [Google Scholar] [CrossRef] [Green Version]
- Nordensvard, J. The Social Challenges of Low Carbon Development; Routledge: London, UK, 2016. [Google Scholar]
- Araujo, K. Low Carbon Energy Transitions: Turning Points in National Policy and Innovation; Oxford University Press: Oxford, UK, 2017. [Google Scholar]
- Fouquet, R.; Pearson, P.J.G. Past and prospective energy transitions: Insights from history. Energy Policy 2012, 50, 1–7. [Google Scholar] [CrossRef]
- Bashmakov, I. Three laws of energy transitions. Energy Policy 2007, 35, 3583–3594. [Google Scholar] [CrossRef]
- Fouquet, R. Historical energy transitions: Speed, prices and system transformation. Energy Res. Soc. Sci. 2016, 22, 7–12. [Google Scholar] [CrossRef] [Green Version]
- Sovacool, B. How long will it take? Conceptualizing the temporal dynamics of energy transitions. Energy Res. Soc. Sci. 2016, 13, 202–215. [Google Scholar] [CrossRef]
- Solomon, B.D.; Krishna, K. The coming sustainable energy transition: History, strategies and outlook. Energy Policy 2011, 39, 7422–7431. [Google Scholar] [CrossRef]
- Grubler, A. Energy transitions research: Insights and cautionary tales. Energy Policy 2012, 50, 8–16. [Google Scholar] [CrossRef]
- Tyfield, D. Transportation and Low Carbon Development; Urban, F., Nordensvärd, J., Eds.; Routledge: London, UK, 2013. [Google Scholar]
- Kuznets, S. Economic Growth and Income Inequality. Am. Econ. Rev. 1955, 45, 1–28. [Google Scholar]
- Van Ruijven, B.; Urban, F.; Benders, R.M.J.; Moll, H.C.; Van der Sluijs, J.; De Vries, B.; Van Vuuren, D.P. Modeling energy and development: An evaluation of models and concepts. World Dev. 2008, 36, 2801–2821. [Google Scholar] [CrossRef]
- Goldemberg, J.; Lucon, O. Energy, Environment and Development, 2nd ed.; Routledge: Oxon, UK, 2009. [Google Scholar]
- Panayotou, T. Economic growth and the environment. Econ. Surv. Eur. 2003, 2, 45–72. [Google Scholar]
- Urban, F.; Nordensvärd, J. Low Carbon Development: Key Issues; Earthscan Routledge: Oxon, UK, 2013. [Google Scholar]
- Ockwell, D. Energy and economic growth: Grounding our understanding in physical reality. Energy Policy 2008, 36, 4600–4604. [Google Scholar] [CrossRef]
- Prosperity without Growth? The Transition to a Sustainable Economy. Available online: https://research-repository.st-andrews.ac.uk/bitstream/handle/10023/2163/sdc-2009-pwg.pdf?seq (accessed on 7 August 2018).
- Urban, F. Pro-poor low carbon development and the role of growth. Int. J. Green Econ. 2010, 4, 82–93. [Google Scholar] [CrossRef]
- Barrett, M.; Lowe, R.; Oreszczyn, T.; Steadman, P. How to support growth with less energy. Energy Policy 2008, 36, 4592–4599. [Google Scholar] [CrossRef] [Green Version]
- Dong, K.; Sun, R.; Hochman, G. Do natural gas and renewable energy consumption lead to less CO2 emission? Empirical evidence from a panel of BRICS countries. Energy 2017, 141, 1466–1478. [Google Scholar] [CrossRef]
- Olale, E.; Ochuodho, T.O.; Lantz, V.; El Armali, J. The environmental Kuznets curve model for greenhouse gas emissions in Canada. J. Clean. Prod. 2018, 184, 859–868. [Google Scholar] [CrossRef]
- Del Pablo-Romero, M.; Sánchez-Braza, A. EKC for the residential sector in the EU-28. Energy 2017, 125, 44–54. [Google Scholar]
- Xu, T. Investigating Environmental Kuznets Curve in China–Aggregation bias and policy implications. Energy Policy 2018, 114, 315–322. [Google Scholar] [CrossRef]
- Adu, D.T.; Denkyirah, E.K. Economic growth and environmental pollution in West Africa: Testing the Environmental Kuznets Curve hypothesis. J. Soc. Sci. 2017. [Google Scholar] [CrossRef]
- Zambrano-Monserrate, M.A.; Silva-Zambrano, C.A.; Davanos-Penafiel, J.L.; Zambrano-Montserrate, A.; Ruano, M.A. Testing environmental Kuznets curve hypothesis in Peru: The role of renewable electricity, petroleum and dry natural gas. Renew. Sustain. Energy Rev. 2018, 82, 4170–4178. [Google Scholar] [CrossRef]
- Stern, D.I. The rise and fall of the environmental Kuznets curve. World Dev. 2004, 32, 1419–1439. [Google Scholar] [CrossRef]
- The Environmental Kuznets Curve after 25 Years. Available online: https://ccep.crawford.anu.edu.au/files/uploads/ccep_crawford_anu_edu_au/2017-03/ccep1514.pdf (accessed on 7 August 2018).
- Gill, A.R.; Viswanathan, K.K.; Hassan, S. The Environmental Kuznets Curve (EKC) and the environmental problem of the day. Renew. Sustain. Energy Rev. 2018, 81, 1636–1642. [Google Scholar] [CrossRef]
- Climate Change 2013: The Physical Science Basis. Available online: https://www.ipcc.ch/pdf/assessment-report/ar5/wg1/WG1AR5_Frontmatter_FINAL.pdf (accessed on 7 August 2018).
- World Bank. Open Data. 2018. Available online: https://data.worldbank.org/ (accessed on 7 August 2018).
- Fischer, R.; Elfgren, E.; Toffolo, A. Energy Supply Potentials in the Northern Counties of Finland, Norway and Sweden towards Sustainable Nordic Electricity and Heating Sectors: A Review. Energies 2018, 11, 751. [Google Scholar] [CrossRef]
Figure 1.
Stylised example of the Environmental Kuznets Curve.

Figure 2.
CO2 emissions of the Nordic countries between 1960 and 2015. Data source: [44].
Figure 2.
CO2 emissions of the Nordic countries between 1960 and 2015. Data source: [44].

Figure 3.
Energy use, measured in kg oil equivalents per capita, of the Nordic countries between 1960 and 2015. Data source: [44].
Figure 3.
Energy use, measured in kg oil equivalents per capita, of the Nordic countries between 1960 and 2015. Data source: [44].

Figure 4.
Share of fossil fuels as percentage of total energy use, by the Nordic countries between 1960 and 2015. Data source: [44].
Figure 4.
Share of fossil fuels as percentage of total energy use, by the Nordic countries between 1960 and 2015. Data source: [44].

Figure 5.
Analysis of the EKC for Denmark. Data source: [44]. (a) Denmark EKC, total CO2 emissions; (b) Denmark EKC, CO2 emissions per capita; (c) Denmark EKC, energy use per capita.
Figure 5.
Analysis of the EKC for Denmark. Data source: [44]. (a) Denmark EKC, total CO2 emissions; (b) Denmark EKC, CO2 emissions per capita; (c) Denmark EKC, energy use per capita.

Figure 6.
Analysis of the EKC for Finland. Data source: [44]. (a) Finland EKC, total CO2 emissions; (b) Finland EKC, CO2 emissions per capita; (c) Finland EKC, energy use per capita.
Figure 6.
Analysis of the EKC for Finland. Data source: [44]. (a) Finland EKC, total CO2 emissions; (b) Finland EKC, CO2 emissions per capita; (c) Finland EKC, energy use per capita.

Figure 7.
Analysis of the EKC for Iceland. Data source: [44]. (a) Iceland EKC, total CO2 emissions; (b) Iceland EKC, CO2 emissions per capita; (c) Iceland EKC, energy use per capita.
Figure 7.
Analysis of the EKC for Iceland. Data source: [44]. (a) Iceland EKC, total CO2 emissions; (b) Iceland EKC, CO2 emissions per capita; (c) Iceland EKC, energy use per capita.

Figure 8.
Analysis of the EKC for Norway. Data source: [44]. (a) Norway EKC, total CO2 emissions; (b) Norway EKC, CO2 emissions per capita; (c) Norway EKC, energy use per capita.
Figure 8.
Analysis of the EKC for Norway. Data source: [44]. (a) Norway EKC, total CO2 emissions; (b) Norway EKC, CO2 emissions per capita; (c) Norway EKC, energy use per capita.

Figure 9.
Analysis of the EKC for Norway. Data source: [44]. (a) Sweden EKC, total CO2 emissions; (b) Sweden EKC, CO2 emissions per capita; (c) Sweden EKC, energy use per capita.
Figure 9.
Analysis of the EKC for Norway. Data source: [44]. (a) Sweden EKC, total CO2 emissions; (b) Sweden EKC, CO2 emissions per capita; (c) Sweden EKC, energy use per capita.

© 2018 by the authors. Licensee MDPI, Basel, Switzerland. This article is an open access article distributed under the terms and conditions of the Creative Commons Attribution (CC BY) license (http://creativecommons.org/licenses/by/4.0/).
Share and Cite
MDPI and ACS Style
Urban, F.; Nordensvärd, J. Low Carbon Energy Transitions in the Nordic Countries: Evidence from the Environmental Kuznets Curve. Energies 2018, 11, 2209. https://doi.org/10.3390/en11092209
AMA Style
Urban F, Nordensvärd J. Low Carbon Energy Transitions in the Nordic Countries: Evidence from the Environmental Kuznets Curve. Energies. 2018; 11(9):2209. https://doi.org/10.3390/en11092209
Chicago/Turabian StyleUrban, Frauke, and Johan Nordensvärd. 2018. "Low Carbon Energy Transitions in the Nordic Countries: Evidence from the Environmental Kuznets Curve" Energies 11, no. 9: 2209. https://doi.org/10.3390/en11092209
Note that from the first issue of 2016, this journal uses article numbers instead of page numbers. See further details here.