Regional Energy, CO2, and Economic and Air Quality Index Performances in China: A Meta-Frontier Approach

1
Business School, Sichuan University, Wangjiang Road, No. 29, Chengdu 610064, China
2
Department of Economics, Soochow University, No. 56, Section 1, Kueiyang Street, Chungcheng District, Taipei 10048, Taiwan
*
Author to whom correspondence should be addressed.
Energies 2018, 11(8), 2119; https://doi.org/10.3390/en11082119
Submission received: 7 June 2018
/
Revised: 6 August 2018
/
Accepted: 13 August 2018
/
Published: 14 August 2018
Abstract
:Rapid economic development has resulted in a significant increase in energy consumption and pollution such as carbon dioxide (CO2), particulate matter (PM2.5), particulate matter 10 (PM10), SO2, and NO2 emissions, which can cause cardiovascular and respiratory diseases. Therefore, to ensure a sustainable future, it is essential to improve economic efficiency and reduce emissions. Using a Meta-frontier Non-radial Directional Distance Function model, this study took energy consumption, the labor force, and fixed asset investments as the inputs, Gross domestic product (GDP) as the desirable output, and CO2 and the Air Quality Index (AQI) scores as the undesirable outputs to assess energy efficiency and air pollutant index efficiency scores in China from 2013–2016 and to identify the areas in which improvements was necessary. It was found that there was a large gap between the western and eastern cities in China. A comparison of the CO2 and AQI in 31 Chinese cities showed a significant difference in the CO2 emissions and AQI efficiency scores, with the lower scoring cities being mainly concentrated in China’s western region. It was therefore concluded that China needs to pay greater attention to the differences in the economic levels, stages of social development, and energy structures in the western cities when developing appropriately focused improvement plans.
1. Introduction
The increase in the use of fossil fuels since the Industrial Revolution has led to a rapid increase in the atmospheric concentrations of greenhouse gases such as CO2, and air pollution from fine particles such as PM2.5, sulphur dioxide (SO2), and nitrogen dioxide (NO2), all of which have had a negative impact on water resources, crops, natural ecosystems, and human health, and a consequent negative effect on medium- and long-term sustainable social and economic development [1].
Over the past 30 years, China’s reforms and opening up policies have been primarily aimed at economic development, which has resulted in an over-exploitation of the natural resources and a significant increase in environmental pollution and ecological damage. The associated increase in coal-fired energy consumption has caused increased and worsening air pollution and higher concentrations of greenhouse gases such as CO2. The International Energy Agency [2] estimated that China’s share of global CO2 emissions from 2002 to 2030 was going to increase from 14% to 19%, and the United States Energy Agency [3] estimated that China’s CO2 emissions would comprise 24.5% of the world’s total by 2030. The World Bank [4] claimed that by 2020, China’s air pollution would annually cause 600,000 early deaths and 20 million respiratory disease sufferers, and its water pollution would affect 190 million people and the deaths of 30,000 children from diarrhea.
China’s focus on industrialization and economic growth in the past two decades has also resulted in a significant increase in air pollutant emissions such as sulfur dioxide (SO2), nitrogen oxides (NOX), carbon monoxide (CO), non-methane volatile organic compounds (NMVOC), and black carbon (BC) [5,6]. The impact of these atmospheric pollutants on health and the environment has caused significant concern [7,8] as air pollution resulted in 1.2 million premature deaths in China in 2010, with a further 25 million people contracting severe respiratory illnesses [8].
Because of China’s severe city air pollution, high energy consumption, and environmental problems need to be urgently addressed to ensure the all-round development of China’s economy, improving energy efficiency and reducing air pollution and CO2 emissions have become critical issues.
In recent years, Chinese governments at all levels have begun focusing on air pollution and CO2 emissions reductions with some positive results [9]; however, severe air pollution and CO2 emissions levels remain a serious issue in many cities. Further, because of the global impact of climate change, it has become increasingly difficult to domestically control air pollution and CO2 levels.
Because of its size, China’s eastern and western regions have wide variations in their economic and social development in terms of resource endowments, industrial structures and geographical conditions, which means there are also significant regional disparities in air pollution controls. In general, the impact of existing policy measures has been effective in the short term, but in some cities, the medium to long-term results are not satisfactory. Further, most measures have failed to solve the fundamental causes of air pollution.
Energy efficiency analyses have tended to be based on conventional total factor analysis frameworks and have only considered ideal output such as economic output while ignoring unfavorable output such as environmental pollutants, meaning that the economic performance assessments and efficiency and productivity estimates were biased. More current productivity analysis frameworks [10,11,12], however, have included all energy, environmental, and ecological efficiency elements.
To analyze energy, the environment, and eco-efficiency or productivity, recent studies from both China and Europe have included GDP as the desirable output and CO2 emissions as the undesirable output and have used static analyses, dynamic analyses, or Meta-frontier DEA (Data Envelopment Analysis) methods to assess energy efficiency. Three main static analyses have been used to assess energy efficiency, including; Charnes, Cooper, Rhodes (CCR), Banker, Charnes, Cooper (BCC), and radial methods [13]; Slack-Based Measures method [14,15,16]; and direction distance function methods [17,18,19]. There are also three main dynamic energy efficiency analysis methods; Window analysis [20]; the Malmquist Productivity Index [21,22,23], and Dynamic SBM models [24]. In some cases, both dynamic and static methods have been used to compare energy [25]. For the Meta-Frontier Method, dynamic meta-frontiers [26], Meta-Frontier non-radial directional distance functions [12,27,28], and Bootstrapped DEA Methods [29,30] have been used to measure energy efficiency and obtain accurate energy efficiency estimates.
To assess environmental efficiency, non-radial DEA methods [31,32,33], and Directional Distance Functions [34,35] have been used; however, only a few studies [13,28] have examined ecological efficiency.
Sulfur dioxide (SO2) has been used as an environmental pollution measure in energy efficiency environmental evaluations in non-radial DEA models [36,37,38] and two stage methods [9,39,40]. In other studies, both SO2 and NO2 have been used as environmental pollution indicators [35,40,41]. However, only considering CO2 as the undesirable output and ignoring other air pollutants such as PM2.5, SO2, and NO2 can bias the energy, environmental, ecological efficiency and productivity analyses. Therefore, to analyze environmental energy efficiency, both CO2 and SO2 (or NO2) need to be considered as undesirable outputs. Maximum Entropy methods [42], non-radial DEA models with both CO2 and SO2 as undesirable outputs [20,43,44] and dynamic DEA methods [45] have all been used to explore environmental efficiency.
Air pollutants can have a significant impact on economic costs; for example, in 2010, the health impact of PM10 in Chinese cities was estimated at US 74 billion [46], which was equivalent to 1.3% of the GDP in that year. In 2013, the Chinese government developed an Air Pollution Control Action Plan, which highlighted air governance and economic development as an official government performance measure. As stated, only including CO2 as the undesirable output and ignoring other undesirable air pollutants such as PM2.5, SO2, and NO2 can lead to biased reports and poor policy advice. Another problem is that most DEA studies on urban efficiency have only been only at a national level, with few analyses on the efficiency in cities in different regions. Because China has large regional differences, different levels of economic development, and varying resource endowments, the same production technology standard cannot be used for all analyses, especially in the eastern and western regions. Therefore, it is necessary to compare and investigate urban efficiencies between regions to ensure more accurate policy recommendations.
The difference between this study and previous similar studies is that urban energy consumption, CO2 emissions, and atmospheric environmental efficiencies are investigated and the economic development level endowment differences between cities in the eastern and western regions of China considered. To do this, this study employed a meta-frontier non-radial directional distance function to analyze regional energy, CO2, the economy, and air quality index (AQI) efficiencies.
This study divided 31 Chinese cities into eastern and western regions and using data from 2013–2016 examined each city’s energy consumption, labor force, and fixed asset size as the input indicators, GDP as the desirable output, and CO2 and AQI as the undesirable outputs.
2. Materials and Methods
Data envelopment analysis (DEA), which is based on the Pareto Optimal solution concept, uses a linear programming method to evaluate the relative utility of Decision Making Units (DMUs), and is able to simultaneously measure the efficiency between multiple inputs and multiple outputs to determine a production efficiency frontier, calculate the DMU production position and the distance to the efficiency frontier, and assess the DMU efficiency value.
DEA was first proposed by Charnes et al. [47] as the CCR model, which was based on a constant return to scale hypothesis. Banker et al. [48] then relaxed the constant returns to scale hypothesis and developed a BCC model based on a variable return to scale assumption. The DEA method has been widely used for industrial efficiency analyses in the financial industry [49], the transportation industry [50], the service industry [51], and the manufacturing industry [52]. As environmental issues have become a greater public concern, applications have been developed [10,11] to measure energy and environmental efficiencies. However, many of these conventional research efficiency analyses have failed to include the undesirable outputs. To resolve the problems associated with the application of undesirable outputs in the DEA model, a radial directional output distance function was proposed [53,54] based on an extension of the output distance function concept in Shephard [55]. The advantage of the radial directional output distance function is that it allows the DMU to simultaneously adjust the factor inputs and output and therefore can be adjusted to increase the desired output and reduce the undesirable output.
However, these radial efficiency models have tended to ignore the variances in the variables, which can lead to estimation errors. To overcome these defects, Fare et al. [56] developed a non-radial directional distance function, which proved superior to other methods as it had more reasonable, more accurate estimation results. Consequently, non-radial directional distance functions have been applied to energy and environmental efficiency analyses [17,57,58,59].
2.1. Environmental Production Technology
Assume that N cities use three inputs; capital (K), labor (L), and energy consumption (E); to produce one desirable output; gross domestic production (Y); and two undesirable outputs; CO2 emissions (C), and the AQI (A) (please refer to the AQI calculations in Section 2.5 for detail). The production technology set (T) is defined below [60,61,62,63].
T = {(K, L, E, Y, C, A): (K, L, E) can produce (Y, C, A)}
The production technology follows standard production theory axioms [60]. Here, T is assumed to be a closed, bounded set with finite inputs that produces finite outputs. To model the joint-production technology, T is assumed to have weak disposability and null-jointness properties.
2.2. Non-Radial Directional Distance Functions
Suppose that there is an N-dimensional DMU set denoted ri where DMUo represents the DMU under evaluation and DMUo ∈ N. The inputs and outputs are defined as , with the inputs producing the desirable output Y and the undesirable output Z . Following [17,59,60], the non-radial directional distance function can be expressed as:
where, λn is an intensity variable, w = denotes a weight vector, g = denotes an explicit directional vector, and θ = denotes a scale vector.
2.3. Meta-Frontier Non-Radial Directional Distance Function
To investigate the technological gap between the eastern and western regions, this paper considers these different groups to be different regions. Two types of frontier technologies are also defined; a meta-frontier non-radial directional distance function and a group-frontier non-radial directional distance function. As proposed in [60,61,62,63] the technical efficiency (TEE) for the different groups can be compared using a meta-frontier model. Suppose there are technological heterogeneities between H groups. The N DMUs can be separated into H subgroups based on their production technologies; therefore, the number of DMUs in the -th group is , and . Each subgroup has own specific production technology, with the DMUs belonging to the same subgroups having a homogeneous technology level under the group frontier.
and are assumed to be the production technology set for the -th group under the group and meta-frontiers, with satisfying the over-arching requirement.
Following [63], the group-frontier non-radial directional distance function for group h is defined based on Equation (2) and the group-frontier (GFE) technical efficiency is determined by solving Equation (2).
Unlike the group-frontier technology, meta-frontier technologies are based on all observations between the groups. As in [17,56,57], the value for is determined after solving the following DEA model (Equation (3)). The technical efficiency of the meta-frontier (MFE) is also determined by solving Equation (3).
Technology Gap Ratio (TGR):
As the meta-frontier is an envelope curve for the group frontiers [62,63], is a sub-set of (); therefore, the technical efficiency of the meta-frontier (MFE) is less than the technical efficiency of the group frontier (GFE). This so-called technical gap ratio (TGR) is:
TGR = MFE/GFE
If TGR is equal to unity, the region is considered efficient for the group technology set production process (the meta-technology set); if the TGR is less than unity, the region is considered inefficient.
2.4. Urban Energy Environmental, CO2, AQI, and GDP Efficiencies
As in the total-factor energy efficiency index used in [64], there are four key features included in this present study: energy environmental efficiency, CO2 efficiency, AQI efficiency, and GDP efficiency. In this study, “i” represents the area and “t” represents time. The four efficiency models are defined in the following:
If the target energy input equals the actual input and the CO2 and AQI undesirable outputs equal the actual undesirable outputs, then the environmental energy, CO2, and AQI efficiencies equal 1, indicating overall efficiency. If the target energy input is less than the actual input and the CO2 and AQI undesirable outputs are less than the actual undesirable outputs, then the environmental energy, CO2, and AQI efficiencies are less than 1, indicating overall inefficiency.
If the target GDP desirable output is equal to the actual GDP desirable output, then the GDP efficiency equals 1, indicating overall efficiency. If the actual GDP desirable output is less than the target GDP desirable output, then the GDP efficiency is less than 1, indicating overall inefficiency.
2.5. Data and Variables
This study used 2013 to 2016 panel data for 31 of the most developed cities in eastern and western China. Data were collected from the Statistical Yearbook of China [65] and the Demographics and Employment Statistical Yearbooks of China [66] from all cities. Air pollutant data were collected from China’s Environmental and Protection Bureau reports [67]. The variables used in the analysis are listed in the following.
2.5.1. Input Variables
Labor input: Number of employees in each city at the end of each year: unit = 1000 persons.
Capital input: Capital stock in each city calculated from the fixed assets in each city: unit = 100 million CNY (Chinese Yuan).
Energy consumed: Calculated according to each city’s total energy consumption: unit = 100 million tonnes. The energy consumption data were taken from China’s Environmental and Protection Bureau reports from 2014 to 2017 [67]. The total energy consumption unit was 10,000 tonnes of standard coal. From the statistical yearbook [65] data from each city, the energy consumption per unit of GDP by region and the unit GDP in each city were used to calculate the total energy consumption in each city, and included coal, oil, natural gas, and the total consumption of primary electricity and other energy.
2.5.2. Output Variable
Desired output: The GDP in each city was the output: 100 million CNY. The GDP data in each provincial capital were derived from the GDP stated in each province’s statistical yearbook for the given period [65], which consisted of the gross output for the primary, secondary, and tertiary industries calculated at current prices: unit: 100 million CNY.
2.5.3. Undesirable Output Variables
(A) Air quality index (AQI) data were based on the impact of the ambient air quality standards and various pollutants on human health, the ecology, and the environment, with the concentration of several routinely monitored air pollutants being simplified into a single conceptual index. In accordance with China’s environmental protection standards [67], the AQI represents the short-term air quality conditions and trends in each city. The main pollutants involved in the air quality assessment were fine particles, inhalable particles, sulfur dioxide, nitrogen dioxide, ozone, and carbon monoxide.
Based on China’s environmental protection standards [67], the AQI calculation and evaluation processes were as follows:
- Step 1:
- To compare the concentration limits of the various pollutants; the fine particulate matter (PM2.5), inhalable particulate matter (PM10), sulfur dioxide (SO2), nitrogen dioxide (NO2), ozone (O3), carbon monoxide (CO2) and other measured concentration values (including PM2.5, PM10 by 24 h average concentration) were calculated separately for the Air Quality Index (Individual Air Quality Index, referred to as IAQI).
- Step 2:
- To select the maximum value from the IAQI for each pollutant and determine its AQI; if the AQI was greater than 50, the largest IAQI pollutant was identified as the primary pollutant.
- Step 3:
- To establish the AQI grading standard air quality level, type, color, health impact and recommended actions were determined.
In short, the AQI was considered the maximum value for the Individual air quality index (IAQI) for each pollutant. When the AQI was greater than 50, the corresponding pollutant was the primary pollutant, with pollutants with an IAQI greater than 100 being considered excessive.
(B) The CO2 emissions data for each city were estimated from the energy consumption. CO2 emissions have been recognized as the primary cause of changing global temperatures and rising sea levels. In the past 100 years, global temperatures have risen by 0.6 °C, and it is estimated that by the middle of the 21st century, global temperatures will have increased by 1.5–4.5 °C and sea levels will have risen by 14 cm. As sea levels rise, the Amazon rainforest is expected to disappear, and the Antarctic and Arctic Ocean ice caps are expected to melt. Air generally contains about 0.03% of CO2; however, due to human activities (such as the burning of fossil fuels), the CO2 content has risen dramatically since the beginning of the industrial revolution, which has resulted in global warming, melting glaciers, and rising sea levels. Due to the above characteristics, CO2, unlike other air pollutants, is used as the sole carbon emissions measure and the main measurement for global solutions to climate change.
This study divided the 31 sample cities into two regions: western region cities (18 in total); Chengdu, Changsha, Chongqing, Guiyang, Hefei, Huhehot, Kunming, Lanzhou, Lhasa, Nanchang, Nanning, Taiyuan, Wuhan, Urumqi, Xian, Xining, Yinchuan, and Zhengzhou; and eastern region cities (13 in total); Beijing, Changchun, Fuzhou, Guangzhou, Harbin, Haikou, Hangzhou, Jinan, Nanjing, Shanghai, Shenyang, Shijiazhuang, and Tianjin (see Figure 1).
3. Results and Discussion
3.1. Input-Output Index Statistical Analyses
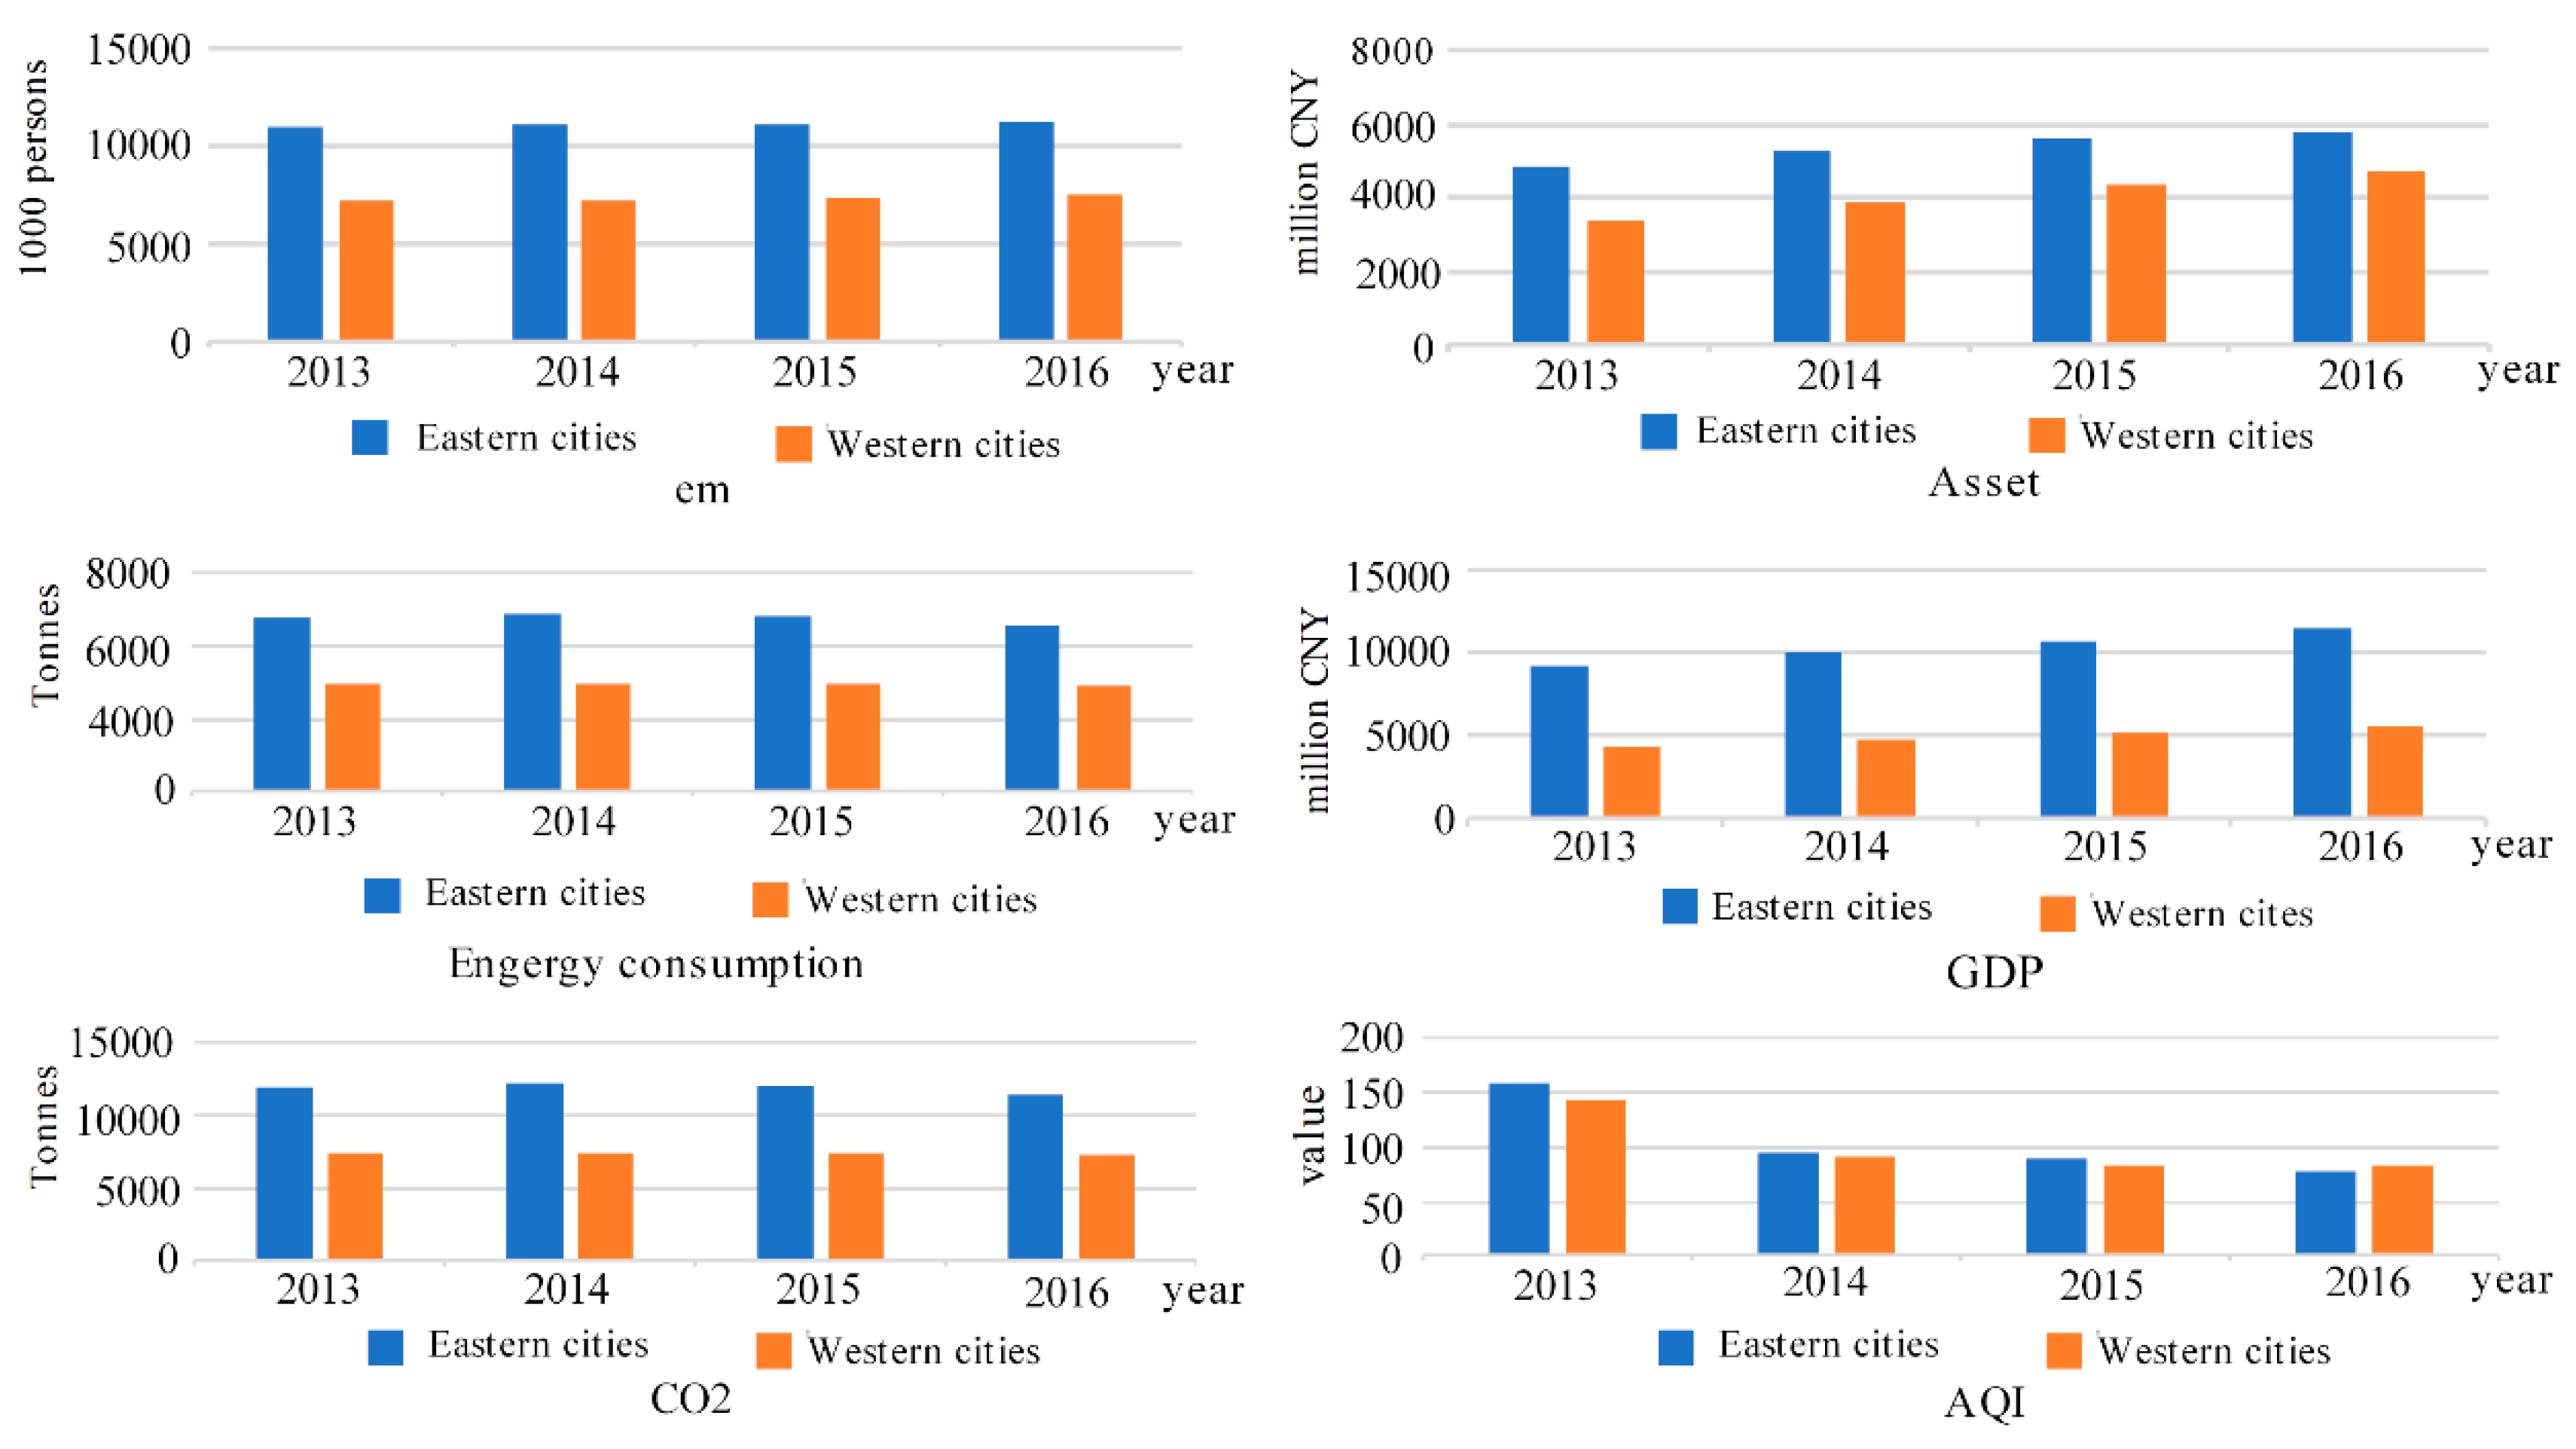
Figure 2 compares the input and output indicators for the western and eastern Chinese cities. The employment, fixed asset, energy consumption, GDP, AQI and CO2 indicators clearly show that the average value for employment, fixed asset investment, and energy consumption in the eastern cities was greater than the average value in the western cities, and that the GDP, CO2 and AQI values were lower.
The employment growth rate in the eastern cities in 2013 was slightly higher than in the western cities, but from 2014, while the rate in the eastern cities began to slowly decline, the rate in the western cities began to grow, reflecting the continued development.
Both the eastern and western cities had a downward trend in energy consumption, with the eastern cities’ energy consumption declining faster than in the western cities. While fixed assets investment in both the western and eastern cities had declining growth rates, the decline was greater in the eastern than the western cities. The average GDP growth rate however, was similar in both the eastern and western regions; overall, however, the average GDP growth rate in the eastern cities was lower, reflecting their more developed status.
The average CO2 emissions in the eastern cities dropped by about 0.3% from 2013 to 2014, and from 2014 to 2015, the average CO2 emissions in the eastern cities declined more rapidly than those in the western cities. The average CO2 emissions in the western cities were rising slowly from 2013 to 2014, but began to decline from 2014 to 2016, and from 2015 to 2016, the average CO2 emissions in the western cities had a greater decline than in the eastern cities.
While in the eastern cities and western cities the average AQI was similar, it was initially slightly higher in the eastern cities; however, in 2016, the average AQI was higher in the western cities. The average AQI began to decline in the eastern cities from 2013 to 2014 and from 2014 to 2015, the average AQI decline in the western cities was slightly higher than in the eastern cities, but from 2015 to 2016, the decline in the eastern cities was greater than in the western cities, indicating that there was a greater average AQI improvement in the eastern cities than in the western cities.
3.2. Overall Efficiency Score Ranking from 2013–2016
Table 1 shows the efficiency scores and rankings for each city from 2013 to 2016. The total efficiency score for five cities was 1 for four consecutive years, indicating that these cities were efficient. The cities with poor efficiency scores and declining rankings were; Kunming, which ranked 6th in efficiency in 2013, but dropped to 19th between 2014 to 2016; Nanchang ranked 9th in 2013 with a score of 0.92 but dropped to 16th with a score of 0.87 in 2016; Zhengzhou, which was ranked 8th from 2013 to 2015, was ranked 18th in 2016 as the efficiency declined sharply to 0.85. The other cities with declining scores and rankings were Harbin, Hefei, Nanjing, Wuhan, Urumqi, Xian, and Xining. The cities that improved their efficiency scores and rankings were; Jinan, which had the highest efficiency score increase from 0.78 in 2013 to 1 in 2016; Shenyang, where the efficiency score rose from 0.82 in 2013 to 1 in 2016; Hangzhou, which had an efficiency score of 0.89 in 2013 and was ranked 17th, raised its score to 0.93 and a rank of 11th; and Guiyang, which had an efficiency score of 0.67 in 2013 and was ranked 30th, improved to 0.79 in 2016 and was ranked 24th.
A Wilcoxon signed rank was applied to further test the differences between the eastern and western region efficiencies. The p-values were compared with the confidence levels α, which were set at 0.01 and 0.05 to assess the distinctions between the average efficiency in the two regional groups. Table 2 shows the detailed test results.
At a significance level of 5%, the eastern region efficiencies were significantly different from the western region efficiencies from 2014–2016; however, there were less differences in 2013.
3.3. Efficiency Scores and Rankings for Energy Consumption, GDP, CO2, and AQI from 2013 to 2016.
Table 3 lists the energy consumption and GDP efficiency scores for each city, from which it can be seen that there were large CO2 and AQI efficiency score differences between 2013 and 2016. While some cities had obviously lower CO2 efficiency scores and higher AQI efficiency scores, the AQI efficiency scores in most cities rose over time. For example, the cities with an AQI efficiency of 1 were Beijing, Guangzhou, Haikou, Nanning, and Shanghai, with Lhasa being close to 1. The cities with AQI efficiency scores below 0.4 were Changsha, Hangzhou, Tianjin, Wuhan, Urumqi, and Zhengzhou, indicating that air pollution improvements were necessary.
As can be seen from Table 3, the CO2 efficiency scores in the different cities differed considerably. Beijing, Guangzhou, Haikou, Nanning, and Shanghai had CO2 emissions efficiencies of 1 and Lhasa at 0.993 was very close to 1 in 2013 and 1 in 2016. The CO2 emissions efficiency scores in the other cities varied greatly, clearly showing that different efficiency improvements were needed. Changsha, Lanzhou, Taiyuan, Xining, and Yinchuan had CO2 emissions efficiency scores below 0.2, and in Taiyuan in particular, the CO2 efficiency score was under 0.2 in the whole examined period. The CO2 efficiency scores in Changsha and Yinchuan declined over time, indicating that greater improvement efforts were needed. Fuzhou, Guiyang, Hangzhou, Huhehot, Kunming, Nanjing, Shenyang, Tianjin, Wuhan, and Xining had CO2 efficiency scores between 0.2 and 0.4, and Chengdu, Changchun, Chongqing, Harbin, Nanchang, and Xian had efficiency scores of around 0.8. The AQI efficiency score and the CO2 efficiency scores also varied widely. Except for Beijing, Guangzhou, Nanning, and Shenyang, which had AQI efficiency scores of 1 (Figure 2), in the other cities the differences between these two efficiency indicators were relatively large. Haikou’s AQI efficiency score was 0.89 in 2013 and 1 from 2014 to 2016. Changchun, Changsha, Hangzhou, Hefei, Jinan, Nanjing, Tianjin, Wuhan, Urumqi, and Zhengzhou Cities had AQI efficiency scores below 0.2 from 2013 to 2016, and Changsha, Wuhan, Zhengzhou, Tianjin, and Urumqi had efficiency scores at or below 0.2. Therefore, large AQI efficiency improvements are needed in these cities as the effect of the governance measures was not obvious.
The efficiencies in Changchun, Hefei, Huhehot, Jinan, Shijiazhuang, and Xian changed significantly over time. By 2016, the AQI efficiency scores had risen above 0.6 to around 0.8, indicating that in 2016, AQI governance in these cities was achieving positive results. Chengdu, Chongqing, Guiyang, Lanzhou, and Xining had efficiency scores between 0.6–0.8.
There were wide variations in the CO2 and AQI efficiency scores between and within the different cities. For example, there was a large difference between the CO2 and AQI efficiency scores in Zhengzhou because of poor AQI governance and control and while there were small CO2 emissions efficiency improvements up to 2016, after this time, the CO2 efficiency began to decline. In Yinchuan, the AQI scores were mostly between 0.6 and 0.8, but there was also poor control of the CO2 emissions. Lanzhou’s AQI efficiency score was also noticeably higher than its CO2 efficiency score, indicating that governance should be focused on CO2 emissions. A similar situation was observed in Kunming, Guiyang, Fuzhou, and Taiyuan. However, even though Taiyuan’s AQI efficiency score was higher than its CO2 efficiency score, it was still low and therefore focused improvements are needed in both areas. This was also true for Changsha, Hangzhou, Huhehot, Jinan, Nanjing, Shenyang, Shijiazhuang, Wuhan, Tianjin, and Urumqi.
As can be seen from Table 3, there were large differences in the energy consumption and GDP efficiency scores between the cities. Overall, effective energy consumption and economic growth were observed in Beijing, Guangzhou, Lhasa, Nanning, and Shanghai, all of which had efficiency scores of 1. Overall, the GDP in most other cities had an upward trend; however, the GDP efficiency scores dropped in 2016 in Chengdu, Changchun, Fuzhou, Guiyang, Harbin, Hefei, Nanchang, Shijiazhuang, Zhengzhou, and Xian.
Compared to the GDP efficiency scores, the energy consumption scores were lower and the gap between the cities greater. Changchun, Harbin, Hefei, Nanchang, and Zhengzhou had energy consumption efficiencies between 0.8 and 1, but Lanzhou, Taiyuan, Shijiazhuang, Xining, and Yinchuan had energy consumption efficiencies below 0.4. Guiyang, Lanzhou, Shijiazhuang, Taiyuan, Xining, and Yinchuan all needed to improve their energy consumption, GDP, and CO2 emissions efficiencies.
3.4. Comparison of Meta-Frontier and Group Frontiers
Table 4 illustrates the gaps in the meta-frontier and group frontier rankings from 2013 to 2016. No gap between the meta-frontier rankings and the group frontier rankings were found for Beijing, Guangzhou, Lhasa, Nanning, Shanghai, and some other cities. Chengdu, Chongqing, Guiyang, Lanzhou, Taiyuan, Urumqi, Xian, and Xining, all of which are in the western region, were nine of the ten cities with the largest group frontier and meta-frontier rankings.
Table 4 shows that in their own regions, cities were efficient. For example, Chongqing, Chengdu, Urumqi, and Wuhan were all ranked 1st in group efficiency; however, compared with the other cities in the country, there was a large gap. Other western cities also had large differences between the group frontier rankings and the meta-frontier rankings. For example, Huhehot and Zhengzhou rank 1st regionally, but 20th and 12th in comparison with the eastern cities, clearly indicating the gap that exists between western and eastern Chinese cities and the greater need for efficiency improvements in the west.
The gap between each city’s efficiency group frontier ranking and meta frontier ranking changed significantly each year. The difference between Chengdu’s efficiency ranking and the national ranking in 2013 was 29, in 2014 was 28, in 2015 was 30 and in 2016 was 31, which indicated that the gap between Chengdu’s efficiency ranking and the meta frontier ranking was widening in 2015 and 2016. Therefore, even though the improvements in the city’s efficiency were relatively good in comparison with other cities in the western region, there were still significant improvements needed to be in line with the eastern cities.
In most cities the improvement gap narrowed over time. For example, Fuzhou, moved from 8th in 2013 to 1st, Harbin increased 7 ranks, Haikou rose 12 ranks from 22nd to 10th, Jinan jumped from 16th to 1st, Shenyang went from 11th to 1st, and Wuhan rose from 25th to 19th.
However, Kunming, Zhengzhou, Xian, Nanchang, Hefei and some other cities. most of which were in the western region, saw a rise in their efficiency gap. For example, Kunming’s gap widened the most from 7th in 2013 to 24th in 2016 and Zhengzhou widened from 12th in 2013 to 22nd in 2016. The regional rankings also indicated that some cities such as Fuzhou had a greater rank gap than their efficiency ranking.
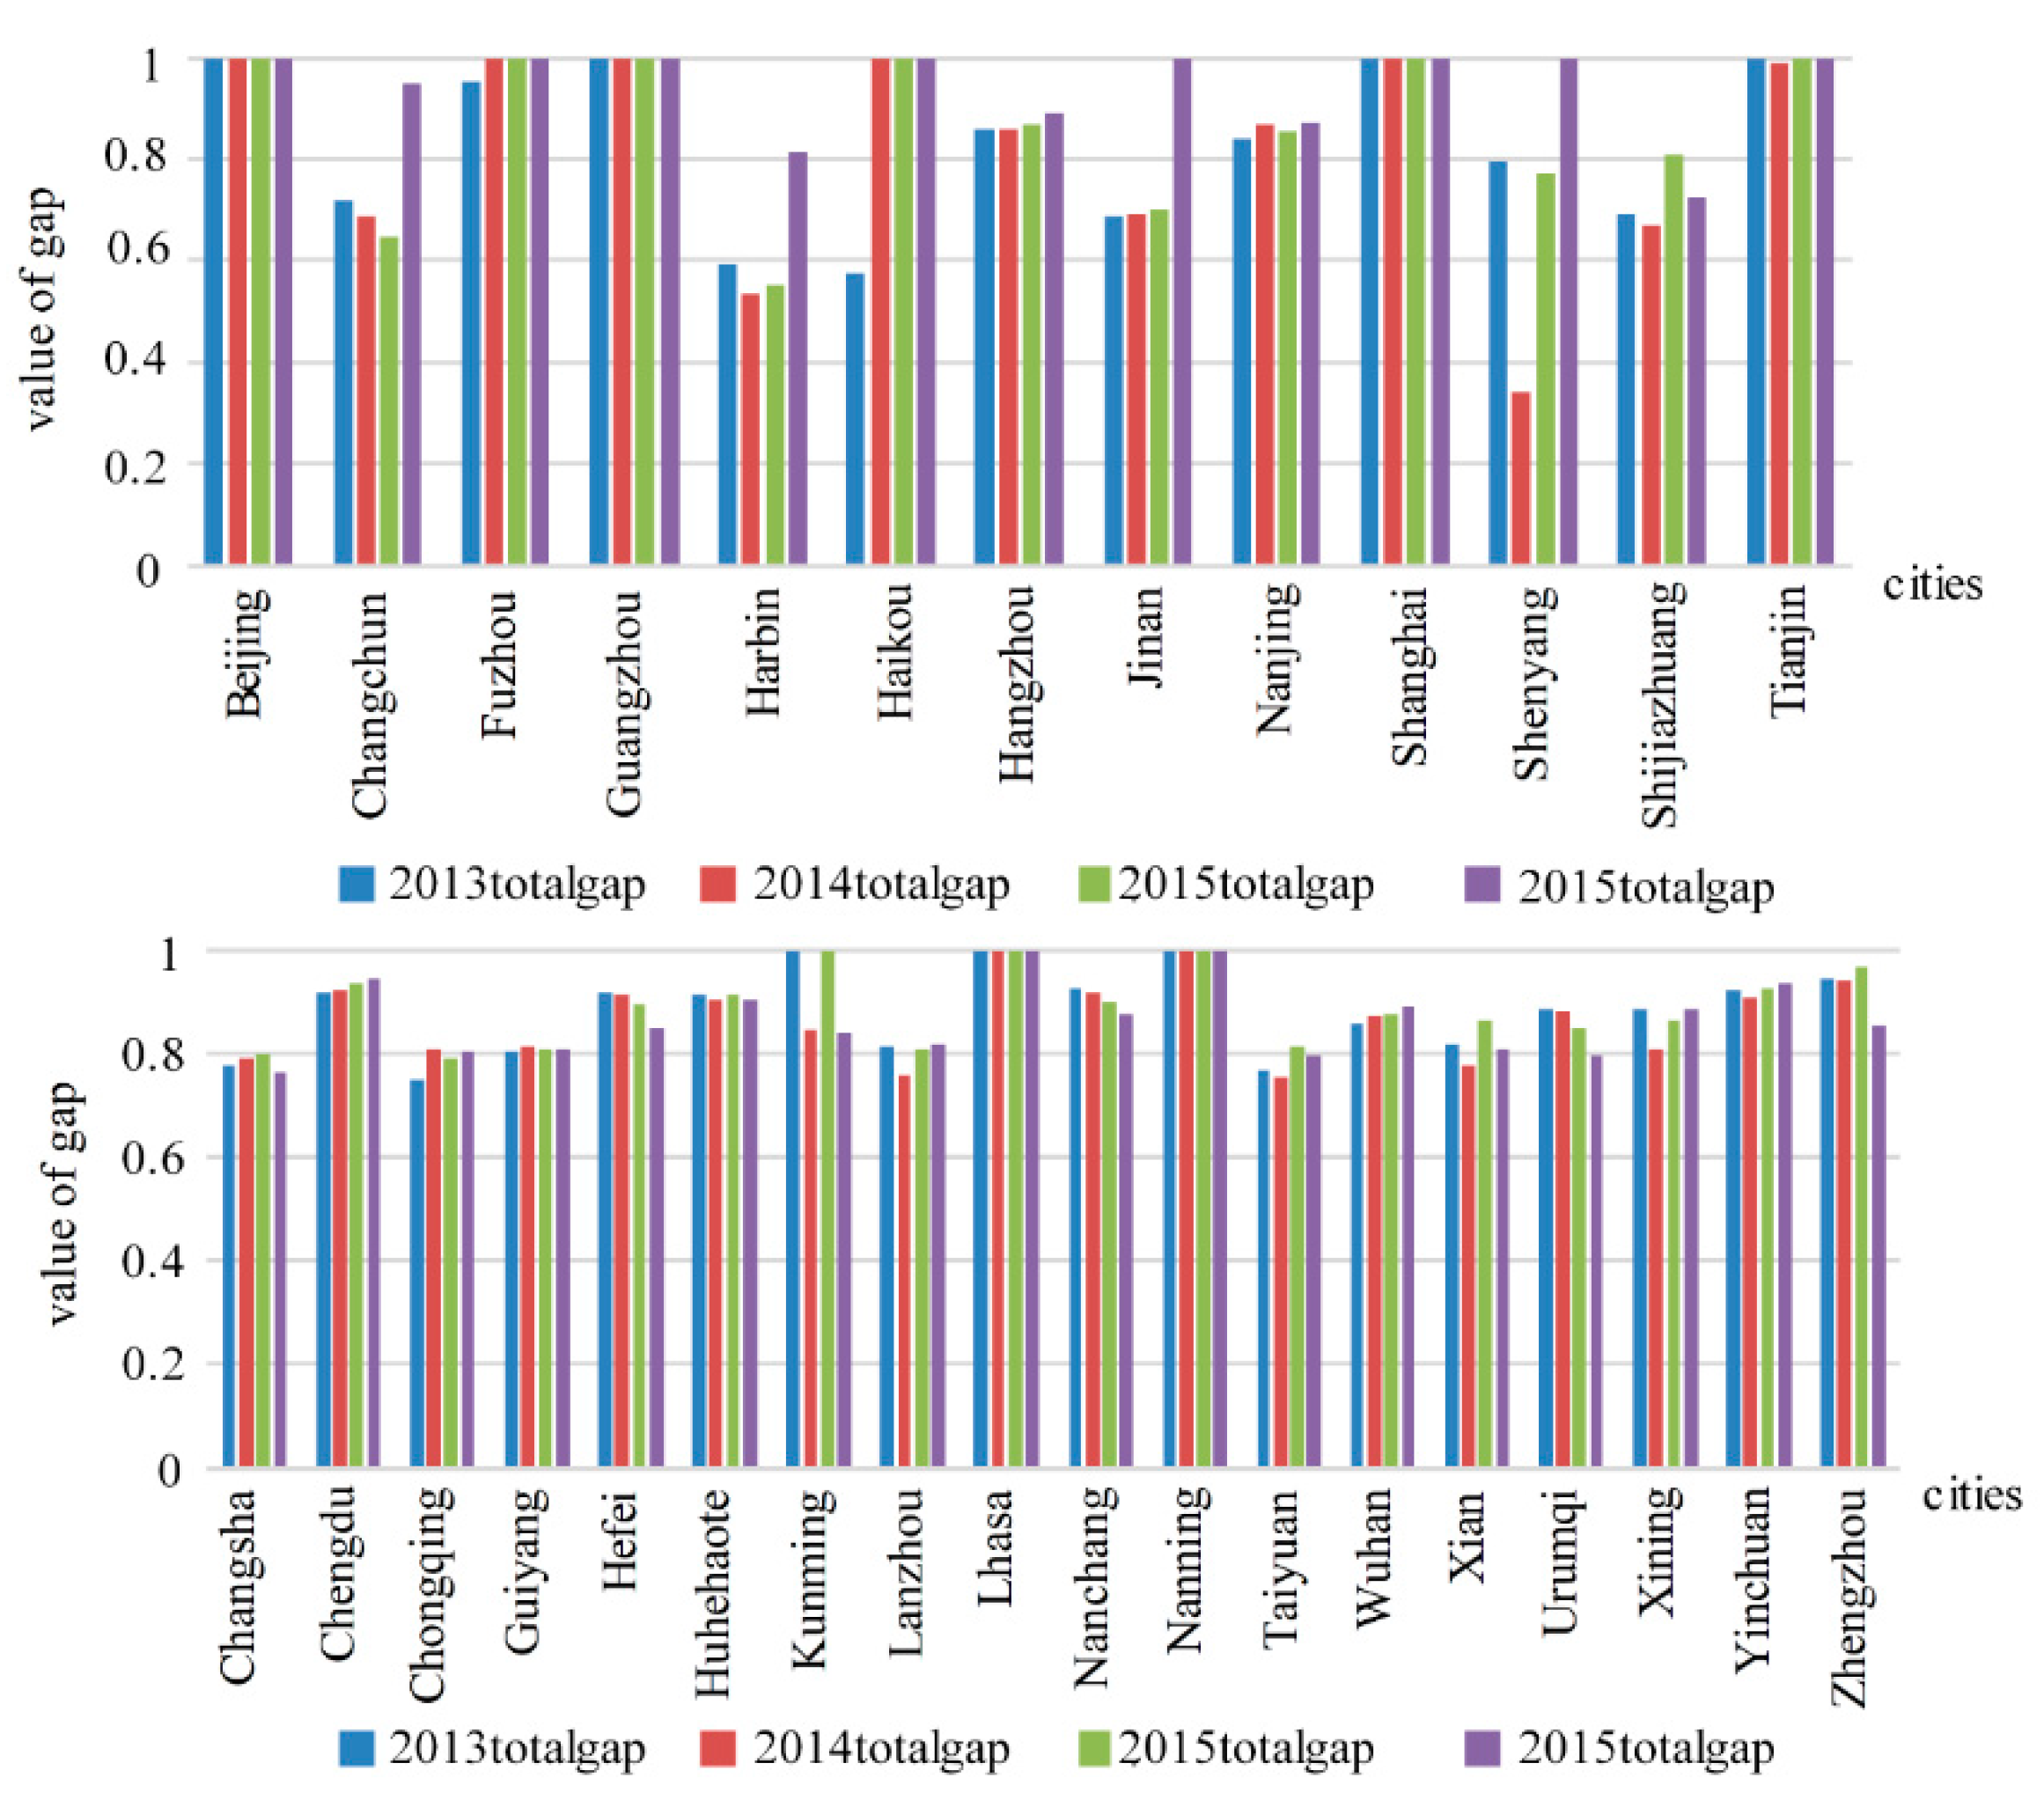
In Figure 3, it can be seen that the efficiency gap in some cities in the eastern region and especially in the economically developed capital cities in the coastal areas was 0, while there were still relatively large gaps in the few underdeveloped cities in the east. The efficiency of the provincial capital cities in the western region was generally lower than in the eastern cities, and there was a relatively continuous gap in the overall efficiency.
From Figure 4, an obvious efficiency gap between the eastern and western regions can be seen. The average gap for the eastern cities was less than in the western cities, and over time, this gap continued to widen. In 2016, while the efficiency in the eastern cities was increasing, the efficiency in the western cities was declining, further widening the gap between the two regions.
A Wilcoxon signed rank Test was applied to further test the differences between the technological gap in the eastern and western regions. Table 5 gives the detailed test results. At a 5% significance level, from 2013–2016, the technological gap in the eastern region was significantly better than the technological gap in the western region.
3.5. Comparative Gaps between the CO2 and AQI Efficiencies
Table 6 shows the differences in the gap rankings between the CO2 and AQI efficiencies compared to the total efficiency in China. In most cities, there was a distinct gap found between the individual CO2-only efficiency and the AQI-only efficiency; however, there was only a narrow efficiency gap between them. While in some cities, the efficiency gaps were expanding over time, in others, they were narrowing.
In 2013, there was little difference between the CO2-only and AQI-only efficiency gaps in Haikou, which ranked 22nd and 23rd. In 2014, the CO2-only efficiency ranking rose to 7th and in 2016 rose to 10th; however, the AQI-only efficiency gap ranking dropped to 29th in 2015 and then to 28th in 2016, which indicated that while Haikou was better than the other cities in terms of air pollution, its CO2 emissions were more serious. Therefore, as one of the few cities with good air quality in China, Haikou should pay more attention to their CO2 emissions.
While the large differences in the efficiency gaps in 2013 between the cities were affected by the CO2 emissions and the AQI, the differences in influence expanded over time. In Nanchang, in 2014, the efficiency gap that excluded CO2 ranked 17th and the efficiency gap that excluded AQI ranked 10th, in 2015, the efficiency gap that excluded CO2 ranked 20th and the efficiency gap that excluded AQI ranked 14th, and in 2016, the performance worsened, with the efficiency gap that excluded CO2 ranking 21st and the efficiency gap that excluded AQI ranking 18th. This indicated that compared with the other cities, Nanchang’s CO2 emissions and air pollution were continuing to deteriorate.
Most efficiency gap rankings rose over time such as in Shenyang, Wuhan, Chongqing, and Changsha; however, in other cities such as Zhengzhou and Xian, the efficiency gap rankings dropped, indicating that the air pollution and CO2 emissions were more serious than in the other cities, indicating that serious attention needs to be paid to strengthening governance. In Zhengzhou in 2013 the efficiency gap for both CO2 and AQI ranked 12th and 13th, but in 2016, dropped to 20th. Overall, the total efficiency gap rankings in Nanchang, Nanjing, Haikou, Xian, Hefei, and Chengdu all dropped and there were large differences in the efficiency gaps between air pollution and CO2.
4. Conclusions and Policy Recommendations
4.1. Conclusions
This study divided 31 cities in China into eastern and western regions to analyze and assess the 2013–2016 energy consumption, GDP, CO2 and AQI efficiency scores, and determine the needed efficiency improvements. The empirical results were as follows.
The cities with low efficiency scores for both AQI and CO2 were Changsha, Hangzhou, Huhehot, Jinan, Nanjing, Shenyang, Shijiazhuang, Tianjin, Wuhan, Urumqi, and Xian. The cities with AQI efficiency scores of 1 were Beijing, Guangzhou, Haikou, Nanning, and Shanghai. The cities with CO2 efficiency scores of 1 were Beijing, Guangzhou, Haikou, Nanning, and Shanghai.
The calculation results for the meta-frontier method indicated that there was remained a large gap between the western and eastern cities. There were only small efficiency differences between the western cities, with many having efficiency scores of 1, which indicated that policies were being effective. However, nine of the ten cities with the largest gaps were located in the west and all had relatively high efficiency values. Compared with the other cities, the greatest gaps were in urban efficiency, where additional improvements are needed.
The efficiency scores between the different cities were not only different but also exhibited varying trends over time. The inter-regional comparison found that the differences between the western cities and the eastern cities were relatively small; however, when comparing the cities with the whole country, the differences between the eastern cities and the western cities were found to be relatively large. In some cities with large efficiency gaps, the gap had expanded over time, which tended to indicate that the efficiency gap was continuing to widen between the western and eastern cities.
4.2. Policy Recommendations
Based on the above results, the central government needs to delegate additional authority to local governments so that individual cities are able to formulate strategic approaches and targets in line with their specific efficiency indicators. Due to the large economic growth and social development differences between the eastern and western cities, the above findings also confirmed that there was a large and widening energy consumption and AQI and CO2 efficiency score gap between the eastern and western cities, with the lower CO2 and AQI efficiency scores mainly concentrated in the western region. Therefore, China needs to pay more attention to the differing economic levels, social development stages, industrial structures, energy structures, and technological development in the western cities and adopt systematic solutions based on local meteorological and climatic conditions, economic and social development, and population quality.
Cities that need to significantly alleviate their CO2 emissions could refer to international green low-carbon development trends. As the Chinese government has highlighted low-carbon development as a major strategy for economic and social development and a sustainable ecology, effective measures must be implemented to control greenhouse gas emissions.
China also needs to speed up its domestic science and technological innovation by offering research and development incentives, giving full play to the market allocation of resources, having both central and local governments take leading roles, strengthening the synergetic control of CO2 and air pollutant emissions, encouraging low carbon leadership, promoting energy structural reform and industrial upgrading, and initiating supply-side structural reforms and consumption-side transformations. China can also assist the coordinated development of the regions by participating in global climate governance, making additional contributions to sustainable economic and social development, and safeguarding global ecological security.
The 13th Five-Year Plan set a higher goal for CO2 emissions reductions in China. By 2020, the target for CO2 emissions per unit of GDP is planned to be 18% lower than in 2015, and total CO2 emissions are expected to be effectively controlled. Efforts to control hydro-fluorocarbons, methane, nitrous oxide, per-fluorocarbon, sulfur hexafluoride, and other non-CO2 greenhouse gas are to be further enhanced and carbon sink capacities expanded.
China is striving to hit a first peak in CO2 emissions efficiency for some heavy and chemical industries by around 2020. The transformation to low-carbon energy systems, industrial systems, and consumer sectors is expected to yield positive results. A national carbon trading market has already started operations, and laws, regulations and a standards system for climate change issues have been established. Systems for statistical accounting, evaluation, and accountability are now complete, low-carbon pilot project demonstrations are increasing, the synergy between carbon and carbon reductions has been further strengthened, and the public’s low-carbon awareness has significantly improved. To achieve these goals, China needs to make positive energy and industrial restructuring, urbanization, and technological innovation moves.
For pollution prevention and control, some cities with low AQI efficiencies managed to achieve significant efficiency improvements in 2016, which is the result of the government’s determination in recent years to fight and control air pollution and to continuously improve the quality of the ecological environment. While the various governance measures taken are related, the air pollution sources are different from the CO2 emissions sources. Therefore, the measures that need to be taken and the air pollution treatments are also different from those applied to CO2 emissions.
We recommend that China pay more attention to governance in the following areas:
First, as the sources of atmospheric pollution are more complex and have regional differences, diagnoses of the atmospheric pollution causes would assist in its governance. Therefore, China should increase research investment in to the causes of the air pollution in different cities and regions and implement solutions through appropriate and focused governance measures.
Second, different geographical locations, meteorological conditions, industrial systems, economic development levels, population levels, and education levels in Chinese cities all influence atmospheric pollution governance. Therefore, power should be decentralized so that individual cities can determine their own city-specific or regional-specific governance measures to target air pollution prevention and control.
Third, as energy structure not only affects carbon emissions but also air pollution prevention, to help control CO2 emissions and pollution, China must proactively adopt measures that assist in new energy development and application.
Fourth, in the short term, a better scientific use of traditional fossil energy is also an effective measure. As new energy cannot immediately replace traditional fossil energy, new and more effective technologies need to be implemented to increase the efficient, clean use of fossil energy. The re-use of fossil energy emissions could also raise the usage efficiency of traditional fossil energy and positively affect the AQI efficiency. Further, China can also continue to build effective public transport services to reduce the use of private cars and could produce motor vehicle emissions purification equipment to further reduce motor vehicle emissions.
Finally, China can strengthen the monitoring and supervision of illegal air pollution emissions, adhere to present legislation and law enforcement, and control unregulated emissions through the promulgation of new laws and regulations.
Author Contributions
Conceptualization, Y.L. and Y.-H.C.; Methodology, Y.L.; Software, Y.-H.C.; Validation, Y.L., Y.-H.C. and L.C.L.; Formal Analysis, Y.L.; Investigation, Y.-H.C.; Resources, L.C.L.; Data Curation, Y.L.; Writing-Original Draft Preparation, Y.L.; Writing-Review & Editing, Y.L.; Visualization, L.C.L.; Supervision, Y.-H.C.; Project Administration, Y.L.; Funding Acquisition, Y.L.
Funding
This study was supported by the National Natural Science Foundation of China (No. 71773082); was supported by Sichuan University grants (No. 2018hhs-42).
Conflicts of Interest
The authors declare no conflict of interest.
References
- Lvovsky, K.; Hughes, G.; Maddison, D.; Ostro, B.; Pearce, D. Environmental Costs of Fossil Fuels: A Rapid Assessment Method with Application to Six Cities; The World Bank Environment Department, Pollution Management Series: Washington, DC, USA, 2000; p. 78. [Google Scholar]
- World Energy Statistics. Role of the International Energy Agency. 2017. Available online: https://doi.org/10.1111/j.1467-9701.1985.tb00423.x (accessed on 4 April 2018).
- Annual Energy Outlook. USA Energy Information Administration—EIA. 2017. Available online: https://doi.org/10.1787/weo-2017-9-en (accessed on 6 March 2018).
- Sustainable Development Goals (SDGs). World Bank. 2017. Available online: https://doi.org/10.1596/978-1-4648-1080-0 (accessed on 8 March 2018).
- Zhang, Q.; Streets, D.G.; Carmichael, G.R.; He, K.B.; Huo, H.; Kannari, A.; Klimont, Z.; Park, I.S.; Reddy, S.; Fu, J.S.; et al. Asian emissions in 2006 for the NASA INTEX-B mission. Atmos. Chem. Phys. 2009, 9, 5131–5153. [Google Scholar] [CrossRef] [Green Version]
- Lin, J.; Nielsen, C.P.; Zhao, Y.; Lei, Y.; Liu, Y.; McElroy, M.B. Recent changes in particulate air pollution over China observed from space and the ground: Effectiveness of emission control. Environ. Sci. Technol. 2010, 44, 7771–7776. [Google Scholar] [CrossRef] [PubMed]
- Bell, M.L.; Dominici, F.; Ebisu, K.; Zeger, S.L.; Samet, J.M. Spatial and temporal variation in PM2.5 chemical composition in the United States for health effects studies. Environ. Health Perspect. 2007, 115, 989–995. [Google Scholar] [CrossRef] [PubMed]
- Yang, G.; Wang, Y.; Zeng, Y.; Gao, G.F.; Liang, X.; Zhou, M.; Wan, X.; Yu, S.; Jiang, Y.; Naghavi, M. Rapid health transition in China, 1990–2010: Findings from the Global Burden of Disease Study 2010. Lancet 2013, 381, 1987–2015. [Google Scholar] [CrossRef]
- Wu, J.; Lv, L.; Sun, J. A comprehensive analysis of China’s regional energy saving and emission reduction efficiency: From production and treatment perspectives. Energy Policy 2015, 84, 166–176. [Google Scholar] [CrossRef]
- Hailu, A.; Veeman, T. Non-parametric productivity analysis with undesirable outputs: An application to Canadian pulp and paper industry. Am. J. Agric. Econ. 2001, 83, 605–616. [Google Scholar] [CrossRef]
- Dyckhoff, H.; Allen, K. Measuring ecological efficiency with data envelopment analysis (DEA). Eur. J. Oper. Res. 2001, 132, 312–325. [Google Scholar] [CrossRef]
- Li, K.; Lin, B. Metafroniter energy efficiency with CO2 emissions and its convergence analysis for China. Energy Econ. 2015, 48, 230–241. [Google Scholar] [CrossRef]
- Li, L.B.; Hu, J.L. Ecological total-factor energy efficiency of regions in China. Energy Policy 2012, 46, 216–224. [Google Scholar] [CrossRef]
- Choi, Y.; Zhang, N.; Zhou, P. Efficiency and abatement costs of energy-related CO2 emissions in China: A slacks-based efficiency measure. Appl. Energy 2012, 98, 198–208. [Google Scholar] [CrossRef]
- Bian, Y.W.; He, P.; Xu, H. Estimation of potential energy saving and carbon dioxide emission reduction in China based on an extended non-radial DEA approach. Energy Policy 2013, 63, 962–971. [Google Scholar] [CrossRef]
- Apergis, N.; Aye, G.C.; Barros, C.P.; Gupta, R.; Wanke, P. Energy efficiency of selected OECD countries: A slacks based model with undesirable outputs. Energy Econ. 2015, 51, 45–53. [Google Scholar] [CrossRef] [Green Version]
- Zhang, N.; Zhou, P.; Choi, Y. Energy efficiency, CO2 emission performance and technology gaps in fossil fuel electricity generation in Korea: A meta-frontier non-radial directional distance function analysis. Energy Policy 2013, 56, 653–662. [Google Scholar] [CrossRef]
- Zhou, G.; Chung, W.; Zhang, X. A study of carbon dioxide emissions performance of China’s transport sector. Energy 2013, 50, 302–314. [Google Scholar] [CrossRef]
- Zhou, G.; Chung, W.; Zhang, Y. Measuring energy efficiency performance of China’s transport sector: A data envelopment analysis approach. Expert Syst. Appl. 2014, 41, 709–722. [Google Scholar] [CrossRef]
- Wang, K.; Wei, Y.M.; Zhang, X. A comparative analysis of China’s regional energy and emission performance: Which is the better way to deal with undesirable outputs? Energy Policy 2012, 46, 574–584. [Google Scholar] [CrossRef]
- Lin, B.; Fei, R. Regional differences of CO2 emissions performance in China’s agricultural sector: A Malmquist index approach. Eur. J. Agron. 2015, 70, 33–40. [Google Scholar] [CrossRef]
- Fan, M.; Shao, S.; Yang, L. Combining global Malmquist–Luenberger index and generalized method of moments to investigate industrial total factor CO2 emission performance: A case of Shanghai (China). Energy Policy 2015, 79, 189–201. [Google Scholar] [CrossRef]
- Emrouznejad, A.; Yang, G.L. CO2 emissions reduction of Chinese light manufacturing industries: A novel RAM-based global Malmquist–Luenberger productivity index. Energy Policy 2016, 96, 397–410. [Google Scholar] [CrossRef]
- Guo, X.Y.; Lu, C.C.; Lee, J.H.; Chiu, Y.H. Applying the dynamic DEA model to evaluate the energy efficiency of OECD countries and China Energy. Energy 2017, 134, 392–399. [Google Scholar] [CrossRef]
- Wu, F.; Fan, L.W.; Zhou, P. Industrial energy efficiency with CO2 emissions in China: A nonparametric analysis. Energy Policy 2012, 49, 164–172. [Google Scholar] [CrossRef]
- Zhang, N.; Wei, X. Dynamic total factor carbon emissions performance changes in the Chinese transportation industry. Appl. Energy 2015, 146, 409–420. [Google Scholar] [CrossRef]
- Yao, X.; Zhou, H.; Zhang, A. Regional energy efficiency, carbon emission performance and technology gaps in China: A meta-frontier non-radial directional distance function analysis. Energy Policy 2015, 84, 142–154. [Google Scholar] [CrossRef]
- Yang, L.; Wang, K.L. Regional differences of environmental efficiency of China’s energy utilization and environmental regulation cost based on provincial panel data and DEA method. Math. Comput. Model. 2013, 58, 1074–1083. [Google Scholar] [CrossRef]
- Duan, N.; Guo, J.P.; Xie, B.C. Is there a difference between the energy and CO2 emission performance for China’s thermal power industry? A bootstrapped directional distance function approach. Appl. Energy 2015, 162, 1552–1563. [Google Scholar] [CrossRef]
- Zhang, N.; Zhou, P.; Kung, C.C. Total-factor carbon emission performance of the Chinese transportation industry: A bootstrapped non-radial Malmquist index analysis. Renew. Sustain. Energy Rev. 2015, 41, 584–593. [Google Scholar] [CrossRef]
- Mekaroonreung, M.; Johnson, A.L. Estimating the shadow prices of SO2 and NOx for U.S. coal power plants: A convex nonparametric least squares approach. Energy Econ. 2012, 34, 723–732. [Google Scholar] [CrossRef]
- Chang, Y.T.; Zhang, N.; Danao, D. Environmental efficiency analysis of transportation system in China: A non-radial DEA approach. Energy Policy 2013, 58, 277–283. [Google Scholar] [CrossRef]
- Song, X.; Hao, Y.; Zhu, X. Analysis of the environmental efficiency of the Chinese transportation sector using an undesirable output slacks-based measure data envelopment analysis model. Sustainability 2015, 7, 9187–9206. [Google Scholar] [CrossRef]
- Bi, G.B.; Song, W.; Zhou, P. Does environmental regulation affect energy efficiency in China’s thermal power generation? Empirical evidence from a slacks-based DEA model. Energy Policy 2014, 66, 537–546. [Google Scholar] [CrossRef]
- Wang, Z.; Feng, C. A performance evaluation of the energy, environmental, and economic efficiency and productivity in China: An application of global data envelopment analysis. Appl. Energy 2015, 147, 617–626. [Google Scholar] [CrossRef]
- Vardanyan, M.; Noh, D. Approximating pollution abatement costs via alternative specifications of a multi-output production technology: A case of the US electric utility industry. J. Environ. Manag. 2006, 80, 177–190. [Google Scholar] [CrossRef] [PubMed]
- Rao, X.; Wu, J.; Zhang, Z. Energy efficiency and energy saving potential in China: An analysis based on slacks-based measure model. Comput. Ind. Eng. 2012, 63, 578–584. [Google Scholar] [CrossRef]
- Wang, Q.; Zhao, Z.; Shen, N.; Liu, T. Have Chinese cities achieved the win–win between environmental protection and economic development? From the perspective of environmental efficiency. Ecol. Indic. 2015, 51, 151–158. [Google Scholar] [CrossRef]
- Bian, Y.; Liang, N.; Xu, H. Efficiency evaluation of Chinese regional industrial systems with undesirable factors using a two-stage slacks-based measure approach. J. Clean. Prod. 2015, 87, 348–356. [Google Scholar] [CrossRef]
- Long, X.; Oh, K.; Cheng, G. Are stronger environmental regulations effective in practice? The case of China’s accession to the WTO. J. Clean. Prod. 2013, 39, 161–167. [Google Scholar] [CrossRef]
- Matsushita, K.; Yamane, F. Pollution from the electric power sector in Japan and efficient pollution reduction. Energy Econ. 2012, 34, 1124–1130. [Google Scholar] [CrossRef]
- Rezek, J.P.; Campbell, R.C. Cost estimates for multiple pollutants: A maximum entropy approach. Energy Econ. 2007, 29, 503–519. [Google Scholar] [CrossRef]
- Zhang, N.; Choi, Y. Environmental Energy Efficiency of China’s Regional Economies: A non-oriented slacks-based measure analysis. Soc. Sci. J. 2013, 50, 225–234. [Google Scholar] [CrossRef]
- Wang, K.; Wei, Y.M. China’s regional industrial energy efficiency and carbon emissions abatement costs. Appl. Energy 2014, 130, 617–631. [Google Scholar] [CrossRef]
- Qin, Q.; Li, X.; Li, L.; Zhen, W.; Wei, Y.M. Air Emission perspective on energy efficiency: A empirical analysis of China’s coastal area. Appl. Energy 2017, 185, 604–614. [Google Scholar] [CrossRef]
- Yu, F.; Ma, G.; Zhang, Y.; Cao, D.; Gao, F.; Wang, J. Several issues about health impact assessment of China’s air pollution. Nat. Med. J. China. 2013, 93, 2695–2698. [Google Scholar] [CrossRef]
- Charnes, A.; Cooper, W.; Rhodes, E. Measuring the Efficiency of Decision-Making Units. Eur. J. Oper. Res. 1978, 2, 429–444. [Google Scholar] [CrossRef]
- Banker, R.D.; Charnes, R.F.; Cooper, W.W. Some Models for Estimating Technical and Scale Inefficiencies in Data Envelopment Analysis. Manag. Sci. 1984, 30, 1078–1092. [Google Scholar] [CrossRef]
- Fukuyama, H.; Matousek, R. Modelling bank performance: A network DEA approach. Eur. J. Oper. Res. 2017, 2, 712–732. [Google Scholar] [CrossRef]
- Chang, Y.T.; Park, H.S.; Jeong, J.; Lee, B.W. Valuating Economic and Environmental Efficiency of Global Airlines: A SBM-DEA Approach. Transp. Res. D Transp. Environ. 2014, 27, 46–50. [Google Scholar] [CrossRef]
- Huang, C.W.; Ho, F.N.; Chiu, Y.H. Measurement of Tourist Hotels’ Productive Efficiency, Occupancy, And Catering Service Effectiveness Using A Modified Two-Stage DEA Model In Taiwan. Omega 2014, 48, 49–59. [Google Scholar] [CrossRef]
- Li, L.-B.; Liu, B.L.; Liu, W.L.; Chiu, Y.H. Efficiency Evaluation of the Regional High-Tech Industry in China: A New Framework Based on Meta-frontier Dynamic DEA Analysis. Socio-Econ. Plan. Sci. 2017, 60, 24–33. [Google Scholar] [CrossRef]
- Luenberger, D.G. Benefit functions and duality. J. Math. Econ. 1992, 21, 461–481. [Google Scholar] [CrossRef] [Green Version]
- Chung, Y.H.; Färe, R.; Grosskopf, S. Productivity and undesirable outputs: A directional distance function approach. J. Environ. Manag. 1997, 51, 229–240. [Google Scholar] [CrossRef]
- Shephard, R.W. Theory of Cost and Production Functions; Princeton University Press: Princeton, NJ, NSA, 1970. [Google Scholar] [CrossRef]
- Fare, R.; Grossopf, S. Directional distance functions and slacks-based measures of efficiency. Eur. J. Oper. Res. 2010, 200, 320–322. [Google Scholar] [CrossRef]
- Zhou, P.; Ang, B.W.; Wang, H. Energy and CO2 emission performance in electricity generation: A non-radial directional distance function approach. Eur. J. Oper. Res. 2012, 221, 625–635. [Google Scholar] [CrossRef]
- Chiu, C.R.; Liou, J.L.; Wu, P.I.; Fang, C.L. Decomposition of the environmental inefficiency of the meta-frontier with undesirable output. Energy Econ. 2012, 34, 1392–1399. [Google Scholar] [CrossRef]
- Barros, C.P.; Managi, S.; Matousek, R. The technical efficiency of the Japanese banks: Non-radial directional performance measurement with undesirable output. Omega 2012, 40, 1–8. [Google Scholar] [CrossRef]
- Färe, R.; Grosskopf, S.; Pasurka, C.A. Environmental production functions and environmental directional distance functions. Energy 2007, 32, 1055–1066. [Google Scholar] [CrossRef]
- Battese, G.E.; Rao, D.S.P. Technology gap, efficiency and a stochastic metafrontier function. Int. J. Bus. Econ. 2002, 1, 87–93. [Google Scholar]
- Battese, G.E.; Rao, D.S.P.; O’Donnell, C.J. Metafrontier Production Function for Estimation of Technical Efficiencies and Technology Gaps for Firms Operating under Different Technologies. J. Prod. Anal. 2004, 21, 91–103. [Google Scholar] [CrossRef]
- O’Donnell, C.J.; Rao, D.S.P.; Battese, G.E. Metafrontier frameworks for the study of firm-level efficiencies and technology ratios. Empir. Econ. 2008, 34, 231–255. [Google Scholar] [CrossRef]
- Hu, J.L.; Wang, S.C. Total-factor energy efficiency of regions in China. Energy Policy 2006, 34, 3206–3217. [Google Scholar] [CrossRef]
- National Bureau of Statistics of China. China Statistical Yearbook. 2017. Available online: http://www.stats.gov.cn/ (accessed on 8 April 2018).
- China Statistical Yearbooks Database. Demographics and the Employment Statistical Yearbook of China, and the Statistical Yearbooks of All Cities. China Academic Journals Electronic Publishing House. 2017. Available online: http://www.stats.gov.cn/ (accessed on 8 April 2018).
- China’s Environmental and Protection Bureau Reports. Ministry of Ecology and Environment of the People’s Republic of China. 2017. Available online: http://www.mep.gov.cn/ (accessed on 26 March 2018).
Figure 1.
The thirty-one sample cities in the two regions, separated by those included in the Western analyses (red) and the Eastern analyses (green).
Figure 1.
The thirty-one sample cities in the two regions, separated by those included in the Western analyses (red) and the Eastern analyses (green).
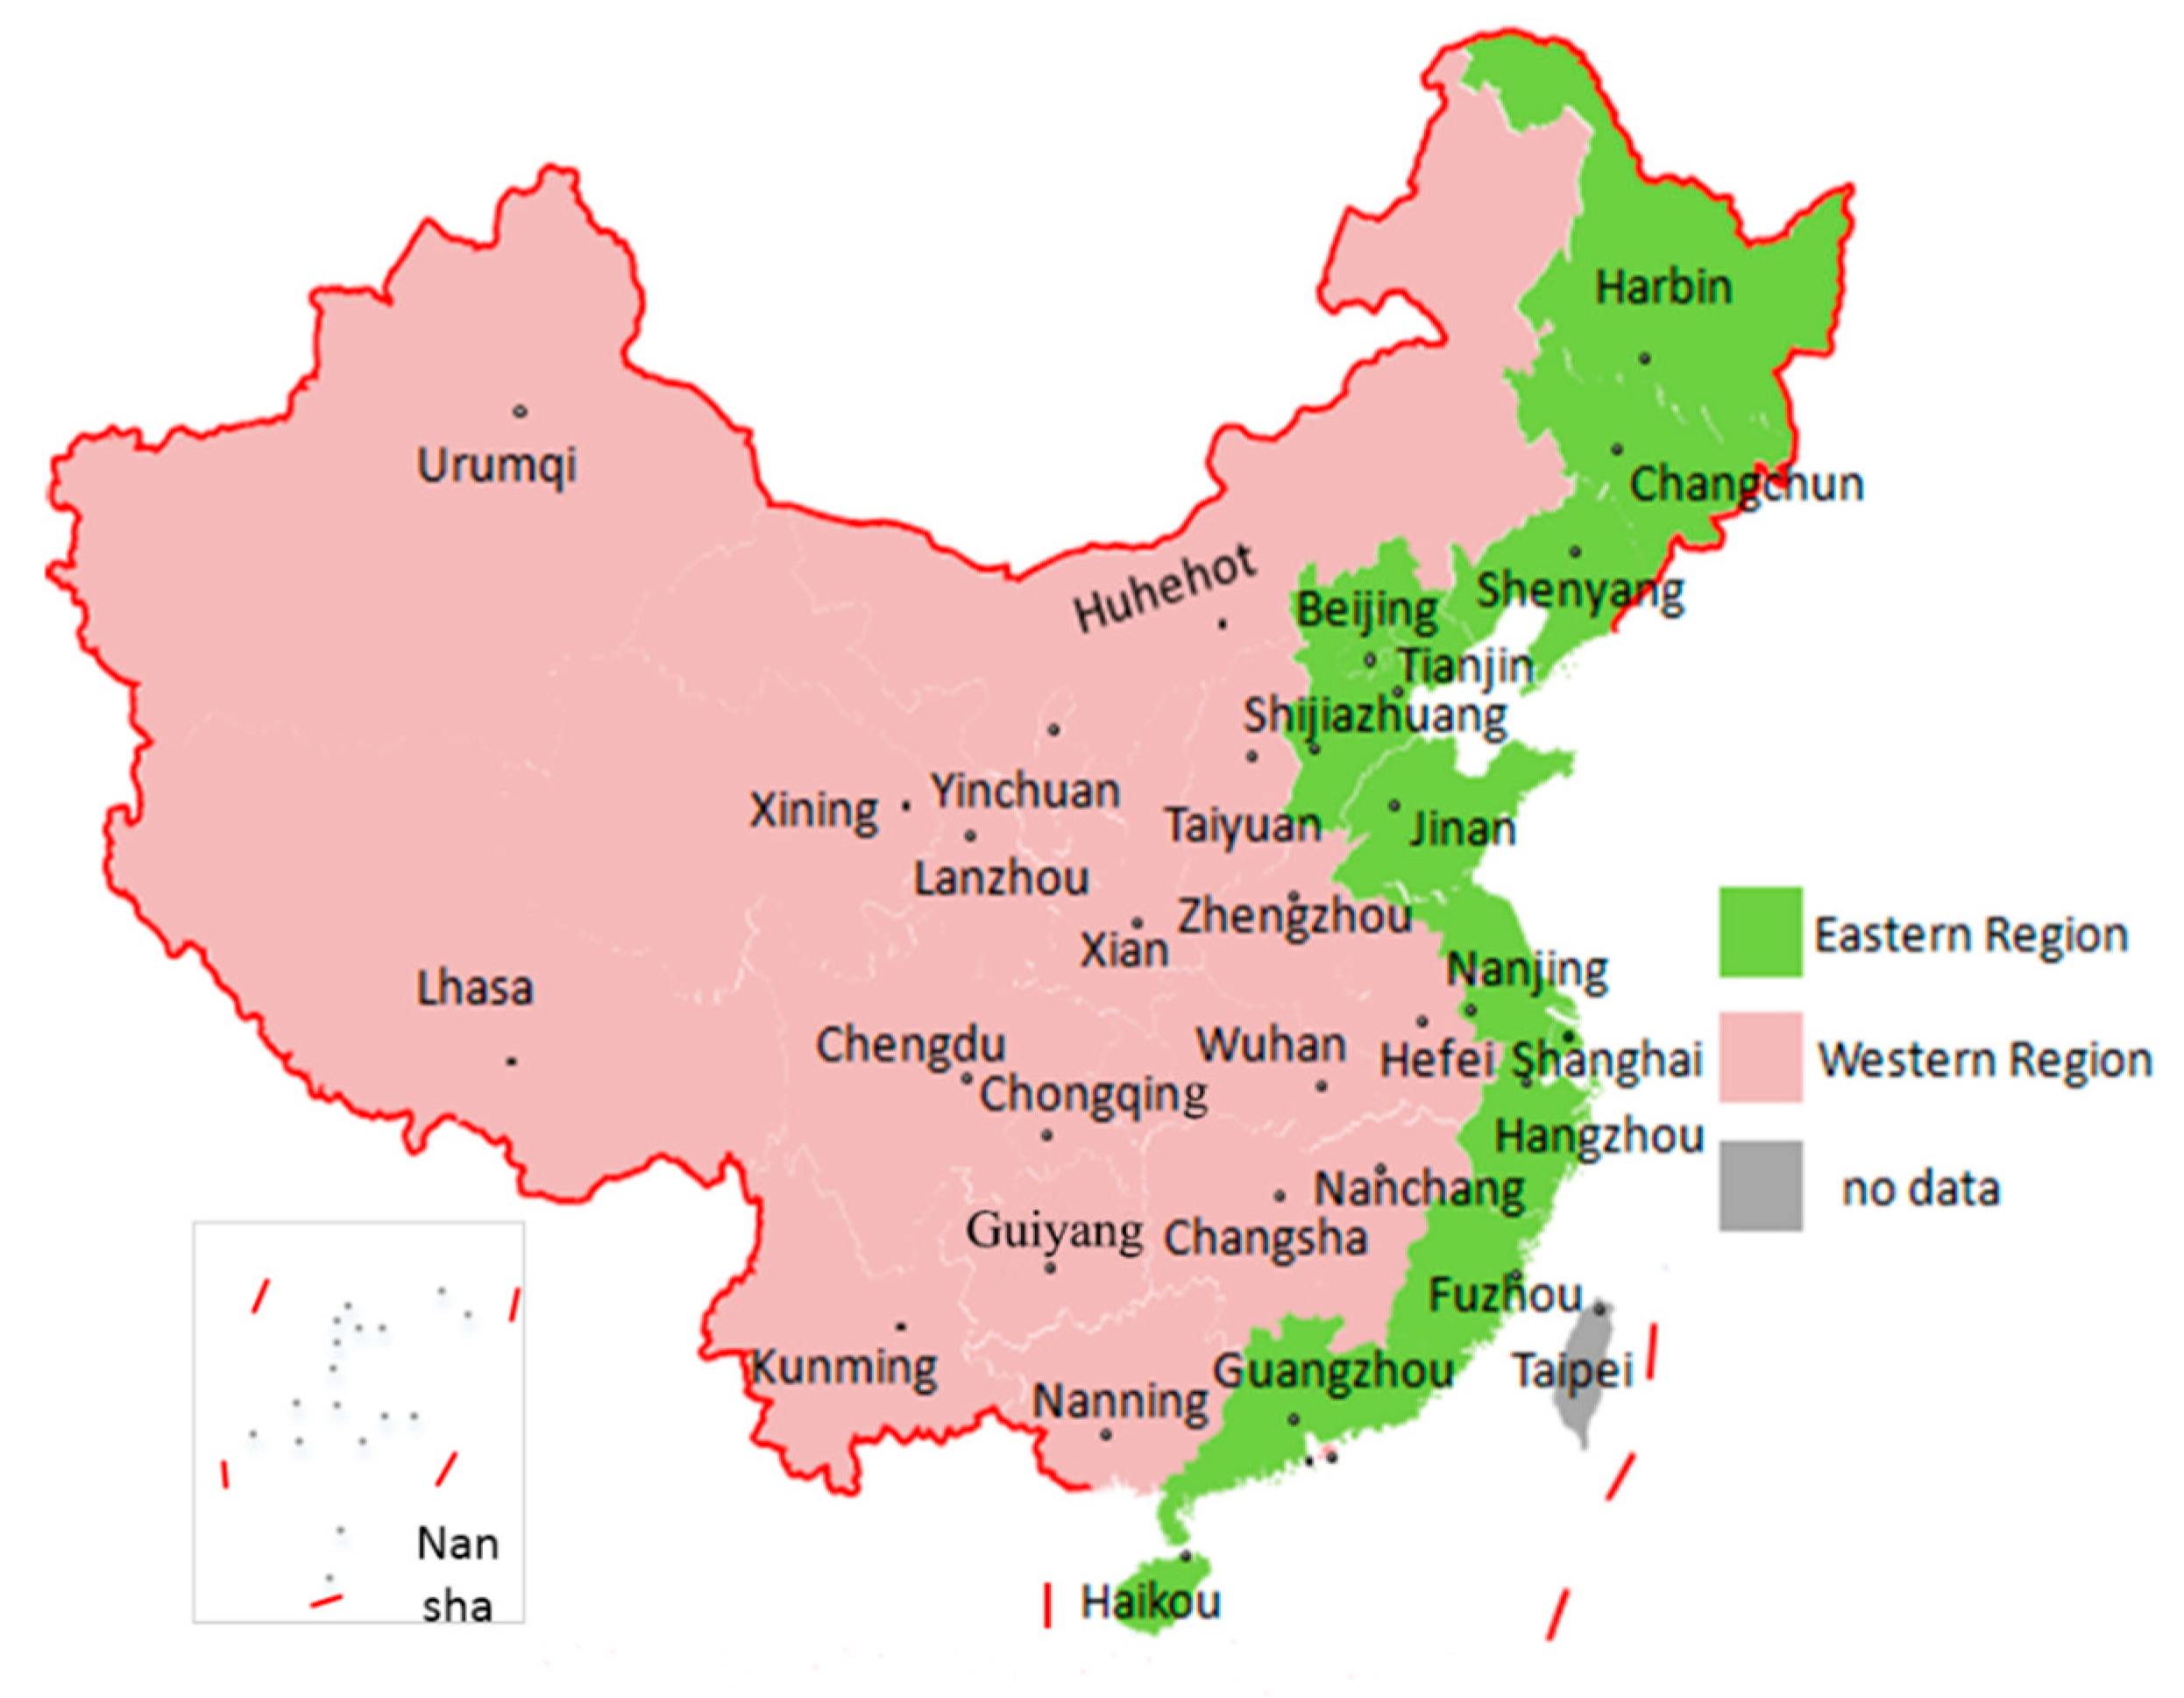
Figure 2.
Input-output index statistical analysis.

Figure 3.
Efficiency gap for the eastern (the upper figure) and western (the lower figure) cities in China.
Figure 3.
Efficiency gap for the eastern (the upper figure) and western (the lower figure) cities in China.

Figure 4.
Regional efficiency gap comparison from 2013–2016.


Table 1.
Overall efficiency score rankings between 2013 and 2016.
| No. | DMU | 2013 | 2014 | 2015 | 2016 | ||||
|---|---|---|---|---|---|---|---|---|---|
| Score | Rank | Score | Rank | Score | Rank | Score | Rank | ||
| 1 | Chengdu | 0.7777 | 24 | 0.788 | 24 | 0.7996 | 21 | 0.762 | 26 |
| 2 | Changsha | 0.9183 | 10 | 0.9233 | 9 | 0.934 | 9 | 0.945 | 10 |
| 3 | Chongqing | 0.7496 | 26 | 0.8102 | 21 | 0.7915 | 23 | 0.803 | 22 |
| 4 | Guiyang | 0.676 | 30 | 0.7556 | 27 | 0.7909 | 24 | 0.789 | 24 |
| 5 | Hefei | 0.8554 | 19 | 0.8607 | 18 | 0.8601 | 18 | 0.821 | 21 |
| 6 | Huhehot | 0.9113 | 12 | 0.9039 | 12 | 0.9123 | 11 | 0.904 | 12 |
| 7 | Kunming | 0.9999 | 6 | 0.8432 | 19 | 0.8583 | 19 | 0.842 | 20 |
| 8 | Lanzhou | 0.7302 | 28 | 0.6511 | 29 | 0.6705 | 30 | 0.667 | 30 |
| 9 | Lhasa | 1 | 1 | 1 | 1 | 1 | 1 | 1 | 1 |
| 10 | Nanchang | 0.9191 | 9 | 0.917 | 10 | 0.9001 | 13 | 0.874 | 16 |
| 11 | Nanning | 1 | 1 | 1 | 1 | 1 | 1 | 1 | 1 |
| 12 | Taiyuan | 0.6855 | 29 | 0.7027 | 28 | 0.7009 | 28 | 0.729 | 28 |
| 13 | Wuhan | 0.8564 | 18 | 0.8708 | 16 | 0.874 | 17 | 0.89 | 14 |
| 14 | Urumqi | 0.8185 | 21 | 0.7761 | 25 | 0.7855 | 25 | 0.784 | 25 |
| 15 | Xian | 0.7769 | 25 | 0.7886 | 23 | 0.7699 | 27 | 0.734 | 27 |
| 16 | Xining | 0.737 | 27 | 0.6407 | 30 | 0.686 | 29 | 0.709 | 29 |
| 17 | Yinchuan | 0.7817 | 23 | 0.7641 | 26 | 0.7754 | 26 | 0.791 | 23 |
| 18 | Zhengzhou | 0.9435 | 8 | 0.9407 | 8 | 0.9678 | 7 | 0.852 | 18 |
| 19 | Beijing | 1 | 1 | 1 | 1 | 1 | 1 | 1 | 1 |
| 20 | Changchun | 0.9016 | 14 | 0.8941 | 14 | 0.9117 | 12 | 0.882 | 15 |
| 21 | Fuzhou | 0.9882 | 7 | 0.864 | 17 | 0.8799 | 16 | 0.861 | 17 |
| 22 | Guangzhou | 1 | 1 | 1 | 1 | 1 | 1 | 1 | 1 |
| 23 | Harbin | 0.8983 | 15 | 0.8838 | 15 | 0.8887 | 15 | 0.848 | 19 |
| 24 | Haikou | 0.8933 | 16 | 1 | 1 | 0.9999 | 6 | 1 | 8 |
| 25 | Hangzhou | 0.8929 | 17 | 0.9031 | 13 | 0.9163 | 10 | 0.934 | 11 |
| 26 | Jinan | 0.7864 | 22 | 0.7959 | 22 | 0.7967 | 22 | 1 | 1 |
| 27 | Nanjing | 0.9133 | 11 | 0.9666 | 7 | 0.9462 | 8 | 0.963 | 9 |
| 28 | Shanghai | 1 | 1 | 1 | 1 | 1 | 1 | 1 | 1 |
| 29 | Shenyang | 0.8245 | 20 | 0.8353 | 20 | 0.8042 | 20 | 1 | 1 |
| 30 | Shijiazhuang | 0.5708 | 31 | 0.5588 | 31 | 0.5825 | 31 | 0.574 | 31 |
| 31 | Tianjin | 0.9091 | 13 | 0.9096 | 11 | 0.893 | 14 | 0.902 | 13 |
Table 2.
Wilcoxon signed rank Test of average Technical efficiency.
| Years | Average of Eastern | Average of Western | Wilcoxon Scorer Test |
|---|---|---|---|
| 2013 | 0.8907 | 0.8409 | 0.1011 |
| 2014 | 0.8932 | 0.8298 | 0.0454 * |
| 2015 | 0.8938 | 0.8376 | 0.0422 * |
| 2016 | 0.9203 | 0.8275 | 0.007 ** |
Notes: * For the two-tailed test, the confidence interval 0.05was significant, ** For the two-tailed test, the confidence interval 0.01 was significant.
Table 3.
Efficiency scores and rankings for energy consumption, GDP, CO2, and AQI in the cities from 2013 to 2016.
Table 3.
Efficiency scores and rankings for energy consumption, GDP, CO2, and AQI in the cities from 2013 to 2016.
| DMU | 2013 | 2014 | 2015 | 2016 | ||||||||||||
|---|---|---|---|---|---|---|---|---|---|---|---|---|---|---|---|---|
| com | GDP | CO2 | AQI | com | GDP | CO2 | AQI | com | GDP | CO2 | AQI | com | GDP | CO2 | AQI | |
| Chengdu | 0.778 | 0.818 | 0.715 | 0.786 | 0.714 | 0.825 | 0.788 | 0.692 | 0.8 | 0.8331 | 0.8 | 0.603 | 0.762 | 0.808 | 0.762 | 0.762 |
| Changsha | 0.657 | 0.924 | 0.198 | 0.116 | 0.664 | 0.929 | 0.203 | 0.121 | 0.665 | 0.938 | 0.195 | 0.192 | 0.656 | 0.948 | 0.177 | 0.022 |
| Chongqing | 0.75 | 0.8 | 0.757 | 0.75 | 0.742 | 0.84 | 0.618 | 0.81 | 0.791 | 0.8275 | 0.791 | 0.791 | 0.803 | 0.835 | 0.803 | 0.803 |
| Guiyang | 0.446 | 0.755 | 0.274 | 0.676 | 0.547 | 0.804 | 0.202 | 0.756 | 0.599 | 0.8271 | 0.513 | 0.791 | 0.63 | 0.826 | 0.324 | 0.789 |
| Hefei | 0.855 | 0.874 | 0.761 | 0.124 | 0.858 | 0.878 | 0.861 | 0.148 | 0.86 | 0.8773 | 0.86 | 0.235 | 0.821 | 0.848 | 0.808 | 0.821 |
| Huhehot | 0.384 | 0.919 | 0.32 | 0.302 | 0.748 | 0.912 | 0.101 | 0.158 | 0.725 | 0.9194 | 0.281 | 0.224 | 0.692 | 0.913 | 0.242 | 0.052 |
| Kunming | 1 | 1 | 0.929 | 1 | 0.489 | 0.864 | 0.148 | 0.843 | 0.664 | 0.8759 | 0.271 | 0.858 | 0.727 | 0.863 | 0.451 | 0.842 |
| Lanzhou | 0.32 | 0.788 | 0.125 | 0.73 | 0.358 | 0.741 | 0.183 | 0.768 | 0.302 | 0.7522 | 0.143 | 0.612 | 0.319 | 0.75 | 0.147 | 0.284 |
| Lhasa | 1 | 1 | 0.993 | 0.997 | 1 | 1 | 1 | 0.994 | 1 | 1 | 1 | 0.992 | 1 | 1 | 1 | 0.991 |
| Nanchang | 0.919 | 0.925 | 0.778 | 0.386 | 0.897 | 0.923 | 0.917 | 0.735 | 0.9 | 0.9092 | 0.9 | 0.553 | 0.874 | 0.888 | 0.842 | 0.874 |
| Nanning | 1 | 1 | 1 | 1 | 1 | 1 | 1 | 1 | 1 | 1 | 1 | 1 | 1 | 1 | 1 | 1 |
| Taiyuan | 0.164 | 0.761 | 0.101 | 0.739 | 0.185 | 0.771 | 0.1 | 0.344 | 0.176 | 0.7698 | 0.1 | 0.532 | 0.23 | 0.787 | 0.103 | 0.035 |
| Wuhan | 0.736 | 0.874 | 0.359 | 0.104 | 0.725 | 0.886 | 0.435 | 0.128 | 0.76 | 0.8881 | 0.464 | 0.167 | 0.747 | 0.901 | 0.359 | 0.011 |
| Urumqi | 0.653 | 0.846 | 0.383 | 0.212 | 0.652 | 0.817 | 0.332 | 0.135 | 0.699 | 0.8234 | 0.486 | 0.2 | 0.784 | 0.822 | 0.784 | 0.019 |
| Xian | 0.777 | 0.818 | 0.792 | 0.145 | 0.765 | 0.826 | 0.789 | 0.182 | 0.77 | 0.813 | 0.77 | 0.342 | 0.734 | 0.79 | 0.734 | 0.067 |
| Xining | 0.217 | 0.792 | 0.1 | 0.737 | 0.25 | 0.736 | 0.133 | 0.734 | 0.261 | 0.761 | 0.124 | 0.686 | 0.62 | 0.774 | 0.578 | 0.709 |
| Yinchuan | 0.37 | 0.821 | 0.116 | 0.716 | 0.34 | 0.809 | 0.134 | 0.722 | 0.275 | 0.8166 | 0.105 | 0.442 | 0.277 | 0.827 | 0.1 | 0.04 |
| Zhengzhou | 0.942 | 0.947 | 0.943 | 0.194 | 0.939 | 0.944 | 0.941 | 0.1 | 0.968 | 0.9688 | 0.968 | 0.1 | 0.852 | 0.871 | 0.852 | 0.079 |
| Beijing | 1 | 1 | 1 | 1 | 1 | 1 | 0.999 | 1 | 1 | 1 | 1 | 1 | 1 | 1 | 1 | 1 |
| Changchun | 0.872 | 0.91 | 0.902 | 0.427 | 0.894 | 0.904 | 0.716 | 0.181 | 0.912 | 0.9188 | 0.912 | 0.171 | 0.882 | 0.894 | 0.86 | 0.882 |
| Fuzhou | 0.988 | 0.988 | 0.717 | 0.988 | 0.696 | 0.88 | 0.391 | 0.864 | 0.716 | 0.8927 | 0.321 | 0.88 | 0.746 | 0.878 | 0.45 | 0.861 |
| Guangzhou | 1 | 1 | 1 | 1 | 1 | 1 | 1 | 1 | 1 | 1 | 1 | 1 | 1 | 1 | 1 | 1 |
| Harbin | 0.892 | 0.908 | 0.898 | 0.215 | 0.884 | 0.896 | 0.718 | 0.367 | 0.889 | 0.8999 | 0.889 | 0.205 | 0.848 | 0.868 | 0.844 | 0.848 |
| Haikou | 0.811 | 0.904 | 0.541 | 0.893 | 1 | 1 | 1 | 1 | 1 | 0.9999 | 1 | 1 | 1 | 1 | 1 | 1 |
| Hangzhou | 0.739 | 0.903 | 0.372 | 0.127 | 0.759 | 0.912 | 0.332 | 0.227 | 0.798 | 0.9227 | 0.447 | 0.201 | 0.804 | 0.938 | 0.397 | 0.03 |
| Jinan | 0.518 | 0.824 | 0.192 | 0.129 | 0.525 | 0.83 | 0.195 | 0.109 | 0.555 | 0.8311 | 0.218 | 0.136 | 1 | 1 | 1 | 1 |
| Nanjing | 0.643 | 0.92 | 0.171 | 0.1 | 0.601 | 0.968 | 0.157 | 0.967 | 0.885 | 0.9489 | 0.869 | 0.178 | 0.862 | 0.964 | 0.511 | 0.02 |
| Shanghai | 1 | 1 | 1 | 1 | 1 | 1 | 1 | 1 | 1 | 1 | 1 | 1 | 1 | 1 | 1 | 1 |
| Shenyang | 0.64 | 0.851 | 0.316 | 0.216 | 0.644 | 0.859 | 0.249 | 0.835 | 0.64 | 0.8363 | 0.321 | 0.198 | 1 | 1 | 1 | 1 |
| Shijiazhuang | 0.39 | 0.7 | 0.339 | 0.168 | 0.41 | 0.694 | 0.299 | 0.197 | 0.368 | 0.7055 | 0.582 | 0.465 | 0.388 | 0.701 | 0.276 | 0.029 |
| Tianjin | 0.708 | 0.917 | 0.25 | 0.227 | 0.719 | 0.917 | 0.288 | 0.111 | 0.709 | 0.9033 | 0.286 | 0.149 | 0.713 | 0.91 | 0.273 | 0.01 |
Table 4.
Comparison of the meta frontier and group frontier city rankings (2013–2016).
| DMU | 2013 Rank by Meta-Frontier | 2013 Rank by Group-Frontier | 2014 Rank by Meta-Frontier | 2014 Rank by Group-Frontier | 2015 Rank by Meta-Frontier | 2015 Rank by Group-Frontier | 2016 Rank by Meta-Frontier | 2016 Rank by Group-Frontier |
|---|---|---|---|---|---|---|---|---|
| Chengdu | 29 | 1 | 28 | 1 | 30 | 1 | 31 | 1 |
| Changsha | 18 | 1 | 12 | 1 | 15 | 1 | 15 | 1 |
| Chongqing | 31 | 1 | 26 | 1 | 31 | 1 | 28 | 1 |
| Guiyang | 28 | 17 | 25 | 14 | 28 | 11 | 26 | 11 |
| Hefei | 19 | 12 | 17 | 12 | 21 | 12 | 23 | 13 |
| Huhehot | 20 | 1 | 19 | 1 | 18 | 1 | 18 | 1 |
| Kunming | 7 | 1 | 23 | 1 | 9 | 1 | 24 | 1 |
| Lanzhou | 27 | 13 | 30 | 16 | 29 | 17 | 25 | 17 |
| Lhasa | 1 | 1 | 1 | 1 | 1 | 1 | 1 | 1 |
| Nanchang | 14 | 11 | 16 | 1 | 20 | 1 | 21 | 1 |
| Nanning | 1 | 1 | 1 | 1 | 1 | 1 | 1 | 1 |
| Taiyuan | 30 | 14 | 31 | 1 | 27 | 15 | 29 | 15 |
| Wuhan | 25 | 1 | 22 | 1 | 23 | 1 | 19 | 1 |
| Urumqi | 26 | 1 | 29 | 1 | 24 | 13 | 27 | 12 |
| Xian | 23 | 15 | 21 | 15 | 26 | 14 | 30 | 14 |
| Xining | 24 | 18 | 27 | 18 | 25 | 18 | 20 | 18 |
| Yinchuan | 17 | 16 | 18 | 17 | 17 | 16 | 16 | 16 |
| Zhengzhou | 12 | 1 | 11 | 1 | 10 | 1 | 22 | 1 |
| Beijing | 1 | 1 | 1 | 1 | 1 | 1 | 1 | 1 |
| Changchun | 13 | 7 | 14 | 5 | 19 | 1 | 11 | 10 |
| Fuzhou | 8 | 6 | 1 | 8 | 1 | 10 | 1 | 12 |
| Guangzhou | 1 | 1 | 1 | 1 | 1 | 1 | 1 | 1 |
| Harbin | 21 | 1 | 20 | 1 | 22 | 1 | 14 | 11 |
| Haikou | 22 | 1 | 1 | 1 | 8 | 1 | 10 | 1 |
| Hangzhou | 9 | 9 | 10 | 6 | 11 | 8 | 12 | 8 |
| Jinan | 16 | 12 | 13 | 9 | 16 | 11 | 1 | 1 |
| Nanjing | 10 | 8 | 9 | 1 | 12 | 7 | 13 | 7 |
| Shanghai | 1 | 1 | 1 | 1 | 1 | 1 | 1 | 1 |
| Shenyang | 11 | 11 | 24 | 1 | 14 | 12 | 1 | 1 |
| Shijiazhuang | 15 | 13 | 15 | 10 | 13 | 13 | 17 | 13 |
| Tianjin | 1 | 10 | 8 | 7 | 1 | 9 | 1 | 9 |
Table 5.
Wilcoxon signed rank Test of technology gap.
| Years | Eastern | Western | Wilcoxon Scorer Test |
|---|---|---|---|
| 2013 | 0.9561 | 0.8827 | 0.01 ** |
| 2014 | 0.9547 | 0.8669 | 0.005 ** |
| 2015 | 0.9655 | 0.8887 | 0.006 ** |
| 2016 | 0.9855 | 0.8641 | 0.0005 ** |
Notes: * For the two-tailed test, the confidence interval 0.05 was significant, ** For the two-tailed test, the confidence interval 0.01 was significant.
Table 6.
CO2 and AQI gap analysis.
| DMU | 2013 Gap Rank (Not Including CO2) | 2013 Gap Rank (Not Including AQI) | 2014 Gap Rank (Not Including CO2) | 2014 Gap Rank (Not Including AQI) | 2015 Gap Rank (Not Including CO2) | 2015 Gap Rank (Not Including AQI) | 2016 Gap Rank (Not Including CO2) | 2016 Gap Rank (Not Including AQI) |
|---|---|---|---|---|---|---|---|---|
| Chengdu | 29 | 28 | 31 | 25 | 30 | 30 | 31 | 29 |
| Changsha | 18 | 17 | 12 | 11 | 14 | 12 | 15 | 10 |
| Chongqing | 31 | 31 | 26 | 29 | 31 | 31 | 28 | 31 |
| Guiyang | 28 | 27 | 25 | 26 | 27 | 25 | 26 | 17 |
| Hefei | 19 | 18 | 18 | 17 | 21 | 17 | 23 | 19 |
| Huhehot | 20 | 19 | 19 | 18 | 18 | 18 | 18 | 14 |
| Kunming | 7 | 30 | 23 | 31 | 9 | 28 | 24 | 25 |
| Lanzhou | 27 | 26 | 29 | 28 | 29 | 26 | 25 | 23 |
| Lhasa | 1 | 1 | 1 | 1 | 1 | 1 | 1 | 1 |
| Nanchang | 14 | 12 | 17 | 10 | 20 | 14 | 21 | 18 |
| Nanning | 1 | 1 | 1 | 1 | 1 | 1 | 1 | 30 |
| Taiyuan | 30 | 29 | 30 | 30 | 28 | 27 | 29 | 26 |
| Wuhan | 25 | 22 | 22 | 21 | 23 | 22 | 19 | 15 |
| Urumqi | 26 | 25 | 28 | 27 | 24 | 23 | 27 | 24 |
| Xian | 23 | 21 | 21 | 19 | 26 | 24 | 30 | 27 |
| Xining | 24 | 24 | 27 | 24 | 25 | 21 | 20 | 21 |
| Yinchuan | 17 | 16 | 16 | 16 | 16 | 16 | 16 | 11 |
| Zhengzhou | 12 | 11 | 11 | 9 | 10 | 7 | 22 | 20 |
| Beijing | 1 | 1 | 1 | 1 | 1 | 1 | 1 | 1 |
| Changchun | 13 | 13 | 14 | 14 | 19 | 19 | 11 | 13 |
| Fuzhou | 8 | 9 | 1 | 8 | 1 | 13 | 1 | 16 |
| Guangzhou | 1 | 1 | 1 | 1 | 1 | 1 | 1 | 1 |
| Harbin | 21 | 20 | 20 | 20 | 22 | 20 | 14 | 22 |
| Haikou | 22 | 23 | 7 | 22 | 8 | 29 | 10 | 28 |
| Hangzhou | 9 | 7 | 10 | 7 | 11 | 8 | 12 | 8 |
| Jinan | 16 | 15 | 13 | 12 | 15 | 15 | 1 | 1 |
| Nanjing | 10 | 8 | 9 | 13 | 12 | 9 | 13 | 9 |
| Shanghai | 1 | 1 | 1 | 1 | 1 | 1 | 1 | 1 |
| Shenyang | 11 | 10 | 24 | 23 | 13 | 11 | 1 | 1 |
| Shijiazhuang | 15 | 14 | 15 | 15 | 17 | 10 | 17 | 12 |
| Tianjin | 1 | 1 | 8 | 6 | 1 | 1 | 1 | 1 |
© 2018 by the authors. Licensee MDPI, Basel, Switzerland. This article is an open access article distributed under the terms and conditions of the Creative Commons Attribution (CC BY) license (http://creativecommons.org/licenses/by/4.0/).
Share and Cite
MDPI and ACS Style
Li, Y.; Chiu, Y.-H.; Lu, L.C. Regional Energy, CO2, and Economic and Air Quality Index Performances in China: A Meta-Frontier Approach. Energies 2018, 11, 2119. https://doi.org/10.3390/en11082119
AMA Style
Li Y, Chiu Y-H, Lu LC. Regional Energy, CO2, and Economic and Air Quality Index Performances in China: A Meta-Frontier Approach. Energies. 2018; 11(8):2119. https://doi.org/10.3390/en11082119
Chicago/Turabian StyleLi, Ying, Yung-Ho Chiu, and Liang Chun Lu. 2018. "Regional Energy, CO2, and Economic and Air Quality Index Performances in China: A Meta-Frontier Approach" Energies 11, no. 8: 2119. https://doi.org/10.3390/en11082119
Note that from the first issue of 2016, this journal uses article numbers instead of page numbers. See further details here.