Energy and Exergy Analyses of Tube Banks in Waste Heat Recovery Applications

Mechanical Engineering, The University of Alabama, Tuscaloosa, AL 35041, USA
*
Author to whom correspondence should be addressed.
Energies 2018, 11(8), 2094; https://doi.org/10.3390/en11082094
Submission received: 16 July 2018
/
Revised: 6 August 2018
/
Accepted: 8 August 2018
/
Published: 12 August 2018
Abstract
:In this study, energy and exergy analyses have been investigated numerically for unsteady cross-flow over heated circular cylinders. Numerous simulations were conducted varying the number of inline tubes, inlet velocity, dimensionless pitch ratios and Reynolds number. Heat leakage into the domain is modeled as a source term. Numerical results compare favorably to published data in terms of Nusselt number and pressure drop. It was found that the energy efficiency varies between 72% and 98% for all cases, and viscous dissipation has a very low effect on the energy efficiency for low Reynolds number cases. The exergy efficiency ranges from 40–64%, and the entropy generation due to heat transfer was found to have a significant effect on exergy efficiency. The results suggest that exergy efficiency can be maximized by choosing specific pitch ratios for various Reynolds numbers. The results could be useful in designing more efficient heat recovery systems, especially for low temperature applications.
1. Introduction
External forced convection around circular cylinders has a great number of applications in heat exchangers, for space heating, power generators, condensers, electrical equipment and many other thermal applications. In order to determine the thermodynamic efficiency of a heat-transfer process, both energy and exergy analyses should be examined. It is a widely-known fact that entropy generation has a considerable influence on the exergy destruction of a system and can occur as a result of heat transfer (temperature gradients) and/or fluid friction (viscous dissipation). High entropy generation will result in a less exergetically-efficient system; therefore, it has been a significant subject matter to explore the parameters that reduce entropy generation and irreversibility.
Fowler and Bejan [1] investigated a correlation to determine the optimal size of bodies with specified external forced convection heat transfer to obtain minimum entropy generation. They have studied three different objects: cylinders, spheres in cross-flow and flat plates in parallel flow. They reported that the optimal size increases gradually with the heat transfer duty parameter. Korukcu [2] had made some numerical analysis to investigate the energy and exergy characteristics of laminar steady flow across a square cylinder. Hence, the flows with low Reynolds numbers were determined to be more sensible to heat transfer and temperature drop in the earlier sections of the upstream region. Moreover, the most remarkable frictional entropy generation values in the upstream region were attained at the inlet section of the throat. Melhem et al. [3] analytically obtained the effect of blockage, Reynolds number and Prandtl numbers on the entropy generation due to laminar flow and heat transfer for a cross-flow over a cylinder confined between parallel plates. The authors found that while the entropy generation increased with increasing Reynolds and Prandtl number, it decreased as the blockage ratio decreased. Another numerical investigation studied by Hijleh [4] examined entropy generation due to laminar mixed heat convection from an isothermal heated cylinder in an air cross-flow. The author examined the effect of Reynolds number, buoyancy parameter and cylinder diameter on entropy generation. They summarized that there was a considerable increase in entropy generation due to mixed convection over pure forced convection, especially at small cylinder parameters. Poulikakos and Johnson [5] have also studied second law analysis of combined heat and mass transfer phenomena in external flow for a flat plate and a cylinder, and they obtained an expression for the entropy generation for combined convective heat and mass transfer in external flows. The expression found accounts for three types of irreversibilities: heat transfer across finite temperature difference, mass transfer across finite difference in chemical potential and in flow friction.
Besides the circular cylinder, there are other studies devoted to different geometries, such as elliptic or squares. Ibrahim and Moawed [6] conducted an experimental investigation to compare the heat transfer and entropy generation for elliptic tubes with and without a fin. They also placed the fins on a different location on the elliptic tubes and obtained optimum fin positions. The authors found that the irreversibility ratio without a fin was greater than that of with a fin. Khan et al. [7] have analytically optimized the tube bank design regarding the dimensionless pitch ratio, velocity, tube diameters and heat load. The authors obtained a general dimensionless expression for the entropy generation rate for a control volume around a tube bank. They presented that for lower approach velocities, a staggered arrangement gave better performance, while in-line arrangement performed better for higher inlet velocities. Moreover, they claimed that compact tube banks gave better performance for both inline and staggered tubes and for smaller tube diameters. Gharbi et al. [8] conducted a numerical study to compare the performance of heat exchangers of different tube geometries: circular, ellipsoidal and wing-shaped. They used entropy generation as a criterion to find the best tube arrangement. The authors obtained heat transfer correlations for each different tube geometry between < Re < . They presented that for all flow conditions, there was no best geometric shape; however, when Re > , the circular tube geometry gave the worst performance, and for Re > , the elliptic shape gave the best performance. Khan et al. [9] compared the overall thermal/fluid performance of different geometries, which were circular, elliptic, square and rectangular. In this study, the authors obtained a dimensionless entropy generation rate for each geometry, which depended on Reynolds number, perimeter, the axis ratio for the elliptical pin fin and the aspect ratio. They reported that the worst performance was found for the square geometry from the point of view of total heat transfer rate, drag force and entropy generation rate. Furthermore, the circular geometry gave the best performance for lower Reynolds numbers, smaller perimeters and larger aspect ratios. The rectangular plate fin performed best for higher Reynolds numbers, smaller aspect ratios and larger perimeters.
In the fuel combustion or chemical reaction process, there is always waste heat, and mostly, this heat is dumped into the environment. However, this waste heat can be reused for economic and environmental purposes. Boilers, furnaces, heaters, kilns and internal combustion produce a large quantity of hot flue gas that can be recovered. It is a widely known fact that waste heat from those sources cannot be fully recovered. In order to increase the efficiency of the waste heat recovery systems, a large amount of studies have been carried out. Cuce and Riffat [10] conducted a comprehensive review of heat recovery systems on building applications. Here, different types of heat recovery systems were illustrated, and it was claimed that heat pipe, fixed plate, run-around and rotary wheel heat recovery systems attained the highest efficiencies. An experimental study was carried out by Velraj et al. [11] to investigate heat recovery from diesel engine exhaust gas. The authors designed and fabricated a finned shell and tube heat exchanger and a PCM-based thermal energy storage tank and integrated these equipment into a diesel engine. It was found that although 30% of the heat of combustion was carried away from internal combustion engines, 10–15% of the fuel power could be stored as heat in the combined storage system. Another experimental investigation was performed by Bari and Hossain [12]. The authors recovered waste heat from a diesel engine using two heat exchangers in a Rankine cycle. They optimized the design of the heat exchangers to improve the overall performance of the heat recovery system. It was claimed that 23.7% power could be improved using water as a working fluid. A theoretical thermal efficiency model was proposed by Ling et al. [13] to investigate the impact of working fluid properties on the thermal efficiency in an organic Rankine cycle. The authors summarized that working fluid had little impact on the optimal operation condition, and the selection of the fluid mainly depended on the heat source heat temperature. They also conducted exergy analysis, and it was found that the evaporator resulted in major exergy destruction. Mohammadi et al. [14] conducted a study to find the best heat recovery system for a cement plant examining energy and exergy analyses. The authors compared a dual pressure Rankine cycle, a simple dual pressure Organic Rankine cycle (ORC), a regenerative dual pressure organic Rankine cycle for high temperatures and a simple ORC and transcritical carbon dioxide cycle for low temperatures. It was claimed that regenerative ORC cycle and ORC gave the best performances for high and low temperatures, respectively. Maatouk and Slim [15] compared the Vapor Compression Refrigeration Cycle (VCRC) and Liquid Desiccant Cooling System (LDCS) for waste heat recovery. Energy and exergy analyses were performed to compare their performances. Here, there was an increase in the overall exergy efficiency when the flue gas inlet temperature increased and exit temperature decreased for VCRC systems. Similarly, global exergy efficiency increased with increasing exhaust gas temperature for LDCS systems. Blanco et al. [16] conducted a study to determine the energy and exergy of waste heat in the industry of the Basque country. They concentrated 10 industrial sectors, such as the integral iron sector, cement and chemical industries, in Basque, and classified them according to their type into gases, liquid effluents and solid products’ stream, as well as the temperature levels. The authors claimed that 40% of the total consumption of energy was wasted and not recovered.
In the literature, there have been many correlations for heat transfer and pressure drop over tube bundles; however, Zukauskas’s [17] correlation for the Nusselt number and pressure drop is among the most widely-used correlations. Zukauskas and Ulinskas [18] performed experiments and proposed correlations for the average Nusselt number and pressure drop for cross-flow over tube banks with a range of 0 < Re < and 0.7 < Pr < 500 for in-line and staggered banks of circular tubes. Khan et al. [19] performed an analytical study to investigate heat transfer from a bundle of circular tube banks in cross-flow for an in-line and staggered arrangement under isothermal boundary conditions. The authors obtained a heat transfer coefficient parameter and suggested a Nusselt number correlation that depended on the longitudinal pitch, transverse pitch, Reynolds and Prandtl number. They claimed that this model was applicable for a wide range of parameters over a bundle of tube banks in staggered or in-line arrangements.
In this study, energy and exergy analyses of tube banks will be investigated using a commercial CFD software, ANSYS Fluent 18.2 [20]. To validate the model, the results are compared to the Zukauskas correlation regarding both Nusselt number and pressure drop. Heat transfer characteristics, entropy generation, viscous dissipation, pressure drop, velocity and temperature distributions are investigated for Reynolds numbers from 500–30,000. The dimensionless pitch ratio of the domain is also varied, and the parameters discussed above are examined. The purpose here is to determine optimal first and second law efficiencies for low-temperature heat recovery using banks of cylindrical tubes, especially for low temperature heat recovery.
2. Mathematical Model
2.1. Governing Equations
In order to investigate fluid flow and heat transfer problems, some governing equations must be solved numerically. The equations for the given problem are continuity, momentum and energy equations, which are presented from Equations (1)–(5) with the assumptions made below:
- Flow is two-dimensional and transient;
- Inlet velocity of the fluid is uniform;
- Thermo-physical properties of the fluid are constant;
- Radiation heat transfer effects are negligible.
Air is used as a fluid for this analysis, as it is quite common as a heat transfer fluid, whose thermophysical properties are taken at a constant temperature corresponding to the mean inlet and outlet temperature of 393 K; see Table 1. The continuity equation (mass conservation), Navier–Stokes equations (momentum conservation) and energy equations are shown in Equations (1)–(4).
where = k/ is the thermal diffusivity and is the viscous dissipation, defined as the heat generation due to shear stress in the fluid:
2.2. Thermodynamics Analysis
The thermodynamic analyses will involve energy (first law) and exergy (second law) efficiencies, which are discussed in detail in the following sections, especially with regards to numerical quantities recorded or observed in the simulations.
2.2.1. Energy Analysis
To begin with, we present the steady-state energy balance for the control mass, assuming negligible kinetic and gravitational effects, as well as negligible control volume work, as follows:
Here, represents the heat transfer rate between the control volume and its surroundings. In this system, there are two heat transfer sources: the first one is due to convection over the cylinders, and the second one is due to heat leakage:
where and P represent the volumetric flow rate and average thermodynamic pressure, respectively. As is seen from Equation (7), the balance of energy depends on the mass flow rate of heat transfer fluid in the simulation, specific heat, the average temperature and pressure difference between outlets. There is also a dependence on heat leakage, which has been artificially introduced to account for heat leakage from the ambient surroundings into the domain. The leakage, , is applied as follows:
where U, A and denote the overall heat transfer coefficient, surface area and temperature difference, calculated as follows:
Finally, the energy efficiency can be defined as the ratio of desired energy extracted from the fluid to the total energy required by the flow. It is written as follows:
2.2.2. Exergy Analysis
The exergy efficiency can be calculated using Equations (11)–(22). The exergy balance equation is similar to the energy equation, but includes a term for exergy destruction due to the irreversibility of the system, :
The first term of Equation (11) represents the exergy gained due to heat transfer and has two sources, as for the energy balance.
Here, , and are the surrounding temperature of the domain, tube surface temperature (assumed constant) and average bulk temperature, respectively. The flow exergy difference between the inlet and outlet is determined as follows and can be calculated by monitoring the temperature difference at the inlet and outlet.
To evaluate the exergy destruction, Equation (16), an entropy balance is required, Equations (16) and (17):
For the given problem, there are three different sources of entropy generation: viscous dissipation, heat transfer to the cylinder and heat transfer to the environment due to heat leakage. These are evaluated in Equations (18)–(21):
Here, , represent the total heat transfer from the fluid to tubes and heat leakage from the system to the environment, respectively.
In order to calculate entropy generation due to viscous dissipation, the average pressure drop and domain temperature are monitored. With the above terms readily calculated in Fluent, it is then possible to evaluate the exergy efficiency of the system.
3. Geometry, Mesh Generation and Boundary Conditions
3.1. Geometry Formation and Boundary Conditions
Figure 1 demonstrates the typical geometry of the given two-dimensional problem. Considered herein, there are 12 different geometries, four different dimensionless pitch ratios and three different numbers of inline tubes. The longitudinal and transverse pitch ratios are defined as the ratios of the distances of two adjacent tube centerlines to tube diameter in the flow direction and perpendicular to the flow direction, respectively. The pitch ratios are assumed equal for each different geometry and are varied from 1.3–3.0. In order to reduce the effects of outlet location on solution parameters, the inlet and outlet of the domain have been extended three-times and six-times the tube diameters before the first row and after the last row, respectively. The diameter of the inline tubes was set to 15 mm for each geometry, consistent with widely-available tubing used in various applications. A non-slip boundary condition was applied to the tubes with a constant surface temperature of 350 K, typical for low-heat recovery applications for boiler feed water heating or other processes. A uniform velocity boundary condition has been applied to the inlet, and the velocity at the inlet is calculated to correspond to various Reynolds numbers and pitch ratios using Equations (23) and (24). The inlet temperature is set to 400 K for each simulation, corresponding to a low temperature heat source, for example waste heat from industrial processes. For the top and bottom walls (see Figure 1), a symmetry condition is used, effectively making the normal velocity component zero at the symmetry plane [21]. A pressure-outlet boundary condition is applied for the outlet of the computational domain with a value of zero gauge pressure. To apply an artificial heat leakage to the system, an energy source term is applied and the sources calculated using Equation (8) for an average value of overall heat transfer coefficient 50 W/mK for each different geometry.
To set the inlet velocity in the tube banks, flow characteristics are determined by the maximum velocity that is seen between the tubes. Hence, the Reynolds number is calculated using a maximum velocity .
A mathematical model of the domain and boundary conditions can be seen in Figure 1.
3.2. Mesh Generation and Grid Independence Study
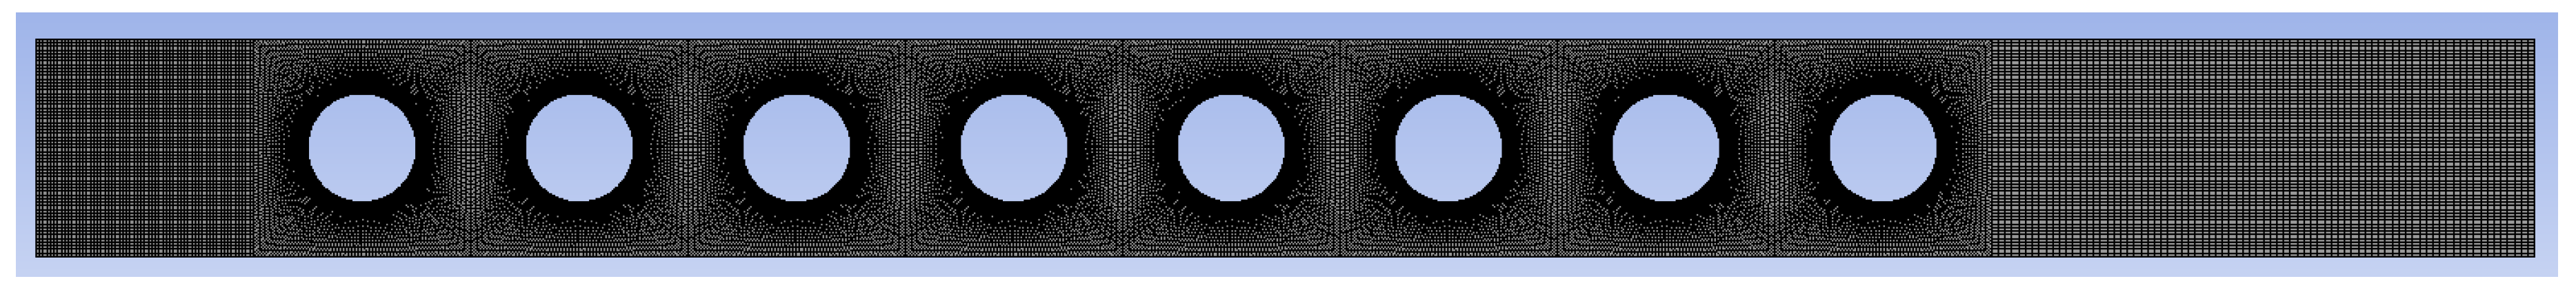
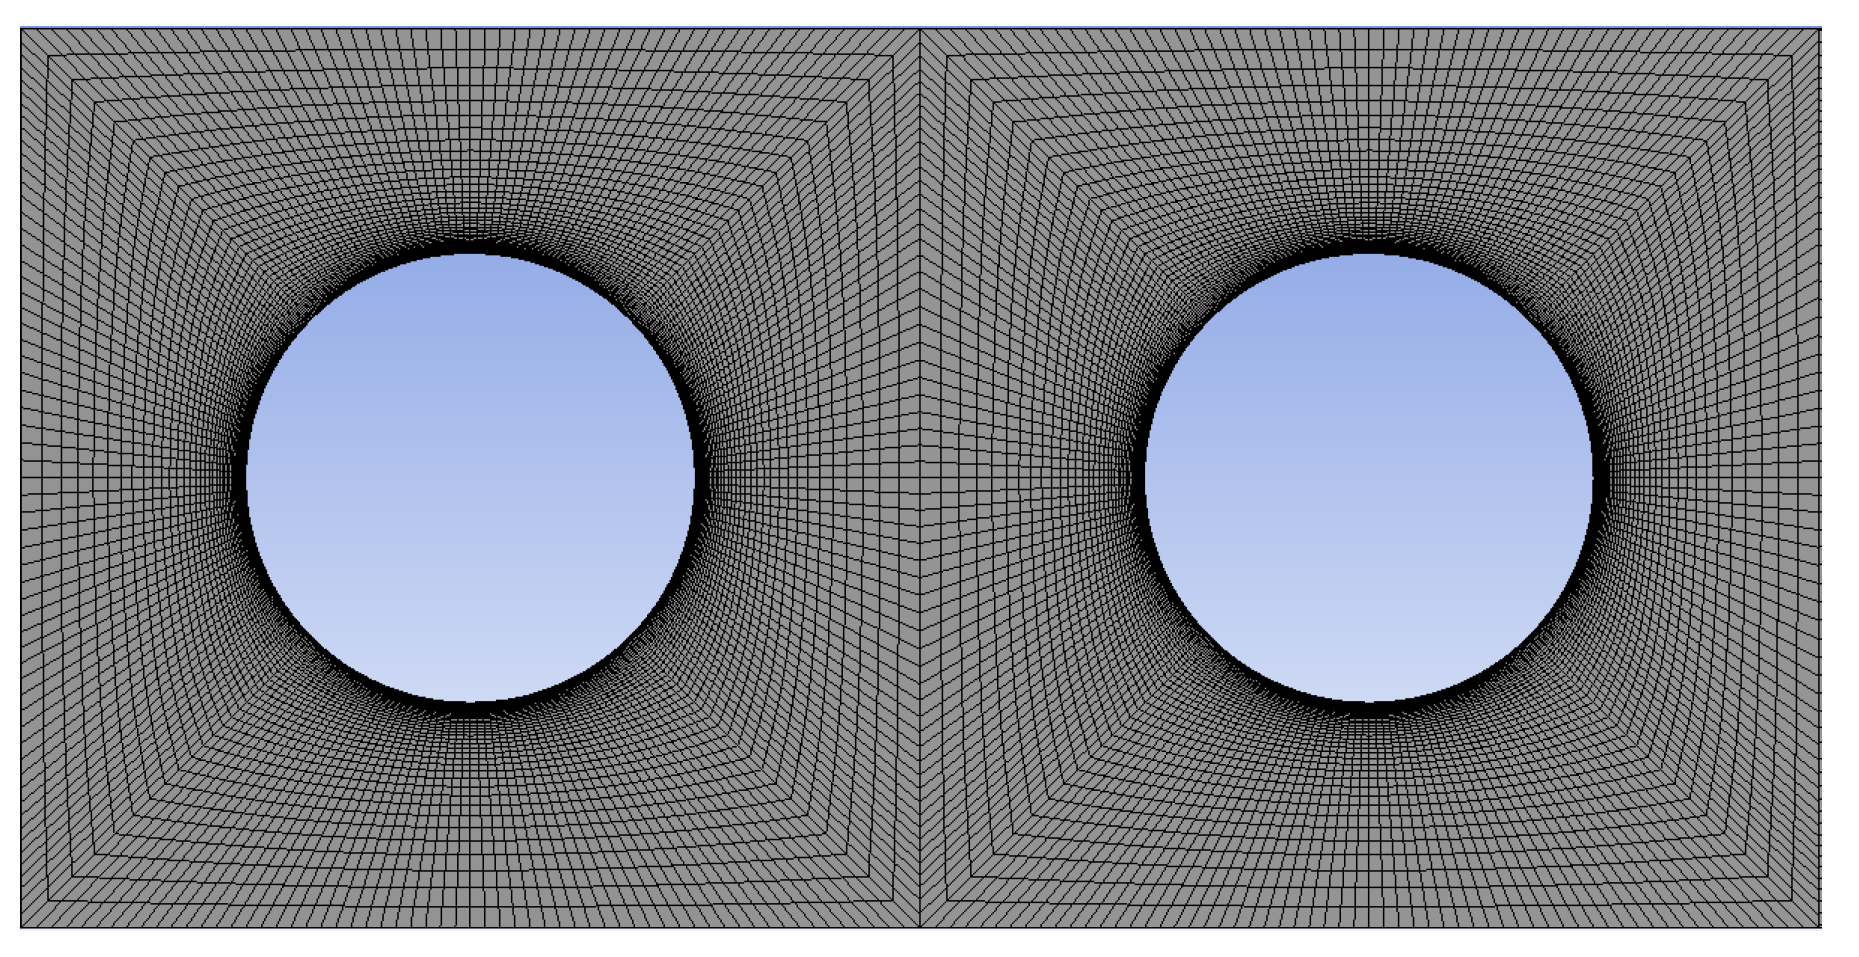
ANSYS Fluent 18.2 is used to create domains and generate meshes. A quadrilateral mesh type has been used for this geometry with an increased density close to the surface of the cylinders. Figure 2 shows the mesh for an eight-cylinder simulation, and a more detailed view of one such cylinder is shown in Figure 3.
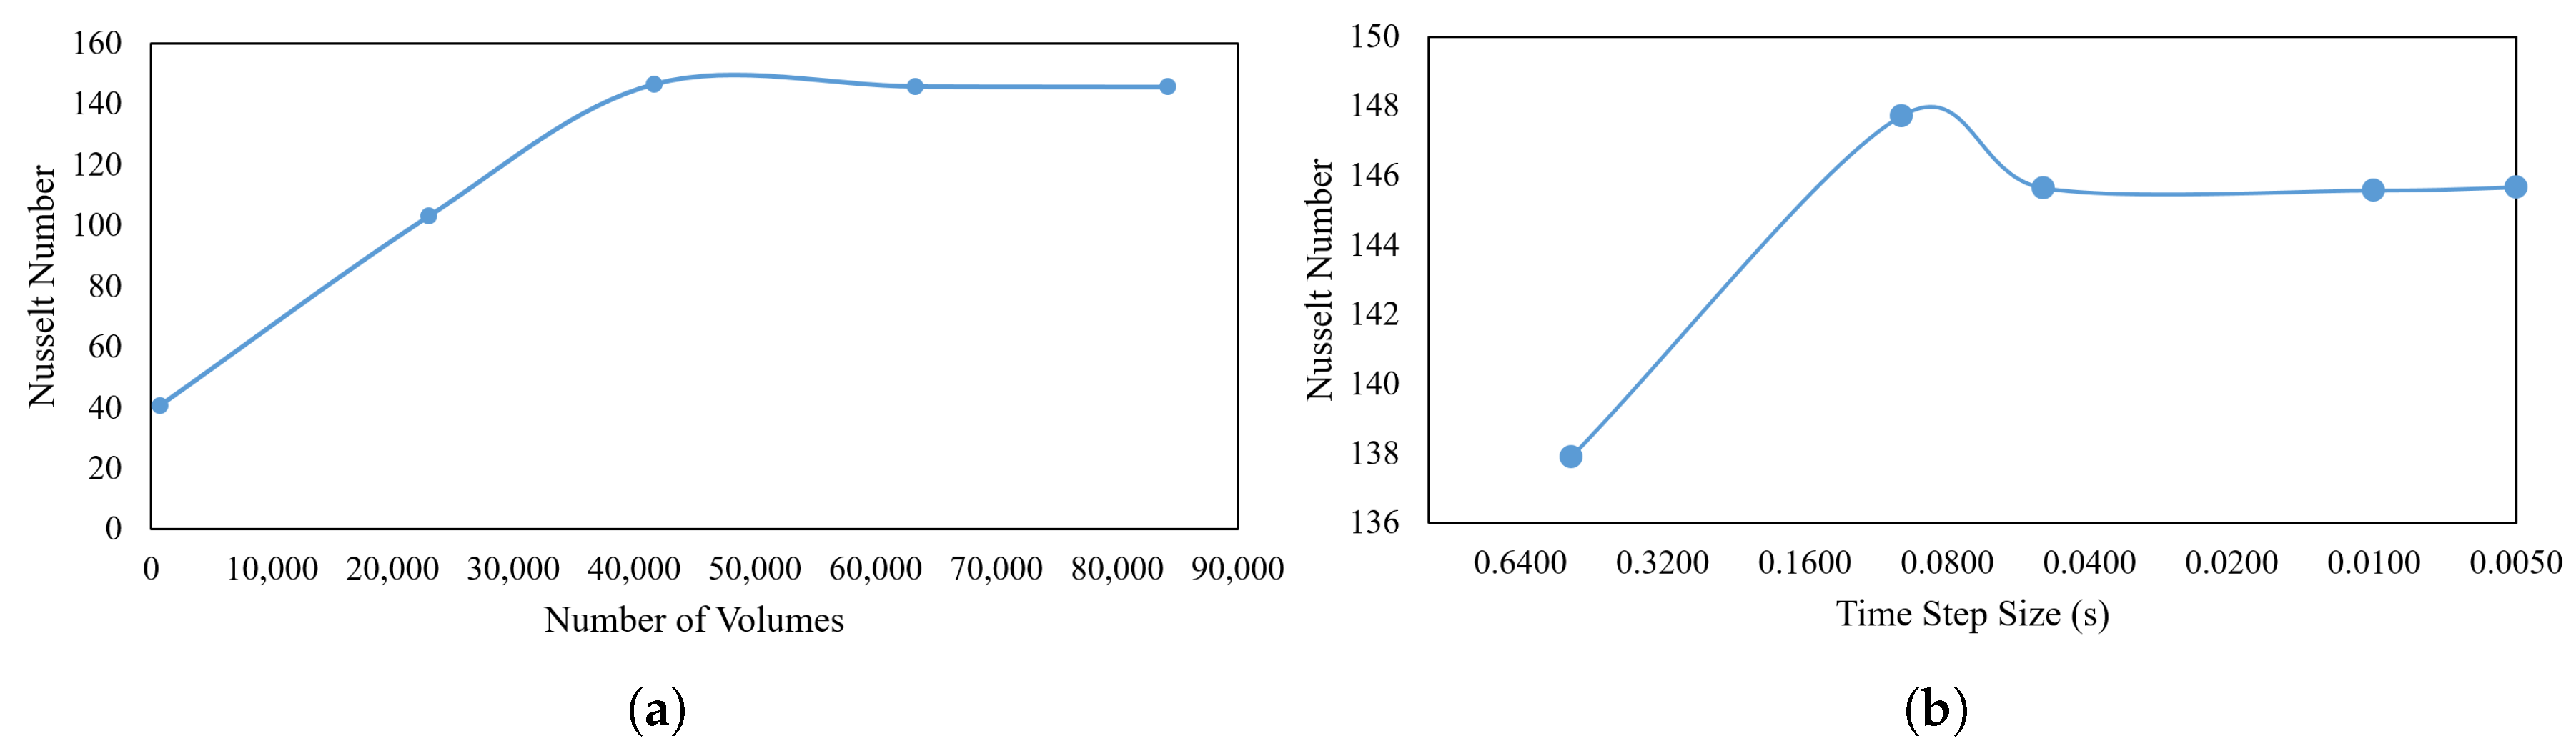
In order to ensure that the grid configuration is adequate, a mesh independence study was performed for a pitch ratio of 1.6. The highest Reynolds number, 30,000, was chosen for grid independence, and the cell number count was increased until no further change in Nusselt number was observed; see Figure 4a. From the analysis of Figure 4a, it is evident that a mesh count of around 65,000 is adequate for simulation purposes.
Time Independence Study and Solver Settings
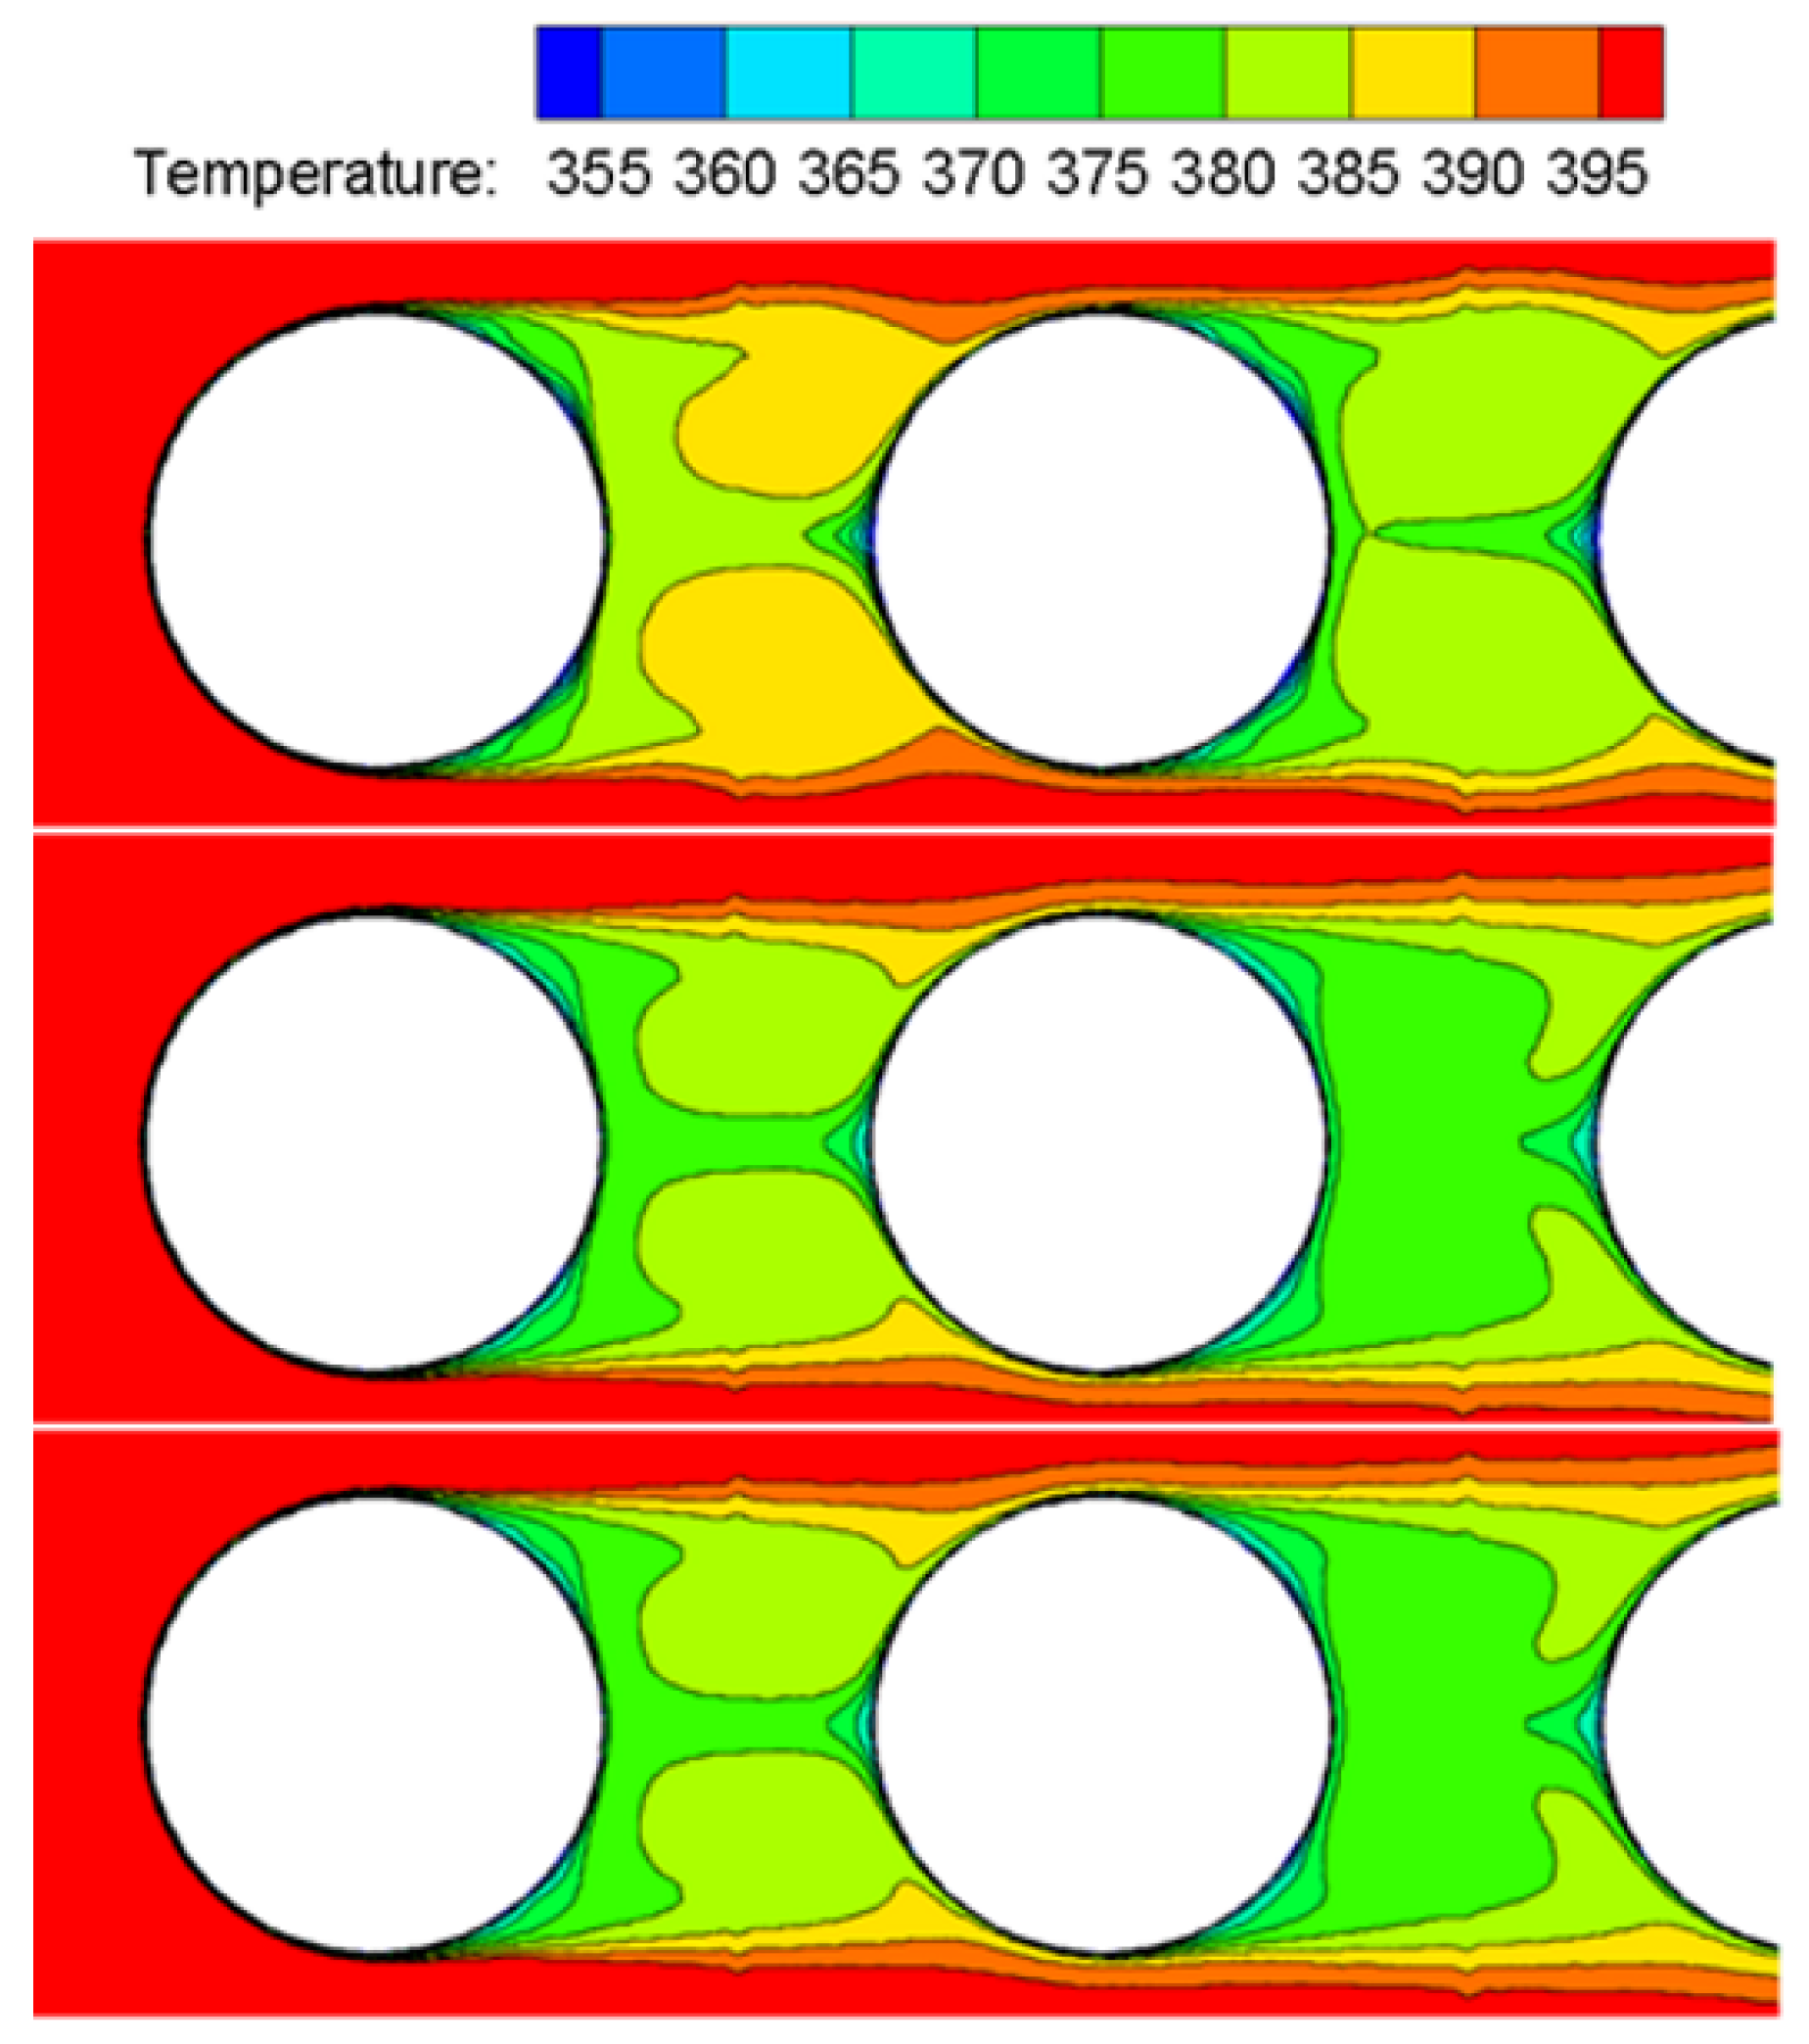
To find an adequate time step size, a time independence study is conducted for the same geometry as above. Simulation are run for 10 seconds (simulated time), and the time step size is varied for each simulation. Figure 4b shows the results of this study and indicates that a time step size of 0.01 s (corresponding to 1000 total time steps) is adequate for this study. The authors note that, in all cases, the Nusselt number becomes constant well before data are recorded for thermodynamics and heat transfer calculations. For example, Figure 4b shows Nusselt number variation in time for a pitch ratio of 1.6 and a Reynolds number of 30,000, clearly showing a steady-state result, albeit with an unsteady solver. Time step independence is further demonstrated by looking at temperature contours for different time step sizes, as seen in Figure 5. It is obvious here that, while there are considerable differences between the 0.05-s and 0.001-s cases, the contours are virtually identical for the 0.01-s and 0.005-s cases. This indicates that the time step size chosen for this study is sufficiently small.
Once the geometry is created and meshed appropriately, ANSYS Fluent 18.2 is used to solve the problem in question. Each simulation is run in a transient fashion, and the k- RNG turbulence model is utilized, as is customary in similar studies [22,23,24,25], due to more reliable results for cross-flow problems, including swirl, separation and recirculation of the fluid. The pressure-corrector, the SIMPLEC (Semi-Implicit Method for Pressure Linked Equations-Consistent) algorithm, is used, with a convergence criterion of for the continuity, momentum and energy equations. A second order upwind scheme was used to discretize the convective terms in the energy and momentum equations, and the second order implicit method was used to discretize the time derivative.
4. Results and Discussions
4.1. Validation
In order to validate the numerical results, the Nusselt number and pressure drop were used as parameters to compare. As is shown in Equations (25) and (26), the Nusselt number can be calculated using built-in functions in the software. Among several Nusselt number correlations, the popular Zukauskas [17] correlation was used; see Table 2. The Reynolds number was then varied for each pitch ratio, and the resulting Nusselt number calculations are shown in Figure 6 alongside the Zukauskas correlation. In many cases, the results were quite close, and the difference between numerical and published values was less than 20% in all cases, except a few. As can be seen from Figure 6a, the difference between the numerical and published values for this case was about 23%. The pitch ratio of 1.3 was very small, and such a low pitch ratio acted to push boundary layers out to a less resolved portion of the mesh, decreasing accuracy somewhat. This was the worst data point in terms validation; on average, experimental and numerical data agreed to within 10%.
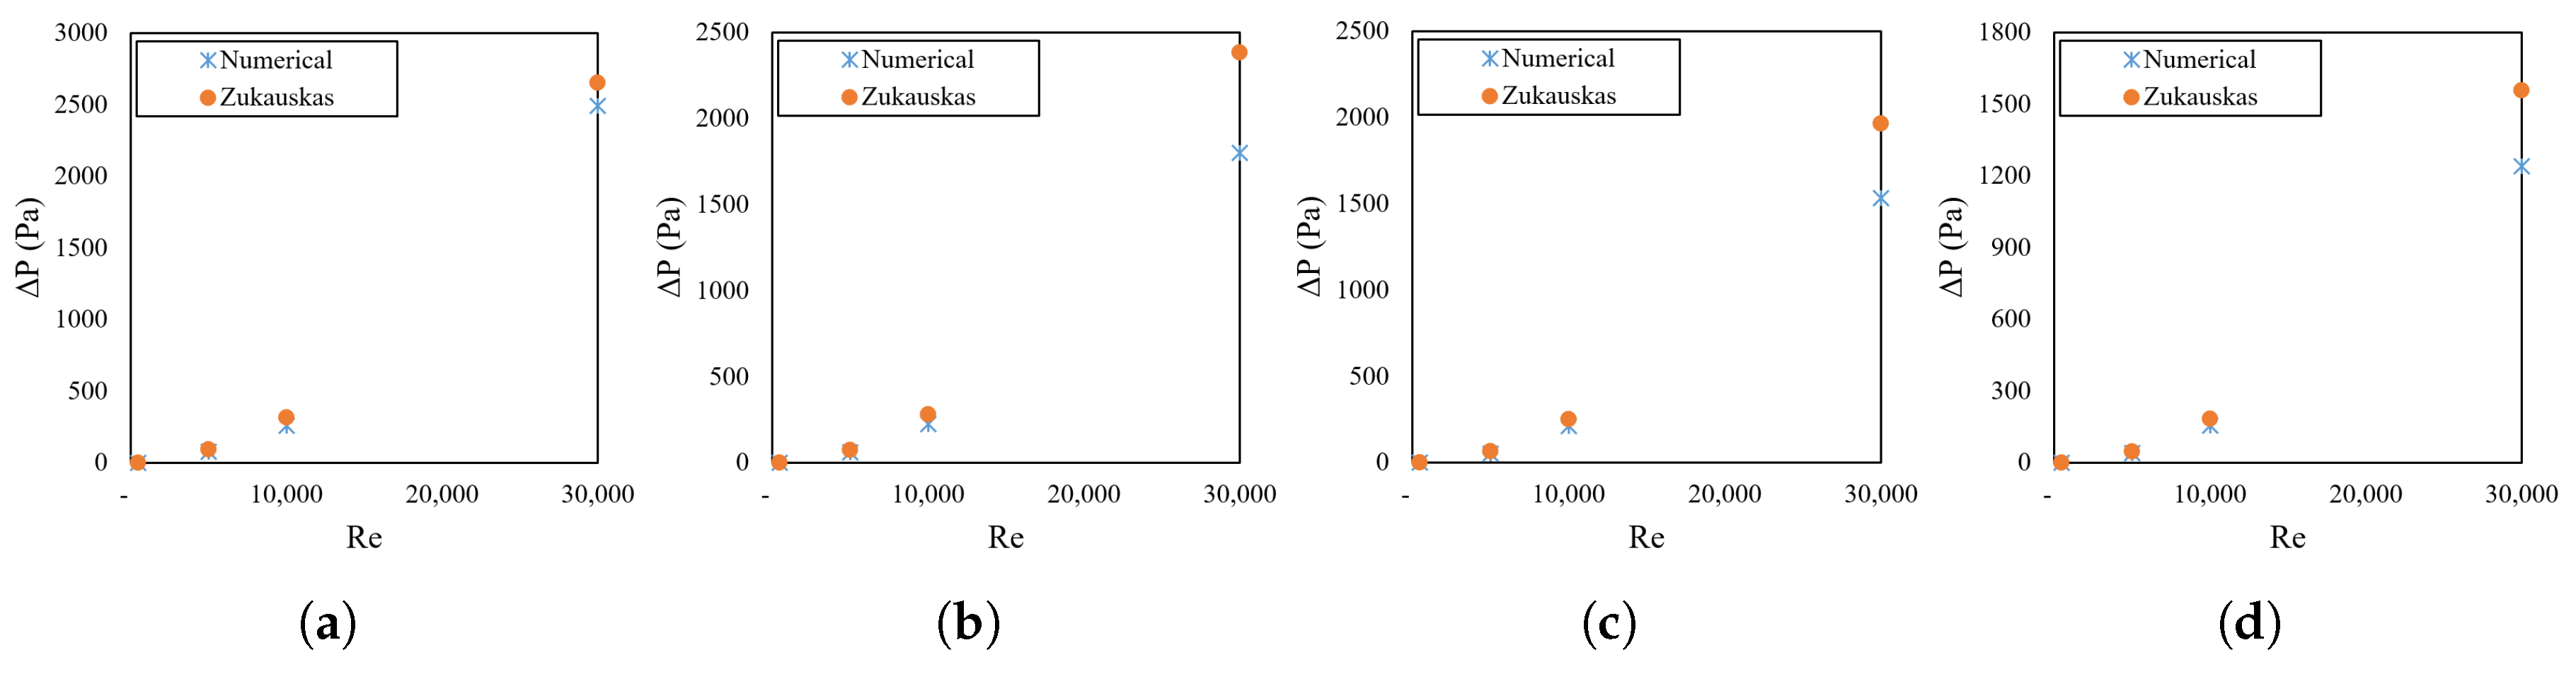
Since viscous dissipation (i.e., pressure drop) is an important factor in thermodynamic analysis, we validated the results comparing the pressure losses between the inlet and the exit of the tube array. Equation (27) indicates an analytical relation for pressure drop in tube banks. In this equation, f and represent the friction factor and the correction factor, respectively. These values can be obtained from a graph provided by Zukauskas and Ulinskas [18]. Moreover, the maximum velocity of the air, which takes place between the tubes, was used corresponding to the Reynolds number. After calculating the pressure drop using Equation (27), the results were compared with the ones obtained using Fluent. In Fluent, the area-weighted-average values of the pressure were recorded at the inlet and outlet of the tube bank. Figure 7 indicates the comparison of the numerical and analytical result of the pressure drop. It can be seen from the graph that the difference between the numerical and published values was less than 20% for most cases, except a few. Although a high Reynolds number, 30,000, was used in this study, the highest difference between the published value was no more than 24% for this Reynolds number. Therefore, it can be said that there was a good agreement between the published values for Nusselt number, as well as pressure drop.
Lastly, it should be noted that, although all cases compared very favorably with the reference data, only the eight-cylinder case had been discussed here for validation purposes, as it had by far the worst agreement among all cases considered.
4.2. Thermodynamics Results
4.2.1. Energy Analysis
Thermodynamics analyses were investigated using Equations (6)–(22). The primary purpose here was to investigate how energy and exergy efficiencies change with respect to the Reynolds number, pitch ratio and number of tubes. Energy efficiency, one of the most important parameters to assess the performance of a system [26], depends on the heat transfer to the cylinders, viscous dissipation and heat leakage from the system to the environment.
The energy efficiencies, as calculated in this study, ranged from 72.17–98.27%. The lowest energy efficiency was obtained for a domain that had three in-line cylinders, a pitch ratio of 3.0 and a Reynolds number of 30,000. The highest occurred with eight cylinders, a pitch ratio of 1.3 and a Reynolds number of 5000.
Figure 8a–c compare the energy efficiencies in terms of pitch ratio and Reynolds numbers for eight, four and three in-line tubes, respectively. As can be seen from the figures, all three graphs had similar trends. Whereas the highest energy efficiencies were obtained with Re = 5000 for some cases, the differences in the efficiency values were relatively close when comparing Re = 5000 and Re = 10,000. The main reason for this is explained by looking at Table 3. It is also noted that viscous dissipation had a considerable effect on the energy efficiency for high Reynolds number cases, for instance the proportion of it was more than 19% for the pitch ratio of 3.0 and Re = 30,000. This is not surprising since viscous dissipation depends on volumetric flow rate and average pressure difference, both of which are increased with higher Re.
Figure 8d–f show the energy efficiency according to four different Reynolds numbers, four different pitch ratios and three different inline tube numbers. Viewing these graphs and comparing again to Table 3, the energy efficiencies decreased with increasing pitch ratios since both heat leakage and viscous dissipation were high for these cases. It is also interesting that, although the pressure difference was higher for small pitch ratio cases, there was less viscous dissipation due to a lower volumetric flow rate.
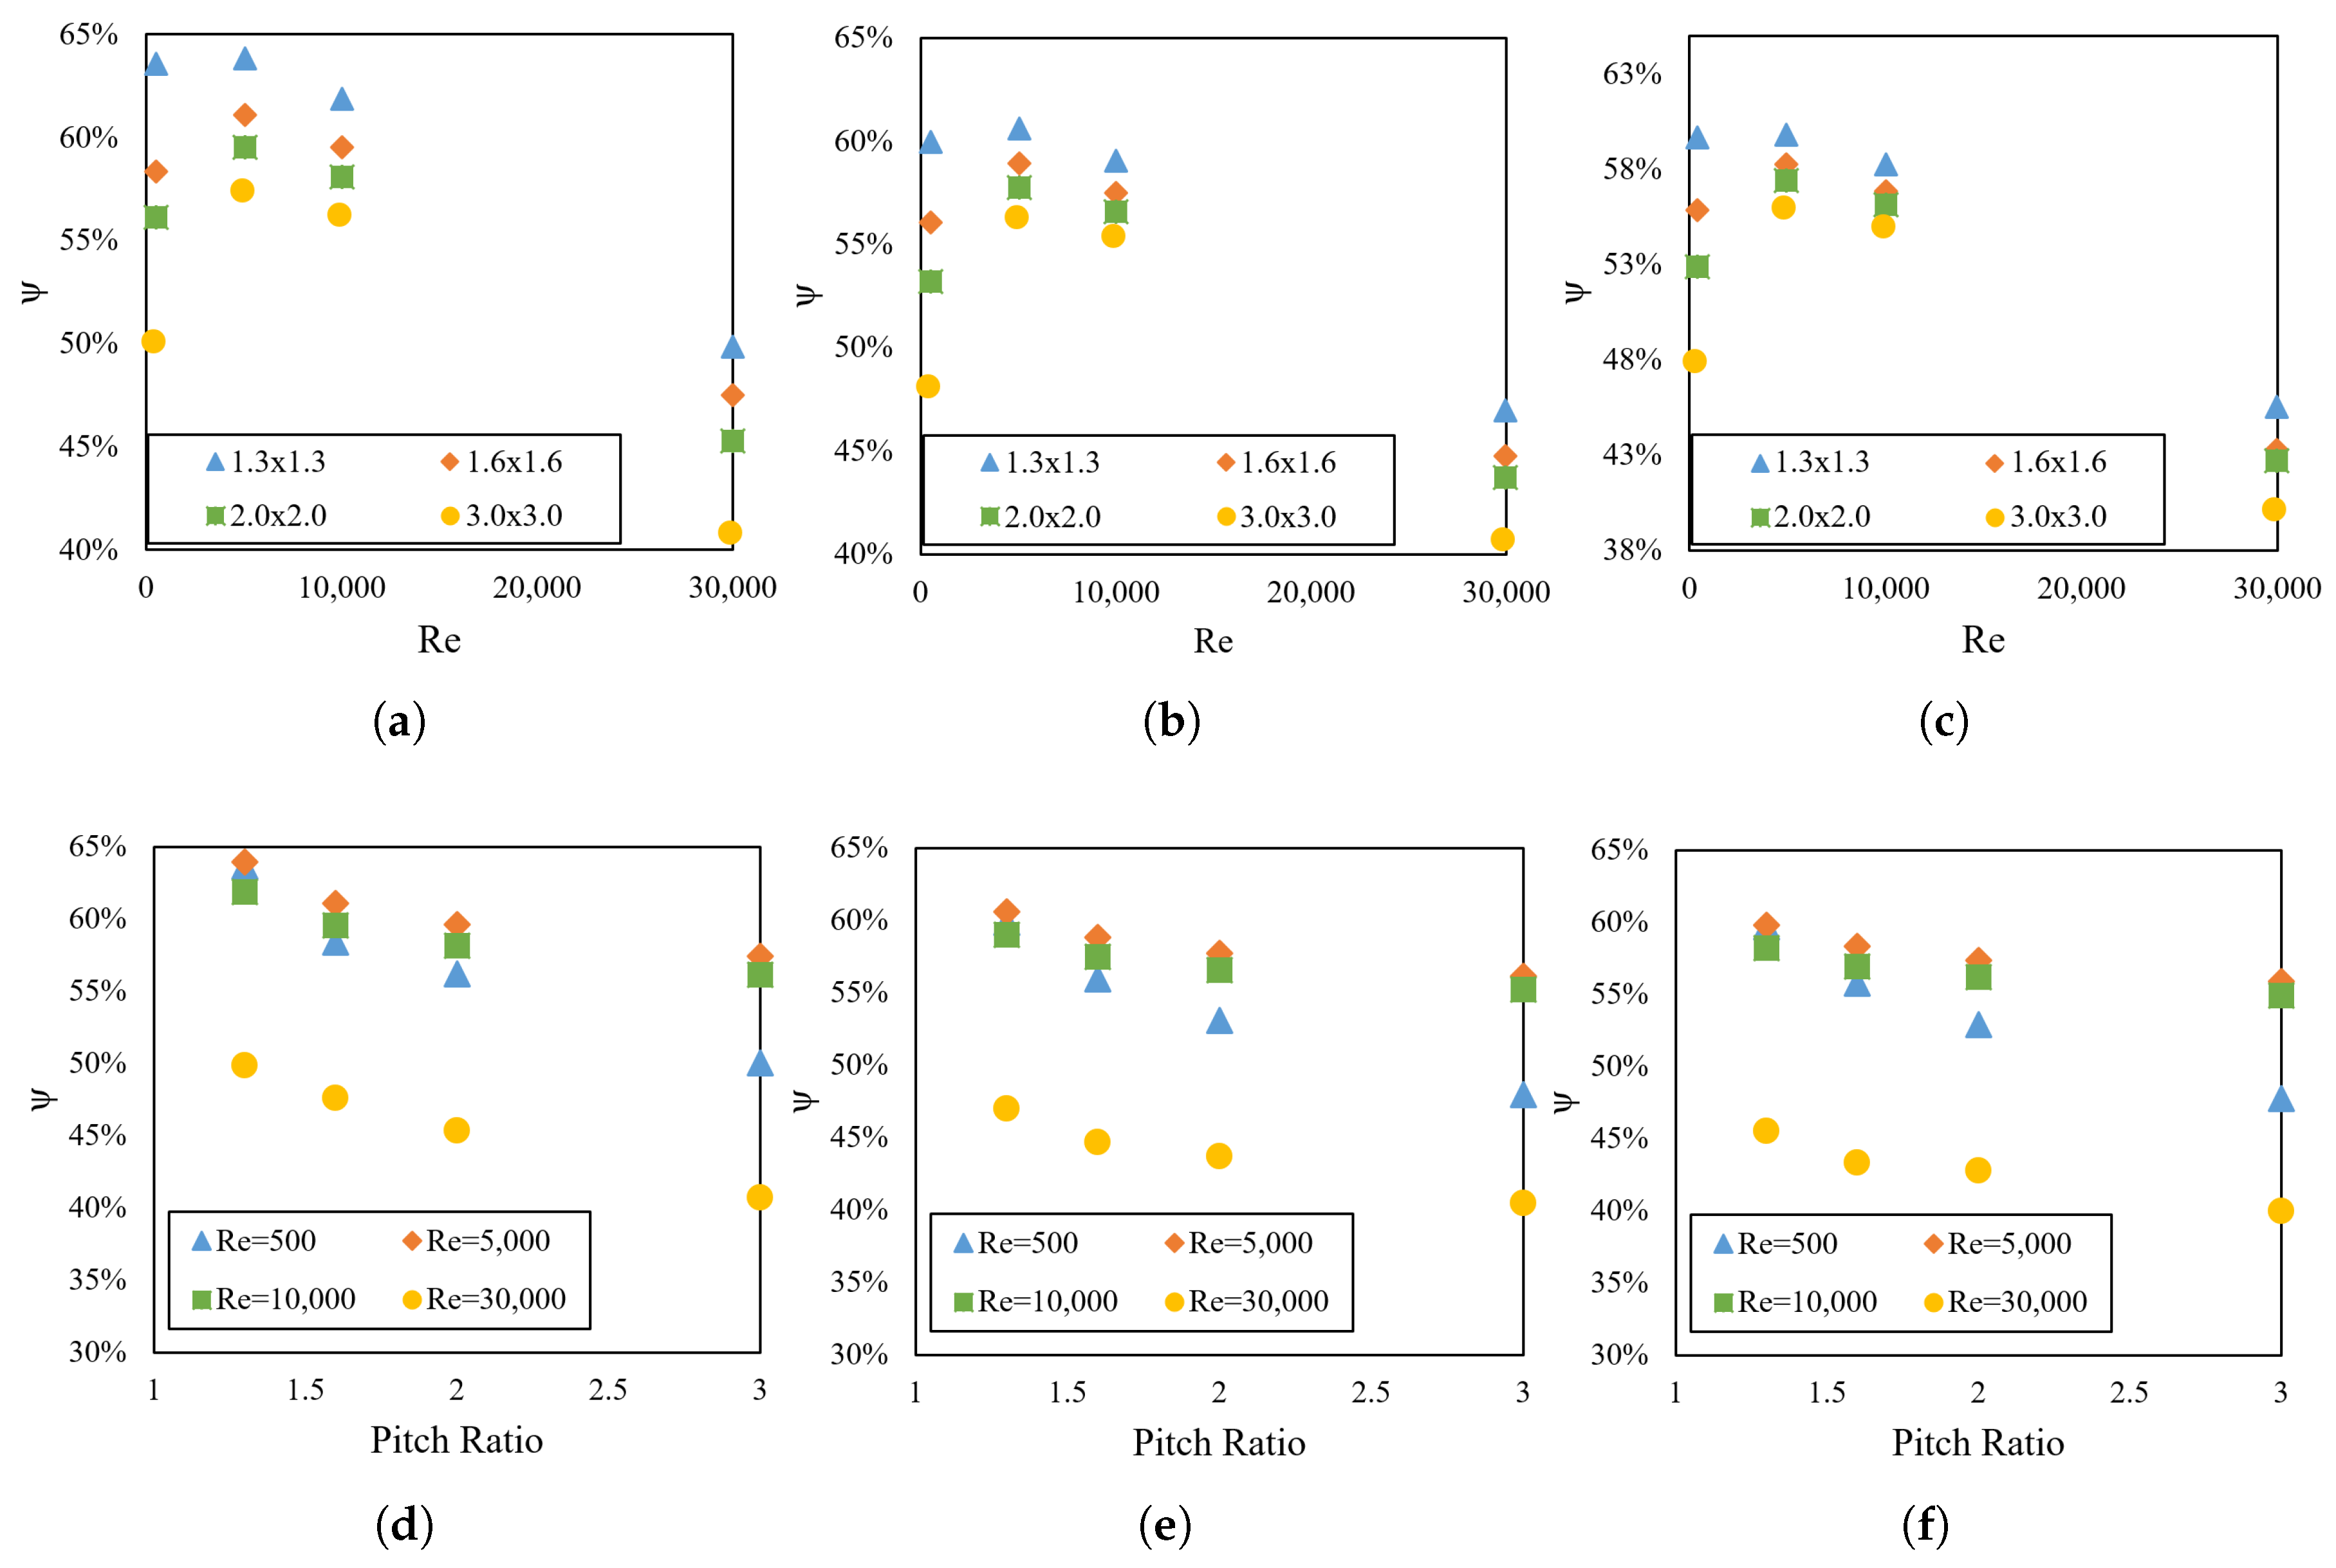
4.2.2. Exergy Analysis
Exergy efficiency calculations were also performed according to Equation (22). The exergy efficiencies in this study ranged from 40–64%, generally much lower than the corresponding energy efficiencies. This disparity was a direct result of exergy destruction, which arose due to irreversibilities in real processes [26] and calculated according to Equations (16)–(21). In most cases, entropy generation due to viscous dissipation was not significant; however, it was a crucial parameter for those systems, especially for high Reynolds numbers. Table 4 shows the ratio of the entropy generation due to viscous dissipation to the total entropy generation. It is evident here that the ratio increased with increasing Reynolds number. It is surprising that, even though the pressure difference was lower for three in-line tubes, the entropy generation ratio due to viscous dissipation was the highest because of the low heat transfer effect in total entropy generation. Increasing the number of cylinders in a domain resulted in more convective heat transfer, leading to higher entropy generation; however, the viscous dissipation effect on the total entropy generation decreased with increasing number of cylinders.
Figure 9a–c compare the exergy efficiencies of different tube banks in terms of pitch ratios, number of in-line cylinders and Reynolds numbers. Recall that several of the highest energy efficiencies were obtained at 5000 Reynolds numbers cases; here, they are also generally found at the same Re = 5000. It should be noted that exergy efficiency differences between the lowest and highest were very high compared with the energy analysis; hence, it can be said that viscous dissipation played a key role in exergy efficiency especially for high Reynolds numbers. Surprisingly, the lowest pitch ratios attained the highest exergy efficiencies, due to the high effect of heat leakage and destructed exergy on the efficiency calculation.
Analyzing heat leakage effects into the system, it is apparent that increasing the dimensionless pitch ratio caused an increase in heat leakage that led to more entropy generation and, hence, lower exergy efficiency.
Figure 9d–f show the exergy efficiencies for eight, four and three in-line tubes according to the pitch ratio for different Reynolds numbers, respectively. As mentioned above, the effect of viscous dissipation was more obvious for high Reynolds numbers. At Re = 30,000, the exergy efficiency was almost half that for the other three Reynolds numbers. Heat leakage effects in exergy analysis became more severe than with energy, especially comparing Reynolds numbers of 5000 and 10,000. While the energy efficiencies were very close for these two Reynolds numbers, exergy efficiency differences were much greater due to the heat leakage effect. Lastly, there was an inverse ratio between the exergy efficiency and dimensionless pitch ratio, as it was in energy efficiency. The reason for this was due to the increase in volumetric flow rate; here, flow rate and associated dissipation carried a higher weight than in the energy analysis, more so than the pressure differential.
Exergy analysis was more useful than energy for evaluating the thermal efficiency of heat transfer problems since it measured the locations, types and magnitudes of waste and losses. Furthermore, exergy analysis represented how close a system was to the ideal. Many researchers have shown that exergy analysis gives a better understanding of the thermodynamic efficiency of a system due to the fact that the while first law of thermodynamics does not depend on the reference environment, the second law is a property of both the reference environment and a system. Furthermore, second law analysis provides meaningful information on the degradation of energy or resources during a process. Lastly, exergy is a measure of quality, as well as quantity. Kanoglu et al. [27] claimed that exergy analysis is based on the combination of the first and second law of thermodynamics. It is also obvious from the results that while the highest energy efficiency was found to be 98%, which is not highly realistic, exergy efficiency was found to be 64% due to exergy destruction for the same case.
5. Conclusions
In this study, both numerical and thermodynamics analyses of in-line tube banks were investigated. ANSYS Fluent 18.2 was used to create the geometry and solve the transient computational problem. Air was selected as the heat transfer fluid with an inlet temperature of 400 K, corresponding to typical low-temperature waste heat temperatures, and several simulations were conducted varying the Reynolds number, pitch ratio and number of cylinders. The Reynolds numbers varied between 500 and 30,000, the pitch ratio between 1.3–3.0 and the number of tubes between 3 and 8. Most simulations completed in 1.5–2 h of real time, and 48 simulations were run in total. In order to validate the results, Nusselt number values were compared to experimental data with good agreement. Grid independence and time-step independence studies were conducted in order to ensure the validity of the model. The model, while transient in nature, produced steady results, and steady-state thermodynamic calculations were performed using time-averaged values only after steady results were realized.
The main findings of this study can be summarized as follows:
- Although some other studies [28] indicated energy efficiencies over 99%, the values from this study varied from 72–98.3%. This is mainly due to the artificial introduction of heat leakage and the consideration of viscous dissipation. The highest energy efficiencies were obtained at a Reynolds number of 5000 for each case because the effect of viscous dissipation did not have a considerable effect on the total energy efficiency for low Reynolds numbers. Energy efficiencies were also compared for different pitch ratios at the same Reynolds numbers, and it was found that energy efficiency decreased with increasing pitch ratios. Moreover, increasing the number of inline tubes increased the energy efficiency because of high convective heat transfer.
- Exergy efficiencies, on the other hand, ranged from 40–64%. They were lower than the corresponding energy efficiencies because of exergy destruction and heat leakage. The highest effect of entropy generation due to viscous dissipation was found with three cylinders due to the fact that the viscous effect was higher than the heat transfer effect on the total entropy generation. Furthermore, the highest exergy efficiency was obtained at a Reynolds number of 5000. Although the energy efficiency and exergy efficiency trends were very similar, the difference between the highest and lowest efficiencies was considerably higher in the exergy case. Therefore, it can be said that viscous dissipation has more effect on exergy efficiency than energy efficiency.
Author Contributions
M.E. designed the computational model, performed the simulations, validated and analyzed the results as well as wrote and edited the article; D.W.M. managed the project, reviewed and edited the article.
Acknowledgments
This research was funded in part by a fellowship from Turkish Ministry of National Education to M.E.
Conflicts of Interest
The authors declare no conflict of interest.
References
- Fowler, A.J.; Bejan, A. Correlation of optimal sizes of bodies with external forced convection heat transfer. Int. Commun. Heat Mass Transf. 1994, 21, 17–27. [Google Scholar] [CrossRef]
- Korukcu, M. 2D Temperature Analysis of Energy and Exergy Characteristics of Laminar Steady Flow across a Square Cylinder under Strong Blockage. Entropy 2015, 17, 3124–3151. [Google Scholar] [CrossRef]
- Melhem, O.A.; Sahin, A.Z.; Yilbas, B.S. Entropy Generation Due To External Fluid Flow and Heat Transfer From a Cylinder Between Parallel Planes. Therm. Sci. 2017, 21, 841–848. [Google Scholar] [CrossRef]
- Abu-Hijleh, B. Entropy Generation in Laminar Convection from an Isothermal Cylinder in Cross Flow. Energy 1998, 23, 851–857. [Google Scholar] [CrossRef]
- Poulikakos, D.; Johnson, J.M. Second law analysis of combined heat and mass transfer phenomena in external flow. Energy 1989, 14, 67–73. [Google Scholar] [CrossRef]
- Ibrahim, E.; Moawed, M. Forced convection and entropy generation from elliptic tubes with longitudinal fins. Energy Convers. Manag. 2009, 50, 1946–1954. [Google Scholar] [CrossRef]
- Khan, W.A.; Culham, J.R.; Yovanovich, M.M. Optimal Design of Tube Banks in Crossflow Using Entropy Generation Minimization Method. J. Therm. Heat Transf. 2007, 21, 372–378. [Google Scholar] [CrossRef] [Green Version]
- Gharbi, N.E.; Kheiri, A.; Ganaoui, M.E.; Blanchard, R. Numerical optimization of heat exchangers with circular and non-circular shapes. Case Studies Therm. Eng. 2015, 6, 194–203. [Google Scholar] [CrossRef]
- Khan, W.A.; Culham, J.R.; Yovanovich, M.M. The Role of Fin Geometry in Heat Sink Performance. J. Electron. Packag. 2006, 128, 324–330. [Google Scholar] [CrossRef]
- Cuce, P.M.; Riffat, S. A comprehensive review of heat recovery systems for building applications. Renew. Sustain. Energy Rev. 2015, 47, 665–682. [Google Scholar] [CrossRef]
- Pandiyarajan, V.; Chinna Pandian, M.; Malan, E.; Velraj, R.; Seeniraj, R.V. Experimental investigation on heat recovery from diesel engine exhaust using finned shell and tube heat exchanger and thermal storage system. Appl. Energy 2011, 88, 77–87. [Google Scholar] [CrossRef]
- Bari, S.; Hossain, S.N. Waste heat recovery from a diesel engine using shell and tube heat exchanger. Appl. Therm. Eng. 2013, 61, 355–363. [Google Scholar] [CrossRef]
- Wang, D.; Ling, X.; Peng, H.; Liu, L.; Tao, L. Efficiency and optimal performance evaluation of organic Rankine cycle for low grade waste heat power generation. Energy 2013, 50, 343–352. [Google Scholar] [CrossRef]
- Mohammadi, A.; Ashjari, M.A.; Sadreddini, A. Exergy analysis and optimisation of waste heat recovery systems for cement plants. Int. J. Sustain. Energy 2016, 37, 115–133. [Google Scholar] [CrossRef]
- Maatouk, C.; Slim, R. Exergy And Energy Analysis Of Waste Heat Recovery Options For Cooling Capacity Production. In Proceedings of the 15th International Refrigeration and Air Conditioning Conference at Purdue, Mar Roukos, Mkalle’s, Lebanon, 14–17 July 2014. [Google Scholar]
- López, L.; Blanco, J.M.; Bonilla, J.J.; Bacza, S.; Sala, J.M. Determination of energy and exergy of waste heat in the industry of the Basque country. Appl. Therm. Eng. 1998, 18, 187–197. [Google Scholar] [CrossRef]
- Žkauskas, A. Heat Transfer from Tubes in Crossflow. Adv. Heat Transf. 1987, 18, 87–159. [Google Scholar]
- Žkauskas, A.; Ulinskas, R. Efficiency Parameters for Heat Transfer in Tube Banks. Heat Transf. Eng. 1985, 6, 19–25. [Google Scholar] [CrossRef]
- Khan, W.A.; Culham, J.R.; Yovanovich, M.M. Convection heat transfer from tube banks in crossflow: Analytical approach. Int. J. Heat Mass Transf. 2006, 49, 4831–4838. [Google Scholar] [CrossRef]
- ANSYS, Inc. ANSYS FLUENT User’s Guide; ANSYS, Inc.: Canonsburg, PA, USA, 2011. [Google Scholar]
- Bahaidarah, H.M.S.; Ijaz, M.; Anand, N.K. Numerical Study of Fluid Flow and Heat Transfer Over a Series of In-Line Noncircular Tubes Confined in a Parallel-Plate Channel. Numerical Heat Transf. 2006, 50, 97–119. [Google Scholar] [CrossRef]
- Sayed Ahmed, S.A.; Mesalhy, O.M.; Abdelatief, M.A. Effect of Longitudinal-External-Fins on Fluid Flow Characteristics for Wing-Shaped Tubes Bundle in Crossflow. J. Therm. 2015. [Google Scholar] [CrossRef]
- Ibrahim, T.A.; Gomaa, A. Thermal performance criteria of elliptic tube bundle in crossflow. Int. J. Therm. Sci. 2009, 48, 2148–2158. [Google Scholar] [CrossRef]
- Sayed Ahmed, S.A.; Ibrahiem, E.Z.; Mesalhy, O.M.; Abdelatief, M.A. Effect of attack and cone angels on air flow characteristics for staggered wing shaped tubes bundle. Heat Mass Transf. 2015, 51, 1001–1016. [Google Scholar] [CrossRef]
- Mangrulkar, C.K.; Dhoble, A.S.; Chakrabarty, S.G.; Wankhede, U.S. Experimental and CFD prediction of heat transfer and friction factor characteristics in cross flow tube bank with integral splitter plate. Int. J. Heat Mass Transf. 2017, 104, 964–978. [Google Scholar] [CrossRef]
- MacPhee, D.; Dincer, I.; Beyene, A. Numerical simulation and exergetic performance assessment f charging process in encapsulated ice thermal energy storage system. Energy 2012, 41, 491–498. [Google Scholar] [CrossRef]
- Kanoglu, M.; Cengel, Y.A.; Dincer, I. Efficiency Evaluation of Energy Systems; Springer: New York, NY, USA, 2012. [Google Scholar]
- MacPhee, D.; Dincer, I. Thermodynamic Analysis of Freezing and Melting Processes in a Bed of Spherical PCM Capsules. J. Sol. Energy Eng. 2009, 131. [Google Scholar] [CrossRef]
Figure 1.
Geometry and boundary conditions.
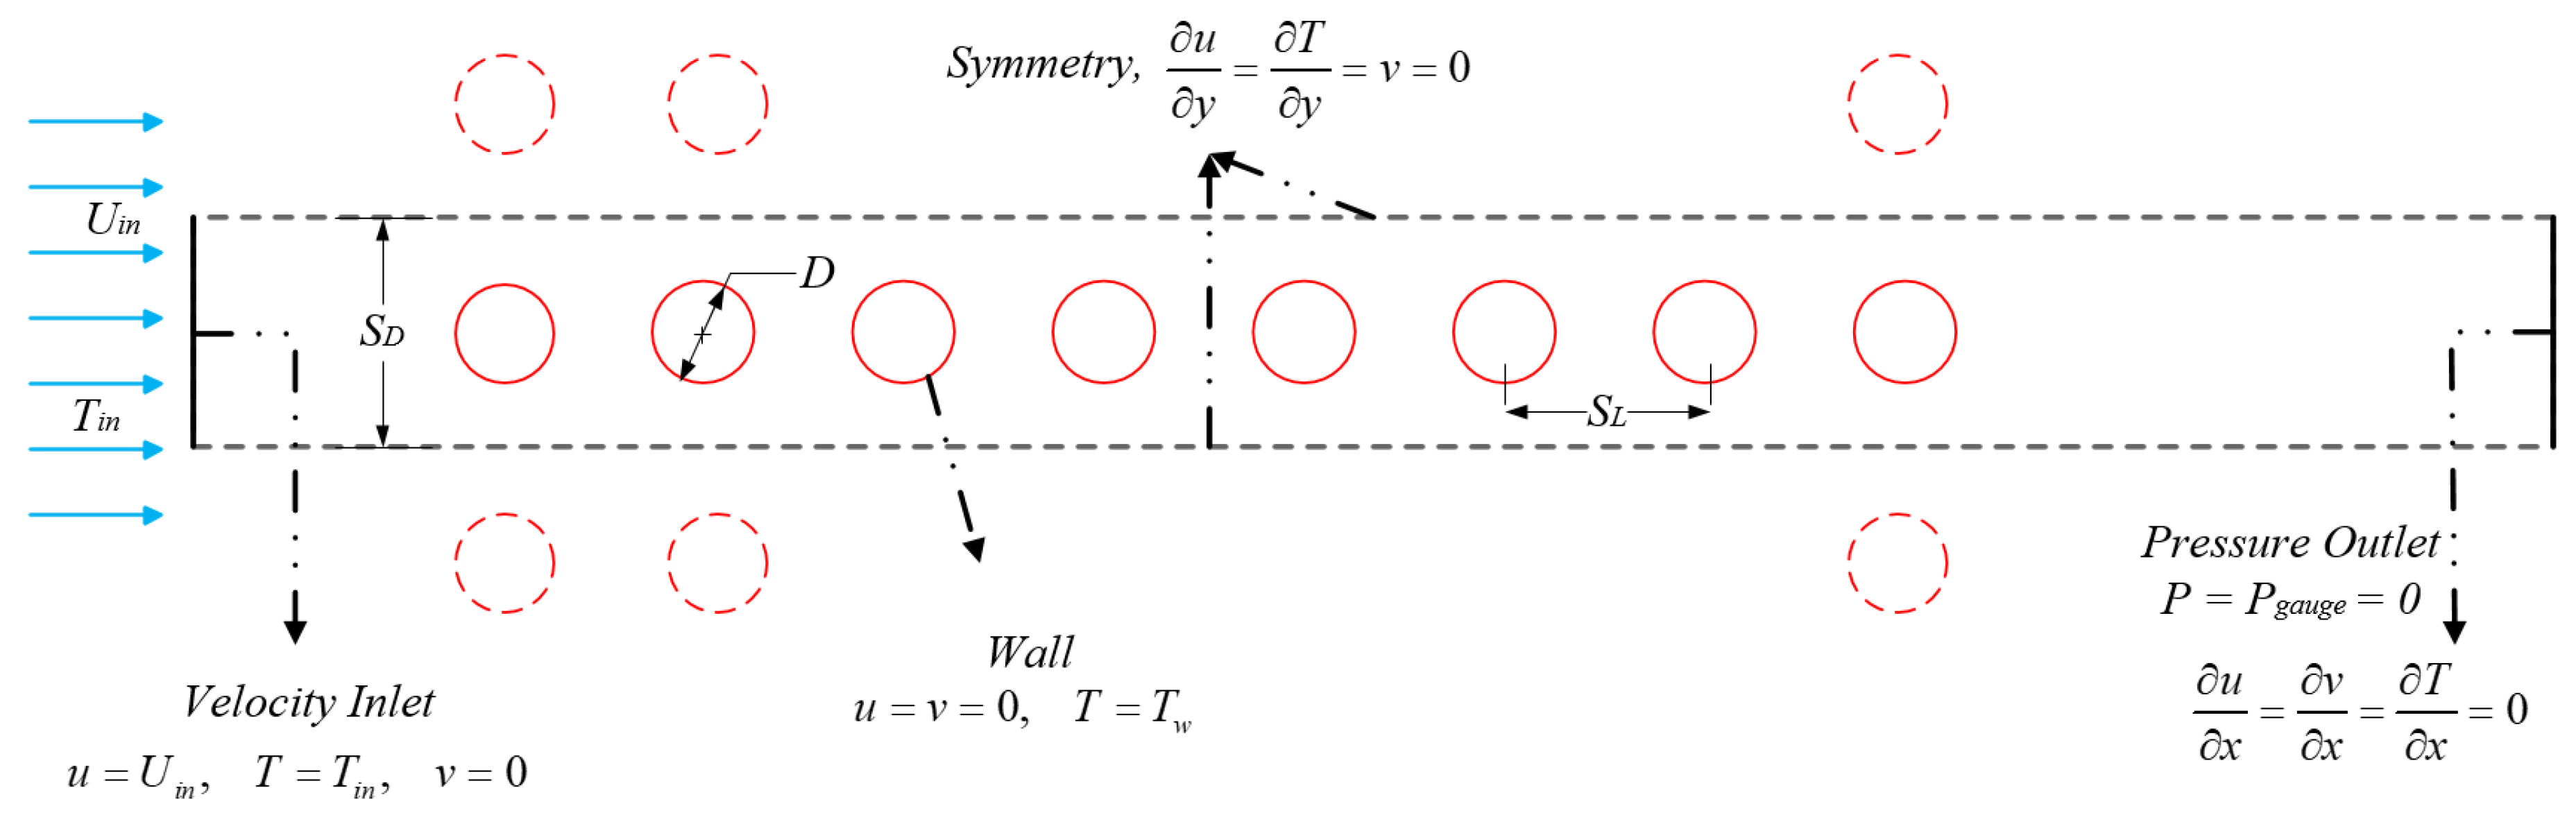
Figure 2.
Overall mesh generation for a 1.6 × 1.6 pitch ratio.

Figure 3.
Close-up of the mesh near the cylindrical surface.

Figure 4.
Independence studies. (a) Grid Independence; (b) Time Independence.

Figure 5.
Temperature contour for different time step sizes (top = 0.5 s, middle = 0.01 s, bottom = 0.005 s)
Figure 5.
Temperature contour for different time step sizes (top = 0.5 s, middle = 0.01 s, bottom = 0.005 s)

Figure 6.
Nusselt number validation. (a) 1.3 Pitch Ratio; (b) 1.6 Pitch Ratio; (c) 2.0 Pitch Ratio; (d) 3.0 Pitch Ratio.
Figure 6.
Nusselt number validation. (a) 1.3 Pitch Ratio; (b) 1.6 Pitch Ratio; (c) 2.0 Pitch Ratio; (d) 3.0 Pitch Ratio.
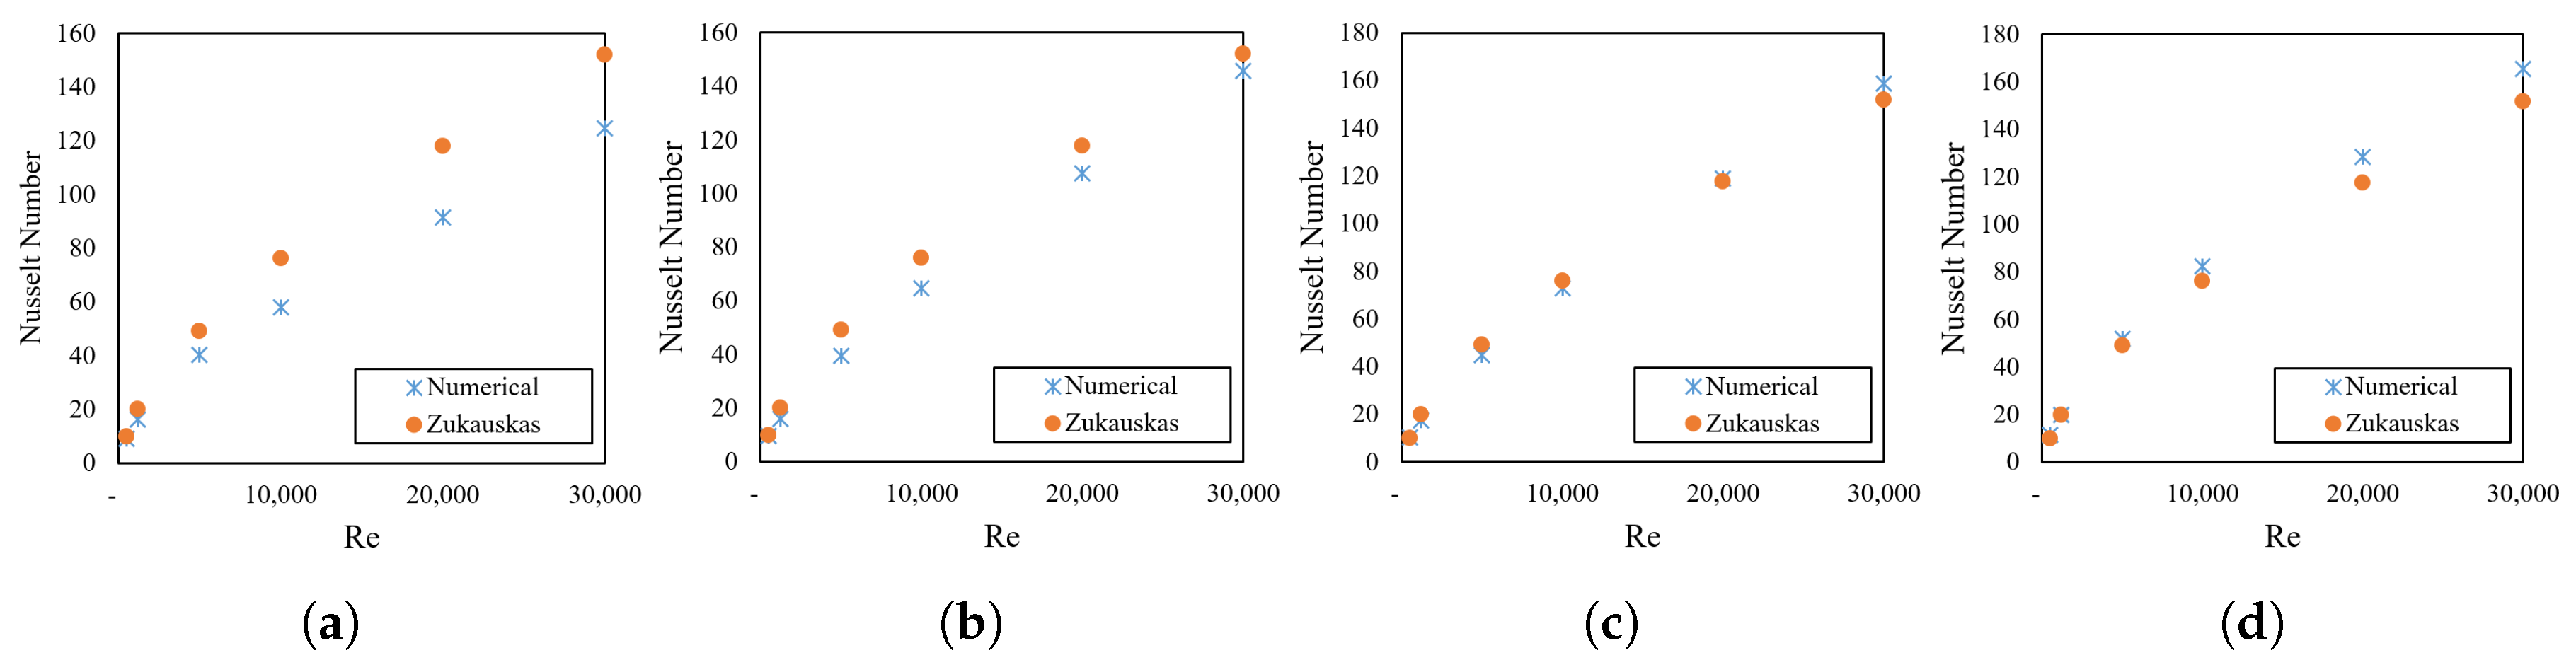
Figure 7.
Pressure drop validation. (a) 1.3 Pitch Ratio; (b) 1.6 Pitch Ratio; (c) 2.0 Pitch Ratio; (d) 3.0 Pitch Ratio.
Figure 7.
Pressure drop validation. (a) 1.3 Pitch Ratio; (b) 1.6 Pitch Ratio; (c) 2.0 Pitch Ratio; (d) 3.0 Pitch Ratio.

Figure 8.
Energy efficiency for (a) 8 tubes, (b) 4 tubes and (c) 3 tubes varying the Reynolds number for all four pitch ratios. (d–f) show the same 8-, 4- and 3-tube cases while varying the pitch ratio for four different Reynolds numbers.
Figure 8.
Energy efficiency for (a) 8 tubes, (b) 4 tubes and (c) 3 tubes varying the Reynolds number for all four pitch ratios. (d–f) show the same 8-, 4- and 3-tube cases while varying the pitch ratio for four different Reynolds numbers.
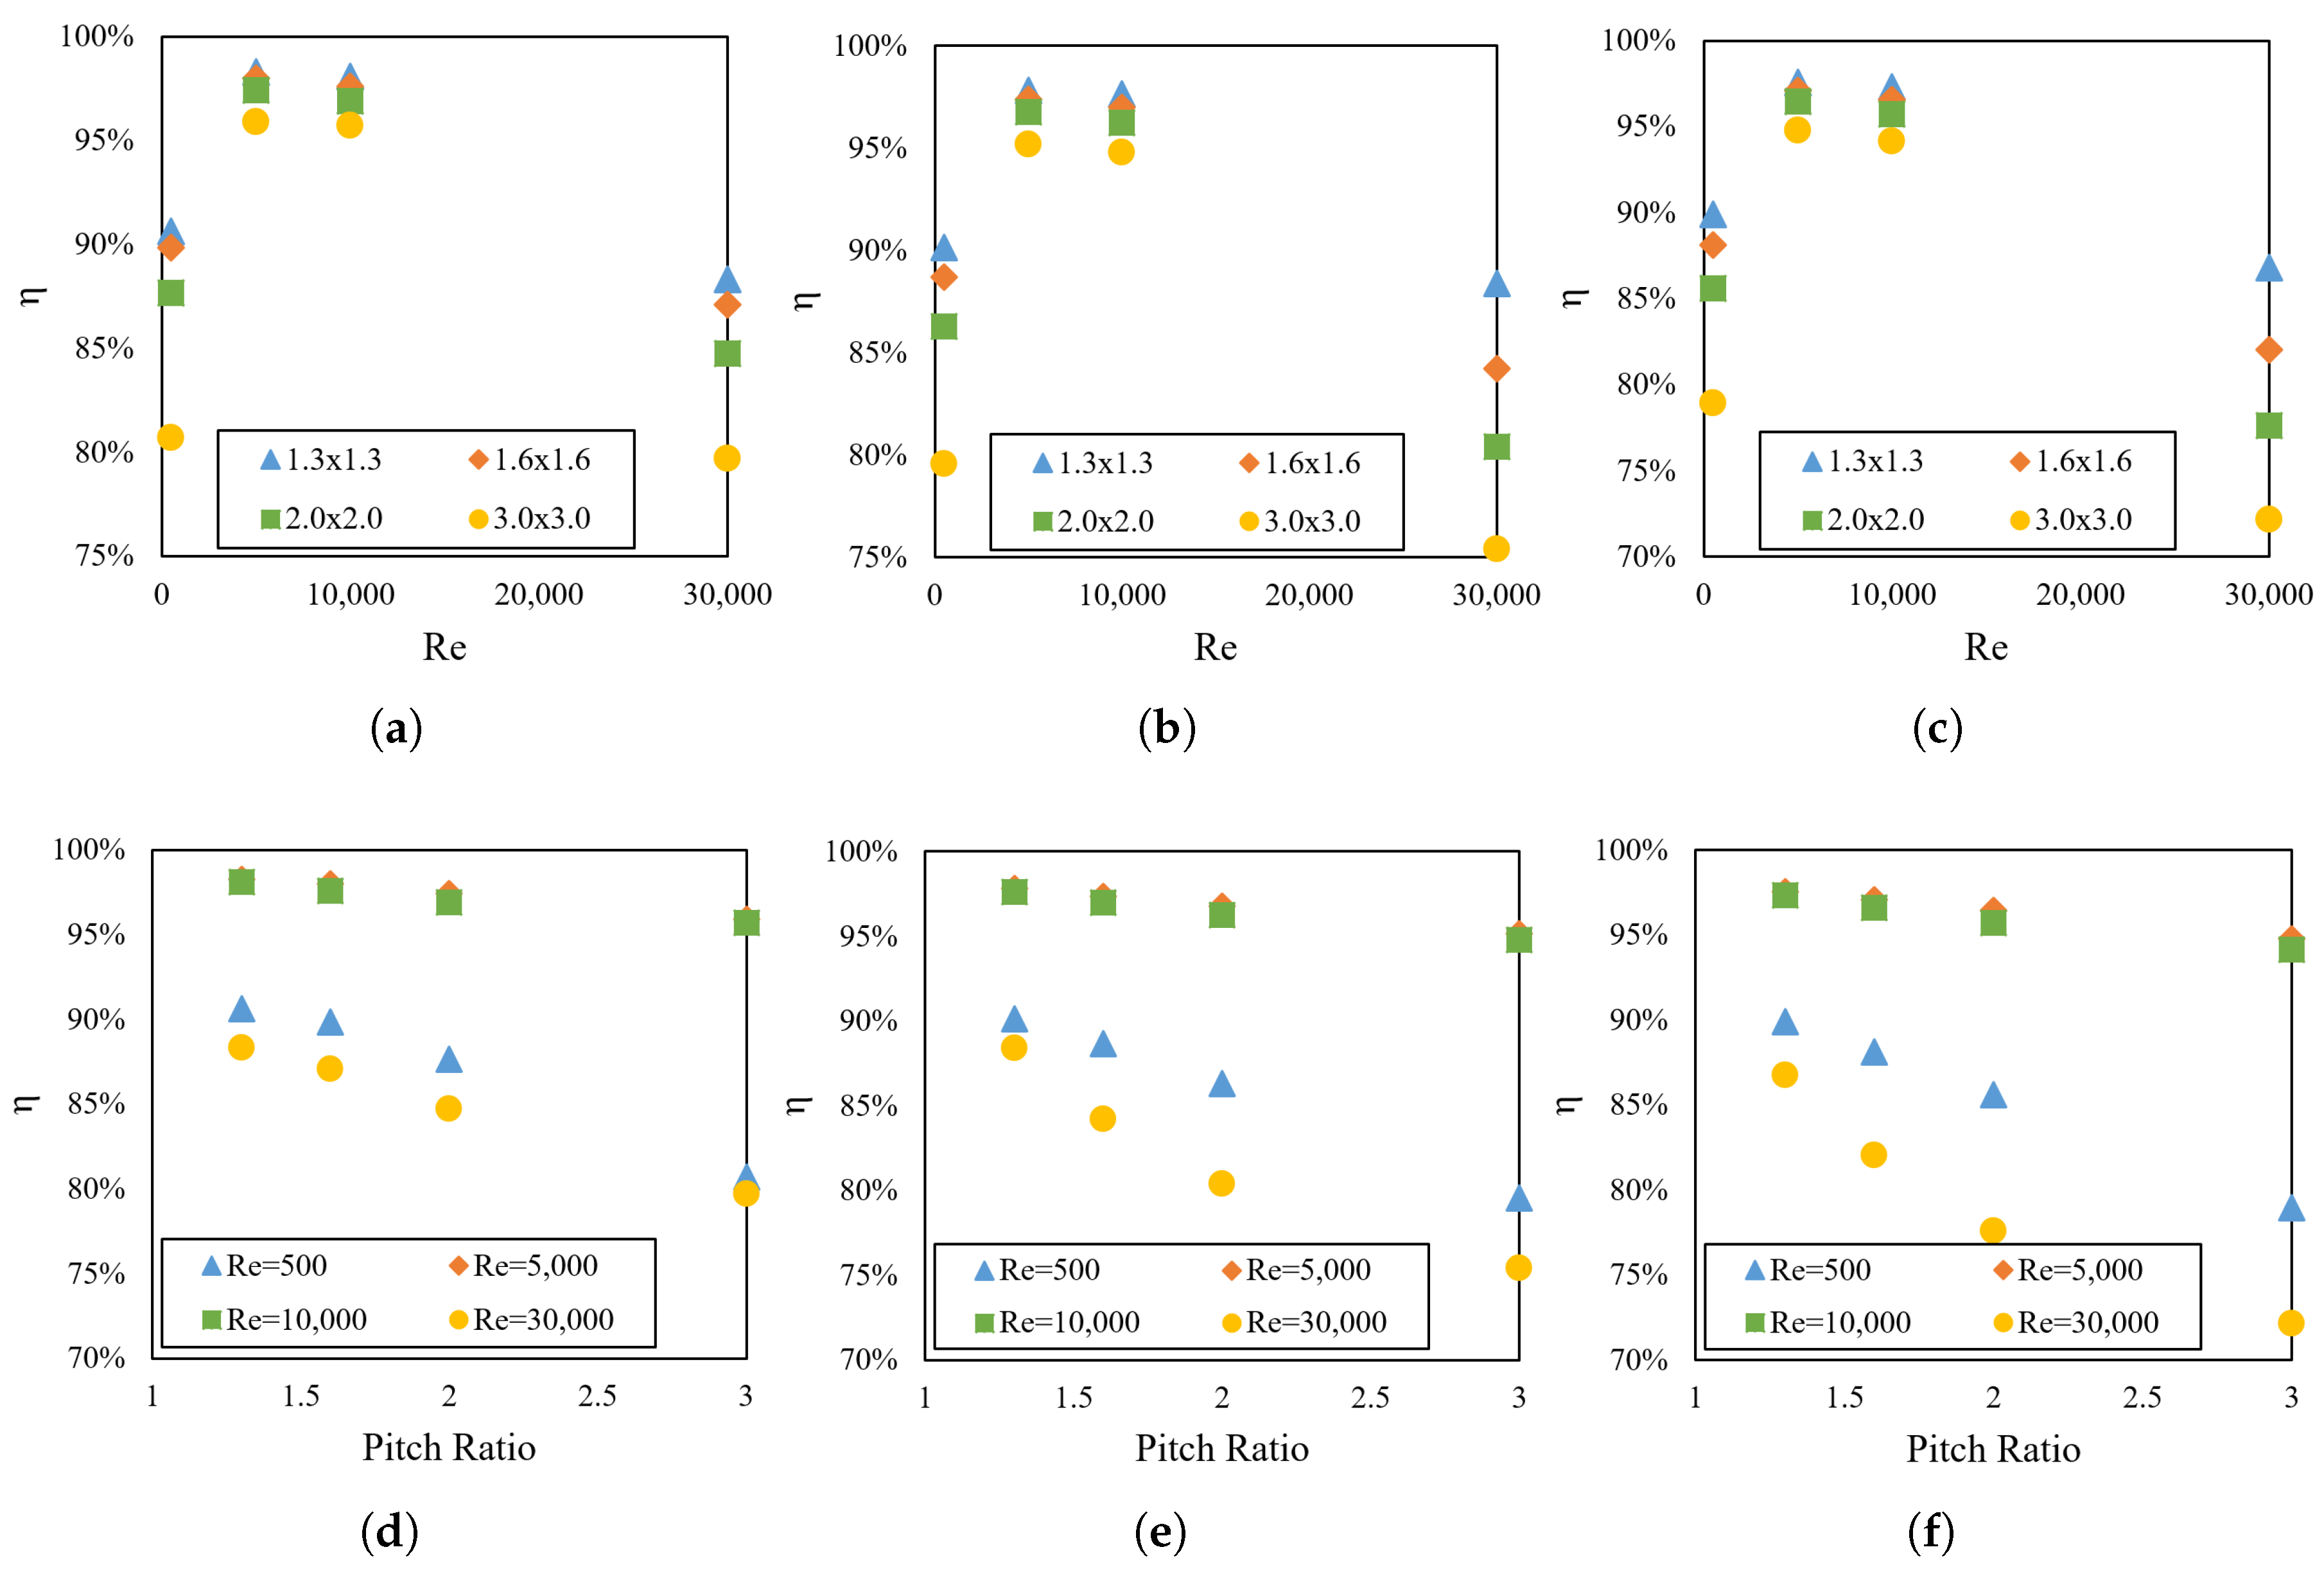
Figure 9.
Exergy efficiency for (a) 8 tubes, (b) 4 tubes and (c) 3 tubes varying the Reynolds number for all four pitch ratios. (d–f) show the same 8-, 4- and 3-tube cases while varying the pitch ratio.
Figure 9.
Exergy efficiency for (a) 8 tubes, (b) 4 tubes and (c) 3 tubes varying the Reynolds number for all four pitch ratios. (d–f) show the same 8-, 4- and 3-tube cases while varying the pitch ratio.


Table 1.
Thermophysical properties of the heat transfer fluid.
| Material (-) | (J/kg·K) | (kg/m) | k (W/m·K) | (Pa·s) |
|---|---|---|---|---|
| HTF (air) | 1011 | 0.897 | 0.0324 |
Table 2.
Zukauskas Nusselt number correlations.
| Nusselt Number Correlation | |
|---|---|
| 100–1000 | = 0.9 |
| 1000– | = 0.52 |
Table 3.
Effect of heat transfer, heat loss and viscous dissipation on energy efficiency (in percentage).
Table 3.
Effect of heat transfer, heat loss and viscous dissipation on energy efficiency (in percentage).
| Pitch Ratio | Reynolds Number | 8 Cylinders | 4 Cylinders | 3 Cylinders | ||||||
|---|---|---|---|---|---|---|---|---|---|---|
| HT | VD | HL | HT | VD | HL | HT | VD | HL | ||
| 1.3 × 1.3 | 500 | 90.62 | 0.00 | 9.38 | 90.14 | 0.00 | 9.85 | 89.88 | 0.00 | 10.11 |
| 5000 | 98.27 | 0.29 | 1.44 | 97.80 | 0.30 | 1.89 | 97.55 | 0.33 | 2.11 | |
| 10,000 | 98.08 | 1.11 | 0.81 | 97.63 | 1.26 | 1.12 | 97.33 | 1.41 | 1.26 | |
| 30,000 | 88.33 | 11.38 | 0.28 | 88.40 | 11.18 | 0.42 | 86.78 | 12.75 | 0.47 | |
| 500 | 89.86 | 0.00 | 10.14 | 88.67 | 0.00 | 11.33 | 88.13 | 0.00 | 11.87 | |
| 5000 | 97.97 | 0.34 | 1.69 | 97.37 | 0.40 | 2.22 | 97.08 | 0.46 | 2.46 | |
| 10,000 | 97.58 | 1.46 | 0.96 | 96.96 | 1.73 | 1.30 | 96.58 | 1.97 | 1.45 | |
| 30,000 | 87.08 | 12.57 | 0.35 | 84.23 | 15.30 | 0.47 | 82.03 | 17.45 | 0.52 | |
| 500 | 87.64 | 0.00 | 12.35 | 86.29 | 0.00 | 13.71 | 85.62 | 0.00 | 14.37 | |
| 5000 | 97.43 | 0.41 | 2.16 | 96.77 | 0.51 | 2.72 | 96.44 | 0.58 | 2.98 | |
| 10,000 | 96.88 | 1.89 | 1.23 | 96.23 | 2.20 | 1.58 | 95.73 | 2.53 | 1.74 | |
| 30,000 | 84.73 | 14.83 | 0.44 | 80.41 | 19.03 | 0.56 | 77.61 | 21.79 | 0.61 | |
| 500 | 80.70 | 0.00 | 19.30 | 79.56 | 0.00 | 20.44 | 78.94 | 0.00 | 21.05 | |
| 5000 | 95.88 | 0.51 | 3.61 | 95.16 | 0.63 | 4.21 | 94.78 | 0.70 | 4.52 | |
| 10,000 | 95.71 | 2.22 | 2.07 | 94.78 | 2.76 | 2.46 | 94.16 | 3.18 | 2.66 | |
| 30,000 | 79.70 | 19.54 | 0.75 | 75.42 | 23.69 | 0.88 | 72.17 | 26.89 | 0.93 | |
Table 4.
Total entropy generation and ratio of entropy generation due to viscous dissipation to the total.
Table 4.
Total entropy generation and ratio of entropy generation due to viscous dissipation to the total.
| No. of Cylinders | Pitch Ratio | S (W/K) | S/S | ||||||
|---|---|---|---|---|---|---|---|---|---|
| 500 | 5000 | 10,000 | 30,000 | 500 | 5000 | 10,000 | 30,000 | ||
| 8 | 0.03 | 0.31 | 0.69 | 5.71 | 0.05% | 2.74% | 8.26% | 28.68% | |
| 0.06 | 0.42 | 0.93 | 7.31 | 0.03% | 2.78% | 9.45% | 28.82% | ||
| 0.07 | 0.53 | 1.22 | 9.88 | 0.03% | 3.20% | 11.16% | 29.99% | ||
| 0.10 | 0.71 | 1.64 | 15.01 | 0.04% | 3.71% | 12.02% | 31.67% | ||
| 4 | 0.03 | 0.21 | 0.43 | 3.13 | 0.03% | 2.46% | 8.20% | 26.83% | |
| 0.04 | 0.25 | 0.55 | 4.51 | 0.03% | 3.01% | 10.16% | 30.08% | ||
| 0.05 | 0.31 | 0.69 | 6.16 | 0.02% | 3.64% | 11.97% | 32.69% | ||
| 0.06 | 0.38 | 0.90 | 8.68 | 0.03% | 4.35% | 13.89% | 34.32% | ||
| 3 | 0.02 | 0.17 | 0.35 | 2.65 | 0.03% | 2.60% | 8.79% | 27.91% | |
| 0.03 | 0.20 | 0.44 | 3.87 | 0.02% | 3.35% | 11.06% | 31.27% | ||
| 0.04 | 0.24 | 0.55 | 5.28 | 0.02% | 4.05% | 13.18% | 34.12% | ||
| 0.04 | 0.30 | 0.71 | 7.32 | 0.03% | 4.78% | 15.31% | 35.87% | ||
© 2018 by the authors. Licensee MDPI, Basel, Switzerland. This article is an open access article distributed under the terms and conditions of the Creative Commons Attribution (CC BY) license (http://creativecommons.org/licenses/by/4.0/).
Share and Cite
MDPI and ACS Style
Erguvan, M.; MacPhee, D.W. Energy and Exergy Analyses of Tube Banks in Waste Heat Recovery Applications. Energies 2018, 11, 2094. https://doi.org/10.3390/en11082094
AMA Style
Erguvan M, MacPhee DW. Energy and Exergy Analyses of Tube Banks in Waste Heat Recovery Applications. Energies. 2018; 11(8):2094. https://doi.org/10.3390/en11082094
Chicago/Turabian StyleErguvan, Mustafa, and David W. MacPhee. 2018. "Energy and Exergy Analyses of Tube Banks in Waste Heat Recovery Applications" Energies 11, no. 8: 2094. https://doi.org/10.3390/en11082094
Note that from the first issue of 2016, this journal uses article numbers instead of page numbers. See further details here.