An Experimental Investigation of Thermal Characteristics of Phase Change Material Applied to Improve the Isothermal Operation of a Refrigerator

1
Department of Mechanical System & Automotive Engineering, Graduate School of Chosun University, 303 Pilmum-Daero, Dong-gu, Gwangju 61452, Korea
2
School of Mechanical System & Automotive Engineering, Chosun University, 303 Pilmum-Daero, Dong-gu, Gwangju 61452, Korea
*
Author to whom correspondence should be addressed.
Energies 2018, 11(8), 2017; https://doi.org/10.3390/en11082017
Submission received: 16 July 2018
/
Revised: 30 July 2018
/
Accepted: 1 August 2018
/
Published: 2 August 2018
(This article belongs to the Section D: Energy Storage and Application)
Abstract
:We investigated the thermal performance of a refrigerator with a functional duct unit (FDU) which was charged with a phase change material (PCM) and designed to replace the existing expandable polystyrene (EPS) duct unit. Since the performance of the FDU is dependent upon the thermal characteristics of the PCM, the eutectic water–salt solution as the PCM was prepared and tested to optimize the thermal characteristics. The thermal properties of the PCM were examined by the T-history method. When the PCM contained 1 wt.% eutectic molten salt compounds, the phase change temperature was approximately −0.5 °C, the supercooling temperature was approximately −2.9 °C, and the latent heat was 304.9 kJ/kg. Compared with other PCMs of different eutectic molten salt concentrations, this PCM was found to have the most appropriate thermal properties for the FDU. Therefore, the PCM with 1 wt.% eutectic molten salt compounds was used in the FDU, which was installed in a 200 L top-mounted freezer (TMF). For a quantitative comparison of the operational performance, an FDU and an EPS duct were installed alternately in a refrigerator operated under the same conditions and analyzed in terms of internal temperature variation and operational characteristics. When the EPS duct was replaced by the FDU, the temperature deviation measured during a defrosting operation was observed to become smaller. Moreover, during a power outage, the refrigerator with the FDU released heat owing to the phase change of the PCM, thereby preventing temperature rise inside the refrigerator.
1. Introduction
Thermal energy storage, which uses a phase change material (PCM) to store and reuse thermal energy, is the most popular traditional energy storage technique. Moreover, as the process of energy storage and reuse through a PCM is eco-friendly, i.e., it generates no toxic chemicals, no pollutants, and no noise [1,2]. This energy storage technique is the most widely used in the building, solar energy, and textile industries [3,4,5,6]. In particular, the potential use of PCMs for residential building applications has been highlighted in recent investigations [5,6,7]. Mazzeo et al. [7,8] performed an accurate thermal analysis of a building envelope PCM layer (that were used as external walls of air-conditioned buildings) experimentally and numerically. Results obtained from their analysis clearly provided a strategic approach for the application of PCM layers to net zero energy buildings (nZEB).
Recently, the application of PCMs has also increased to improve the efficiency and static temperature function of refrigerators [9,10,11,12,13]. Oró et al. [9] examined the performance of a refrigerator, in which a 10-mm-thick stainless container with a PCM was placed on a shelf. They reported that the PCM maintained the freezer temperature of the freezer below −6 °C–4 °C even in the case of a three-hour power shutdown, thereby enabling food to be stored for a longer time. Azzouz et al. [10] attached a PCM-filled panel to the rear of the evaporator of a household refrigerator to analyze the impact of the PCM on the refrigerator efficiency. Depending on experimental conditions, as compared to the conventional refrigerators, the coefficient of performance (COP) was improved by 10–30%. Gin et al. [12] attempted to reduce intermittent heat loss due to the opening and closing of the freezer door and power shutdown by attaching PCM-filled panels to the interior side and rear of the refrigerator. As the auxiliary refrigerant, the PCM improved the energy efficiency of the freezer. Pradip et al. [11] and Cheng et al. [13] also reported similar results.
The majority of the models available in the household refrigerator market are top-mounted freezers (TMFs), side-by-side (SBS) refrigerators, and French-door refrigerators (FDRs), all of which have a large size and volume. Large refrigerators require a much longer time to restore its operating temperature after being opened and closed than small refrigerators. The accurate control of a storage temperature is also required to maintain the freshness of food for a long time. To achieve this goal, a PCM was applied to one of the conventional refrigerators as the thermal storage source, and its effectiveness was verified in this study. In contrast to previous studies [10,11,12,13], we fabricated the PCM that can be directly applied to the interior of a refrigerator, considering the operating conditions, and analyzed the thermal properties.
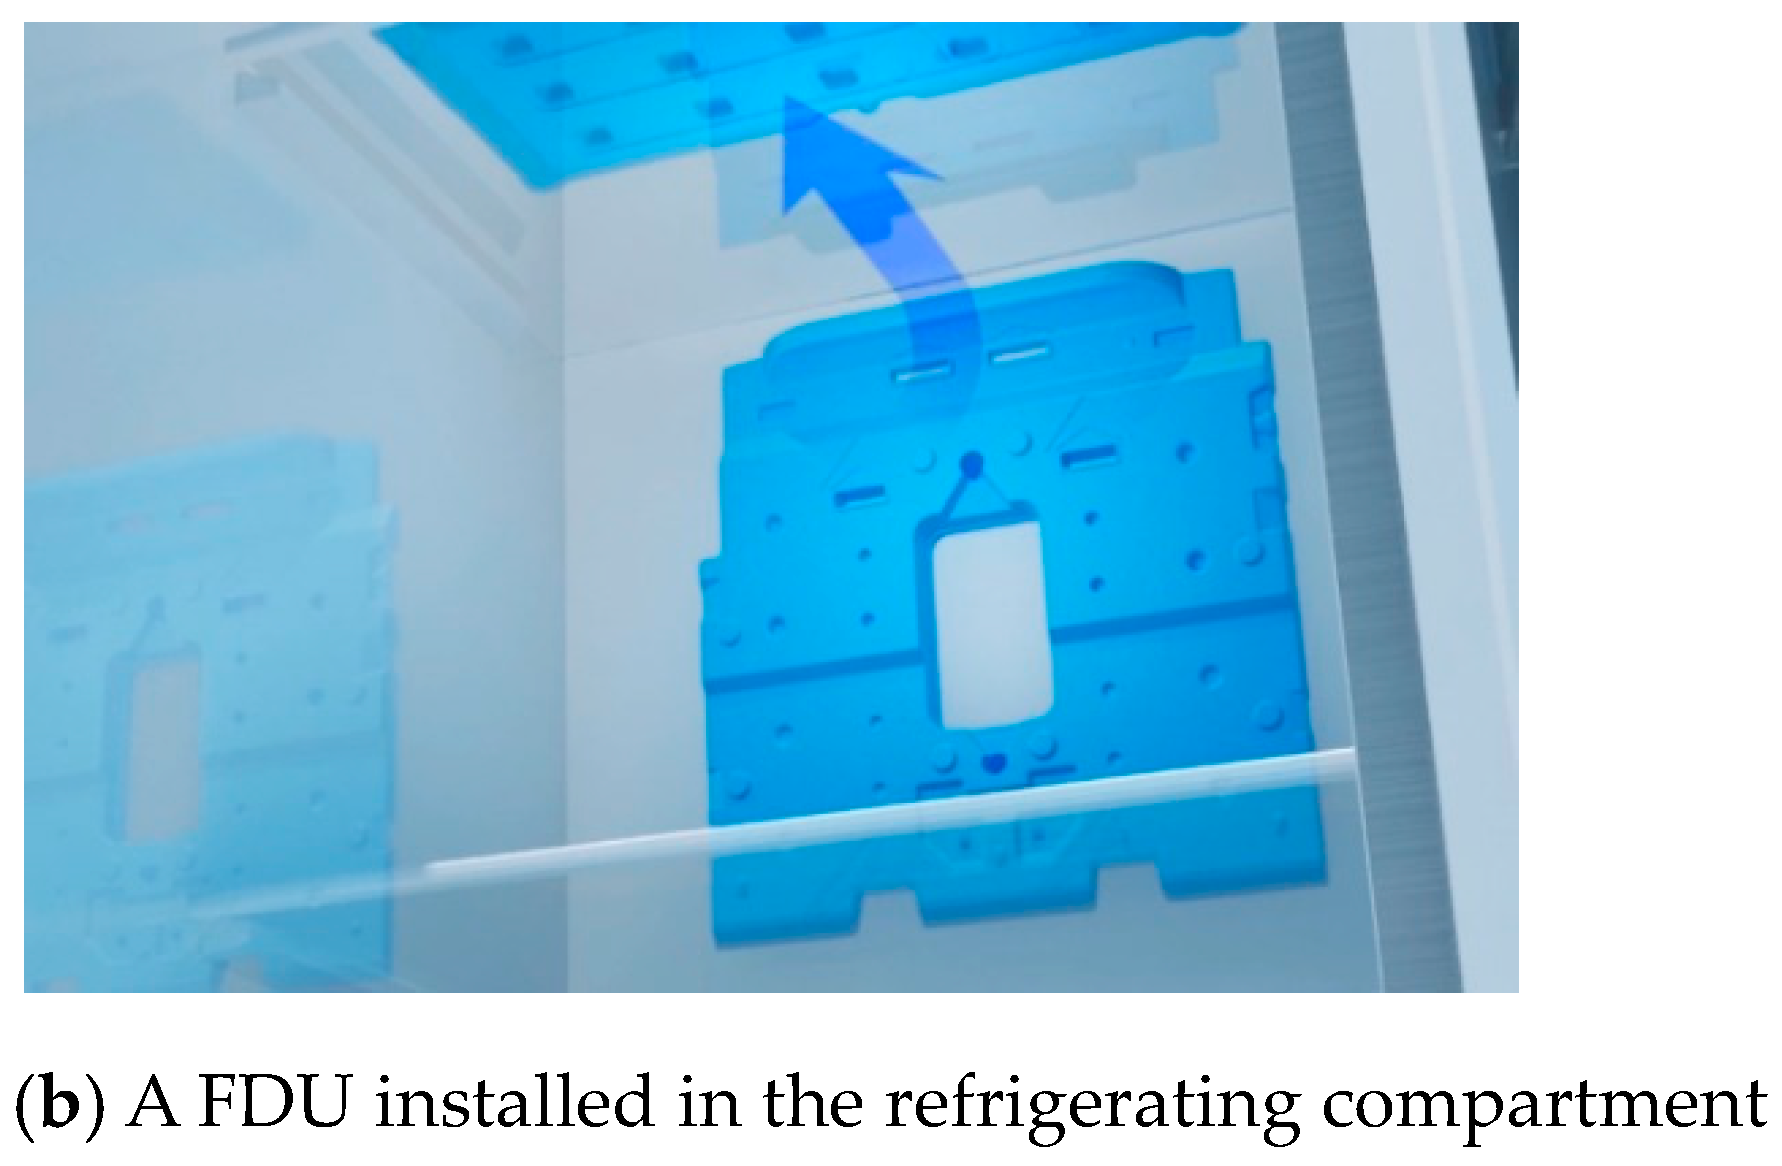
As part of this study, a PCM container illustrated in Figure 1a,b was also fabricated to minimize the process or alteration of the interior of a refrigerator to which the PCM with the appropriate thermal properties for the operating conditions of the refrigerator was to be applied. The PCM container was fabricated using a high-density polyethylene (HDPE) injection blow molding to hold the designated PCM. This container can replace the existing expandable polystyrene (EPS) duct units. An EPS duct unit is a simple path through which cold air permeates from the freezer to refrigerating compartment, while the proposed PCM container can maintain the refrigerator at an adequate temperature for a certain time by passive control during power shutdown or defrosting. Accordingly, apart from the existing function of the EPS duct unit, the PCM container was designed to delay the temperature rise inside a refrigerator that is opened or has a defrosting operation. In this study, the PCM container is referred to as the functional duct unit (FDU).
2. Experimental Setup and Method
2.1. Experiment for Determining a Refrigerator PCM
Table 1 presents the chemical composition of eutectic molten salt used for fabricating the PCM. The eutectic water–salt PCM was produced by diluting seven compounds listed in Table 1 with distilled water. To optimize the phase change characteristics such as supercooling, phase change temperature, and latent heat, the concentrations of eutectic molten salt in the PCM solutions were adjusted and the mass concentrations (wt.%) of eutectic molten salt were determined using Equation (1):
where meutectic salt is the mass of the eutectic molten salt, and mtotal is the total mass of the PCM solutions. It is important to note that the fraction of each of seven compounds constituting the eutectic molten salt is always kept constant. As a eutectic water–salt PCM is often accompanied by supercooling during a phase change process [2], this study used the super absorbent polymer (SAP) as viscosity agents to improve the problems of supercooling and phase separation.
The T-history method was applied to ensure the reliability of the thermal analysis for the PCM. Figure 2a,b display a brine refrigeration experimental system adopted for the T-history method to examine the thermal properties of the PCM in this study. The test chamber (shown in Figure 2b) of the experimental system was filled with brine. The brine was cooled by the heat exchange with a copper pipe through which the refrigerant flowed. To minimize the stratification of the brine temperature inside the chamber, a centrifugal circulating pump was used to force the cooled brine to circulate. Pyrex test tubes containing PCMs with different concentrations of eutectic salt compounds were arranged in the test chamber filled with brine. Subsequently, the experimental system operated to cool the PCM down to −18 °C through heat exchange with brine. When the brine and PCM were at a thermal equilibrium, the freezing cycle was stopped and the thawing process started. During the experiment, the PCM and brine temperatures were recorded on a PC through K-type thermocouples and data acquisition.
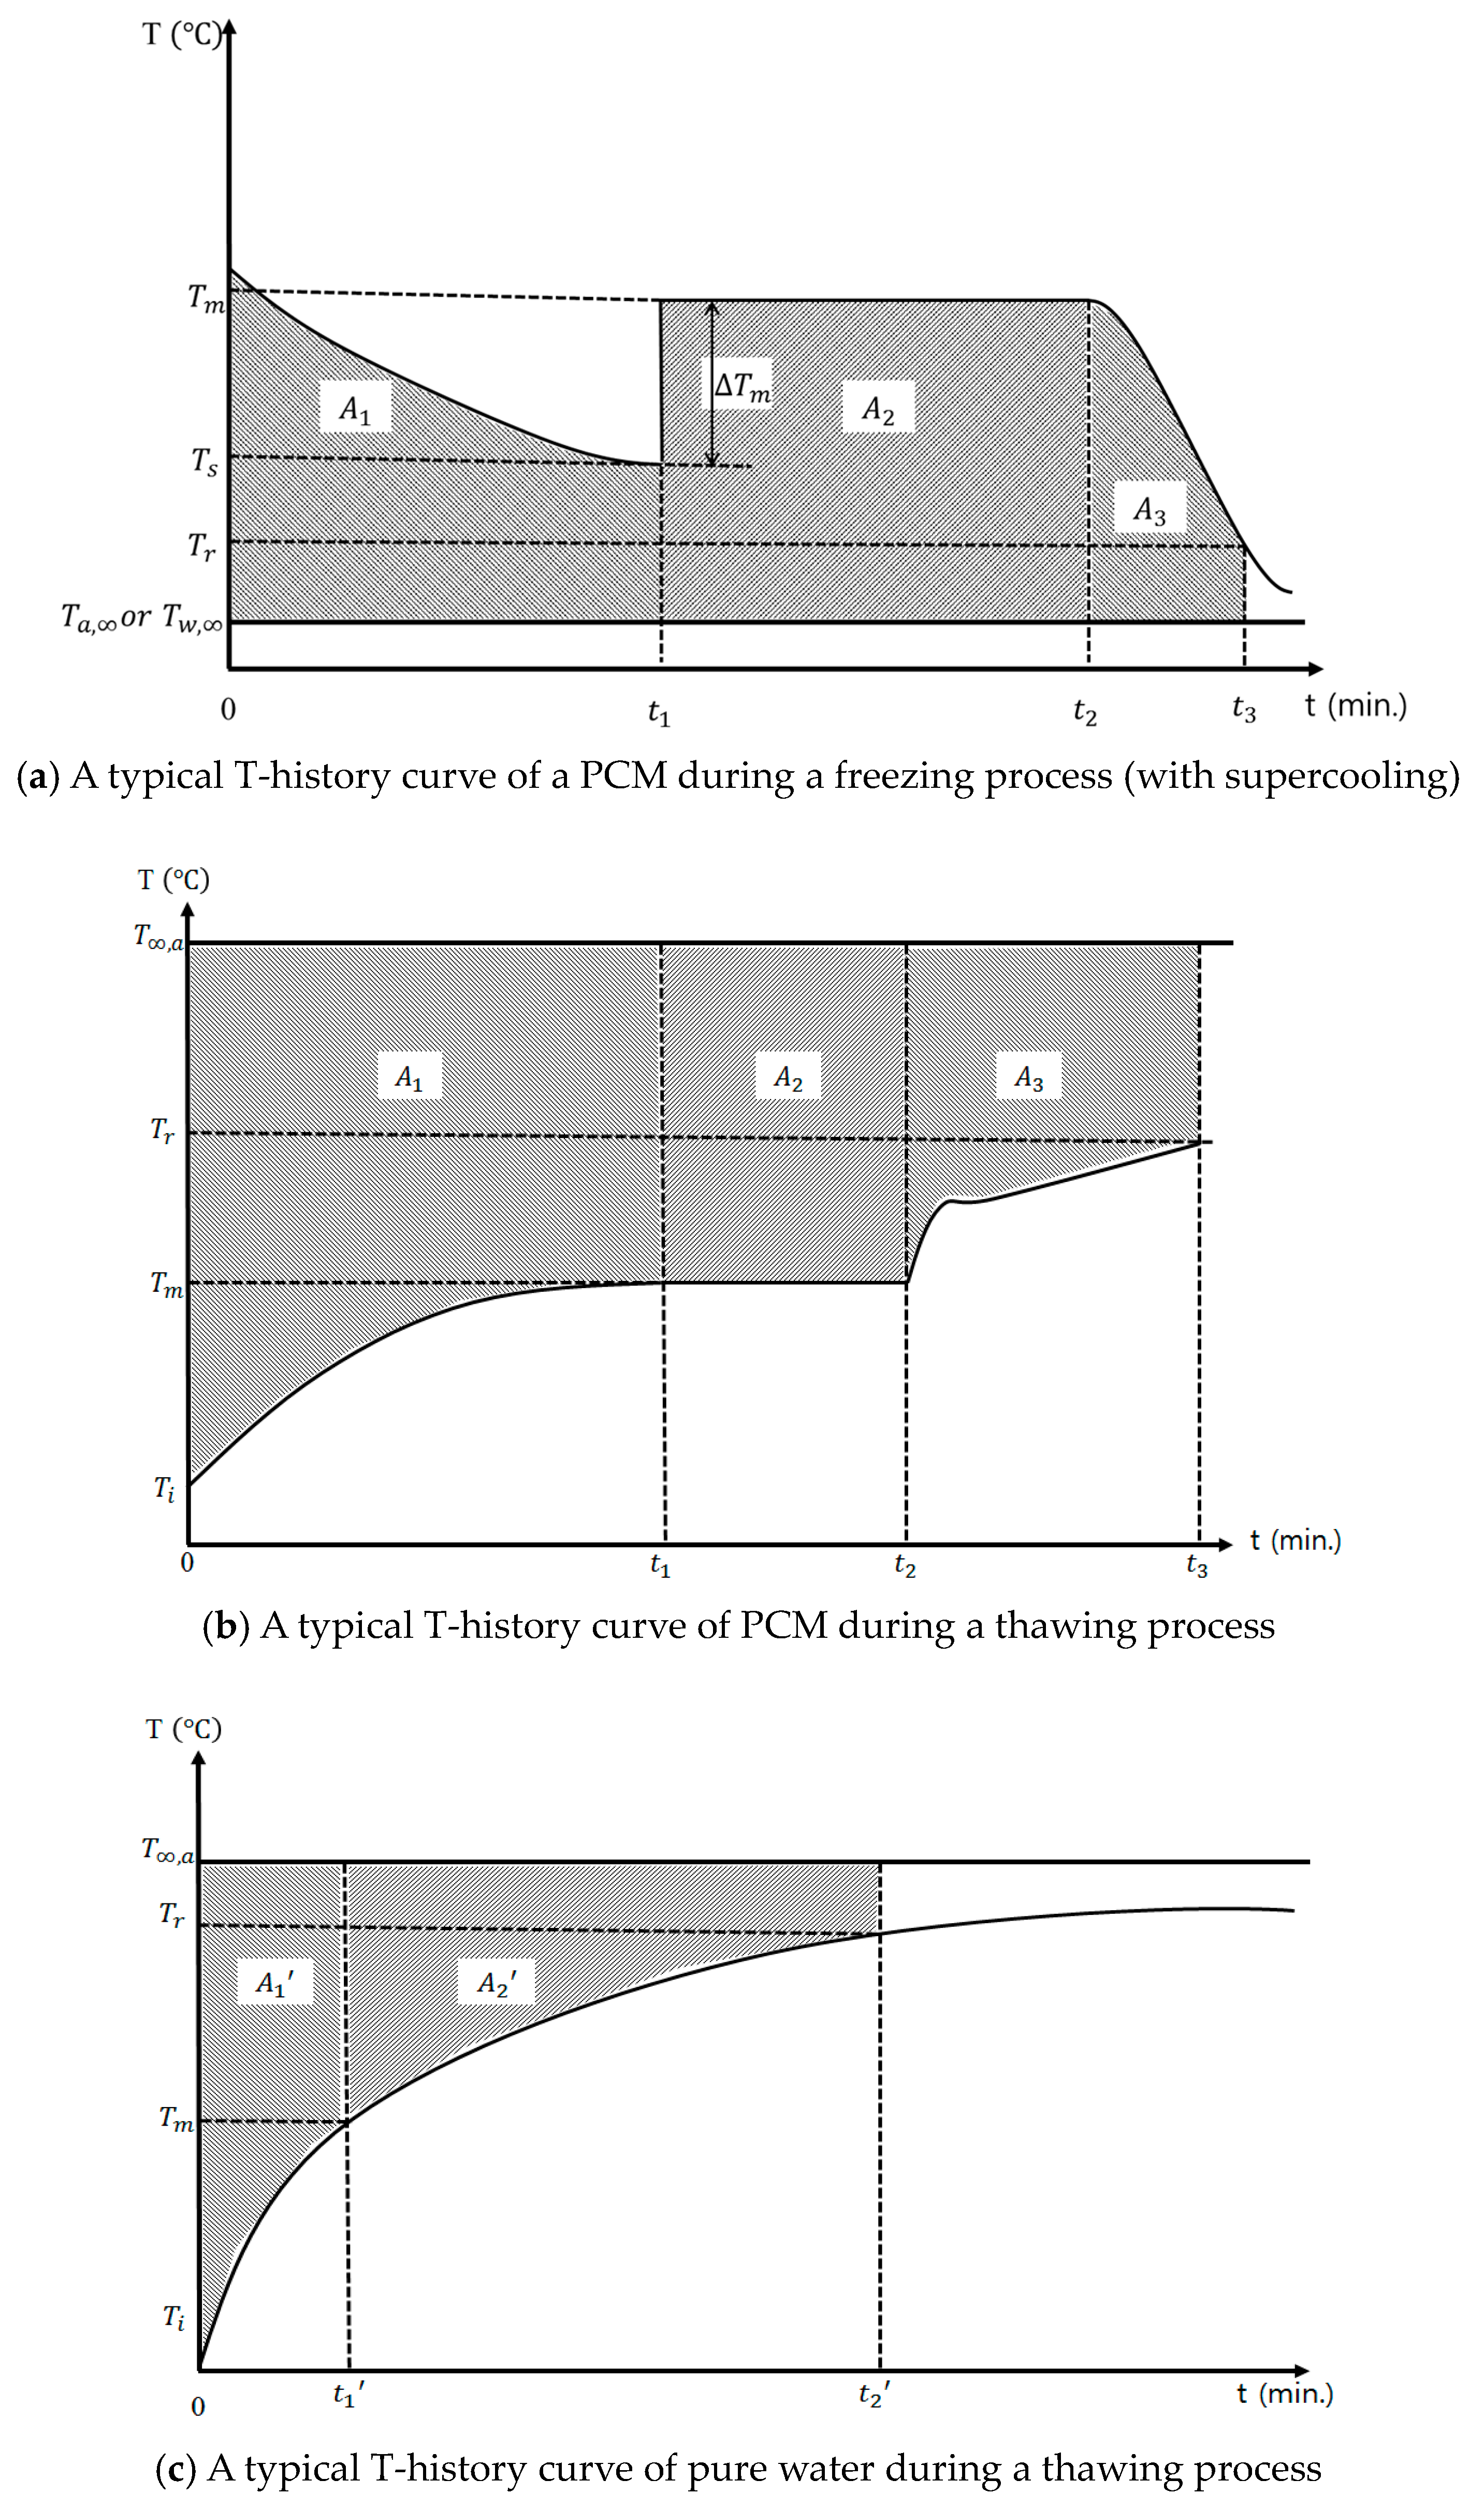
Figure 3a–c show a typical time-temperature history obtained during freezing and thawing processes. The T-history method [14] uses the thermal loads of a freezing cycle, which maintains the PCM at the ambient temperature to record the temperatures of the PCM being cooled as a function of time, and calculates the specific and latent heats by applying the obtained time-temperature history. The T-history method can obtain PCM thermal properties at medium (0 °C–100 °C ) and high (over 100 °C) phase change temperature as well as low phase change temperature (below 0 °C) PCM [15]. The proposed PCM of this study, as displayed in Figure 3a, showed a supercooling section during the freezing process, which can generate errors in the calculations of the latent and specific heats. Hence, the time-temperature graph obtained during the thawing process was applied to the T-history method for calculating the specific and latent heats of the PCM. Additionally, as the thawing process included a section where sensible heat and latent heat changed together, the approach of the revised T-history method proposed in the previous investigations [2,16,17,18,19] was used to define the inflection point of the thawing curve and designate a phase change section.
To calculate the latent and specific heats during the thawing process using the T-history method, the PCMs, which were fabricated by varying the mass concentrations (wt.%) of eutectic molten salt, were cooled down to a lower temperature than the phase change temperature. Subsequently, the PCMs were thawed in the atmosphere maintaining T∞,a, and the temperature change over time was recorded. Figure 3b is the temperature-time graph of the PCM, which was measured during the thawing process. As the experimental condition satisfied the condition (Bi < 0.1) under which the lumped capacitance method can be applied [2,14,19], Equation (2) can be applied to the sensible heat section from 0 to t1 of the solid-state PCM in Figure 4b:
where mt is the weight of the test tube, mp is the weight of the PCM, Cp,t is the specific heat of the test tube, Cp,s is the specific heat of the solid PCM, and Ac is the convection heat transfer coefficient of the test tube, and A1 is expressed as .
Equation (3) is valid from t1 to t2, where the PCM has a phase change:
where Hm is the latent heat, and A2 is obtained from . Equation (4) was used for the sensible heat section (from t2 to t3) of the liquid-state PCM:
where Cp,l is the specific heat of the liquid-state PCM, and A3 is obtained from .
Similarly, when the distilled water in a test tube is thawed in air, the time-temperature graph of Figure 3c can be acquired, and the thawing process for the distilled water can be expressed as Equations (5) and (6):
where mw is the weight of the distilled water, and Cp,w is the specific heat of the distilled water. By rearranging the equations above, the following Equations (7)–(9) on the specific and latent heats can be obtained:
In the equations above, the experimental environment and conditions need to be applicable to the lumped capacitance method, and the distilled water and PCM should have the same convection heat transfer coefficient. In the case of the specific heat, as the value of is a heat ratio, the value was calculated only for the section where it did not diverge and had a certain slope.
2.2. Performance Experiment of a Refrigerator with PCM
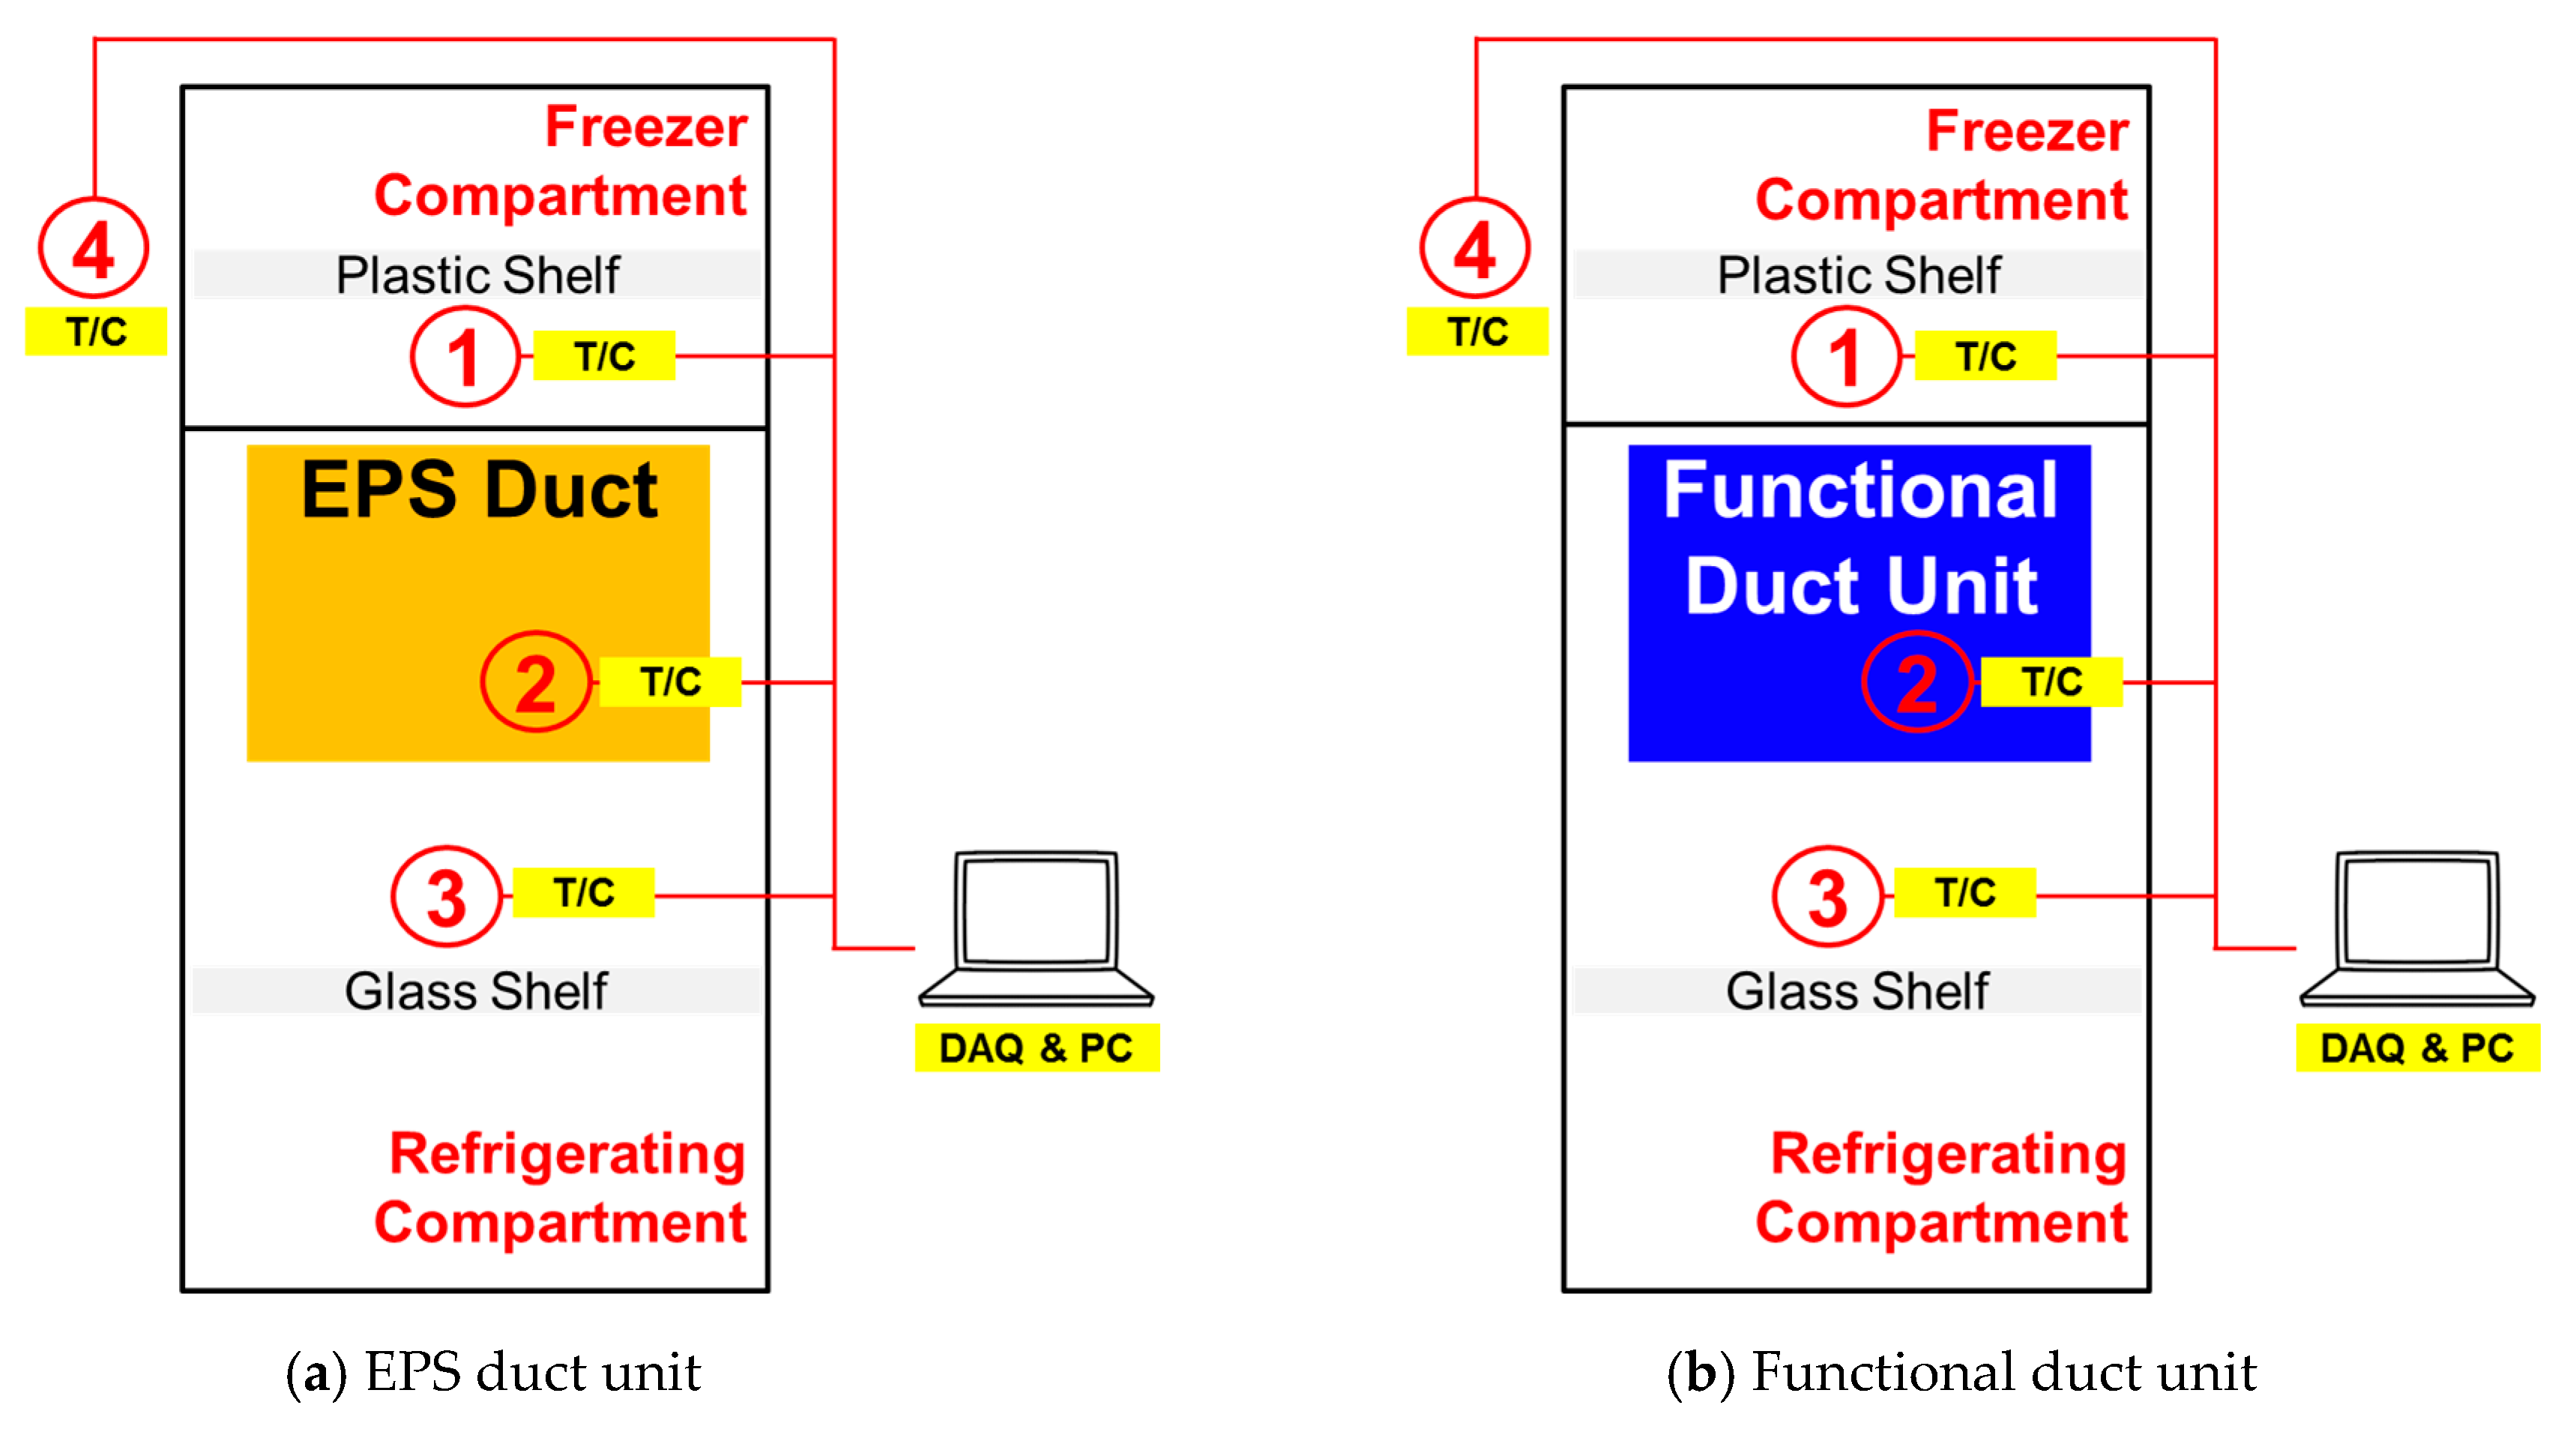
To compare the operational performance between a refrigerator with the conventional EPS duct unit and that equipped with an FDU, 1445 g of the proposed PCM was injected into an FDU case. Additionally, 15 g of SAP was injected to improve the supercooling, and the complete FDU was installed in the same position as the EPS duct unit. A TMF-type refrigerator, which had a total volume of 255 L, was used in the experiment. Figure 4 is the schematic diagram of the experiment where an EPS duct unit and an FDU were installed in the refrigerator.
The locations of the thermocouples were pre-selected to measure the temperatures of the freezer compartment (denoted as (1) in Figure 4), the duct surface (denoted as (2) in Figure 4), and the refrigerating compartment (denoted as (3) in Figure 4) along with the outdoor temperature (denoted as (4) in Figure 4). The temperatures were recorded for 40 h. The doors of the freezer and refrigerator were not opened during the experiment, and the outdoor temperature was set to represent the daily life environment.
3. Experimental Results and Discussion
3.1. T-History Method-Based Measurement of Thermal Properties of PCM
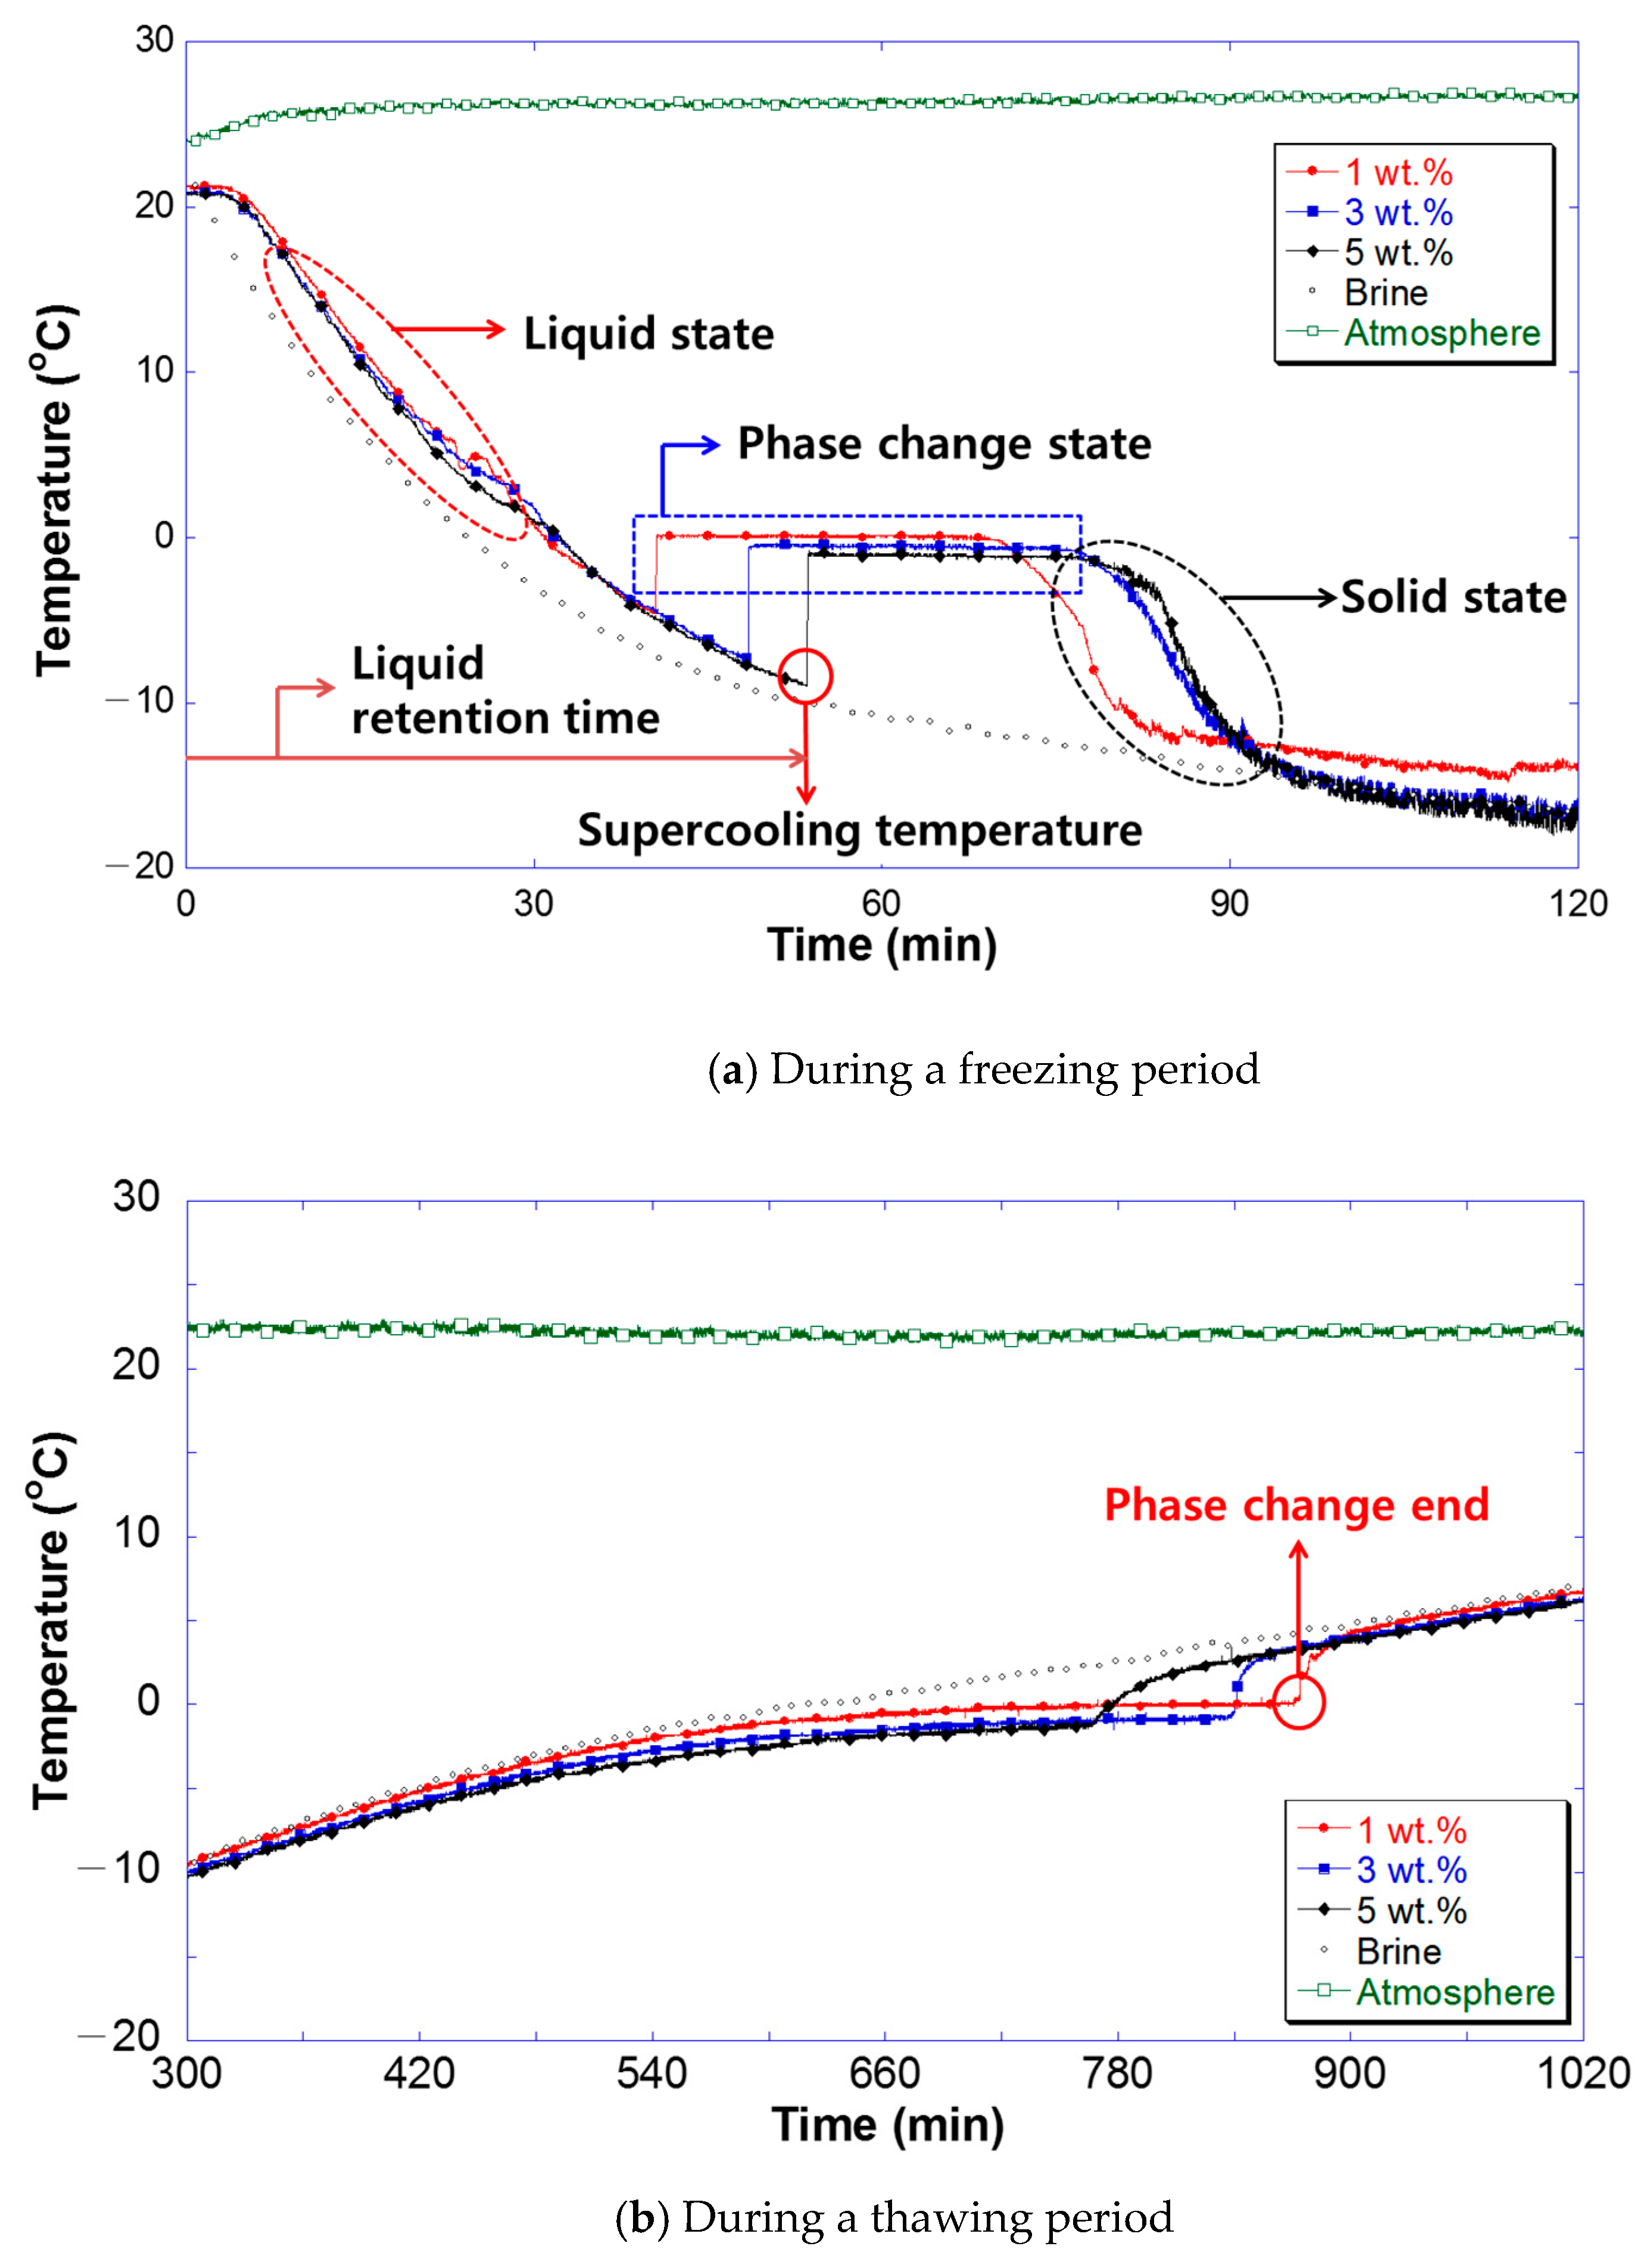
Figure 5a,b display a time-temperature history obtained during the freezing and thawing processes for the PCM without SAP. From the temperature record of the freezing process, the thermal properties such as the supercooling temperature, retention time of liquid phase, phase change temperature, and phase change section were identified. As shown in Figure 5a, the concentration of the eutectic molten salts in the PCM increased, the phase change temperature was observed to decrease. When the concentrations of the eutectic molten salts were 1 wt.%, 3 wt.% and 5 wt.%, the phase change temperatures were −0.1 °C, −0.5 °C and −1.1 °C, respectively. The higher the concentration of the eutectic molten salts in the PCM becomes, the lower the supercooling temperature occurs. When the concentrations of the eutectic molten salts were 1 wt.%, 3 wt.% and 5 wt.%, the supercooling temperatures were −4.6 °C, −7.4 °C, and −8.9 °C, respectively. The distilled water used as reference PCM had the supercooling temperature of −8.3 °C. The increased supercooling temperature prolongs the retention time of the liquid phase that is the duration where the PCM maintains its liquid phase until entering the phase change section. The extended liquid phase of the PCM with increasing the concentrations of the eutectic molten salts can influence the operation time of a compressor, eventually decreasing the COP of the freezing system [1,10]. Since the energy input is essential to initiate the phase change of PCM for our system at the beginning stage of operation, choosing the PCM with 1 wt.% eutectic molten salt compounds can reduce the total energy added to a refrigerator, increasing the energy efficiency.
Figure 5b is a time–temperature graph collected during the thawing process for the PCM without SAP. In contrast to the freezing process, the phase change was accompanied by sensible and latent heats. Accordingly, the phase change section cannot be clearly distinguished from the phase change temperature. In this study, as Peck [2] proposed, the inflection point, which was the reference of the sensible and latent heats, was utilized to obtain the liquid-phase specific heat, solid-phase specific heat, and latent heat of the PCM.
Table 2 summarizes the mean values of the thermal properties of the PCM without the SAP, which were obtained from the freezing and thawing processes that were repeated five times for the same specimens. As the eutectic salt compounds had higher mass concentrations, the liquid-phase specific heat, solid-phase specific heat, and latent heat tended to decrease as tabulated.
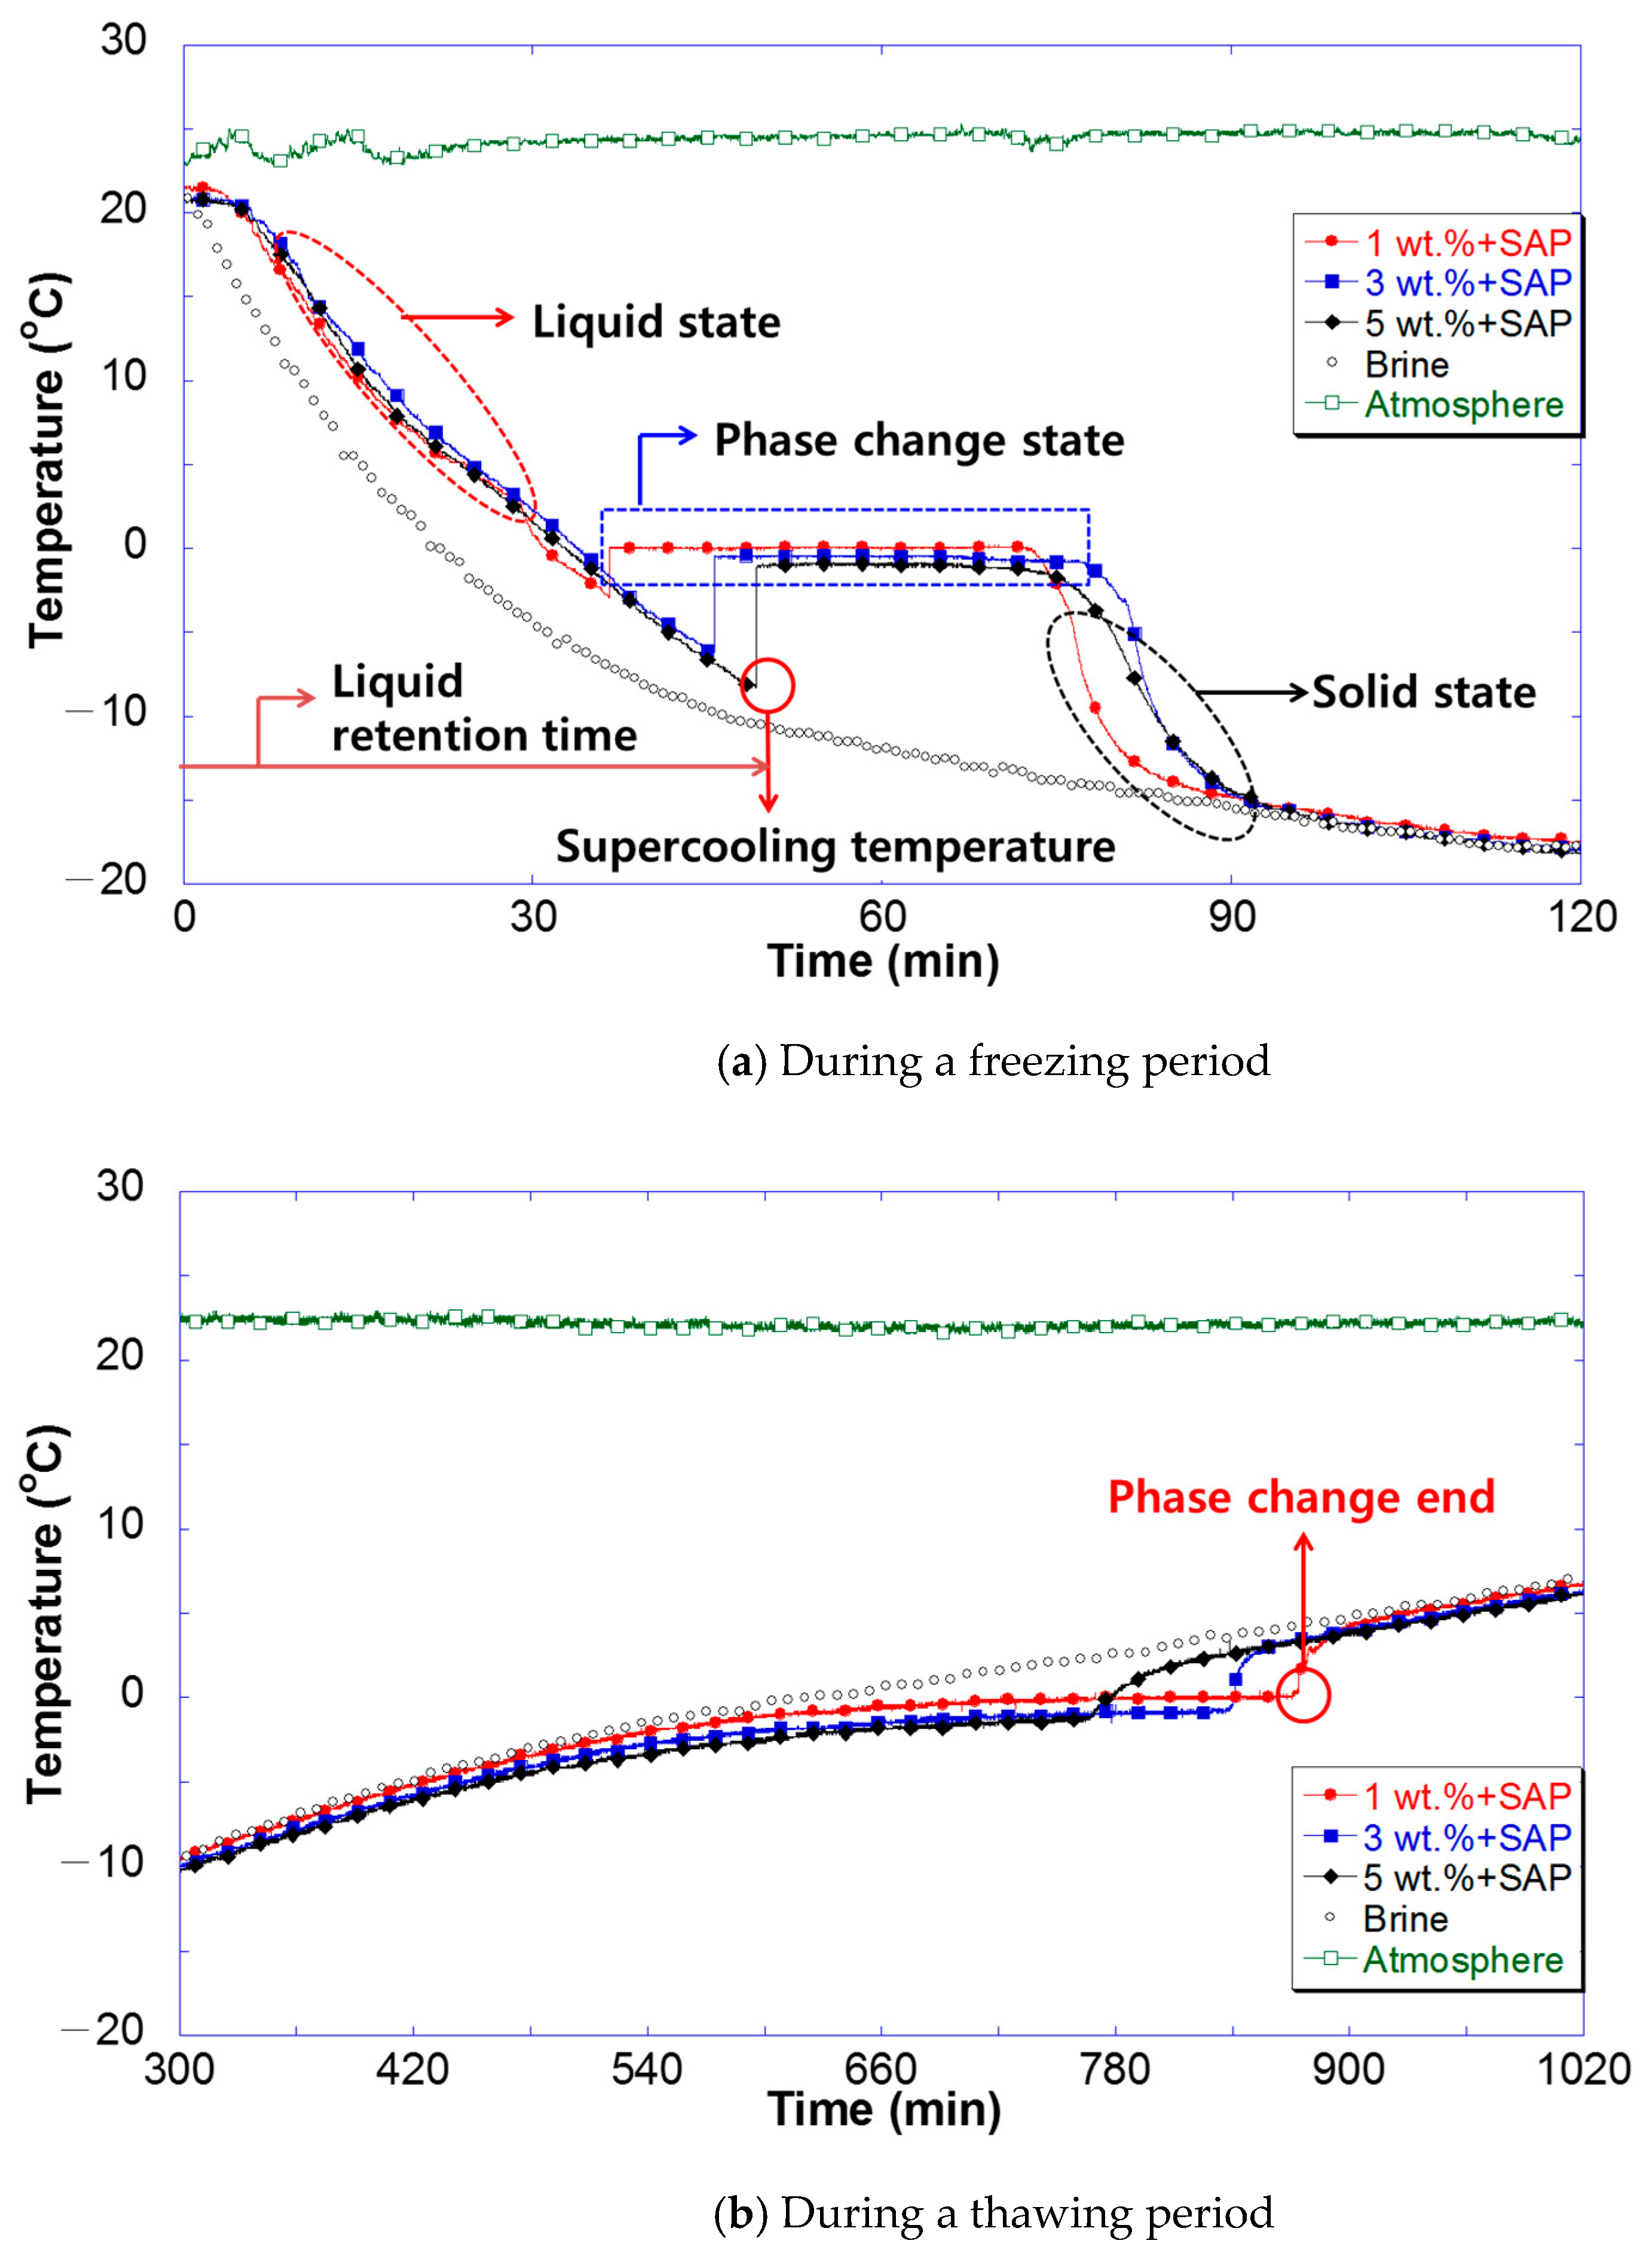
To examine the thermal properties of the PCM with the SAP, the experiments were conducted similarly as those for the PCM without the SAP. Figure 6a,b display the time-temperature history obtained during the freezing and thawing processes of the PCM to which the SAP was added. Similar to the PCMs without the SAP, the phase change temperature and supercooling temperature during the freezing process were observed to decrease as the concentrations of the eutectic molten salts in the PCM increased. Unlike the freezing process of the PCM without the SAP, the thawing process showed little impact of the SAP on thermal properties such as the phase state and phase change section. Additionally, no significant change in the thermal properties such as the liquid-phase specific heat, solid-phase specific heat, and latent heat was observed with the SAP additions as summarized in Table 3.
As listed in the table, when the mass concentrations of the eutectic molten salts were 1 wt.%, 3 wt.% and 5 wt.%, the phase change temperatures of the PCM were −0.5 °C, −0.8 °C and −1.2 °C, respectively. These results were slightly lower than those of the PCM without SAP. For the same mass concentrations, the supercooling temperatures were −2.9 °C, −6.8 °C, and −8.6 °C, respectively, indicating improvements as compared to the PCM without SAP. In particular, when the mass concentrations were 1 wt.% and 3 wt.%, the PCM + SAP improved the supercooling temperature by over 1 °C, which resulted in a large decrease in the retention time of the liquid phase. The liquid-phase specific heat and solid-phase specific heat of the PCM decreased with the increase in mass concentration. This was the same tendency as that of the PCM without SAP. The latent heat of the PCM with SAP decreased with the increase in mass concentration. Every specimen showed a slightly lower latent heat than that of the PCM without SAP.
When a PCM is considered as the FDU filler, it is noteworthy that the temperature of the cold air passing the conventional EPS duct (which bridges the freezer to refrigerating compartment) is −7 °C. In other words, any PCM with the phase change and supercooling temperatures of below −7 °C is not suitable for the FDU because it does not change its phase inside a refrigerator. Accordingly, the PCM had the concentrations of 5 wt.% cannot be applied to the FDU. PCMs with 1 wt.% (for both with and without SAP) or 3 wt.% mass concentrations had the phase change and supercooling temperatures of over −7 °C. Other thermal properties had to be considered to choose an optimal PCM between the two types of PCMs. In terms of the liquid and solid phase heat and latent heat, the PCM with 1 wt.% mass concentration displayed better performance. Consequently, the PCM with 1 wt.% mass concentration appeared to display the optimal thermal properties for an FDU based on the results of the T-history method.
3.2. Operational Characteristics of a Refrigerator with PCM Installed in the Refrigerating Compartment
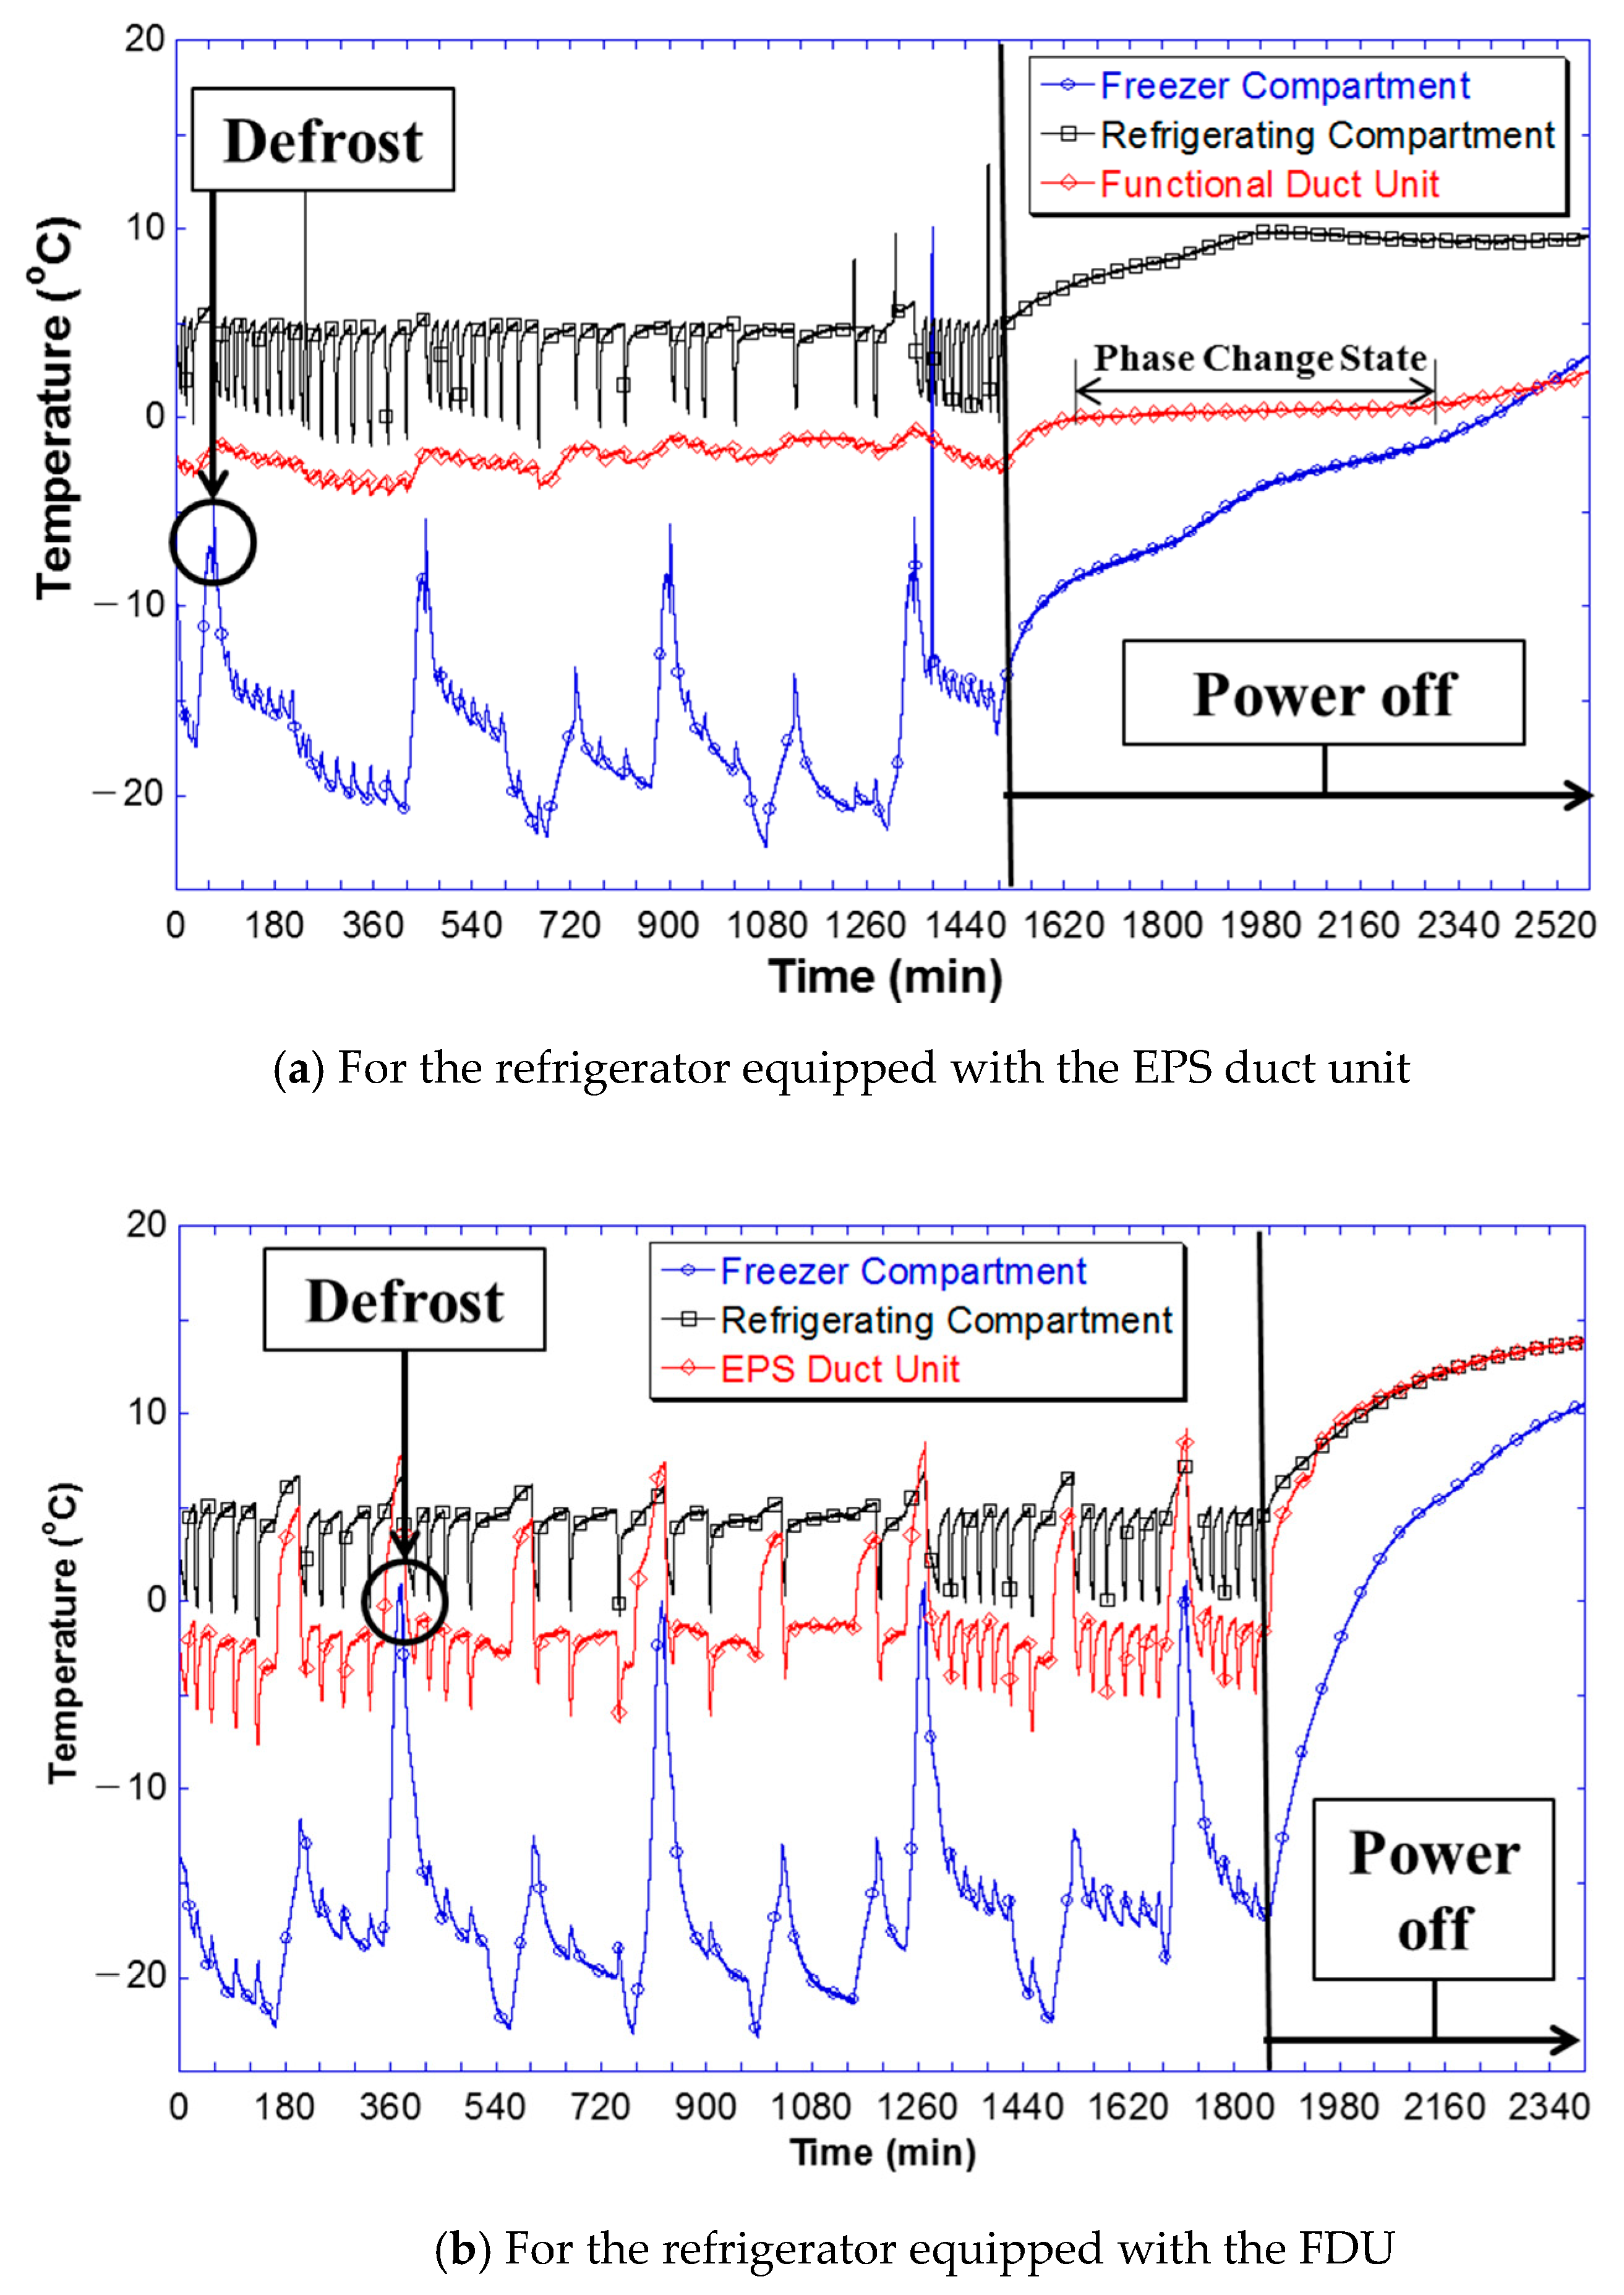
This study investigated the operational characteristics of a refrigerator by comparing the EPS duct installed in the conventional refrigerator and the FDU filled with 1 wt.% PCM, as described in the experimental setup of Section 2.2. Figure 7a is the operational characteristic graph of the refrigerator equipped with EPS, while the graph shown in Figure 7b illustrates the operational characteristics of the FDU-mounted refrigerator. Each graph shows the temperatures of the freezer (1), duct surface (2), and refrigerating compartment (3) as denoted in Figure 4. In the figures, the capacity of keeping the designated temperature for a refrigerator with PCM (i.e., a refrigerator equipped with the FDU) is compared to that without PCM (i.e., one equipped with the EPS duct unit). Variations in the temperature measured from the freezer compartment with the FDU are much smaller than those measured from the freezer compartment with the EPS duct unit. These experimental results demonstrate that the refrigerator equipped with the FDU has better operational performance in terms of holding a constant cold temperature.
As shown in the figures, the refrigerator used in this study had a regular defrosting operation to remove frost from the freezer. The temperature change inside the freezer during defrosting was used to evaluate the operational characteristics of the refrigerator and can be expressed as:
where ∆Tde indicates the temperature variation inside the freezer when the refrigerator is defrosting. Tpe is the highest temperature of the freezer during the defrosting operation, and Tst is the temperature immediately before the defrosting operation. As shown in the figures, the freezers equipped with an EPS duct or FDU maintained the temperature of −14 °C–−24 °C. However, as soon as the defrosting operation started, the Tpe of the freezer equipped with an EPS duct rose as high as 1.8 °C and ∆Tde became as high as 20.4 °C. Meanwhile, when an FDU was installed, the Tpe was as low as −5.4 °C and ∆Tde decreased to 13.1 °C.
Table 4 provides the temperature measurements acquired from the pre-selected locations (1–3) marked in Figure 4 when the freezer reached its highest temperature during the defrosting operation. As summarized in the table, the FDU recorded lower temperatures at every measurement point than the existing EPS duct unit. For example, the duct surface temperature in the refrigerator equipped with an EPS duct rose to 8.8 °C while the temperature in the FDU-mounted refrigerator raised only to −1.5 °C during the defrosting operation. In addition, during the defrosting operation, the temperatures inside the refrigerating compartment with EPS duct and FDU were 7.4 °C and 5.9 °C, respectively. The smaller temperature variation for the refrigerator equipped with the FDU was attributable to the fact that the latent heat was released and thus a sudden temperature rise was prevented when the selected PCM in the FDU reached the phase change temperature.
To qualitatively evaluate the capacity of holding a constant cold temperature in the refrigerating compartment with the FDU, the power was shut down under the same temperature conditions as for the refrigerator with the EPS duct unit, and temperature variation was observed. The power was shut down after the refrigerator operation was collected for 23 h. To enhance the reliability of the experiment, we checked whether the refrigerator had completed four defrosting operations before shutting down its power. As shown in Figure 7a,b, when the temperature of the refrigerator reached 0 °C, the power was switched off, and the temperature variation per unit time (∆T/min) in the refrigerating compartment was comparatively analyzed.
Table 5 summarizes the temperature variations per unit time, which were measured in the refrigerating compartment after the power shutdown. As listed in Table 5, the temperature inside the refrigerating compartment of the refrigerator with the EPS duct rose drastically to 9.1 °C after 120 min of power shutdown. Meanwhile, the refrigerating compartment of the FDU-mounted refrigerator increased the internal temperature up to 6.9 °C after the same time lapse under the power shutdown. The selected PCM filling the FDU started its phase change and caused the release of latent heat immediately after the power shutdown, thereby restraining the temperature rise inside the refrigerating compartment more effectively than that with the EPS duct. As shown in the phase change state in Figure 7b, the effects of latent heat storage can be clearly seen through the temperature suppression results of about 12 h as the FDU is installed. Accordingly, the refrigerating compartment equipped with an EPS duct had a much larger temperature variation per unit time (0.076) than that with an FDU (0.058), which resulted in the drastic temperature rise due to the power shutdown.
4. Conclusions
In this study, we produced a eutectic water–salt PCM by diluting eutectic salt compounds with distilled water. The most suitable PCM for an FDU was determined by considering phase change characteristics (supercooling temperature, phase change temperature, cold retention time, specific heat, and latent heat) according to the mass concentrations of the eutectic molten salt compounds. The PCM selected was placed into an FDU, and the operational performances were experimentally compared between a refrigerator with the FDU and the conventional one. From the experimental results obtained while selecting the PCM for the FDU and the operational characteristics of the FDU-mounted refrigerator, which were compared with those of the conventional refrigerator, the following conclusions have been derived:
- When the viscosity agent (SAP) was added to a PCM based on the thermal property data of the T-history method, the PCM improved the supercooling temperature by 0.3 °C–2.3 °C as compared to a PCM without the viscosity agent. The latent heat of the PCM with the viscosity agent decreased by approximately 2 kJ/kg depending on the specimens.
- The PCM with 1 wt.% eutectic salt compounds had a phase change temperature of −0.5 °C, supercooling temperature of −2.9 °C, cold retention time of 510 min, and latent heat of 304.9 kJ/kg. These were the best thermal properties among all the PCMs with different mass concentrations. Accordingly, the PCM with 1 wt.% eutectic salt compounds was selected for the FDU.
- Choosing the PCM containing 1 wt.% eutectic salt compounds can reduce the total energy added to the refrigerator before the liquid–solid phase change period by lowering the supercooling temperature and thus eventually increasing the energy efficiency.
- In comparison with the refrigerator equipped with an EPS duct, the FDU-mounted refrigerator, which was filled with the PCM with 1 wt.% eutectic salt compounds restrained a drastic temperature rise inside the freezer compartment during defrosting. Furthermore, in the case of a power shutdown, the PCM in the FDU-mounted refrigerator reached the phase change temperature and released latent heat, thereby effectively restraining a drastic temperature rise inside the refrigerating compartment.
Author Contributions
S.J.L. and S.H.P.; Methodology, S.J.L.; Experiment & Validation, S.H.P.; Formal Analysis, S.J.L.; Writing-Original Draft Preparation, S.H.P.; Writing-Review & Editing.
Acknowledgments
This work was supported by the “Human Resources Program in Energy Technology” of the Korea Institute of Energy Technology Evaluation and Planning (KETEP), granted financial resources from the Ministry of Trade, Industry, and Energy, Republic of Korea (No. 20174030201620) and the Program through the National Research Foundation of Korea (NRF) funded by the Ministry of Science and ICT (No. NRF-2017M1A3A3A06016680).
Conflicts of Interest
The authors declare no conflict of interest.
References
- Kim, C.O. A Study on Cooling Characteristics of TMA-Water Clathrate Compound for Low Temperature Latent Heat Storage. Ph.D. Thesis, Chosun University, Gwangju, Korea, 2008. [Google Scholar]
- Peck, J.H. A Study on Measurement of the Latent Heat for Phase Change Material. Ph.D. Thesis, Chonbuk National University, Jeonju, Korea, 2015. [Google Scholar]
- Tyagi, V.V.; Buddhi, D. PCM thermal storage in buildings: A state of the art. Renew. Sustain. Energy Rev. 2007, 11, 1146–1166. [Google Scholar] [CrossRef]
- Sharma, A.; Tyagi, V.V.; Chen, C.R.; Buddhi, D. Review on thermal energy storage with phase change materials and applications. Renew. Sustain. Energy 2009, 13, 318–345. [Google Scholar] [CrossRef]
- Zhao, J.; Ji, Y.; Yuan, Y.; Zhang, Z.; Lu, J. Energy-Saving Analysis of Solar Heating System with PCM Storage Tank. Energies 2018, 11, 237. [Google Scholar] [CrossRef]
- Siyabi, I.A.; Khanna, S.; Mallick, T.; Sundaram, S. Multiple Phase Change Material (PCM) Configuration for PCM-Based Heat Sinks-An Experimental Study. Energies 2018, 11, 1629. [Google Scholar] [CrossRef]
- Mazzeo, D.; Oilveti, G.; Arcuri, N. Definition of a new set of parameters for the dynamic thermal characterization of PCM layers in the presence of one or more liquid–solid interfaces. Energy Build. 2017, 141, 379–396. [Google Scholar] [CrossRef]
- Mazzeo, D.; Oilveti, G.; Arcuri, N. A Method for Thermal Dimensioning and for Energy Behavior Evaluation of a Building Envelope PCM Layer by Using Characteristic Days. Energies 2017, 10, 659. [Google Scholar] [CrossRef]
- Oró, E.; Miró, L.; Farid, M.M.; Cabeza, L.F. Improving thermal performance of freezers using phase change materials. Int. J. Refrig. 2012, 35, 984–991. [Google Scholar] [CrossRef]
- Azzouz, K.; Leducq, D.; Gobin, D. Enhancing the performance of household refrigerators with latent heat storage: An experimental investigation. Int. J. Refrig. 2009, 32, 1634–1644. [Google Scholar] [CrossRef]
- Tulapurkar, C.; Subramaniam, P.R.; Thagamani, G.; Thiyagarajan, R. Phase change materials for domestic refrigerators to improve food quality and prolong compressor off time. In Proceedings of the International Refrigeration and Air Conditioning Conference, West Lafayette, IN, USA, 12–15 July 2010. [Google Scholar]
- Gin, B.; Farid, M.M.; Bansal, P.K. Effect of door opening and defrost cycle on a freezer with phase change panels. Energy Convers. Manag. 2010, 51, 2698–2709. [Google Scholar] [CrossRef]
- Cheng, W.L.; Mei, B.J.; Liu, Y.N.; Huang, Y.H.; Yuan, X.D. A novel household refrigerator with shape-stabilized PCM (Phase Change Material) heat storage condenser: An experimental investigation. Energy 2011, 36, 5797–5804. [Google Scholar] [CrossRef]
- Zhang, Y.; Jiang, Y.; Jiang, Y. A simple method, the T-history method, of determining the heat of fusion, specific heat and thermal conductivity of phase-change materials. Meas. Sci. Technol. 1999, 10, 201–205. [Google Scholar] [CrossRef]
- Paola, M.G.D.; Arcuri, N.; Calabró, V.; Simone, M.D. Thermal and Stability Investigation of Phase Change Material Dispersions for Thermal Energy Storage by T-history and Optical Methods. Energies 2017, 10, 354. [Google Scholar] [CrossRef]
- Hong, H.; Kim, S.K.; Kim, Y.S. Accuracy improvement of T-history method for measuring heat of fusion of various materials. Int. J. Refrig. 2004, 27, 360–366. [Google Scholar] [CrossRef]
- Peak, J.H.; Kim, J.J.; Kang, C.; Hong, H. A study of accurate latent heat measurement for a PCM with a low melting temperature using T-history method. Int. J. Refrig. 2006, 29, 1225–1232. [Google Scholar] [CrossRef]
- Park, C.H.; Peck, J.H.; Kang, C.D.; Hong, H.K. Accuracy Improvement for Measurement of Heat of Fusion by T-history Method. Korean J. Air-Cond. Refrig. Eng. 2003, 15, 652–661. [Google Scholar]
- Incropera, F.P.; Bergman, T.L.; DeWitt, D.P.; Lavine, A.S. Fundamentals of Heat and Mass Transfer, 4th ed.; John Wily & Sons, Inc.: Hoboken, NJ, USA, 1966; pp. 212–217. [Google Scholar]
Figure 1.
A functional duct unit (FDU) filled with selected PCM in the refrigerator.
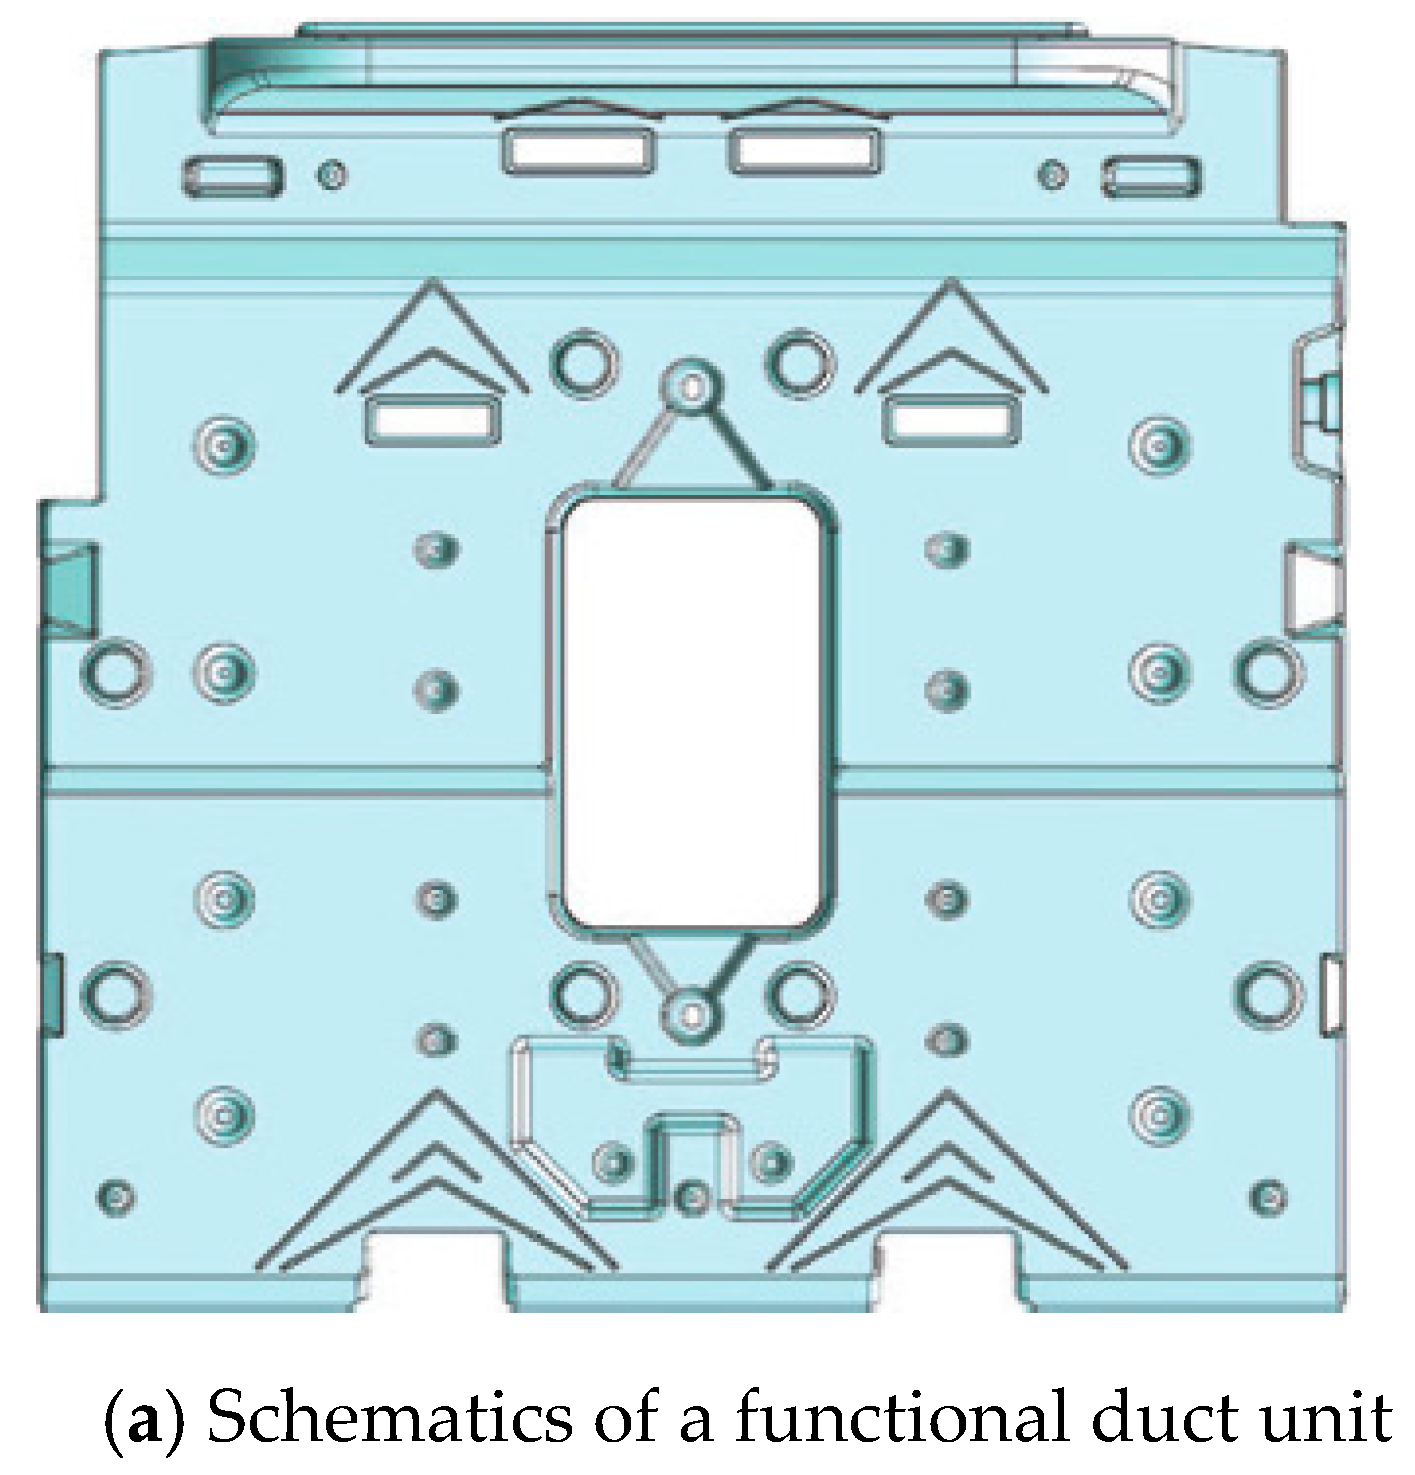

Figure 2.
Experimental apparatus used for the T-history method.
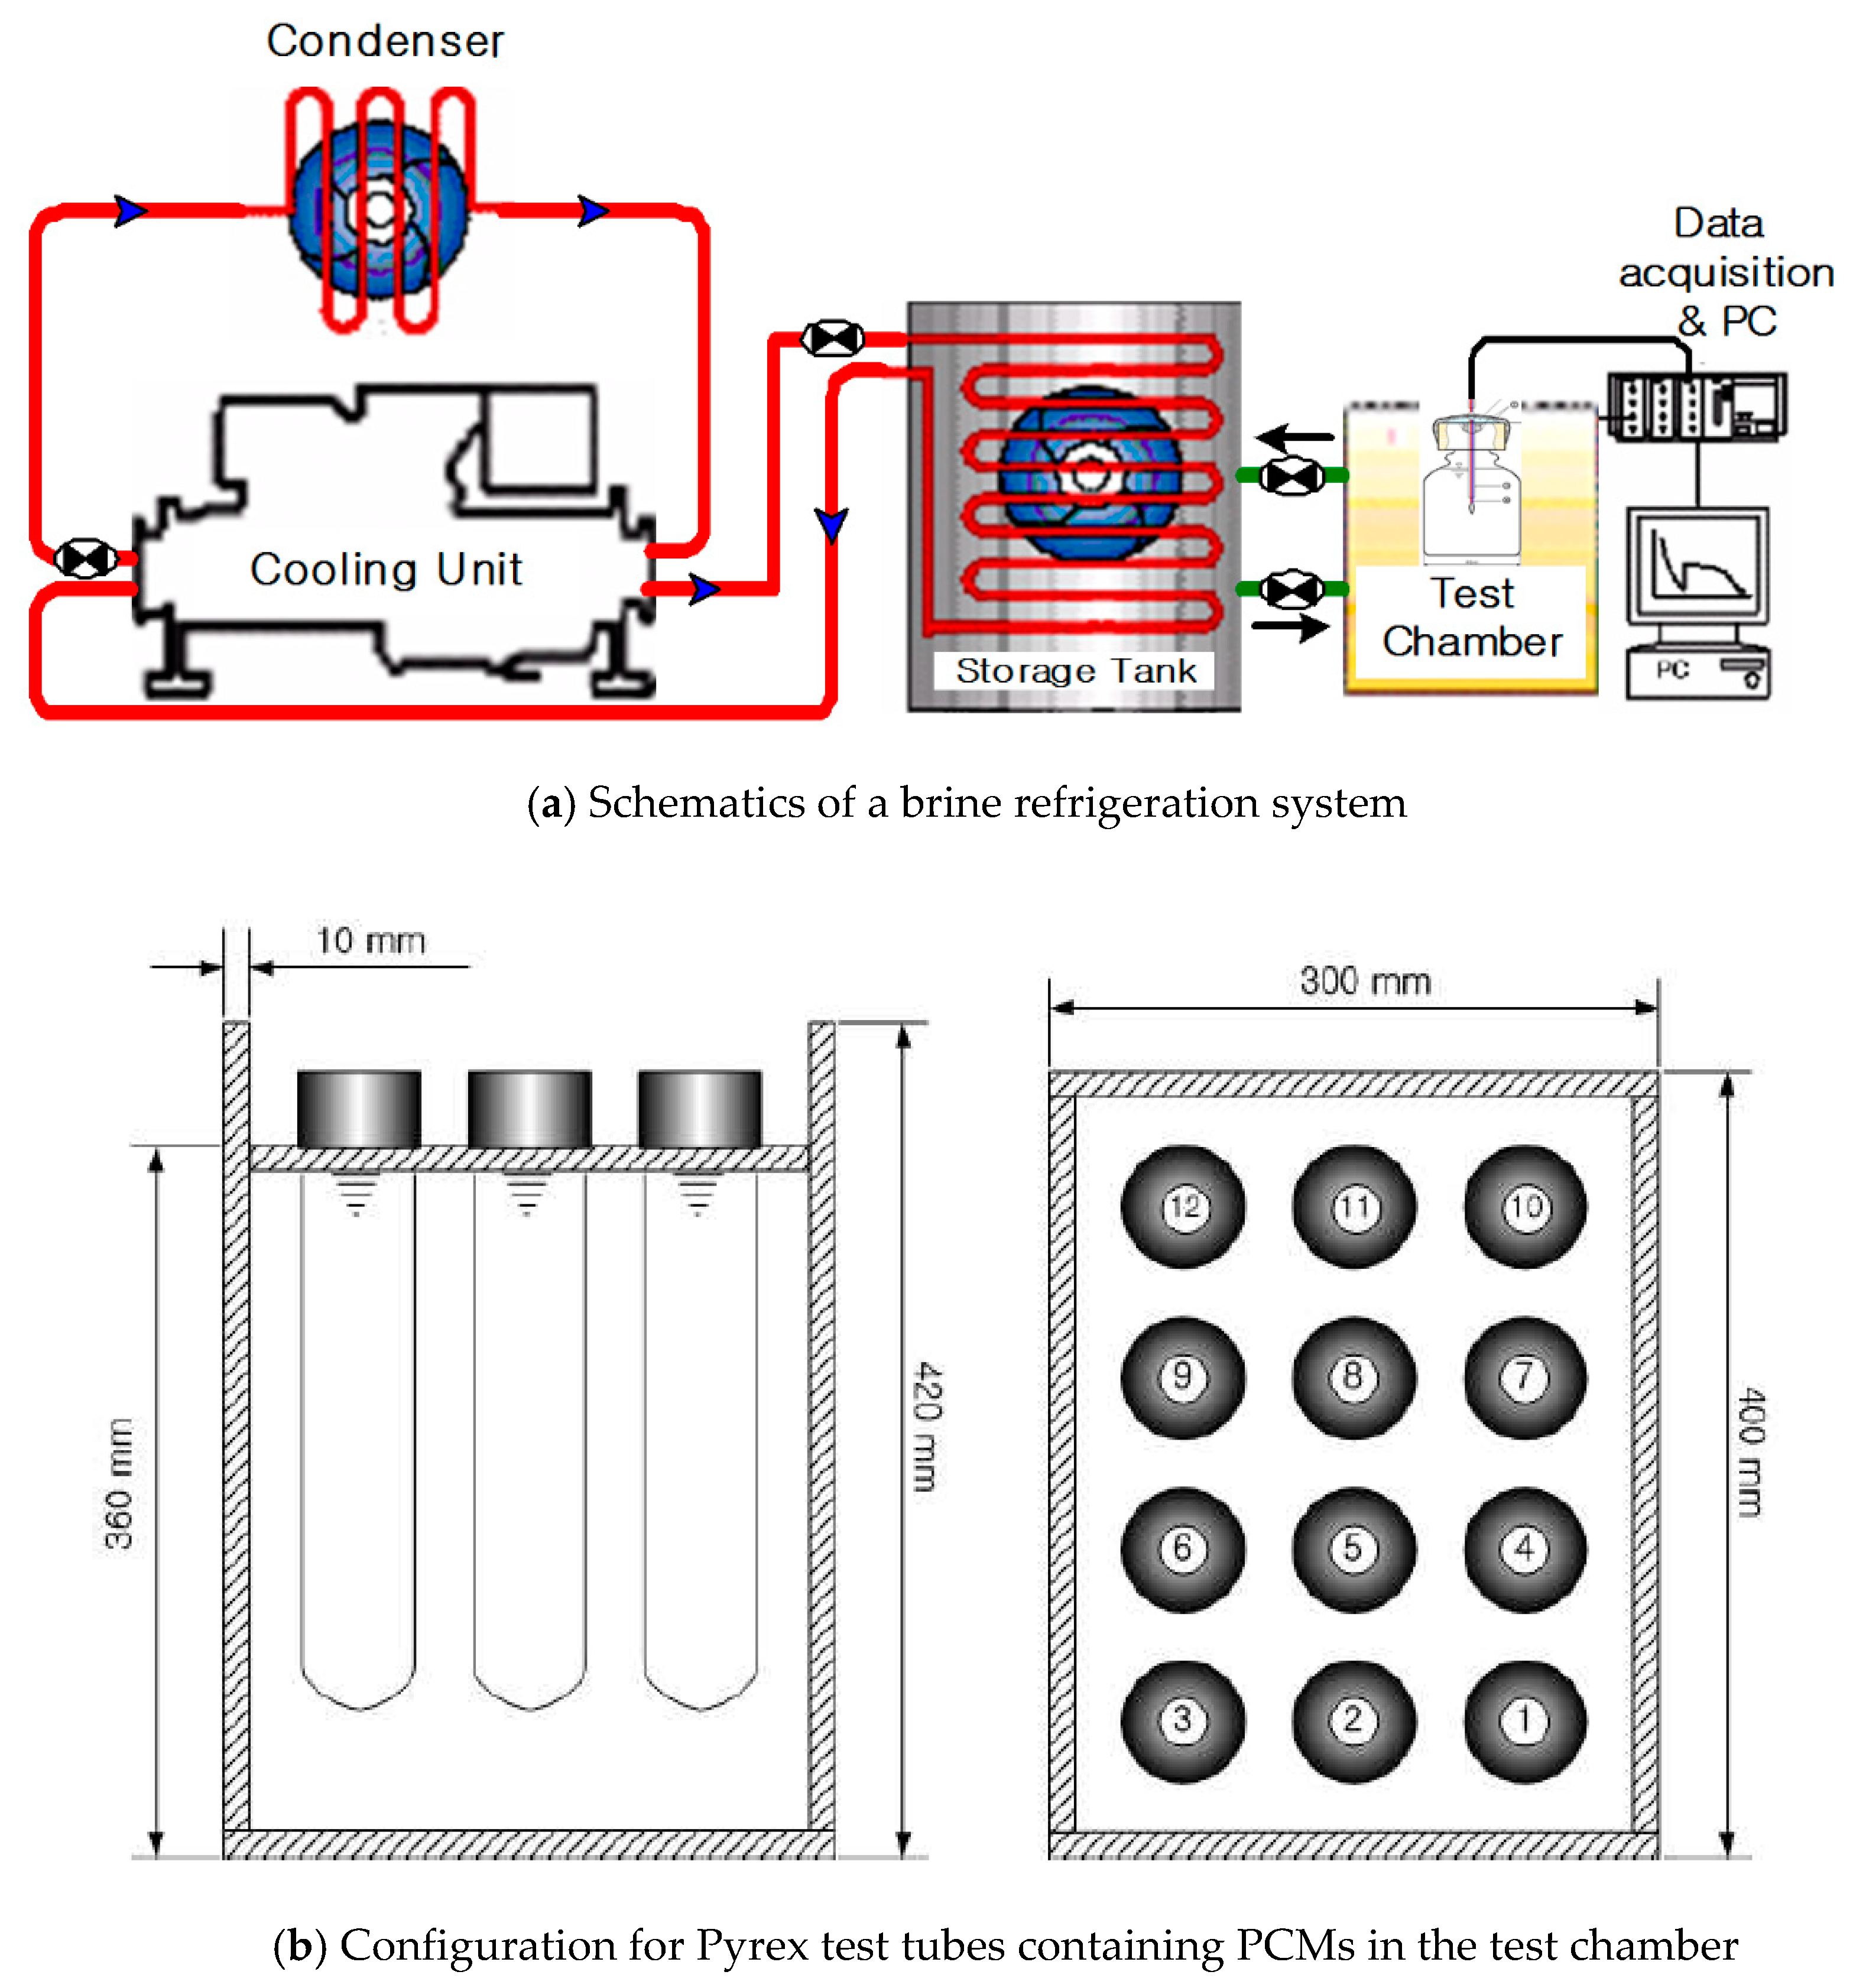
Figure 3.
Time-temperature graph for applying the T-history method of PCM and pure water.

Figure 4.
Pre-selected locations for temperature measurements of refrigerators equipped with EPS duct unit and FDU.
Figure 4.
Pre-selected locations for temperature measurements of refrigerators equipped with EPS duct unit and FDU.

Figure 5.
Measured temperature of PCMs with different eutectic molten salt concentrations; 1 wt.%, 3 wt.% and 5 wt.% without SAP.
Figure 5.
Measured temperature of PCMs with different eutectic molten salt concentrations; 1 wt.%, 3 wt.% and 5 wt.% without SAP.

Figure 6.
Measured temperature of PCMs with different eutectic molten salt concentrations; 1 wt.%, 3 wt.% and 5 wt.% with SAP.
Figure 6.
Measured temperature of PCMs with different eutectic molten salt concentrations; 1 wt.%, 3 wt.% and 5 wt.% with SAP.

Figure 7.
Measured temperatures inside the refrigerator as a function of time.


Table 1.
List of chemical compositions used to fabricating the PCM.
| Materials Name | Chemistry Symbols | Chemical Abstract Service (CAS) Number |
|---|---|---|
| Sodium sulfate | Na2SO4 | 7757-82-6 |
| Sodium phosphate | Na3PO4 | 7632-05-5 |
| Potassium sulfate | K2SO4 | 7778-18-9 |
| Carbamide | CO(NH2)2 | 57-13-6 |
| Silica | SiO2 | 10279-57-9 |
| Water | H2O | 7732-18-5 |
Table 2.
Summary of thermal properties of PCMs with different eutectic molten salt concentrations; 1 wt.%, 3 wt.% and 5 wt.% without SAP.
Table 2.
Summary of thermal properties of PCMs with different eutectic molten salt concentrations; 1 wt.%, 3 wt.% and 5 wt.% without SAP.
| Thermal Properties | 1 wt.% | 3 wt.% | 5 wt.% | Pure Water (Reference) |
|---|---|---|---|---|
| Phase change temperature (°C) | −0.1 | −0.5 | −1.1 | 0 |
| Liquid retention time (min) | 40.5 | 48.5 | 53.6 | 47 |
| Supercooling temperature (°C) | −4.6 | −7.4 | −8.9 | −8.3 |
| Liquid specific heat (kJ/kg·K) | 3.94 | 3.89 | 3.81 | 4.18 |
| Solid specific heat (kJ/kg·K) | 1.93 | 1.88 | 1.84 | 2.04 |
| Latent heat (kJ/kg) | 306.2 | 288.6 | 260.4 | 333 |
Table 3.
Summary of thermal properties of PCMs with different eutectic molten salt concentrations; 1 wt.%, 3 wt.% and 5 wt.% with SAP.
Table 3.
Summary of thermal properties of PCMs with different eutectic molten salt concentrations; 1 wt.%, 3 wt.% and 5 wt.% with SAP.
| Thermal Properties | 1 wt.% + SAP | 3 wt.% + SAP | 5 wt.% + SAP | Pure Water (Reference) |
|---|---|---|---|---|
| Phase change temperature (°C) | −0.5 | −0.8 | −1.2 | 0 |
| Liquid retention time (min) | 36.5 | 45.5 | 49.2 | 47 |
| Supercooling temperature (°C) | −2.9 | −6.8 | −8.6 | −8.3 |
| Liquid specific heat (kJ/kg·K) | 3.91 | 3.85 | 3.82 | 4.18 |
| Solid specific heat (kJ/kg·K) | 1.89 | 1.84 | 1.80 | 2.04 |
| Latent heat (kJ/kg) | 304.9 | 286.1 | 258.7 | 331 |
Table 4.
Summary of temperature measured at pre-selected locations at Tpe.
| Location | EPS Duct Unit | Functional Duct Unit |
|---|---|---|
| Freezer compartment (1) | 1.8 °C | −5.4 °C |
| Duct surface (2) | 8.8 °C | −1.5 °C |
| Refrigerating compartment (3) | 7.4 °C | 5.9 °C |
Table 5.
Comparisons of temperatures and variation rates measured in the refrigerating compartment after power off.
Table 5.
Comparisons of temperatures and variation rates measured in the refrigerating compartment after power off.
| Duration | With EPS Duct Unit (°C) | With FDU (°C) |
|---|---|---|
| At power off | 0.0 | 0.0 |
| 60 min after power off | 7.5 | 6.0 |
| 120 min after power off | 9.1 | 6.9 |
| ∆T/min | 0.076 | 0.058 |
© 2018 by the authors. Licensee MDPI, Basel, Switzerland. This article is an open access article distributed under the terms and conditions of the Creative Commons Attribution (CC BY) license (http://creativecommons.org/licenses/by/4.0/).
Share and Cite
MDPI and ACS Style
Lee, S.-J.; Park, S.-H. An Experimental Investigation of Thermal Characteristics of Phase Change Material Applied to Improve the Isothermal Operation of a Refrigerator. Energies 2018, 11, 2017. https://doi.org/10.3390/en11082017
AMA Style
Lee S-J, Park S-H. An Experimental Investigation of Thermal Characteristics of Phase Change Material Applied to Improve the Isothermal Operation of a Refrigerator. Energies. 2018; 11(8):2017. https://doi.org/10.3390/en11082017
Chicago/Turabian StyleLee, Seok-Joon, and Seul-Hyun Park. 2018. "An Experimental Investigation of Thermal Characteristics of Phase Change Material Applied to Improve the Isothermal Operation of a Refrigerator" Energies 11, no. 8: 2017. https://doi.org/10.3390/en11082017
Note that from the first issue of 2016, this journal uses article numbers instead of page numbers. See further details here.