Joint Operation between a PSO-Based Global MPP Tracker and a PV Module Array Configuration Strategy under Shaded or Malfunctioning Conditions


Department of Electrical Engineering, National Chin-Yi University of Technology, Taichung 41170, Taiwan
*
Author to whom correspondence should be addressed.
Energies 2018, 11(8), 2005; https://doi.org/10.3390/en11082005
Submission received: 24 June 2018
/
Revised: 27 July 2018
/
Accepted: 27 July 2018
/
Published: 1 August 2018
(This article belongs to the Section A: Sustainable Energy)
Abstract
:This paper aims to present a smart, particle swarm optimization (PSO)-based, real time configuration strategy for a photovoltaic (PV) module array in the event of shadow cast on a PV module(s) and/or module failure as an effective approach to power generation efficiency elevation. At the first step, the respective maximum output power levels provided by a normal operating array at various levels of irradiation and module surface temperatures are measured and entered as references into a database. Subsequently, the maximum output power (MPP) level, tracked by a MPP tracker, is feedbacked for a comparison with an aforementioned reference as a way to tell whether there is either a shadow or a malfunction event on a PV module(s). Once an abnormal operation is detected, the presented smart configuration algorithm is performed to reconfigure the PV module array such that the array is operated at the global MPP as intended. Furthermore, by use of a PIC microcontroller that is a family of microcontrollers made by Microchip Technology for compact implementation, this study is experimentally validated as an effective approach to locating the global MPP at all events.
1. Introduction
A partially shaded or malfunctioning PV module(s) in an array leads to multiple peaks on the corresponding P-V characteristic curve, and gives rise to a considerable output power drop [1,2]. In light of this, global maximum power point tracking algorithms [3,4,5] are proposed to resolve such multiple peak problems and as a way to reduce the shadow or malfunction impact on the overall system performance. Since a PV module array is operated in a fixed configuration, the above-stated algorithms lead to limited improvement in the electricity generation efficiency, particularly under serious shaded or malfunctioning conditions.
Some differential power processing (DPP) converters and voltage equalizers that are one of the most viable solutions to partial shading are mentioned in [6,7,8]. A distributed algorithm for controlling differential power processing (DPP) converters in photovoltaic (PV) application was presented in [6]. It tackled the problem of maximizing the power extracted from a system of series-connected PV modules outfitted with DPPs. However, this method must use the numbers of inductor and capacitor, will increase the cost of the system and reduce the stability of the system. Reference [7] proposed a photovoltaic module architecture with parallel-connected sub-module integrated dc-dc converters that improve efficiency of energy capture in the presence of partial shading or other mismatch conditions. But this architecture needs to connect a dc-dc converter in each series of PV module array that will increase the cost of the PV system. At the same time, the loss of converters will increase. A two-switch voltage equalizer using an LLC resonant inverter with a voltage multiplier has been proposed in [8]. With this proposed voltage equalizer, local maximum power points successfully disappeared and extractable maximum power significantly increased compared with those without equalization. However, this method needs to couple with the LLC resonant inverter and additional voltage multiplier for PV modules connected in series. And this method cannot be applied in the series-parallel PV modules architecture.
As suggested in [9], an adaptive PV module array mainly involves two parts, namely a fixed part and an adaptive bank. In any shaded or malfunctioning event in the fixed part, the PV modules in the adaptive bank are interconnected to the fixed part as an effective way to reduce the negative impact of shadow on the overall power system performance. Yet, the price paid is that this approach requires a large number of voltage/current sensors and switches for the interconnection between the fixed part and the adaptive bank. Particularly, for a high capacity power generation system, there must be a tremendous amount of backup PV modules deployed in the adaptive bank, that is, a rise in cost to business concerns. As presented in [10], a single maximum power point tracker (MPPT) in a PV module array is replaced with multiple MPPTs so as to reduce the impact of shaded or malfunctioning modules. In this manner, the power generation efficiency of the overall system can elevated as intended, while this MPP tracking strategy requires a greater number of DC-DC converters, a high-cost investment in facilities, than a single MPP tracker. In contrast, a shaded PV module(s) is excluded in the normal operation of a PV module array by manipulation of switches [11] for a maintained level of output power, but it necessitates a complex module configuration.
In light of this, a novel and smart configuration strategy is presented for a PV module array in this work. It merely requires a single MPP tracker, and a smaller number of switches than previous studies. All the switches here are manipulated in such a way that the PV module array is operated at the global MPP in any partially shaded and/or malfunctioning event.
In this paper, Section 2 described briefly the P-V and I-V characteristic curves for a PV module array under normal and shaded module conditions. Then, all the proposed and the most commonly seen PV module arrays in literature and practical applications are illustrated and compared in Section 3. Section 4 described briefly the implementation procedure of the proposed PSO algorithm to track the actual maximum power points when applied to multipeaked output characteristic curves of PV module arrays. The joint operation between a PSO-based global MPP tracker and a PV module array configuration strategy under shaded or malfunctioning conditions is presented in Section 5. Final, in Section 6, some experimental results are made to demonstrate the effectiveness of the proposed MPP tracker and a PV module array configuration strategy.
2. P-V and I-V Characteristic Curves for a PV Module Array under Normal and Shaded Module Conditions
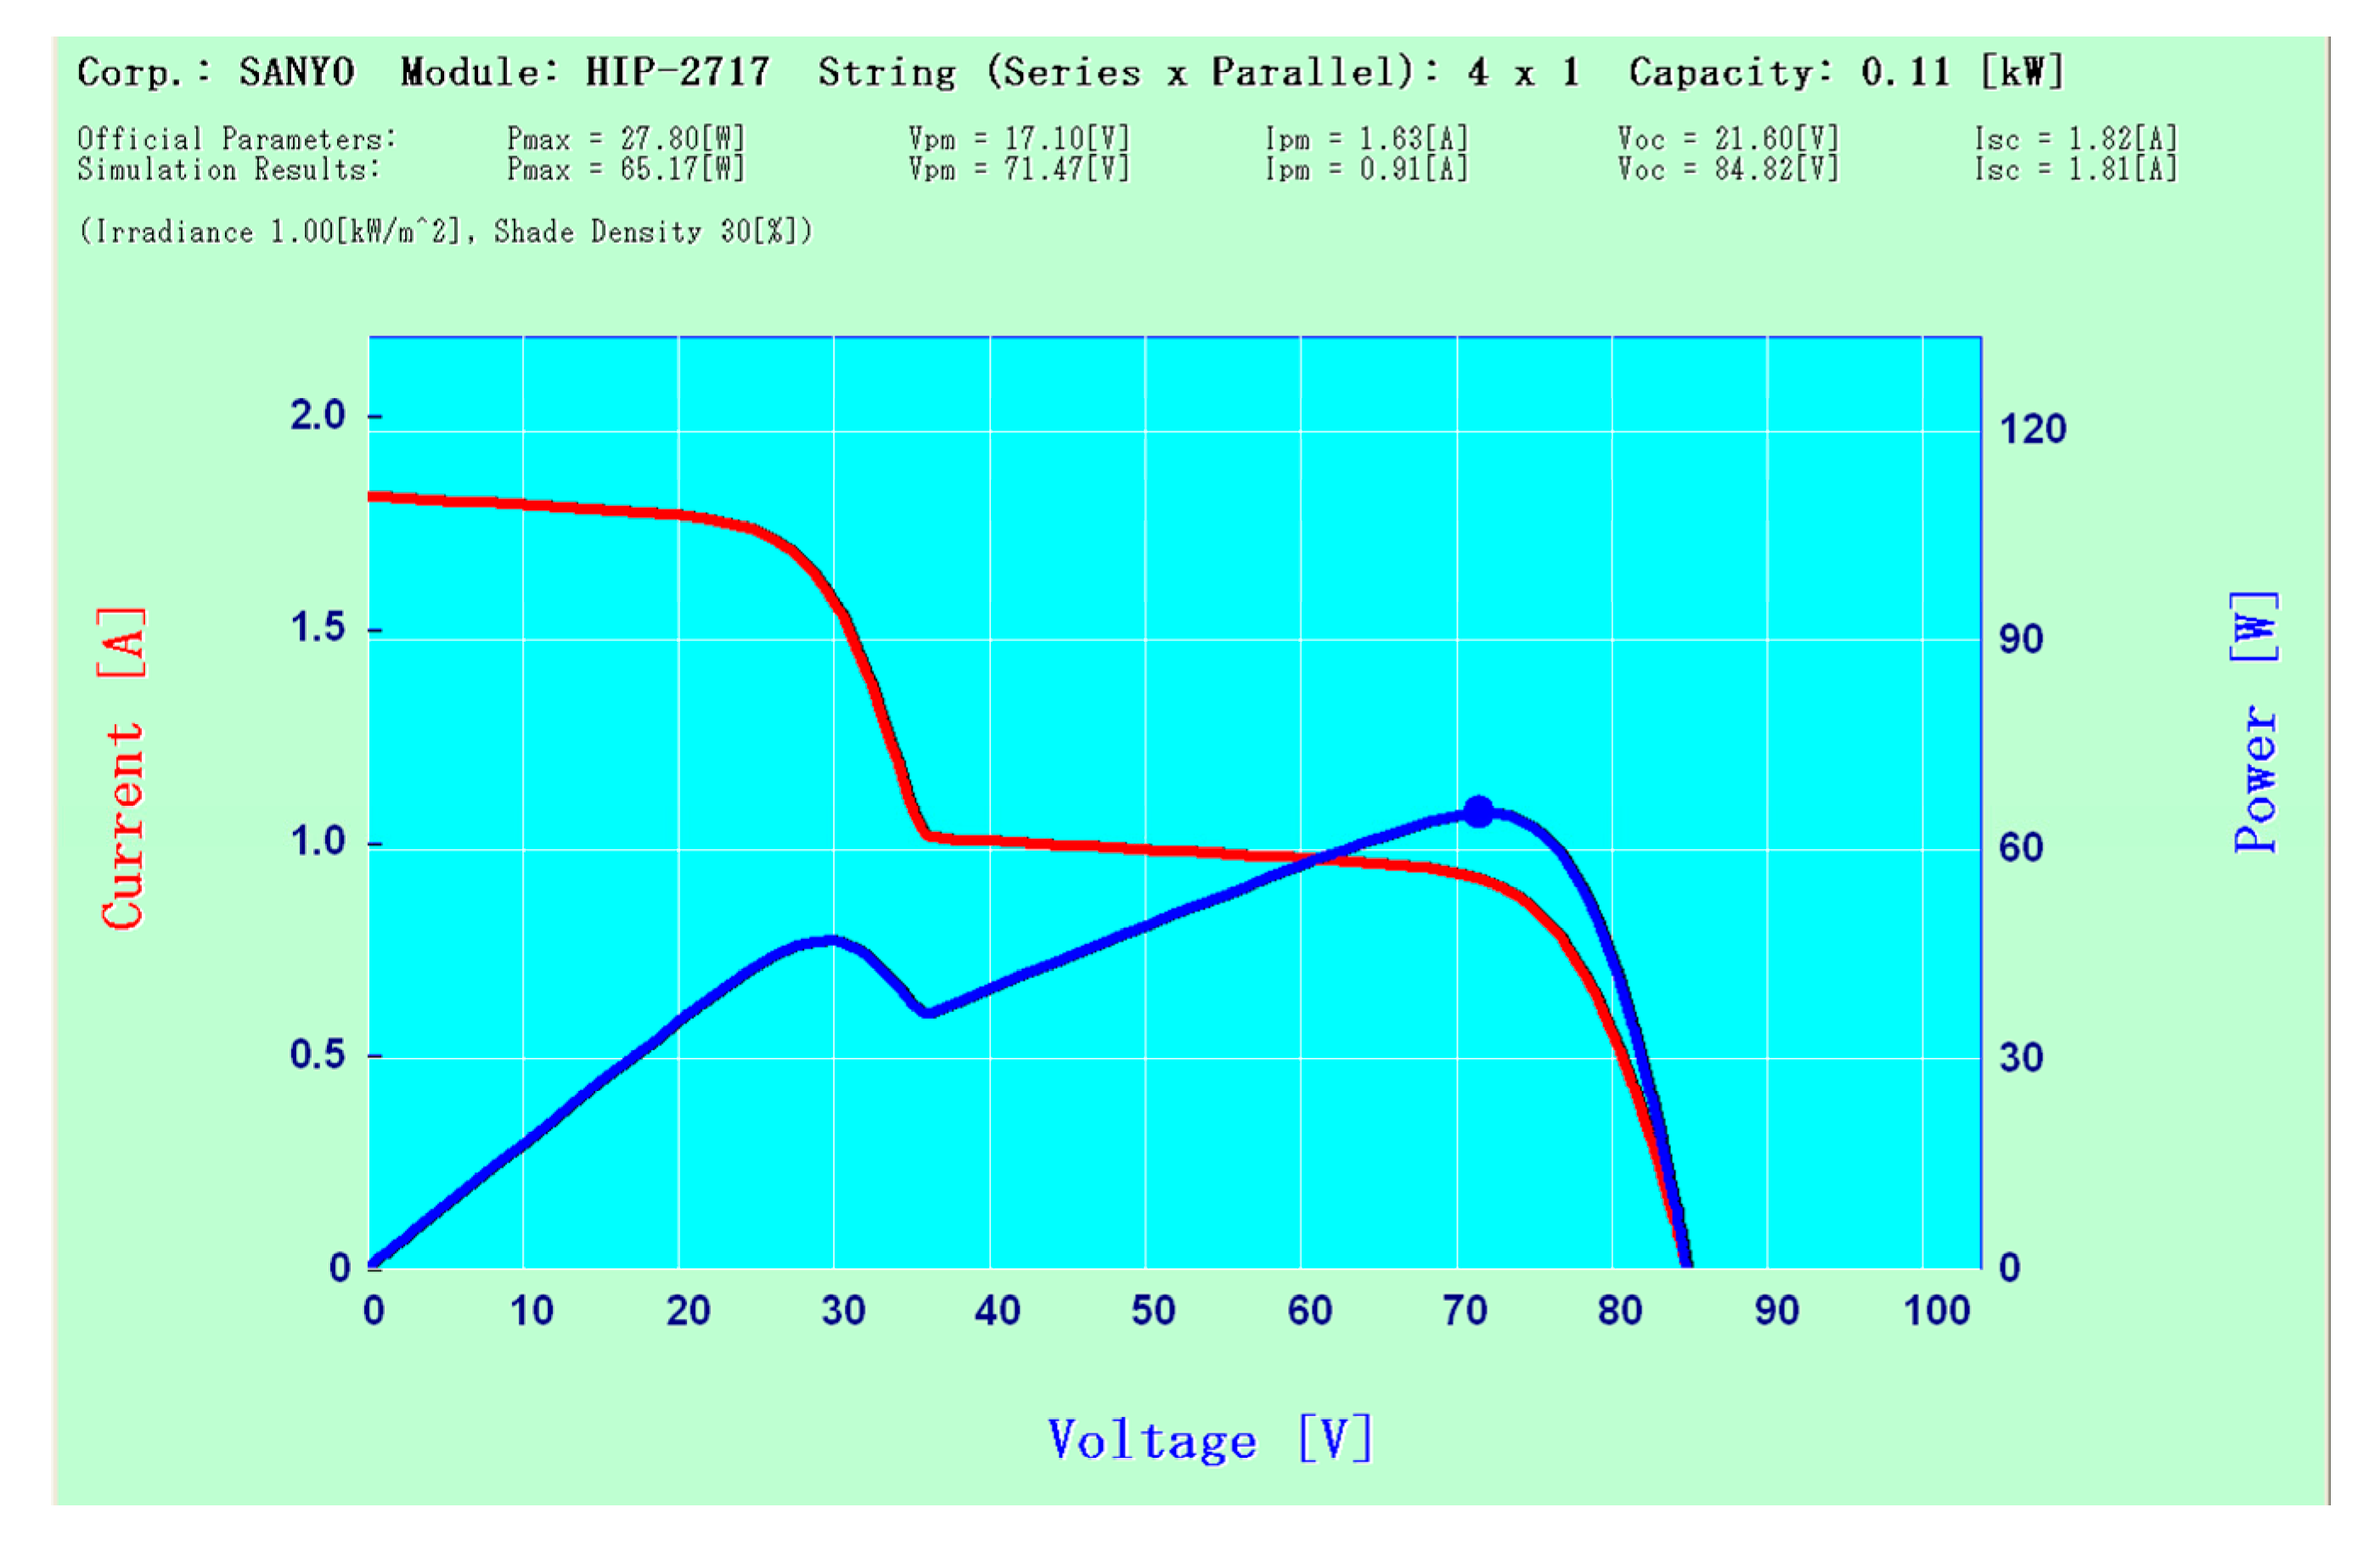
There is an obvious difference between the I-V as well as P-V characteristic curves of a PV module array in normal and abnormal operations. Presented in Figure 1 is a family of I-V and P-V characteristic curves of a 4-series 1-parallel array built with SANYO HIP-2717 PV modules [12] (Panasonic Co. Ltd., Kusatsu, Japan) at an irradiation between 200 and 1000 W/m2 and a surface temperature of 25 °C. As exhibited in Figure 2, multiple peaks appear on the I-V and P-V characteristic curves in the event of a single shaded PV module. In simple terms, a multiple peak problem is inevitably seen on both the P-V and I-V characteristic curves in a cascade array configuration under partially shaded conditions.
3. PV Module Array Configurations
All the proposed and the most commonly seen PV module arrays in literature and practical applications can be categorized into 6 types [13,14] as follows in terms of the way they are configured: (1) the first is referred to as a series array, since all the PV modules are connected in series, but a major disadvantage is a significant drop in the output current in the event of shaded or malfunctioning module; (2) the second is referred to as a parallel array, since all the modules are connected in parallel, but a major disadvantage is a considerable drop in the output voltage in case of shaded or malfunctioning module; (3) the third is referred to as a serial-parallel array, the most widely used configuration due to easy implementation, where PV modules are firstly connected in series and then in parallel; (4) the fourth is referred to as a total cross-tied (TCT) array where a number of PV modules are firstly connected in parallel as a subsystem, and multiple subsystems are then connected in series. In this manner, the performance of a PV module array can be improved relative to a parallel or series array; (5) the fifth is referred to as a bridge-linked (BL) array, where the PV modules are interconnected in a bridge rectifier fashion, but a disadvantage is that a partially shaded module is found to affect all the neighboring PV modules, which gives rise to a drop in both the output voltage and current, and an MPP tracker, as presented in [13], cannot successfully perform a tracking task in a BL array; and (6) the last is referred to as a honey-comb (HC) array, where all the PV modules are interconnected in a honey comb topology. In this context, the output power can be elevated to a certain extent under particular, but not all, partially shaded conditions.
All the six types of normal operating arrays deliver the same level of output power under identical operating conditions, i.e., irradiation and module surface temperature. Nonetheless, different array configurations account for different levels of output power in any shaded or module failure event. Providing less amount of output current or voltage than expected in normal operation, a partially shaded, or malfunctioning, PV module demonstrates adverse effect on all the adjacent modules, such that the overall output power falls. For this sake, a smart algorithm is developed as a way to optimize the array configuration for operation at the global MPP at all events.
As illustrated in Figure 3, there is a single switch between neighboring PV modules deployed along adjacent branches. This presented smart algorithm is demonstrated through a skillful manipulation of switch conduction. Accordingly, the module configuration is optimized in any case whenever there is a shadow or/and malfunction event in a PV module(s), such that the PV module array operates constantly at the global MPP as intended. This novel algorithm is development based on a PSO algorithm, which will be detailed in the following section.
4. Typical PSO Algorithm
Proposed by Kennedy and Eberhart in 1995 [15,16], the particle swarm optimization (PSO) algorithm is of collective intelligence and pertains to a certain type of evolutionary algorithm. The development of the original PSO algorithm is inspired by the way a flock of birds forage, and is successfully applied to resolve a number of optimization problems such as described in [17]. Suppose that there is a bird, referred to as a particle in a PSO algorithm, flying in the sky. Each moving particle in the space is associated with a fitness value and is aware of its current optimal fitness value and position, referred to as the particle optimal value pbest. pbest is in essence the individual experience of each particle, and the global optimum as well as the optimal position, referred to as the global optimal value gbest, is shared by all the particles. For this sake, the position and the velocity of each particle are updated through the experience of individual particle and the whole particle swarm. To begin with, all the particles are randomly distributed over the field of interest. Provided that a particle verges on an optimal object value, all the particles will search toward the same optimal object value, which may be a local, but may not be the global, optimum. Thus, gbest must be updated in order that all the particles can converge to the global optimum [18].
As stated previously, a PSO algorithm performs a comprehensive search task in a distributed manner with memory over a search scope. In the original PSO algorithm, the velocity of each particle is updated through the differences between the velocity and pbest/gbest, and the position is updated by the updated velocity. Accordingly, the search difference radius and direction are updated. A typical PSO algorithm is stated as follows [19]:
- Stept 1
- Build an optimal object function,
- Stept 2
- Initialize a particle swarm, and then generate the initial position and velocity of each particle in a random manner,
- Stept 3
- The fitness value of each particle is evaluated through the object function and is then compared with those of others so as to find the particle optimal value pbest, by which the search direction of each particle is updated,
- Stept 4
- Either the particle optimal value pbest or the global optimal value gbest is saved as the updated gbest, whichever is larger, by which the search direction of each particle is updated,
- Stept 5
- The velocity and position of a particle is updated by the kernel equation in the PSO algorithm, expressed as:where and respectively represent the velocities of particle j at discrete time instants k + 1 and k, C1 and C2 the learning factors, w the inertia weighting, the optimal value of particle j at time instant k, gbest the global optimal value, and the positions of particle j at time instants k + 1 and k, and rand (·) a random number between 0 and 1, and
- Stept 6
- The procedure for finding the fitness of a fitness function is repeated until the global optimization solution is found or the specified number of iterations is reached.
5. Array Configuration Optimization Strategy
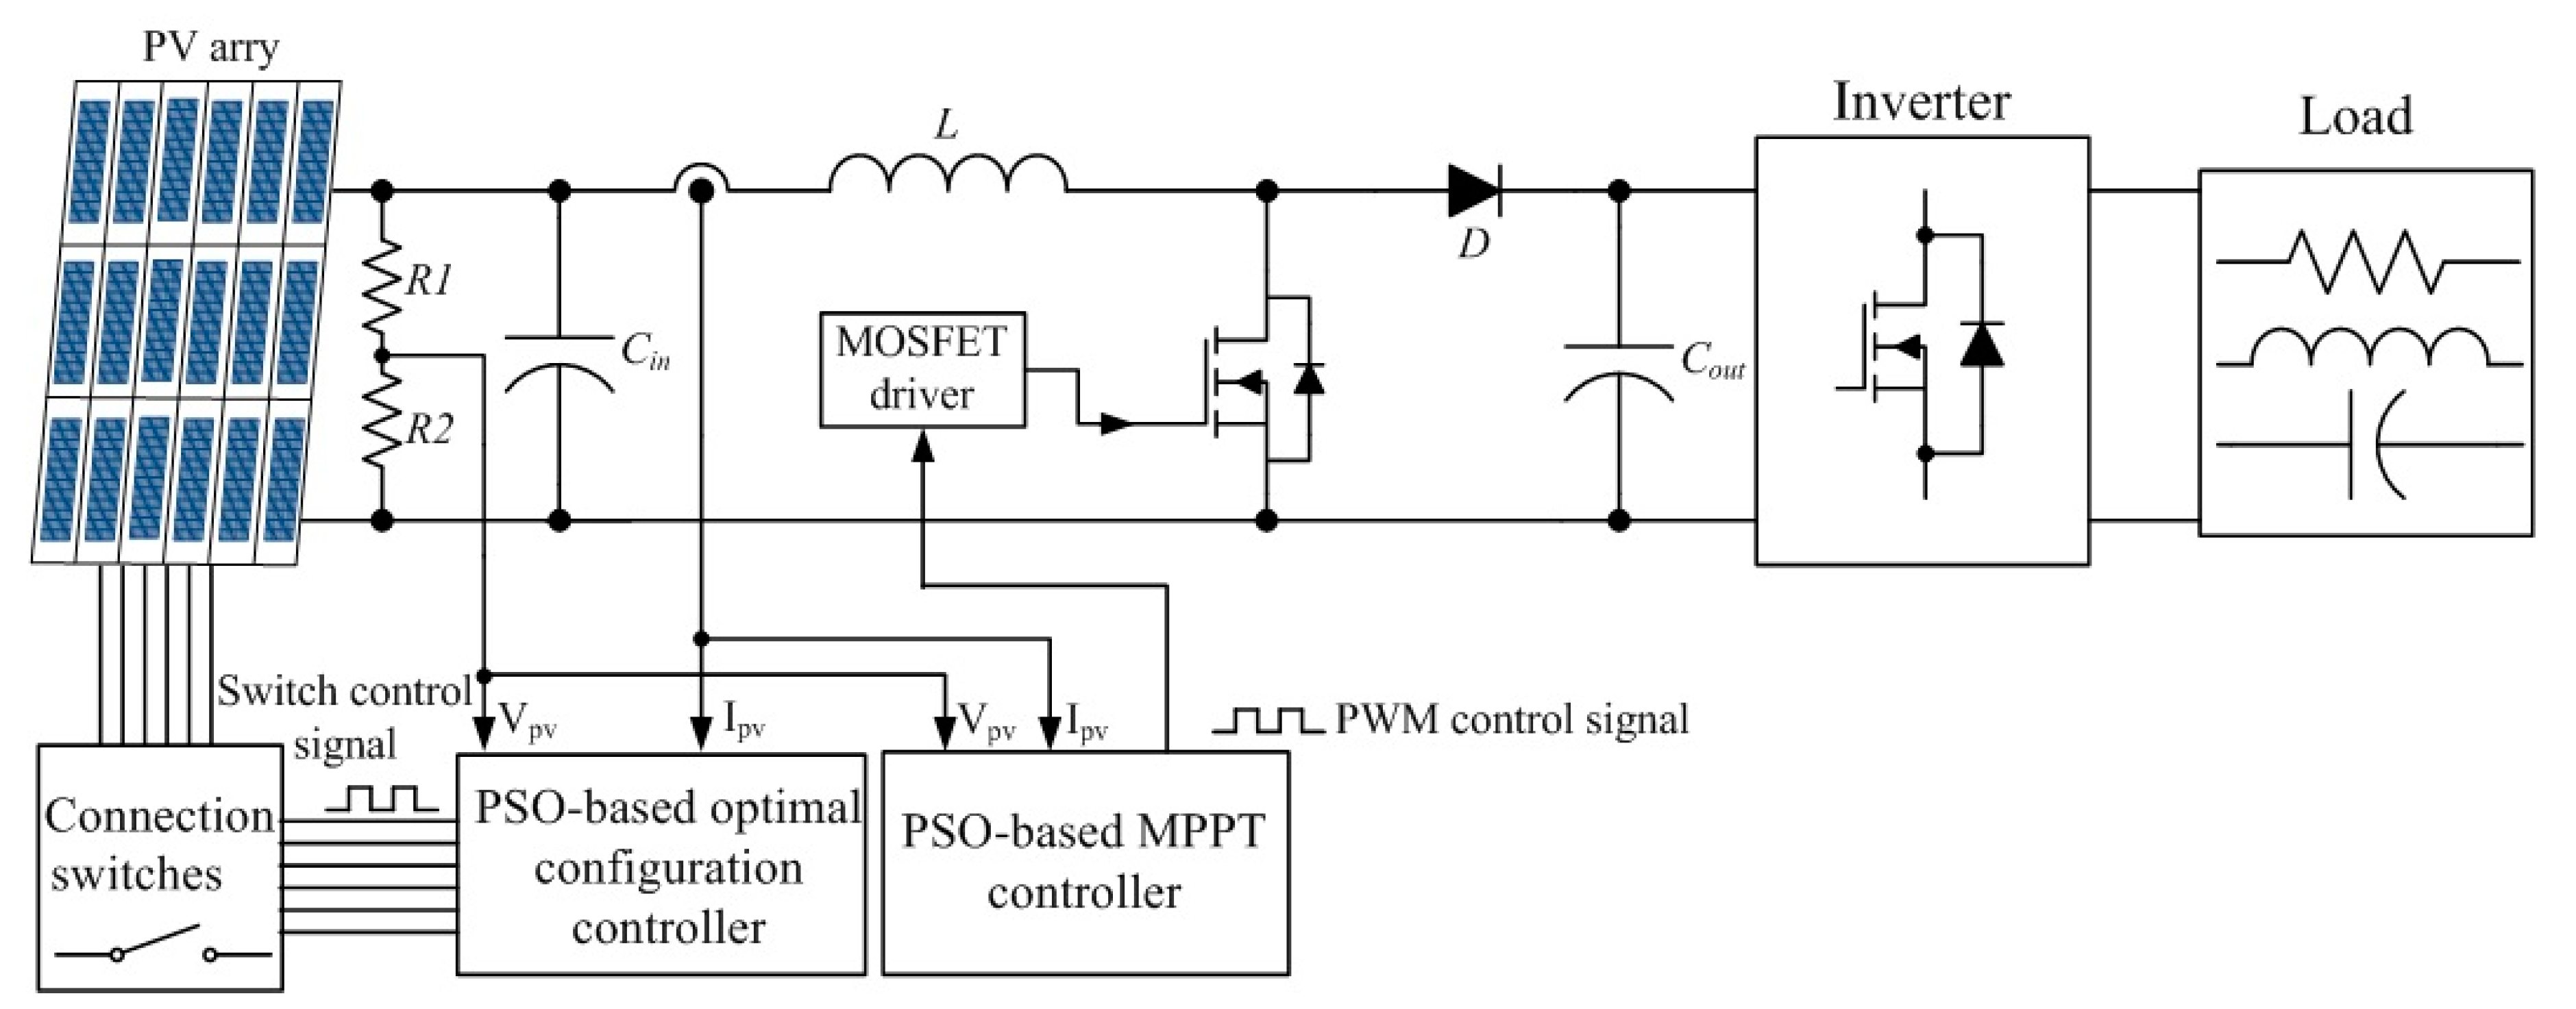
As presented in Figure 4, the proposed global MPP tracking system for a photovoltaic module array mainly involves three subsystems, namely: (1) a boost converter; (2) an MPP tracker; and (3) an array configuration controller. Skillful manipulation of the boost converter is made using the MPP tracker, such that the operating point of the photovoltaic module array stays constantly at the MPP. In normal operations, all the switch conduction statuses remain unchanged, and the array configuration controller remains disabled until there is any shadow, or malfunctioning, event. In contrast, the moment there is any shadow event or module failure detected, the array configuration controller operates in such a way that the output power is maximized through switch controlled reconfiguration.
5.1. MPPT Operation under Shaded and/or Malfunctioning PV Module Conditions
The output power of a photovoltaic power generating system is found to a function of its load. In this context, the electricity converted from the solar energy cannot be fully delivered to the load. Hence, placed between the photovoltaic module array and the load, an MPP tracker is designed to make the photovoltaic module array operate at an MPP at all events. As suggested in [20], an MPP tracker is trapped at a local, rather than the intended global MPP on a P-V characteristic curve with multiple peaks, in case of any shaded or malfunctioning PV modules. In view of this, a PSO-based MPP tracking algorithm is presented as an effective solution to the above-stated problem for an elevated power generation efficiency of a photovoltaic module array. The PSO-based tracking algorithm is stated as follows [21]:
- Stept 1
- Initialize all the PSO parameters, the duty cycle of the boost converter is treated as the position of a particle, i.e., , and an optimal object function represents the output power of the photovoltaic module array, defined as ,
- Step 2
- The particle position, namely the duty cycle value, is applied to the boost converter. Subsequently, given the output voltage and current, the output power can be evaluated as the value of the object function,
- Step 3
- Either the output power evaluated in Step 2 or the particle optimal value pbest is saved as the updated pbest, whichever is larger. Subsequently, either pbest or the global optimal value gbest is saved as the updated gbest, whichever is larger,
- Step 4
- The velocities and the positions of all the particles are updated using the kernel equation in a PSO algorithm,
- Step 5
- Repeat Steps 2–4 until the specified number of iterations is reached, and
- Step 6
- In the event of any change in the PV module conditions, either shaded or malfunctioning, skip to Step 1 for another MPP tracking process. Otherwise, stay idle.
5.2. Joint Operation between an MPPT and the Proposed Configuration Optimization Strategy
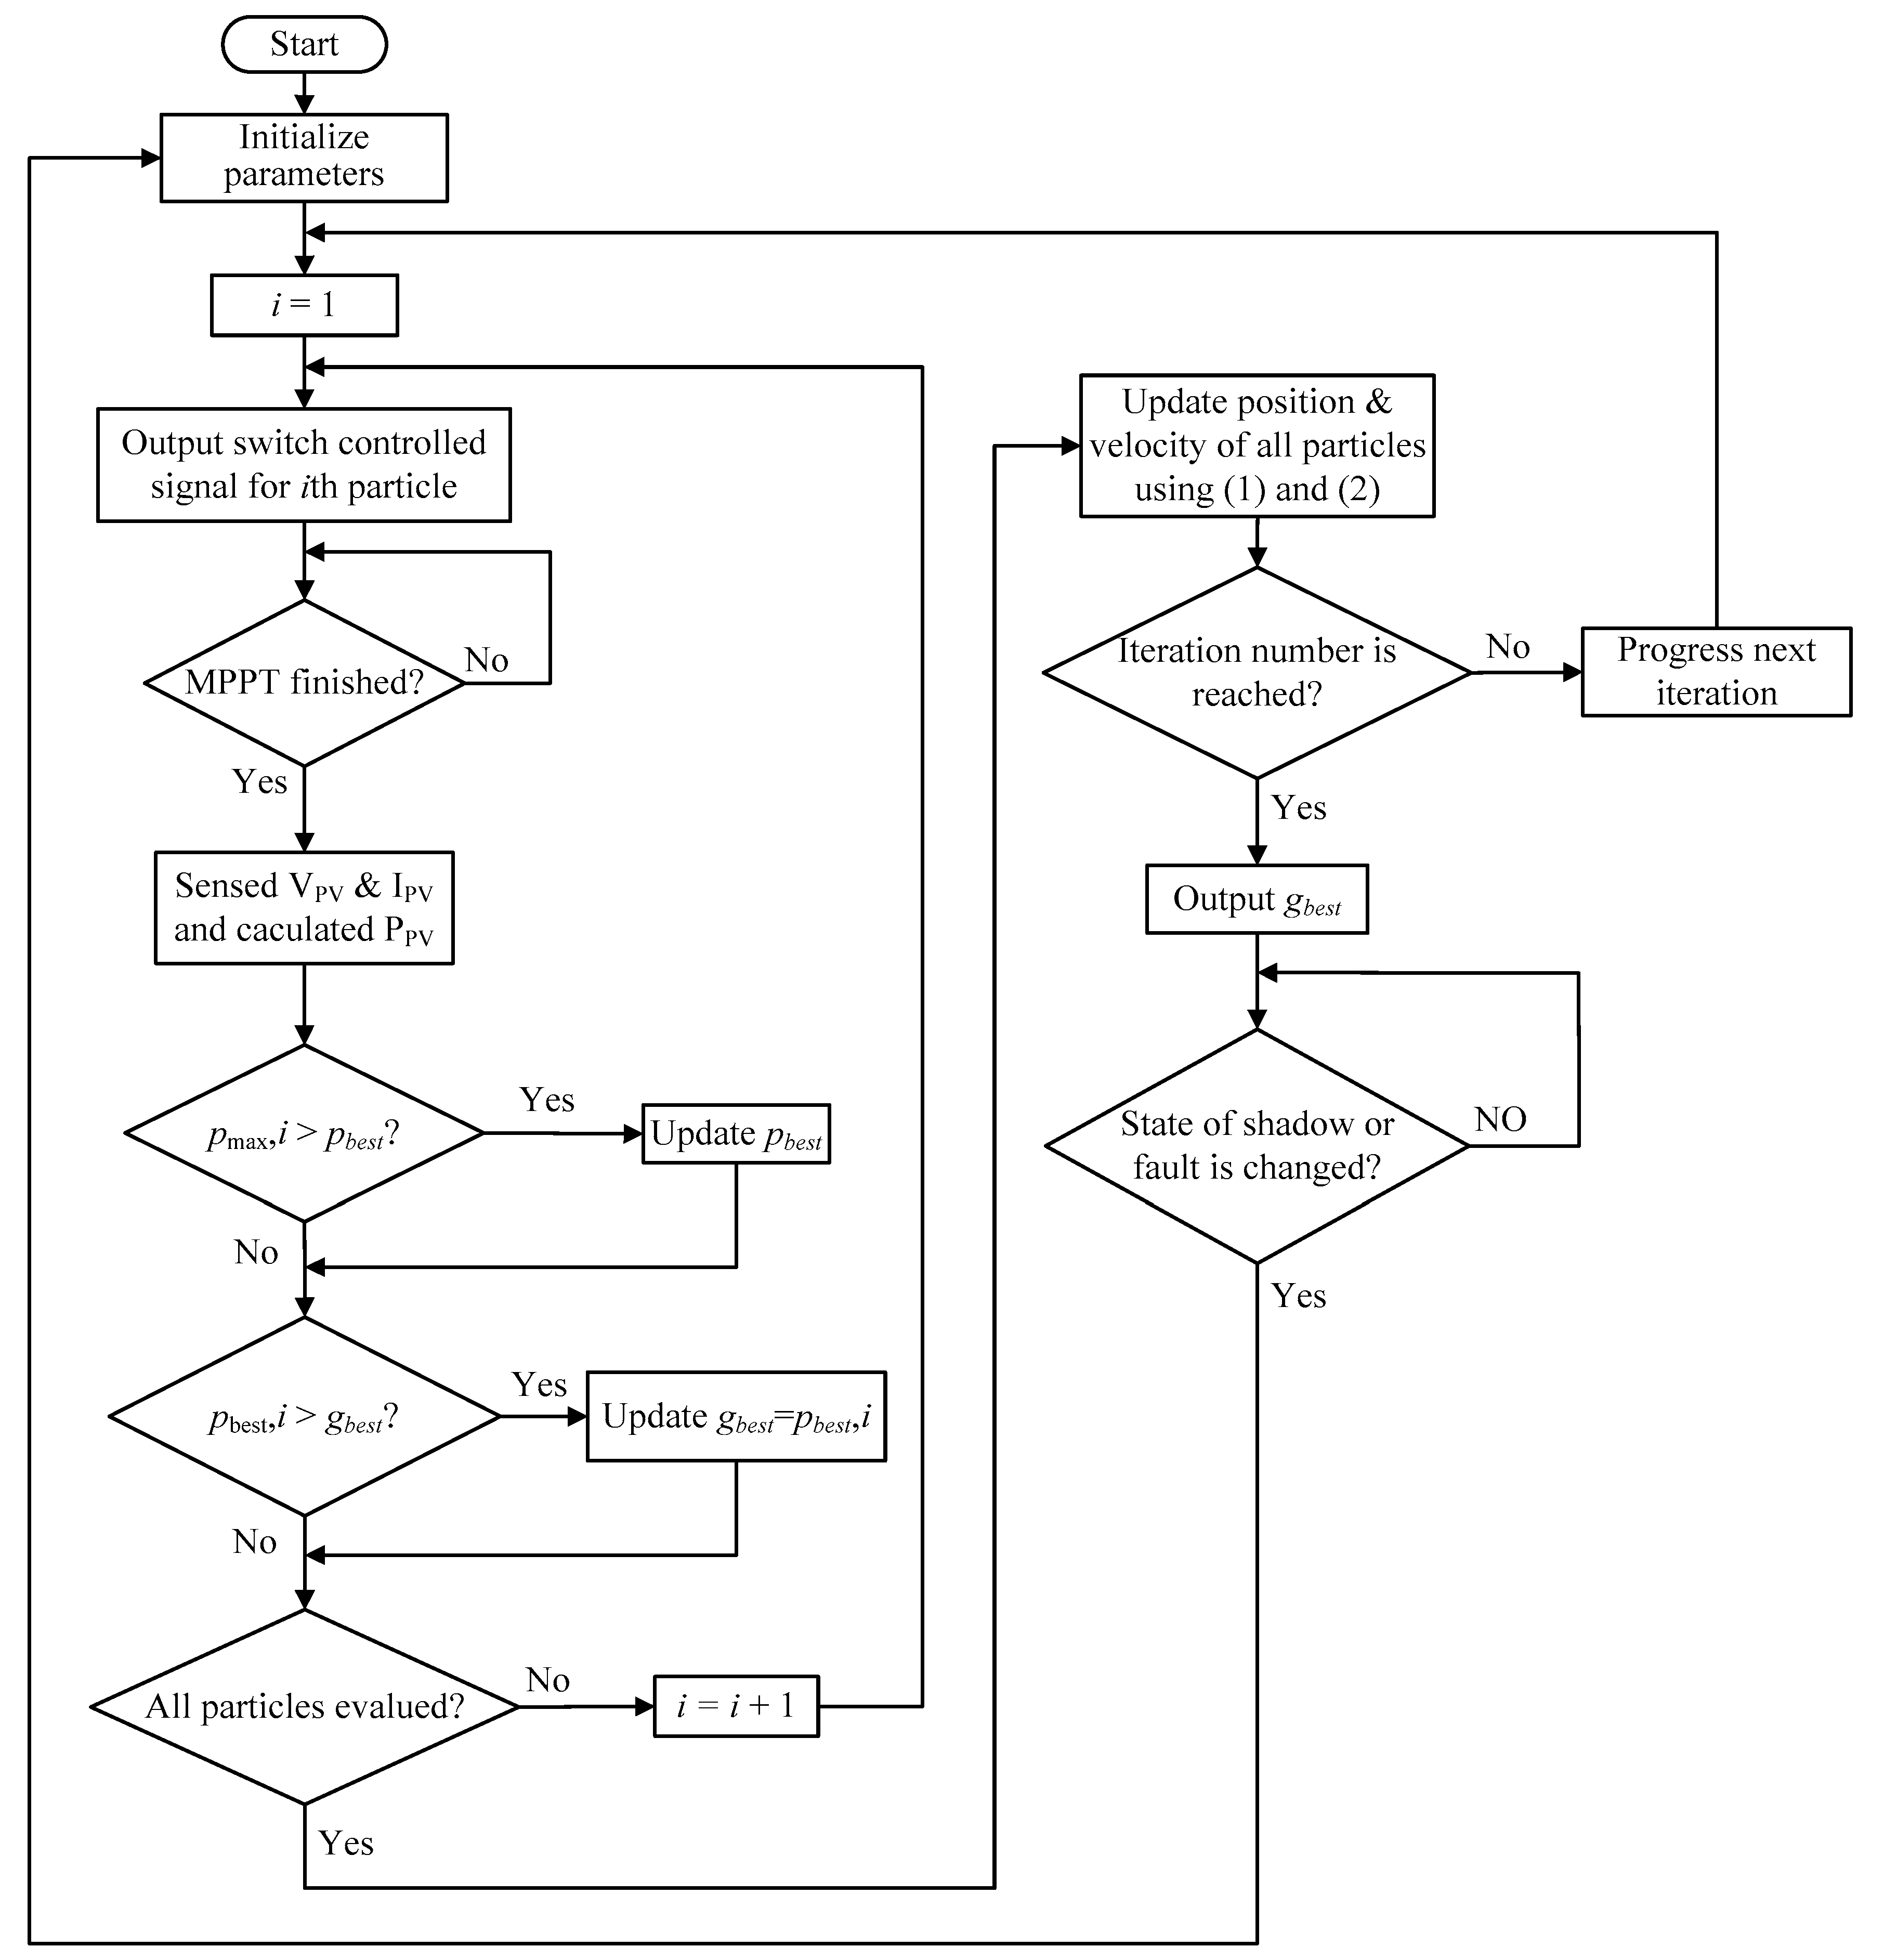
In an effort to maximize the output power, a PSO-based MPP tracker works together with a smart array configuration strategy. The moment either a shaded event(s) or a PV module failure(s) is detected through a comparison between the maximized output power and a reference in a database under identical operating conditions, the presented array configuration strategy, as illustrated in Figure 5, is employed and stated as follows:
- Step 1
- Initialize all the PSO parameters, and the position of particle j, , is regarded as the switch control signals. Then, define the optimal object function as , the output power of a PV module array,
- Step 2
- All the switches are manipulated by the above-stated switch control signals. Subsequently, an MPP tracker is enabled to perform an MPP tracking task,
- Step 3
- The MPP current and voltage are measured so as to evaluate the output power as the object function value,
- Step 4
- Either the evaluated output power or the particle optimal value pbest is saved as the updated pbest, whichever is larger. Subsequently, either pbest or the global optimal value gbest is saved as the updated gbest, whichever is larger,
- Step 5
- The position and velocity of each particle are updated by the kernel equations in the PSO algorithm,
- Step 6
- Repeat Steps 2–5 until the specified number of iterations is reached, and
- Step 7
- In case of any change in the PV module conditions, skip back to Step 1 for another tracking task. Otherwise, stay idle.
6. Experimental Results
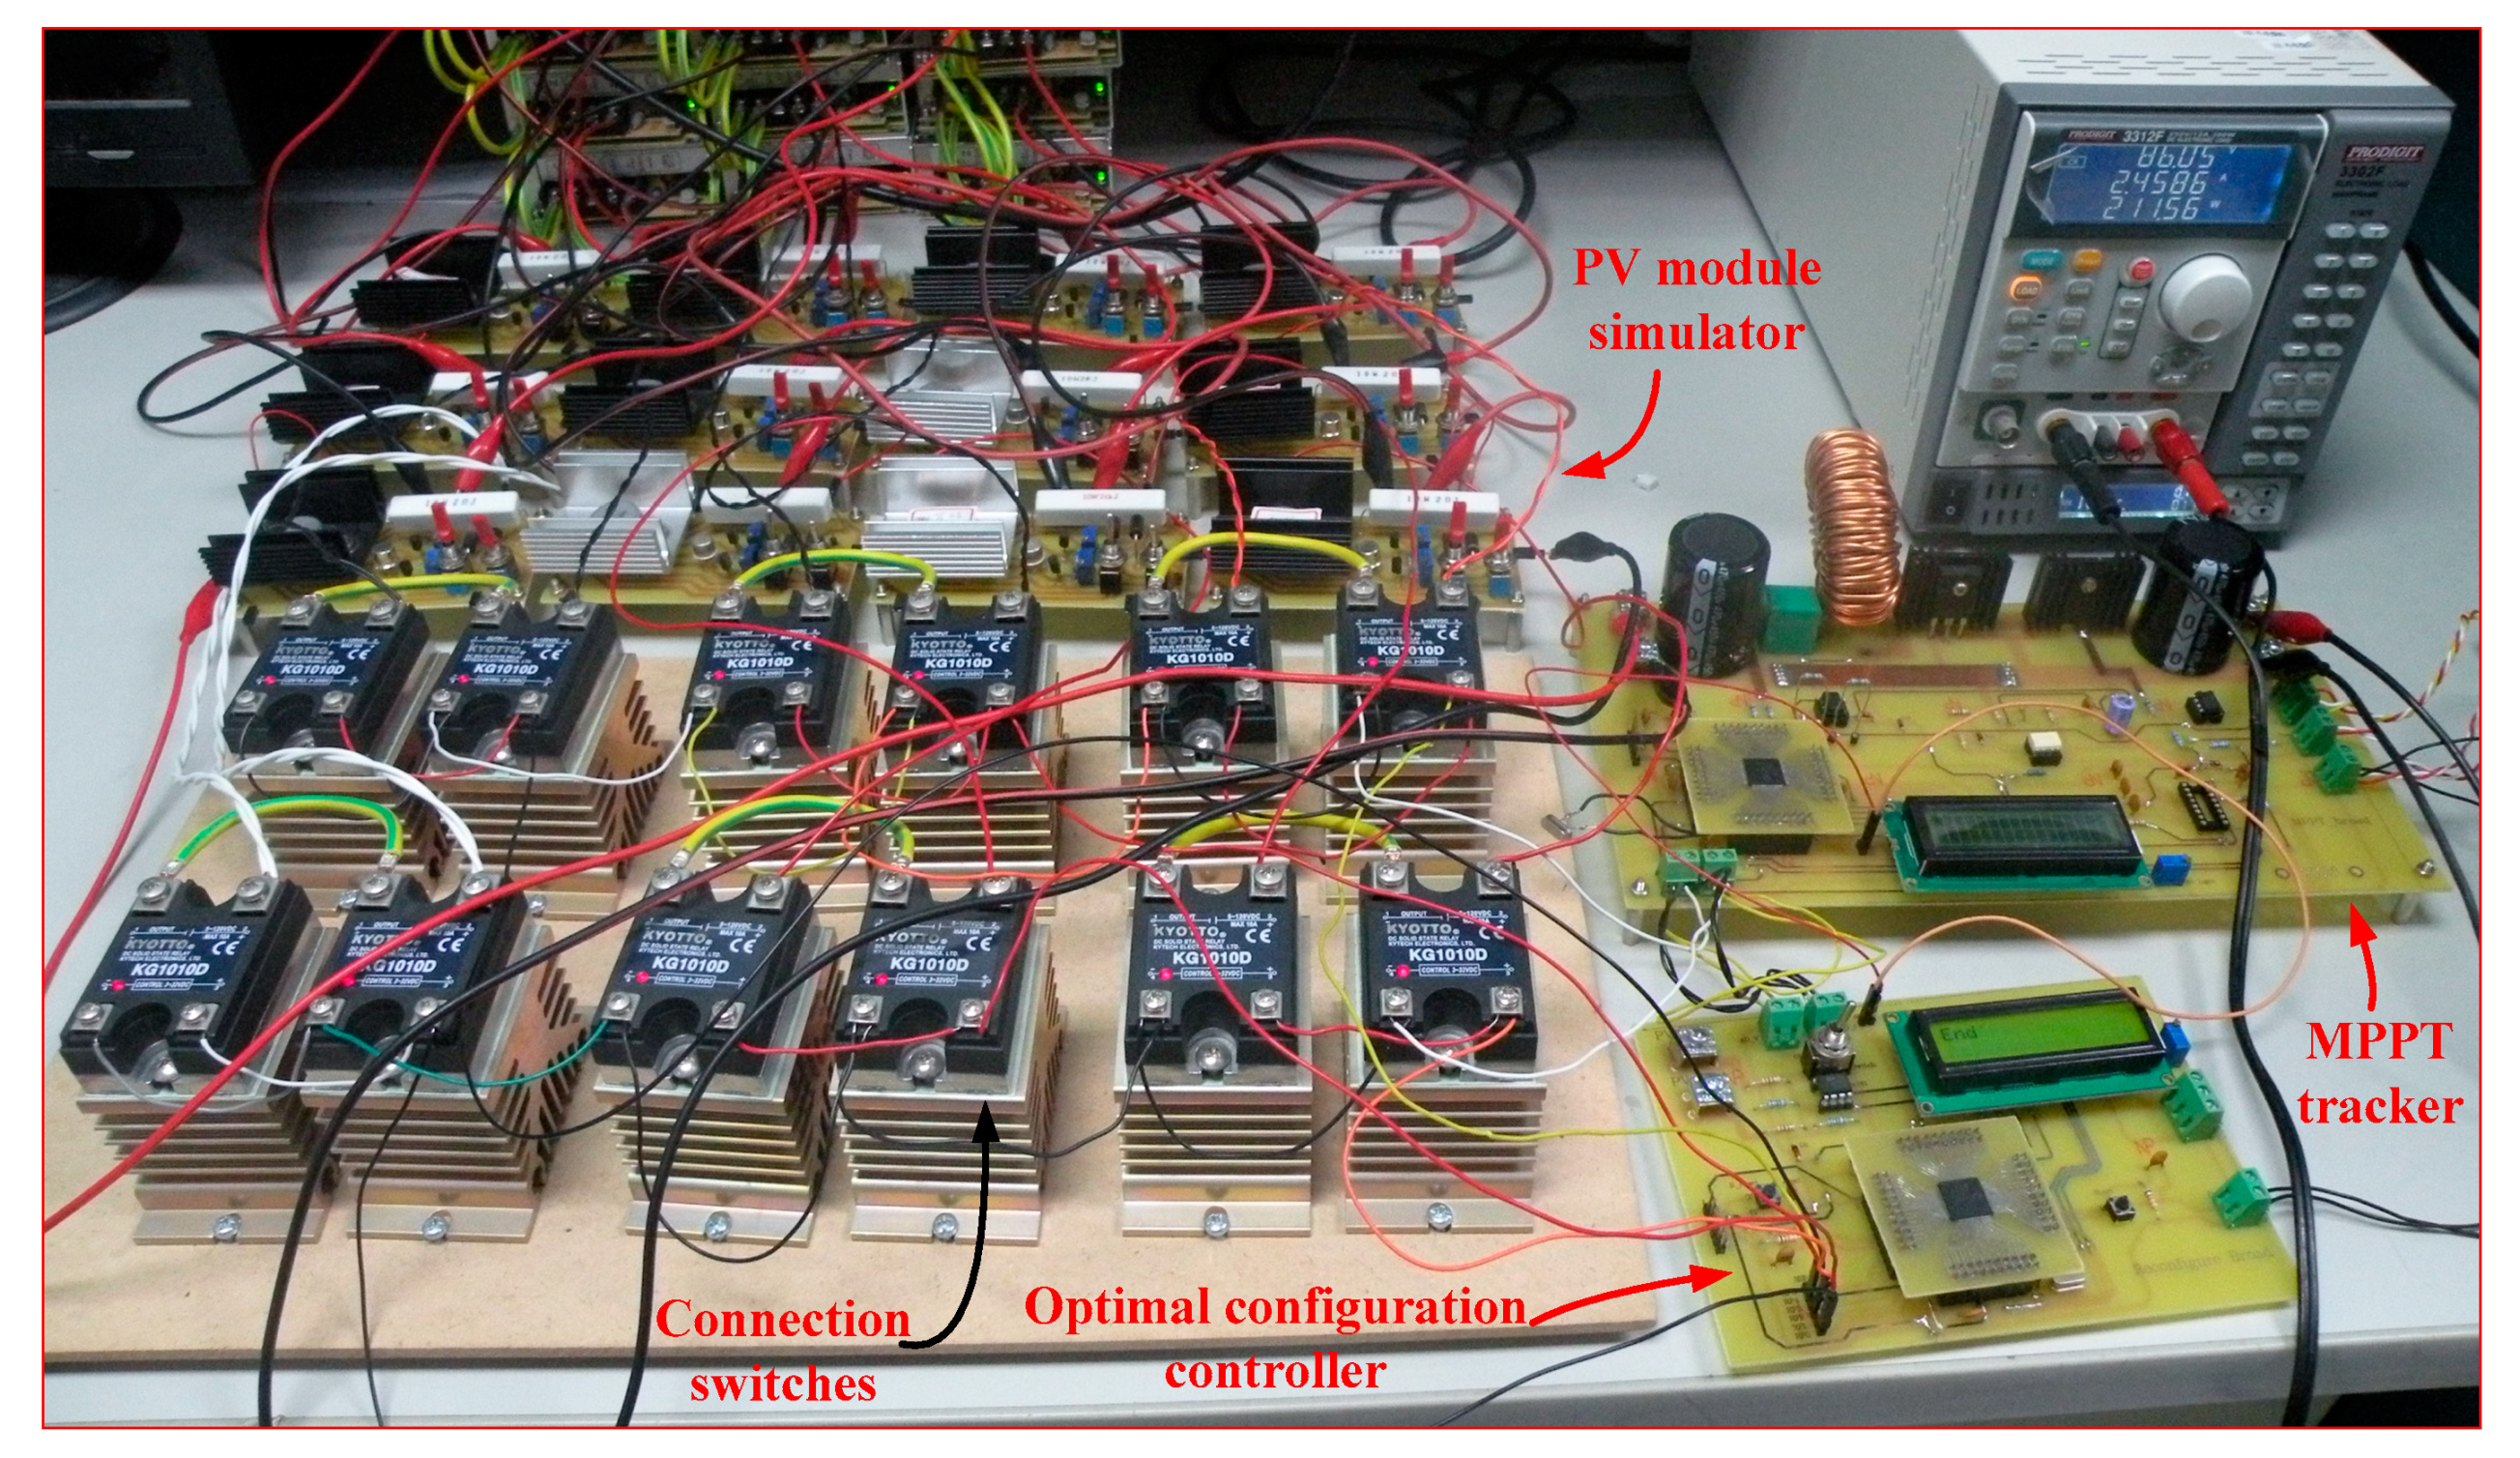
Experiments are conducted on a 4-series 3-parallel array built with SANYO HIP2717 modules. Tabulated in Table 1 are the electric specifications of an HIP 2717 module under standard test condition (STC) [12] and in Table 2 are PSO-parameters employed in this work. In general, C1, C2, and w in the traditional PSO algorithm are fixed values set to w = (10 − C1 − C2)/10. Therefore, the parameters of this paper are chosen as shown in Table 2. The experimental results also show that the selected parameters respond quickly and can track to the global maximum power point. Because the more particles, the longer the time of per iteration, the particles are chosen four to shorten the time of each iteration. The measured results show that the global maximum power point can be tracked in any test case. Exhibited in Figure 6 is a photo of the tracking system under test for arbitrary partially shaded and/or malfunctioning module cases.
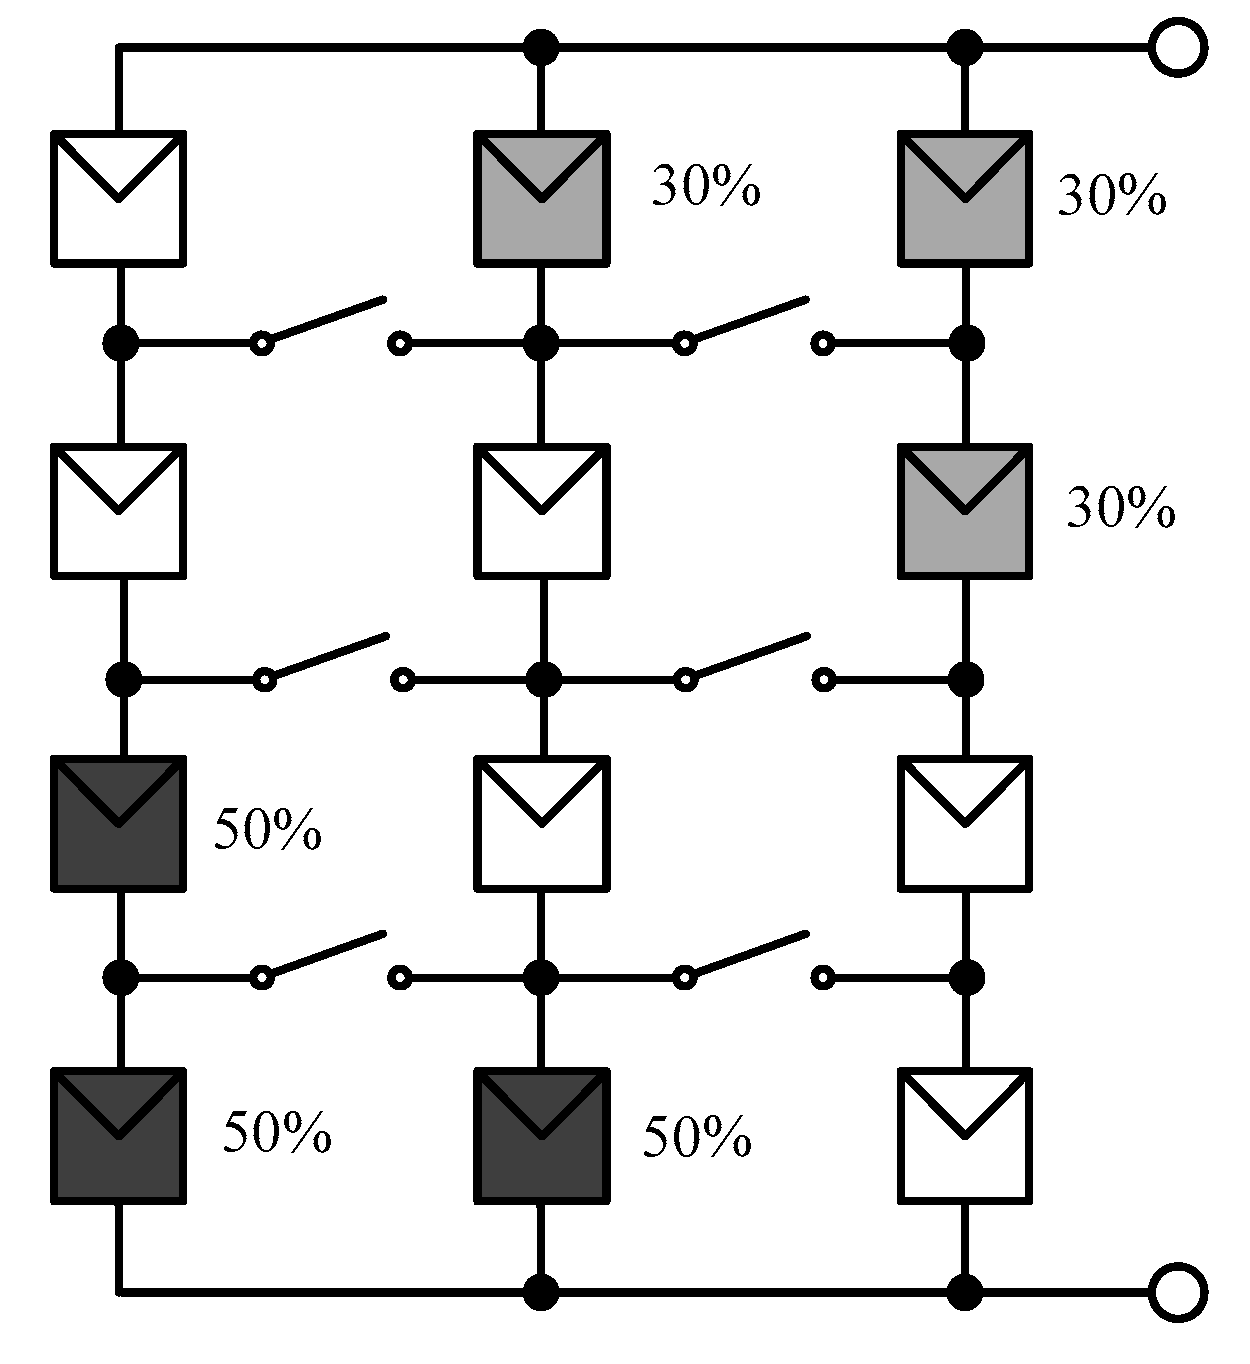
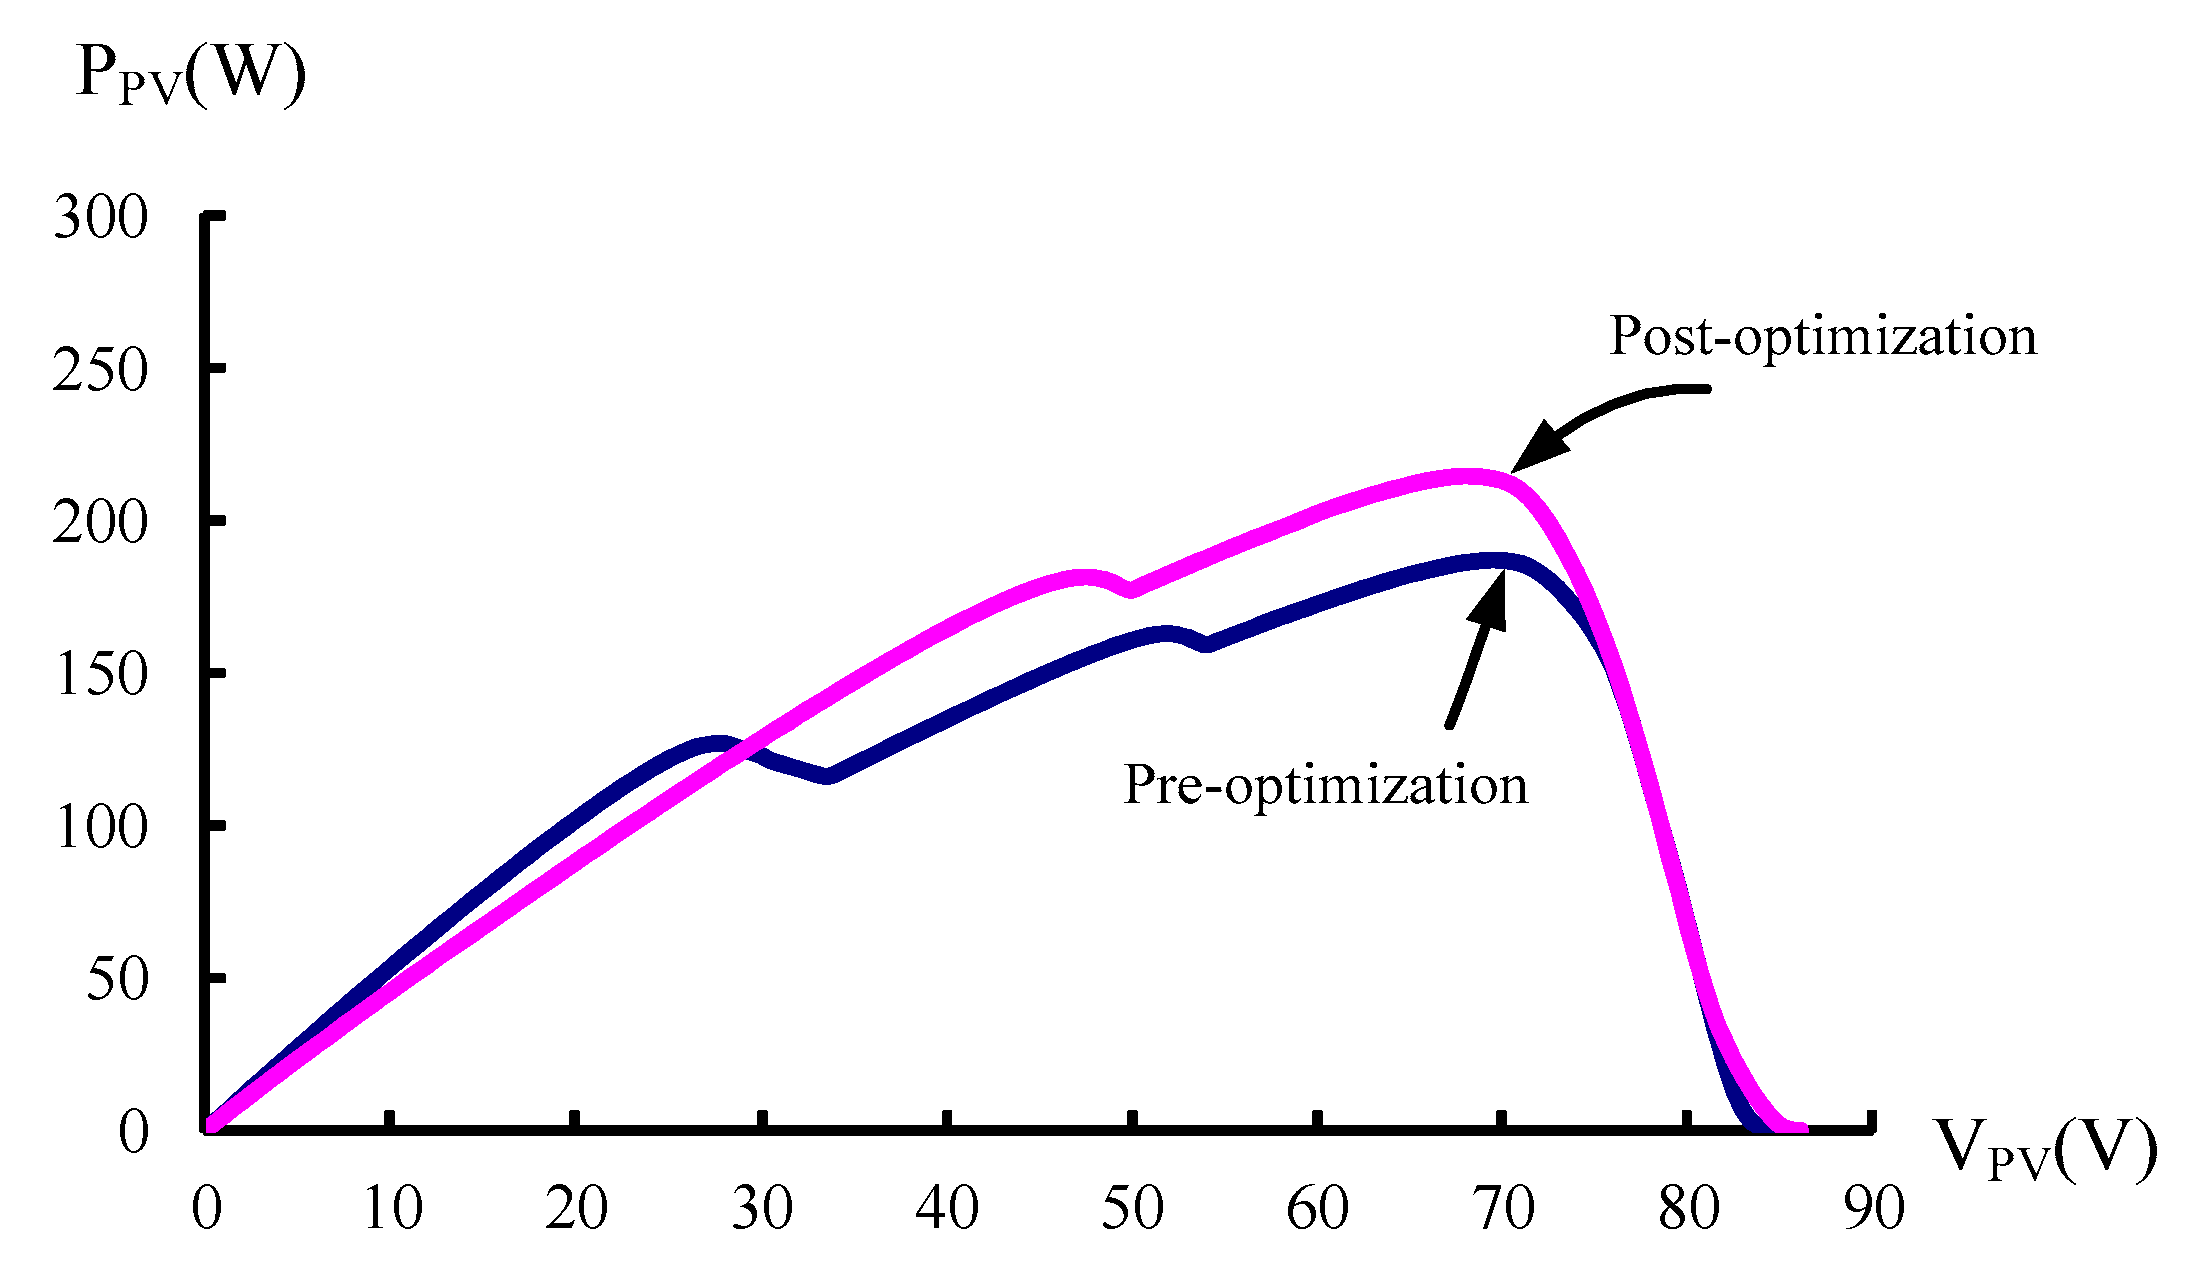
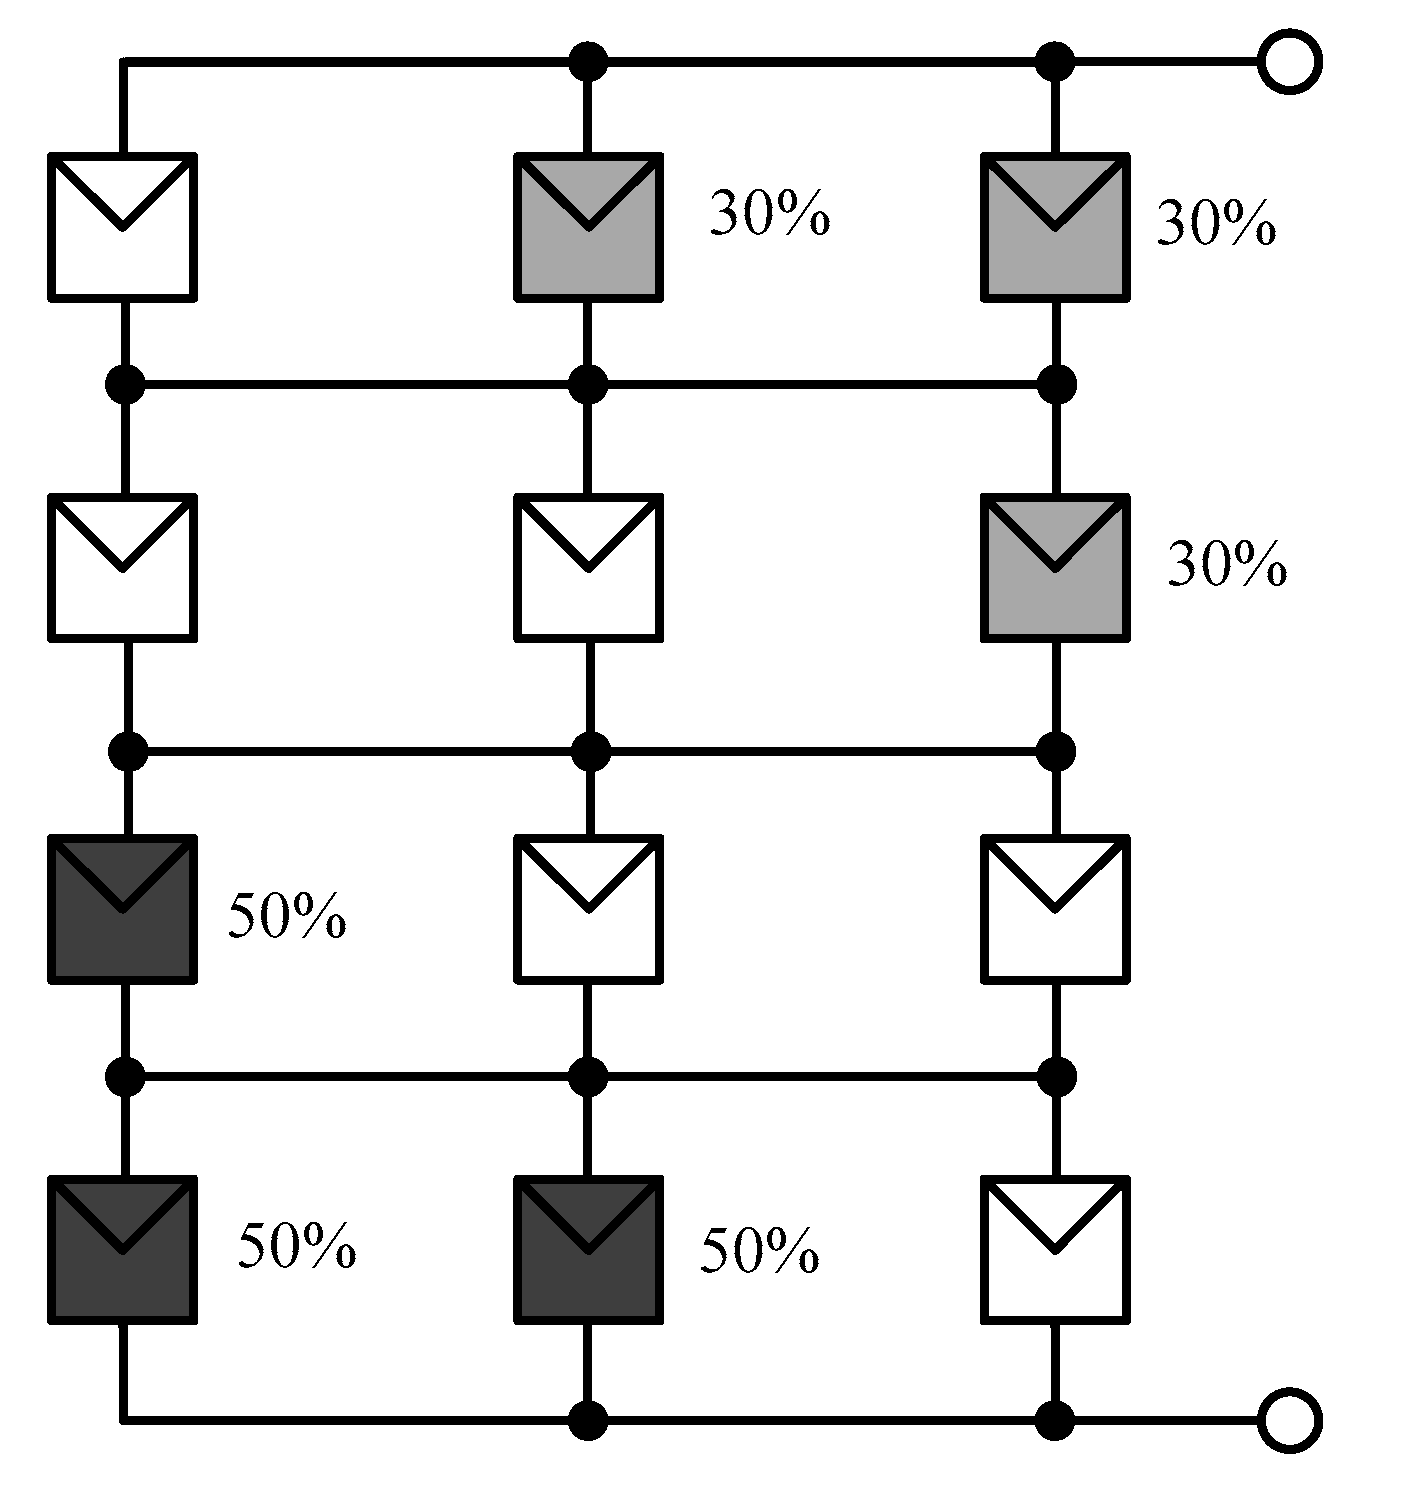
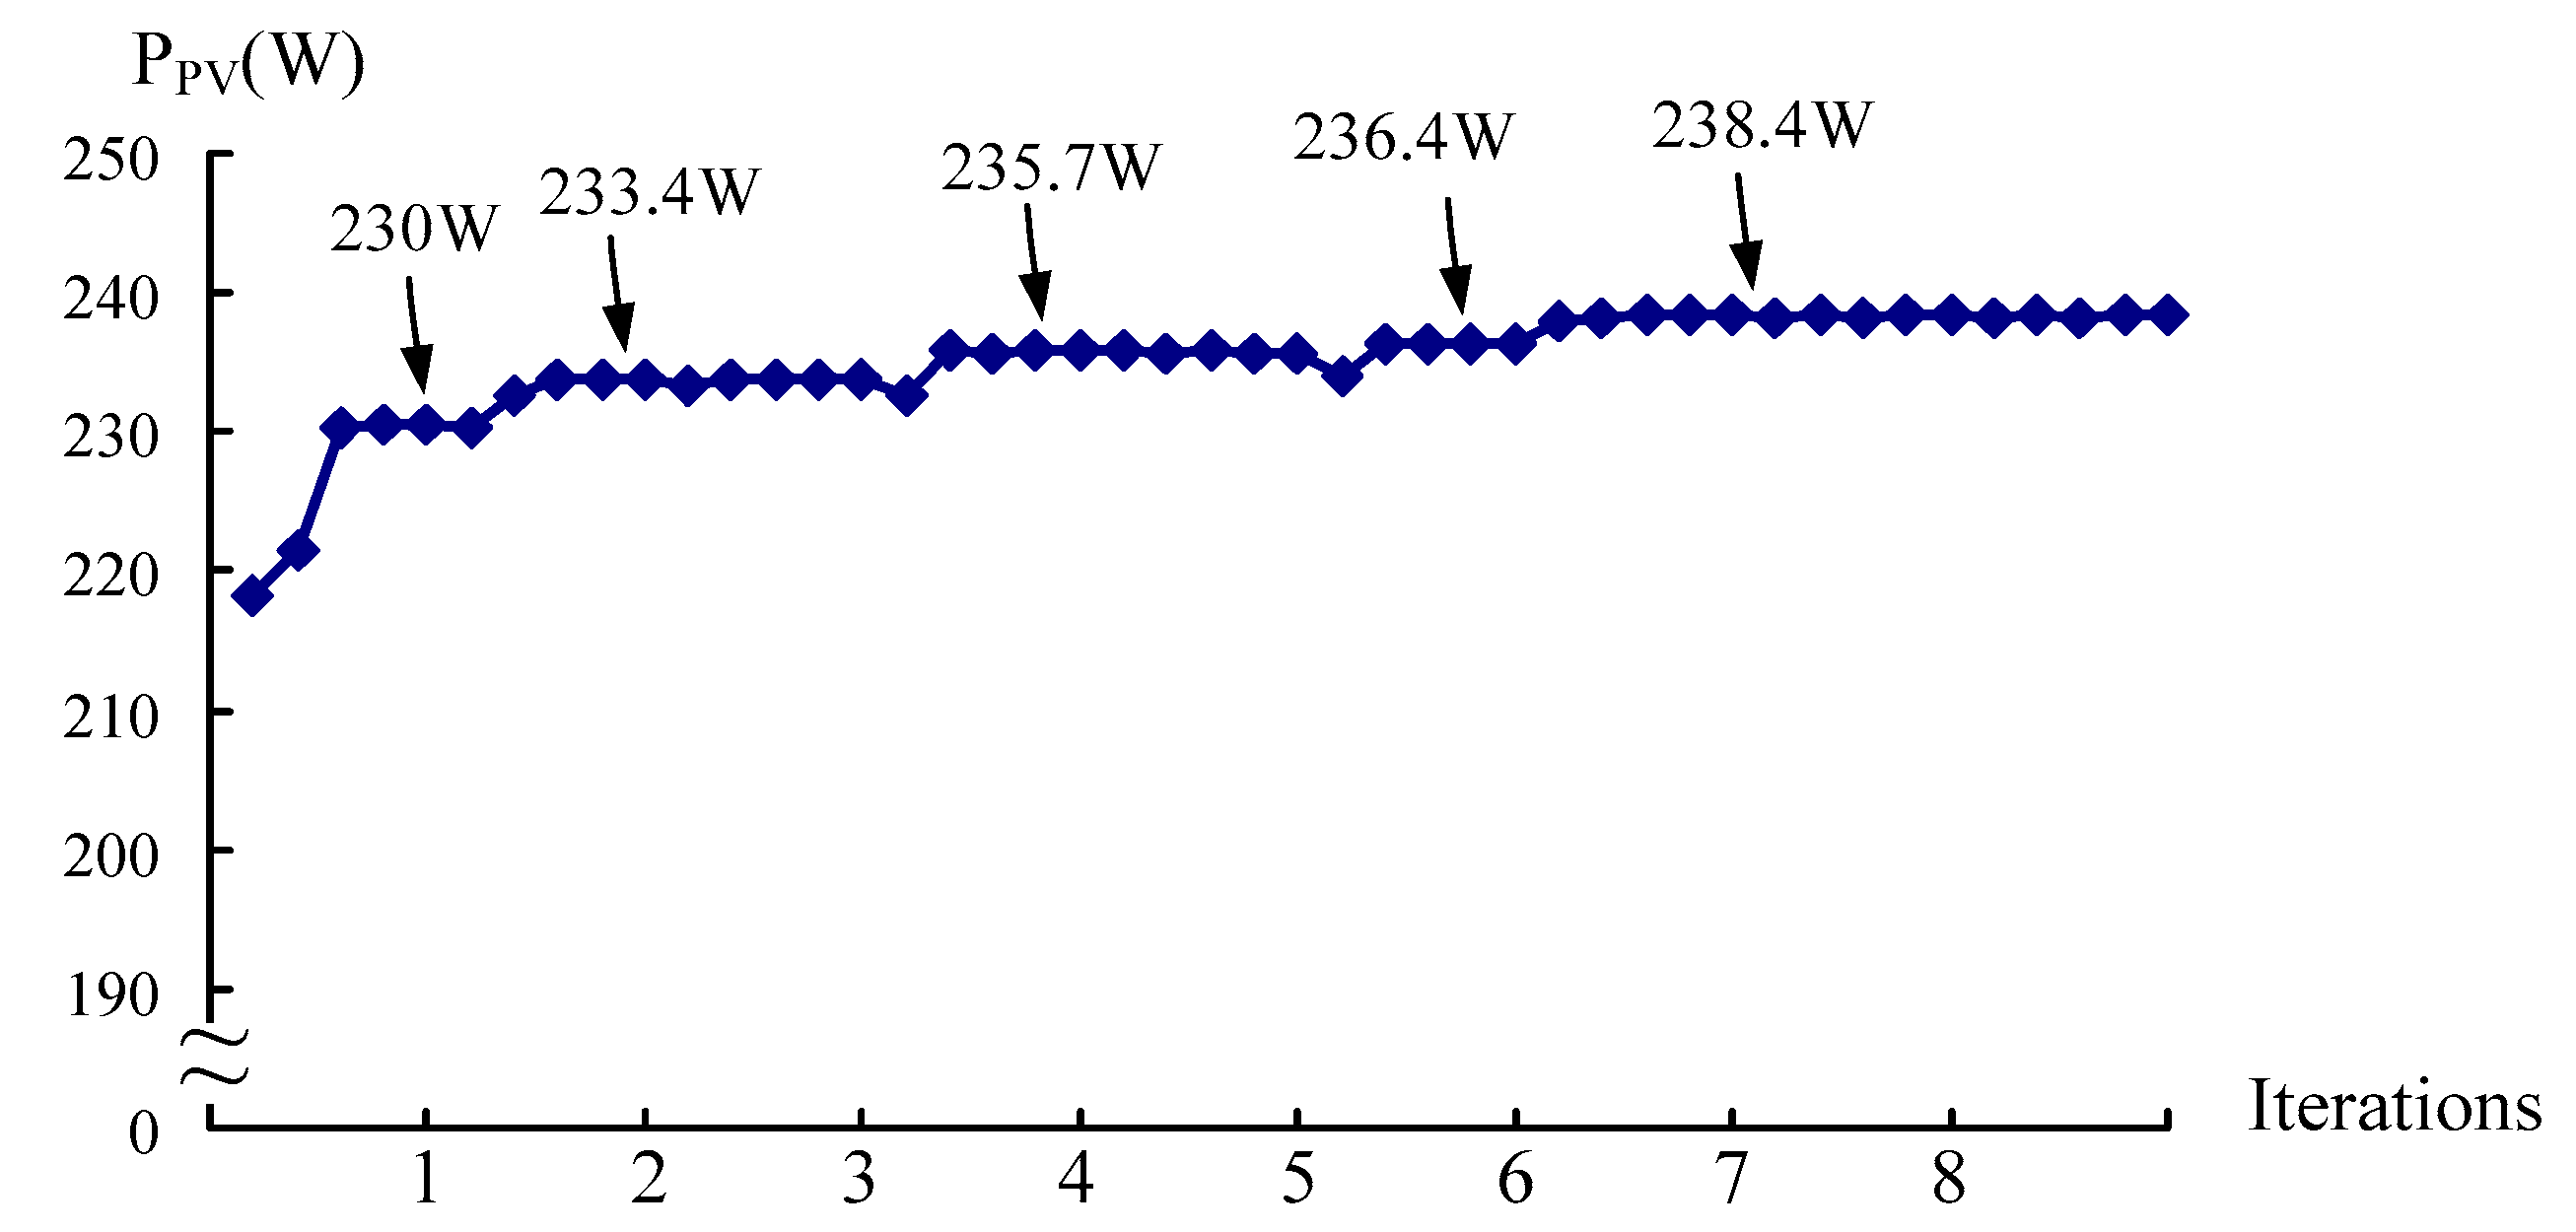
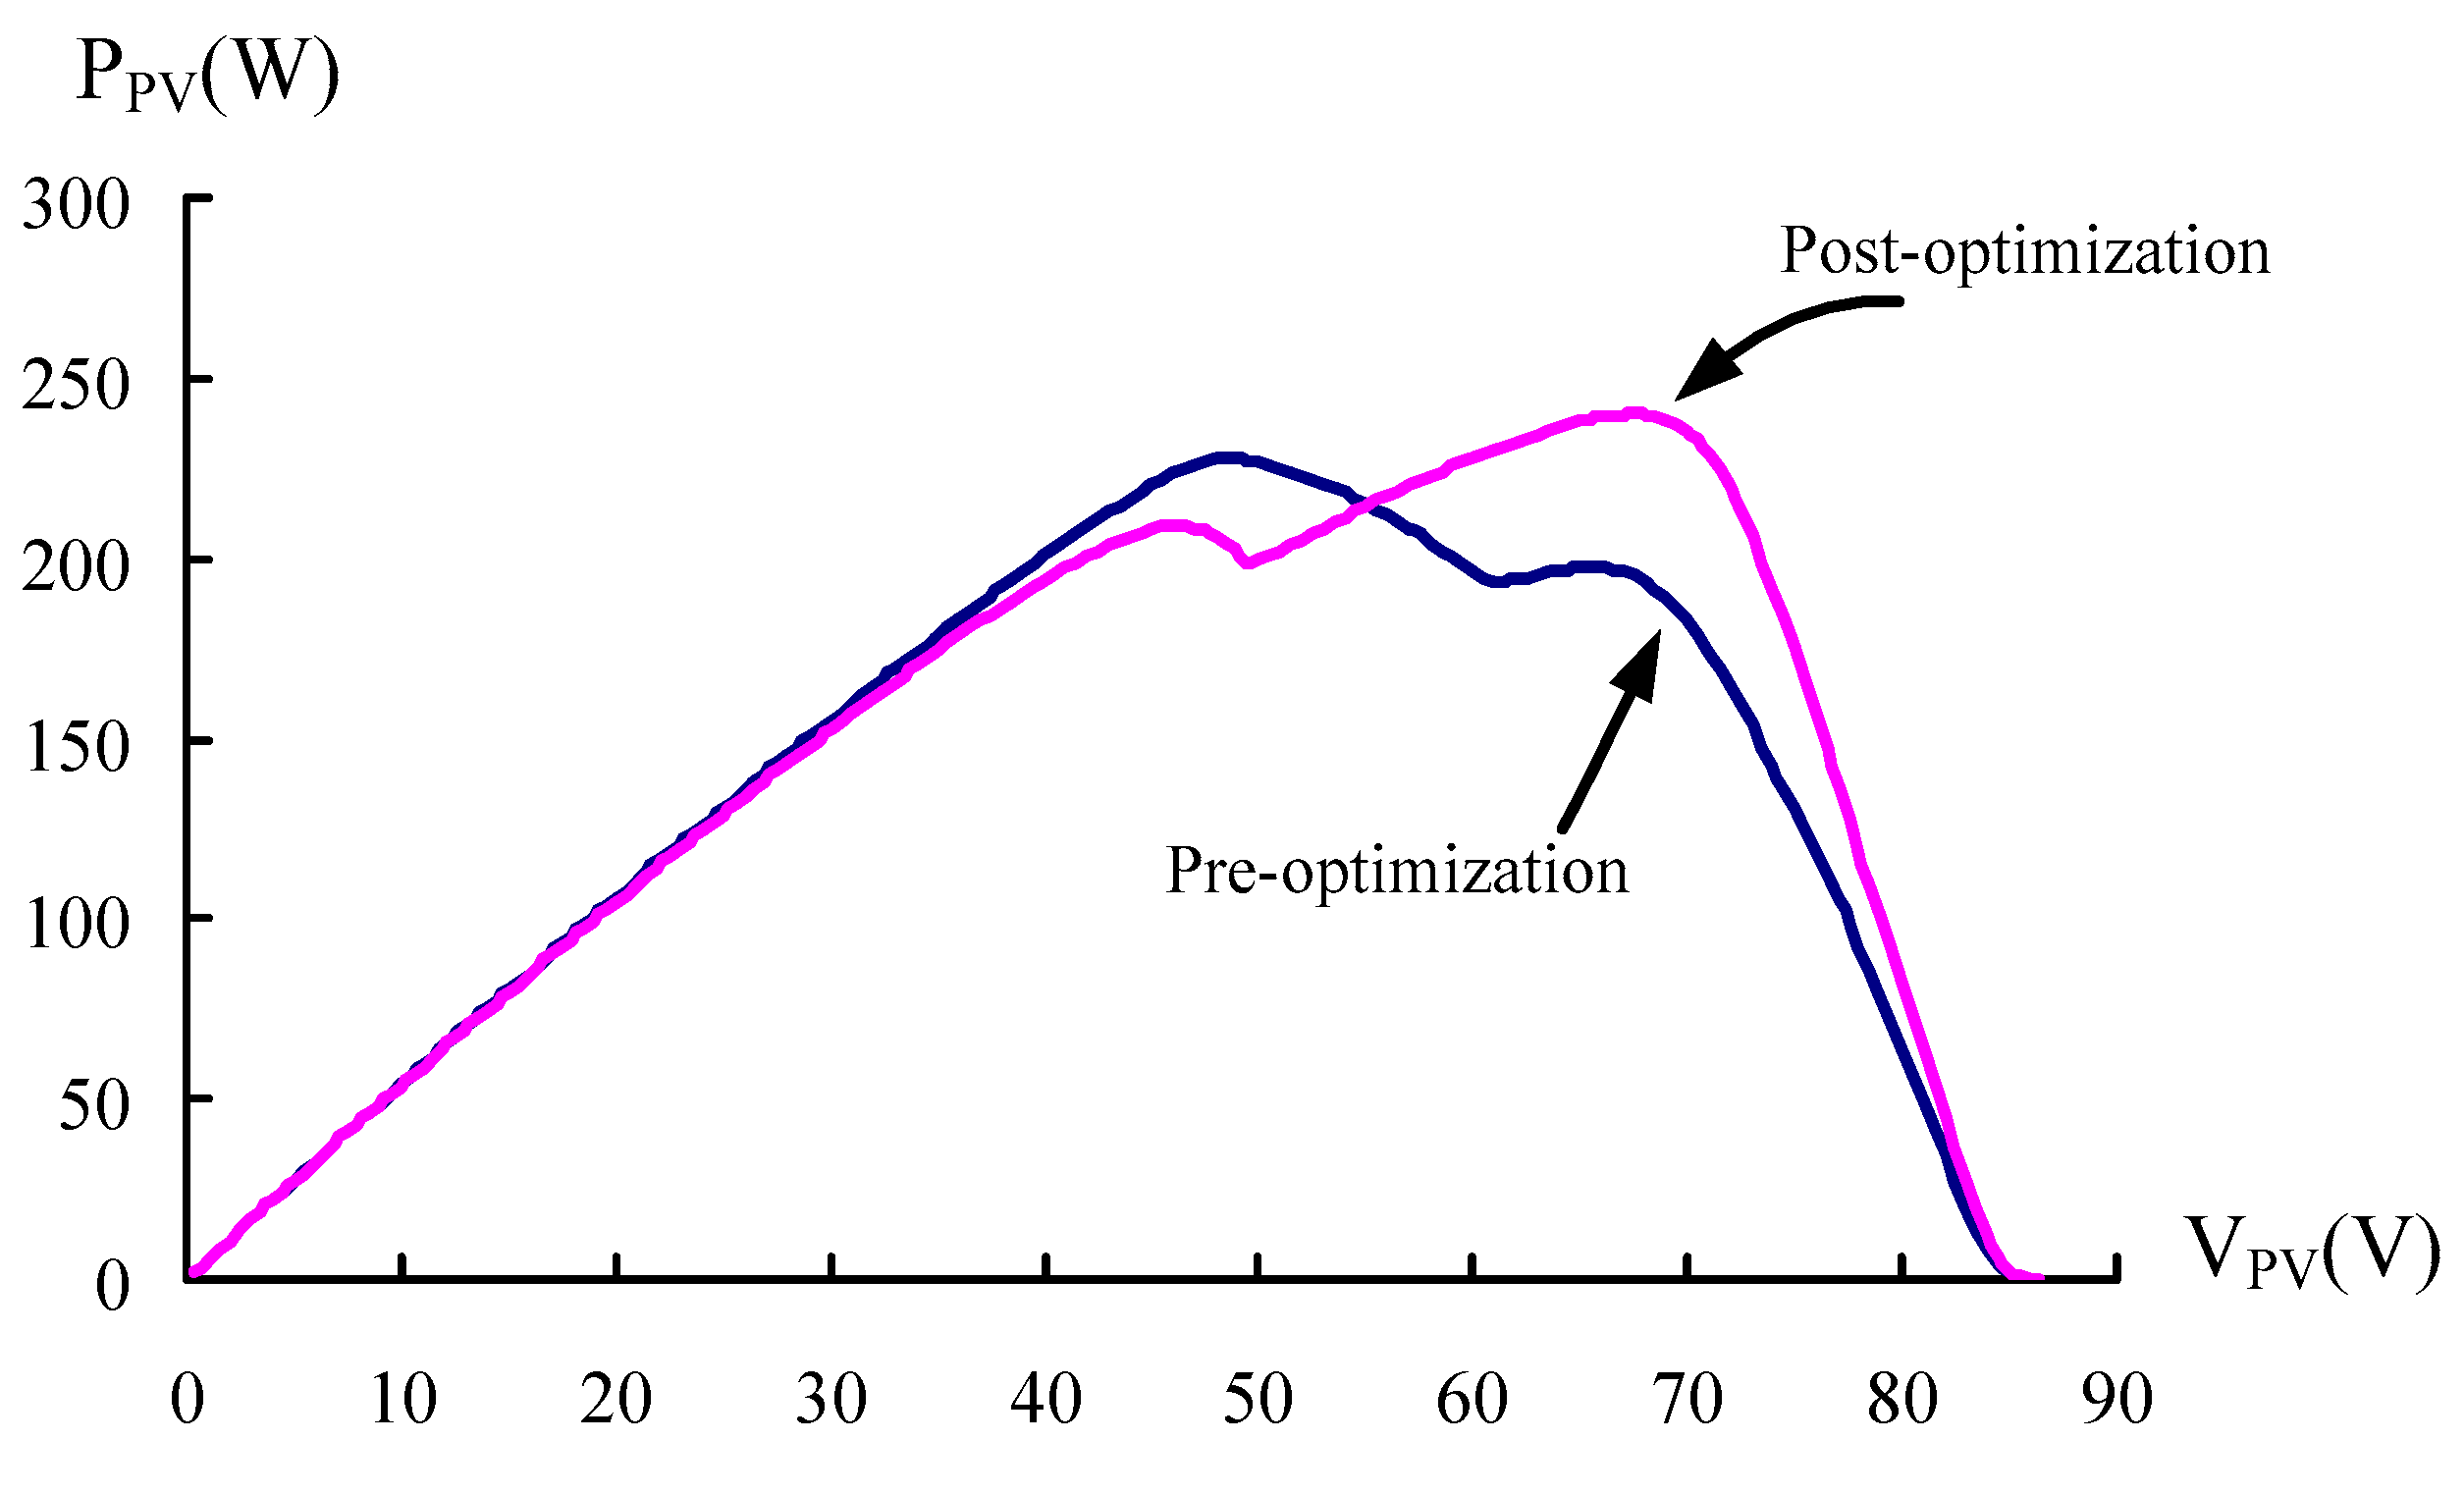
Test Case 1 refers to a case where there are three 30% shaded PV modules at the upper right corner and three 50% shaded modules at the lower left corner, as illustrated in Figure 7. Presented in Figure 8 is a plot of the global optimal value gbest versus the number of iterations, and in Figure 9 is the P-V characteristic curve comparison between pre- and post-output power optimization, while in Figure 10 is the optimized PV module configuration. As can be seen in Figure 8, the optimized module configuration is successfully found following 7 iterations, and it is indicated in Table 3 that the optimization leads to a 16.68% rise (31.4 W) in the output power.
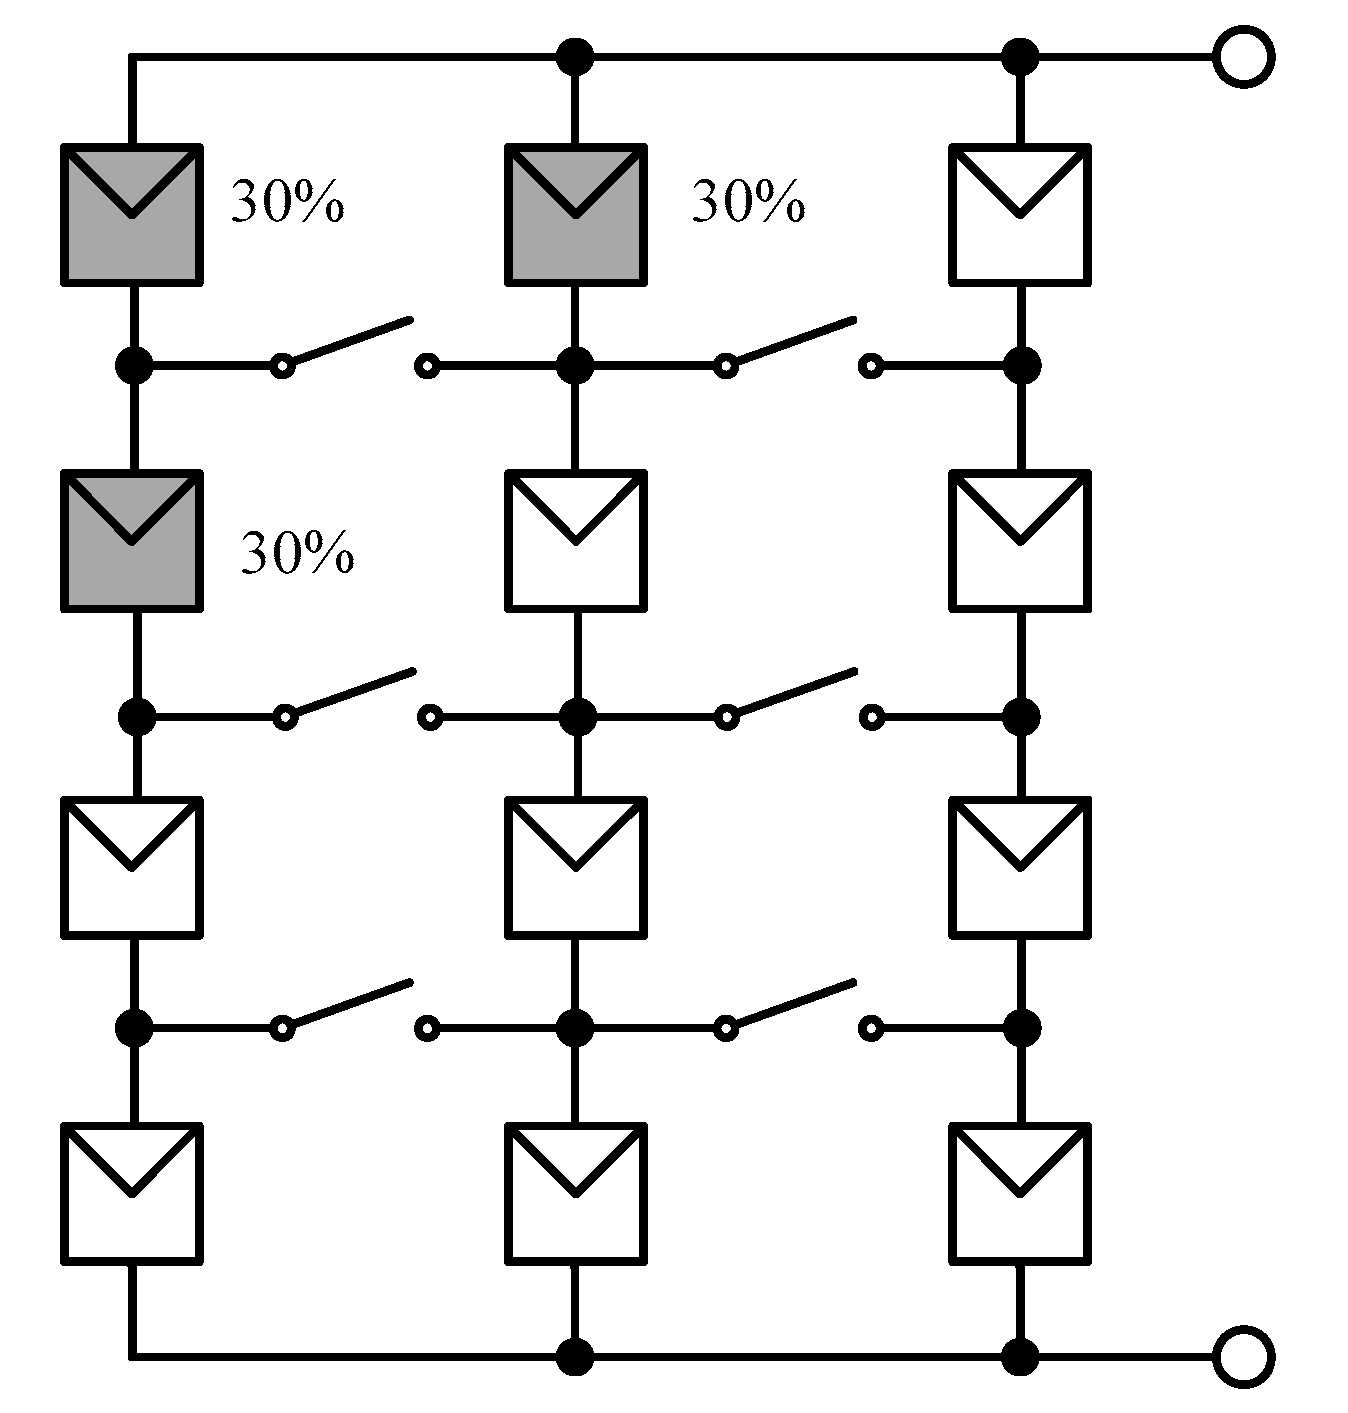
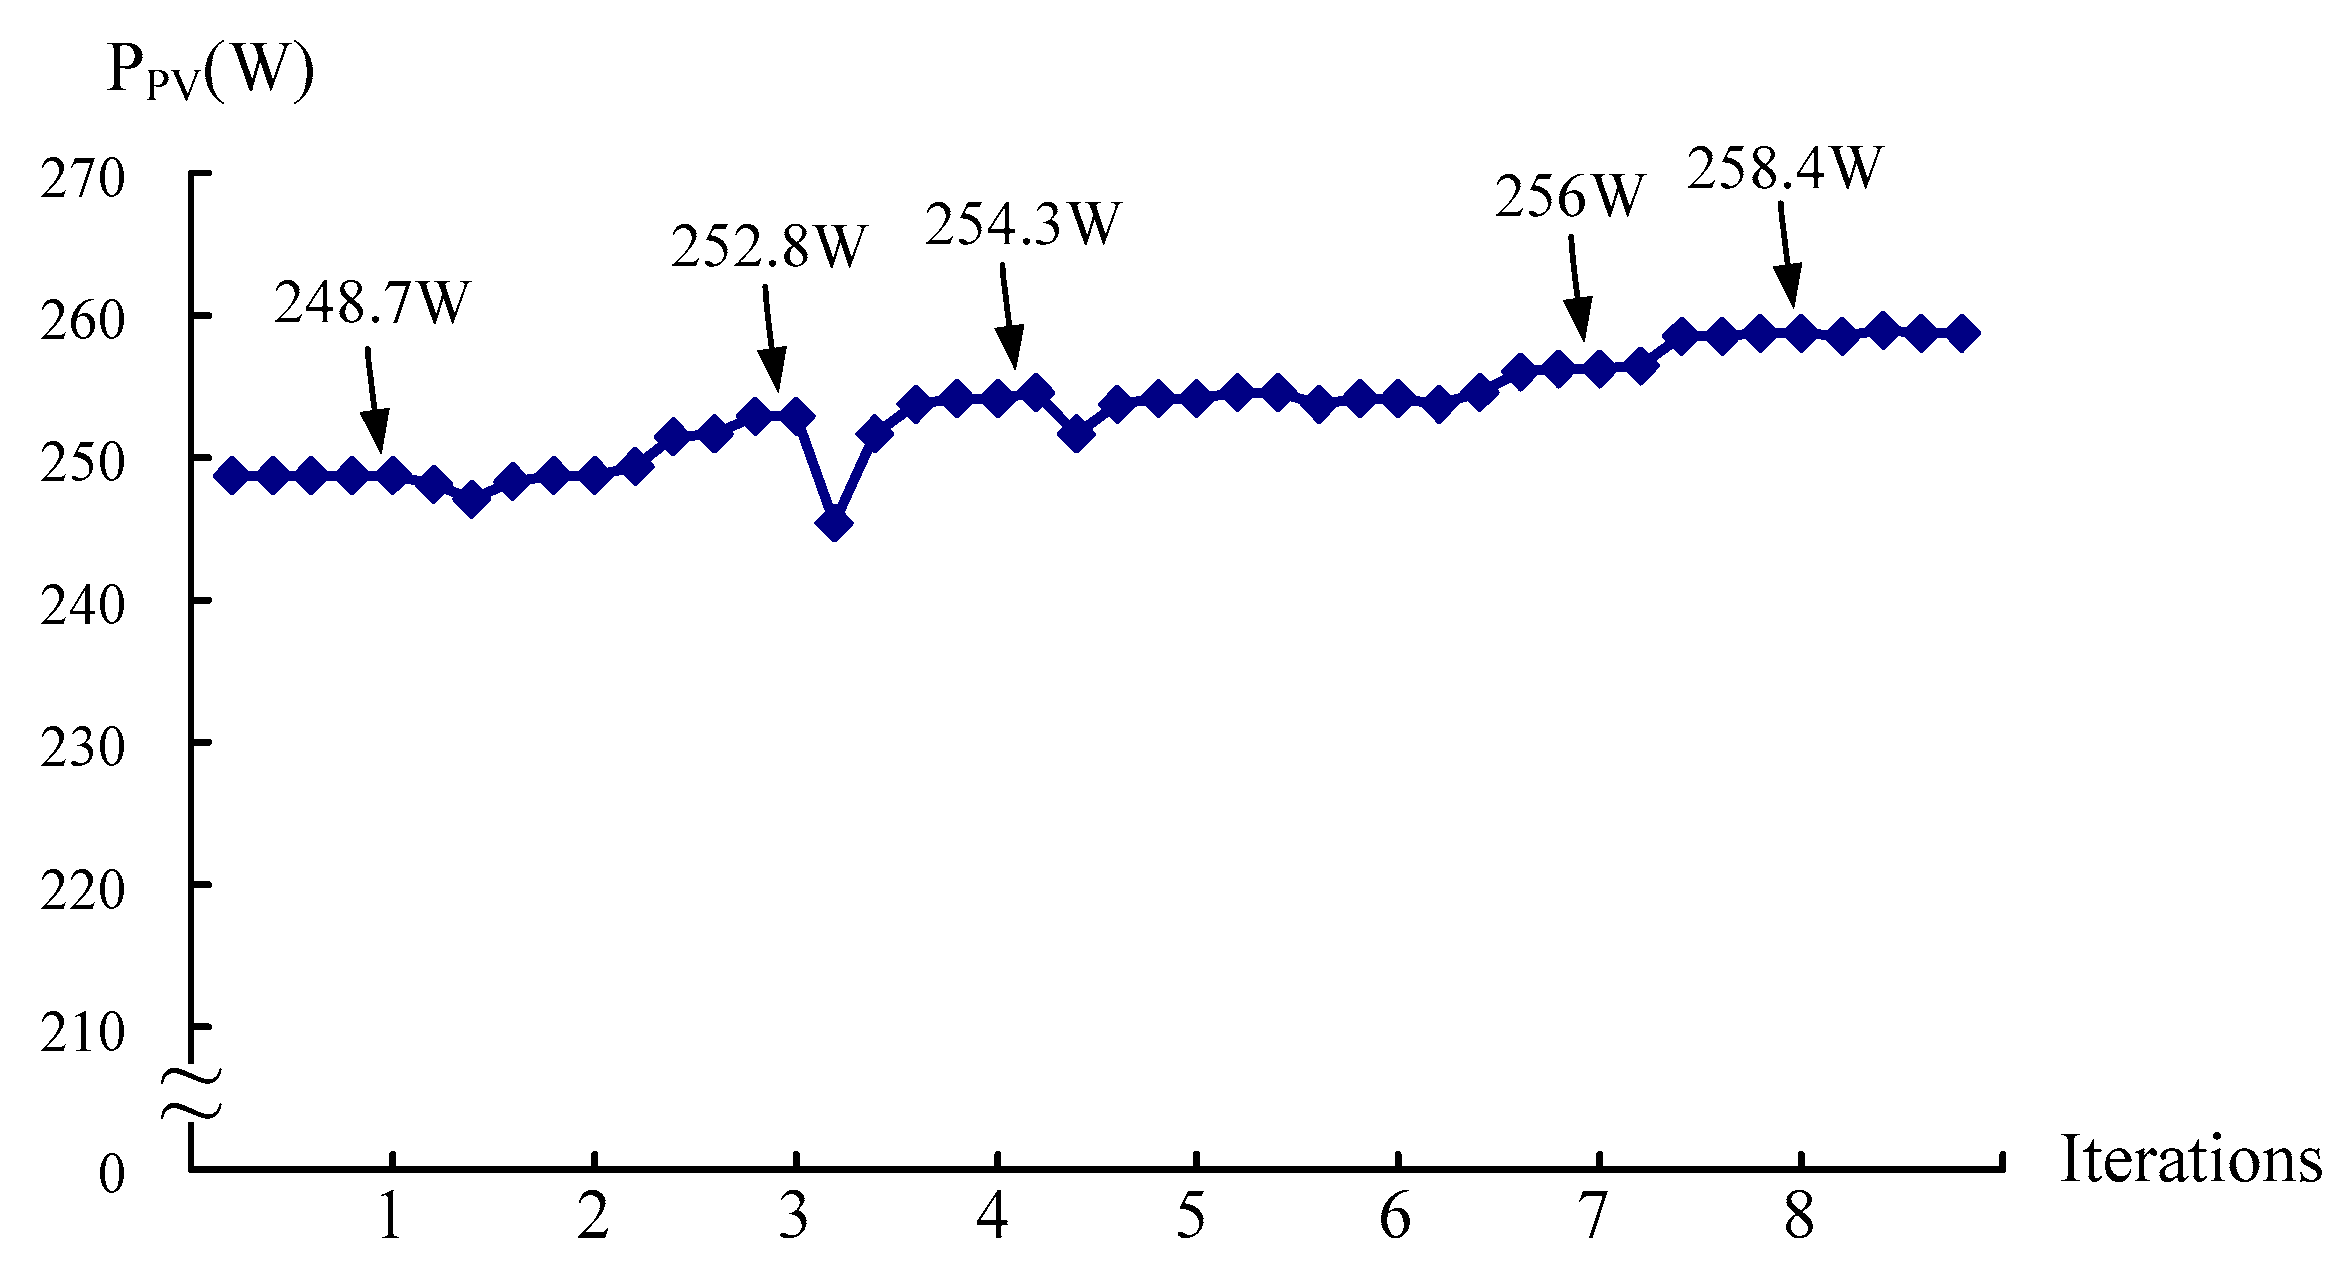
As presented in Figure 11, there are three 30% shaded PV modules at the upper left corner in test Case 2, and the output power is plotted against the number of iterations in Figure 12. The comparison of P-V characteristic curves between the pre- and the post-optimization cases is exhibited in Figure 13, and the optimized PV module configuration is demonstrated in Figure 14. It is found in Figure 12 that the configuration is successfully optimized following 7 iterations. Table 4 gives a 3.22% rise (8.06 W) in the output power after optimization.
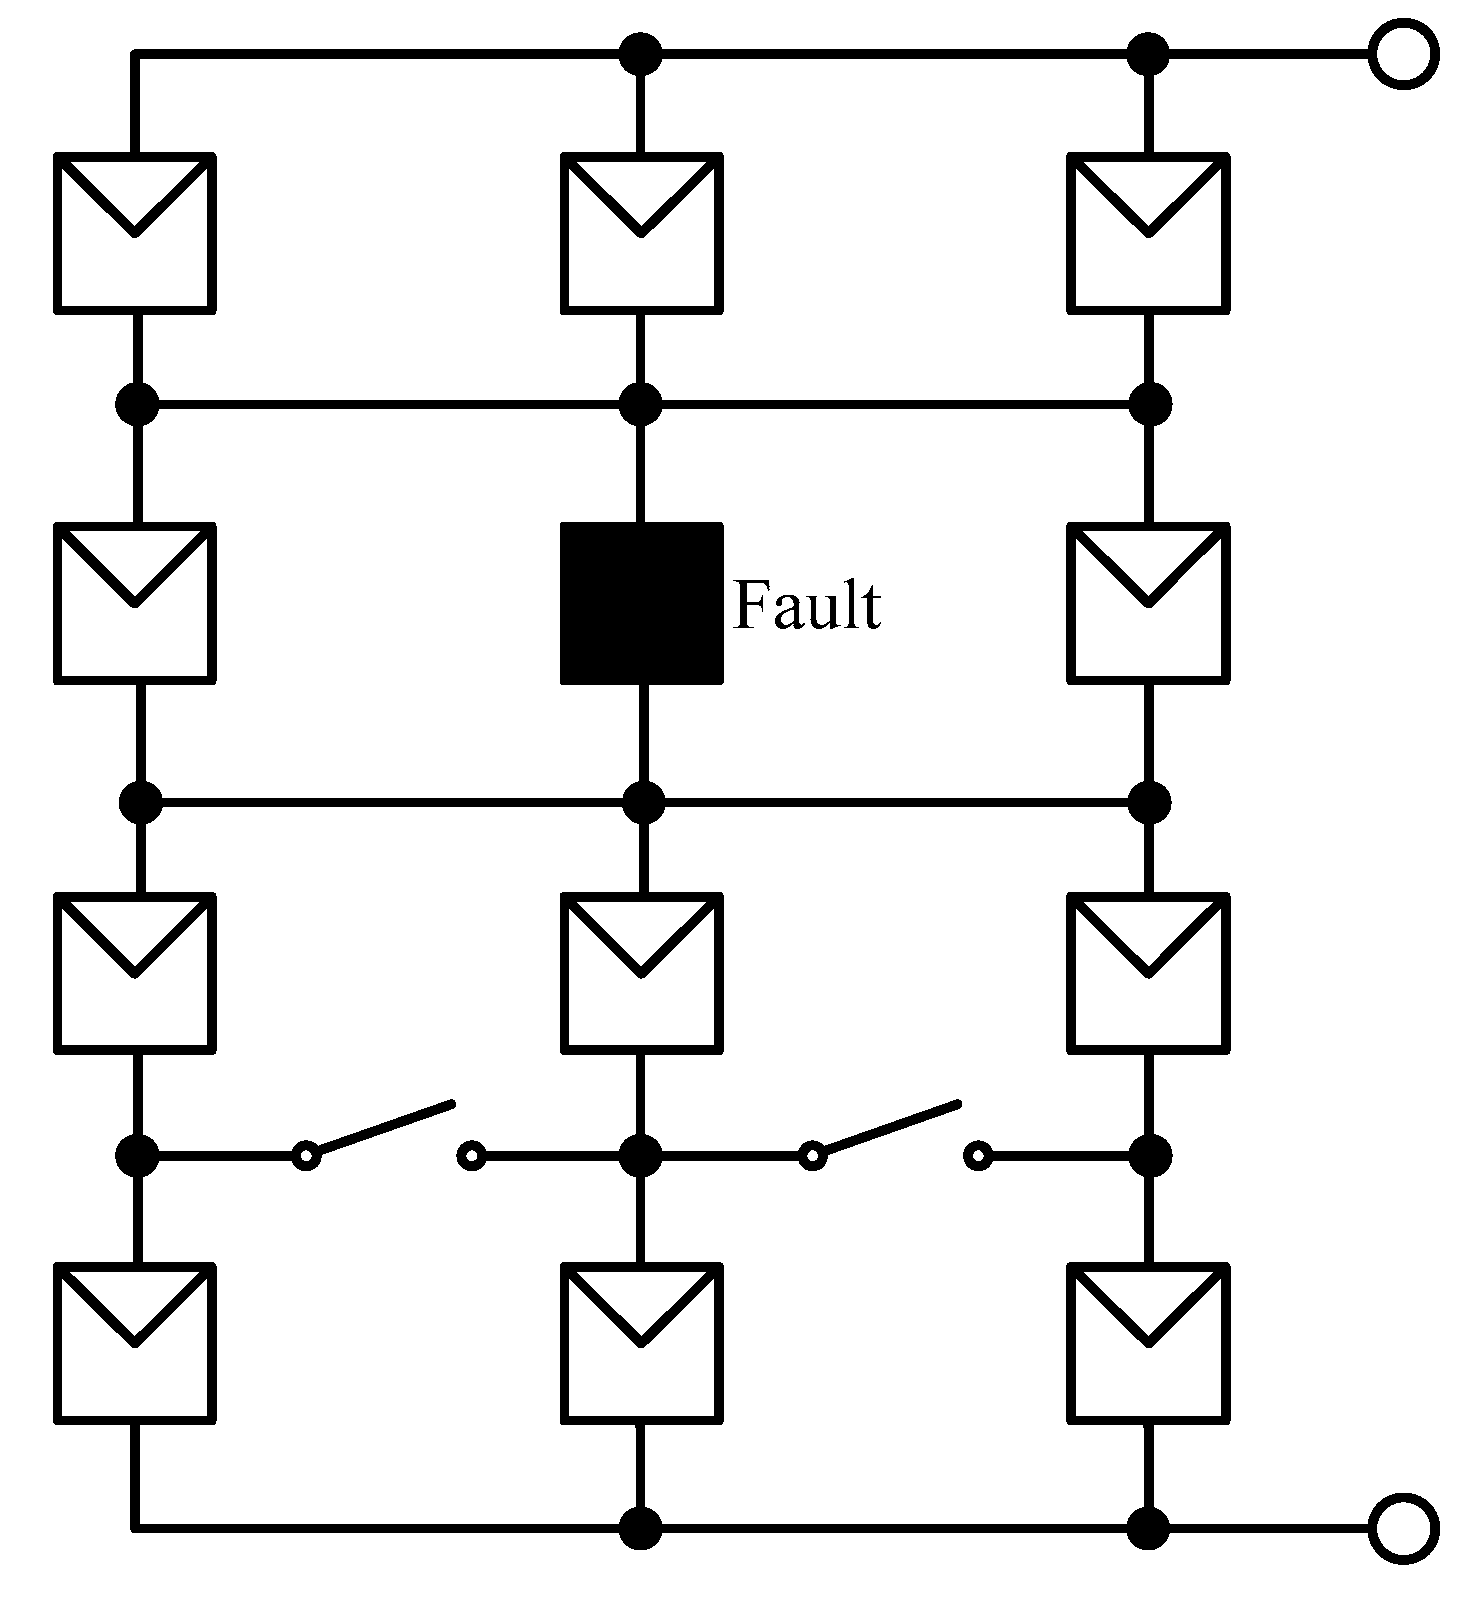
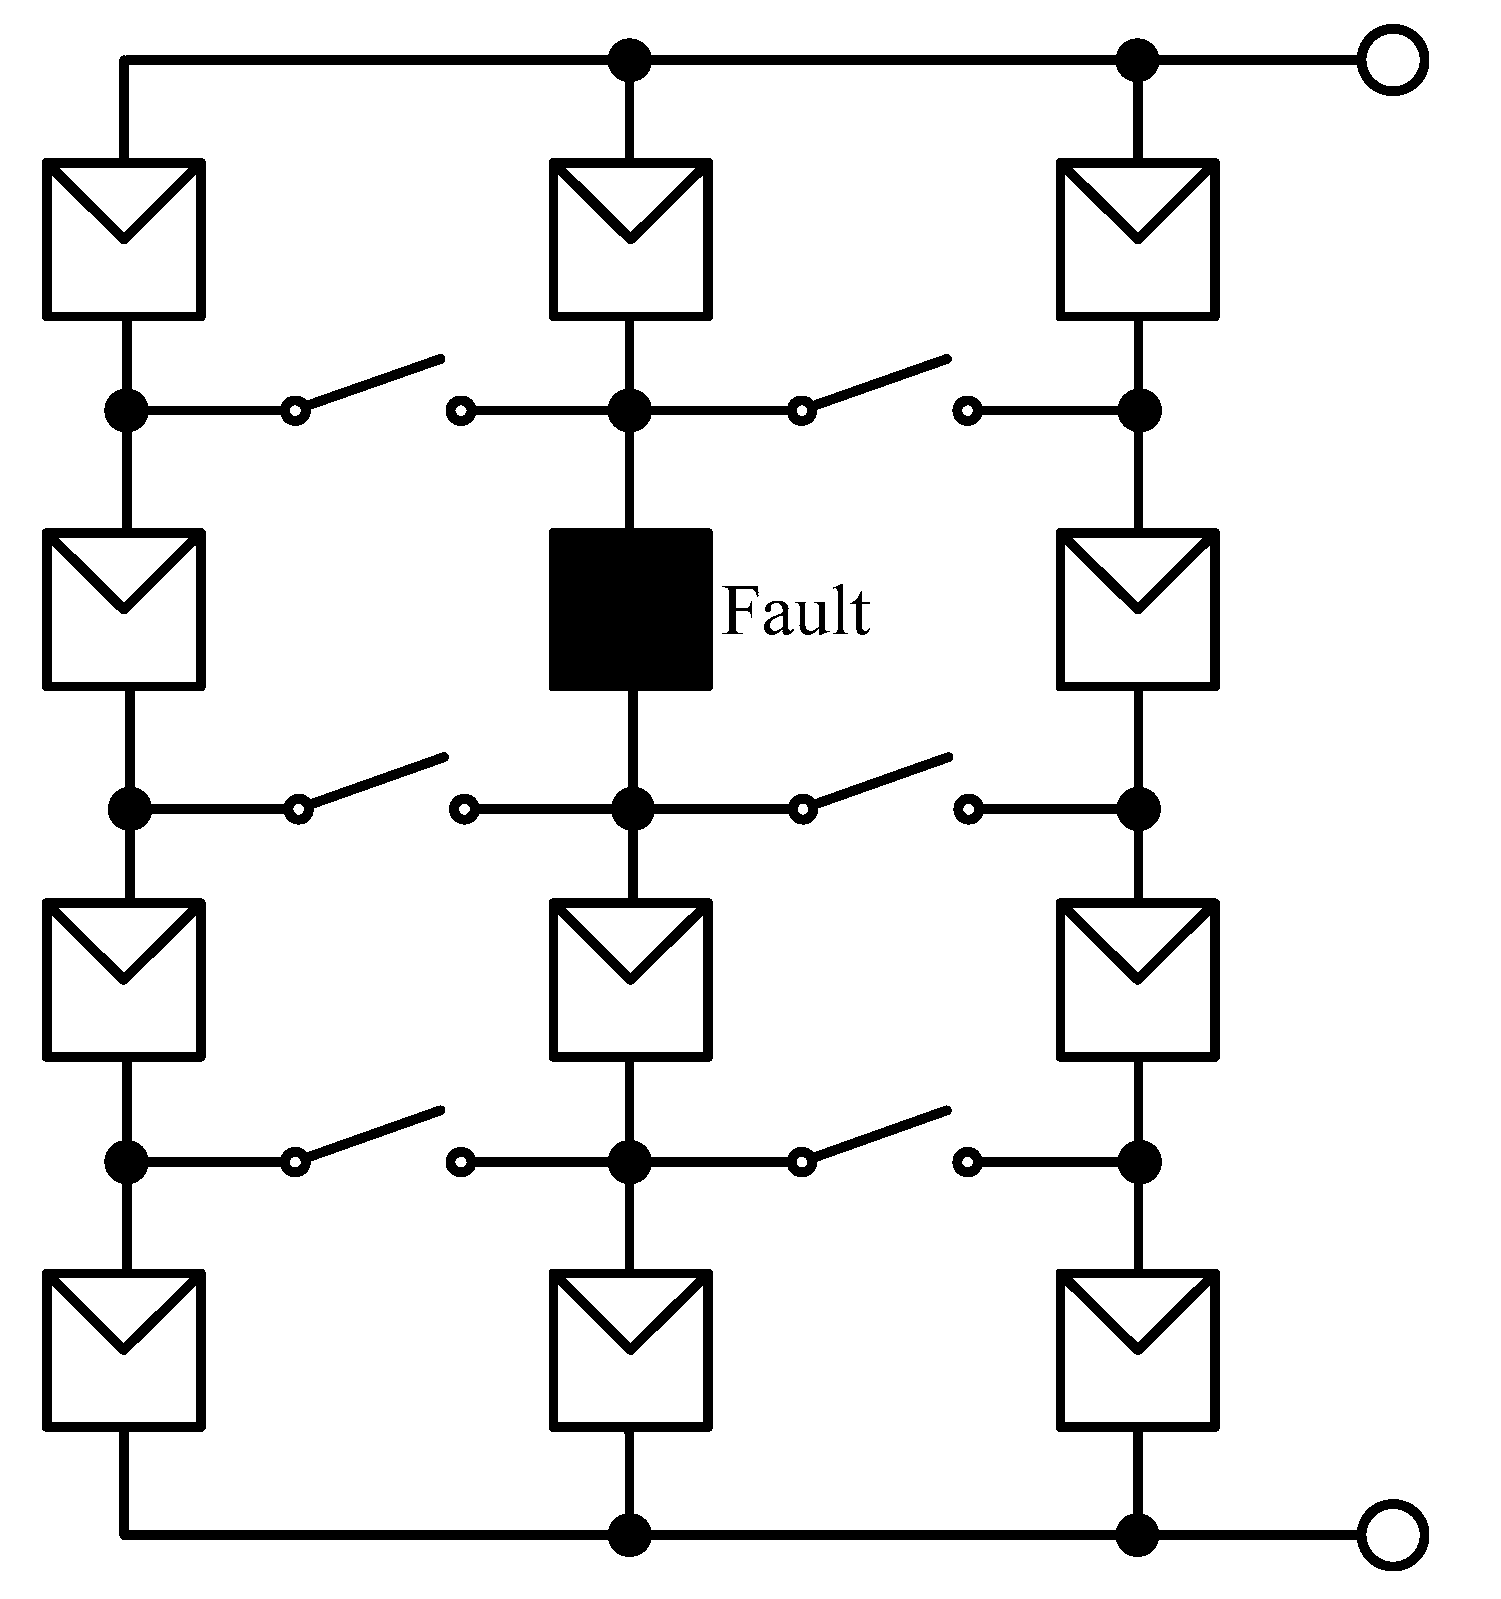
As illustrated in Figure 15, there is a single PV malfunctioning module, the second in the middle branch. A plot of the output power versus the number of iterations performed is presented in Figure 16, a comparison of P-V characteristic curves is made between the pre- and post-optimization cases in Figure 17, and the optimized module configuration is demonstrated in Figure 18. It is noted in Figure 16 that the PV module configuration in this case is optimized following 6 iterations, and Table 5 gives a 4.12% rise (9.51 W) in the output power after optimization.
The curves in Figure 8, Figure 9, Figure 12, Figure 13, Figure 16 and Figure 17 are drawn with the data collected using PIC microcontroller. Because the microcontroller does not have the ability to draw, the data collected from microcontroller is then rendered in a MatLab software package. In a word, all the figures are presented with real data.
In this paper, experiments are conducted on a 4-series 3-parallel PV array with SANYO HIP2717 modules. Tabulated in Table 1 are the electric specifications of HIP2717 module under standard test condition. Therefore, the theoretical maximum output power of a 4-series 3-parallel PV array is 334.44 W at standard test condition. The theoretical maximum power outputs for pre-optimization and post-optimization of three different shaded test cases at standard test condition are listed in Table 3, Table 4 and Table 5, respectively. The theoretical maximum power of the PV module array is approximately 334.44 W in normal operation, but only 188.29 W, 250.51 W and 230.89 W were extractable without the optimized configuration strategy in Case 1, Case 2 and Case 3 shaded or fault conditions, respectively. Therefore, the utilization factors of the PV module array without the optimized configuration strategy are 0.563, 0.749 and 0.690, respectively. However, 219.7 W, 258.57 W and 240.4 W can be extracted with the optimized configuration strategy in Case 1, Case 2 and Case 3 shaded or fault conditions, respectively. The utilization factors of the PV module array can be promoted to 0.657, 0.773 and 0.719, respectively. So it proved that the power generation efficiency of the PV module array can be improved by using the proposed PSO-based global MPP tracker and PV module array optimized configuration strategy under shaded or malfunctioning conditions.
The three test cases investigated in the present study underwent MPPT for 8 iterations under the proposed PSO-based global MPP tracker. According to the average tracking time and MPP tabulated in Table 6, the method accurately identified the real MPP.
7. Conclusions
This paper presents a PSO-based smart algorithm for PV module configuration optimization; such that a PV module array is operated at the global MPP for arbitrary cases when there is any shaded or malfunctioning event in a PV module(s). The development of a PSO algorithm is inspired by the flocking behavior of birds that forage in a distributed manner with memory, and accordingly the foraging route is minimized. In this manner, the entire particle swarm approaches the global optimal value. This proposed PSO-based algorithm does as intended enable a PV module array to operate at the global MPP for the purpose of power generation efficiency elevation, and is validated experimentally as an effective approach to dealing with the shadow or/and malfunction problem in PV modules.
Author Contributions
The conceptualization was proposed by P.-Y.C. and K.-H.C., who also were responsible for writing-review & editing this paper. P.-Y.C. completed the formal analysis of the PSO-based smart algorithm. B.-J.L. carried out the data curation, software program and experiment validation. K.-H.C. was in charge of project administration.
Funding
This research was funded by Ministry of Science and Technology, Taiwan, under the Grant Number MOST 106-2221-E-167-013–MY2.
Acknowledgments
The authors gratefully acknowledge the support of the Ministry of Science and Technology, Taiwan, under the Grant Number MOST 106-2221-E-167-013–MY2.
Conflicts of Interest
The authors of the manuscript declare that there is no conflict of interest with any of the commercial identities mentioned in the manuscript.
Nomenclature
| PSO | particle swarm optimization |
| PV | photovoltaic |
| MPP | maximum power point |
| MPPT | maximum power point tracker |
| TCT | total cross-tied |
| HC | honey-comb |
| pbest | particle optimal value |
| gbest | global optimal value |
| velocities of particle j at discrete time instant k | |
| C1, C2 | learning factors |
| optimal value of particle j at time instant k | |
| position of particle j at time instant k | |
| output power of the photovoltaic module array | |
| output voltage of the photovoltaic module array | |
| output current of the photovoltaic module array | |
| STC | standard test condition |
| Pmax | maximum output power of the photovoltaic module array |
| Impp | current of the MPP |
| Vmpp | voltage of the MPP |
| Isc | short current of the photovoltaic module array |
| Voc | open voltage of the photovoltaic module array |
| w | weight factor of the PSO algorithm |
References
- Mohammadmehdi, S.; Saad, M.; Rasoul, R.; Rubiyah, Y.; Ehsan, T.R. Analytical Modeling of Partially Shaded Photovoltaic Systems. Energies 2013, 6, 128–144. [Google Scholar] [Green Version]
- Jin, Y.; Hou, W.H.; Li, G.G.; Chen, X. A Glowworm Swarm Optimization-Based Maximum Power Point Tracking for Photovoltaic/Thermal Systems under Non-Uniform Solar Irradiation and Temperature Distribution. Energies 2017, 10, 541. [Google Scholar] [CrossRef]
- Shahrooz, H.; Mohd, A.M.R.; Mohd, Z.A.A.K. Implementing a Novel Hybrid Maximum Power Point Tracking Technique in DSP via Simulink/MATLAB under Partially Shaded Conditions. Energies 2016, 9, 85. [Google Scholar] [Green Version]
- Koutroulis, E.; Blaabjerg, F. A New Technique for Tracking the Global Maximum Power Point of PV Arrays Operating under Partial-Shading Conditions. IEEE J. Photovolt. 2012, 2, 184–190. [Google Scholar] [CrossRef]
- Chendi, L.; Yuanrui, C.; Dongbao, Z.; Junfeng, L.; Jun, Z. A High-Performance Adaptive Incremental Conductance MPPT algorithm for photovoltaic systems. Energies 2016, 9, 288–305. [Google Scholar]
- Qin, S.; Cady, S.T.; García, A.D.D.; Podgurski, R.C.N.P. A Distributed Approach to Maximum Power Point Tracking for Photovoltaic Submodule Differential Power Processing. IEEE Trans. Power Electron. 2015, 30, 2024–2040. [Google Scholar] [CrossRef]
- Olalla, C.; Clement, D.; Rodríguez, M.; Makisimović, D. Architectures and Control of Submodule Integrated dc-dc Converters for Photovoltaic Applications. IEEE Trans. Power Electron. 2013, 28, 2980–2997. [Google Scholar] [CrossRef]
- Uno, M.; Kukita, A. Two-switch Voltage Equalizer Using an LLC Resonant Inverter and Voltage Multiplier for Partially-shaded Series-connected Photovoltaic Modules. IEEE Trans. Ind. Appl. 2015, 51, 1587–1601. [Google Scholar] [CrossRef]
- Nguyen, D.; Lehman, B. An Adaptive Solar Photovoltaic Array Using Model-Based Reconfiguration Algorithm. IEEE Trans. Ind. Electron. 2008, 55, 2644–2654. [Google Scholar] [CrossRef]
- El-Dein, M.Z.S.; Kazerani, M.; Salama, M.M.A. Novel Configurations for Photovoltaic Farms to Reduce Partial Shading Losses. In Proceedings of the 2011 IEEE Power and Energy Society General Meeting, Detroit, MI, USA, 24–28 July 2011; pp. 1–5. [Google Scholar]
- Alahmad, M.; Chaaban, M.A.; kit Lau, S.; Shi, J.; Neal, J. An Adaptive Utility Interactive Photovoltaic System Based on a Flexible Switch Matrix to Optimize Performance in Real-time. Sol. Energy 2012, 86, 951–963. [Google Scholar] [CrossRef]
- SANYO HIP 2717 Data Sheet. Available online: http://iris.nyit.edu/~mbertome/solardecathlon/SDClerical/SD_DESIGN+DEVELOPMENT/091804_Sanyo190HITBrochure.pdf (accessed on 15 January 2016).
- Ramaprabha, R.; Mathur, B.L. A Comprehensive Review and Analysis of Solar Photovoltaic Array Configurations under Partial Shaded Conditions. Int. J. Photoenergy 2011, 2012. [Google Scholar] [CrossRef]
- Wang, Y.J.; Hsu, P.C. An Investigation on Partial Shading of PV Modules with Different Connection Configurations of PV Cells. Energy 2011, 36, 3069–3078. [Google Scholar] [CrossRef]
- Eberhart, R.C.; Kennedy, J. A New Optimizer using Particle Swarm Theory. In Proceedings of the Sixth International Symposium on Micro Machine and Human Science, Piscataway, NJ, USA, 4–6 October 1995. [Google Scholar]
- Kennedy, J.; Eberhart, R.C. Particle Swarm Optimization. In Proceedings of the IEEE International Conference on Neural Networks, Piscataway, NJ, USA, 4–6 October 1995. [Google Scholar]
- Liu, Y.; Niu, B. A Novel PSO Model Based on Simulating Human Social Communication Behavior. Int. J. Photoenergy 2012, 2012. [Google Scholar] [CrossRef]
- Liu, A.; Zahara, E.; Yang, M.T. A Modified NM-PSO Method for Parameter Estimation Problems of Models. Int. J. Photoenergy 2012, 2012. [Google Scholar] [CrossRef]
- Ishaque, K.; Salam, Z.; Amjad, M.; Mekhilef, S. An Improved Particle Swarm Optimization (PSO)–Based MPPT for PV With Reduced Steady-State Oscillation. IEEE Trans. Power Electron. 2012, 27, 3627–3638. [Google Scholar] [CrossRef]
- Luigi, P.; Renato, R.; Ivan, S.; Pietro, T. Optimized Adaptive Perturb and Observe Maximum Power Point Tracking Control for Photovoltaic Generation. Energies 2015, 8, 3418–3436. [Google Scholar] [Green Version]
- Liu, Y.H.; Huang, S.C.; Huang, J.W.; Liang, W.C. A Particle Swarm Optimization-Based Maximum Power Point Tracking Algorithm for PV Systems Operating under Partially Shaded Conditions. IEEE Trans. Energy Convers. 2012, 27, 1027–1035. [Google Scholar] [CrossRef]
Figure 1.
A family of (a) I-V; (b) P-V characteristic curves with the irradiation level as a free parameter for a 4-series 1-parallel array built with SANYO HIP-2717 PV modules at a module surface temperature of 25 °C.
Figure 1.
A family of (a) I-V; (b) P-V characteristic curves with the irradiation level as a free parameter for a 4-series 1-parallel array built with SANYO HIP-2717 PV modules at a module surface temperature of 25 °C.
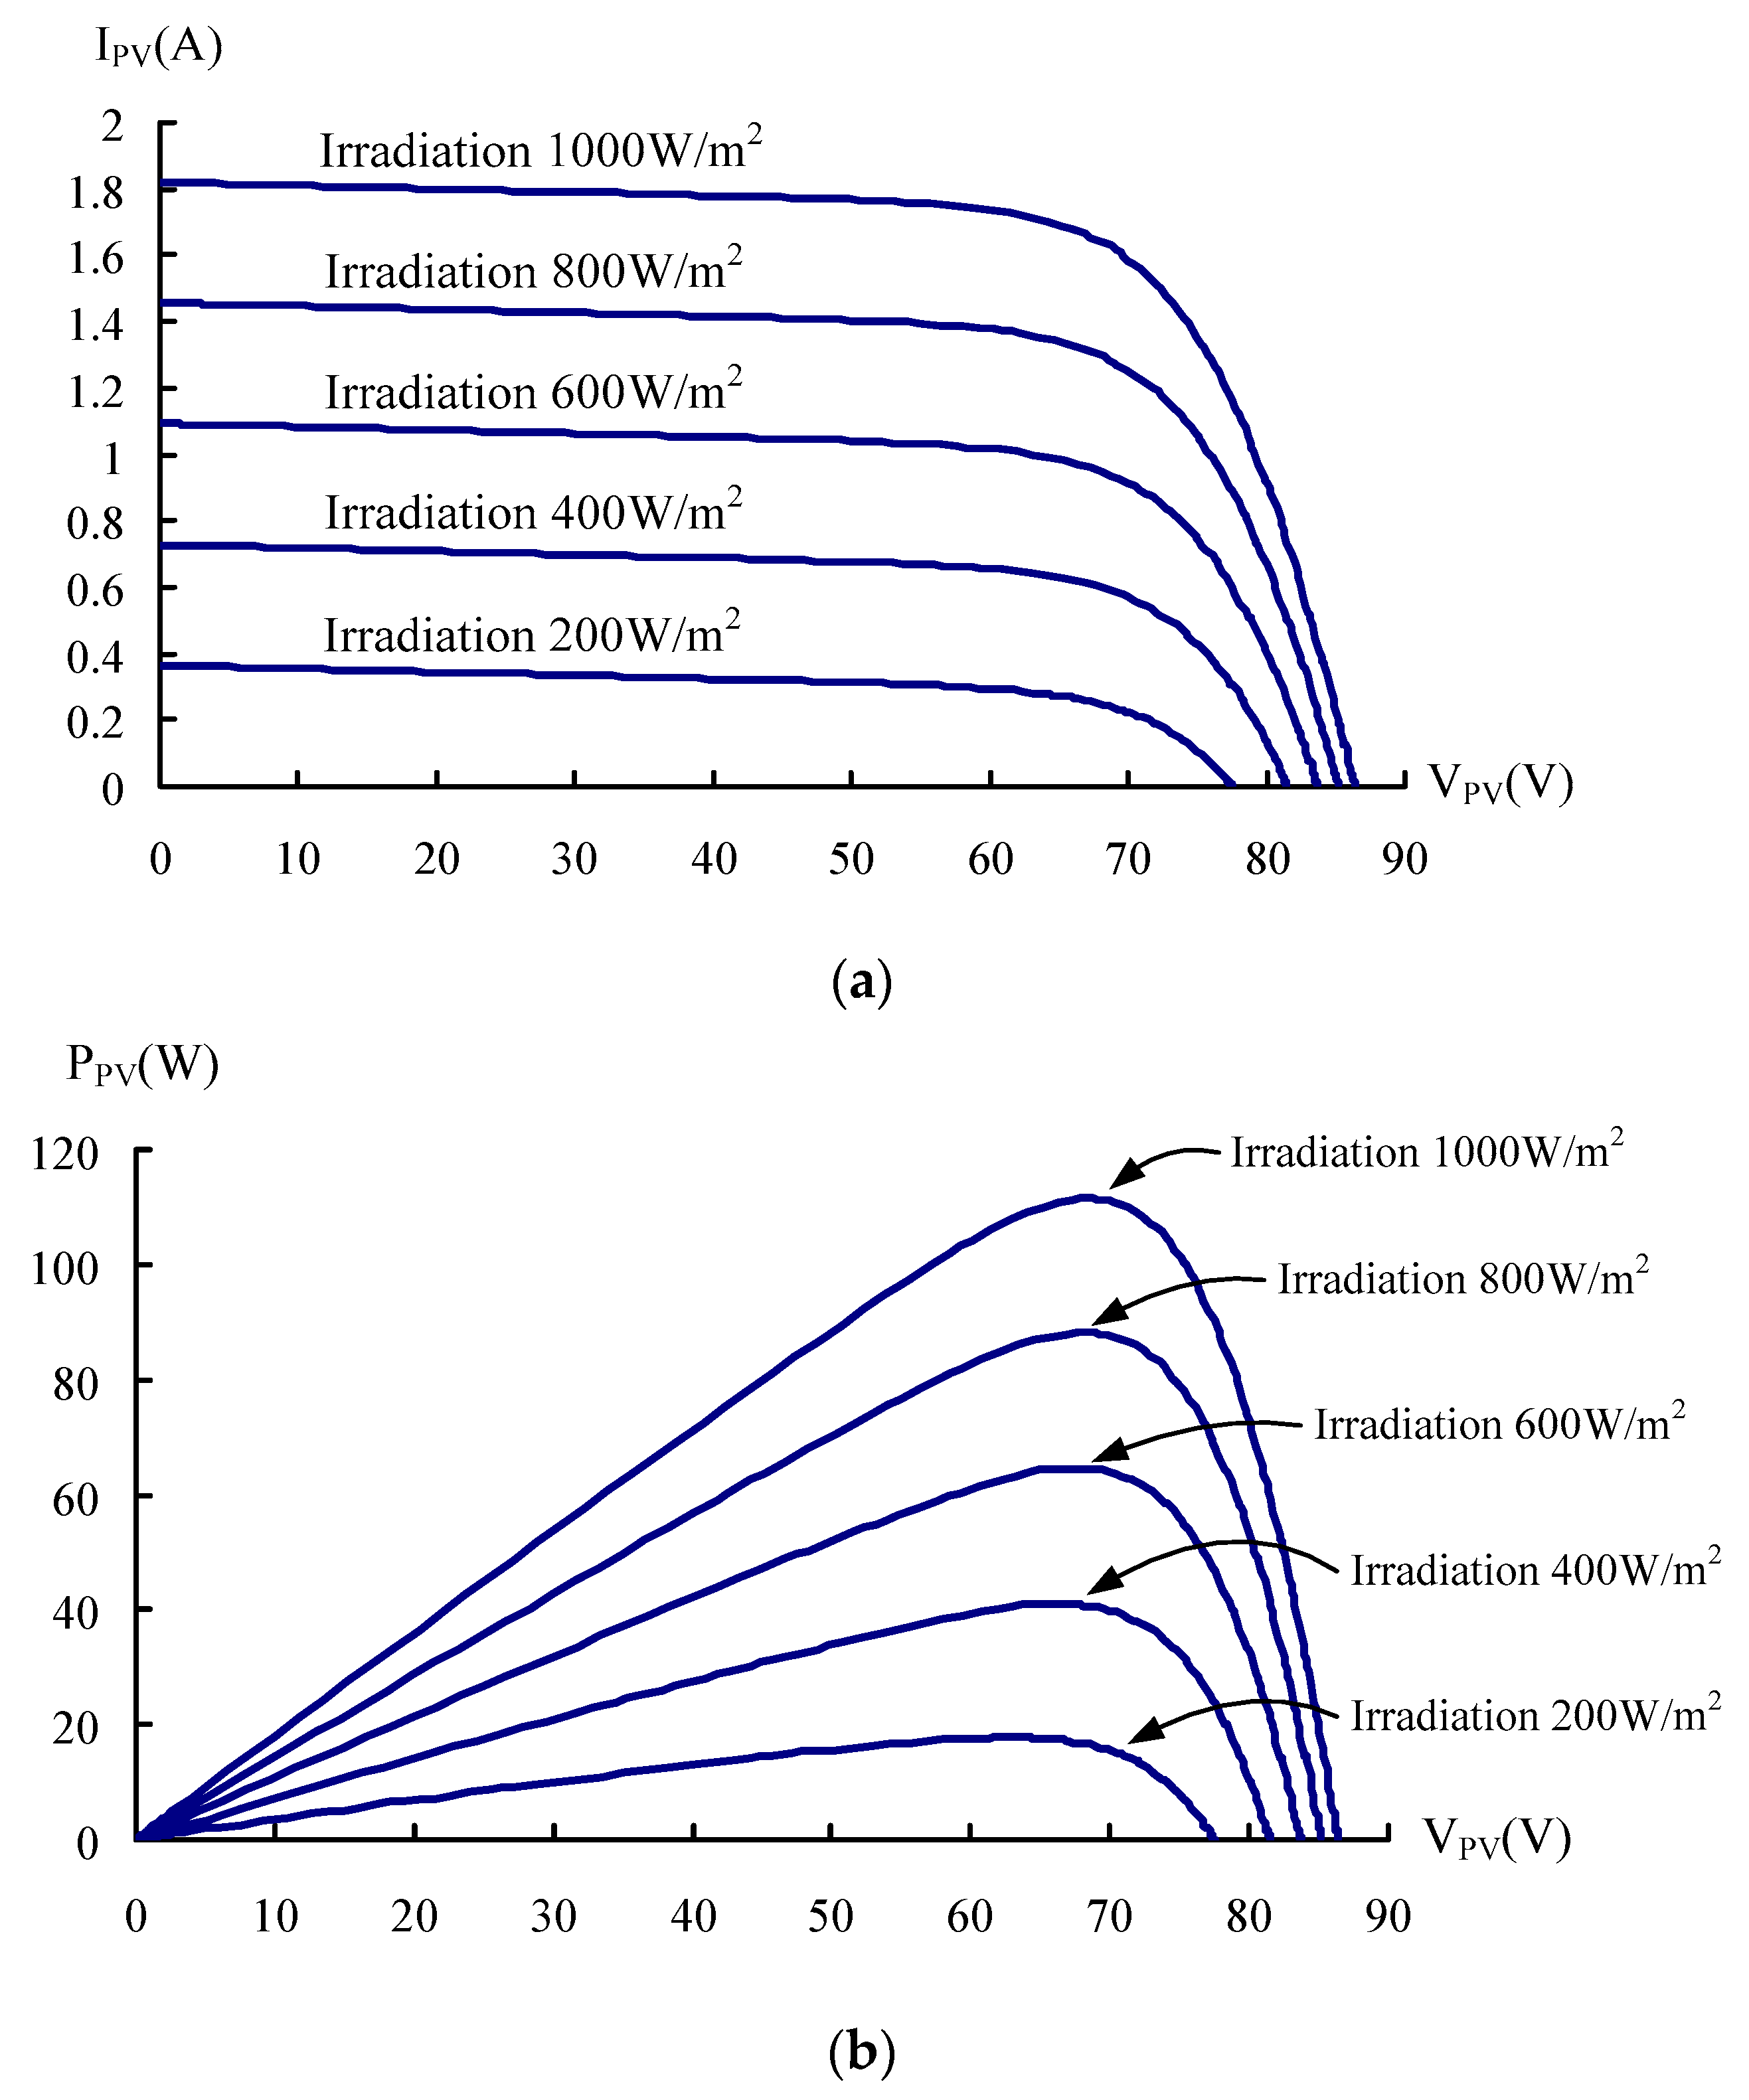
Figure 2.
I-V and P-V characteristic curves for a 4-series 1-parallel array with a single shaded PV module at a module surface temperature of 25 °C and an irradiation of 1000 W/m2.
Figure 2.
I-V and P-V characteristic curves for a 4-series 1-parallel array with a single shaded PV module at a module surface temperature of 25 °C and an irradiation of 1000 W/m2.

Figure 3.
An illustration of the proposed PV module array configuration.
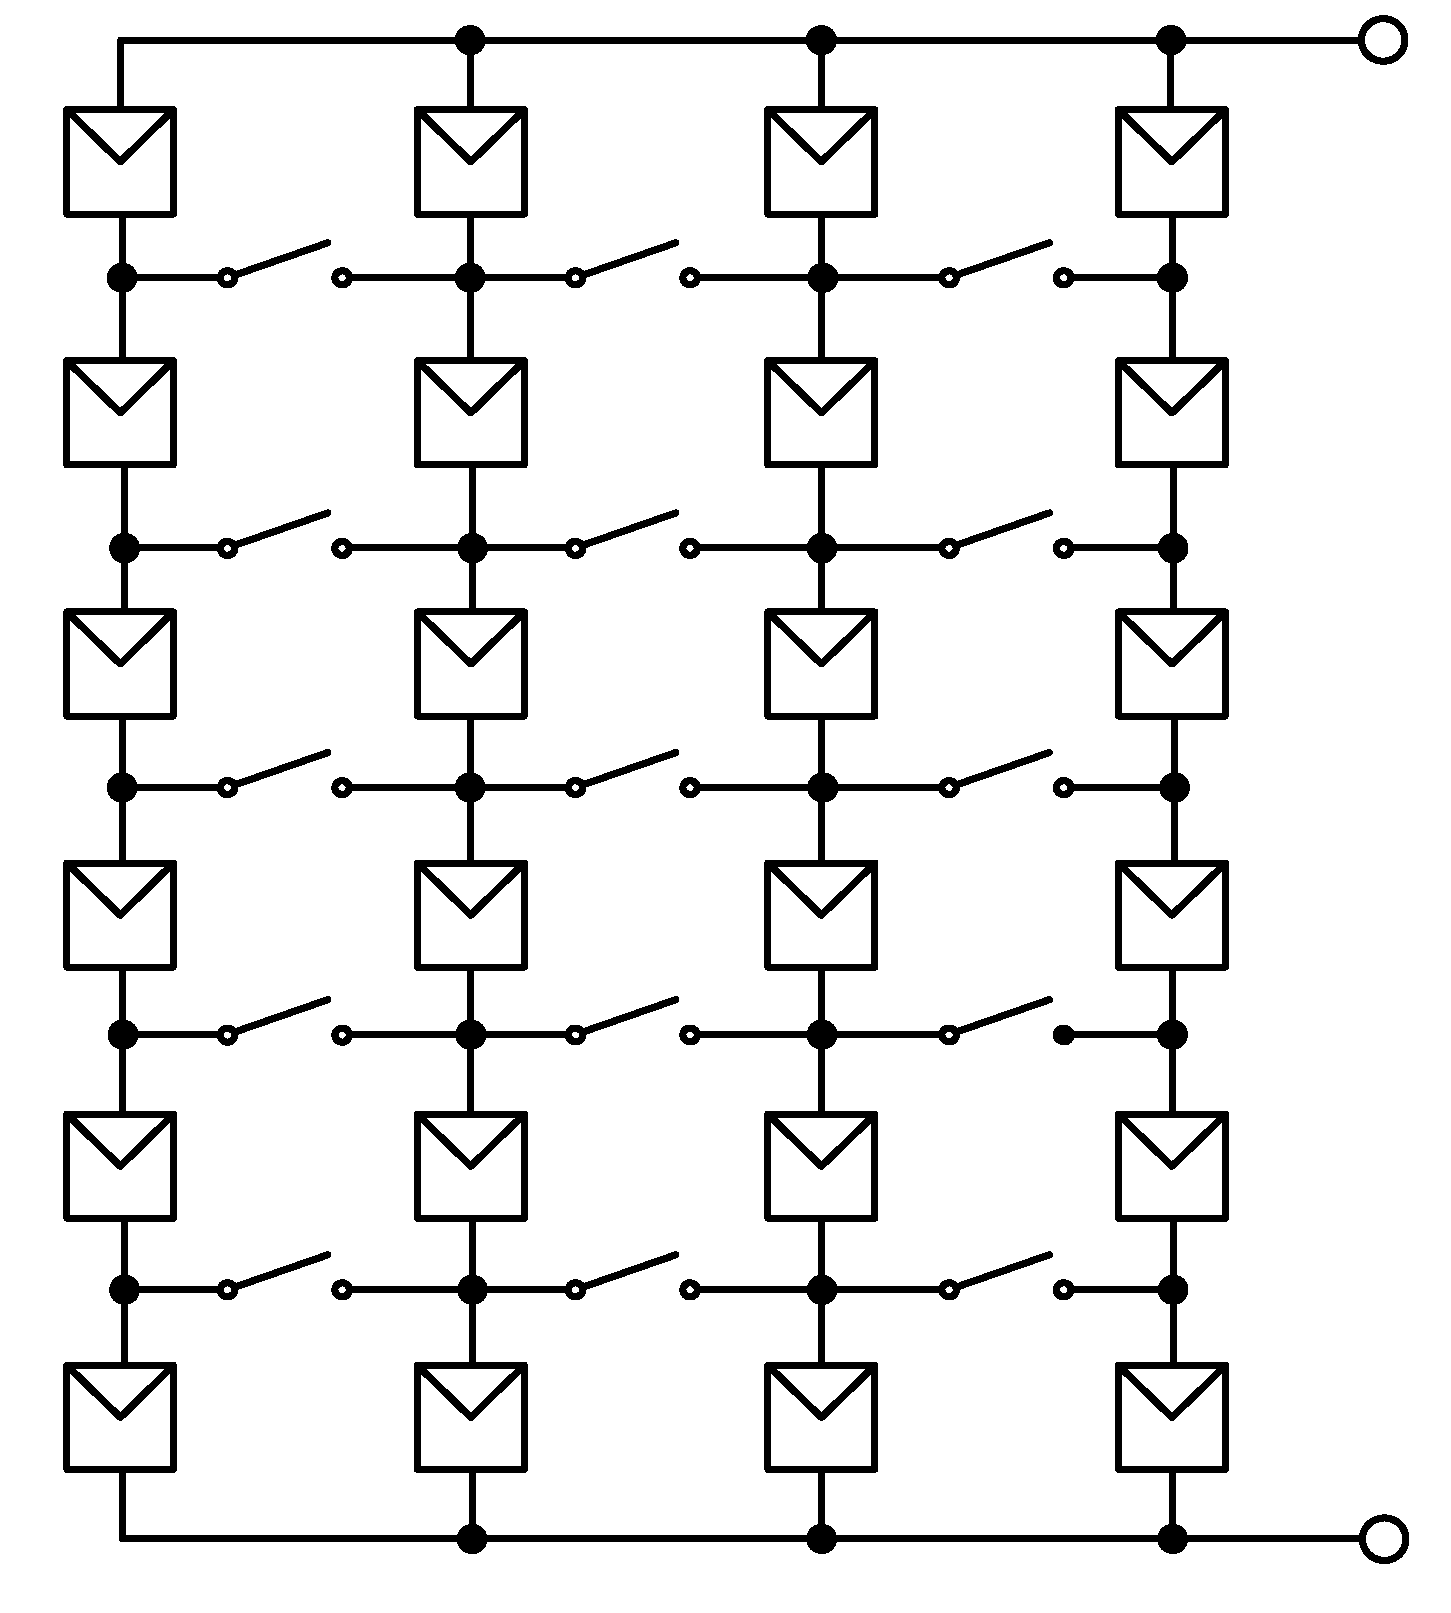
Figure 4.
A framework of this proposed PSO-based MPP tracker with a configuration optimization strategy.
Figure 4.
A framework of this proposed PSO-based MPP tracker with a configuration optimization strategy.

Figure 5.
A flow chart representing the global MPP tracking algorithm employed in Figure 4.
Figure 5.
A flow chart representing the global MPP tracking algorithm employed in Figure 4.

Figure 6.
A photo of the proposed global MPP tracker.

Figure 7.
The pre-optimized array configuration in Case 1.

Figure 8.
A plot of the measured gbest against the number of iterations in Case 1 before configuration optimization.
Figure 8.
A plot of the measured gbest against the number of iterations in Case 1 before configuration optimization.
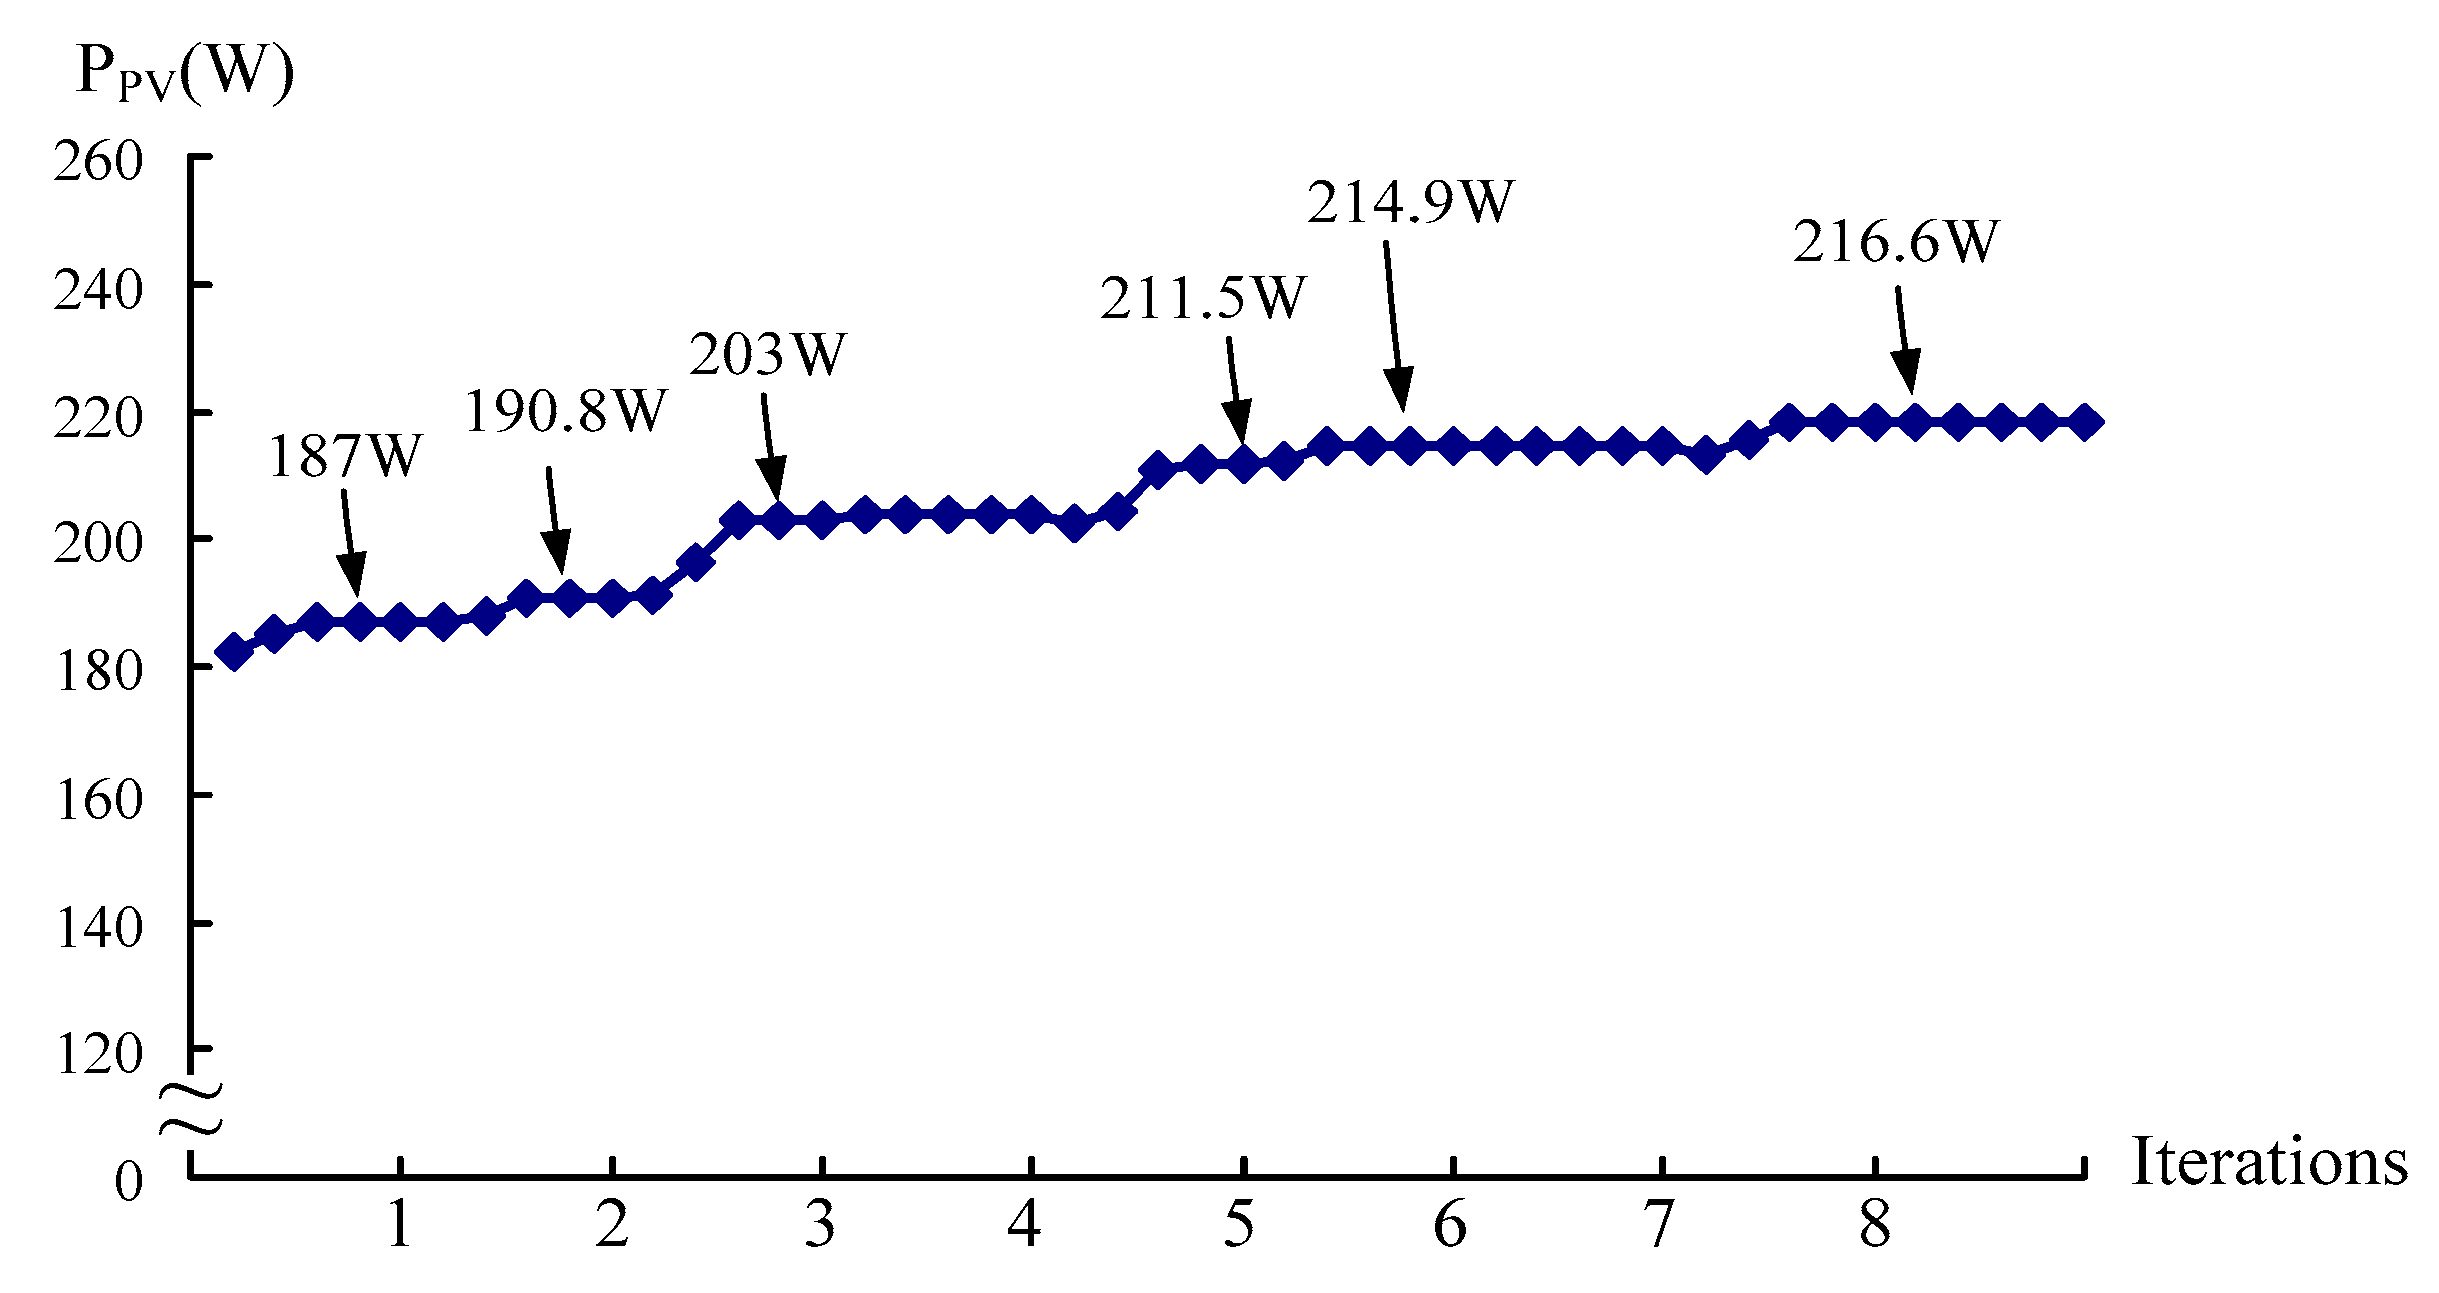
Figure 9.
P-V characteristic curve comparison between pre- and post-optimization in Case 1.

Figure 10.
The post-optimized array configuration in Case 1.

Figure 11.
The pre-optimized array configuration in Case 2.

Figure 12.
A plot of the measured gbest against the number of iterations in Case 2 before configuration optimization.
Figure 12.
A plot of the measured gbest against the number of iterations in Case 2 before configuration optimization.

Figure 13.
P-V characteristic curve comparison between pre- and post-optimization in Case 2.
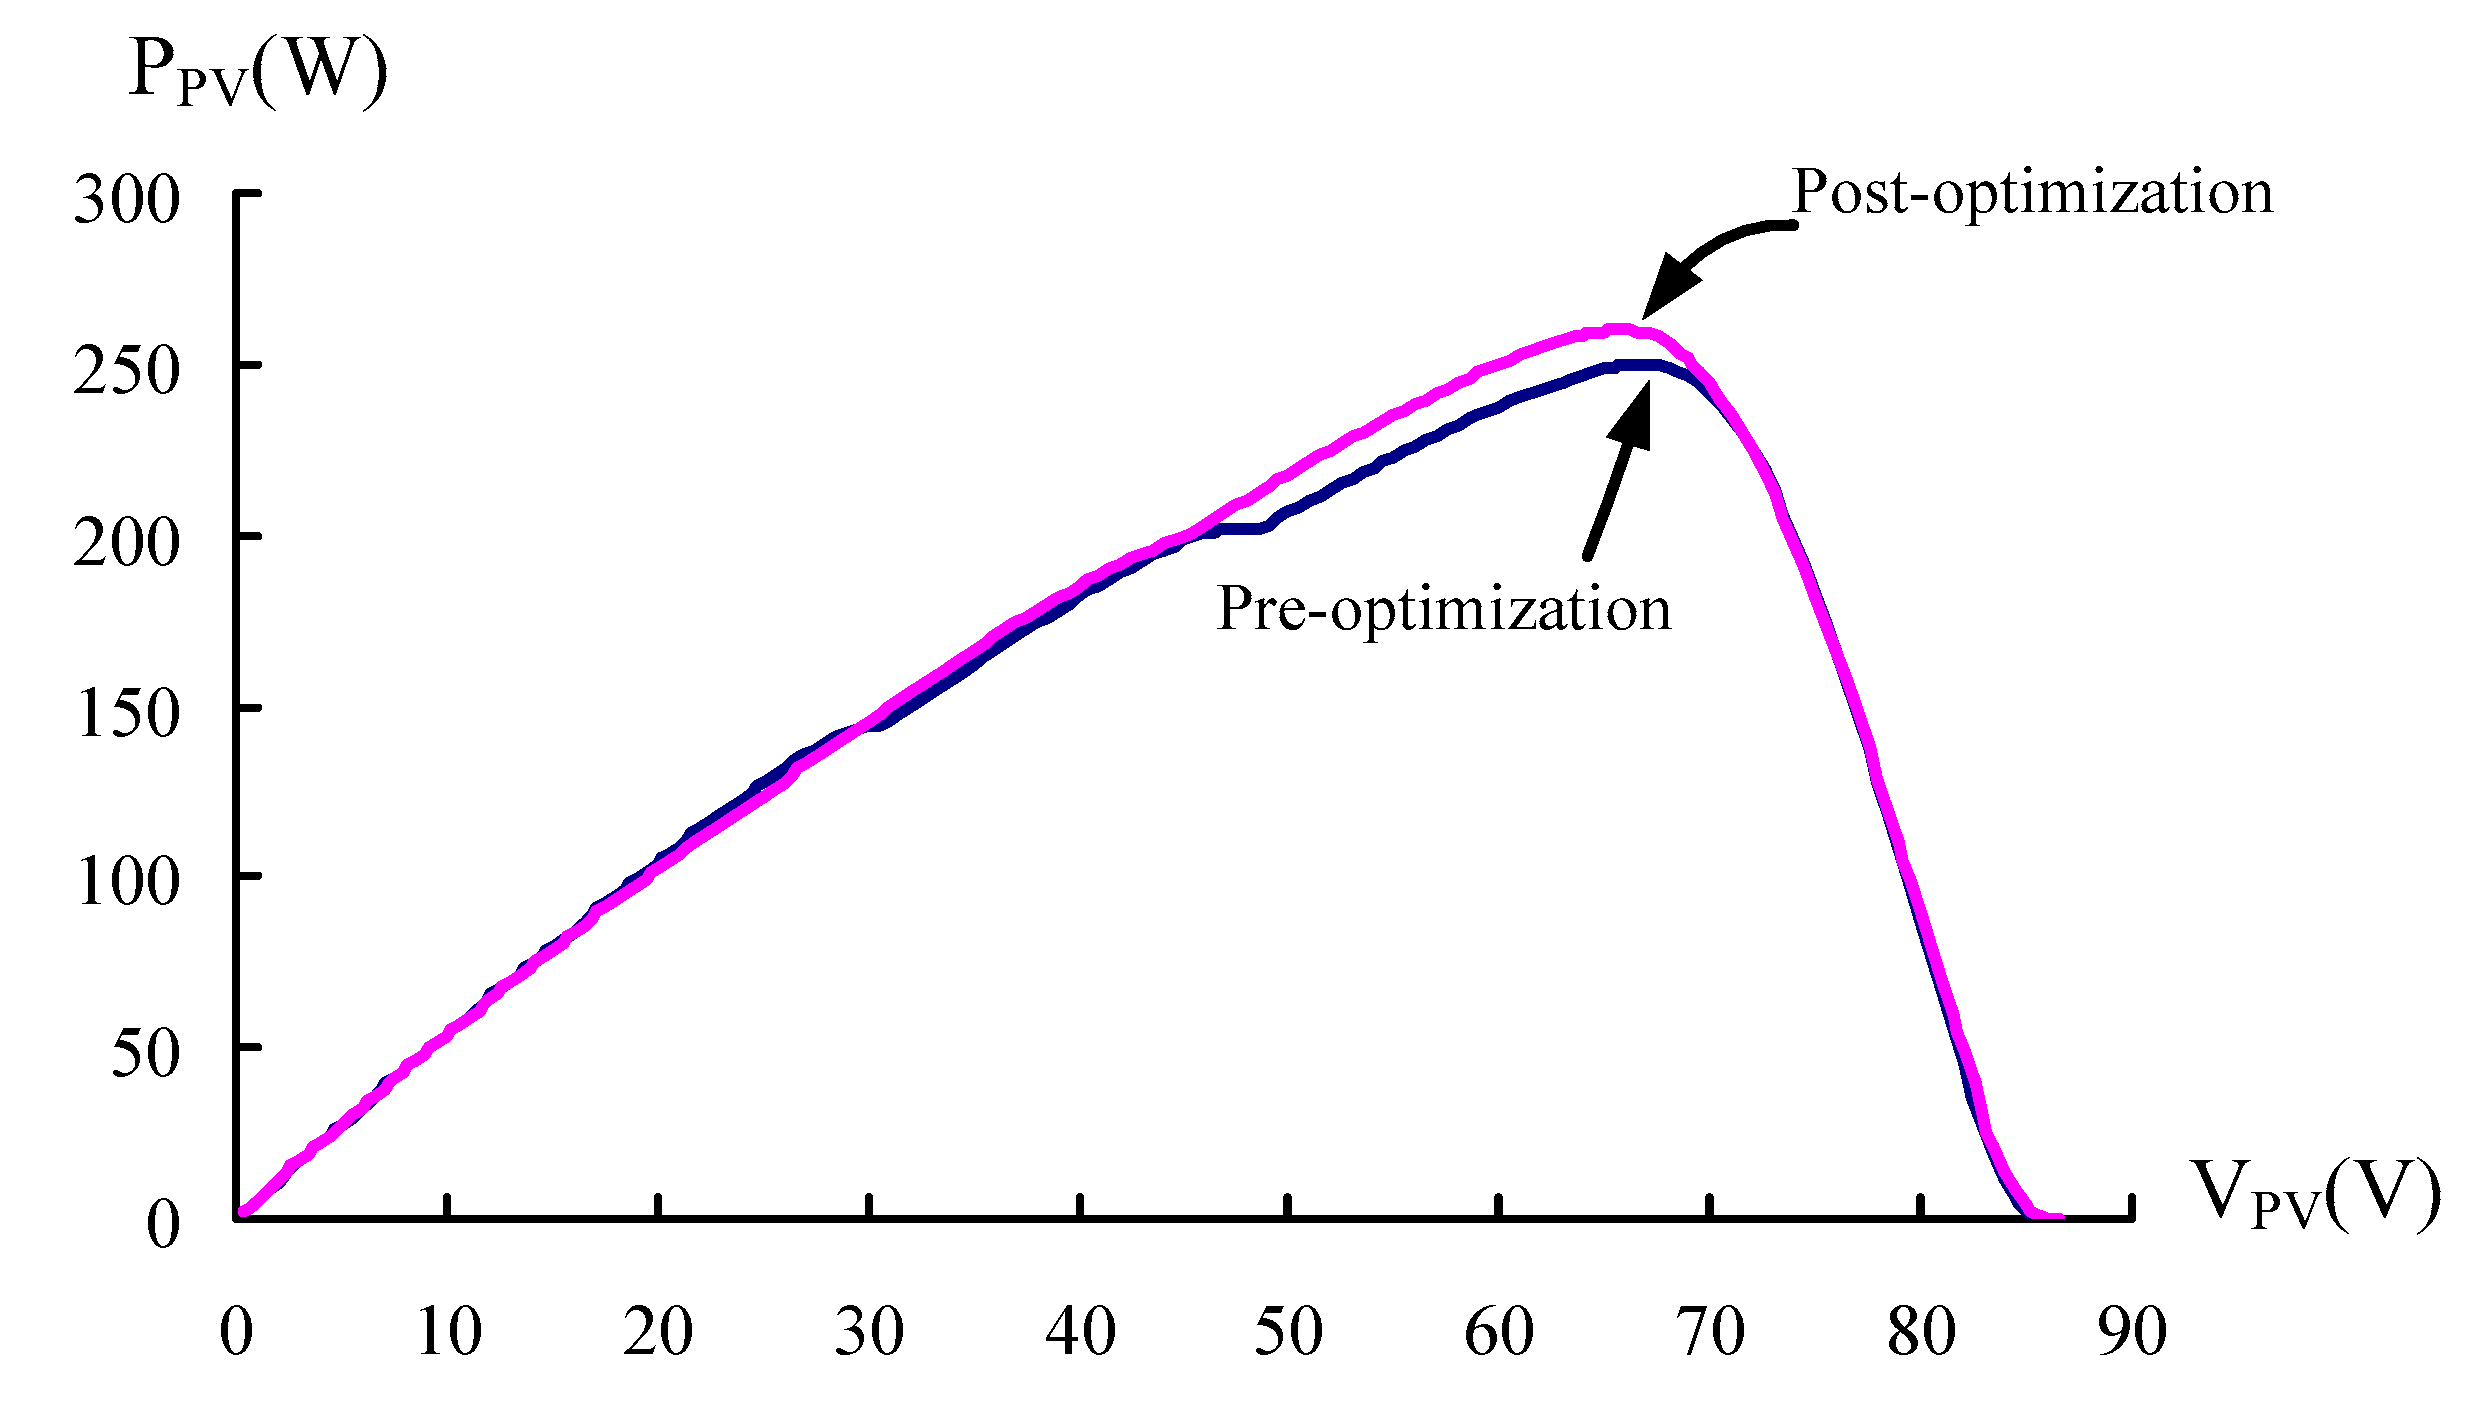
Figure 14.
The post-optimized array configuration in Case 2.
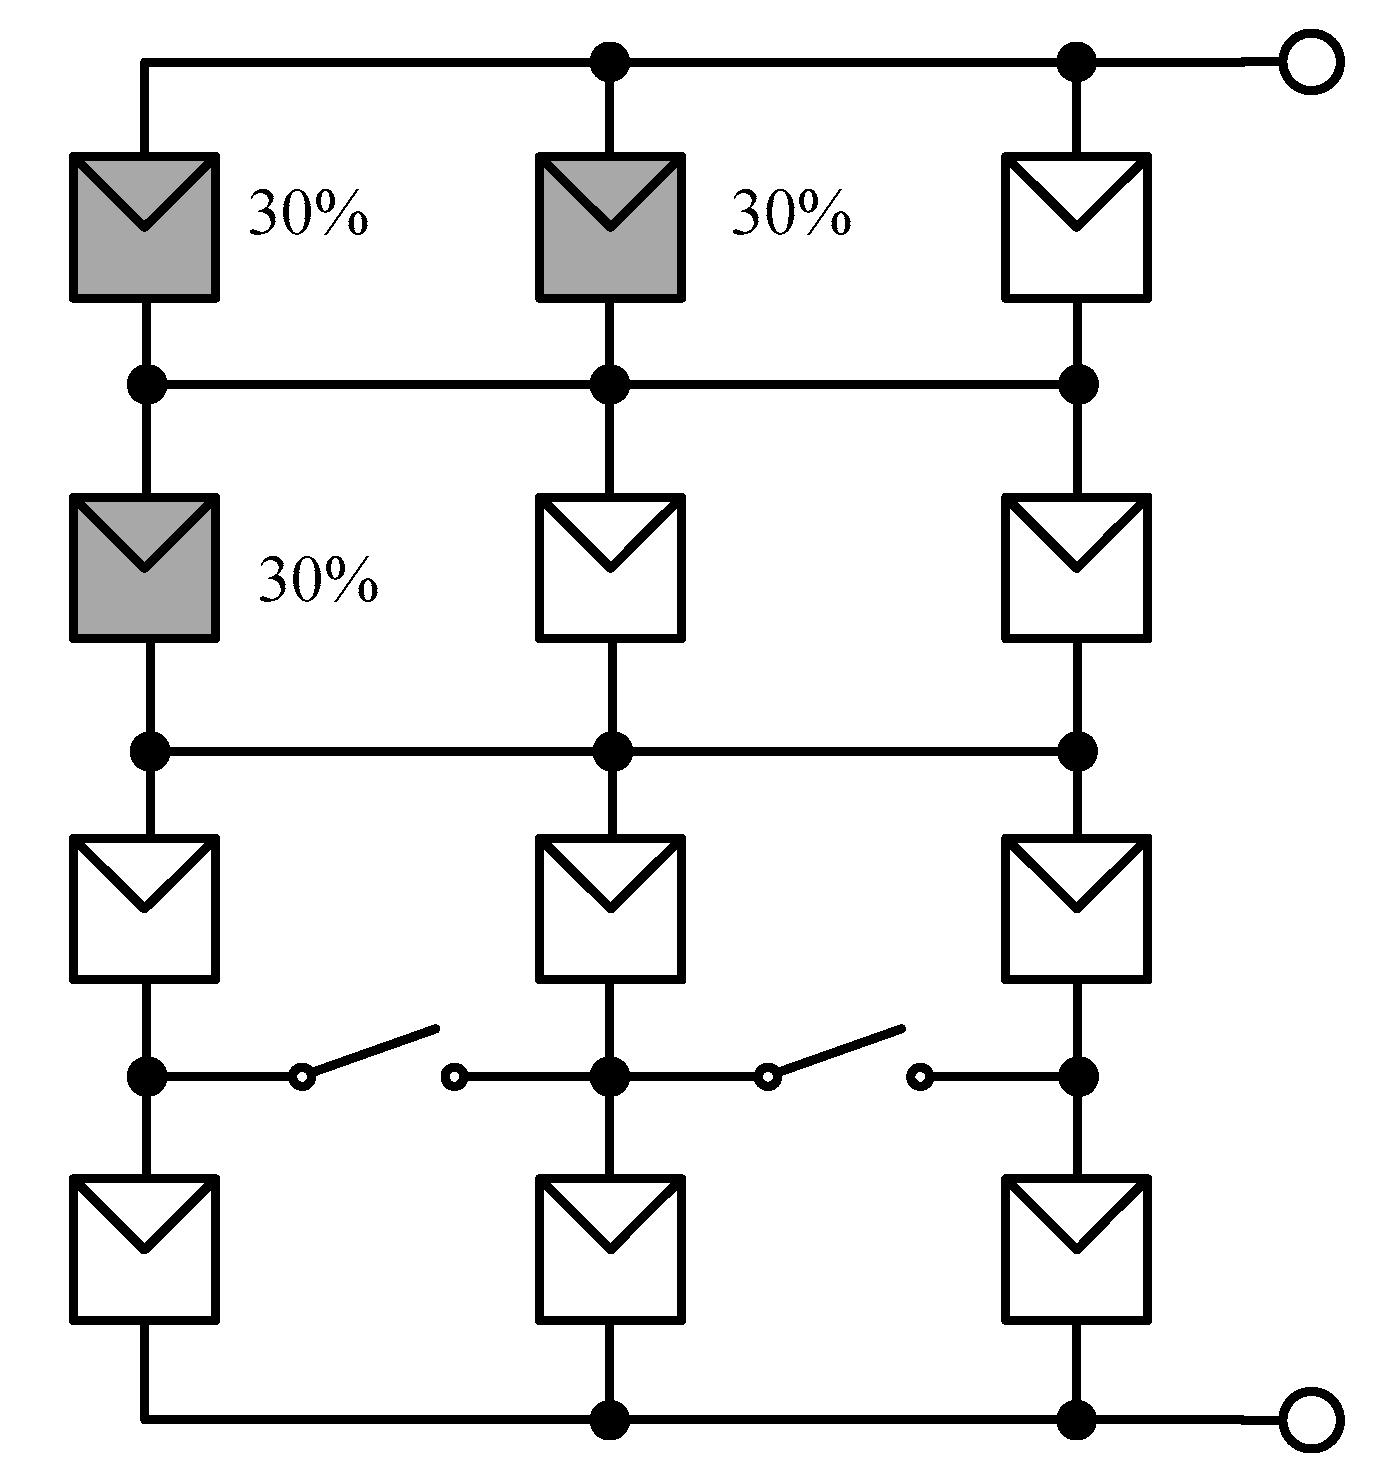
Figure 15.
The pre-optimized array configuration in Case 3.

Figure 16.
A plot of the measured gbest against the number of iterations in Case 3 before configuration optimization.
Figure 16.
A plot of the measured gbest against the number of iterations in Case 3 before configuration optimization.

Figure 17.
P-V characteristic curve comparison between pre- and post-optimization in Case 3.

Figure 18.
The post-optimized array configuration in Case 3.

Table 1.
Specifications of a SANYO HIP 2717 photovoltaic module.
| Name | SANYO HIP 2717 |
|---|---|
| Maximum power point (Pmax) | 27.87 W |
| Current of the MPP (Impp) | 1.63 A |
| Voltage of the MPP (Vmpp) | 17.1 V |
| Short current (Isc) | 1.82 A |
| Open voltage (Voc) | 21.6 V |
Table 2.
Parameter setting for this proposed PSO (particle swarm optimization) algorithm.
| Parameter | PSO Algorithm |
|---|---|
| Paticle numbers | 4 |
| Learning factor (C1) | 1 |
| Learning factor (C2) | 2 |
| Weight factor (w) | 0.7 |
| Iterations | 8 |
Table 3.
Output power comparison between pre- and post-optimization in Case 1.
| Output power of pre-optimization | 188.29 W |
| Output power of post-optimization | 219.70 W |
| Increase power | 31.41 W (16.68%) |
Table 4.
Output power comparison between pre- and post-optimization in Case 2.
| Output power of pre-optimization | 250.51 W |
| Output power of post-optimization | 258.57 W |
| Increase power | 8.06 W (3.22%) |
Table 5.
Output power comparison between pre- and post-optimization in Case 3.
| Output power of pre-optimization | 230.89 W |
| Output power of post-optimization | 240.40 W |
| Increase power | 9.51 W (4.12%) |
Table 6.
The measurement results of the three test cases obtained using PSO-based global MPP tracker without and with configuration optimization.
Table 6.
The measurement results of the three test cases obtained using PSO-based global MPP tracker without and with configuration optimization.
| Test Case | Without Configuration Optimization | With Configuration Optimization | ||||
|---|---|---|---|---|---|---|
| P-V Curve Peaks | Average Tracking Time | Average MPP | P-V Curve Peaks | Average Tracking Time | Average MPP | |
| 1 | Triple | 3.3 s | 188.29 W | Double | 2.5 s | 219.70 W |
| 2 | Double | 2.8 s | 250.51 W | Single | 2.4 s | 258.57 W |
| 3 | Double | 3.4 s | 230.89 W | Double | 2.7 s | 240.40 W |
© 2018 by the authors. Licensee MDPI, Basel, Switzerland. This article is an open access article distributed under the terms and conditions of the Creative Commons Attribution (CC BY) license (http://creativecommons.org/licenses/by/4.0/).
Share and Cite
MDPI and ACS Style
Chen, P.-Y.; Chao, K.-H.; Liao, B.-J. Joint Operation between a PSO-Based Global MPP Tracker and a PV Module Array Configuration Strategy under Shaded or Malfunctioning Conditions. Energies 2018, 11, 2005. https://doi.org/10.3390/en11082005
AMA Style
Chen P-Y, Chao K-H, Liao B-J. Joint Operation between a PSO-Based Global MPP Tracker and a PV Module Array Configuration Strategy under Shaded or Malfunctioning Conditions. Energies. 2018; 11(8):2005. https://doi.org/10.3390/en11082005
Chicago/Turabian StyleChen, Pi-Yun, Kuei-Hsiang Chao, and Bo-Jyun Liao. 2018. "Joint Operation between a PSO-Based Global MPP Tracker and a PV Module Array Configuration Strategy under Shaded or Malfunctioning Conditions" Energies 11, no. 8: 2005. https://doi.org/10.3390/en11082005
Note that from the first issue of 2016, this journal uses article numbers instead of page numbers. See further details here.