Development and Optimization of a Building Energy Simulation Model to Study the Effect of Greenhouse Design Parameters


1
Department of Agricultural Engineering, Kyungpook National University, Daegu 702-701, Korea
2
Department of Horticulture Environment System, Korea National College of Agriculture and Fisheries, 1515, Kongjwipatjwi-ro, Deokjin-gu, Jeonju-si, Jeollabuk-do 54874, Korea
3
Institute of Agricultural Science & Technology, Kyungpook National University, Daegu 702-701, Korea
*
Author to whom correspondence should be addressed.
†
These authors contributed equally to this work.
Energies 2018, 11(8), 2001; https://doi.org/10.3390/en11082001
Submission received: 10 July 2018
/
Revised: 26 July 2018
/
Accepted: 30 July 2018
/
Published: 1 August 2018
Abstract
:Energy management of the greenhouse is considered to be one of the most important challenges of greenhouse farming. Energy saving measures need considered, besides applying energy supplying techniques. To address this issue, a model was developed to simulate the thermal environment of a greenhouse using a Transient Systems Simulation Program (TRNSYS 17) as a building energy simulation (BES) platform. The model was calibrated by modifying the input parameters to minimize the uncertainties obtained from the results. Nash-Sutcliffe efficiency coefficients of 0.958 and 0.983 showed good agreement between the computed and experimental results. The proposed model was used to evaluate the effects of greenhouse design parameters, including roof shape, orientation, double-glazing, natural ventilation, coverings and their thickness, on its energy conservation capacity. It was found that the most suitable design for a greenhouse located in Daegu (latitude 35.53° N, longitude 128.36° E) South Korea would be east-west (E-W) oriented, with a gothic-shaped roof and double-glazing of PMMA (Polymethylmethacrylate) covering. Natural ventilation reduced the inside temperature of greenhouse, thereby reducing the energy demand of cooling. The model developed can help greenhouse farmers and researchers make pre-design decisions regarding greenhouse construction, taking their local environment and specific needs into consideration.
1. Introduction
In severe climatic conditions, different heating and cooling systems are used to achieve the desired microenvironment in a greenhouse; however, this combination tends to cause an increase in energy consumption. Although the value of higher crop yields that can be obtained in a well-controlled modern greenhouse compared to outdoor cultivation is recognized, there are concerns that the greenhouse sector has become one of the most energy-intensive sectors in the agriculture industry, because of its high energy input [1]. According to one recent report from South Korea, greenhouse heating costs have increased to 30–40% of total production costs [2]. Reduction of energy consumption in greenhouse farming is the most significant challenge facing both researchers and growers, and as energy demand increases, both are focusing on ways to manage, save, produce, and store energy [3]. Various technologies, particularly renewable energy, are being utilized globally to fulfill energy requirements in buildings in general, including in the agriculture sector [4].
Most of the existing studies have focused on applying different renewable energy sources in greenhouses, aiming to reduce the cost of energy production for economical crop growth [5,6]. Experimental analyses undoubtedly provide the most reliable data; however, the results obtained from such analyses are often site-specific and may be valid only for the particular climatic conditions under evaluation, in addition to being expensive [7]. Researchers have used modeling and simulation to analyze solar energy and geothermal energy, and different heating and energy storage systems with the aim of providing a more environmentally sustainable and economically feasible method of heating in greenhouses. Several studies have used the transient systems simulation program (TRNSYS) to investigate the feasibility of utilizing solar energy to heat greenhouses. Usually solar irradiation is high in summer and low in winter; this has inspired researchers to develop the concept of seasonal storage of energy to compensate for energy demand during heating periods [8]. Voulgaraki and Papadkis [9] presented studies of solar heating and seasonal storage for such a system, including thermal and economic analysis for the whole system. Carlini et al. [10] verified the feasibility of a “photovoltaic greenhouse” and further analyzed the influence of the climate outside the greenhouse, the choice of plants cultivated, the choice of construction materials, wind conditions, altitude, and slope exposure on energy balance. Attar et al. [11] also presented a greenhouse solar heating system, discussing the parameters that influence seasonal storage systems. Vadiee and Martin [1] studied feasibility of the evolution of solar energy to fulfil the energy demand of greenhouses, discussing options to minimize energy demand and maximize the utilization of solar energy. Asdrubali et al. [12] described a solar energy system for greenhouse heating and compared simulation results with real energy consumption. Chargui et al., and Sungbok et al. [13,14], who evaluated the applicability of geothermal energy for heating and cooling greenhouses, analyzed the on-demand utilization of energy stored in the earth. Moreover, Hoes et al., and Vadiee and Martin [15,16] studied the influence of the “closed greenhouse” concept from the perspective of energy management. Different aspects of energy management in greenhouses are important in different contexts. Dalamagkidis et al. [17] designed a scheme to optimize of heating, cooling, humidification, and dehumidification in greenhouses. Kolokotsa et al. [18] developed a fuzzy logic controller system and studied the efficiency of greenhouses while considering all the external parameters that influence their internal environments. Serir et al. (2012) [19] estimated the heat transfer coefficient of greenhouse covering materials in order to evaluate the thermal behavior of unheated greenhouses. Lee et al. [20] studied the optimal selection of heating and cooling facilities for greenhouses. Ishigami et al. studied [21] environmental control in greenhouses by calculating their heat balance and fogging systems. Zhang et al. [22] developed a model to study the soil heat storage in greenhouse and validated results of their model with experimental data. Park et al. [23] studied the cooling and heating load in greenhouses using plant hot water. Therefore, we decided to propose a Building Energy Simulation (BES) model to study the greenhouse design parameters, which will help researchers and growers to take pre-design decisions under local weather conditions.
Apart from using novel energy conservation technologies, evaluating and optimizing greenhouse design parameters can affect fuel consumption positively and reduce energy demands. The evaluation of greenhouse design parameters has the potential to reduce energy demand. Energy supply techniques were modeled without considering the potential effects of various greenhouse design parameters on energy efficiency. There are some studies that analyze greenhouse design parameter. Mathala et al. developed a mathematical model to study these parameters, comparing the inside temperature for each one. However, this study did not calculate energy demand and ignored different covering materials typically used in greenhouses to reduce heat loss [24]. Gupta et al. [25] used an Auto-Cad tool to study the total solar fraction inside a greenhouse at different orientations to determine the best ones; while this study covers a very important design parameter, this model cannot be used to study the other parameters for decision making. Sethi [26] also studied the different shapes and orientations of greenhouses by using mathematical modeling based on solar radiation transmission through different shapes and orientations, and also validated the model using experimental results. These studies do not consider other greenhouse design parameters or estimate the total energy requirement for both heating and cooling periods by taking the seasonal requirement into account. As many BES models have been developed and validated, this tool provides an opportunity for researchers to analyze agricultural buildings efficiently and evaluate different parameters, while accounting for local weather conditions.
TRNSYS is a versatile component-based program that provides tools to simulate both simple and complex energy flows in buildings. It was first developed in 1975 for the simulation of thermal systems but has since undergone continuous development to become a hybrid simulator by including photovoltaic, thermal solar, and other energy systems [13]. TRNSYS consists of a series of programs and add-ins that carry out simulation under user-defined conditions. It can easily be connected with many other programs, such as ANSYS Fluent, Matlab, and Excel, for coupled simulations and pre- and post-processing; such versatility has made TRNSYS an effective program to carry out energy systems simulations.
The main scope of this study is to provide a reliable BES model (using TRNSYS 17) to study how various aspects of greenhouse design affect energy conservation. It is important to determine energy demand to estimate annual operating cost for greenhouse crop production. The energy demand is highly dependent on greenhouse design parameters, which influence the internal environment of the greenhouse based on the availability of solar radiation in the greenhouse. Therefore, efforts have been made to correctly estimate the effect of solar radiation on the internal environment of a greenhouse. This was done by calibrating the proposed BES model based on a detailed examination of the methods used to calculate solar radiation on a tilted surface of the greenhouse. The BES model was successfully validated with the experimentally obtained results, and statistical analyses were carried out on the calibration and validation results to determine the reliability of the proposed model. The calibrated and validated BES model was then used to evaluate the effect of various greenhouse design parameters, including: Greenhouse shape, orientation, glazing, use of natural ventilation; which includes different roof and side vents openings, covering materials including; polyethylene (PE), polyvinyl chloride (PVC), horticulture glass (HG), polymethylmethacrylate (PMMA), and polycarbonate (PC), and the thickness of the covering material. All simulations were conducted for a single span greenhouse. The selection of the optimum greenhouse design can reduce its energy demand. This tool provides an opportunity for researchers and growers to analyze agricultural buildings efficiently and evaluate their different parameters while accounting for their local weather conditions.
2. Materials and Methods
2.1. Experimental Greenhouse
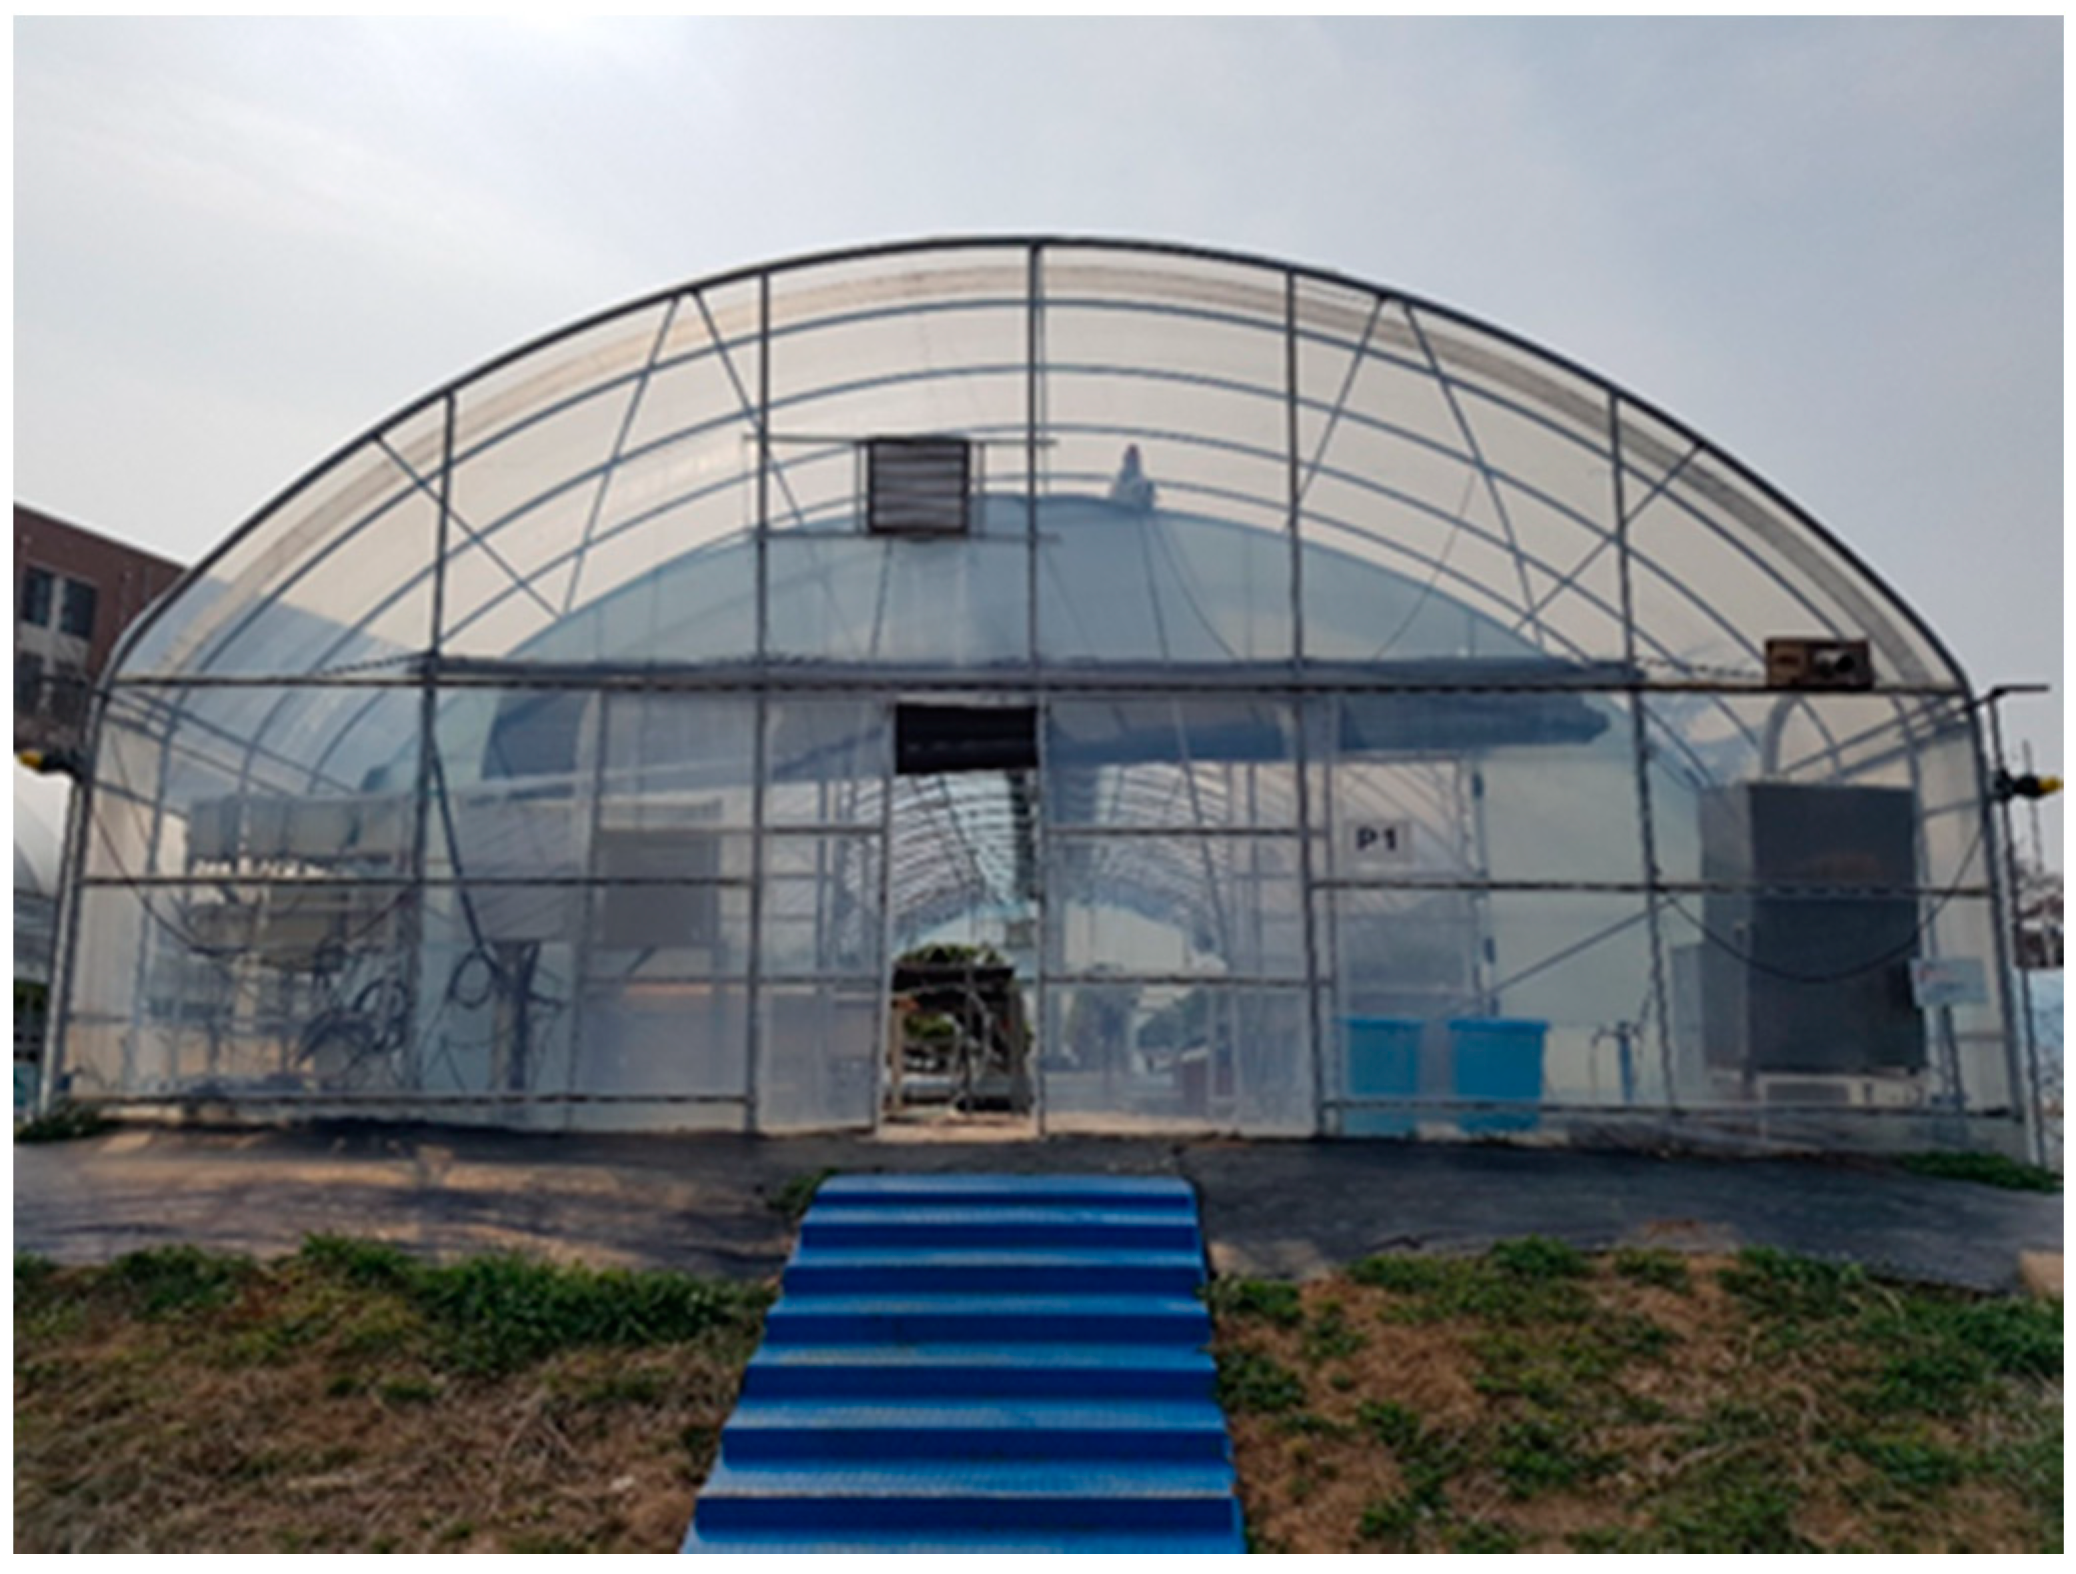
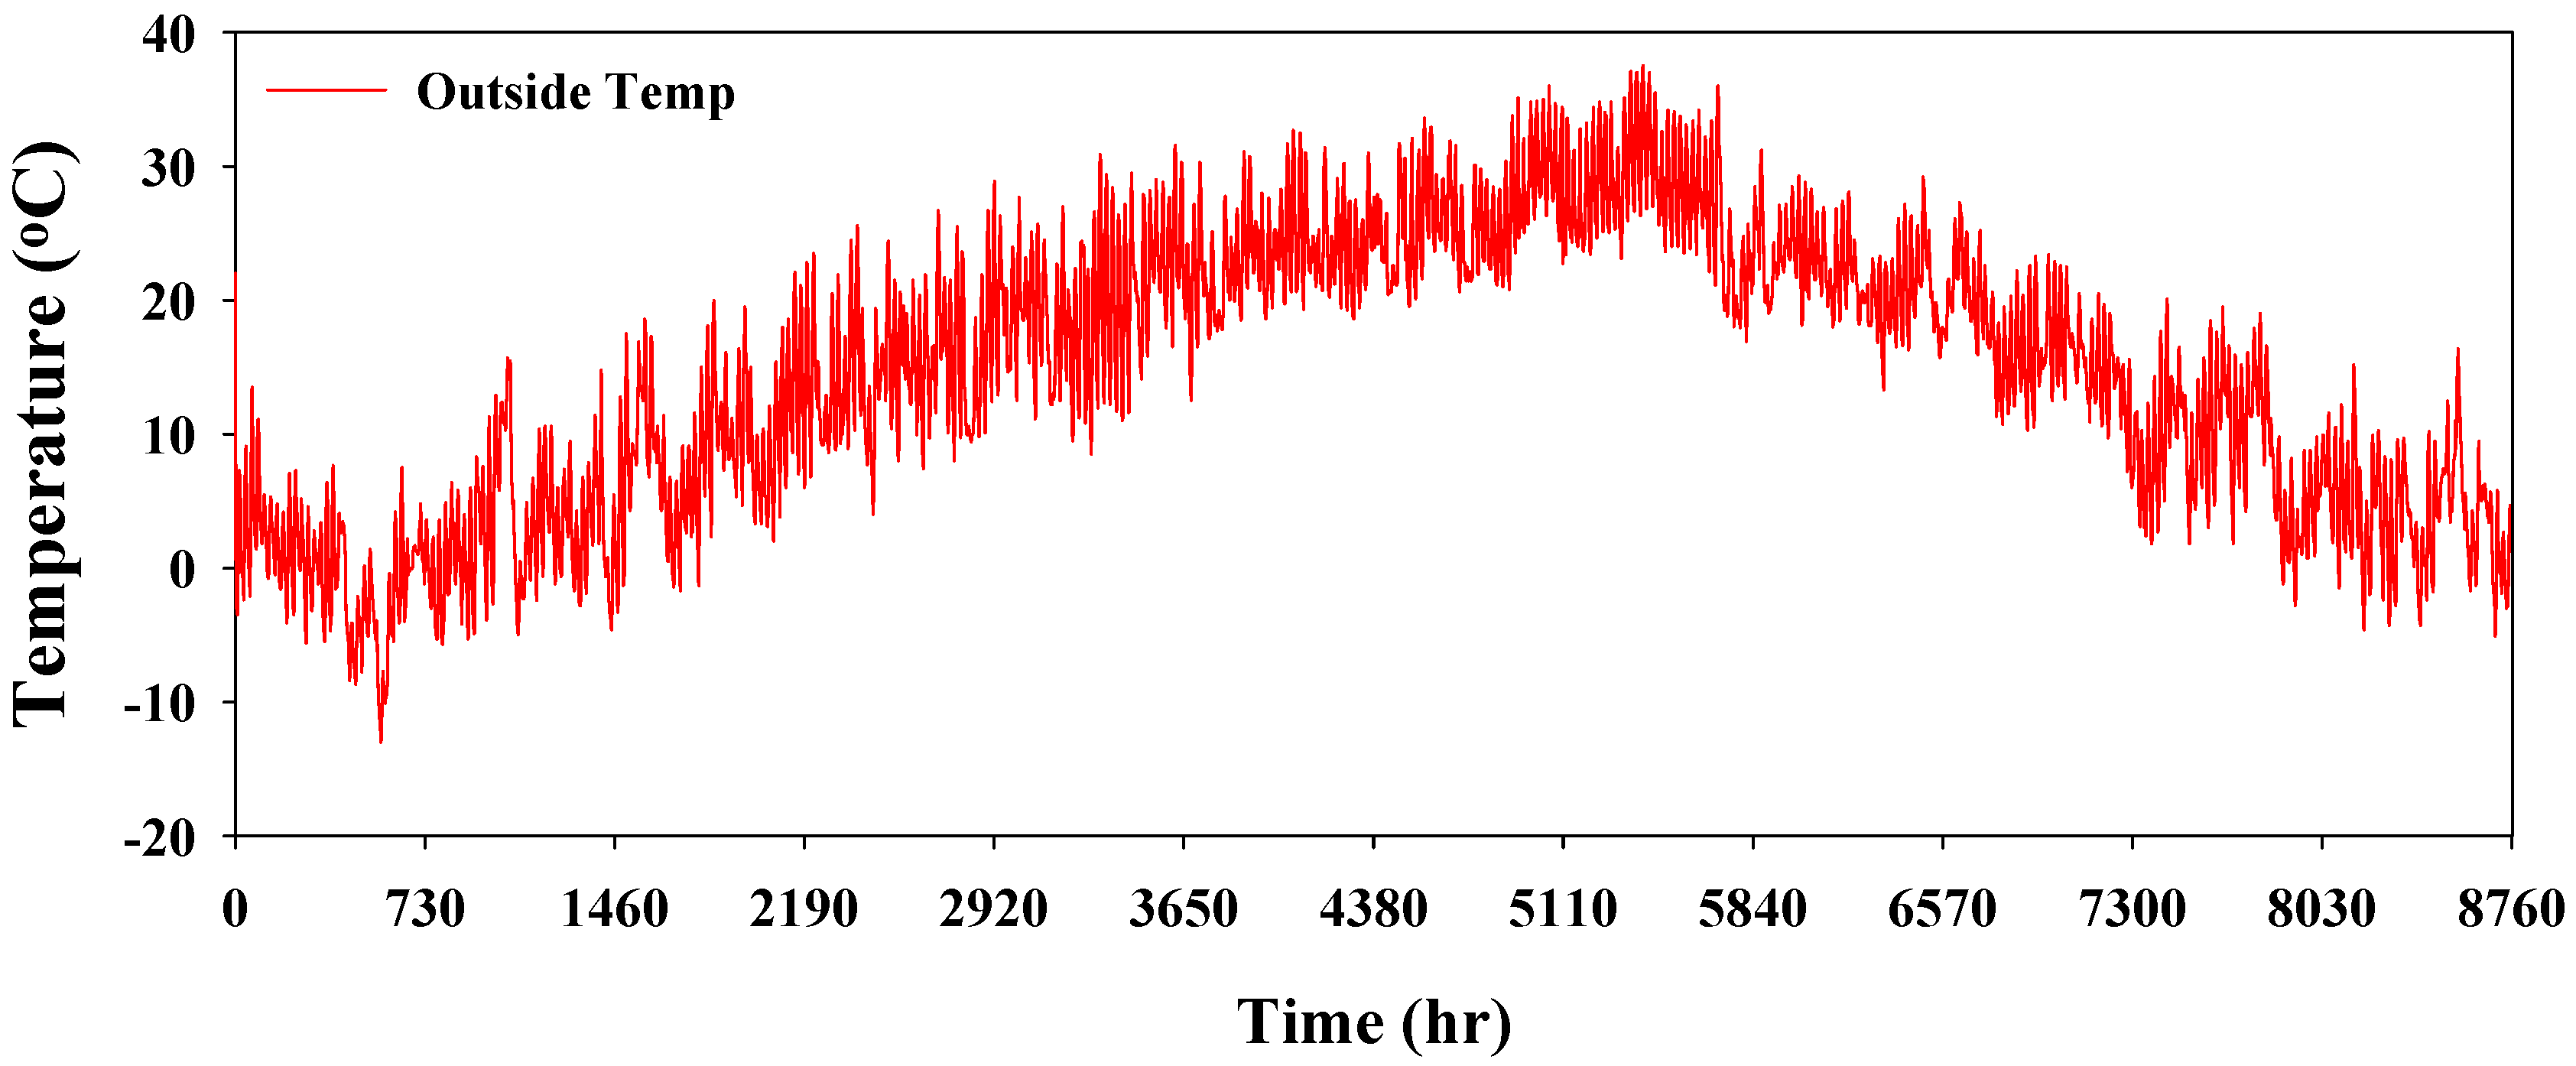
The single-span experimental greenhouse had a rectangular based, round roof, and was covered with a double-layered PE material, as shown in Figure 1. The dimensions of the greenhouse were 22 m × 8.4 m × 4 m, with a total volume and floor area of 556.8 m3 and 184.8 m2, respectively; these specifications are shown in Figure 2. The experimental greenhouse was located in Daegu (latitude 35.53° N, longitude 128.36° E, elevation 48 m), South Korea. Necessary information and data from the site were collected to use as input data in the BES model. Weather data were recorded for one year starting from 1 January 2016; their characteristics are presented in Table 1. The temperature inside the greenhouse was measured at different locations along the central line, and the mean of these measured temperatures were used for comparison with the BES results for validation. During the experimental period, no crops were grown inside the greenhouse. The weather parameters, air temperature, solar radiation, and relative outdoor humidity were monitored by mounting several sensors outside the greenhouse. The annual mean temperature and solar radiation measured outside the greenhouse are given in Figure 3 and Figure 4, respectively. In addition, wind speed, wind direction, and ambient pressure data were obtained from the Korean Meteorological Administration (KMA). Wind speeds were recorded at a height of 10 m, but taking the height of our greenhouse into account, the wind speed data were modified to the height of its eaves using the following power law Equation (1) [27]:
where W is the wind speed in ms−1 at the required height h (in m), Wd is the wind speed at the given height H (in ms−1), and α is an empirically derived coefficient (2/9).
2.2. Building Energy Simulation (BES)
2.2.1. Modeling
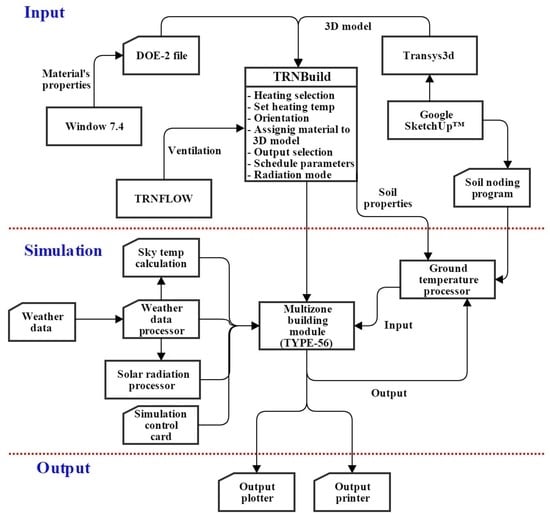
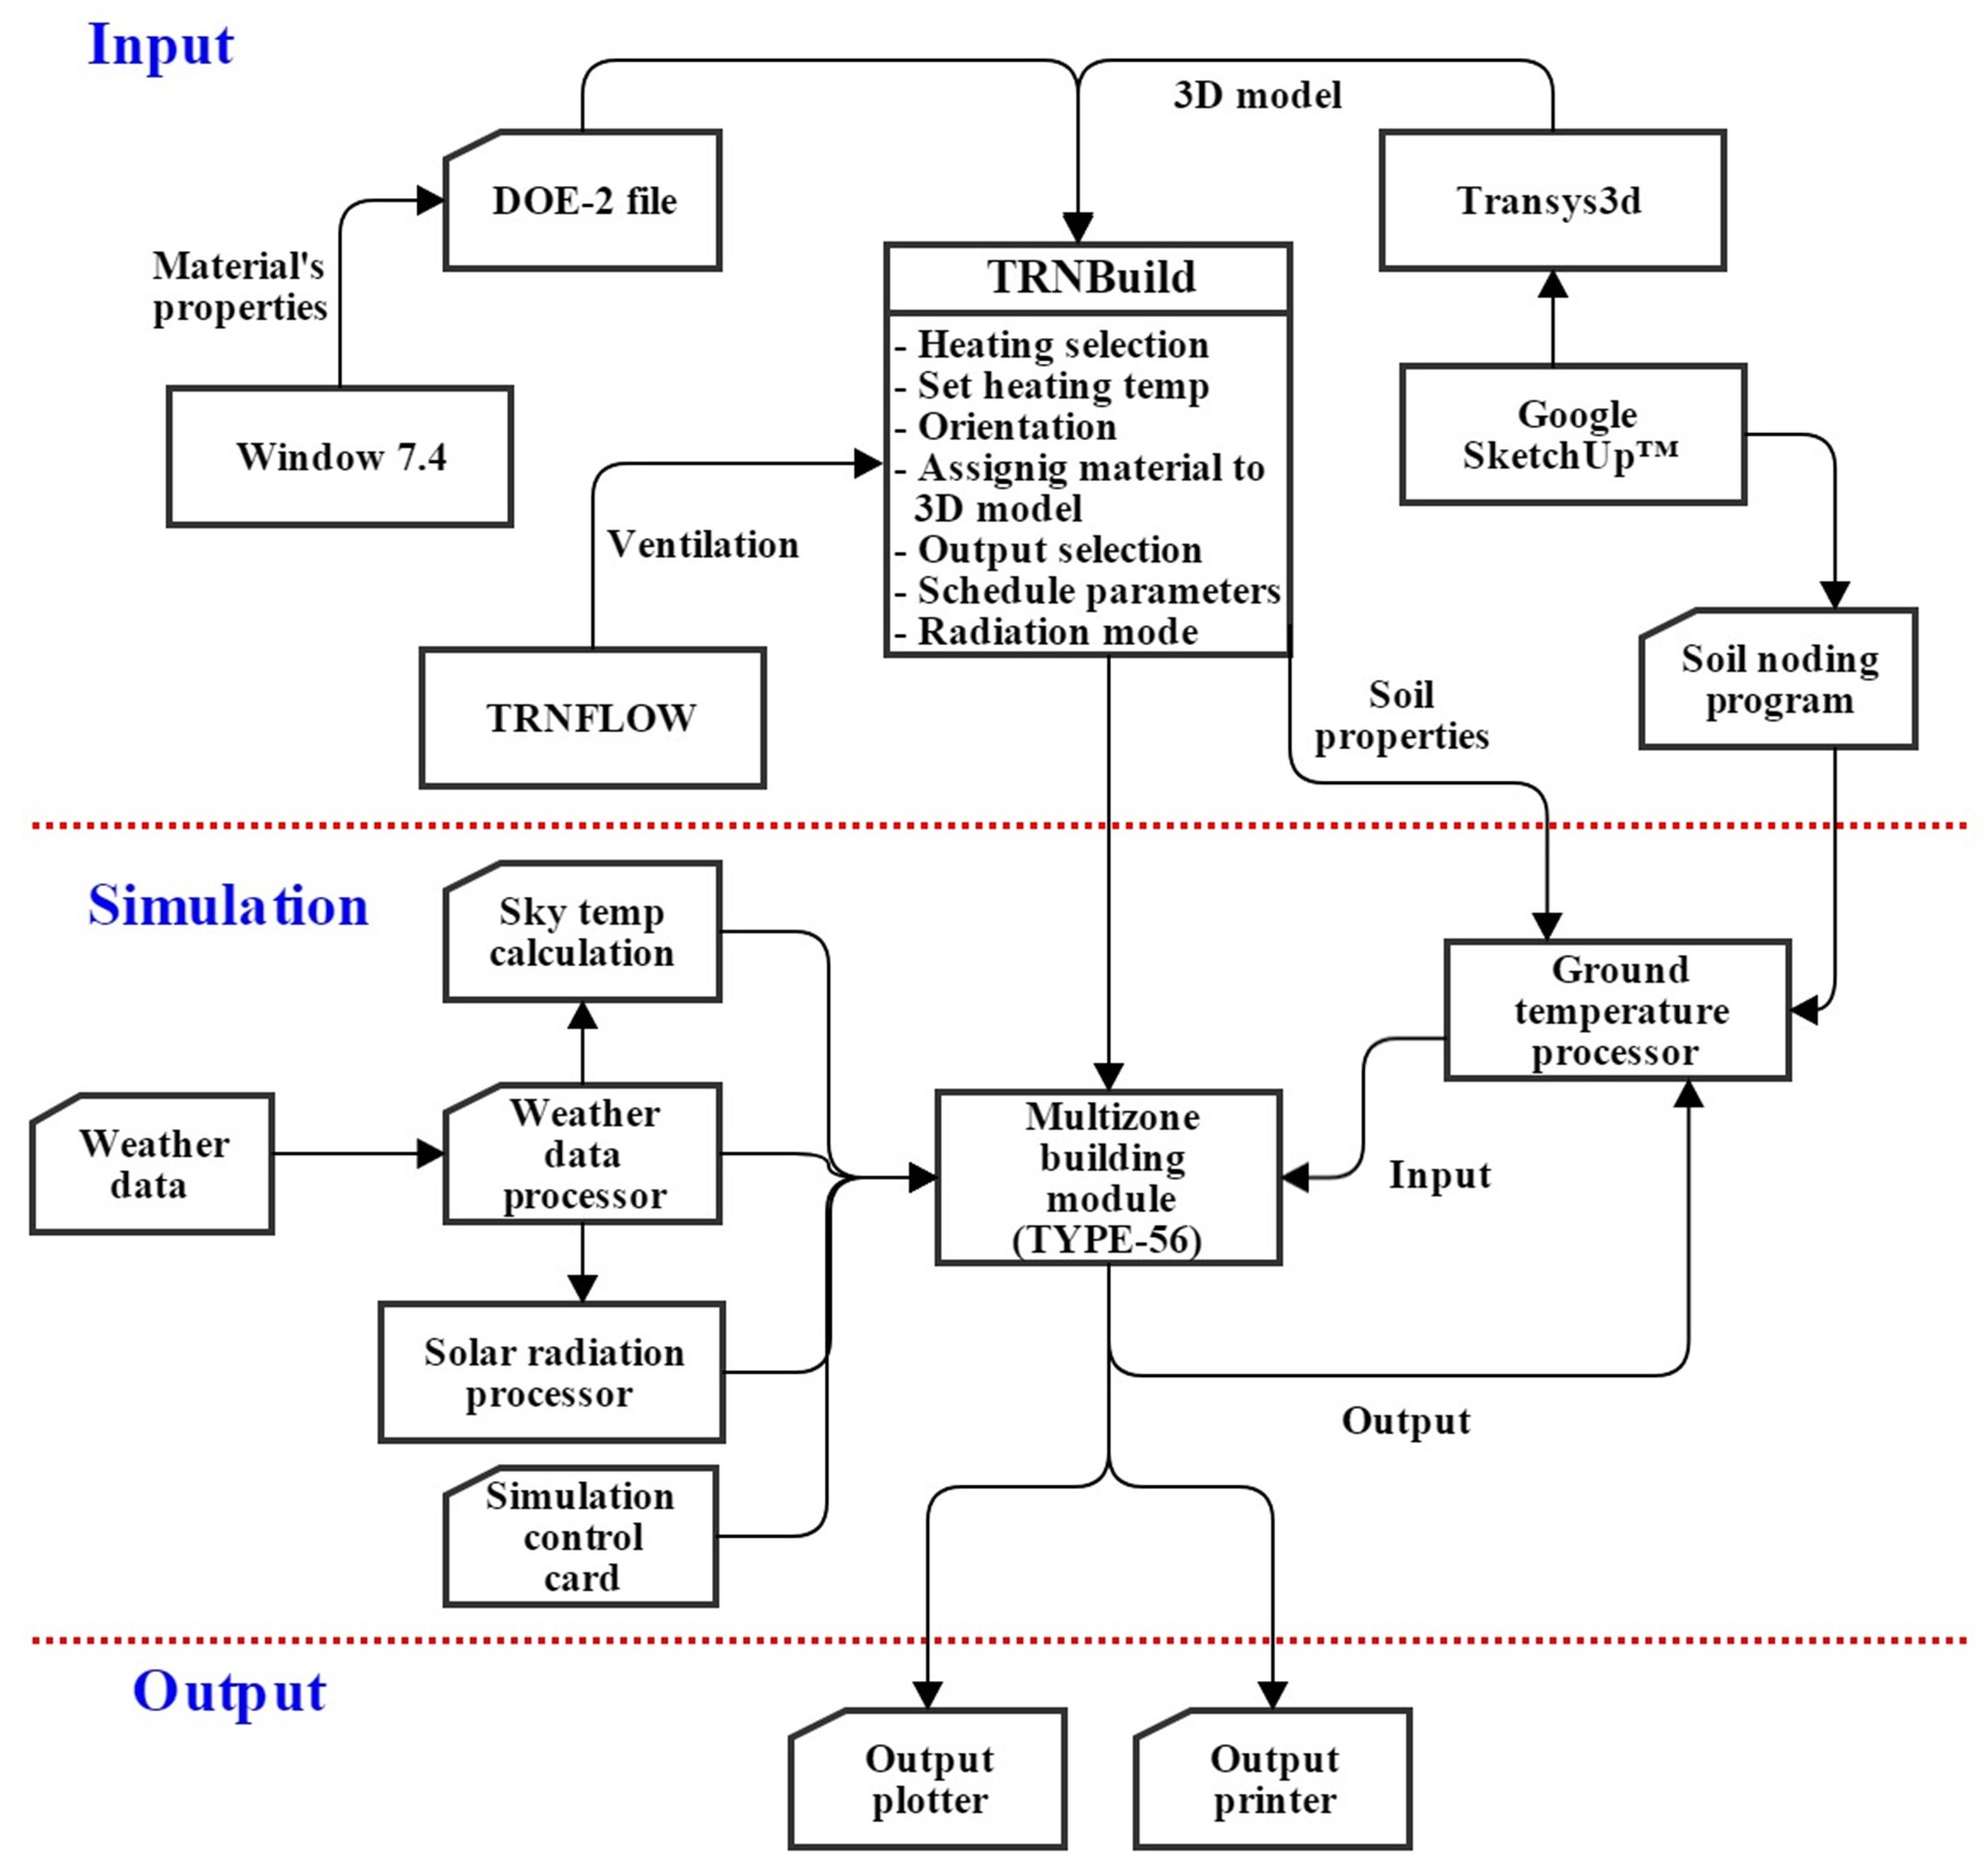
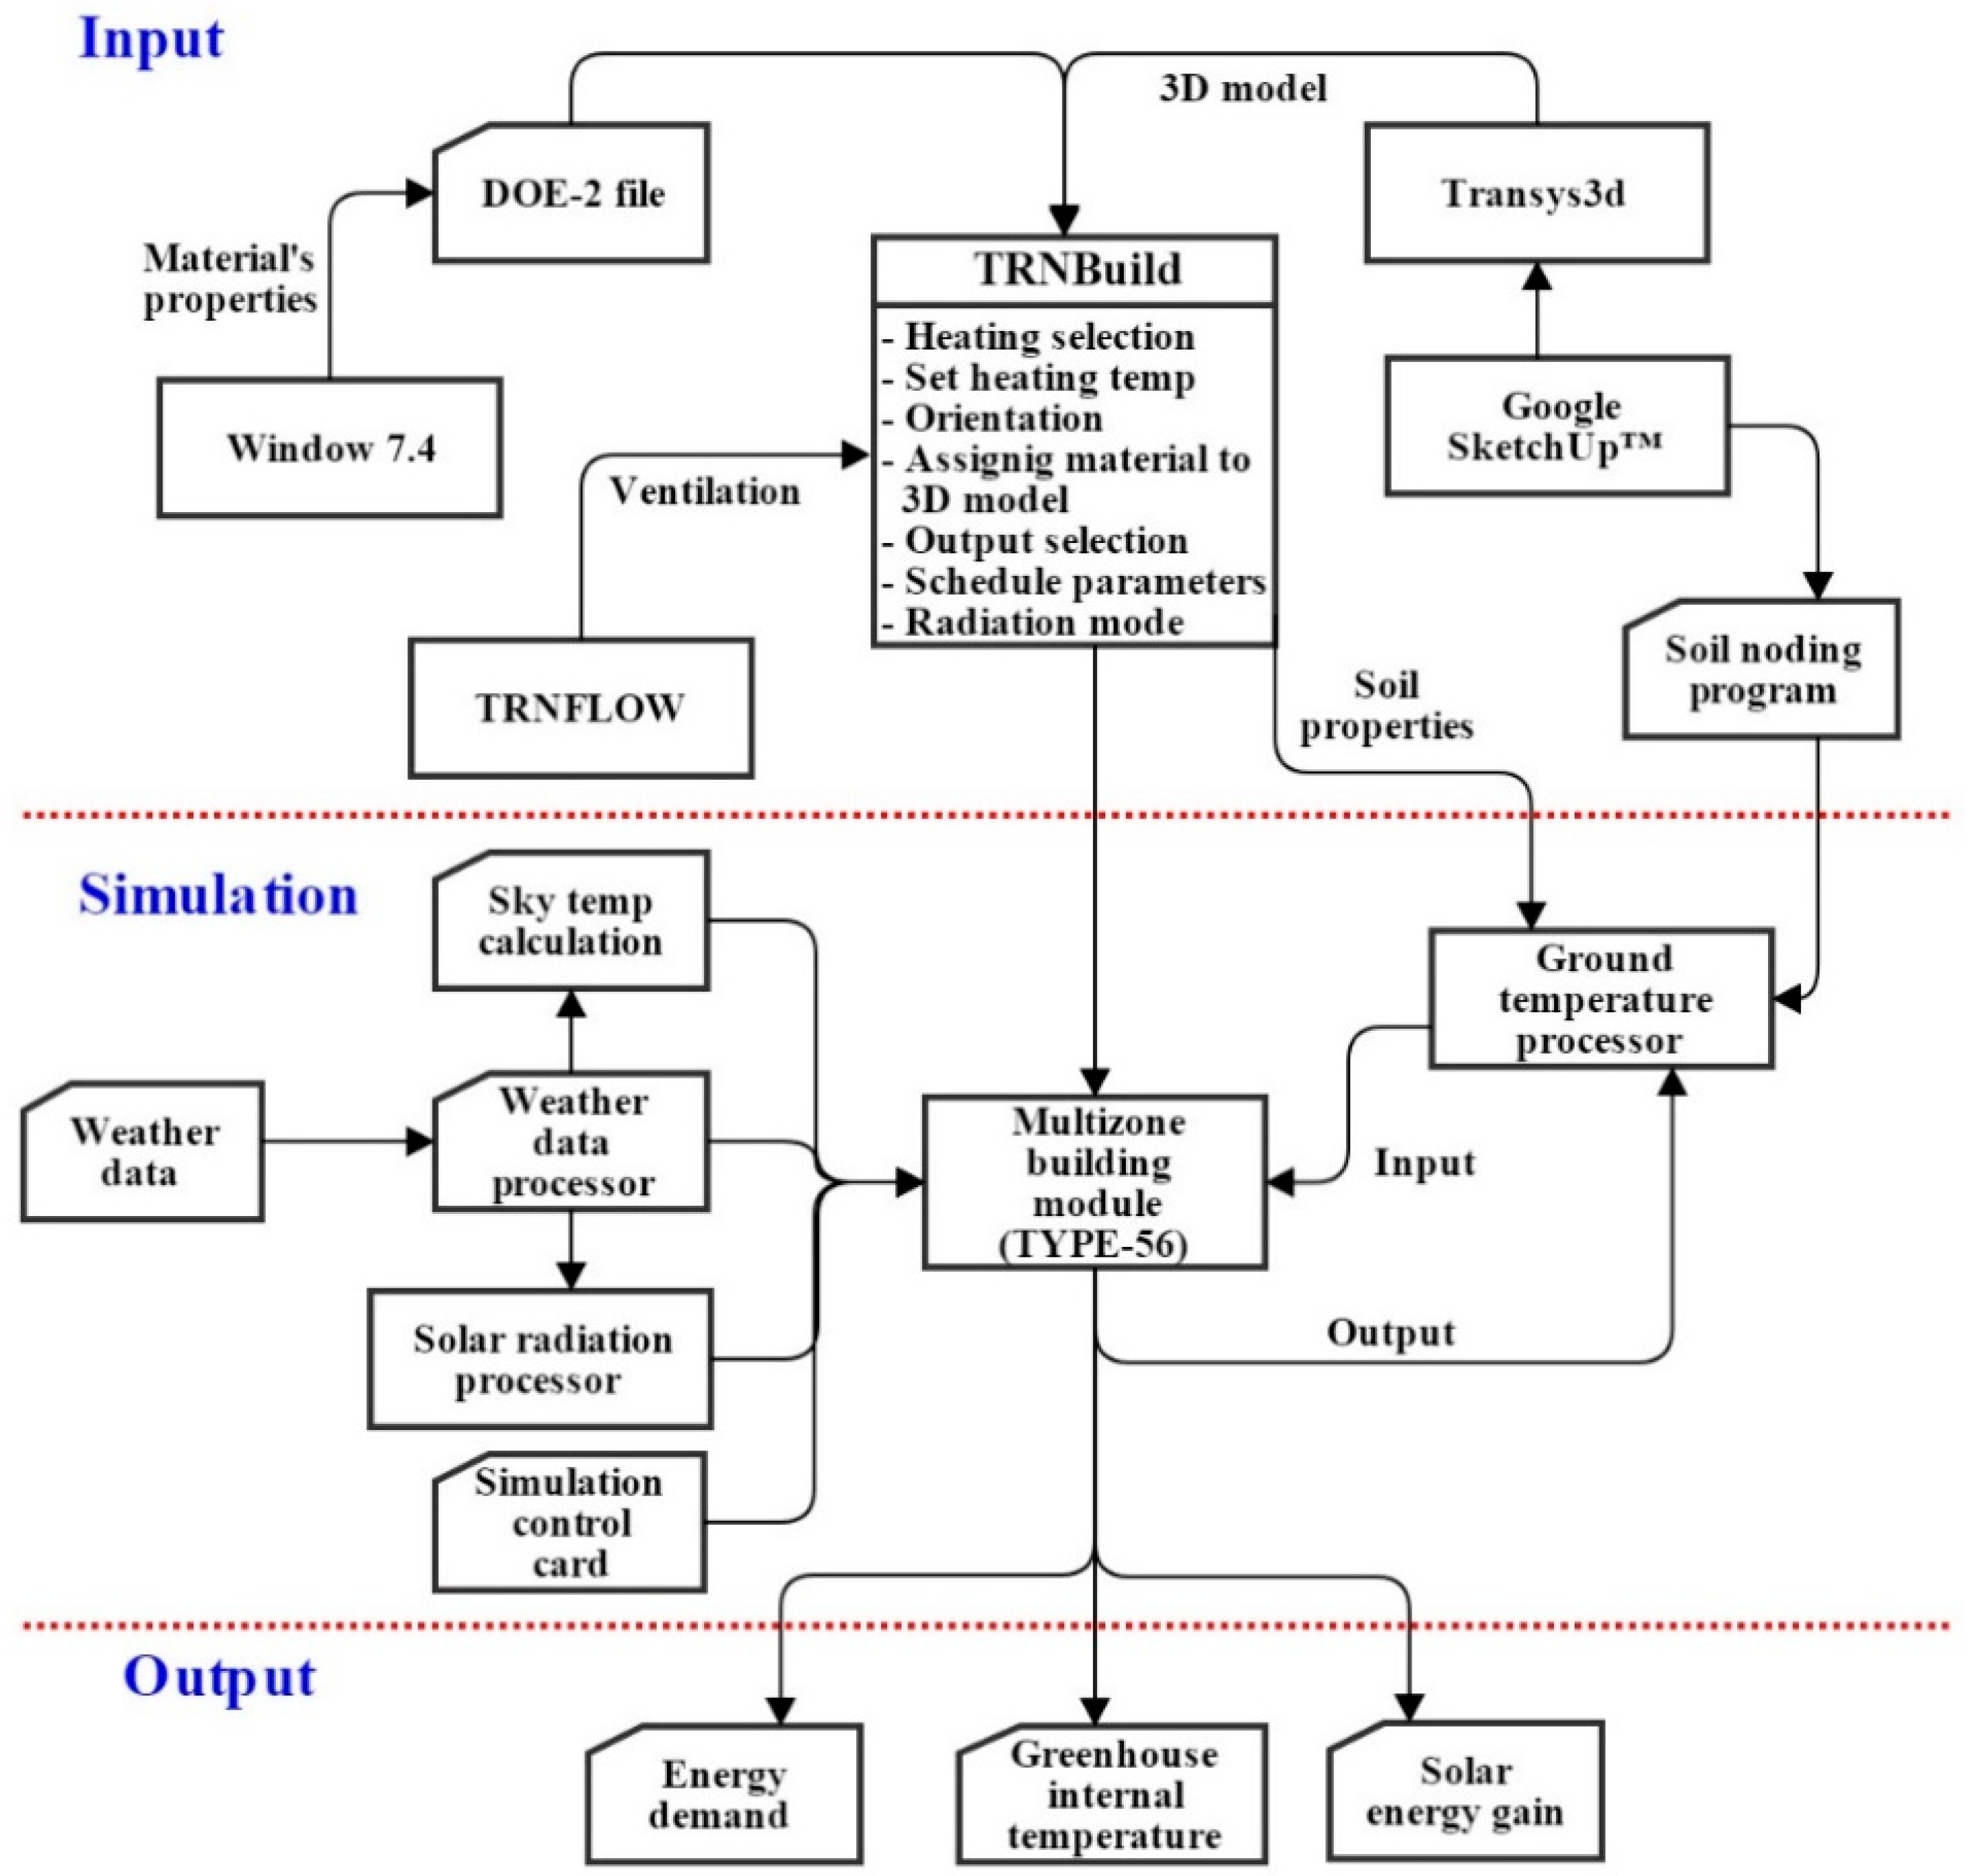
A BES model was designed, using the TRNSYS 17 program, to evaluate the effects of various greenhouse design parameters on its internal thermal environment. A sensitivity analysis was conducted by evaluating the impact of each parameter on the energy conservation capacity of the greenhouse. The details of each greenhouse design parameter, studied using BES modeling, are given in Table 2. For this study, we used the following TRNSYS 17 software modules: Simulation studio, TRNBuild, Google SketchUp™, Trnsys3d, TRNFlow, the SoilNoding program, and Berkeley Lab Window 7.4 software. These modules were run on a desktop personal computer with an Intel core i7-5820k processor (3.30 Ghz), DDR3-RAM (32 GB), and NVIDIA GeForce GTX 960 graphics card, using 64-bit Windows 7. The elements of the modeling process are detailed in the flow diagram presented in Figure 5. TRNSYS simulation studio (the main interface of the program) connects all the components of the model. All the simulations were carried out by inputting the 2016 weather data for Daegu into the weather data module (Type-9) in the simulation studio. Three commonly used single-span greenhouse shapes: Gothic, round, and even-roof, were evaluated to assess the structure of the greenhouse. Utilizing the same specifications as the experimental greenhouse, three dimensional (3D) models of these greenhouses were designed in Trnsys3d, which is a plugin for the Google SketchUp™ software. These 3D models were then imported into TRNBuild, and the basic project data were created. TRNSYS simulation studio TYPE-56 (multizone building module) was used, in conjunction with TRNBuild to input the basic description of the project. We used Berkley Lab Window 7.4 software to create a DOE-2 file (which is readable by TRNBuild) of the covering materials, using the following known properties of materials: Solar transmittance and reflectance, thermal radiation transmittance and emission, visible radiation transmittance and reflectance, conductivity (W m−1 K−1), and thickness (mm).
Moreover, Figure 6 shows a sample of the DOE-2 file for PMMA material. The ground energy exchange is also important to consider, as solar energy captured during daytime is retained in the surface layers of the ground and contributes to an increased night-time air temperature in the greenhouse. To account for this, we used the Multizone slab model (Type 49) offered by TRNSYS, which requires a greenhouse floor input file created using the SoilNoding program, a plugin for Google SketchUp™. The input file was imported into Type 49, where it was connected with Type 56 to obtain an input for the energy transferred to the floor and with TRNBuild to provide inputs for soil properties. The calculated ground surface temperature (output of Type 49) was applied to the greenhouse model to simulate the internal greenhouse environment. Natural ventilation was simulated using TRNFLOW, a ventilation module of the TRNSYS 17 program. TRNFLOW coupled the internal and surrounding greenhouse environments with a consideration of wind speed, wind direction, wind pressure, and internal and external temperatures. The airflow network in the model was defined by linking the external node (ambient environment) to the thermal node (internal greenhouse) through the open windows using the TRNFLOW interface within TRNBuild. In addition, the weather data were connected with Type 56 in the simulation studio to make them available for the TRNFLOW interface. To perform these evaluations, the annual energy demand for both heating and cooling was obtained by setting the internal temperature of the greenhouse at a constant of 18 °C for heating and 27 °C for cooling; these are the target temperatures for the tomato crop in South Korea. The length, width, and height were kept the same as those of the experimental greenhouse used for the validation.
2.2.2. Statistical Analysis of the BES Model
Statistical analyses were performed to analyze the predictive power of the BES model using the Nash–Sutcliffe efficiency coefficient (NSE) to compare the experimentally observed data with the output of the BES. This coefficient quantitatively describes the accuracy of the model results; its value ranges from −∞ to 1, and values closer to 1 indicate a better predictive power of the model. The NSE value can be calculated by using Equation (2):
where is the experimentally obtained internal air temperature of the greenhouse, is the simulated internal air temperature of the greenhouse, is the mean of the experimental air temperature, and n is the total number of observations.
2.2.3. Calibration
The BES model was calibrated to reduce the uncertainties that occurred as a result of variations in the input parameters. Firstly, we needed to define the thermal and optical properties of the construction materials of the modeled greenhouse, as TRNSYS does not contain data on materials that are typically used as greenhouse covers. Table 3 shows the characteristics properties of the greenhouse covers necessary to conduct the simulation [28]. In addition, TRNSYS used constant values for the internal and external convective heat transfer coefficients (hi and he, respectively), These needed to be adjusted as they are weather dependent. One [29] of our previous studies examined different hi and he values recommended by different researchers, and found the best fit for the BES as shown in Equations (3) and (4) below:
where hi and he (W∙m−2∙k−1) are the internal and external convective heat transfer coefficients, respectively. W is the wind speed, Tai the internal air temperature, and Tsi the internal surface temperature.
Moreover, the greenhouse energy demand during both heating and cooling periods is particularly sensitive to the solar energy gain of the greenhouse, in a simulation, this is dependent upon correct processing and estimation of the solar radiation received inside the greenhouse. The input parameters of the solar radiation processor of TRNSYS affect the model results directly. Therefore, the model needs to be calibrated using a selection of input parameters by evaluating their effects on the results. The ambient weather data input for the solar radiation processor were the external total horizontal radiation, temperature, and relative humidity. The outputs were estimated as beam (IbT), diffuse (IdT), and reflected (IgT) radiation on the tilted surface.
The radiation processor calculated the total solar radiation on the tilted surface by adding these measurements of radiations. The beam radiation on the tilt surface is calculated by a geometric factor, that can be defined as shown in Equation (5) [30]:
where Ib is the beam radiation on the horizontal surface, and Rb is a geometric factor (the ratio of tilted to horizontal beam radiation) that can be defined as shown in Equation (6) [30]:
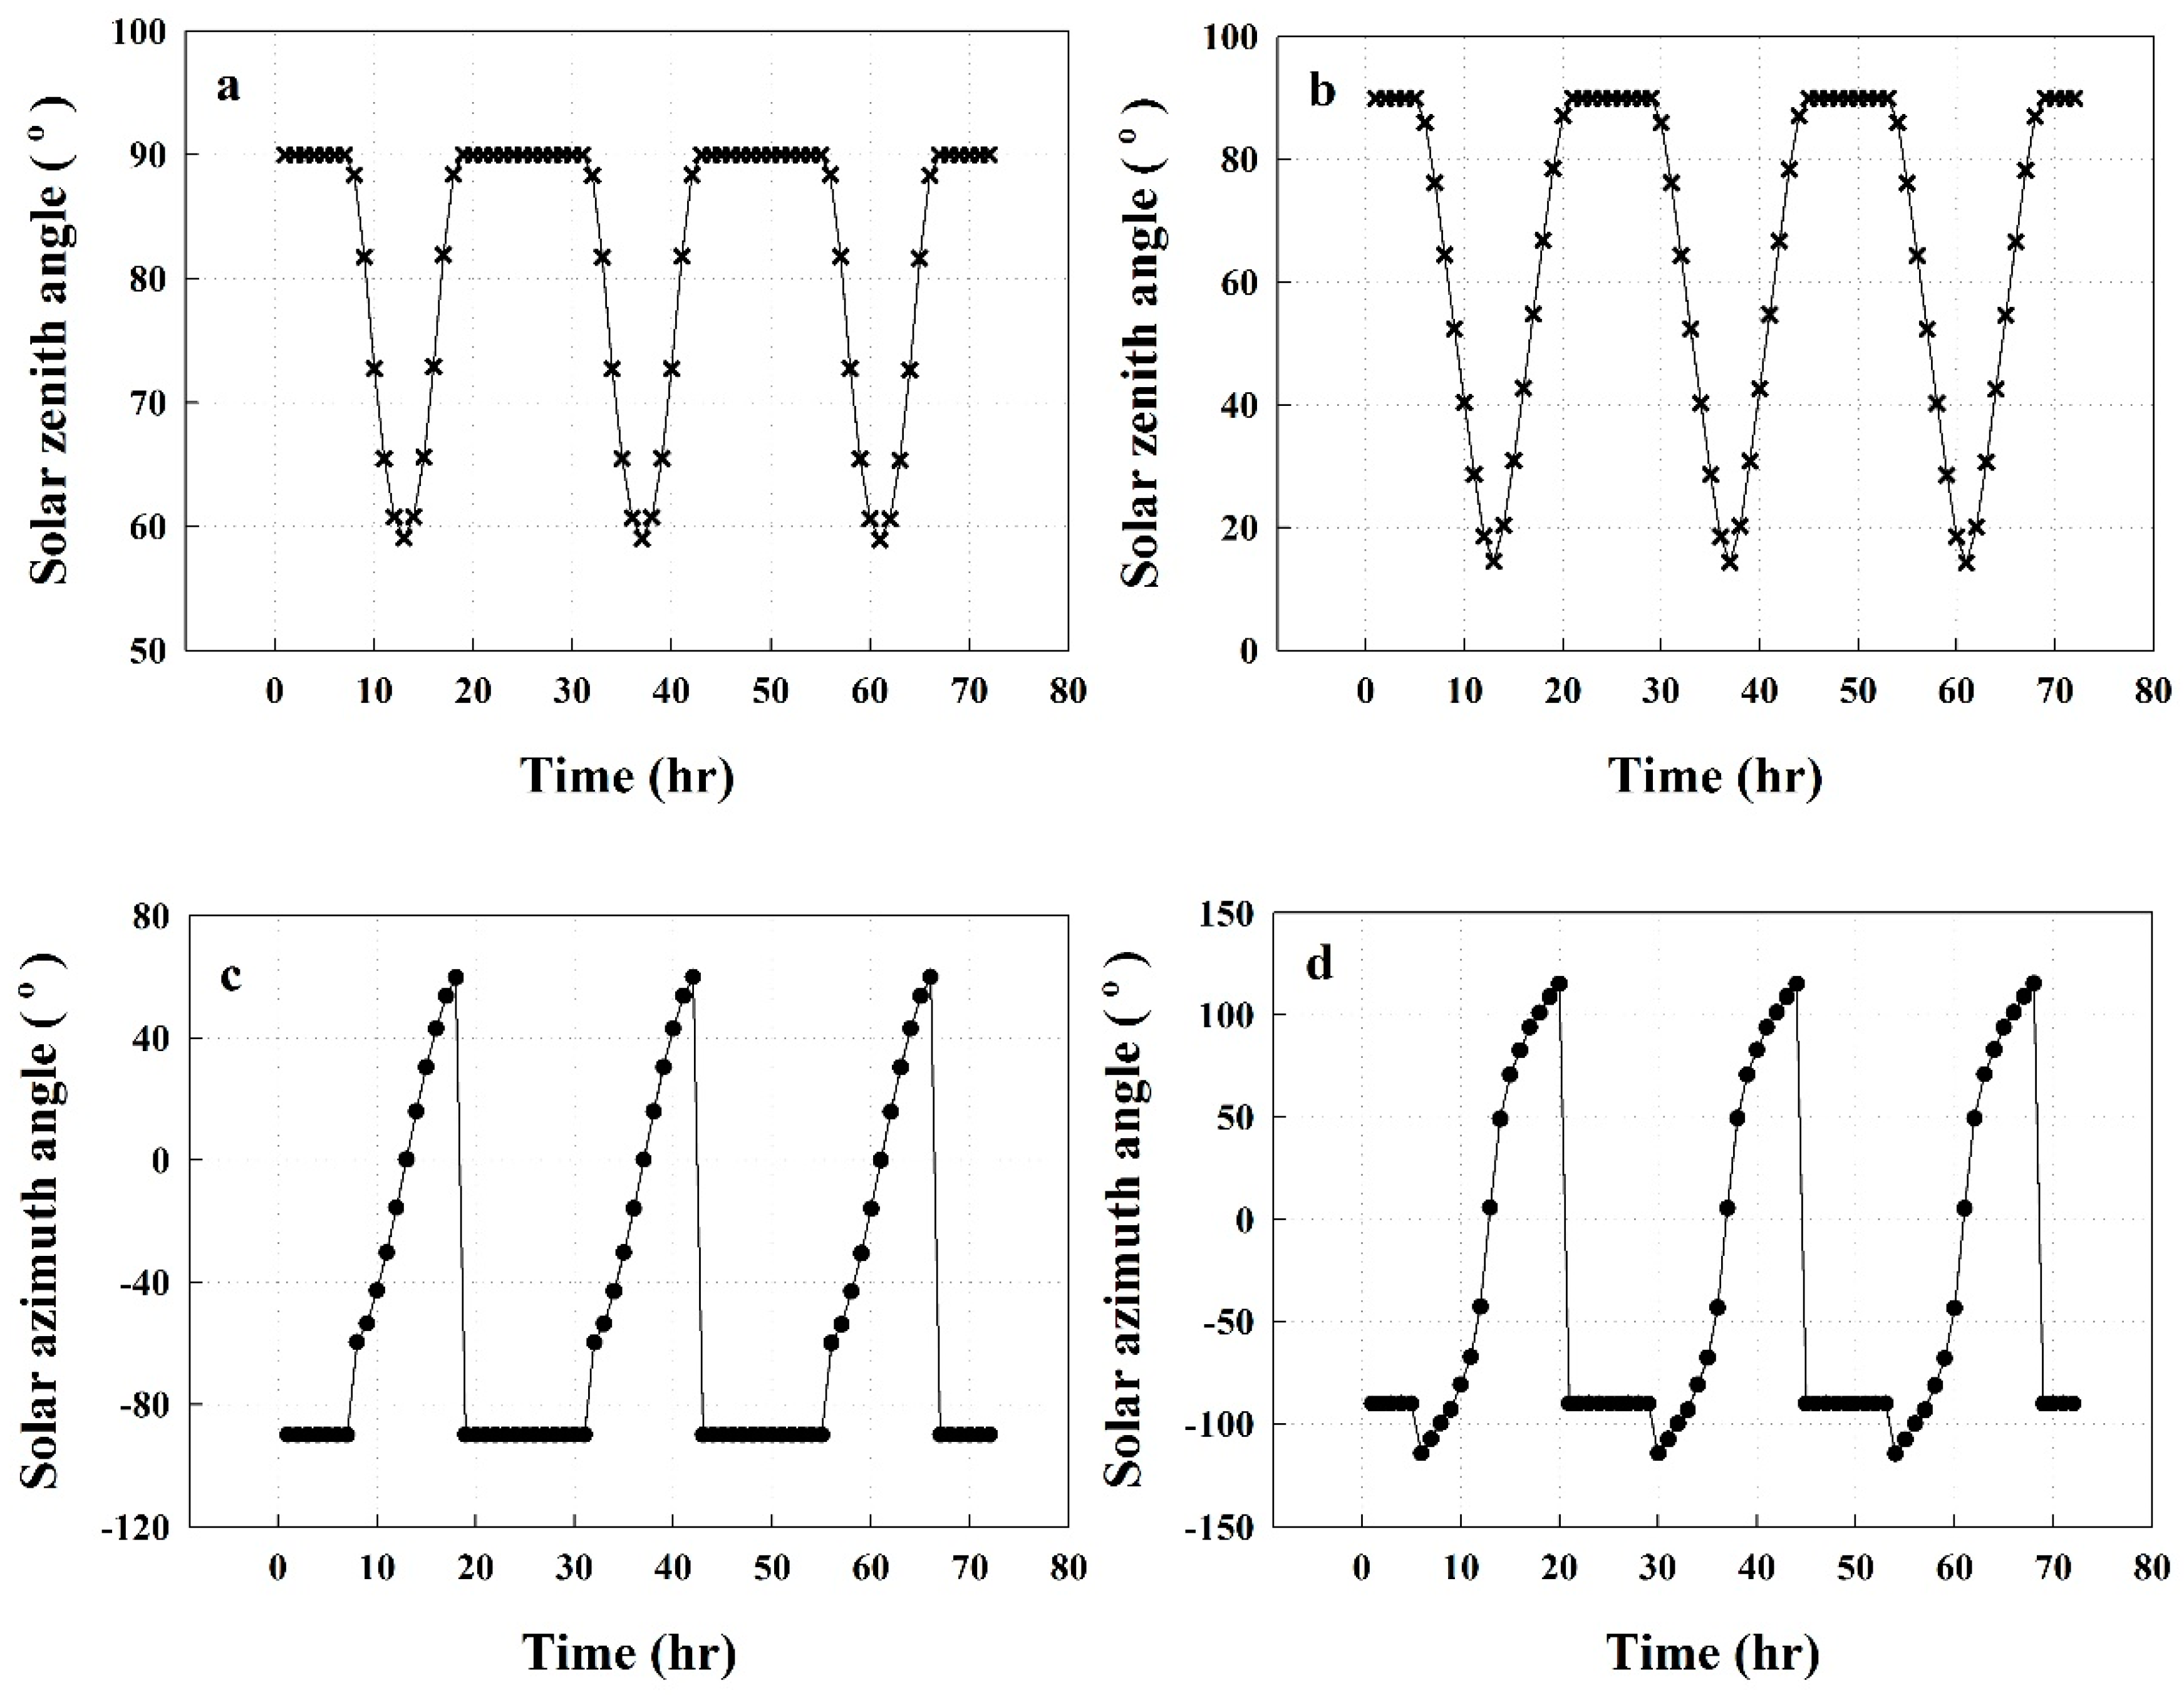
In the Equations (6) and (7) above, is the angle of incidence of beam radiation on the tilt surface, is the solar zenith angle, β is the slope of the surface, is the azimuth angle of the surface, and is the solar azimuth respectively. Figure 7 shows the hourly value of solar zenith and azimuth angles calculated using the solar radiation processor over different periods of time during the year.
The reflected radiation on the tilted surface is estimated by assuming that the ground acts as an isotropic reflector using Equation (8) [30]:
where is reflectance of the ground surface:
The radiation processor of TRNSYS 17 uses five different “tilted surface radiation” modes to estimate the diffuse solar radiation, based on the different relationships prescribed by different researchers. All these modes use the same techniques to estimate the beam and reflected radiations but differ regarding how diffuse radiation is estimated on an inclined surface. Mode 1 uses an isotropic sky model that assumes that the diffuse radiation is distributed uniformly across the sky and is given by Equation (9) [30,31]:
where IdT is the diffuse radiation on the tilted surface, and Id is diffuse radiation on a horizontal surface.
The Mode 2 model, developed by Hay and Davies [30,32], accounts for the anisotropy index by defining a portion of the diffused radiation as circumsolar, while another portion is considered to be isotropic. The empirical equation of the model is expressed in Equation (10):
where AI is the anisotropy index, and the third tilted surface mode is modelled based on Reindl model. In this model, a term for the horizon brightening factor is added to the Hay and Davies model equation, resulting in Equation (11) [30,33]:
where f is the modulating factor, that can be calculated using Equation (12):
where I is the total radiation on the horizontal surface.
The model used in Mode 4 was developed by Perez et al. [34]. This model accounts for circumsolar radiation, horizon brightening, and isotropic diffuse radiation by using an empirically calculated “reduced brightness coefficient” which is a function of sky clearness and sky brightness factors. This model can be defined as shown in Equation (13) [30]:
where F1 and F2 are the reduced brightness coefficients and θac is the angular location of circumsolar region.
The tilted surface radiation model used in Mode 5 was also developed by Perez et al. in 1988. This model is identical to the one used in Mode 4, except for reduced brightness coefficients.
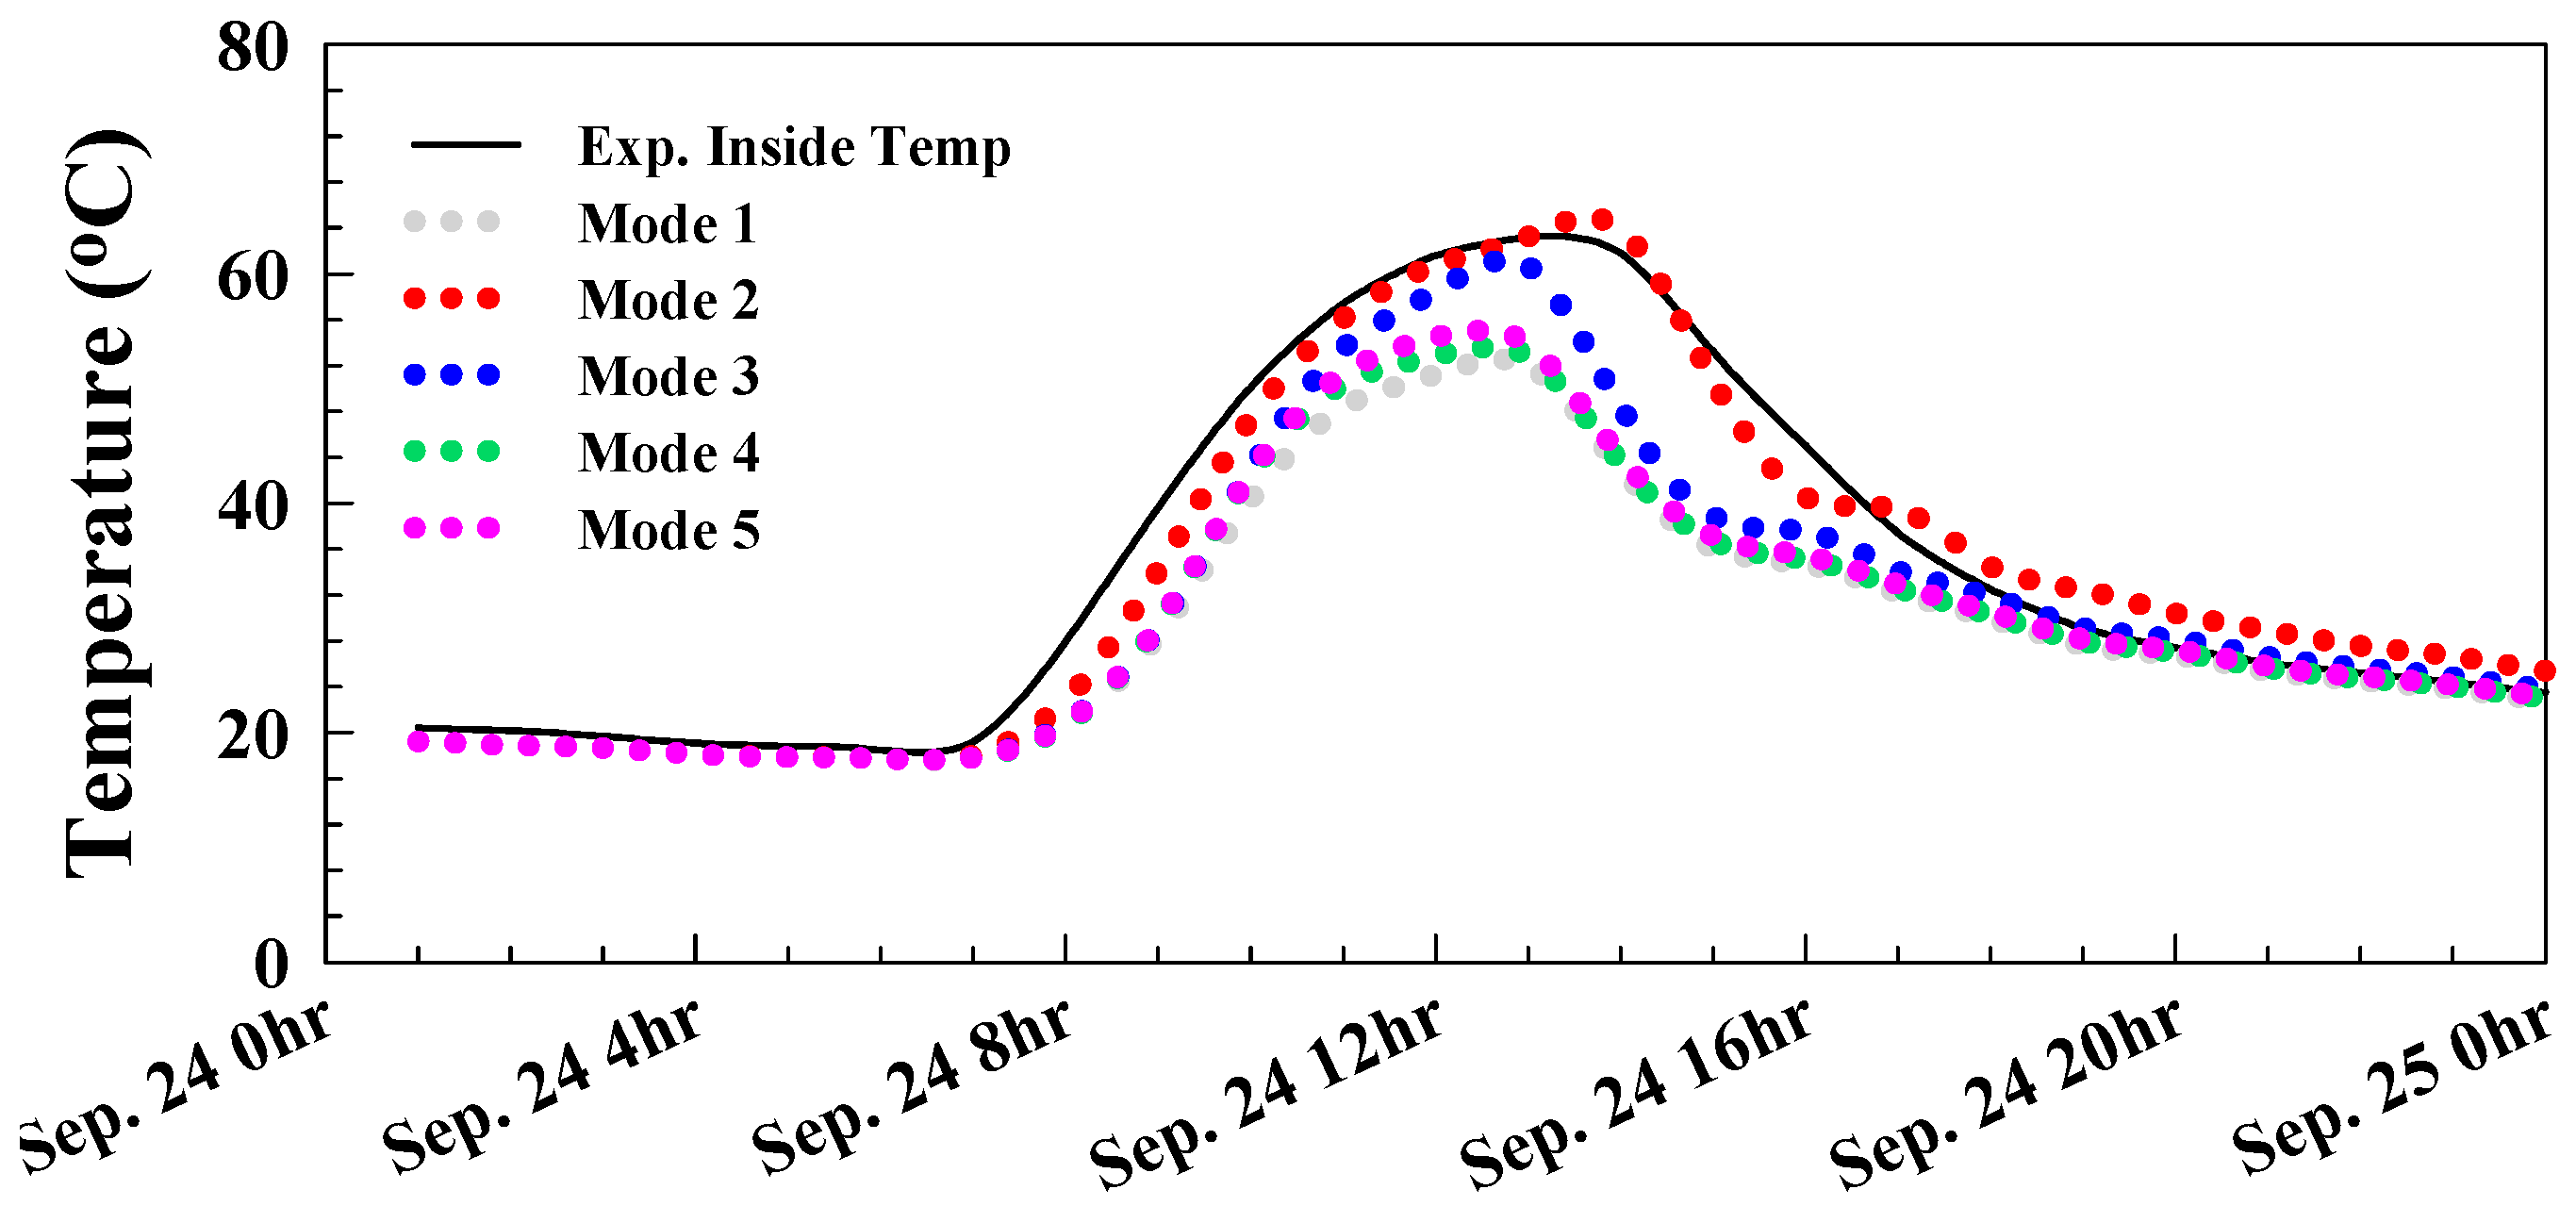
The variations in greenhouse temperatures resulting from the use of the different modes are presented in Figure 8. The NSE values for Mode 1, Mode 2, Mode 3, Mode 4, and Mode 5 are 0.761, 0.972, 0.878, 0.793, and 0.812, respectively. Mode 2, a model developed by Hay and Davies, was selected as the most appropriate after results of the simulation were compared with experimentally measured internal temperatures; an NSE value of 0.972 also demonstrated that it had greater predictive power than that of the other modes. A study suggested that the Hay and Davies model is straightforward and easy to use when only total horizontal radiations are available as an input [35]. However, this model is simpler to use than the other models, as it does not require any empirical coefficient. The two Perez models used reduced brightness location-dependent coefficients in addition to the Hay and Davies model, that significantly over-predict the total radiation. There are three factors that influence the results of the Reindl model: An increase in the sky diffuse radiation, the lack of incidence angle in the afternoon, and the modulating factor. Moreover, as our greenhouse location is south-facing, i.e., towards the sun in the northern hemisphere, another study [36] also suggested that the Hay and Davies model is best-suited for south facing locations.
2.2.4. Validation
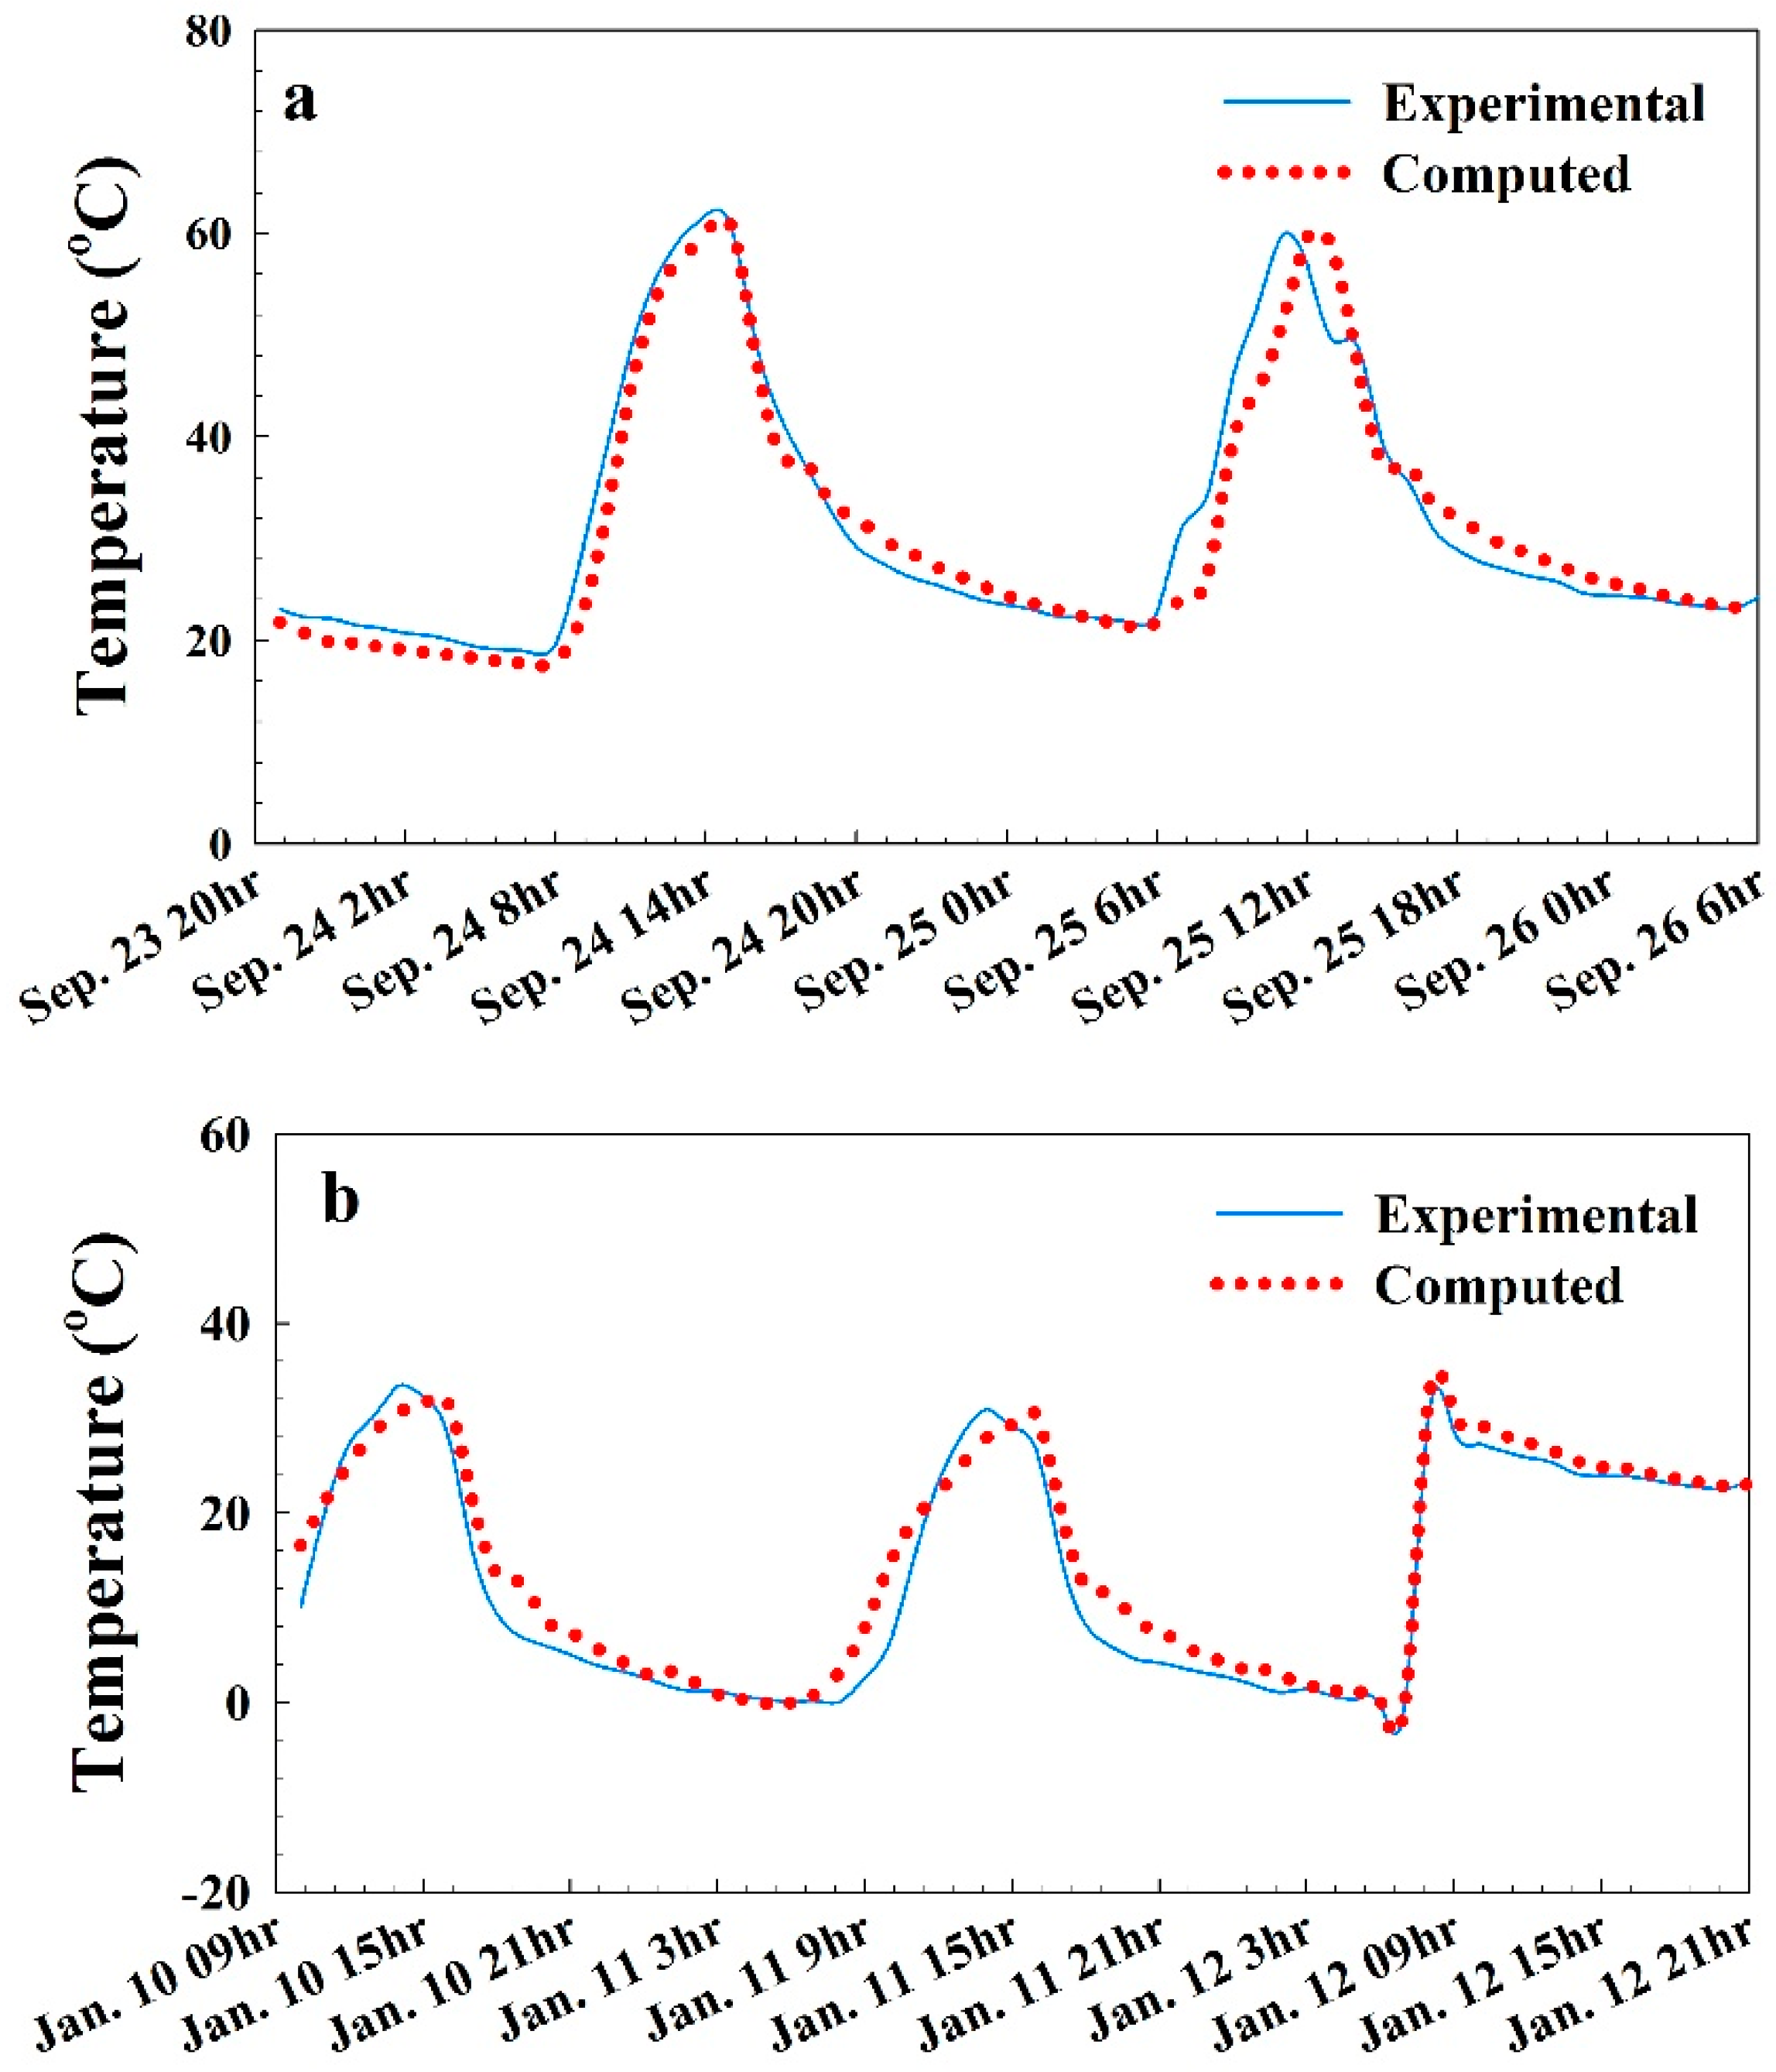
To validate our model, the computed results, obtained using the same conditions as those in the experimental greenhouse, were compared to the experimentally obtained results. Figure 9a,b present the computed and experimentally observed internal temperatures of the fully closed and naturally ventilated greenhouses, respectively. In both cases, the experiments were conducted in Daegu over two different periods in 2016, from 23 September to 26 September and from 10 January to 12 January, respectively. The NSE values for both validation results, 0.958 and 0.983, indicate the goodness-of-fit between experimental and simulation results. The agreement between these experimental and computed results under both conditions encourages adoption of the proposed BES model.
3. Results and Discussion
After the successful creation, calibration, and validation of the BES model, simulations were performed to obtain results for all the parameters presented in Table 2. The first analysis was conducted by running three separate simulations for the three different greenhouse roof shapes of the greenhouse, thereby calculating the annual energy demand required to maintain the desired temperature inside the greenhouse for each, as shown in the Figure 10. The results indicated that the annual energy demand of the gothic-shaped roof greenhouse was 2% and 8% lower than those of the even- and round-shaped roofs, respectively. These results were corroborated by a previous study [24], in which a mathematical model was developed to simulate thermal environment inside the greenhouse; this study compared the internal temperature of the typically used round-, even-, and gothic-shaped greenhouse roofs for 24 h. The greenhouse with the gothic shaped roof had a higher temperature then others under all ambient conditions, which means it required less energy than the others. The reduction in annual energy demand occurs owing to the fact that this greenhouse received more solar radiation during the winter, while receiving less during the summer, compared to the model greenhouses with different shaped roofs.
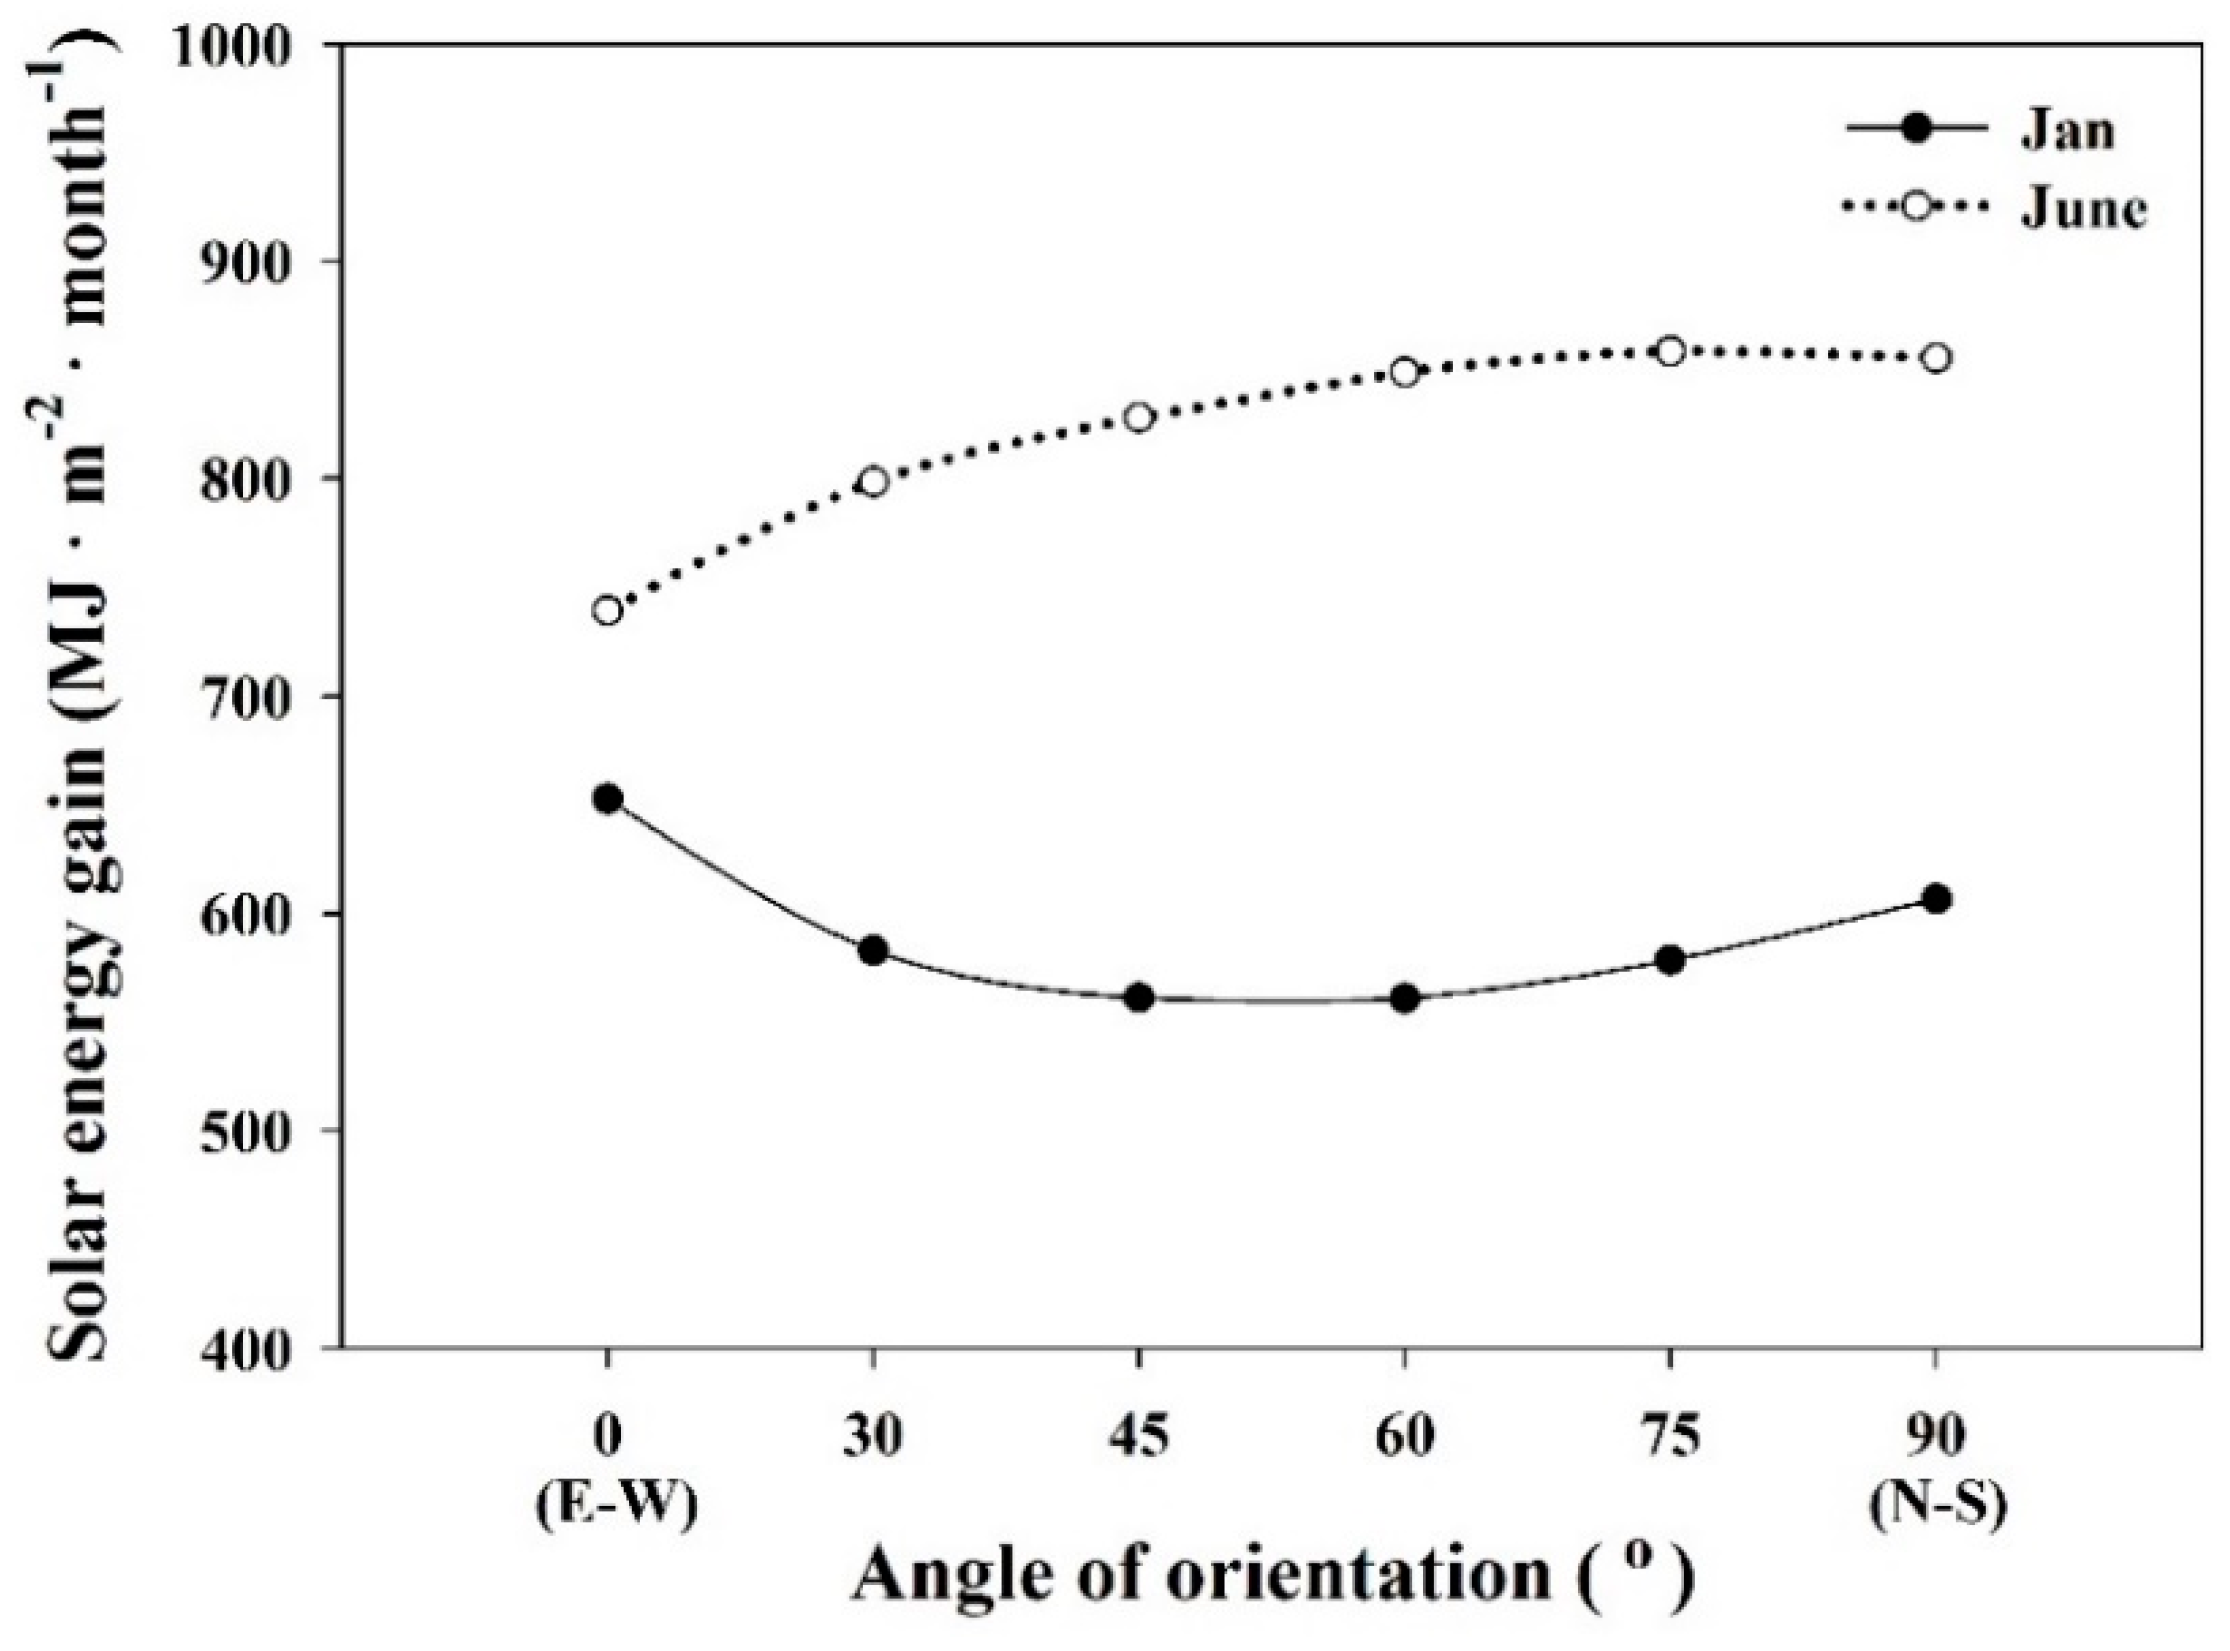
The effect of greenhouse orientation was studied on otherwise identical gothic-roofed greenhouses. The total solar gain captured at different angles of orientation (described in Table 2) for two typical winter and summer days was modeled to find the best orientation, i.e., the one that received the highest solar radiation in winter and lowest in summer. This difference occurs because the beam and diffuse solar radiation on inclined surfaces depend on the position of the sun and inclined surfaces that face the sun called the geometric factor. This geometric factor takes into account the surface slope, surface azimuth angle, solar zenith angle, and solar azimuth angle, the results of these results are presented in Figure 11. They show that in the northern hemisphere, a greenhouse orientated at 0° (E-W) receives more solar radiation in January and less in June than one orientated at 90° (N-S), which shows the opposite results. Moreover, for all the orientations, the solar energy gain is higher in the summer months than in the winter months because summer has a greater number of daylight hours than winter.
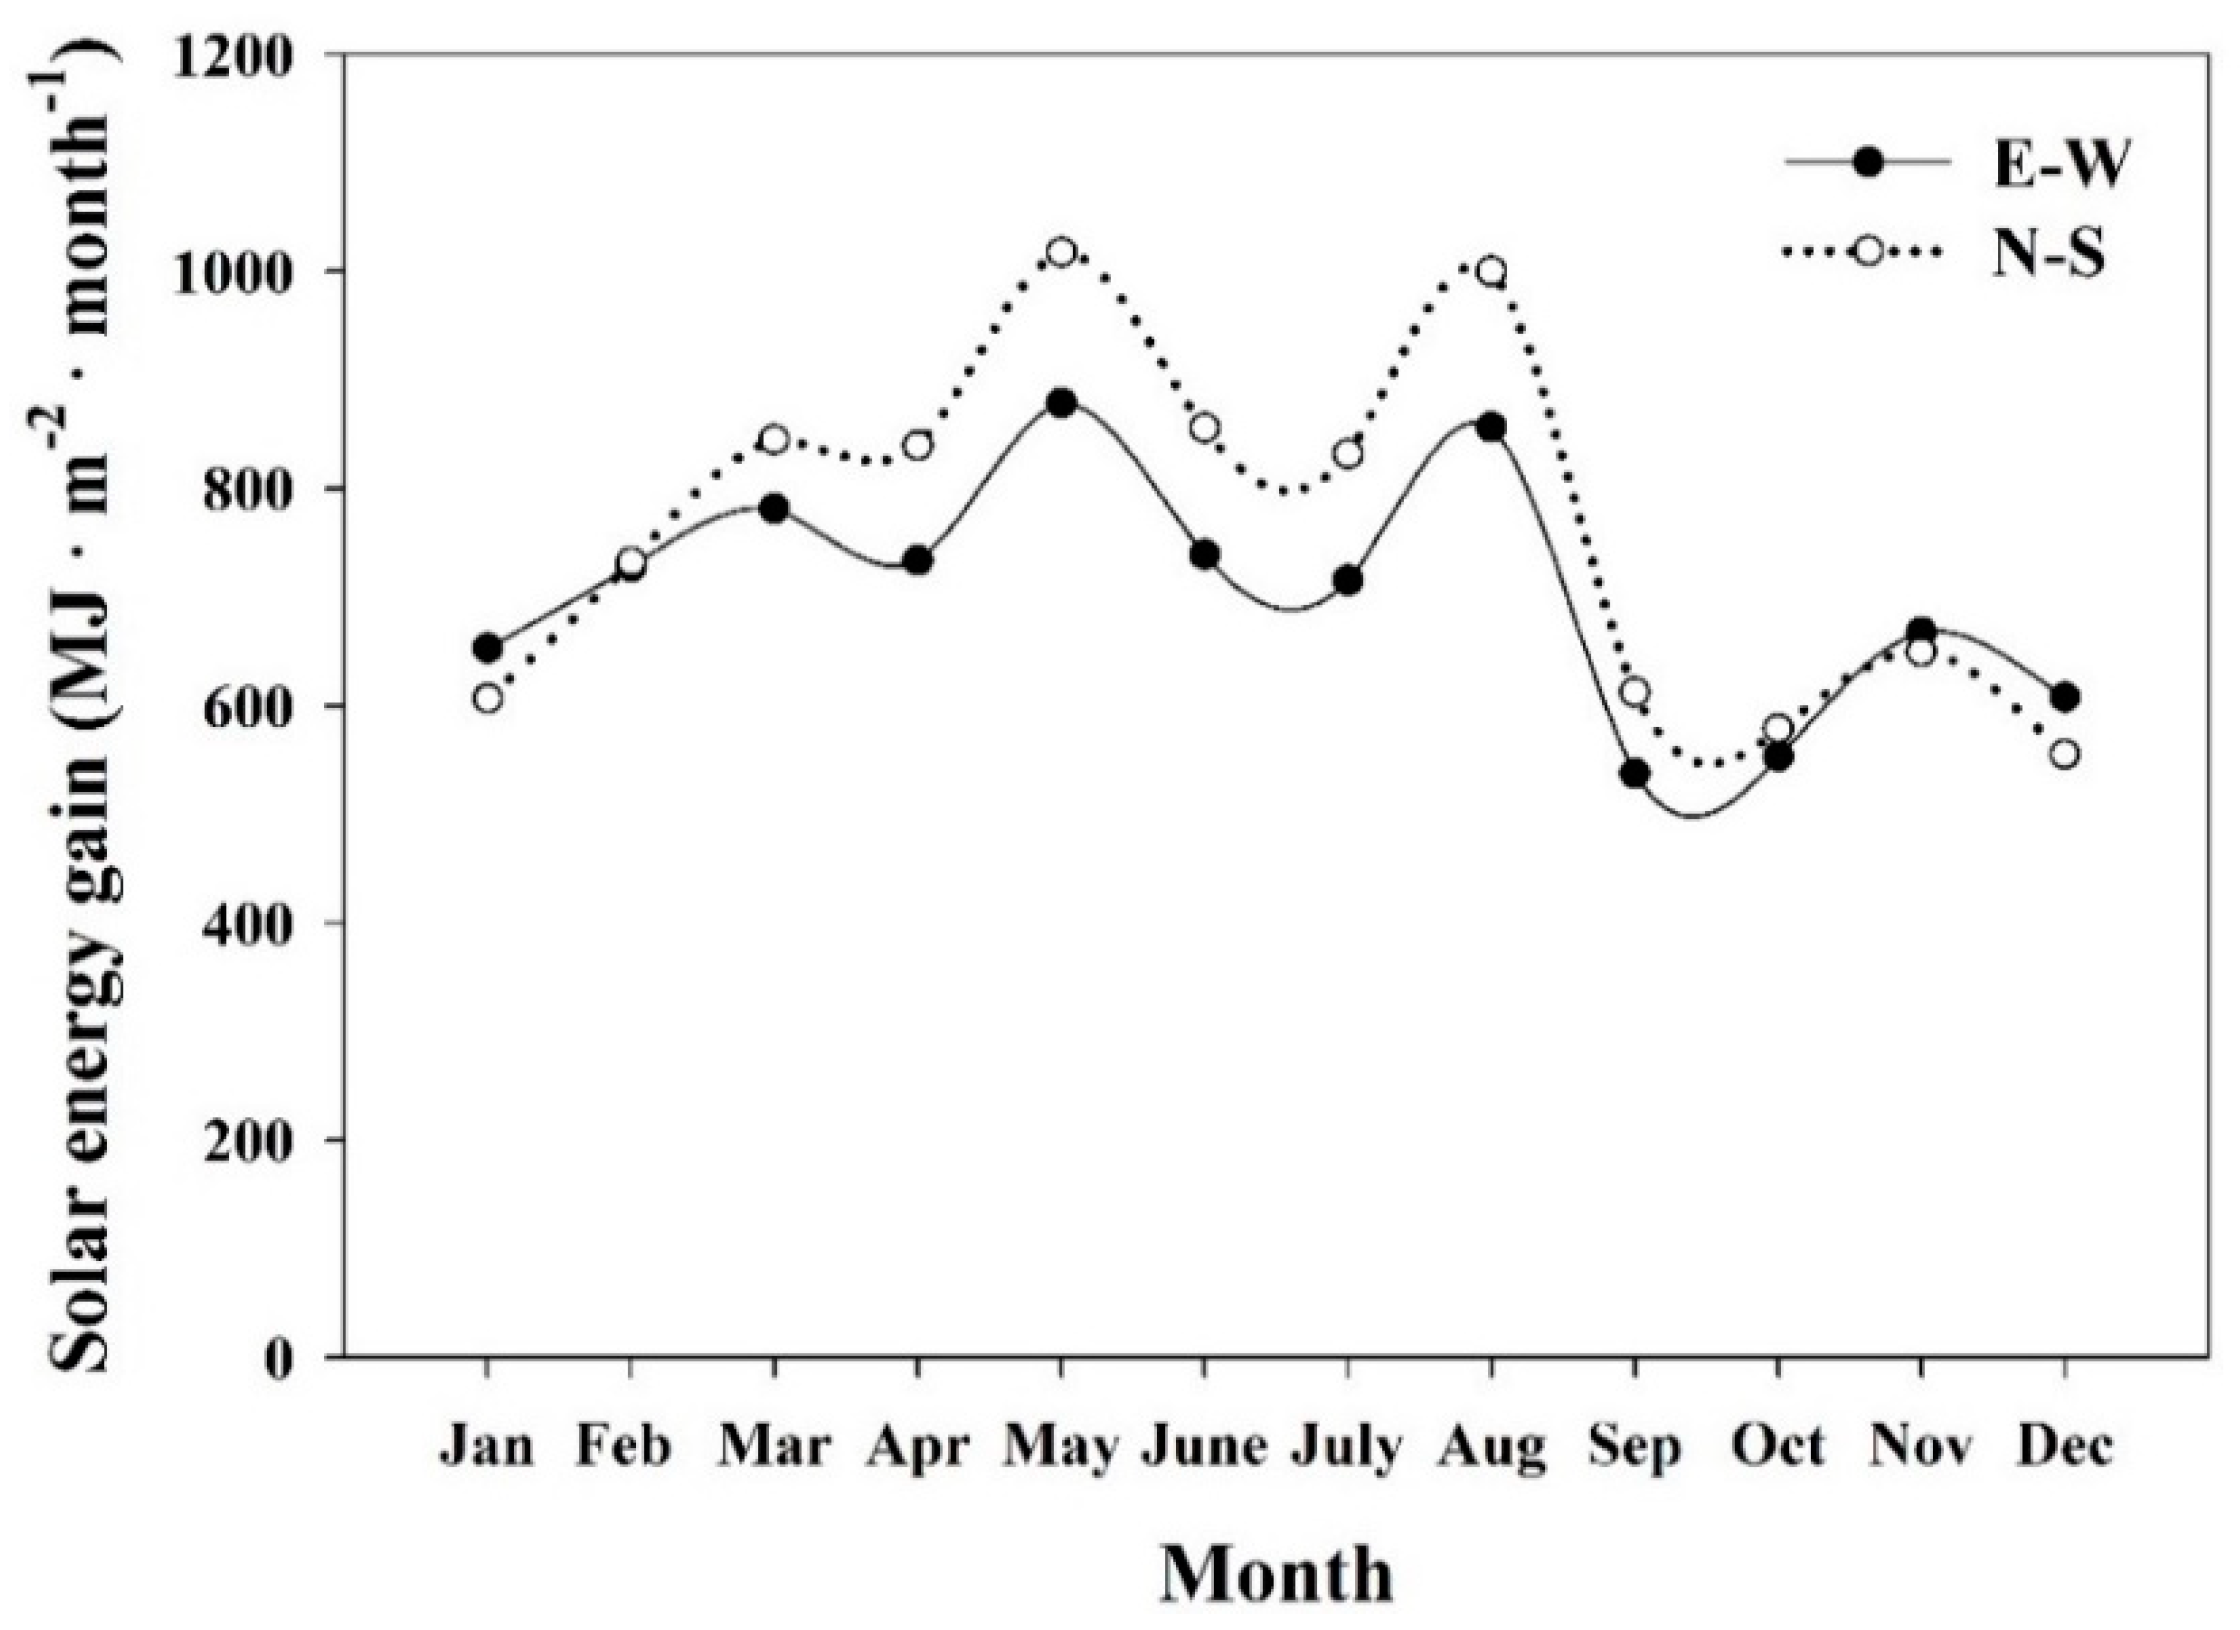
Figure 12 shows the monthly total solar energy gain inside the greenhouse for the both orientations. In addition, the solar gain during the winter months is higher for the E-W oriented greenhouse than for the N-S oriented greenhouse; the opposite trend can be seen during the summer months. To save heat energy in winter, more solar radiation is needed to achieve high internal greenhouse temperatures; it is vice versa in summer. Therefore, an E-W oriented greenhouse is preferred as it receives more solar radiation inside during winter months and less in summer months. In a previous study, Auto-Cad tool was used to analyze the total solar fraction inside the greenhouse for selected summer and winter days for greenhouses at different orientations. Our results agree with the trend of solar energy gain for different orientations that was reported by Gupta et al. [25].
Figure 13 shows the effect of double-glazing on internal greenhouse temperatures during heating season (1–5 January 2016). To observe the effect of double-glazing on the internal greenhouse temperature, the single-layered PE material was replaced with a double-layered PE material, for fully closed greenhouse, in the window type manager of TRNBuild. Only the PE material was selected for the assessment, as it is the most commonly used greenhouse-covering material worldwide because of its affordability relative to glass, polycarbonate, polyvinylchloride, and others materials. Double-layered PE materials are used to trap heat inside the greenhouse to reduce heat loss through the coverings. The results show that the internal temperature of the double-layered greenhouse was 2–5 °C higher than that of the single-layered greenhouse.
Natural ventilation is widely used to decrease the internal temperature of greenhouses to save cooling energy, especially in the summer. Instead of discussing the natural ventilation rate as a result of different windows being open, herein, we discuss the effect of natural ventilation on the internal temperature of the greenhouse as the focus area of this study is the thermal environment of greenhouses. Analyses were carried out to observe the effect of different side and roof vent openings on the internal temperature of the greenhouse. To observe the effect of natural ventilation on the cooling energy demand in the summer, both side and roof vents of differing opening widths were evaluated. The roof window openings were located in the middle of the greenhouse and the side windows were 50 cm above the ground. Simulations were carried out separately for all cases of side and with roof ventilation described in Table 2, and the results of the effects on the internal temperature of the greenhouse are shown in Figure 14. The outcomes show that there is a slight decrease in greenhouse internal temperature for the different widths in the roof vents; however, when even a small side vent is open, there is a marked drop in the internal temperature of the greenhouse. Furthermore, we can see from the results that the internal temperature dropped significantly with a slight increase in the side openings of the greenhouse, but that the rate of decrease levelled off rapidly. After the opening-length reached 1 m, no significant decrease in temperature was found. The overall result shows that the roof vents are more effective when used in conjunction with side vents than when used alone.
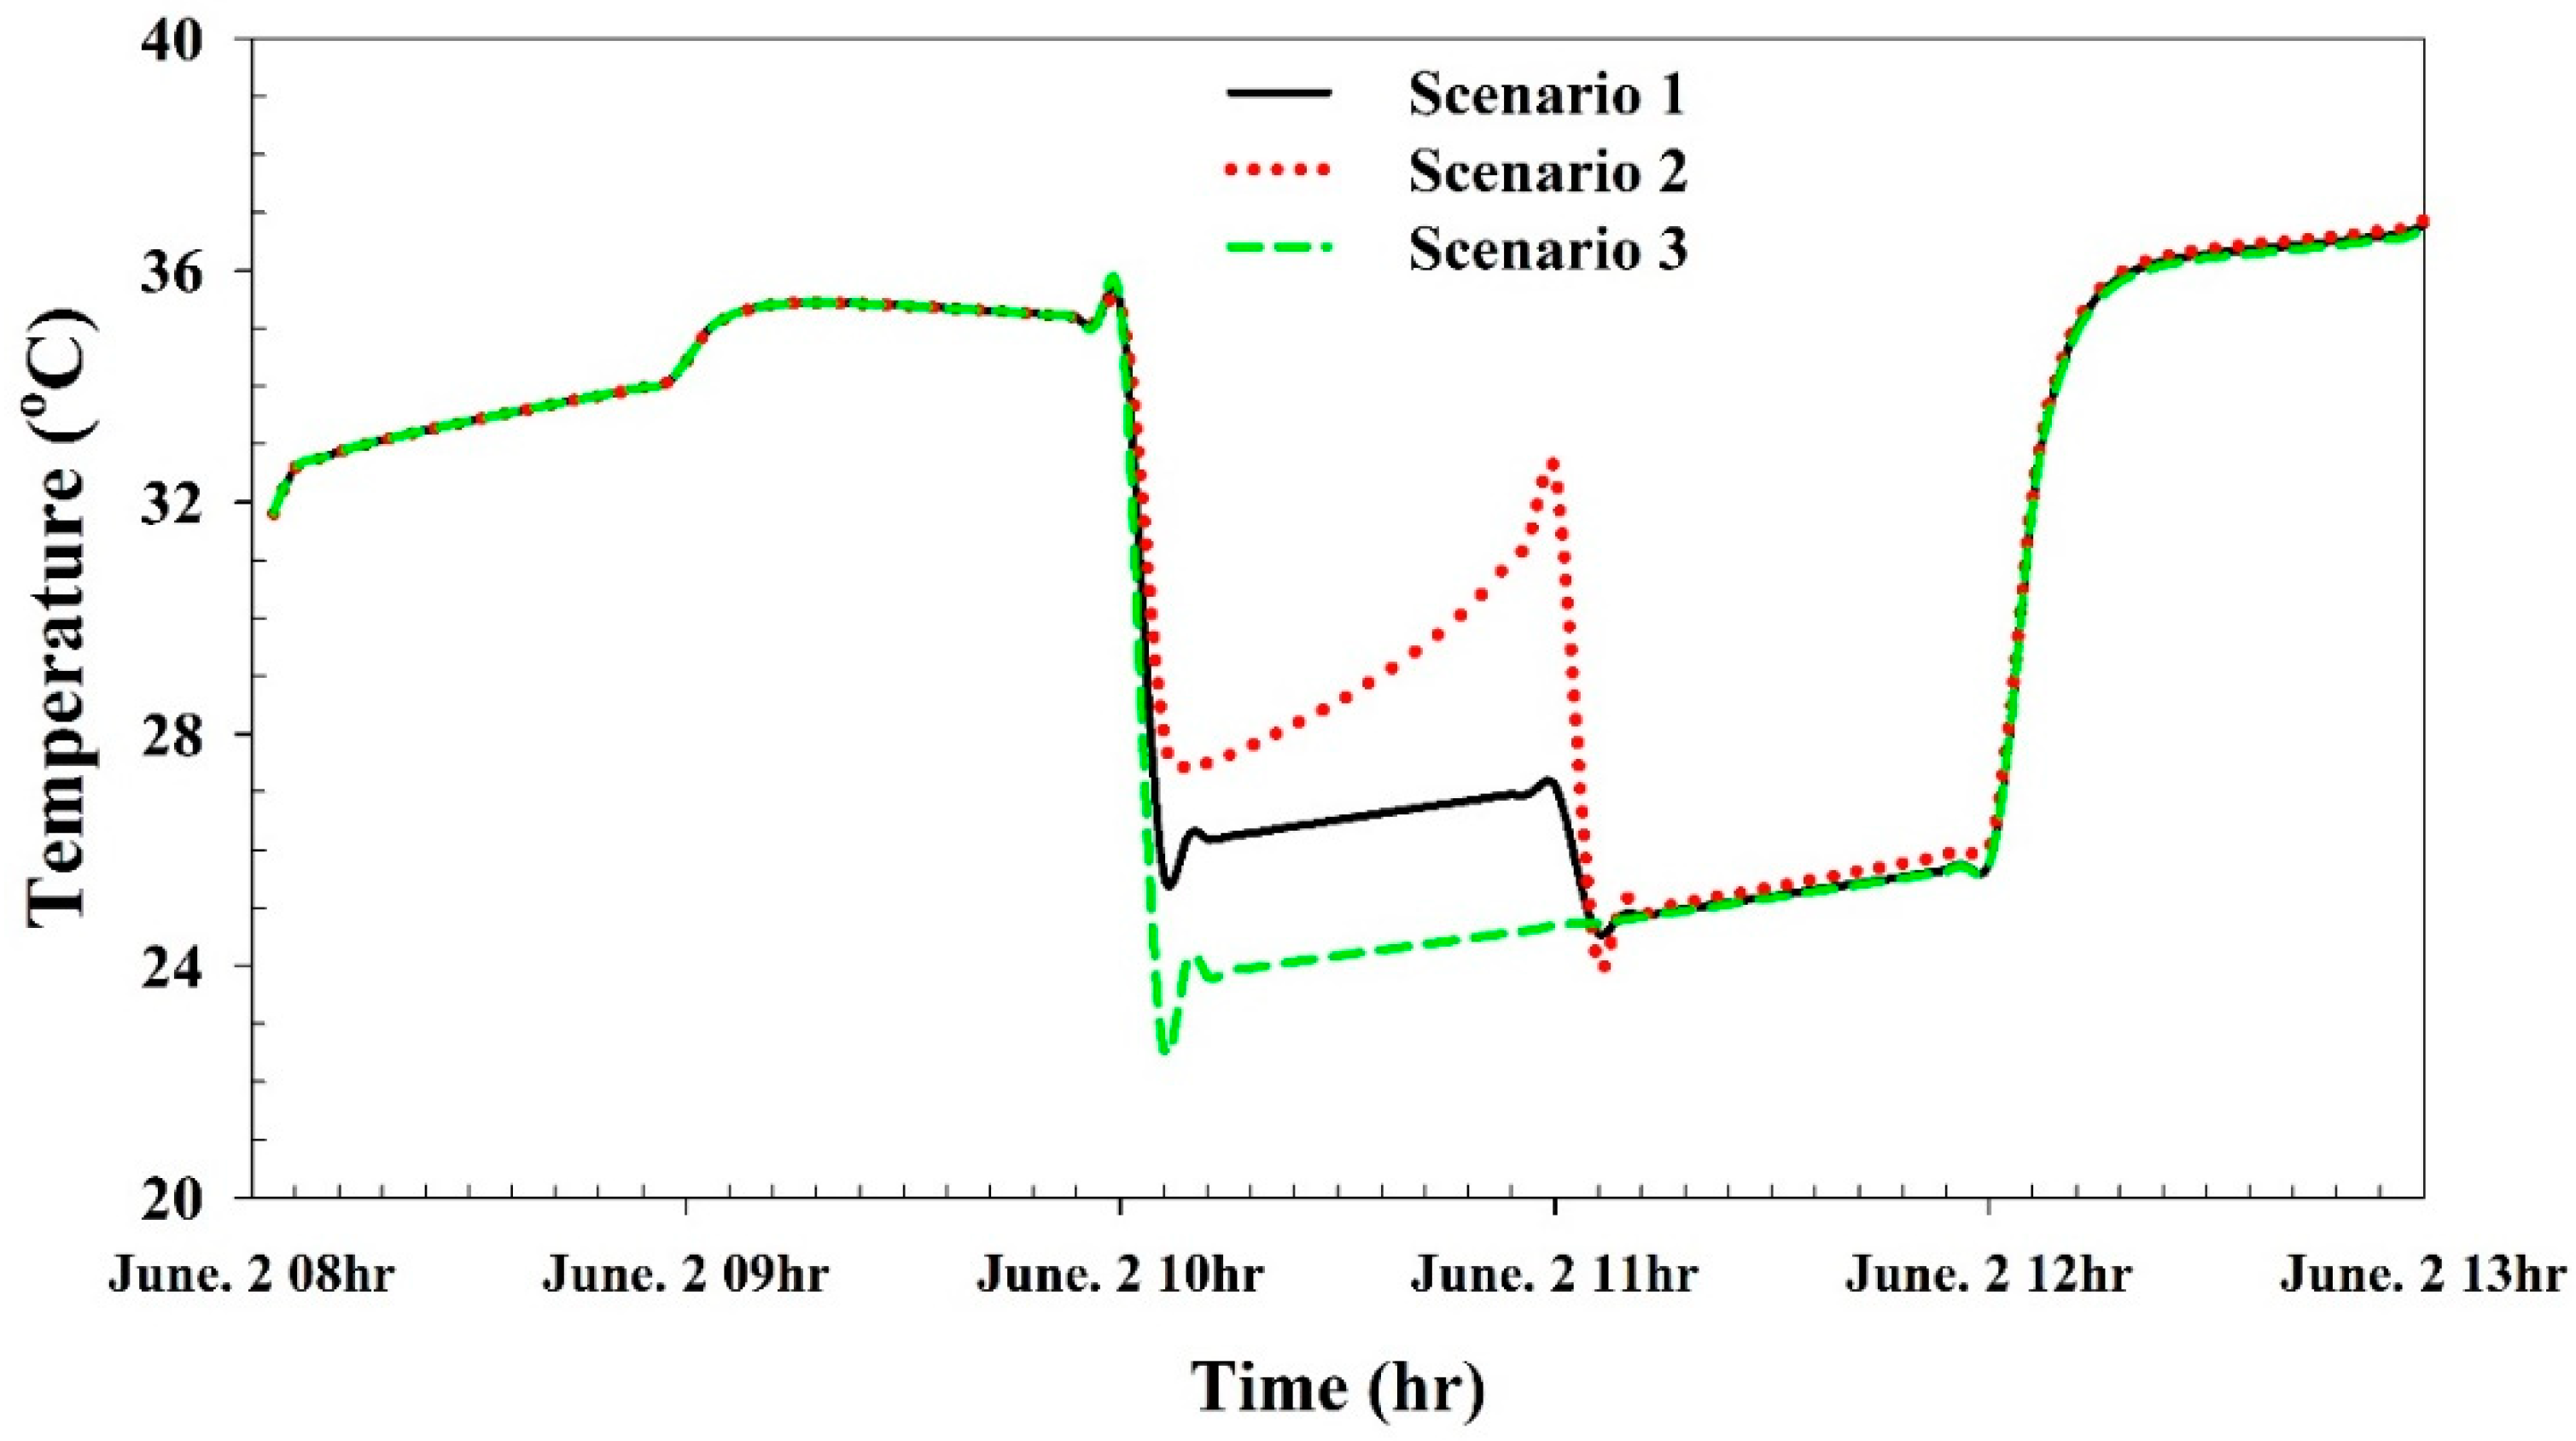
Figure 15 shows the different scenarios (scenario 1: side vents 1 m, scenario 2: roof vents 0.8 m, scenario 3: combined side and roof vents) of side and roof vents openings from 10 to 11 am, used to investigate their effect on the internal temperature of the greenhouse. Scenario 1 shows a reduction of 11 °C in the internal temperature during daylight hours and as time passed, the temperature remained effectively constant even though solar radiation increased. Scenario 2 shows that the temperature decreased rapidly when the roof window was opened, but it started to increase after some time, showing only a 4 °C reduction in internal temperature. These results show that when only roof vents are used, ventilation has less of an effect than solar radiation, so an increase in greenhouse internal temperature occurs. Scenario 3 shows a significant reduction in the temperature when both side and roof windows are open. Furthermore, the temperature dropped rapidly within five minutes in all the scenarios because the single span greenhouse was not very wide, and opening vents along the length of the greenhouse allowed a rapid change in the internal temperature. The Nam [37] evaluated the effect of roof and side vents opening on the internal temperature of a single span greenhouse; the results of these field experiments also confirmed the rapid decrease in the internal temperature of the greenhouse immediately after the vents were opened. Moreover, the results imply that the effect of solar radiation is not significant in the case of side vents.
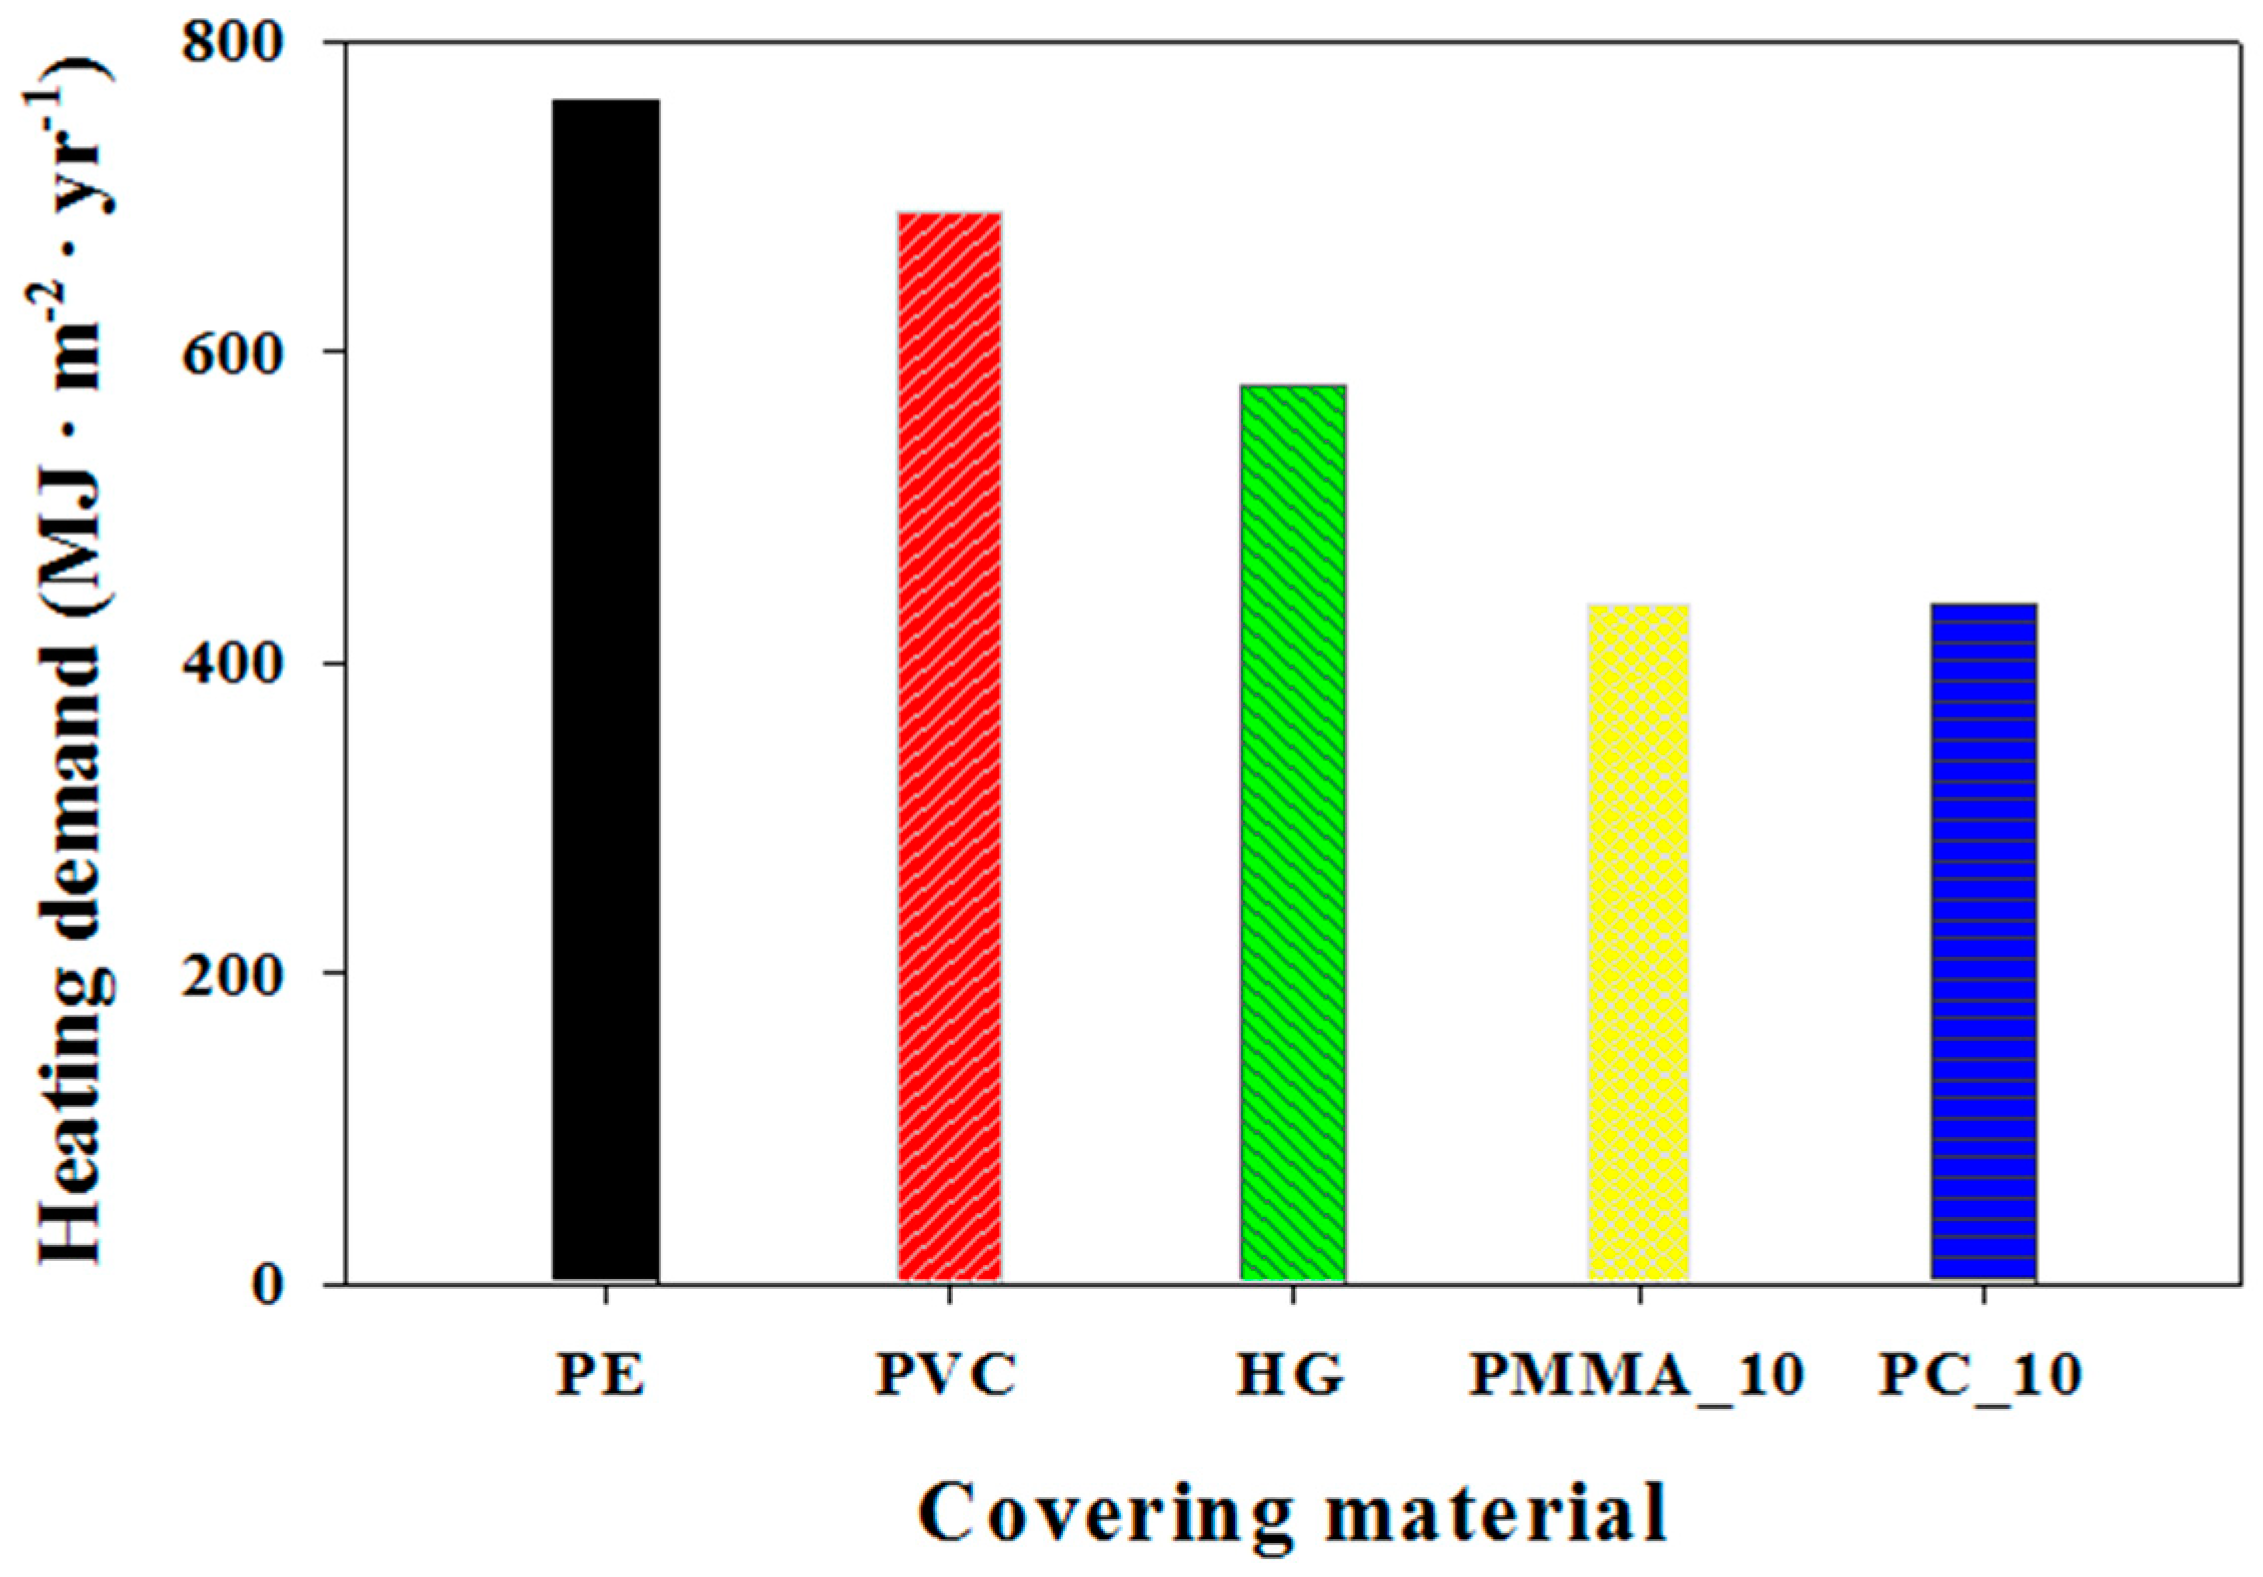
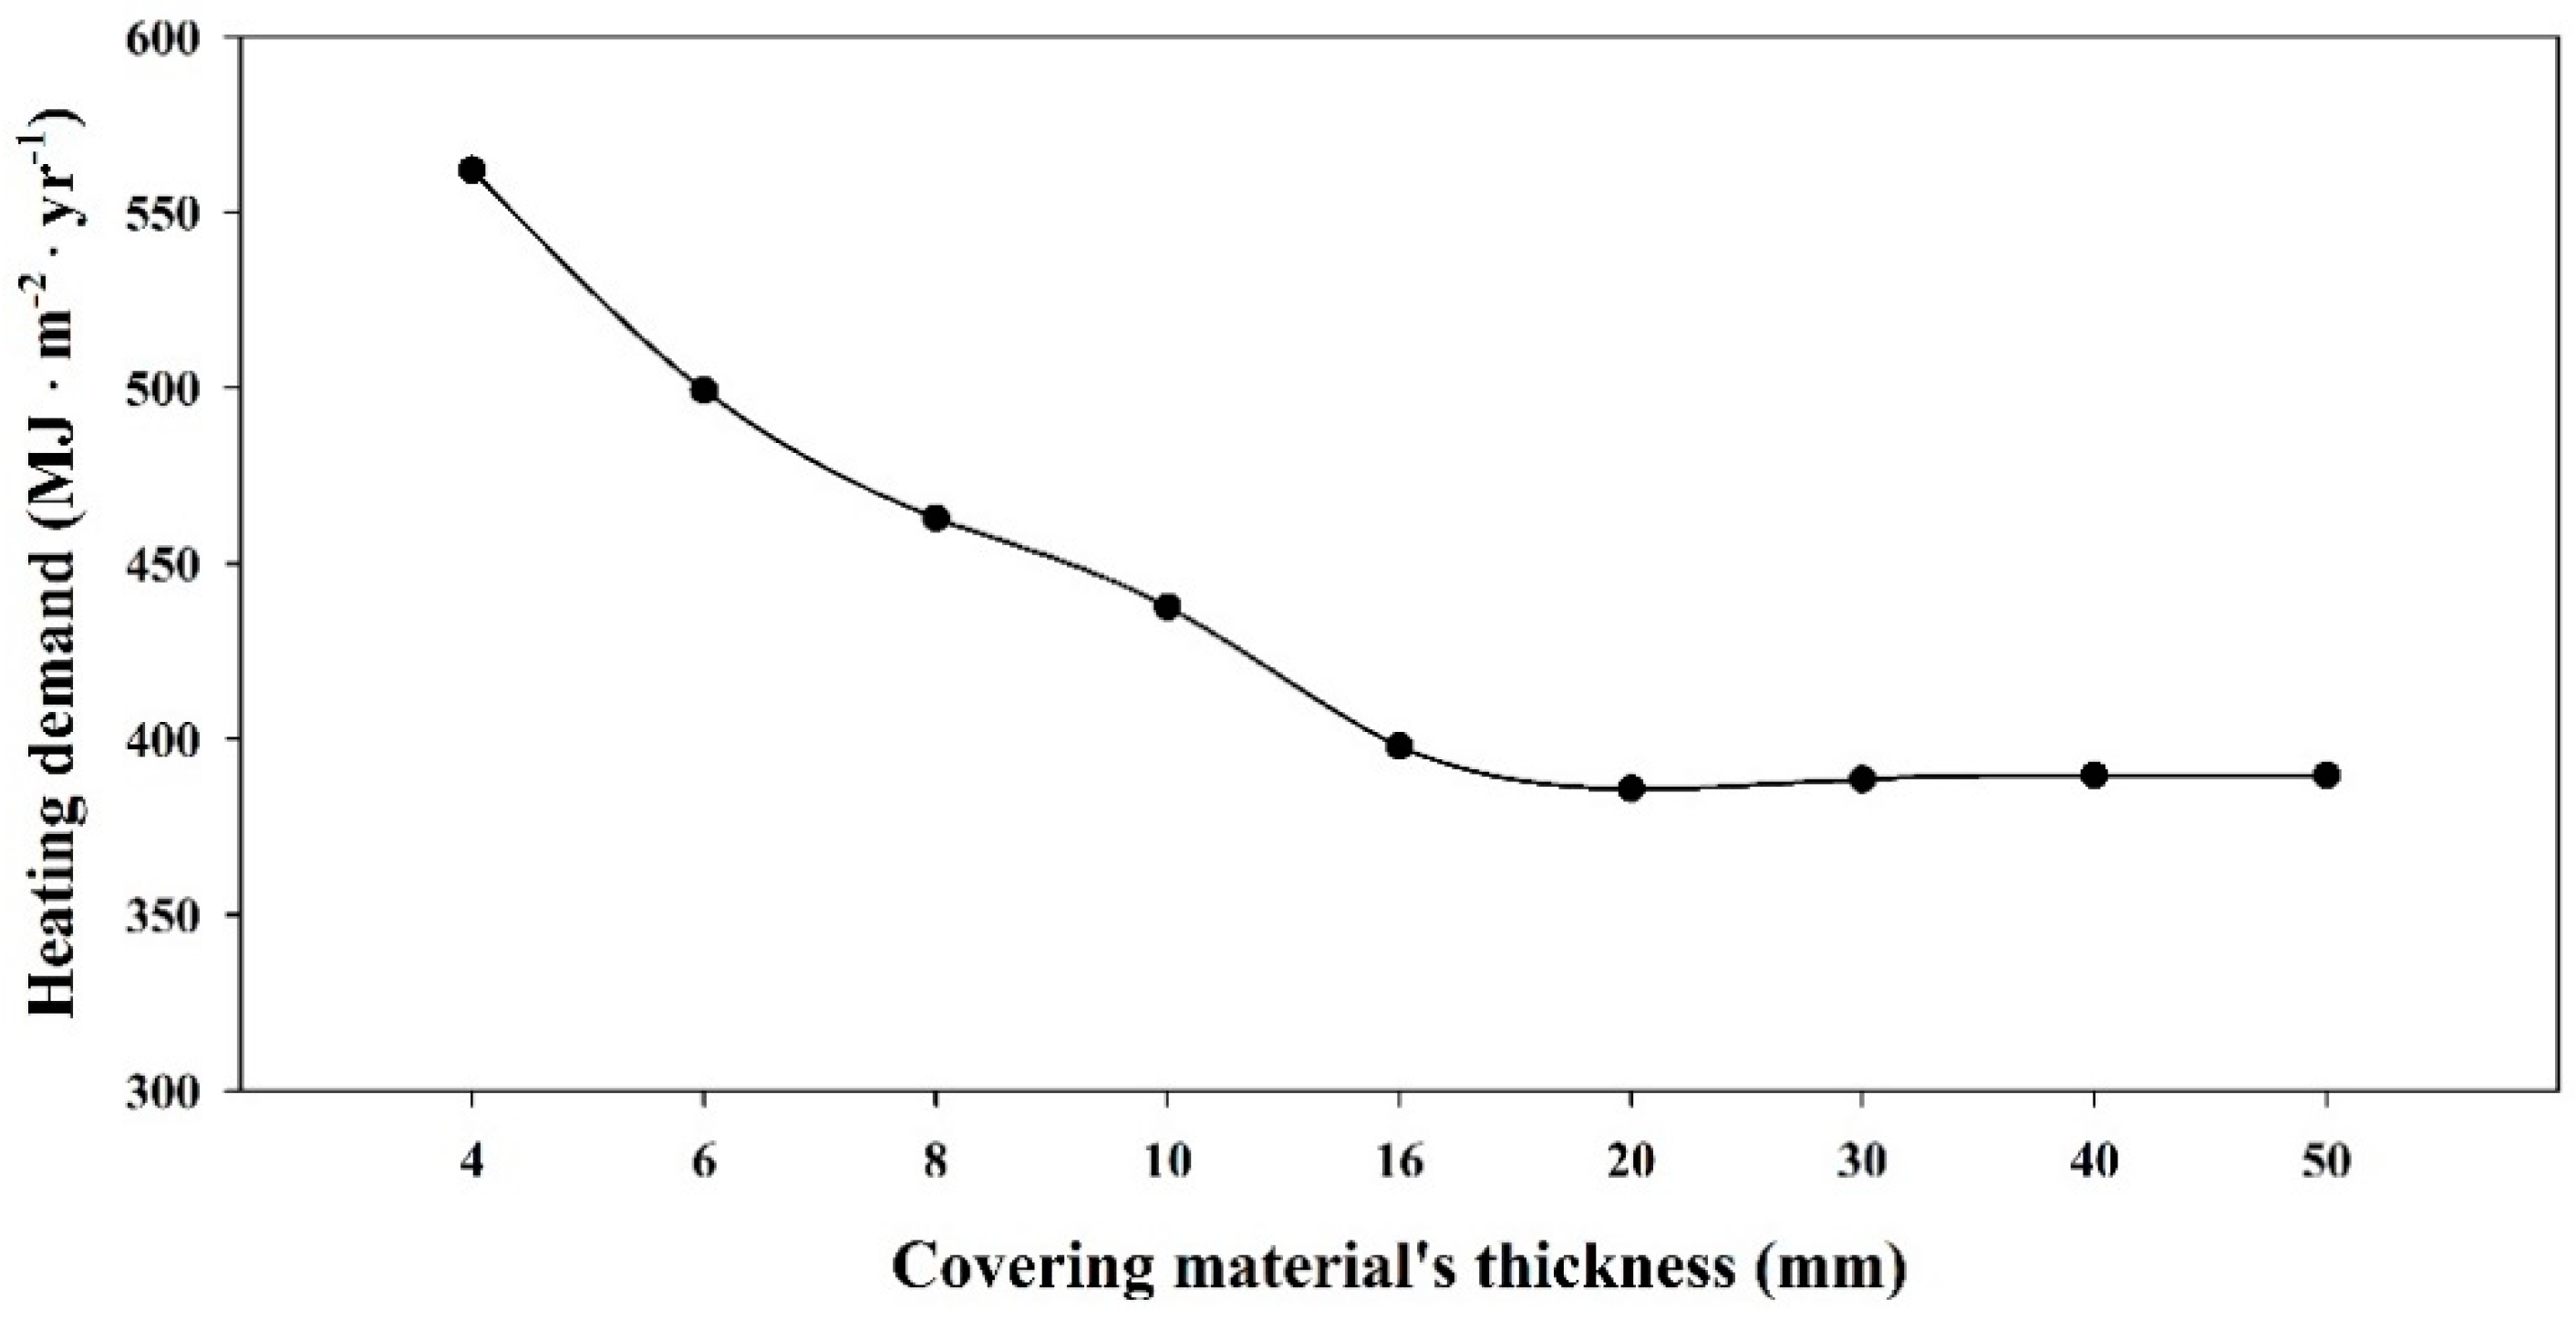
Greenhouse covering material is another important factor to be considered while conducting thermal analyses of a greenhouse. Many covering materials are commercially available in the market and the choosing of the most appropriate one to meet local requirements can help to minimize operating costs of the greenhouse. In Figure 16, we present the heat energy demand of some of the covering materials used as greenhouse covers. PMMA shows the least demand for heat compared to others including PE, PVC, HG, and PC. We also investigated the effect of different thicknesses, including 4, 6, 8, 10, 16, 20, 30, 40, and 50 mm of double layered PMMA. Each sheet of the material was 0.15 mm thick; hence, the total covering thickness depends on the air-gap between them. The results presented in Figure 17 show the heating demand of the greenhouse after PMMA coverings of different thicknesses were applied. The outcomes of this analysis show that the heating demand decreased significantly when the cover thickness was increased from 4 mm but also that there was no significant decrease in the heating demand after the thickness reached 16 mm. Guohui [38] used Computational fluid dynamics (CFD) to predict the thermal convective heat transfer coefficient, thermal resistance, and thermal transmittance of the double-glazing of greenhouse covering material. One of result from this study regarding overall heat transfer coefficient (U-value) with different air spaces between double-glazing, also confirmed our outcome.
TRNSYS is a BES software that is not for the greenhouse modeling; in Section 2.2.3, gives the recommended necessary inputs needed to use this software for greenhouse modeling. This study also ignores the crop inside the greenhouse, which is also an important parameter and has influence on the environment inside the greenhouse. Therefore, we plan to include crop modeling and greenhouse vents automatically controlled by the internal environment in future studies.
4. Conclusions
This paper detailed the development, calibration, and validation of a BES model to simulate the thermal environment of a series of greenhouse designs using TRNSYS 17. In the Section 2.2.3 on calibration, we specified the input parameters required to model the thermal environment of greenhouse using BES. The parameters include the internal and external convective heat transfer coefficients, the DOE-2 file, to introduce materials into the TRNSYS using their thermal and optical properties; the properties of the most common greenhouse coverings; and evaluation results for five different calculations of solar radiation on a tilted (roof) surface model. The statistical analyses (NSE values) for these models, known as Mode 1, Mode 2, Mode 3, Mode 4, and Mode 5 are 0.761, 0.972, 0.878, 0.793, and 0.812, respectively. Mode 2, a model developed by Hay and Davies, was found to be most appropriate. It demonstrated a good correlation between measured and simulated results. The NSE values of 0.958 and 0.983 for validation of both type of results indicated that the model can be a useful tool with which to study the effects of greenhouse design parameters on the total annual heating and cooling load of a greenhouse.
The second part of this paper described the effect of greenhouse design parameters including shape of the roof, orientation, glazing, natural ventilation, covering material, and thickness of the covering material on the energy consumption of a greenhouse. It was discovered that the greenhouses with gothic-shaped roofs required 2% and 8% less energy than those with round- and even-shaped roofs, respectively. In addition, for a greenhouse located in Daegu (latitude 35.53° N, longitude 128.36° E) South Korea, the most suitable orientation is E-W. Furthermore, a 40% reduction in the heat energy requirement was observed when the single-glazed PE covering by replacing with a double-glazed covering. During the summer months, natural ventilation had the potential to decrease the internal greenhouse temperature by approximately 2–11 °C relative to a non-ventilated greenhouse with the same design parameters.
TRNSYS 17 showed a high flexibility in carrying out analyses under local weather conditions by considering all the possible factors that could be modeled to improve the thermal efficiency of a greenhouse. The high correlation between the computational analysis and measured data, as demonstrated by the NSE values, encourages the adoption of the model when investigating energy supplies with an underlying aim to reduce the energy costs of greenhouse agriculture, taking their local environment and specific needs into consideration.
Supplementary Materials
Supplementary File 1Author Contributions
Authors contributed equally to this manuscript. All authors proofread and approved the final manuscript.
Funding
This work was supported by Korea Institute of Planning and Evaluation for Technology in Food, Agriculture, Forestry and Fisheries (IPET) through the Agriculture, Food and Rural Affairs Research Center Support Program, funded by the Ministry of Agriculture, Food and Rural Affairs (MAFRA) (717001-7).
Conflicts of Interest
The authors declare no conflict of interest.
Nomenclature
| Subscripts | |
| ai | Internal air |
| si | Internal surface |
| Abbreviations | |
| TRNSYS | Transient Systems Simulation |
| PE | Polyethylene |
| PVC | Polyvinyl chloride |
| HG | Horticulture glass |
| PMMA | Polymethylmethacrylate |
| PC | Polycarbonate |
| BES | Building energy simulation |
| KMA | Korean Meteorological Administration |
| NSE | Nash–Sutcliffe efficiency coefficient |
| Symbols | |
| T | Temperature |
| H | Humidity |
| S | Solar radiation |
| W | wind speed |
| hi | Internal convective heat transfer coefficient |
| he | External convective heat transfer coefficient |
| Tsi | Internal surface temperature |
| Ibt | Beam radiation on tilted surface |
| Igt | Reflected radiation tilted surface |
| Idt | Diffuse radiation tilted surface |
| Ib | Beam radiation on the horizontal surface |
| Id | Diffuse radiation on the horizontal surface |
| Rb | geometric factor |
| Incidence angle of beam radiation on the tilt surface | |
| Solar zenith angle | |
| β | Slope of a surface |
| Surface azimuth angle | |
| Solar azimuth angle | |
| Reflectance of the ground surface | |
| AI | Anisotropy index |
| f | Modulating factor |
| I | Total radiation on horizontal surface |
| θac | Angular location of circumsolar region |
| Yr | Year |
References
- Vadiee, A.; Martin, V. Solar blind system-solar energy utilization and climate mitigation in glassed buildings. Energy Procedia 2014, 57, 2023–2032. [Google Scholar] [CrossRef]
- Yang, S.H.; Lee, C.G.; Lee, W.K.; Ashtiani, A.A.; Kim, J.Y.; Lee, S.D.; Rhee, J.Y. Heating and cooling system for utilization of surplus air thermal energy in greenhouse and its control logic. J. Biosyst. Eng. 2012, 37, 19–27. [Google Scholar] [CrossRef]
- Carlini, M.; Castellucci, S. Modelling and simulation for energy production parametric dependence in greenhouses. Math. Probl. Eng. 2010, 2010. [Google Scholar] [CrossRef]
- Xaman, J.; Hernandez-Perez, I.; Arce, J.; Alvarez, G.; Ramirez-Davila, L.; Noh-Pat, F. Numerical study of earth-to-air heat exchanger: The effect of thermal insulation. Energy Build. 2014, 85, 356–361. [Google Scholar] [CrossRef]
- Sethi, V.P.; Sumathy, K.; Lee, C.; Pal, D.S. Thermal modeling aspects of solar greenhouse microclimate control: A review on heating technologies. Sol. Energy 2013, 96, 56–82. [Google Scholar] [CrossRef]
- Hassanien, R.H.E.; Li, M.; Lin, W.D. Advanced applications of solar energy in agricultural greenhouses. Renew. Sustain. Energy Rev. 2016, 54, 989–1001. [Google Scholar] [CrossRef]
- Adnan, R.; Jong Won, L.; Hyun Woo, L. A review of greenhouse energy management by using building energy simulation. Prot. Hortic. Plant Fact. 2015, 24, 317–325. [Google Scholar]
- Calise, F. High temperature solar heating and cooling systems for different mediterranean climates: Dynamic simulation and economic assessment. Appl. Therm. Eng. 2012, 32, 108–124. [Google Scholar] [CrossRef]
- Voulgaraki, S.I.; Papadakis, G. Simulation of a Greenhouse Solar Heating System with Seasonal Storage in Greece. In Proceedings of the International Society for Horticultural Science (ISHS), Leuven, Belgium, 1 September 2008; pp. 757–764. [Google Scholar]
- Carlini, M.; Honorati, T.; Castellucci, S. Photovoltaic greenhouses: Comparison of optical and thermal behaviour for energy savings. Math. Probl. Eng. 2012, 2012. [Google Scholar] [CrossRef]
- Attar, I.; Naili, N.; Khalifa, N.; Hazami, M.; Farhat, A. Parametric and numerical study of a solar system for heating a greenhouse equipped with a buried exchanger. Energy Convers. Manag. 2013, 70, 163–173. [Google Scholar] [CrossRef]
- Asdrubali, F.; Cotana, F.; Messineo, A. On the evaluation of solar greenhouse efficiency in building simulation during the heating period. Energies 2012, 5, 1864. [Google Scholar] [CrossRef]
- Chargui, R.; Sammouda, H.; Farhat, A. Geothermal heat pump in heating mode: Modeling and simulation on trnsys. Int. J. Refrig. 2012, 35, 1824–1832. [Google Scholar] [CrossRef]
- Lee, S.; Lee, I.; Hwang, H.; Hong, S.; Seo, I.; Kwon, K.; Ha, T. Design and assessment of greenhouse using ground source heat pump system, Energy, biomass and biological residues. In Proceedings of the International Conference of Agricultural Engineering-CIGR-AgEng 2012: Agriculture and Engineering for a Healthier Life, Valencia, Spain, 8–12 July 2012; p. 1248. [Google Scholar]
- Hoes, H.; Desmedt, J.; Goen, K.; Wittemans, L. The geskas project, closed greenhouse as energy source and optimal growing environment. In Proceedings of the International Society for Horticultural Science (ISHS), Leuven, Belgium, 1 September 2008; pp. 1355–1362. [Google Scholar]
- Vadiee, A.; Martin, V. Energy analysis and thermoeconomic assessment of the closed greenhouse—the largest commercial solar building. Appl. Energy 2013, 102, 1256–1266. [Google Scholar] [CrossRef]
- Dalamagkidis, K.; Saridakis, G.; Kolokotsa, D. Development of simulation algorithms for control scheme optimization in greenhouses. In Proceedings of the Dynastee Scientific Conference, Athens, Greece, 12–14 October 2005. [Google Scholar]
- Kolokotsa, D.; Saridakis, G.; Dalamagkidis, K.; Dolianitis, S.; Kaliakatsos, I. Development of an intelligent indoor environment and energy management system for greenhouses. Energy Convers. Manag. 2010, 51, 155–168. [Google Scholar] [CrossRef]
- Serir, L.; Bournet, P.E.; Benmoussa, H.; Mesmoudi, K. Thermal simulation of a greenhouse under a semi-arid climate. In Proceedings of the International Society for Horticultural Science (ISHS), Leuven, Belgium, 1 July 2012; pp. 635–642. [Google Scholar]
- Lee, S.-B.; Lee, I.-B.; Homg, S.-W.; Seo, I.-H.; Bitog, P.J.; Kwon, K.-S.; Ha, T.-H.; Han, C.-P. Prediction of greenhouse energy loads using building energy simulation (bes). J. Korean Soc. Agric. Eng. 2012, 54, 113–124. [Google Scholar] [CrossRef]
- Ishigami, Y.; Goto, E.; Watanabe, M.; Takahashi, T.; Okushima, L. Development of a simulation model to evaluate environmental controls in a tomato greenhouse. Acta Hortic. 2014, 1037, 93–98. [Google Scholar] [CrossRef]
- Zhang, L.; Xu, P.; Mao, J.; Tang, X.; Li, Z.; Shi, J. A low cost seasonal solar soil heat storage system for greenhouse heating: Design and pilot study. Appl. Energy 2015, 156, 213–222. [Google Scholar] [CrossRef]
- Park, S.J.; Lee, S.N.; Lee, I.B. Calculation of heating and cooling loads for plastic film greenhouse utilizing power plant hot water by using building energy simulation. In Proceedings of the Korean Society for Bio-Environment Control Conference, Cheongju, Korea, 7–8 October 2015; pp. 31–32. [Google Scholar]
- Gupta, M.J.; Chandra, P. Effect of greenhouse design parameters on conservation of energy for greenhouse environmental control. Energy 2002, 27, 777–794. [Google Scholar] [CrossRef]
- Gupta, R.; Tiwari, G.; Kumar, A.; Gupta, Y. Calculation of total solar fraction for different orientation of greenhouse using 3d-shadow analysis in auto-cad. Energy Build. 2012, 47, 27–34. [Google Scholar] [CrossRef]
- Sethi, V.P. On the selection of shape and orientation of a greenhouse: Thermal modeling and experimental validation. Sol. Energy 2009, 83, 21–38. [Google Scholar] [CrossRef]
- Watts, D.; Jara, D. Statistical analysis of wind energy in chile. Renew. Energy 2011, 36, 1603–1613. [Google Scholar] [CrossRef]
- Valera, M.D.; Molina, A.F.; Alvarez, M.A. Protocolo de Auditoría Energética en Invernaderos. Auditoría Energética de un Invernadero para Cultivo de flor Cortada en Mendigorría; Instituto Para La Diversificación Y Ahorro De La Energía: Madrid, Spain, 15 June 2011. (In Spanish) [Google Scholar]
- Rasheed, A.; Lee, J.W.; Lee, H.W. Development of a model to calculate the overall heat transfer coefficient of greenhouse covers. Span. J. Agric. Res. 2017, 15, 4. [Google Scholar] [CrossRef]
- Klein, S.A. Trnsys, a Transient System Simulation Program; Solar Energy Laborataory, University of Wisconsin: Madison, WI, USA, 2012; pp. 92–95. [Google Scholar]
- Liu, B.; Jordan, R. Daily insolation on surfaces tilted towards equator. ASHRAE J. 1961, 10, 53–59. [Google Scholar]
- Hay, J.E.; Davies, J.A. Calculation of the Solar Radiation Incident on an Inclined Surface. In Proceedings of the First Canadian Solar Radiation Data Workshop; Hay, J.E., Won, T.K., Eds.; Ministry of Supply and Services Canada: Toronto, ON, Canada, 1980. [Google Scholar]
- Reindl, D.T.; Beckman, W.A.; Duffie, J.A. Evaluation of hourly tilted surface radiation models. Sol. Energy 1990, 45, 9–17. [Google Scholar] [CrossRef]
- Perez, R.; Seals, R.; Ineichen, P.; Stewart, R.; Menicucci, D. A new simplified version of the perez diffuse irradiance model for tilted surfaces. Sol. Energy 1987, 39, 221–231. [Google Scholar] [CrossRef] [Green Version]
- Iqbal, M. An Introduction to Solar Radiation; Elsevier: Toronto, ON, Canada, 2012; Available online: https://books.google.com.hk/books?id=3_qWce_mbPsC&printsec=frontcover&hl=zh-TW&source=gbs_ge_summary_r&cad=0#v=onepage&q&f=false (accessed on 14 November 2017).
- Noorian, A.M.; Moradi, I.; Kamali, G.A. Evaluation of 12 models to estimate hourly diffuse irradiation on inclined surfaces. Renew. Energy 2008, 33, 1406–1412. [Google Scholar] [CrossRef]
- Nam, S. Roof ventilation structures and ridge vent effect for single span greenhouses of arch shape. CNU J. Agric. Sci. 2001, 28, 99–107. [Google Scholar]
- Gan, G. Thermal transmittance of multiple glazing: Computational fluid dynamics prediction. Appl. Therm. Eng. 2001, 21, 1583–1592. [Google Scholar] [CrossRef]
Figure 1.
Experimental greenhouse at Daegu (latitude 35.53° N, longitude 128.36° E).

Figure 2.
Dimensions and positions of sensors (S (solar radiation), TH (temperature & humidity)) in the experimental greenhouse. PE: Polyethylene.
Figure 2.
Dimensions and positions of sensors (S (solar radiation), TH (temperature & humidity)) in the experimental greenhouse. PE: Polyethylene.
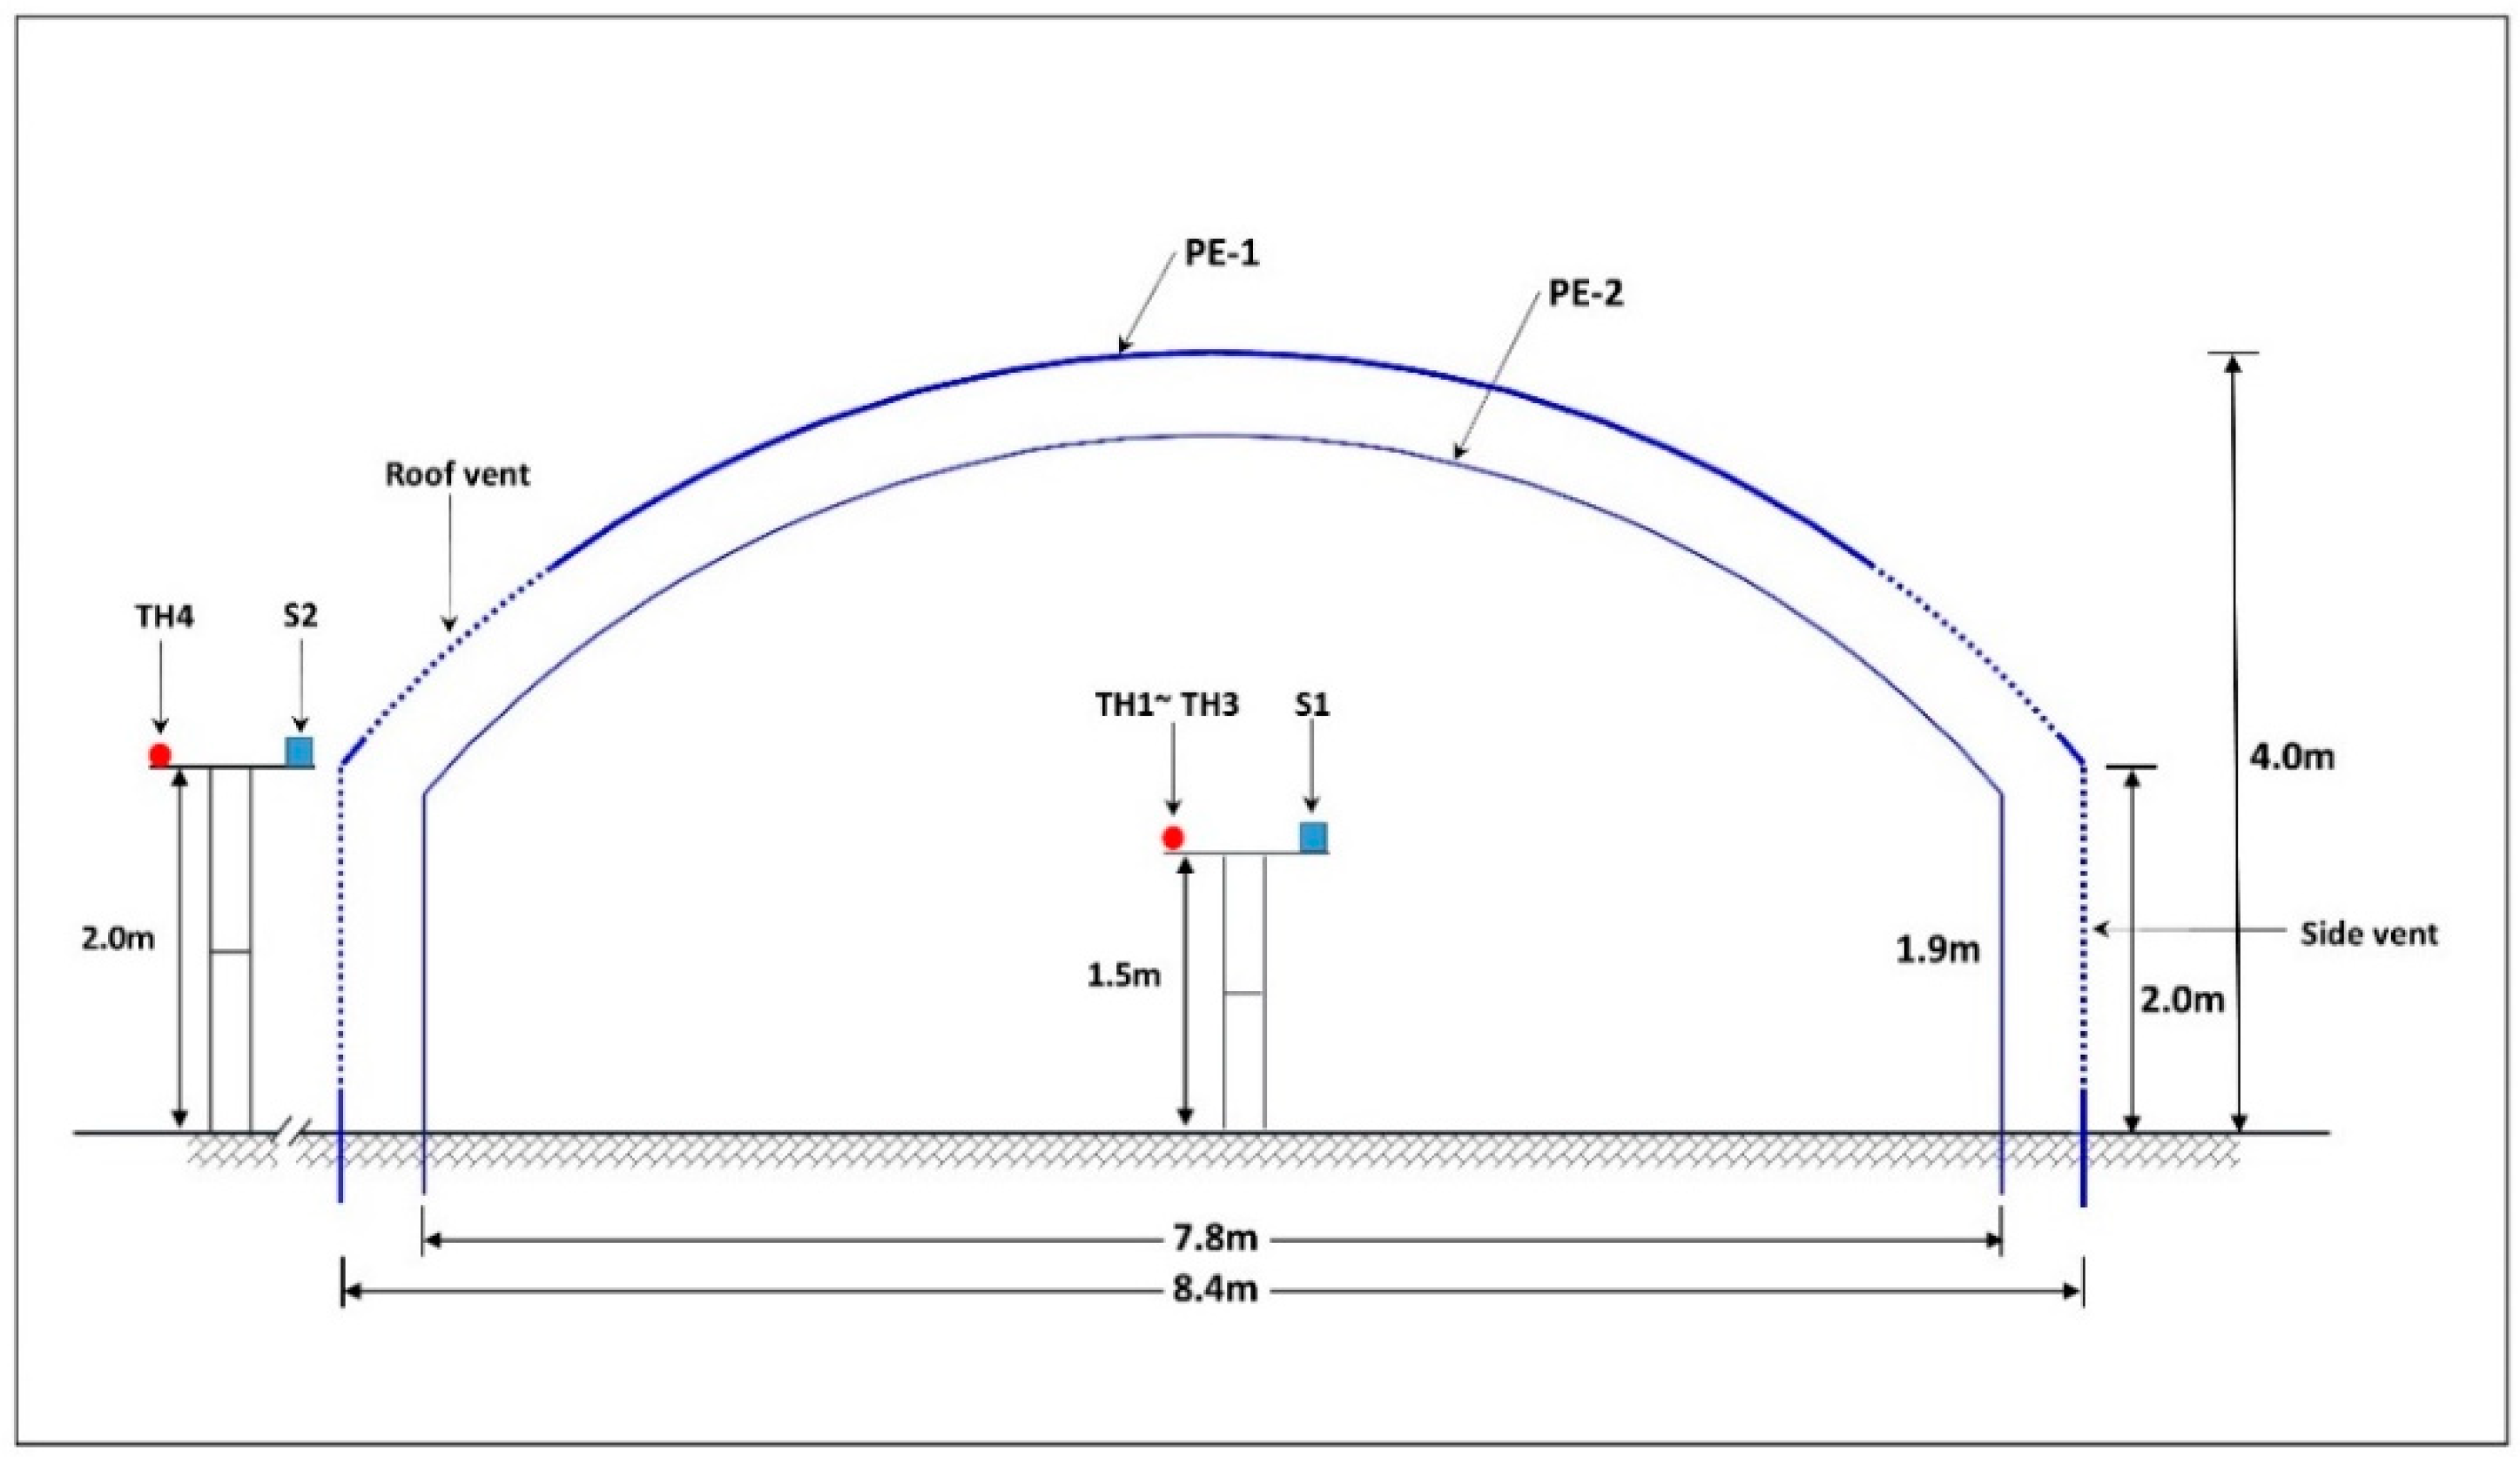
Figure 3.
Hourly mean temperature outside the greenhouse.

Figure 4.
Hourly solar radiation outside the greenhouse.
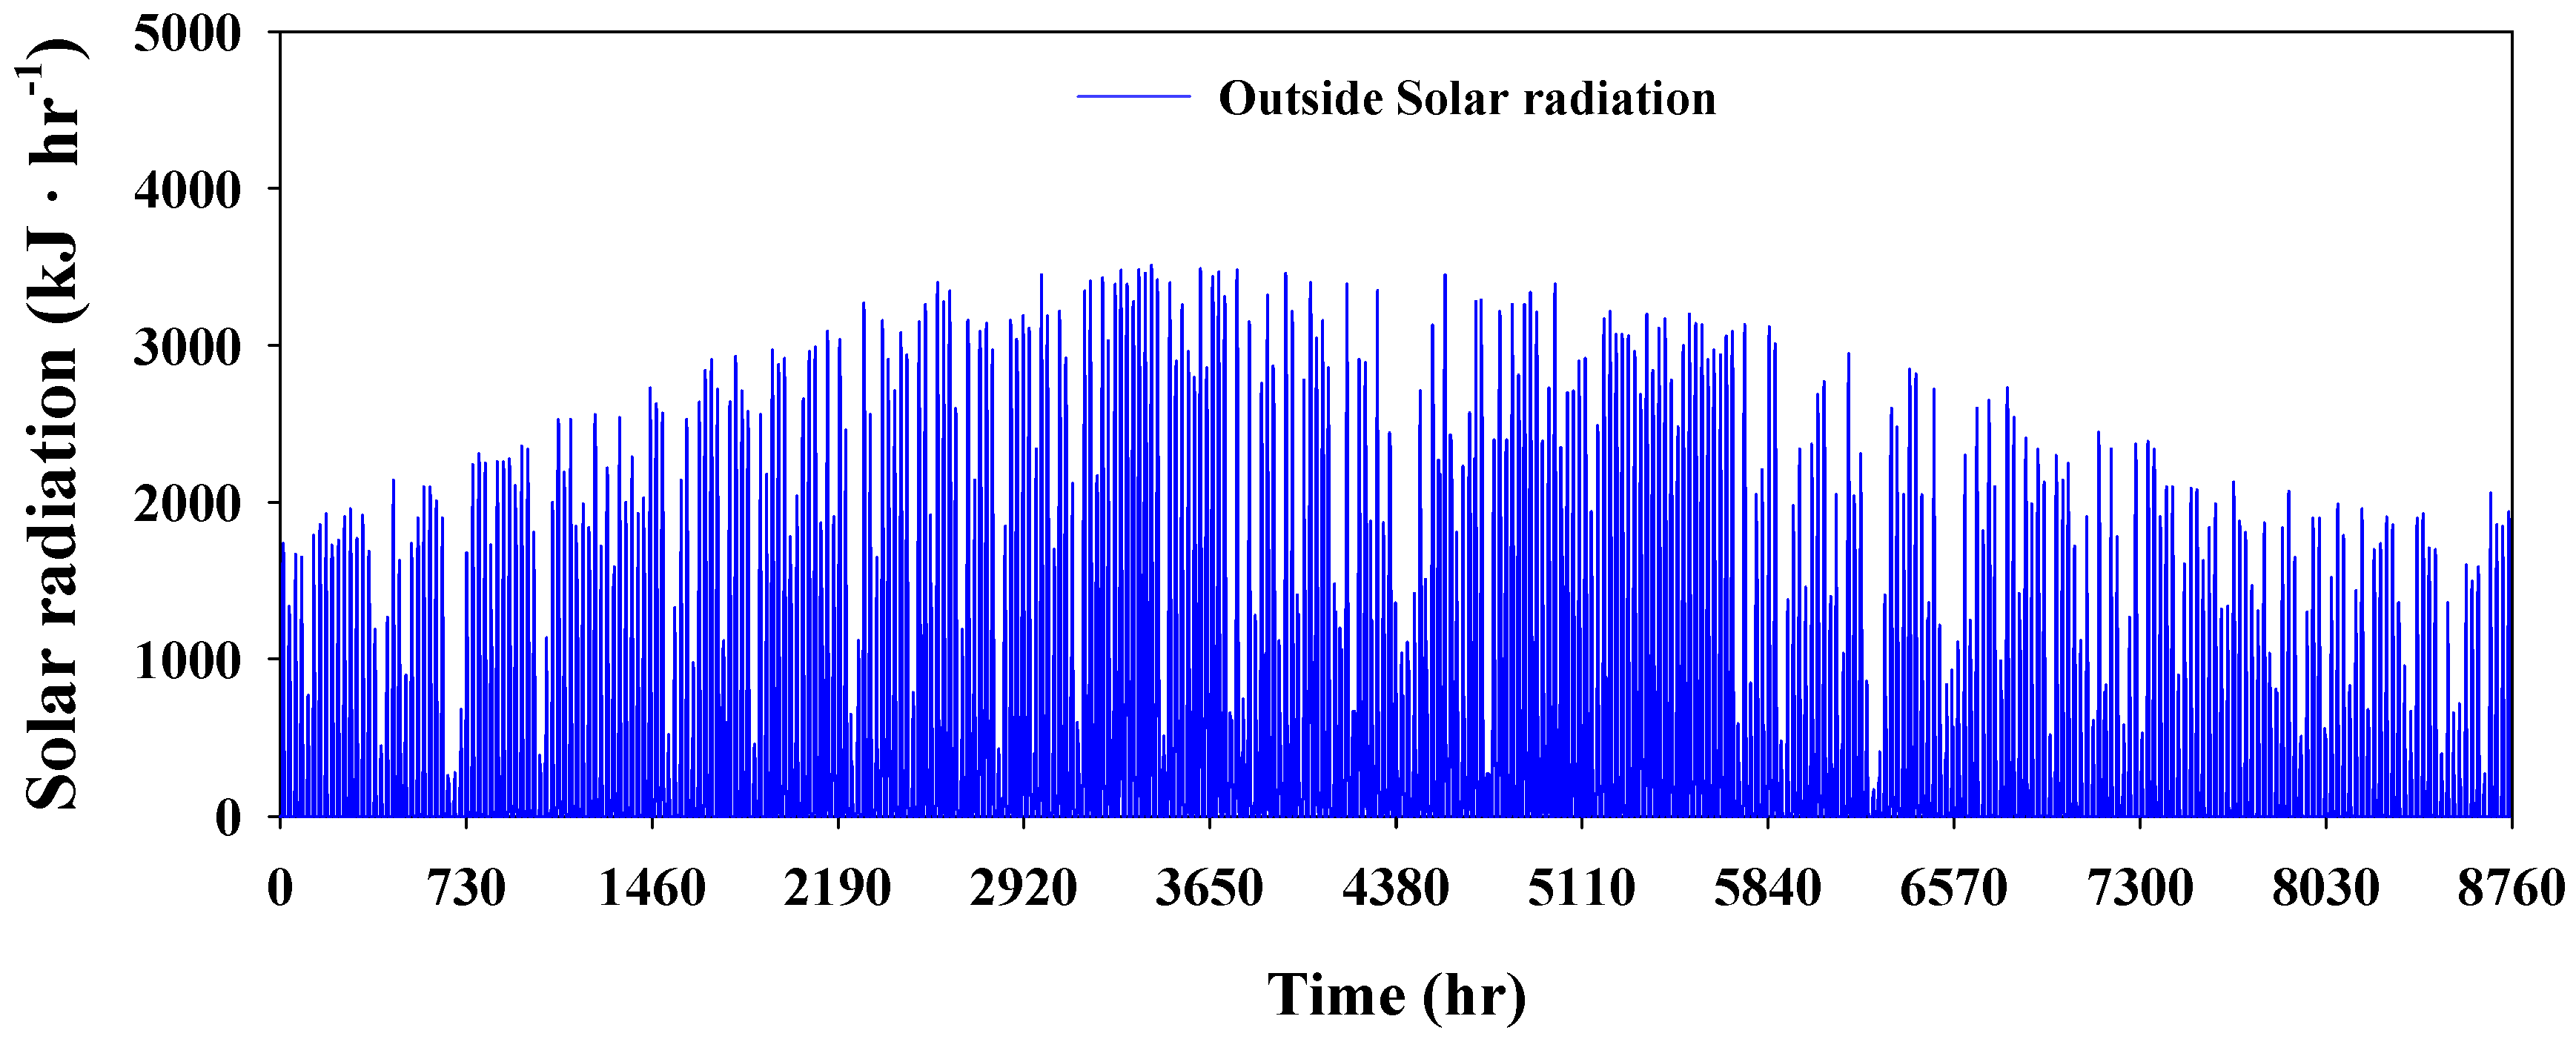
Figure 5.
Flow chart of the modeling process.

Figure 6.
Sample of the DOE-2 file for PMMA (Polymethylmethacrylate).

Figure 7.
Solar azimuth in (a) January, (b) June, and zenith angles in (c) January, (d) June.

Figure 8.
Variation in greenhouse internal temperature for different radiation models.

Figure 9.
Computed vs. measured internal air temperatures of a (a) fully closed greenhouse, and (b) naturally ventilated greenhouse.
Figure 9.
Computed vs. measured internal air temperatures of a (a) fully closed greenhouse, and (b) naturally ventilated greenhouse.

Figure 10.
Comparison of the monthly heating and cooling energy demands for selected greenhouse roof shapes.
Figure 10.
Comparison of the monthly heating and cooling energy demands for selected greenhouse roof shapes.
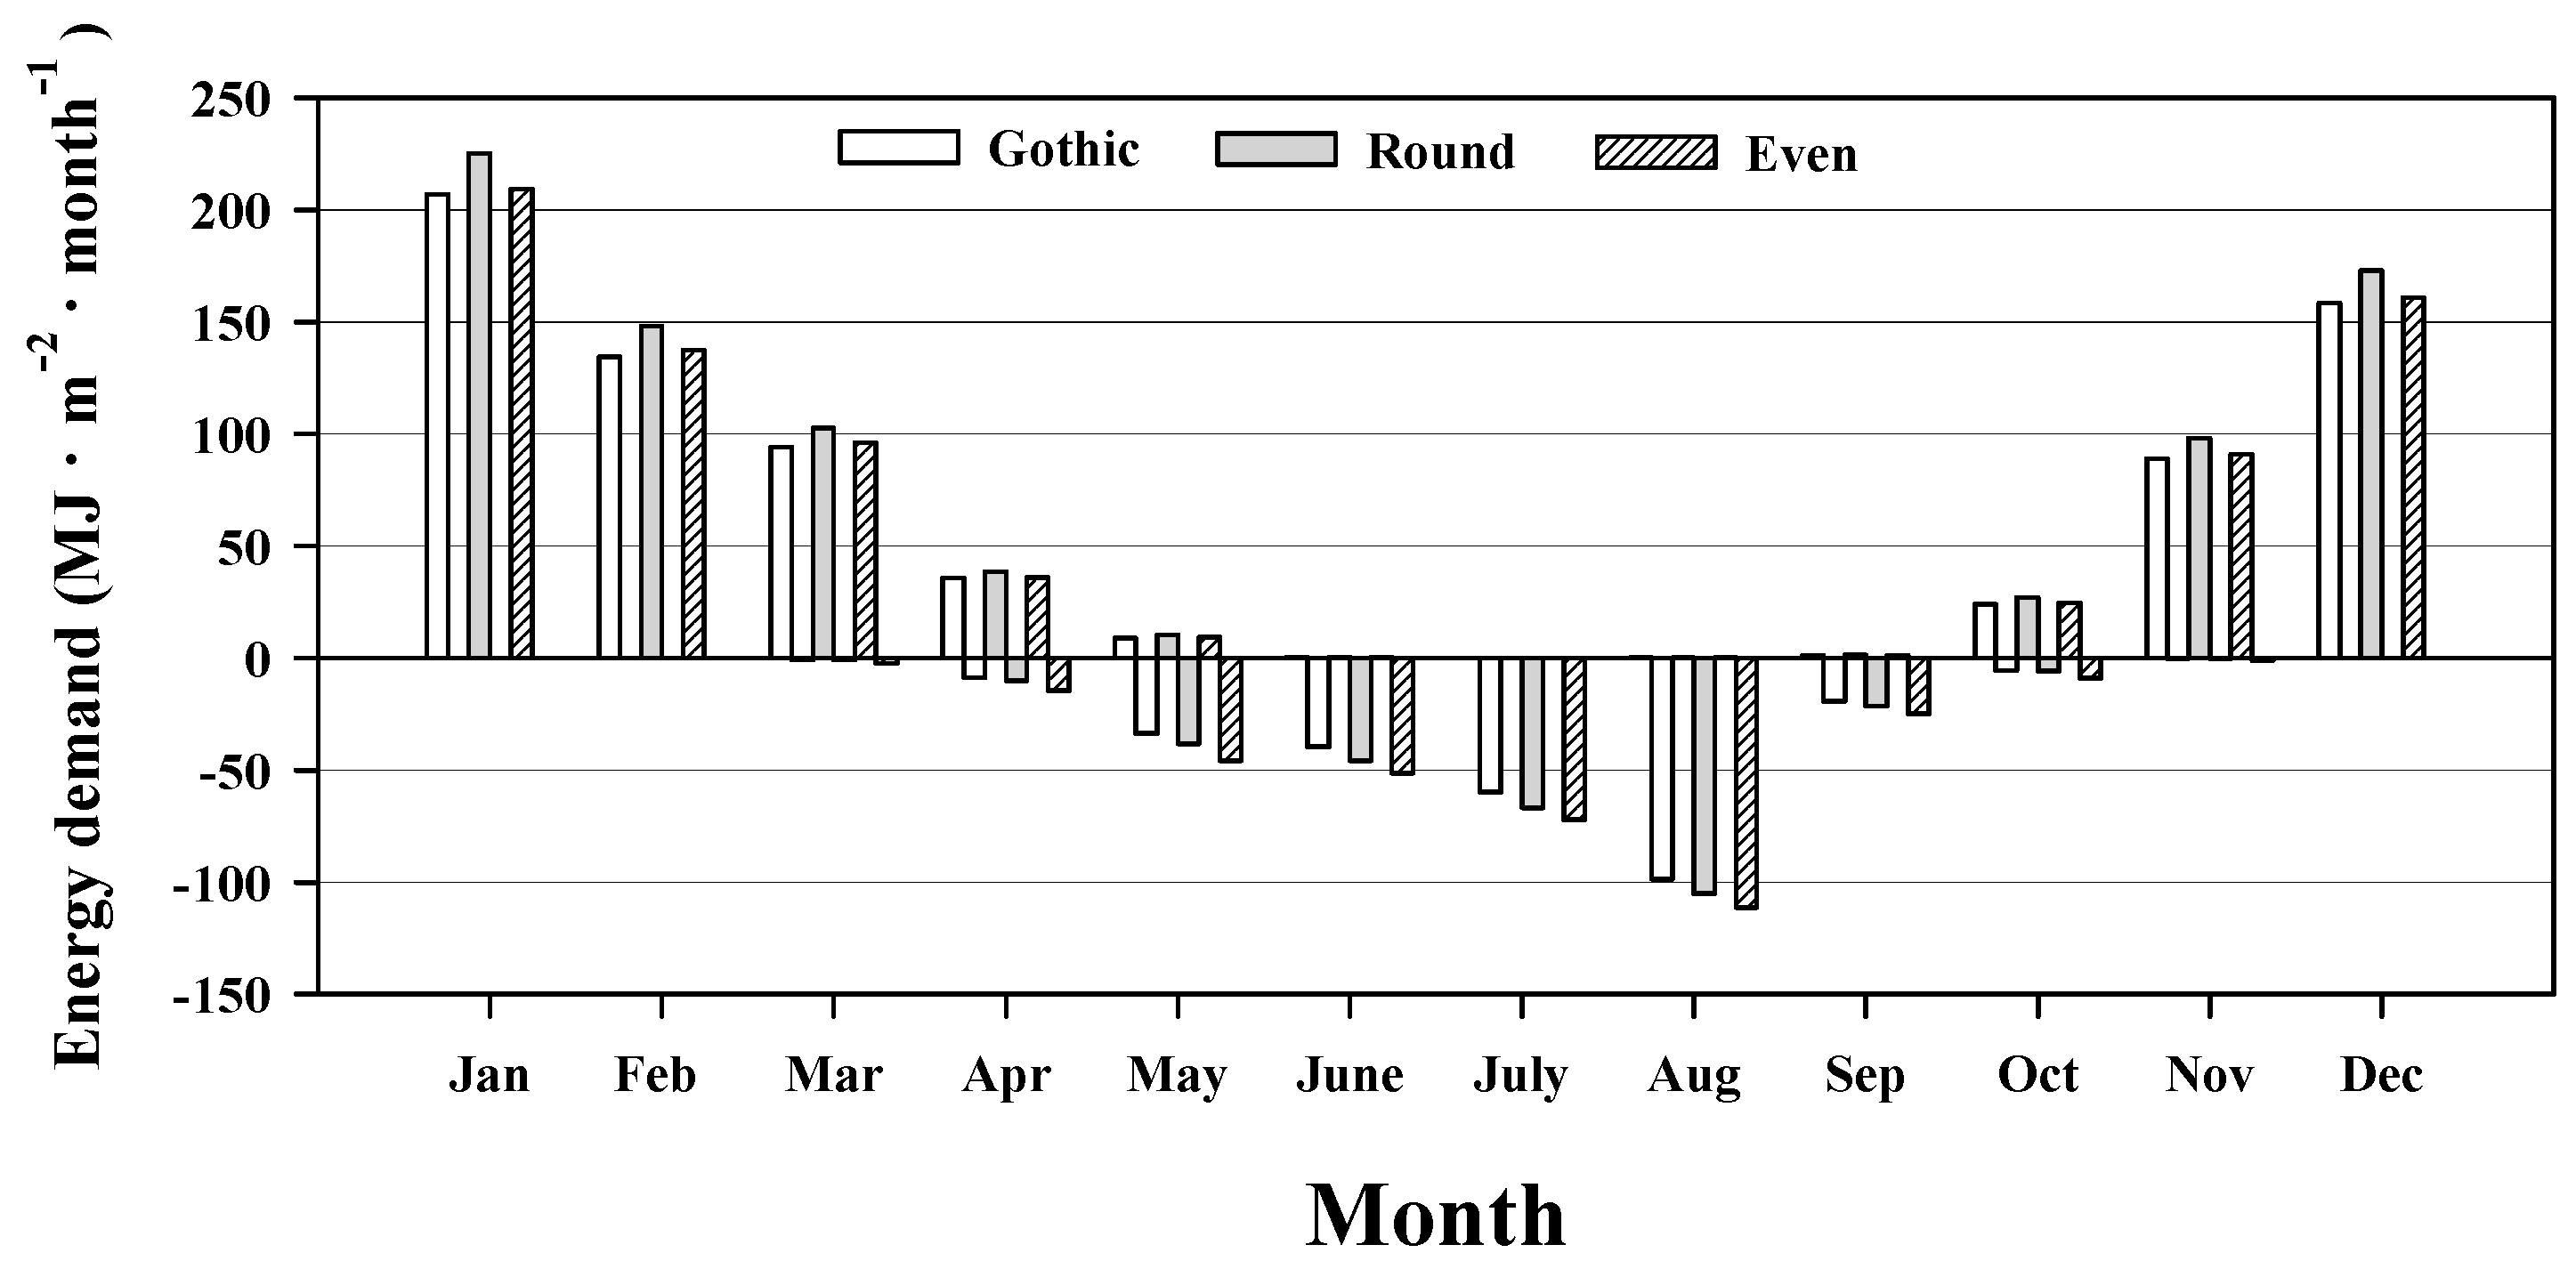
Figure 11.
Solar energy gain at different angles of orientations, of a gothic-shaped roof.

Figure 12.
Monthly total solar energy gain for greenhouse oriented (a) E-W and (b) N-S.

Figure 13.
Variation in internal greenhouse air temperatures (from 1–5 January 2016) of greenhouse covered with single and double-layered PE material.
Figure 13.
Variation in internal greenhouse air temperatures (from 1–5 January 2016) of greenhouse covered with single and double-layered PE material.
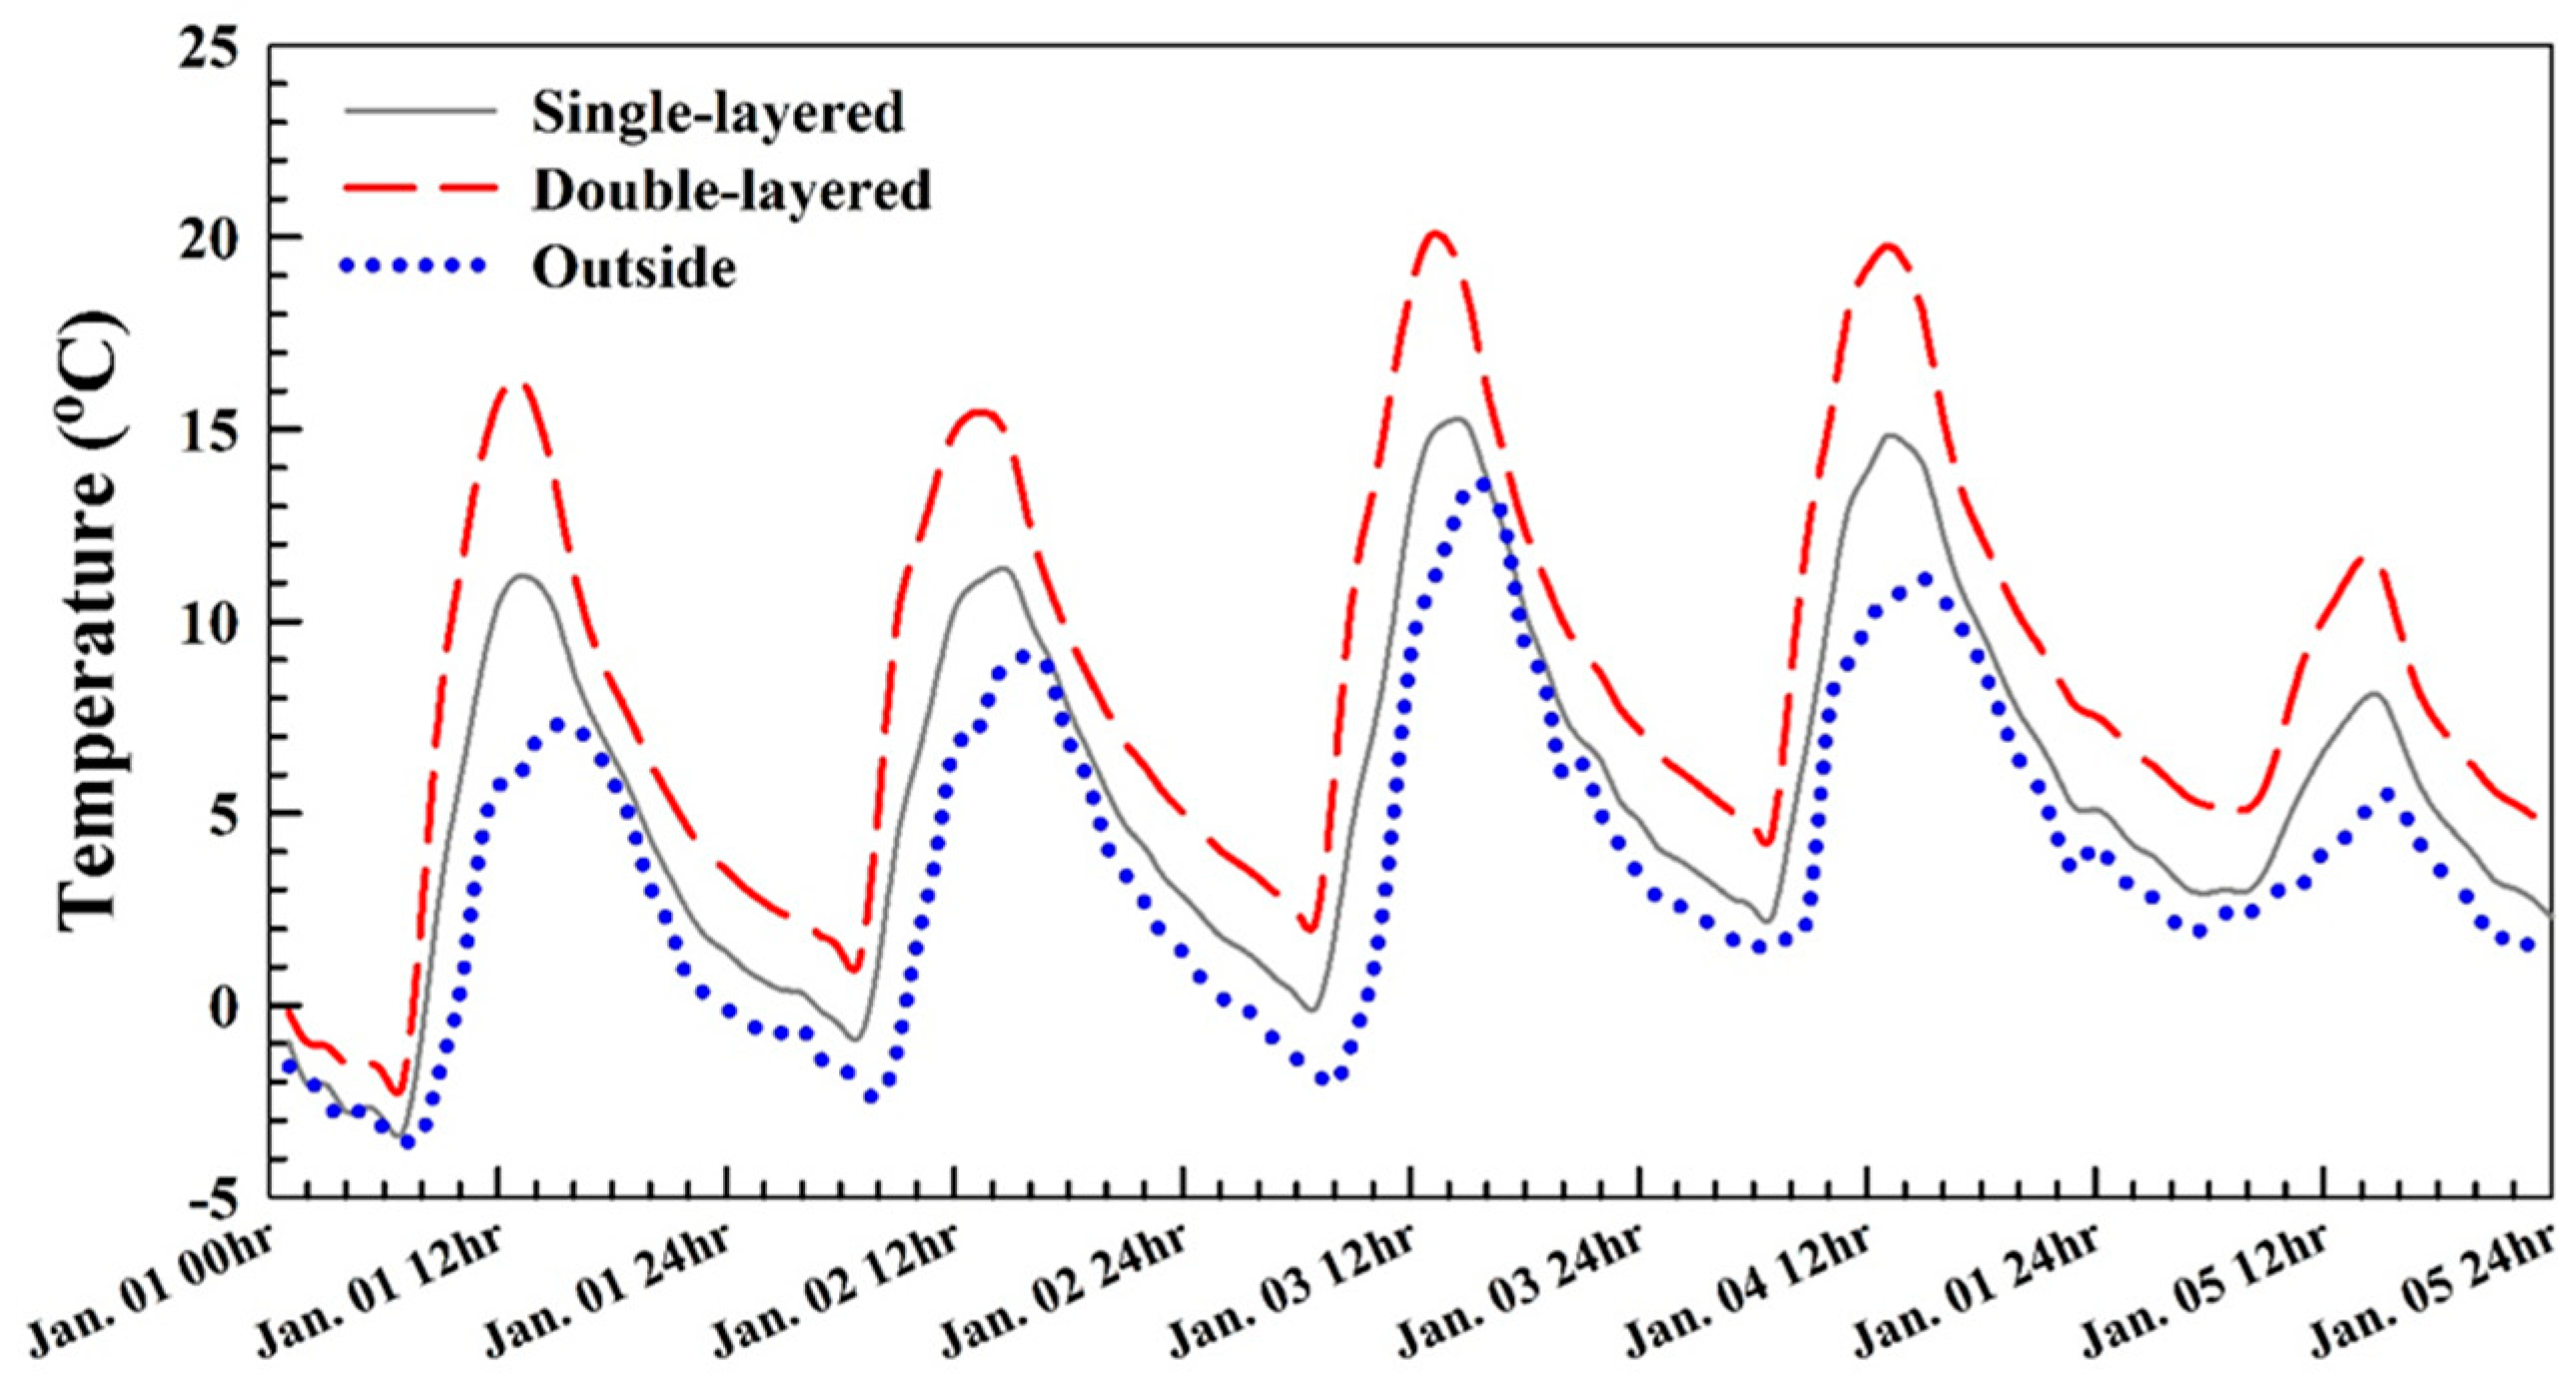
Figure 14.
Variations in greenhouse internal temperature with different side and roof openings.
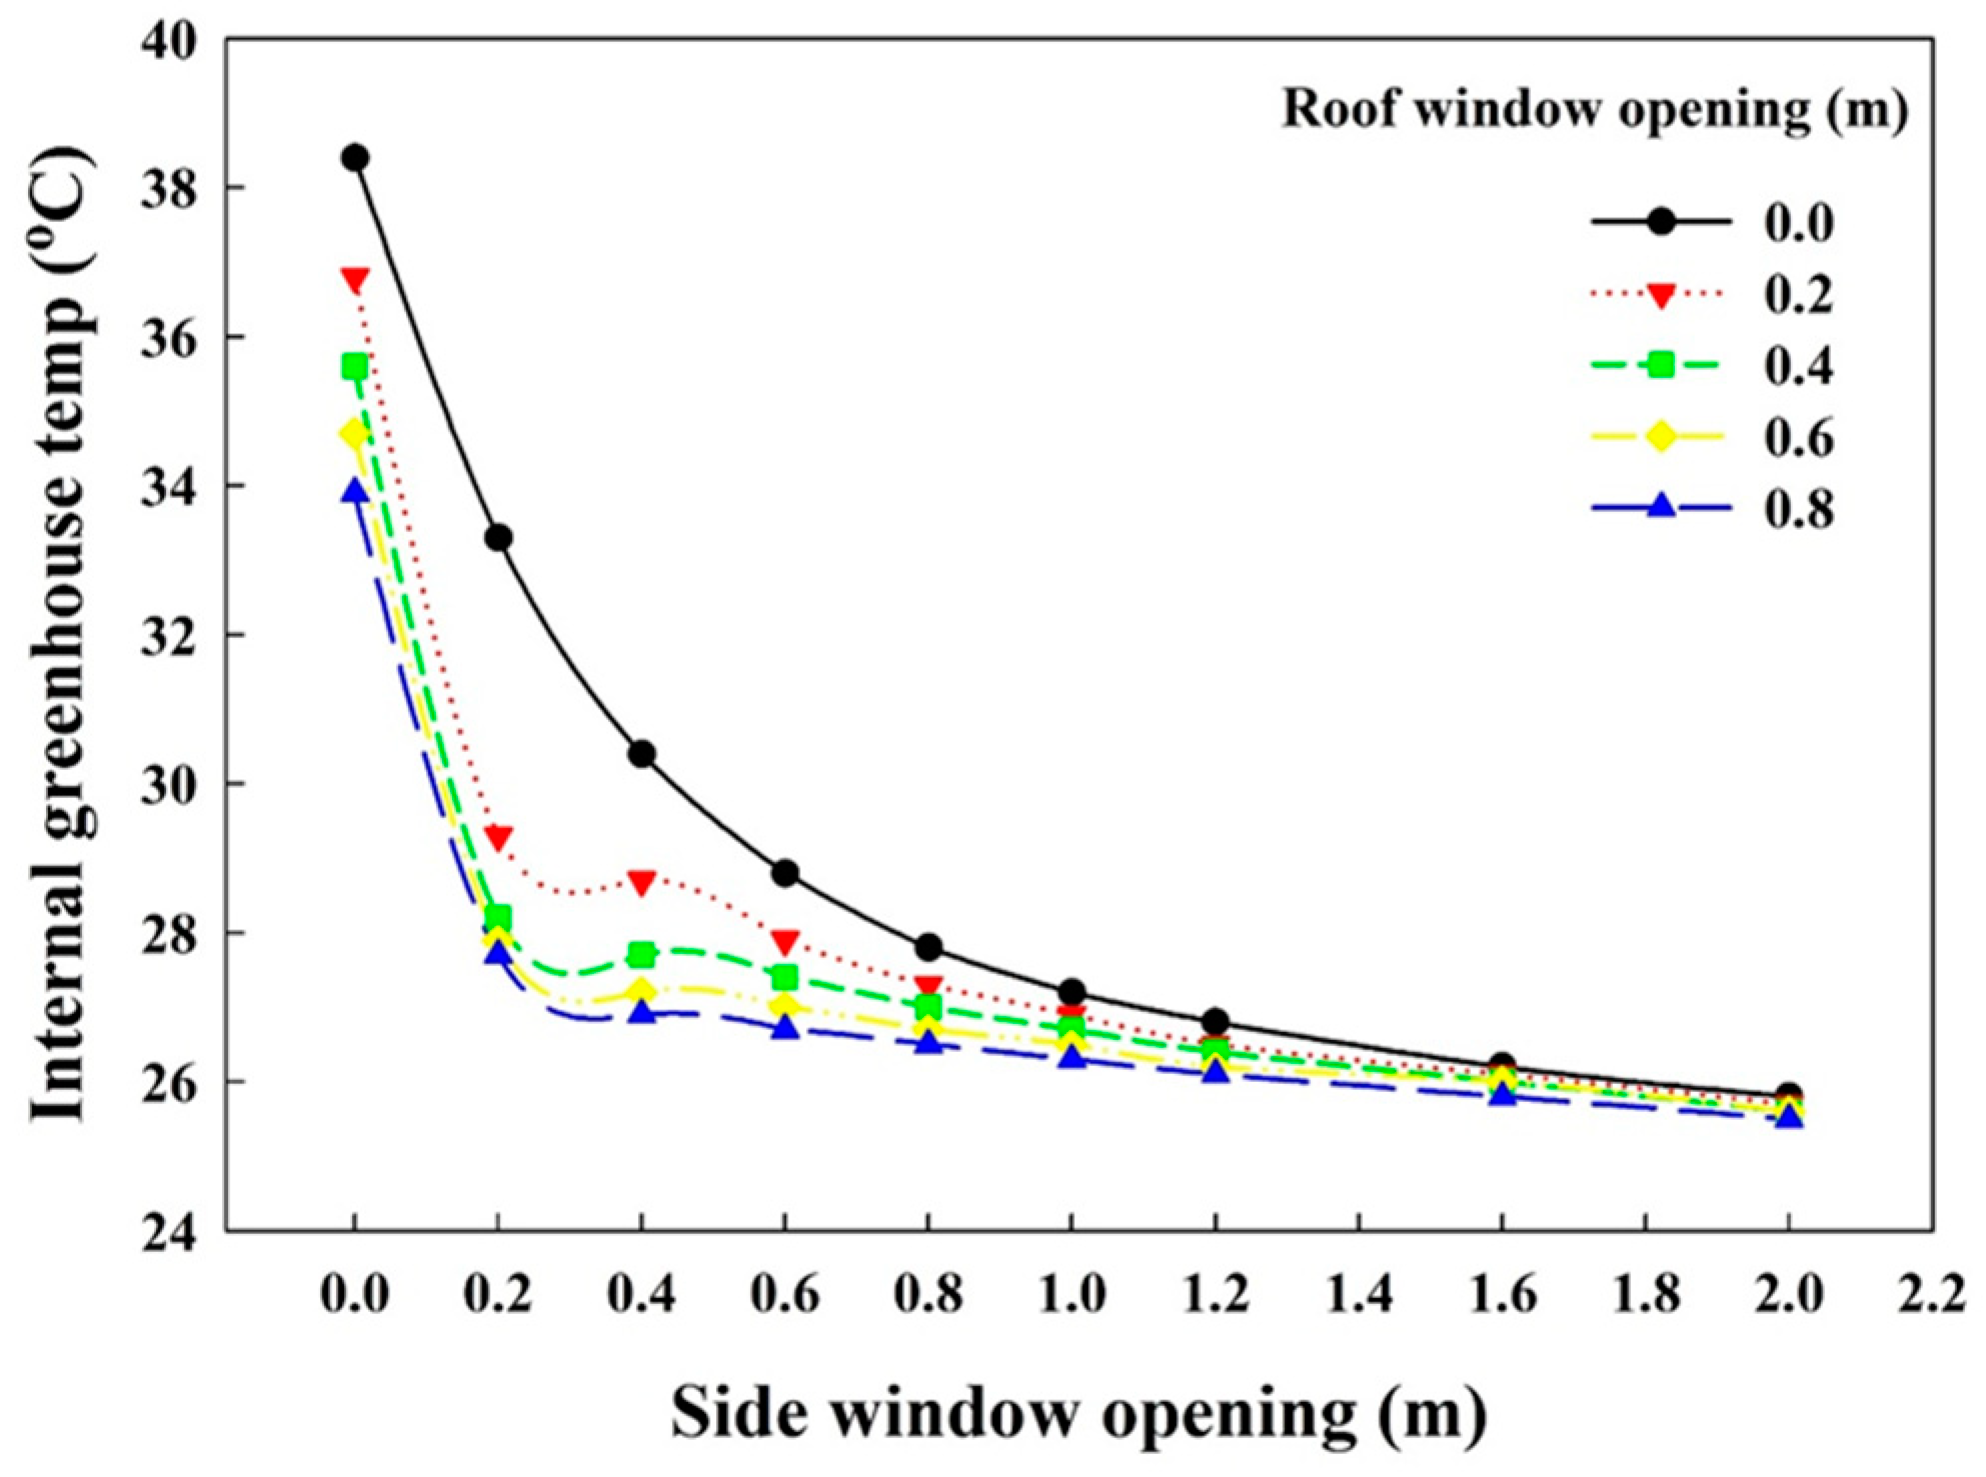
Figure 15.
Greenhouse internal temperature for different natural ventilation scenarios.

Figure 16.
Annual heating demand of gothic-shaped greenhouse by using different coverings. PE: Polyethylene, PVC: Polyvinyl chloride; HG: Horticulture glass; PMMA: Polymethylmethacrylate; PC: Polycarbonate.
Figure 16.
Annual heating demand of gothic-shaped greenhouse by using different coverings. PE: Polyethylene, PVC: Polyvinyl chloride; HG: Horticulture glass; PMMA: Polymethylmethacrylate; PC: Polycarbonate.

Figure 17.
Effect of the thickness of PMMA covering material on the annual heating demand of the greenhouse modeled with gothic-shaped greenhouse.
Figure 17.
Effect of the thickness of PMMA covering material on the annual heating demand of the greenhouse modeled with gothic-shaped greenhouse.


Table 1.
Characteristics of the weather data used in the simulations.
| Weather Parameter | Unit | Time Interval | Sensor | Data Recorded |
|---|---|---|---|---|
| Temperature | °C | 10 min | TR-76Ui-H, TECPEL | Field recorded |
| Relative humidity | % | 10 min | TR-76Ui-H, TECPEL | Field recorded |
| Solar radiation | kW | 10 min | CMP3, Kipp & Zonen | Field recorded |
| Wind speed | ms–1 | 1 h | JY-WS161B, Jingang | KMA |
| Wind direction | degree | 1 h | JY-WS161B, Jingang | KMA |
| Ambient pressure | hPa | 1 h | PTB-220TS, VAISALA | KMA |
KMA: Korean Meteorological Administration.
Table 2.
Details of studied parameters.
| Parameter | Test Condition | |||||||||||
|---|---|---|---|---|---|---|---|---|---|---|---|---|
| Roof shape | Gothic | Round | Even roof | |||||||||
| Orientation | 0 (E-W) | 30 | 45 | 60 | 75 | 90 (N-S) | ||||||
| Glazing | Single | Double | ||||||||||
| Natural ventilation | Side vent opening (m) | 0.0 | 0.2 | 0.4 | 0.6 | 0.8 | 1.0 | 1.2 | 1.4 | 1.6 | 1.8 | 2.0 |
| Roof vent opening (m) | 0.0 | 0.2 | 0.4 | 0.6 | 0.8 | |||||||
| Covering material | PE | PVC | HG | PMMA | PC | |||||||
| Thickness of PMMA (mm) | 4 | 6 | 8 | 10 | 16 | 20 | 30 | 40 | 50 | |||
Note: PE: Polyethylene; PVC: Polyvinyl chloride; HG: Horticulture glass; PMMA: Polymethylmethacrylate; PC: Polycarbonate.
Table 3.
Characteristics of the greenhouse cover materials.
| Cover Characteristics | Greenhouse Covers | ||||
|---|---|---|---|---|---|
| PE | PVC | HG | PMMA | PC | |
| Solar transmittance | 0.86 | 0.91 | 0.89 | 0.82 | 0.78 |
| Solar reflectance | 0.10 | 0.07 | 0.08 | 0.12 | 0.14 |
| Visible radiation transmittance | 0.89 | 0.92 | 0.91 | 0.92 | 0.75 |
| Visible radiation reflectance | 0.08 | 0.14 | 0.08 | 0.07 | 0.15 |
| Thermal radiation transmittance | 0.18 | 0.06 | 0.00 | 0.00 | 0.02 |
| Thermal radiation emission | 0.79 | 0.62 | 0.90 | 0.98 | 0.89 |
| Conductivity (W m−1 K−1) | 0.33 | 0.13 | 0.76 | 0.19 | 0.19 |
| Thickness (mm) | 0.10 | 0.10 | 4.00 | 10 | 10 |
© 2018 by the authors. Licensee MDPI, Basel, Switzerland. This article is an open access article distributed under the terms and conditions of the Creative Commons Attribution (CC BY) license (http://creativecommons.org/licenses/by/4.0/).
Share and Cite
MDPI and ACS Style
Rasheed, A.; Lee, J.W.; Lee, H.W. Development and Optimization of a Building Energy Simulation Model to Study the Effect of Greenhouse Design Parameters. Energies 2018, 11, 2001. https://doi.org/10.3390/en11082001
AMA Style
Rasheed A, Lee JW, Lee HW. Development and Optimization of a Building Energy Simulation Model to Study the Effect of Greenhouse Design Parameters. Energies. 2018; 11(8):2001. https://doi.org/10.3390/en11082001
Chicago/Turabian StyleRasheed, Adnan, Jong Won Lee, and Hyun Woo Lee. 2018. "Development and Optimization of a Building Energy Simulation Model to Study the Effect of Greenhouse Design Parameters" Energies 11, no. 8: 2001. https://doi.org/10.3390/en11082001
Note that from the first issue of 2016, this journal uses article numbers instead of page numbers. See further details here.