Development of Window-Mounted Air Cap Roller Module


1
Institute of Green Building and New Technology Mirae Environment Plan, Seoul 01905, Korea
2
School of Architure, Kookmin University, 77 Jeongneung-ro, Seongbuk-gu, Seoul 02707, Korea
*
Author to whom correspondence should be addressed.
Energies 2018, 11(7), 1909; https://doi.org/10.3390/en11071909
Submission received: 6 July 2018
/
Revised: 17 July 2018
/
Accepted: 19 July 2018
/
Published: 21 July 2018
Abstract
:While previous research has shown the use of attachable air-caps on windows to efficiently reduce a building’s energy consumption, the air-caps considered had to be attached to the entire window’s surface, thus limiting the occupants’ view and creating the inconvenience of needing to detach and attach the air-caps. In this study, a window-mounted air-cap roller module using Velcro tape that may be easily attached, detached, and rolled up or down was developed and performance tested in a full-scale test bed. It was found that as the area of the air-caps attached on a window increased, the required indoor lighting energy increased. However, the window insulation improved, thus reducing the cooling and heating energy needed. Attaching the air-caps to the entire window surface effectively reduced the building’s energy consumption, but views through the window may be disturbed. Thus, the developed window-mounted air-caps enable an occupant to reduce the building energy consumption and maintain their view according to their need. The findings of this study may contribute to a reduction in building energy consumption without sacrificing a pleasant indoor environment. Further studies may be needed to verify their efficacy under varying indoor and outdoor conditions.
1. Introduction
The concept of net zero energy buildings has been extensively examined; the concept that the power generation from new renewable energy resources offsets the total energy consumption of the building, thus achieving net-zero energy consumption [1,2,3]. Although many studies contributed to the development of new and renewable energy resources to counterbalance the total energy spent in the building, net zero energy buildings are mostly impossible without reduced energy consumption of the building itself. The “2015 Renewable Energy Data Book”, published by the United States Department of Energy, reported that energy consumption by buildings accounted for 39.8% of the overall energy consumption in the United States [4]. It also predicted that the energy consumption of the buildings would continue to increase. The energy usage of buildings for space heating, lighting, and cooling is as high as 20.8%, 11.3%, and 10.0% of the total energy usage in the United States, respectively [5]. Therefore, there is an increased requirement to develop technologies and methods to reduce the energy consumed by buildings. Further, high energy consumption is related to the poor insulation of building skins, especially that of windows. Various studies have been conducted to investigate potential approaches for improving the thermal performance of windows, including the use of double skins [6,7,8,9,10,11,12,13,14,15], phase change materials (PCM) [16,17,18,19,20,21,22], window blinds [23,24,25,26,27,28,29,30,31,32], awnings [33,34,35], and light shelves [36,37,38,39,40,41]. Although several of these apparatuses may be efficiently used to reduce the energy consumption of the buildings, they often have high installation costs or are difficult to be applied to the existing buildings. Air caps, originally developed by the Sealed Air Corporation [42] as a packaging material, comprise a regular pattern of air pockets that are sealed between two sheets of polyethylene film and have been depicted to improve window insulation. In previous studies, air caps were attached to the entire window surface [43,44,45], which may have efficiently improved the insulation performance of the window; however, this may disturb the view through the window and increase the amount of energy required to ensure indoor lighting. Additionally, water or double-sided adhesive tape was used to adhere the air caps [43,44], which caused problems while attaching and detaching the air-caps. In this study, a window-mounted air cap roller module was developed for easy attachment, detachment, and adjustment of the air caps. A full-scale test bed was used to verify the effectiveness of the module in reducing the energy consumption that is required for heating, lighting, and cooling a building.
1.1. Literature Review Research on Air Caps and Their Specifications
According to the information provided by the manufacturer [42], air cap pockets are generally circular and their dimensions vary depending on the thickness of the air-filled layer, as shown in Table 1. In this study, Type 2 air caps with 10-mm diameter circular air-filled pockets were used. This choice was based on a previous study, in which the thermal performance of a window was improved using air caps [43].
Table 2 presents a summary of previous work improving building insulation by implementing air caps. In previous studies, researchers suggested attaching air caps directly onto the glass surfaces or frames of windows to achieve an air-tight fit and improve insulation performance. However, attaching air caps directly onto a window may impair viewing through the window, which is its original function. Moreover, attaching air caps onto a window may decrease the amount of natural light entering the building, thereby reducing the indoor illumination and increasing the energy demand for lighting.
1.2. Appropriate Indoor Temperature and Illumination Standards for Performance Evaluation
Indoor temperature and illumination are factors that determine the pleasantness of an indoor space. Maintaining them at a constant level contributes to a reduction in total building energy consumption by preventing unnecessary energy consumption for cooling, heating, and lighting [46]. Therefore, setting appropriate standards for indoor temperature and illumination is important in controlling cooling and heating devices and lighting. A summary of the appropriate indoor temperature and illumination standards for various countries is presented in Table 3 and Table 4. Based on these standards, the performance evaluation in this study was conducted for maintaining the summer and winter indoor temperature standards of 26 °C and 20 °C, respectively. The appropriate indoor illumination standard was determined as 500 lx [35]. The reasons for selecting this indoor illumination standard for the performance evaluation in this study were the following. Upon examining the illumination standards of the United States, Japan, and Korea, the values of 500 and 600 lx were found to be used interchangeably as the illumination for a “normal” task grade. In the cases of Japan and South Korea, 600 lx is designated as the maximum allowed illumination. In light of this, the 600 lx value was excluded as an appropriate indoor illumination standard. Therefore, this study set 500 lx as the appropriate indoor illumination standard and proceeded to carry out the performance evaluation under this condition.
2. Proposal and Performance Evaluation Methods
2.1. Proposal of Window-Mounted Air Cap Roller Module
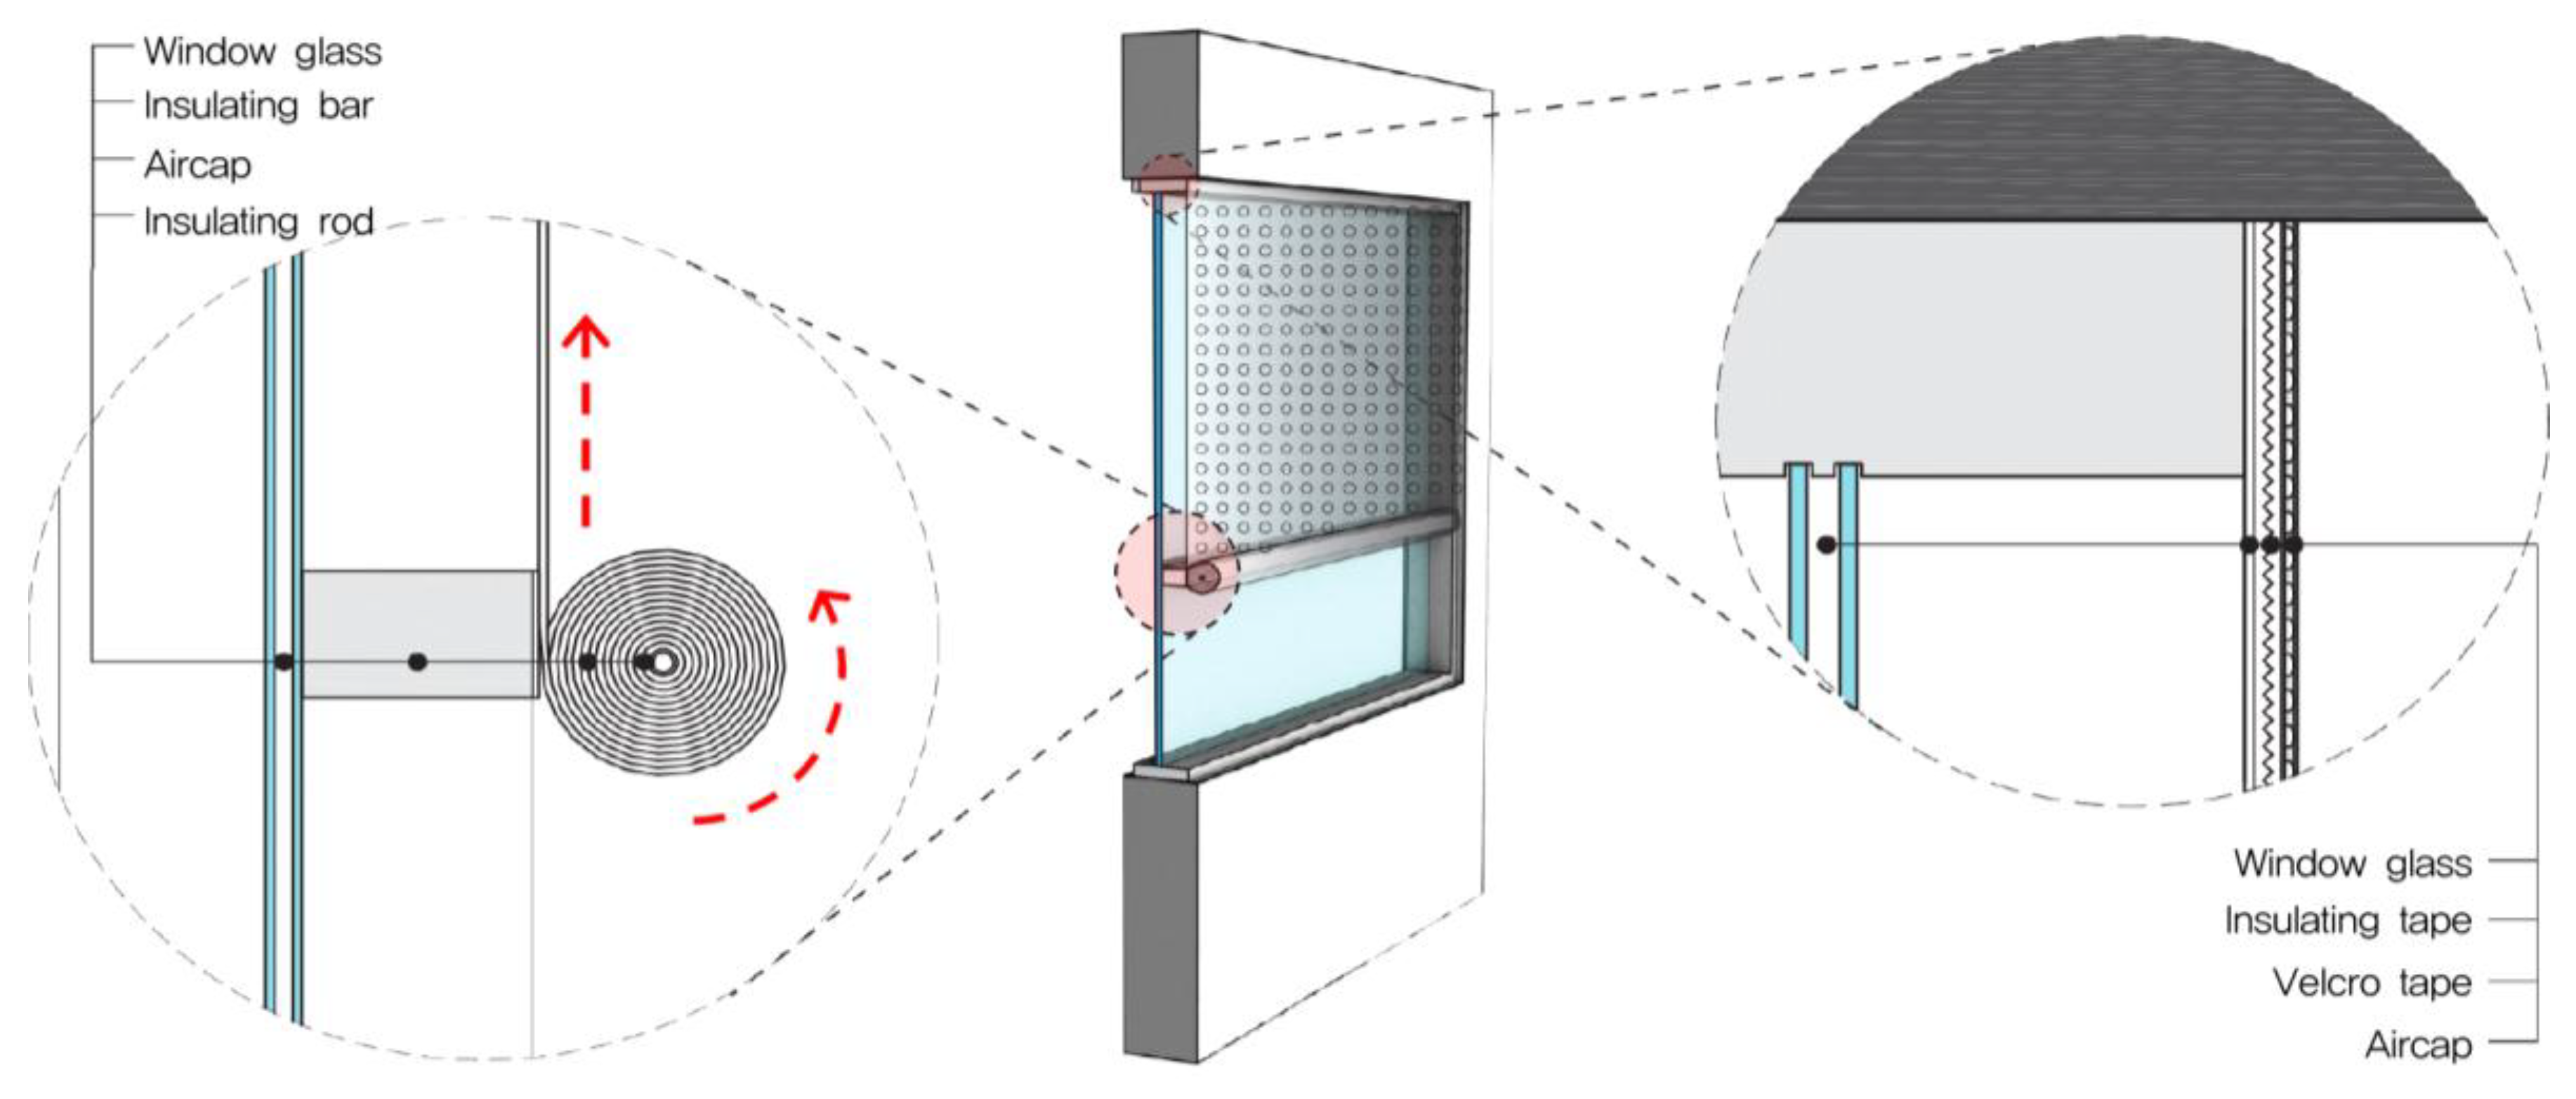
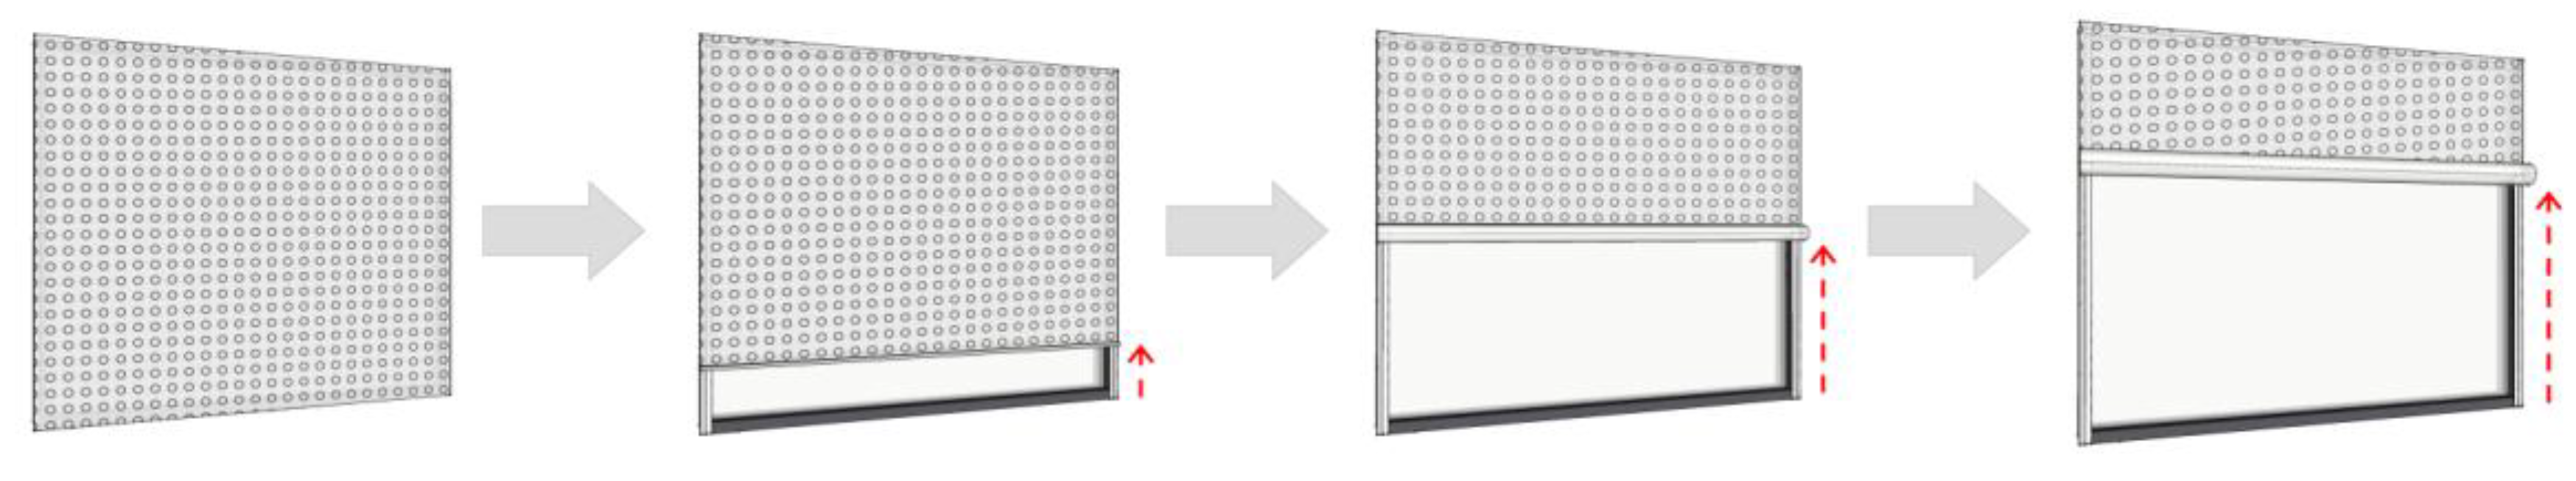
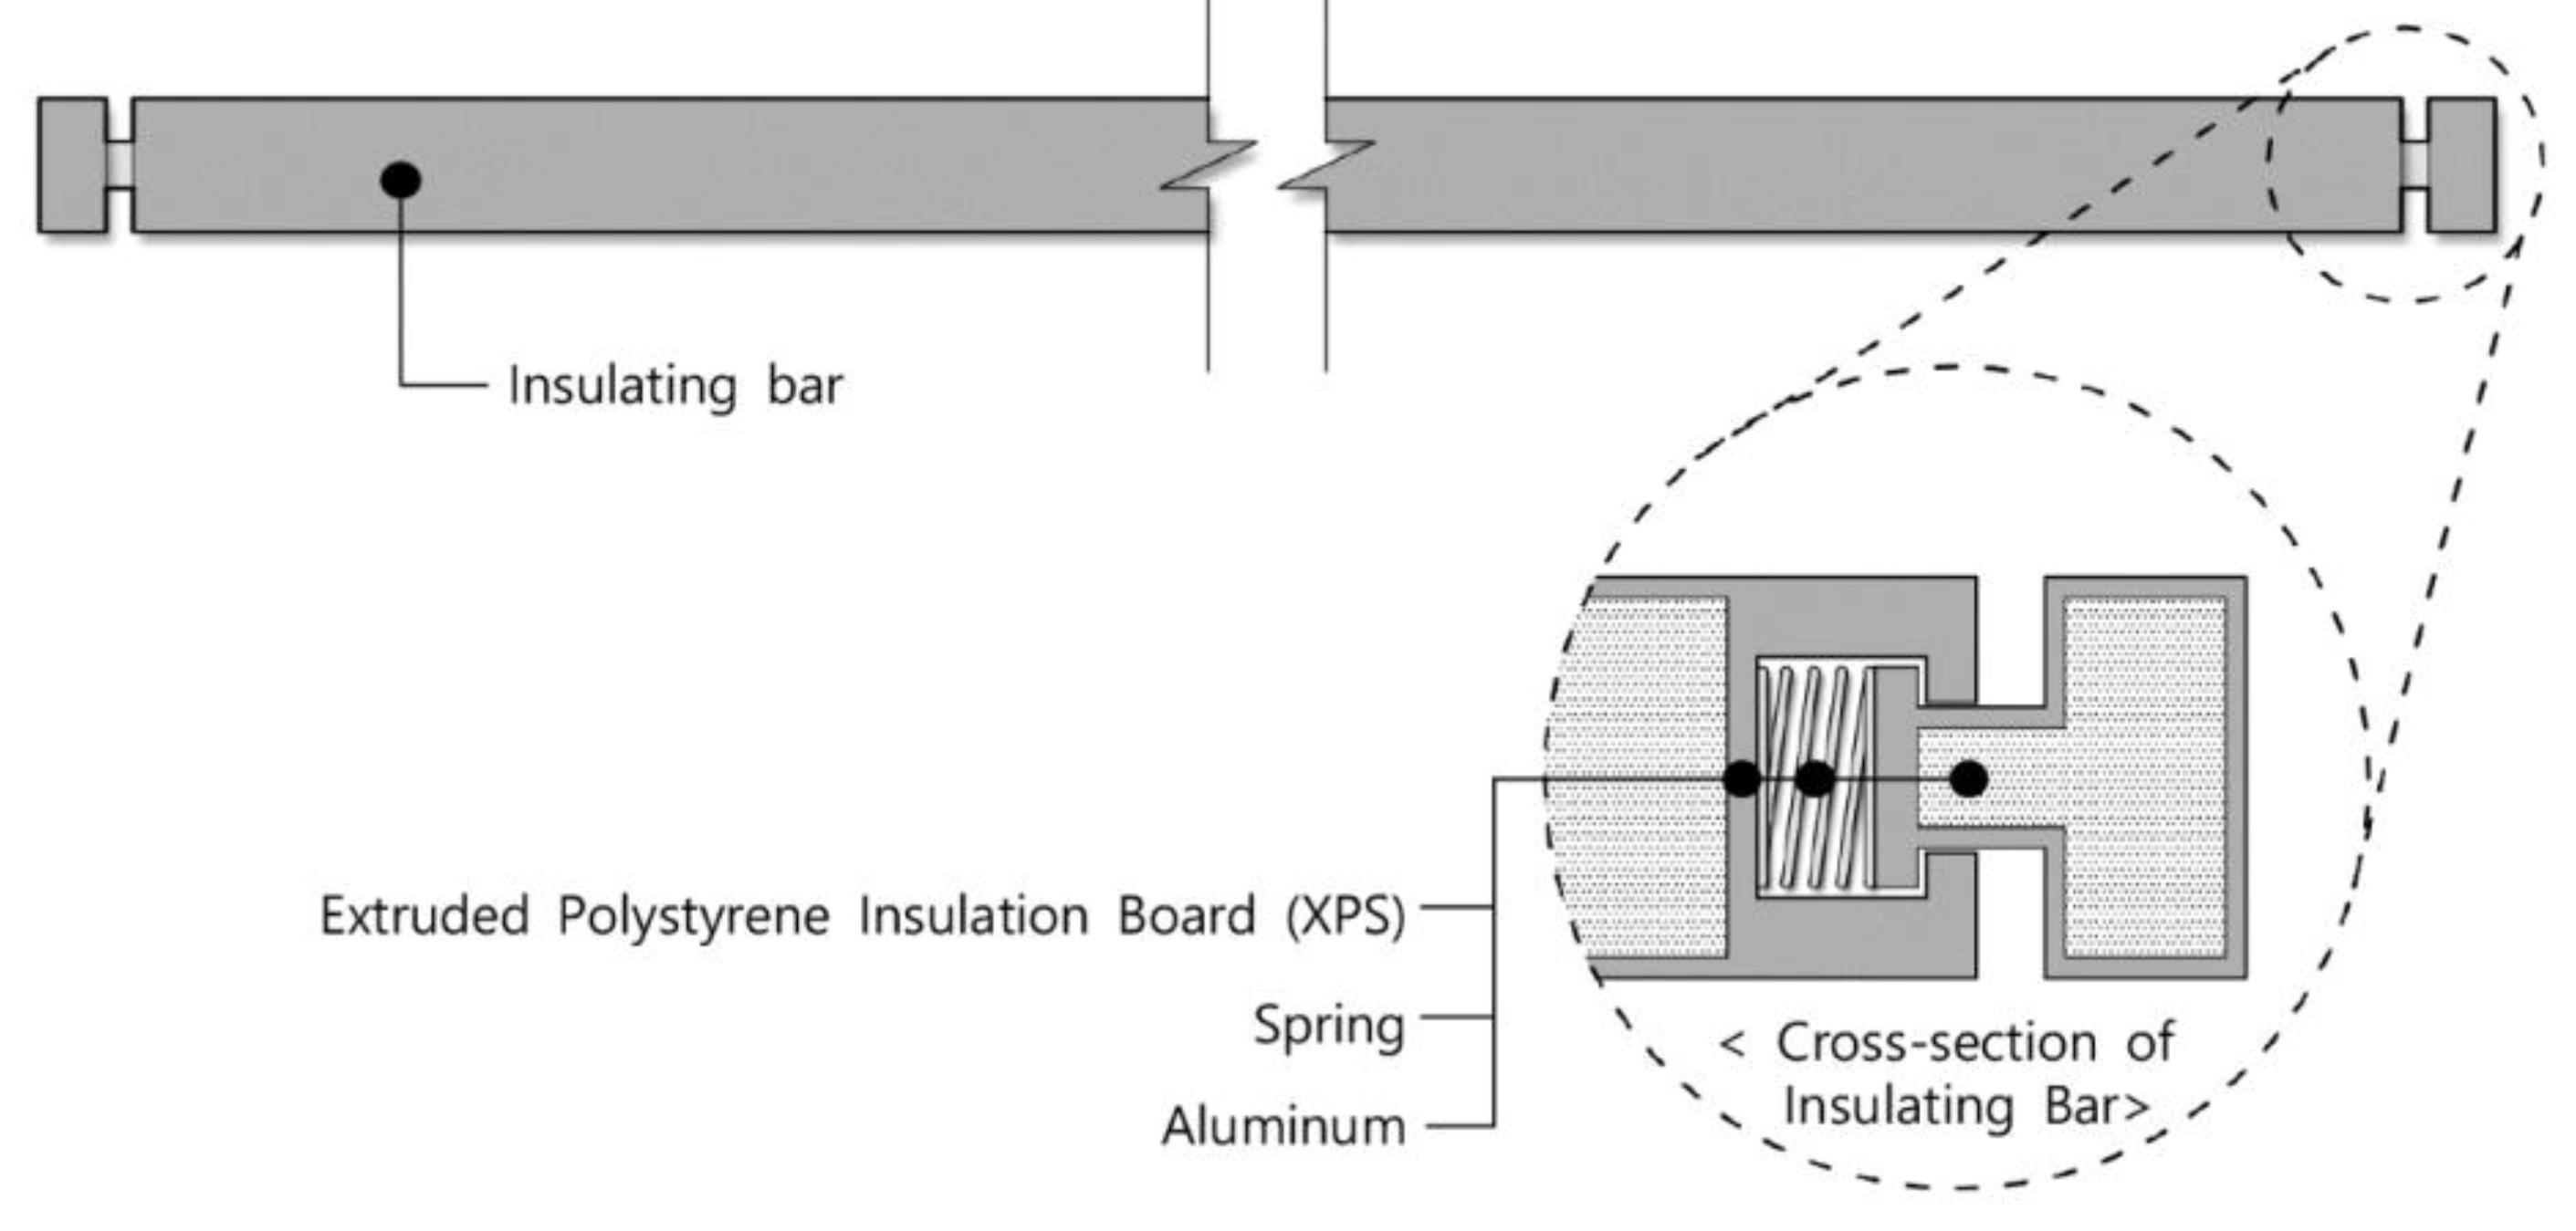
The proposed window-mounted air cap roller module shown in Figure 1, Figure 2, and Figure 3 allows a user to roll the air cap sheets up or down to vary the window area to which the air caps are attached in accordance with the desired view and illumination through the window. However, decreasing this area may reduce the insulation performance of the windows, resulting in an increase in the building’s energy consumption. To overcome this limitation, the window-mounted air cap roller module was attached to the window frame. This was based on the findings of a previous report, which indicated that the insulation performance of a window was improved more when the air caps were attached to the window frame than when they were attached to the glass surface of the window [43]. Velcro™ tape and dual-sided insulation tape were used to attach the air caps to the window frame to improve the insulation and allow easy attachment and detachment of the air cap sheet. An aluminum insulating rod, prepared by insulating treatment, was attached to the lower part of the window-mounted air cap roller module to allow an indoor occupant to easily adjust the air cap sheet. The insulating rod was designed for insulation by using an extruded polystyrene (XPS) insulation board attached to the lower part of the window-mounted air cap roller module. Additionally, an insulation bar was inserted between the air cap sheet and the glass surface of the window to resolve the gap caused by the attachment of the air cap to the window frame. The aluminum insulation bar was prepared by inserting an extruded polystyrene insulation board into it for insulation and air-tightness. Springs were placed at both ends of the insulation bar for solid and convenient attachment to the inside of the window frame. A test bed of the proposed window-mounted air cap roller module was installed for the performance evaluation (shown in Figure 4).
2.2. Environment for Performance Evaluation
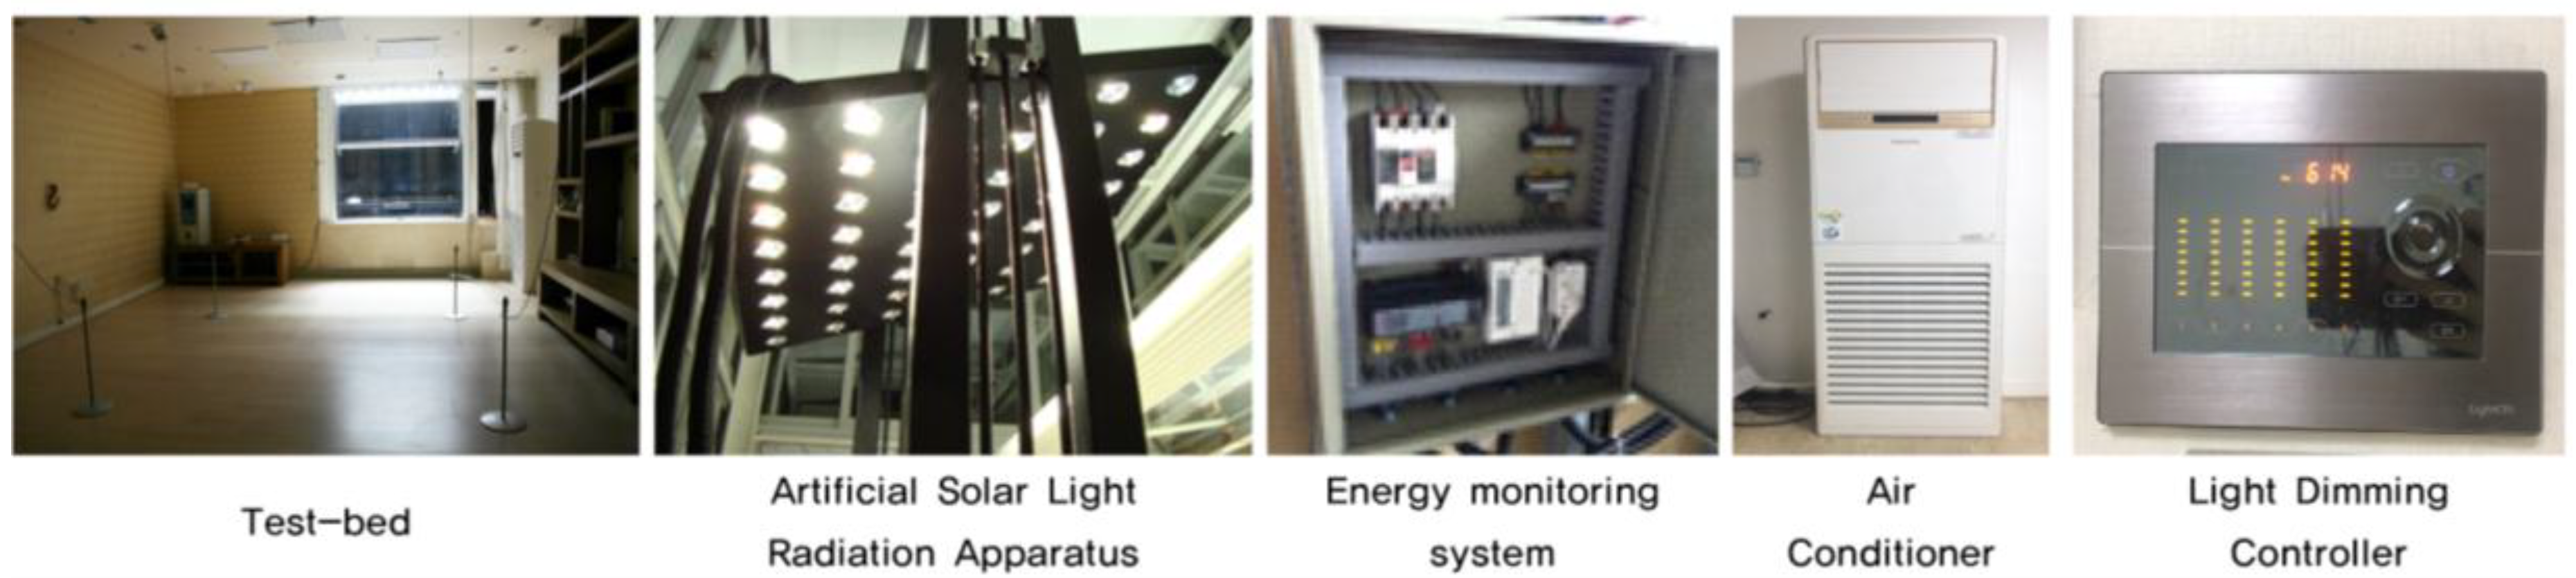
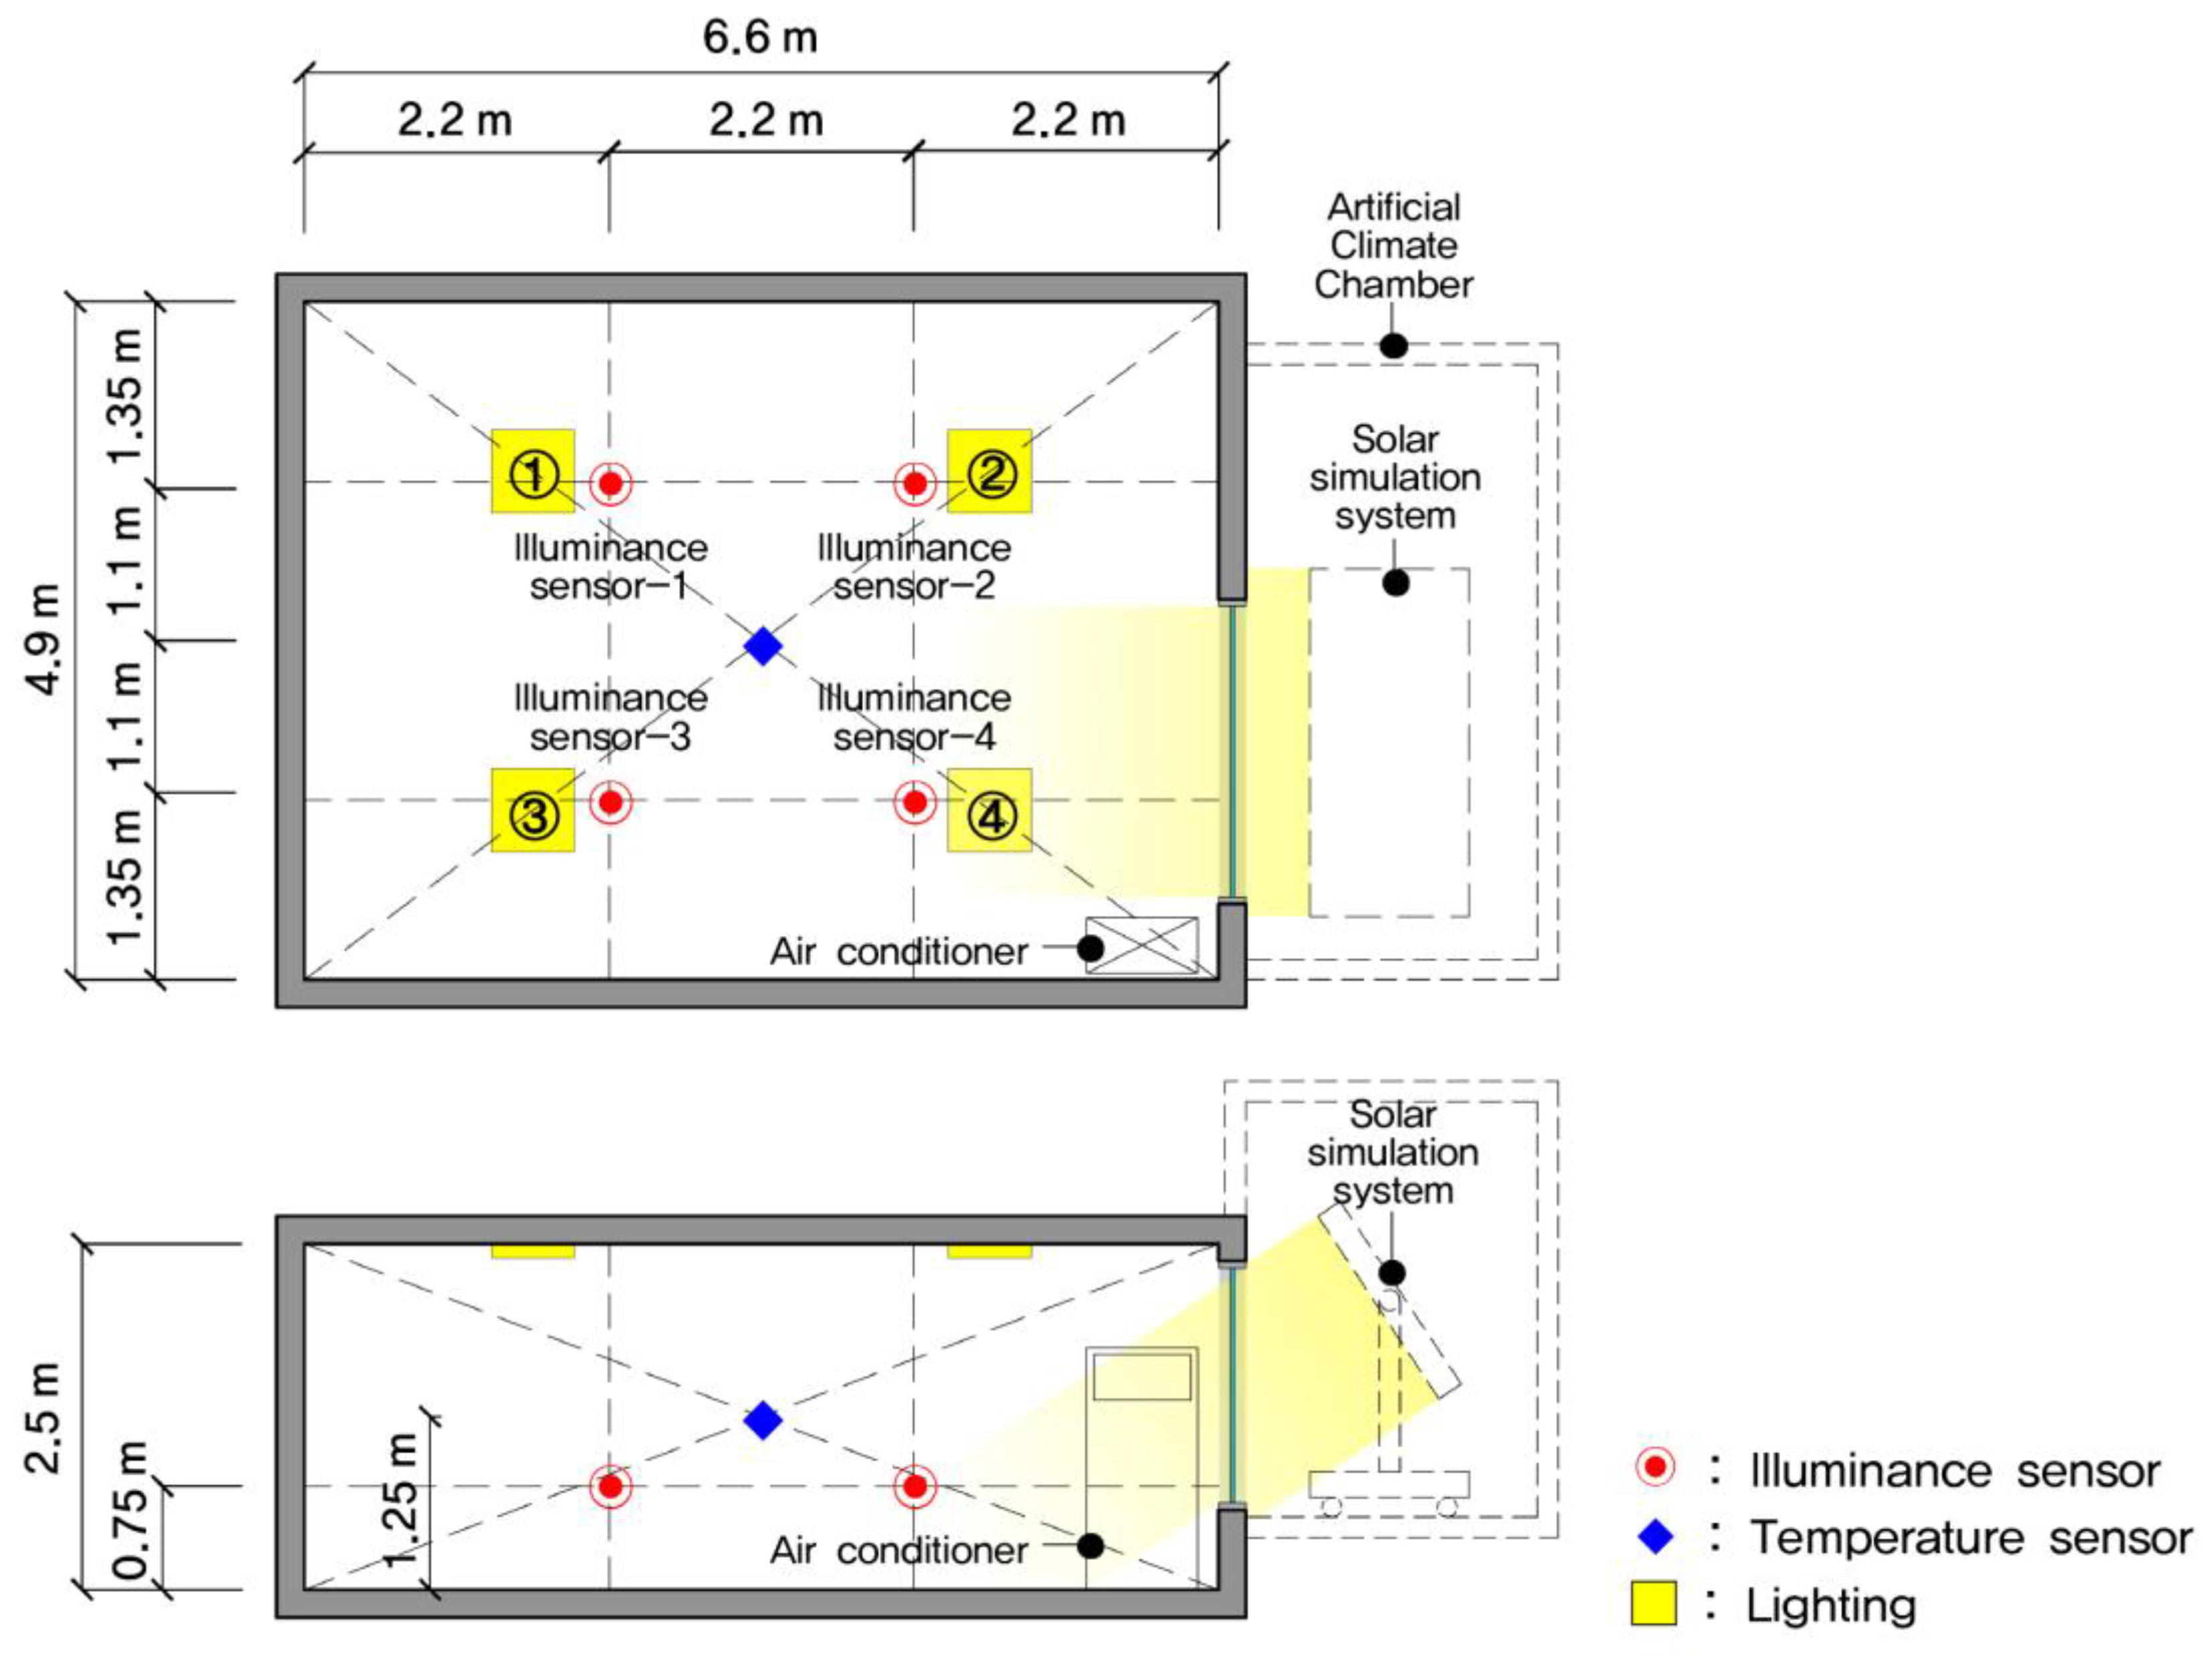
The developed full-scale test bed for performance evaluation of the window-mounted air cap roller module is detailed in Table 5 and illustrated in Figure 5. The test bed was 4.9 m wide, 2.5 m high, and 6.6 m long. The window to which the air caps were attached was 2.2 m wide, 1.8 m high, and included transparent double glazing. To form an external environment for the performance evaluation, an artificial climate chamber was installed outside the window to control the temperature. The external temperatures for the performance evaluation were determined to be −11.3 °C and 36.5 °C for winter and summer, respectively [52]. The artificial climate chamber included an artificial solar radiation apparatus to control the light intensity, height, and angle of the artificial light source to form various external environmental conditions. Because the artificial solar light radiation apparatus employed an artificial light source, the environmental conditions created for the performance evaluation were different from the actual conditions. However, the artificial light source satisfied the Grade A measurement homogeneity standards, according to the ASTM E927-85 international standard. This ensured that uniform external environmental conditions were maintained between the performance evaluation cases. Due to the characteristics of the artificial solar light radiation apparatus used in this study, the performance evaluation was performed only with the windows in question facing south.
Temperature and illumination sensors were installed as shown in Figure 6 to collect indoor environmental information. A temperature sensor was installed at the center of the indoor space, whereas four illumination sensors were installed at positions 2.2 and 4.4 m away from the window at a height of 0.75 m, in accordance with their optimal measuring distance [53].
As shown in Table 6, to undertake the performance evaluation in this study, air conditioning and lighting appliances were installed in the test bed, and automated control of the air conditioner and lighting device was also established. The air conditioner employed in this study allowed home network-based control, and the rated power for cooling and heating was 11,000 and 13,200 W, respectively. On/off control of the air conditioner to maintain the appropriate indoor temperature was performed automatically in coordination with the indoor temperature sensor. In the off mode, the air conditioner operated at minimum power without cooling or heating the indoor space but was never entirely turned off. For example, cooling of the indoor space was performed in summer when the indoor temperature was higher than 26 °C; however, when the indoor temperature was below 26 °C, the air conditioner operated at minimum power with only the fan running and did not perform cooling duty. Heating of the indoor space was performed in winter when the indoor temperature was lower than 20 °C; however, when the indoor temperature was below 20 °C, heating was not performed, and the air conditioner continued to operate at minimum power. An LED lighting device allowed control in eight levels of illumination. The position of the lighting device was determined based on a four-point method recommended by the Illuminating Engineering Society [49]. Illumination sensors 1, 2, 3, and 4 were connected to lights 1, 2, 3, and 4, respectively, to control the indoor illumination values. When the measured illumination value was below 500 lx, the lights were automatically brightened, beginning with the illumination sensor that showed the lowest illumination value, until an illumination of 500 lx was reached. For example, when an indoor illumination value of 400 lx was measured by illumination sensor 1, the light connected to that sensor was brightened from level 1 up to level 8, until the value reached 500 lx or higher. If the minimum indoor illumination value did not reach 500 lx even after the brightness control of light No. 1 to level 8, the brightness level of light No. 3, which was the light nearest to the illumination sensor, showed the lowest illumination value, and was sequentially elevated from level 1 to level 8 until the minimum indoor illumination value measured by the illumination sensors exceeded 500 lx. This brightness control was repeated until the minimum indoor illumination value exceeded 500 lx.
2.3. Method of Performance Evaluation
In this section, the performance evaluation method for the proposed window-mounted air cap roller is detailed. As shown in Table 7, the evaluation was conducted for six cases: (Case 1) air caps attached to the entire window surface; (Case 2) air caps attached from a height of 1.2 m, corresponding to eye level at a sitting position, to the top of the window; (Case 3) air caps attached from a height of 1.5 m, corresponding to eye level at a standing position, to the top of the window; (Case 4) air caps attached from a height of 1.8 m from the floor to the top of the window; (Case 5) air caps attached from a height of 2.1 m from the floor to the top of the window; and (Case 6) no air caps attached. The settings for Cases 4 and 5 were established by adjusting the settings of Cases 1, 2 and 3, which considered the eye level of building residents. In other words, the heights of the air caps in Cases 2, 3, 4, and 5 were adjusted in 0.3-m increments to make it possible to undertake performance evaluations according to the area of air cap coverage.
Because the lighting devices and air conditioner were automatically switched on and off to maintain the appropriate lighting and temperature levels, the power consumed by these devices was used as a performance indicator for each case. The thermal properties of the air cap sheets were dependent on the position of the internal air layers, thus limiting the calculation of thermal conductivity, heat transmission coefficient, and thermal resistance.
Furthermore, the power consumed by the lighting devices was calculated by setting the minimum illumination measured by the indoor illumination sensors to 500 lx. In addition, to evaluate the reduction of the energy consumption for cooling and heating in each case, the temperature sensor located at the center of the indoor space was connected to the air conditioner, which was automatically controlled to maintain the predetermined appropriate indoor temperature. In this study, the power consumed by the automatically controlled air conditioner was used as a quantitative performance evaluation indicator. However, the cooling and heating energy consumption was measured while performing dimming control of the lights to satisfy the appropriate indoor illumination standard.
The performance evaluation was limited to summer and winter, when air conditioners and heating are most used, between 10 a.m. and 3 p.m. The selected external illumination and temperature conditions for summer and winter are shown in Table 8 [52] and were simulated by varying the input solar radiation and artificial lighting.
3. Results and Discussion of Performance Evaluation
In contrast to Case 6, which did not have air cap attachments, Cases 1 through 5, all of which had air cap attachments, presented lower average indoor illumination. This was due to the reduced amount of natural light introduced into the indoor space by the air caps attached to the windows. In addition, increases in the air-cap coverage area reduced the amount of natural light being introduced indoors, resulting in lower average indoor illumination. It was also possible to confirm this through the indoor images of each case, as presented in Table 9. As shown in Table 10, the results indicated that increases in the air cap coverage area resulted in increases in energy consumption for indoor lighting purposes. For example, Cases 1 through 5 presented an increase in energy consumption between 4.3% and 17.8% during the summer season and an increase between 12.3% and 52.1% during the winter season compared with Case 6. To summarize the above, an increase in the air cap coverage area reduced the natural light volumes, which in turn increased the energy consumption required to maintain the appropriate indoor illumination levels. In regards to Cases 1 through 5, which had air cap attachments, an increase in energy consumption between 5.6% and 25.7% during the summer and winter seasons compared with Case 6 was needed to reach the appropriate 500 lx indoor illumination level. In light of this, these cases were considered inappropriate to reduce the energy consumption for lighting purposes.
The effects on the heating and cooling energy consumption of attaching the air cap roller module are presented in Table 11. The greatest reduction in the cooling and heating energy consumption occurred when the air caps were attached to the entire window surface (Case 1). However, the cooling and heating energy consumption was lower in all cases except Case 6, in which no air caps were attached. When the air caps were only attached to a part of the window surface (Cases 2, 3, 4, and 5), the cooling and heating energy consumption decreased by 2.0% to 21.9% for summer and by 8.3% to 27.5% for winter when compared with Case 6. In the summer simulation, the cooling energy consumption notably increased in Case 4, in which the air caps were attached from a height of 1.8 m above the floor to the top of the window. In the winter simulation, the heating energy consumption notably increased in Case 3, in which the air caps were attached from a height of 1500 mm above the floor to the top of the window. Therefore, the proposed window-mounted air cap roller module may effectively reduce the cooling and heating energy consumption even if the air cap coverage area is adjusted to permit viewing through the window and to allow light into the room. Additionally, the module enables an occupant to choose the level of viewing possible through the window and reduces the cooling and heating energy consumption, depending on the circumstances.
When considering only the reduction in total energy consumption, the best method for applying the window-mounted air cap roller module proposed in this paper is that of Case 1, in which air caps were attached to the entire window surface; however, that case did not allow viewing through the window. However, the energy consumed did decrease as the air cap coverage area was reduced, as shown in Figure 7. The energy consumption dramatically increased in Case 4 during the summer and in Case 3 during the winter. Therefore, considering the energy savings and viewing performance, the optimal height for the air cap module is 1.5 m. This is the height at which occupants can still see through the windows and energy consumption is significantly decreased.
4. Conclusions
A window-mounted air cap sheet roller module was proposed and evaluated to address the impairment of viewing caused by the application of air caps on windows while still reducing building energy consumption. The proposed module was first designed as an air cap attachment module that allowed the air cap sheet to be rolled up and secured with Velcro™ tape. An insulation bar was used to resolve the gap between the air caps and window glass surface caused by the attachment of the air caps to the window frame.
A performance evaluation of the proposed model was then completed using a full-scale test bed. Lighting energy consumption increased by 4.3% to 17.8% in summer and by 12.3% to 52.1% in winter compared with the case in which no air caps were attached; therefore, the use of air cap sheets is not appropriate for reducing the lighting energy consumption. Heating and cooling energy, however, were significantly decreased through the use of the module. The greatest reduction in heating and cooling energy usage was found when the air caps were attached to the entire window surface (Case 1). However, when the air caps were only attached to part of the window surface (Cases 2, 3, 4, and 5), the cooling and heating energy consumption decreased by 2.0% to 21.9% for the summer and by 8.3% to 27.5% for the winter compared with Case 6, indicating that the proposed window-mounted air cap roller module was effective. Cooling energy consumption notably increased during the summer in Case 4, in which the air caps were attached from a height of 1800 mm above the floor to the top of the window. Heating energy consumption notably increased during winter in Case 3, in which the air caps were attached from a height of 1.5 m above the floor to the top of the window.
Therefore, the air caps may be attached to the entire surface of a window to reduce the energy consumption but may also be effectively attached from the top of the window to a height of 1500 mm above the floor to allow viewing through the window, while still reducing the amount of energy consumed. Therefore, the window-mounted air cap roller module may enable a building occupant to choose the level of viewing secured through windows and reduce the cooling and heating energy consumption, depending on the circumstances.
The proposed window-mounted air cap roller module allowed air caps to be conveniently attached to a window while resolving the problem of the impairment of views caused by the attachment of air caps onto the entire window surface. However, the performance evaluation in this study was carried out in an artificial environment by controlling specific variables. Further studies may be needed to overcome this limitation by considering various variables, such as air cap dimensions, heat transmission coefficient, time lag, material properties, and the effectiveness of air cap applications under different climate characteristics. In addition, although this study was conducted to improve viewing through a window when air caps were attached, the view from an indoor space depending on various external environmental conditions was not analyzed. Therefore, further studies may also be needed to analyze the views through windows from an indoor space.
Author Contributions
H.L. developed main idea of the current study, performed and interpret the analysis, and wrote the manuscript. J.S. reviewed the paper. All authors have read and approved the final manuscript.
Acknowledgments
This work was supported by the National Research Foundation of Korea (NRF) grant funded by the Korea government (MSIT) [grant numbers NRF-2018R1C1B4A01018660, NRF-2018R1A2B2007165].
Conflicts of Interest
The authors declare no conflict of interest.
References
- Sartori, I.; Napolitano, A.; Voss, K. Net zero energy buildings: A consistent definition framework. Energy Build. 2012, 48, 220–232. [Google Scholar] [CrossRef] [Green Version]
- Sesana, M.M.; Salvalai, G. Overview on life cycle methodologies and economic feasibility for nZEBs. Build. Environ. 2013, 67, 211–216. [Google Scholar] [CrossRef]
- AlFaris, F.; Juaidi, A.; Manzano-Agugliaro, F. Intelligent homes’ technologies to optimize the energy performance for the net zero energy home. Energy Build. 2017, 153, 262–274. [Google Scholar] [CrossRef]
- 2015 Renewable Energy Data Book. Available online: http://www.nrel.gov/docs/fy17osti/66591.pdf (accessed on 6 July 2018).
- Energy Information Administration (EIA). Annual Energy Review 2014. Available online: http://www.eia.gov/forecasts/archive/aeo14/ (accessed on 6 July 2018).
- Wang, Y.; Chen, Y.; Zhou, J. Dynamic modeling of the ventilated double skin façade in hot summer and cold winter zone in China. Build. Environ. 2016, 106, 365–377. [Google Scholar] [CrossRef]
- Panão, M.J.O.; Santos, C.A.; Mateus, N.M.; da Graça, G.C. Validation of a lumped RC model for thermal simulation of a double skin natural and mechanical ventilated test cell. Energy Build. 2016, 121, 92–103. [Google Scholar] [CrossRef]
- Hong, T.; Kim, J.; Lee, J.; Koo, C.; Park, H.S. Assessment of Seasonal Energy Efficiency Strategies of a Double Skin Façade in a Monsoon Climate Region. Energies 2013, 6, 4352–4376. [Google Scholar] [CrossRef] [Green Version]
- Parra, J.; Guardo, A.; Egusquiza, E.; Alavedra, P. Thermal Performance of Ventilated Double Skin Façades with Venetian Blinds. Energies 2015, 8, 4882–4898. [Google Scholar] [CrossRef] [Green Version]
- Năstase, G.; Şerban, A.; Dragomir, G.; Bolocan, S.; Brezeanu, A.I. Box window double skin façade. Steady state heat transfer model proposal for energetic audits. Energy Build. 2016, 112, 12–20. [Google Scholar] [CrossRef]
- Larsen, S.F.; Rengifo, L.; Filippín, C. Double skin glazed façades in sunny Mediterranean climates. Energy Build. 2015, 102, 18–31. [Google Scholar] [CrossRef]
- Pomponi, F.; Piroozfar, P.A.; Southall, R.; Ashton, P.; Farr, E.R. Life cycle energy and carbon assessment of double skin façades for office refurbishments. Energy Build. 2015, 109, 143–156. [Google Scholar] [CrossRef] [Green Version]
- Kim, G.; Schaefer, L.; Kim, J.T. Development of a double-skin facade for sustainable renovation of old residential buildings. Indoor Built Environ. 2013, 22, 180–190. [Google Scholar] [CrossRef]
- Ni, Z.; Lu, S.; Peng, L. Experimental study on fire performance of double-skin glass facades. J. Fire Sci. 2012, 30, 457–472. [Google Scholar] [CrossRef]
- Kim, D.W.; Park, C.S. Difficulties and limitations in performance simulation of a double skin façade with EnergyPlus. Energy Build. 2011, 43, 3635–3645. [Google Scholar] [CrossRef]
- Liu, C.; Wu, Y.; Zhu, Y.; Li, D.; Ma, L. Experimental investigation of optical and thermal performance of a PCM-glazed unit for building applications. Energy Build. 2018, 158, 794–800. [Google Scholar] [CrossRef]
- Reddy, K.S.; Mudgal, V.; Mallick, T.K. Thermal Performance Analysis of Multi-Phase Change Material Layer-Integrated Building Roofs for Energy Efficiency in Built-Environment. Energies 2017, 10, 1367. [Google Scholar] [CrossRef]
- Zhang, Y.; Cui, H.; Tang, W.; Sang, G.; Wu, H. Effect of Summer Ventilation on the Thermal Performance and Energy Efficiency of Buildings Utilizing Phase Change Materials. Energies 2017, 10, 1214. [Google Scholar] [CrossRef]
- Stamatiadou, M.E.; Katsourinis, D.I.; Founti, M.A. Computational assessment of a full-scale Mediterranean building incorporating wallboards with phase change materials. Indoor Built Environ. 2017, 26, 1429–1443. [Google Scholar] [CrossRef]
- Mazzeo, D.; Oliveti, G.; Arcuri, N. A Method for Thermal Dimensioning and for Energy Behavior Evaluation of a Building Envelope PCM Layer by Using the Characteristic Days. Energies 2017, 10, 659. [Google Scholar] [CrossRef]
- Zhong, K.; Li, S.; Sun, G.; Li, S.; Zhang, X. Simulation study on dynamic heat transfer performance of PCM-filled glass window with different thermophysical parameters of phase change material. Energy Build. 2015, 106, 87–95. [Google Scholar] [CrossRef]
- Kim, T.; Ahn, S.; Leigh, S.B. Energy consumption analysis of a residential building with phase change materials under various cooling and heating conditions. Indoor Built Environ. 2014, 23, 730–741. [Google Scholar] [CrossRef]
- Katsifaraki, A.; Bueno, B.; Kuhn, T.E. A daylight optimized simulation–based shading controller for venetian blinds. Energy Build. 2017, 126, 207–220. [Google Scholar] [CrossRef]
- Kim, S.H.; Shin, K.J.; Choi, B.E.; Jo, J.H.; Cho, S.; Cho, Y.H. A study on the variation of heating and cooling load according to the use of horizontal shading and venetian blinds in office buildings in Korea. Energies 2015, 8, 1487–1504. [Google Scholar] [CrossRef]
- Gunay, H.B.; O’Brien, W.; Beausoleil–Morrison, I.; Gilani, S. Development and implementation of an adaptive lighting and blinds control algorithm. Build. Environ. 2017, 113, 185–199. [Google Scholar] [CrossRef]
- Meerbeek, B.W.; de Bakker, C.; De Kort, Y.A.W.; Van Loenen, E.J.; Bergman, T. Automated blinds with light feedback to increase occupant satisfaction and energy saving. Build. Environ. 2016, 103, 70–85. [Google Scholar] [CrossRef]
- Khamporn, N.; Chaiyapinunt, S. Effect of installing a venetian blind to a glass window on human thermal comfort. Build. Environ. 2014, 82, 713–725. [Google Scholar] [CrossRef]
- Oleskowicz–Popiel, C.; Sobczak, M. Effect of the roller blinds on heat losses through a double–glazing window during heating season in Central Europe. Energy Build. 2014, 73, 48–59. [Google Scholar] [CrossRef]
- Clark, J.; Peeters, L.; Novoselac, A. Experimental study of convective heat transfer from windows with Venetian blinds. Build. Environ. 2013, 59, 690–700. [Google Scholar] [CrossRef]
- Sanati, L.; Utzinger, M. The effect of window shading design on occupant use of blinds and electric lighting. Build. Environ. 2013, 64, 67–76. [Google Scholar] [CrossRef]
- Cuevas, C.; Fissore, A.; Fonseca, N. Natural convection at an indoor glazing surface with different window blinds. Energy Build. 2010, 42, 1685–1691. [Google Scholar] [CrossRef]
- Dalal, R.; Naylor, D.; Roeleveld, D. A CFD study of convection in a double glazed window with an enclosed pleated blind. Energy Build. 2009, 41, 1256–1262. [Google Scholar] [CrossRef]
- Arce, P.; Castellón, C.; Castell, A.; Cabeza, L.F. Use of microencapsulated PCM in buildings and the effect of adding awnings. Energy Build. 2012, 44, 88–93. [Google Scholar] [CrossRef]
- Juanicó, L.E. A new design of configurable solar awning for managing cooling and heating loads. Energy Build. 2009, 41, 1381–1385. [Google Scholar] [CrossRef]
- Lee, H.; Jang, H.I.; Seo, J. A preliminary study on the performance of an awning system with a built–in light shelf. Build. Environ. 2018, 131, 255–263. [Google Scholar] [CrossRef]
- Lee, H.; Jeon, G.; Seo, J.; Kim, Y. Daylighting performance improvement of a light–shelf using diffused reflection. Indoor Built Environ. 2017, 26, 717–726. [Google Scholar] [CrossRef]
- Lee, H.; Gim, S.H.; Seo, J.; Kim, Y. Study on movable light–shelf system with location–awareness technology for lighting energy saving. Indoor Built Environ. 2017, 26, 717–726. [Google Scholar] [CrossRef]
- Lee, H.; Kim, K.; Seo, J.; Kim, Y. Effectiveness of a perforated light shelf for energy saving. Energy Build. 2017, 144, 144–151. [Google Scholar] [CrossRef]
- Warrier, G.A.; Raphael, B. Performance evaluation of light shelves. Energy Build. 2017, 140, 19–27. [Google Scholar] [CrossRef]
- Lim, Y.W.; Heng, C.Y.S. Dynamic internal light shelf for tropical daylighting in high–rise office buildings. Build. Environ. 2016, 106, 155–166. [Google Scholar] [CrossRef]
- Meresi, A. Evaluating daylight performance of light shelves combined with external blinds in south–facing classrooms in Athens, Greece. Energy Build. 2016, 116, 190–205. [Google Scholar] [CrossRef]
- Sealed Air. Available online: http://www.sealedairprotects.com/eu/en/products/bubblewrap/bubble_wrap.aspx (accessed on 6 July 2018).
- Lee, S.J.; Kim, J.G.; Kim, J.; Jeong, H.; Lee, J.S.; Jang, C.Y. A Comparative Evaluation on the Thermal Insulation Performance of Windows according to the Temporary Improvement Method. KIEAE J. 2015, 15, 77–82. [Google Scholar] [CrossRef]
- Hwang, J.; Jeong, A.H.; Jeon, B.H.; Ahn, Y.C. Thermal Performance Evaluation of the Window Systems with Air–bubble Sheets. Korean J. Air–Cond. Refrigeration Eng. 2015, 27, 463–467. [Google Scholar] [CrossRef]
- Lee, H.; Kim, S.; Seo, J. Development of a detachable window aircap module for energy saving. Energy Build. 2018, 158, 1640–1647. [Google Scholar] [CrossRef]
- Back, S.K.; Lee, S.H. A Study on Lighting Design and Illumination and Luminance of in Advanced type Control Room by the Standard of Ergonomics–Focused on Ling Ao Phase II NPP MCR Environmental Design in Guangdong, China. J. Ergon. Soc. Korea 2008, 27, 73–82. [Google Scholar] [CrossRef]
- ANSI/ASHRAE 55-2013. Thermal Environmental Conditions for Human Occupancy; American Society of Heating, Refrigerating and Air–Conditioning Engineers Inc.: Atlanta, GA, USA, 2013. [Google Scholar]
- ISO 7730: 2005 (E). Ergonomics of the Thermal Environment–Analytical Determination and Interpretation of Thermal Comfort using Calculation of the PMV and PPD Indices and Local Thermal Comfort Criteria; International Organization for Standardization: Geneva, Switzerland, 2005. [Google Scholar]
- Illuminating Engineering Society. The Lighting Handbook; Illuminating Engineering Society (IES): New York, NY, USA, 2011. [Google Scholar]
- ISZ 9110:2010. Recommended Levels of Illumination; Japanese Industrial Standards Committee: Tokyo, Japan, 2010. [Google Scholar]
- KSA 3011–2013. Recommended Levels of Illumination; The Korean Standards Association (KSA): Seoul, Korea, 1998. [Google Scholar]
- Jeon, G.M.; Lee, H.W.; Seo, J.H.; Kim, Y.S. Performance evaluation of light–shelf based on light environment and air conditioner environment. KIEAE J. 2016, 16, 47–55. [Google Scholar] [CrossRef]
- Jung, B.K.; Choi, A.S. An experimental study of the optimum spatial characteristics and location of photosensor for daylight responsive dimming systems. J. Korean Inst. Illum. Electr. Install. Eng. 2003, 17, 8–14. [Google Scholar] [CrossRef]
Figure 1.
Control of the coverage area by the window-mounted air cap roller module.

Figure 2.
Control of the coverage area by the window-mounted air cap roller module (air cap sheet rolling).
Figure 2.
Control of the coverage area by the window-mounted air cap roller module (air cap sheet rolling).

Figure 3.
Configuration and function of the insulating bar included in the window-mounted air cap roller module.
Figure 3.
Configuration and function of the insulating bar included in the window-mounted air cap roller module.

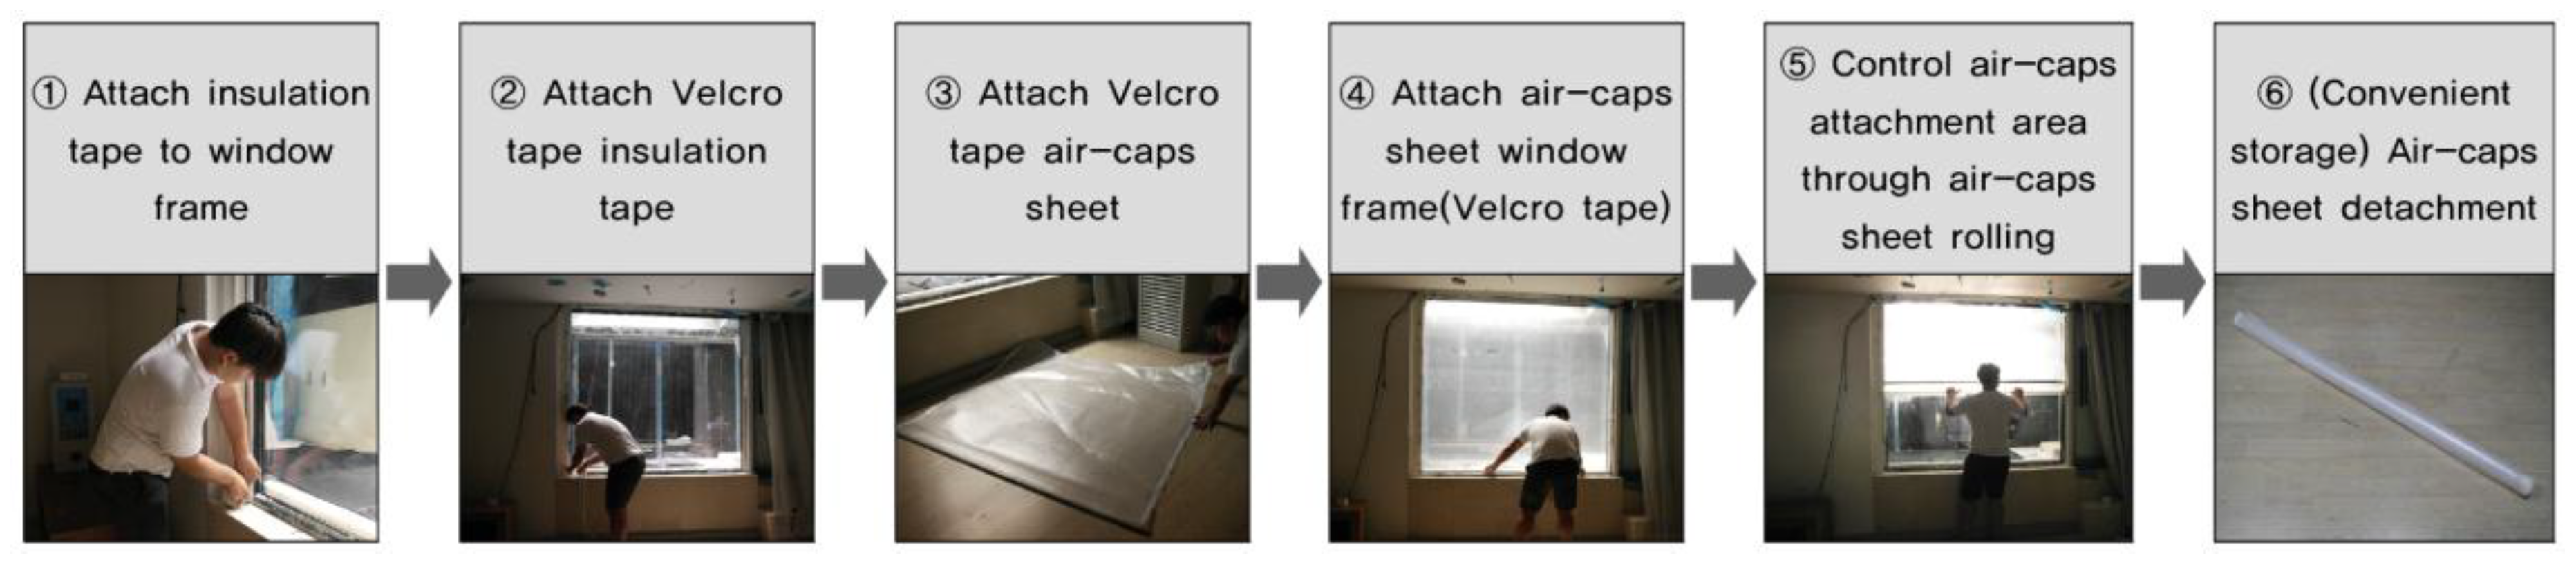
Figure 4.
Process of installing the window-mounted air cap roller module.

Figure 5.
Overview of test bed and measurement apparatus.

Figure 6.
Floor plan and sectional view of test bed.

Figure 7.
Evaluation of performance in terms of reducing energy consumption by lighting device and air conditioner for each case.
Figure 7.
Evaluation of performance in terms of reducing energy consumption by lighting device and air conditioner for each case.


Table 1.
Air cap specifications provided by the manufacturer.
| Type | D (Diameter of Air Layer) | t (Thickness of Coating Layer) | Air Cap Section |
|---|---|---|---|
| 1 | 10 mm | 0.2 mm |  |
| 2 | 0.4 mm | ||
| 3 | 20 mm | 0.6 mm | |
| 4 | 25 mm | ||
| 5 | 30 mm |
Table 2.
Previous studies on air caps for the improvement of window insulation performance.
| Author (year) | Materials for Attachment of Air Caps | Parts to Which Air Caps are Attached | Area of Window to Which Air Caps are Attached | Consideration of Views Through Windows Depending on Air Cap Coverage |
|---|---|---|---|---|
| Lee et al. (2015) [43] | Water or double-sided adhesive tape | Glass surface or window frame | Entire surface | Not considered |
| Hwang et al. (2015) [44] | Water | Glass surface of window | Entire surface | Not considered |
| Lee et al. (2017) [45] | Linear magnet and insulation tape | Window frame | Entire surface | Not considered |
Table 3.
Appropriate indoor temperature standard.
| Standard | Summer (°C) | Winter (°C) |
|---|---|---|
| ANSI/ASHRAE Standard 55-2013 (USA) [47] | 23.0–26.0 | 20.0–23.5 |
| ISO Standard (Europe) [48] | 23.0–26.0 | 20.0–24.0 |
Table 4.
Appropriate indoor illumination standard.
| Reference Standards | Task Grade | Minimum Allowed Illumination (lx) | Standard Allowed Illumination (lx) | Maximum Allowed Illumination (lx) |
|---|---|---|---|---|
| IES (USA) [49] | Normal | 500 | 750 | 1000 |
| Simple | 200 | 300 | 500 | |
| JIS Z 9110 (Japan) [50] | Normal | 300 | 500 | 600 |
| Simple | 150 | 200 | 300 | |
| KS A 3011 (Republic of Korea) [51] | Normal | 300 | 400 | 600 |
| Simple | 150 | 200 | 300 |
Table 5.
Overview of test bed.
| Room size, Material | |
| Size: | 4.9 m (W) × 6.6 m (D) × 2.5 m (ceiling height) |
| Reflectability: | Ceiling (86%), wall (46%), floor (25%) |
| Material: | Insulation panel (thickness: 0.1 m) |
| Window size, Material | |
| Size: | 1.9 m (W) × 1.7 m (H) |
| Type: | Double glazed 24 mm (6CL + 12A + 6CL) |
| Thermal transmittance: | 2.83 W/m2K (summer), 2.69 W/m2K (winter) |
| Transmissivity: | 80% |
| Artificial solar Light Radiation Apparatus | |
| Precision of solar light radiation: | Grade A (according to ASTM E927-85) |
| Range of illumination: | 0–80,000 lx |
| Directions: | South aspect |
| Temperature Sensor | |
| Sensing element: | silicon photo sensor, with filter |
| Detection range: | 0–200,000 lx |
| Precision: | ±3% |
| Illuminance Sensor | |
| Sensing element: | NTC 10 KΩ; AN type |
| Detection range: | −40 °C to +90 °C |
| Precision: | ±0.3 °C |
| Energy Monitoring System | |
| Measurement capacity: | Single phase (220 V, 1–50 A) |
| Measurement items: | Power/voltage/current, real-time, and accumulated amount |
| Error rate: | within 2.0% |
Table 6.
Specifications of the lighting devices and air conditioner.
| Device | Specifications |
|---|---|
| Lighting | Type: 8-level dimming (LED type) Electricity consumption according to the level of dimming lighting control: lv 1 (12 W), lv 2 (18 W), lv 3 (22 W), lv 4 (28 W), lv 5 (34 W), lv 6 (39 W), lv 7 (43 W), lv 8 (51 W) heating temperature: 35 °C |
| Air conditioner | Model: AP-SM302 (EHP) Heating/cooling capacity: 13,200 W/11,000 W Heating/cooling energy consumption: 3.90 kW/3.90 kW COP: heating: 3.38/cooling: 2.82 |
Table 7.
Cases for the performance evaluation.
| Case | Ratio of Air Cap Coverage Area to Entire Window Area (%) | Case | Ratio of Air Cap Coverage Area to Entire Window Area (%) |
|---|---|---|---|
 (Case 1) Air caps covering the entire window surface | 100 |  (Case 4) Air caps attached from a height of 1.8 m to the top of the window | 27.5 |
 (Case 2) Air caps attached from a height of 1.2 m to the top of the window | 73 |  (Case 5) Air caps attached from a height of 2.1 m to the top of the window | 9.1 |
 (Case 3) Air caps attached from a height of 1.5 m to the top of the window | 46 |  (Case 6) No air caps attached | 0 |
Table 8.
External illumination, solar radiation, and outdoor temperature conditions in each time zone.
Table 8.
External illumination, solar radiation, and outdoor temperature conditions in each time zone.
| Season | Time Zone | |||
|---|---|---|---|---|
| 10:00–12:00 | 12:00–13:00 | 12:00–14:00 | ||
| Summer | External illumination | 70,000(±100) lx | 80,000(±100) lx | 70,000(±100) lx |
| Solar radiation | 429(±2) W/m2 | 503(±2) W/m2 | 429(±2) W/m2 | |
| Altitude | 76.5° | |||
| External temperature | 34(±1) °C | |||
| Winter | External illumination | 20,000(±100) lx | 30,000(±100) lx | 20,000(±100) lx |
| Solar radiation | 283(±2) W/m2 | 340(±2) W/m2 | 283(±2) W/m2 | |
| Altitude | 29.5° | |||
| External temperature | −10(±1) °C | |||
Table 9.
Images of individual cases and sum of electrical power consumption for each case.
| Case | Indoor Images for Each Case | Sum of Electrical Power Consumption by Lighting Devices (kWh) | Case | Indoor Images for Each Case | Sum of Electrical Power Consumption by Lighting Devices (kWh) | ||
|---|---|---|---|---|---|---|---|
| Summer (External Illuminance: 80,000 lx) | Winter (External Illuminance: 30,000 lx) | Summer (External Illuminance: 80,000 lx) | Winter (External Illuminance: 30,000 lx) | ||||
| 1 |  |  | 0.834 | 4 |  |  | 0.703 |
| 2 |  |  | 0.798 | 5 |  |  | 0.657 |
| 3 |  |  | 0.731 | 6 |  |  | 0.620 |
Table 10.
Lighting device control and power consumption for maintaining appropriate indoor illumination.
Table 10.
Lighting device control and power consumption for maintaining appropriate indoor illumination.
| Summer | |||||
| Case | External Illuminance (lx) | Illumination (lx) | Lighting control: light number (dimming level) | Power Consumption (kWh) | |
| Min. | Ave. | ||||
| 1 | 80,000 | 76.0 | 285.1 | 1(8) + 3(8) + 2(3) | 0.642 |
| 70,000 | 66.1 | 188.2 | 1(8) + 3(8) + 2(5) | ||
| 2 | 80,000 | 78.8 | 311.3 | 1(8) + 3(8) + 2(3) | 0.630 |
| 70,000 | 68.4 | 202.2 | 1(8) + 3(8) + 2(4) | ||
| 3 | 80,000 | 82.2 | 339.9 | 1(8) + 3(8) + 2(2) | 0.591 |
| 70,000 | 70.2 | 224.4 | 1(8) + 3(8) + 2(3) | ||
| 4 | 80,000 | 84.7 | 483.2 | 1(8) + 3(8) + 2(1) | 0.589 |
| 70,000 | 73.1 | 243.7 | 1(8) + 3(8) + 2(3) | ||
| 5 | 80,000 | 87.5 | 509.2 | 1(8) + 3(8) | 0.552 |
| 70,000 | 74.9 | 251.9 | 1(8) + 3(8) + 2(3) | ||
| 6 | 80,000 | 90.4 | 559.2 | 1(8) + 3(7) | 0.528 |
| 70,000 | 76.1 | 280.2 | 1(8) + 3(8) + 2(3) | ||
| Winter | |||||
| Case | External Illuminance (lx) | Illumination (lx) | Lighting control: light number (dimming level) | Power Consumption (kWh) | |
| Min. | Ave. | ||||
| 1 | 30,000 | 386.2 | 5130.4 | 1(3) | 0.192 |
| 20,000 | 270.3 | 3727.5 | 1(8) + 3(1) | ||
| 2 | 30,000 | 391.5 | 5257.1 | 1(3) | 0.168 |
| 20,000 | 274.1 | 3800.2 | 1(8) | ||
| 3 | 30,000 | 401.7 | 5391.8 | 1(2) | 0.140 |
| 20,000 | 289.4 | 4065.9 | 1(7) | ||
| 4 | 30,000 | 407.2 | 5474.5 | 1(1) | 0.114 |
| 20,000 | 284.5 | 4140.3 | 1(6) | ||
| 5 | 30,000 | 409.6 | 5680.5 | 1(1) | 0.105 |
| 20,000 | 293.1 | 4546.2 | 1(5) | ||
| 6 | 30,000 | 415.8 | 5800.1 | 1(1) | 0.092 |
| 20,000 | 292.2 | 4695.6 | 1(4) | ||
Table 11.
Air conditioner power consumption required to maintain appropriate indoor temperature for each case.
Table 11.
Air conditioner power consumption required to maintain appropriate indoor temperature for each case.
| Summer | ||||||
| Electrical Power Consumption | Case 1 | Case 2 | Case 3 | Case 4 | Case 5 | Case 6 |
| Power consumed by air conditioner (kWh) | 1.955 | 2.072 | 2.129 | 2.483 | 2.599 | 2.653 |
| Reduction of energy consumption in comparison with the case without air cap attachment (Case 6) | 26.3% | 21.9% | 19.8% | 6.4% | 2.0% | - |
| Winter | ||||||
| Electrical Power Consumption | Case 1 | Case 2 | Case 3 | Case 4 | Case 5 | Case 6 |
| Power consumed by air conditioner (kWh) | 2.595 | 2.665 | 3.095 | 3.195 | 3.370 | 3.676 |
| Reduction of energy consumption in comparison with the case without air cap attachment (Case 6) | 29.4% | 27.5% | 15.8% | 13.1% | 8.3% | - |
© 2018 by the authors. Licensee MDPI, Basel, Switzerland. This article is an open access article distributed under the terms and conditions of the Creative Commons Attribution (CC BY) license (http://creativecommons.org/licenses/by/4.0/).
Share and Cite
MDPI and ACS Style
Lee, H.; Seo, J. Development of Window-Mounted Air Cap Roller Module. Energies 2018, 11, 1909. https://doi.org/10.3390/en11071909
AMA Style
Lee H, Seo J. Development of Window-Mounted Air Cap Roller Module. Energies. 2018; 11(7):1909. https://doi.org/10.3390/en11071909
Chicago/Turabian StyleLee, Heangwoo, and Janghoo Seo. 2018. "Development of Window-Mounted Air Cap Roller Module" Energies 11, no. 7: 1909. https://doi.org/10.3390/en11071909
Note that from the first issue of 2016, this journal uses article numbers instead of page numbers. See further details here.