1. Introduction
Sustainability addresses environmental and socioeconomic issues affecting current and future generations [
1,
2,
3]. It is a way to understand the world as a complex interaction between economic, social, environmental, and political systems. It is also an ethical or normative view of the world that urges us to embrace a holistic view of what a good society should be [
4,
5]. From an ethical perspective, the information on our planet’s situation is truly worrying. Systemic stress is characterized by the exponential growth of key indicators, such as population growth, CO
2 emissions into the atmosphere, and an increase in the consumption of energy, water, minerals, and natural resources [
6]. Due to the increasing concern over these environmental problems, the principles of circular economy (CE) are becoming stronger every year, exerting increasing pressure on decision makers [
7,
8,
9]. In this scenario, engineers are gradually moving from the classical perspective of “manufacture-use-throw” to a circular economy engineering, considering the after-life use of components and systems as technological nutrients [
10].
As an alternative, the circular economy refers to an industrial economy that is restorative and regenerative by intent and design [
7,
11]. It is intended to rely on renewable energy, minimize the use of energy, and remove the use of toxic chemicals and waste eradicated through careful design. The environment provides us with a base of both renewable and non-renewable sources of energy, which function as input for the economy [
12]. Hence, some interesting strategies integrating apparently far away areas of engineering have been proposed to enhance sustainability and energy savings from a circular economy-aimed perspective [
10,
13].
1.1. Biomass as Power Source
The Directive 2009/28/EC of the promotion of the use of energy from renewable sources is the roadmap of energy for 2050. This document establishes the use of renewable energy sources in the countries of the European Union, with the objective of a final gross consumption of renewable energy of 75% in 2050, reaching 97% in the future. According to the estimates of the European Union, there will be a reduction in the use of coal for the generation of electricity of 57–65% in 2030 and of 96–99% in 2050 [
14].
In this context of renovation, biomass can be defined as non-fossilized organic matter, resulting from spontaneous or induced biological processes [
15]. It includes the biodegradable fraction of agricultural products, waste and residues (including plant and animal substances), forestry, and related industries, as well as the biodegradable fraction of municipal and industrial waste. A significant generator of biomass is the olive mills industry. The province of Jaén (Andalusia, South of Spain) produces more than 20% of all olive oil worldwide and 50% of oil nationwide, with an agricultural area destined to olive cultivation of 78%.
According to Messineo et al. [
16], olive mill effluents (OME) could be used as feedstock to produce renewable energy. Thus, Jaén has a high potential to generate this kind of energy. OME is a suitable raw material to produce energy based on biomass and a stabilization line is foreseen in three stages for an energy chain based on OME. This would allow a virtuous cycle at the level of the mill or small groups of mills, making good use of waste while eliminating the problem of waste disposal. If the mills themselves produce the necessary energy, they reduce their environmental impact and link a process of circular economy that makes the olive oil sector highly sustainable. By producing the energy, itself, transport costs are minimized and, therefore, besides being sustainable, it is viable from a financial perspective. The high volume of production of olive oil, in turn, implies high volumes of OME, so that the mill, once it has covered its energy needs, obtains a surplus of energy that must be managed.
Since many small towns are involved in the subject, the energy generated by the olive cooperatives can serve as an “in situ” source of energy for essential municipal services, like public lighting, whose impact is remarkable [
17]. Thus, the cooperative gets compensation from the city and the city obtains cleaner and cheaper energy.
On the other hand, the affected populations will be incorporated into the economy as recipients of energy from renewable sources, integrating themselves within the process of circular economy related to the production of olive oil and energy. In addition, the decrease in energy costs can boost the processes of improving energy efficiency in public lighting, with the substitution of technologies that allow greater energy efficiency.
Thus, the goal of this work is to identify whether energy efficiency can be improved in rural populations of the province of Jaén by using biomass as an energy source to power its public lighting. To achieve this objective, we analyze the agro-industrial district of “La Loma” and the specific case of Baeza, a municipality located in the South of Spain, with relevant olive oil production.
Since the current context is characterized by a continuous design of new rules and policies to foster CE, new strategies must be developed to enable us to face the changes introduced in the regulatory framework, to generate conservative management of energy, to be sustainable and respectful of our environment, to be competitive, and, finally, to survive. This scenario requires new energy efficient models that answer to these demands. We focus on the evaluation of public lighting efficiency, the reduction of CO2 emissions, and the use of biomass in agricultural districts.
1.2. Agro-Energy Districts
The model of agro-industrial districts [
18] implies a flexible specialization formula based on the territorial articulation of small and medium enterprises in a rural environment in transformation and oriented towards the development of agri-food based industries capable of generating greater shared value. This shared value model, theorized by Porter and Kramer [
19], implies a concept of sustainability based on growth with the environment and distributed intelligence capable of harmonizing local demands with ecosystem services. In these districts, there are experiences of both competition and cooperation between companies, mostly small to medium-sized.
The agro-energy district is based on the promotion of local energy projects. It relies on models of distributed energy generation from biomass from the agricultural sector that supports the agro-industrial district [
20]. These energy production systems are much more sustainable than conventional or centralized ones, and, above all, much more efficient from economic, social, and environmental points of view. These systems contribute to providing greater energy autonomy to local productive systems, contributing to the circular economy model and respect for ecosystems.
In this context, the use of local biomass as a fuel to produce energy contributes to sustainability through different means, but mainly by the reduction of greenhouse gases and use of waste, that can have a great environmental and economic impact, especially for the generation of pests and deterioration of natural spaces. In particular, the opportunities for Spain and for the whole of the European Union are evident [
21].
The application of CE to agro-industrial districts could report both economic and environmental benefits. The CE-based engineering attempts to reduce pollution and environmental impact and increase recycling by reusing existing resources. Thus, the production system regenerates the inputs used, trying to reduce the negative externalities of the process. It is intended to rely on renewable energy, minimizing waste by using it.
The materials used can have both types of flows [
11]—biological, when materials are designed to re-enter the biosphere, and technical, because they are designed to run with minimal loss of quality. Biological nutrients are materials that can be renewed without human processing. This resource must be transformed and reintegrated into the biosphere. In the CE-oriented recycling, a biological nutrient is performed by various biochemical processes, such as extracting all possible resources using biomass conversion, anaerobic digestion, in which organic material removes microorganisms to produce biogas, composting, soil restoration, and agriculture.
2. Materials and Method
The energy potential of the region where the case-study is carried out and the current possibilities of the public lighting, as well as the methodology used, are analyzed in the materials and method to obtain the results presented in this research.
2.1. Regional and Particular Energy Potential
According to the Andalusia Govern, it has been estimated that all agro-industries in the olive grove sector in Andalusia produce 277,063 tons of oil-bone annually (with an average humidity of 13%), 432,984 tons of leaf (37% humidity), and 985,552 tons of orujillo (10% humidity) [
20,
21].
The energy potential derived from these by-products amounts to 567,702 tons per year, representing 2.8% of the total primary energy consumption of the region. Regarding this energy potential, 87.6% (497,440 tons per year) is not self-consumed in the same sector and, thus, it is available for other uses. [
22].
Expressed in other terms, the estimated amount is equivalent to an electrical production of 1425.7 GWh per year [
22], which represents the domestic consumption of a population of 922,919 people. The replacement of fossil fuel energy by the one generated from biomass would amount to a reduction of 530,349 tons of CO
2-eq per year, with 1.2% of the total emissions of Andalusia being 41,279,000 ton of CO
2.
The district of La Loma, located in Baeza (Province of Jaén, Andalusia, Spain), includes a total of 21 municipalities and has a cultivation area of 172,626 Ha. It is an area of maximum potentiality of biomass. The annual rainfall rates are between 150–200 mm per year, and irrigation is used in the areas of Úbeda and Baeza. Due to these climatic conditions, it is preferable to carry out biennial pruning. In this aspect, we know that the tons of biomass obtained from olive pruning, not including the leaf, varies according to the olive grove. In the case of irrigation, the amount of biomass obtained reaches 2.5 tons per hectare of crop [
21].
Bearing in mind that the area of Úbeda and Baeza has a high cultivation surface, which is irrigated because the amount of biomass obtained per hectare is higher than in dry land and its climatic conditions and cultivation factors, it has maximum potential for biomass from olive pruning. In this area, a total of 215,782 tons of biomass can be obtained each year. To know the amount of heating pellet that could be obtained from the biomass available in the area, simply subtract the amount corresponding to the humidity of the said biomass [
16]. This information reflects the potential in energy terms of this region.
2.2. Public Lighting of Baeza
Public lighting is an essential element to grant both real and perceived safety [
23], that is, accurate public lighting will enhance citizen well-being and social sustainability.
Baeza has an approximate population of 16,000 people and 4373 points of light have been inventoried. The main technical characteristics of the installations are shown in
Table 1.
Table 1 shows the data of the public lighting installation in Baeza (Province of Jaén, Andalusia, Spain) for a daily work of 12 h and its economic and environmental impact. The estimation is 0.34 kg/CO
2 per kWh, according to the Spanish Electrical Network [
24]. The cost of kWh was calculated according to the information supplied by the town hall of Baeza and Ruiviejo [
25], obtained from the real cost of the energy.
In 2014, the most commonly installed technology in lighting installations was a high pressure sodium lamp (HPS), which has completely displaced the old equivalent mercury vapor luminaries. The latter have been reduced to a large extent due to ecological problems associated with the amounts of mercury used and the recycling of the lamps.
Since 2011, when the first regulations of energetic efficiency and public lighting was published, the city authorities aimed to change the discharge lamp-based public lighting to a more efficient one implemented with light-emitting diode (LED), however, the excessive fee of this replacement made local authorities give up.
In this work, a replacement will be considered that is powered from a power supply of a biomass central, supplying 15,985 MWh per year. This central is located in the area of Baeza, which is in the line of an “in situ” power as required by CE to avoid costs derived from transport and other eventualities.
The feasibility of the project will be evaluated by means of a cost-benefit analysis (CBA) based on the net present value (NPV), which offers information about the cost and benefits, allowing the assessment of investment opportunity in a particular moment in time. The evaluation has been complemented with the internal rate of return (IRR), which is the interest rate at which the NPV is equal to zero. These NPV values are calculated from the cash flow or annual cash flow, bringing all future amounts—negative and positive flows—to the present. This indicator helps to evaluate the return of private investments [
26,
27].
The overall results and implications regarding financial and environmental terms will be presented and discussed in this work.
3. Results
To improve energy efficiency, this paper proposed the next process to be implemented in two steps:
- (1)
Replacement of traditional HPS lighting system by LED technology;
- (2)
Powering of the new installation with the renewable energy obtained from biomass of the agro industrial district.
The main parameters of the planned replacement corresponding to the first step are shown in
Table 2:
Table 2 shows the data of the same public lighting installation when changing HPS to LED for a daily work of 12 h and its economic and environmental impact (column 2) and savings with respect to the former HPS installation.
According to this information, the main advantages of the proposal are:
Reduce the electricity consumption of lighting;
Possibility to regulate lighting levels according to different night schedules and types of roads, adjusting to the needs of citizens, and without reducing the lifetime of lamps;
Adapt the existing facilities to the precepts established in the Energy Efficiency Regulation in outdoor lighting installations and, as a derivative, those contained in the electro-technical regulation for low voltage; and
The energy classification, according to energy efficiency classes of UE must be A.
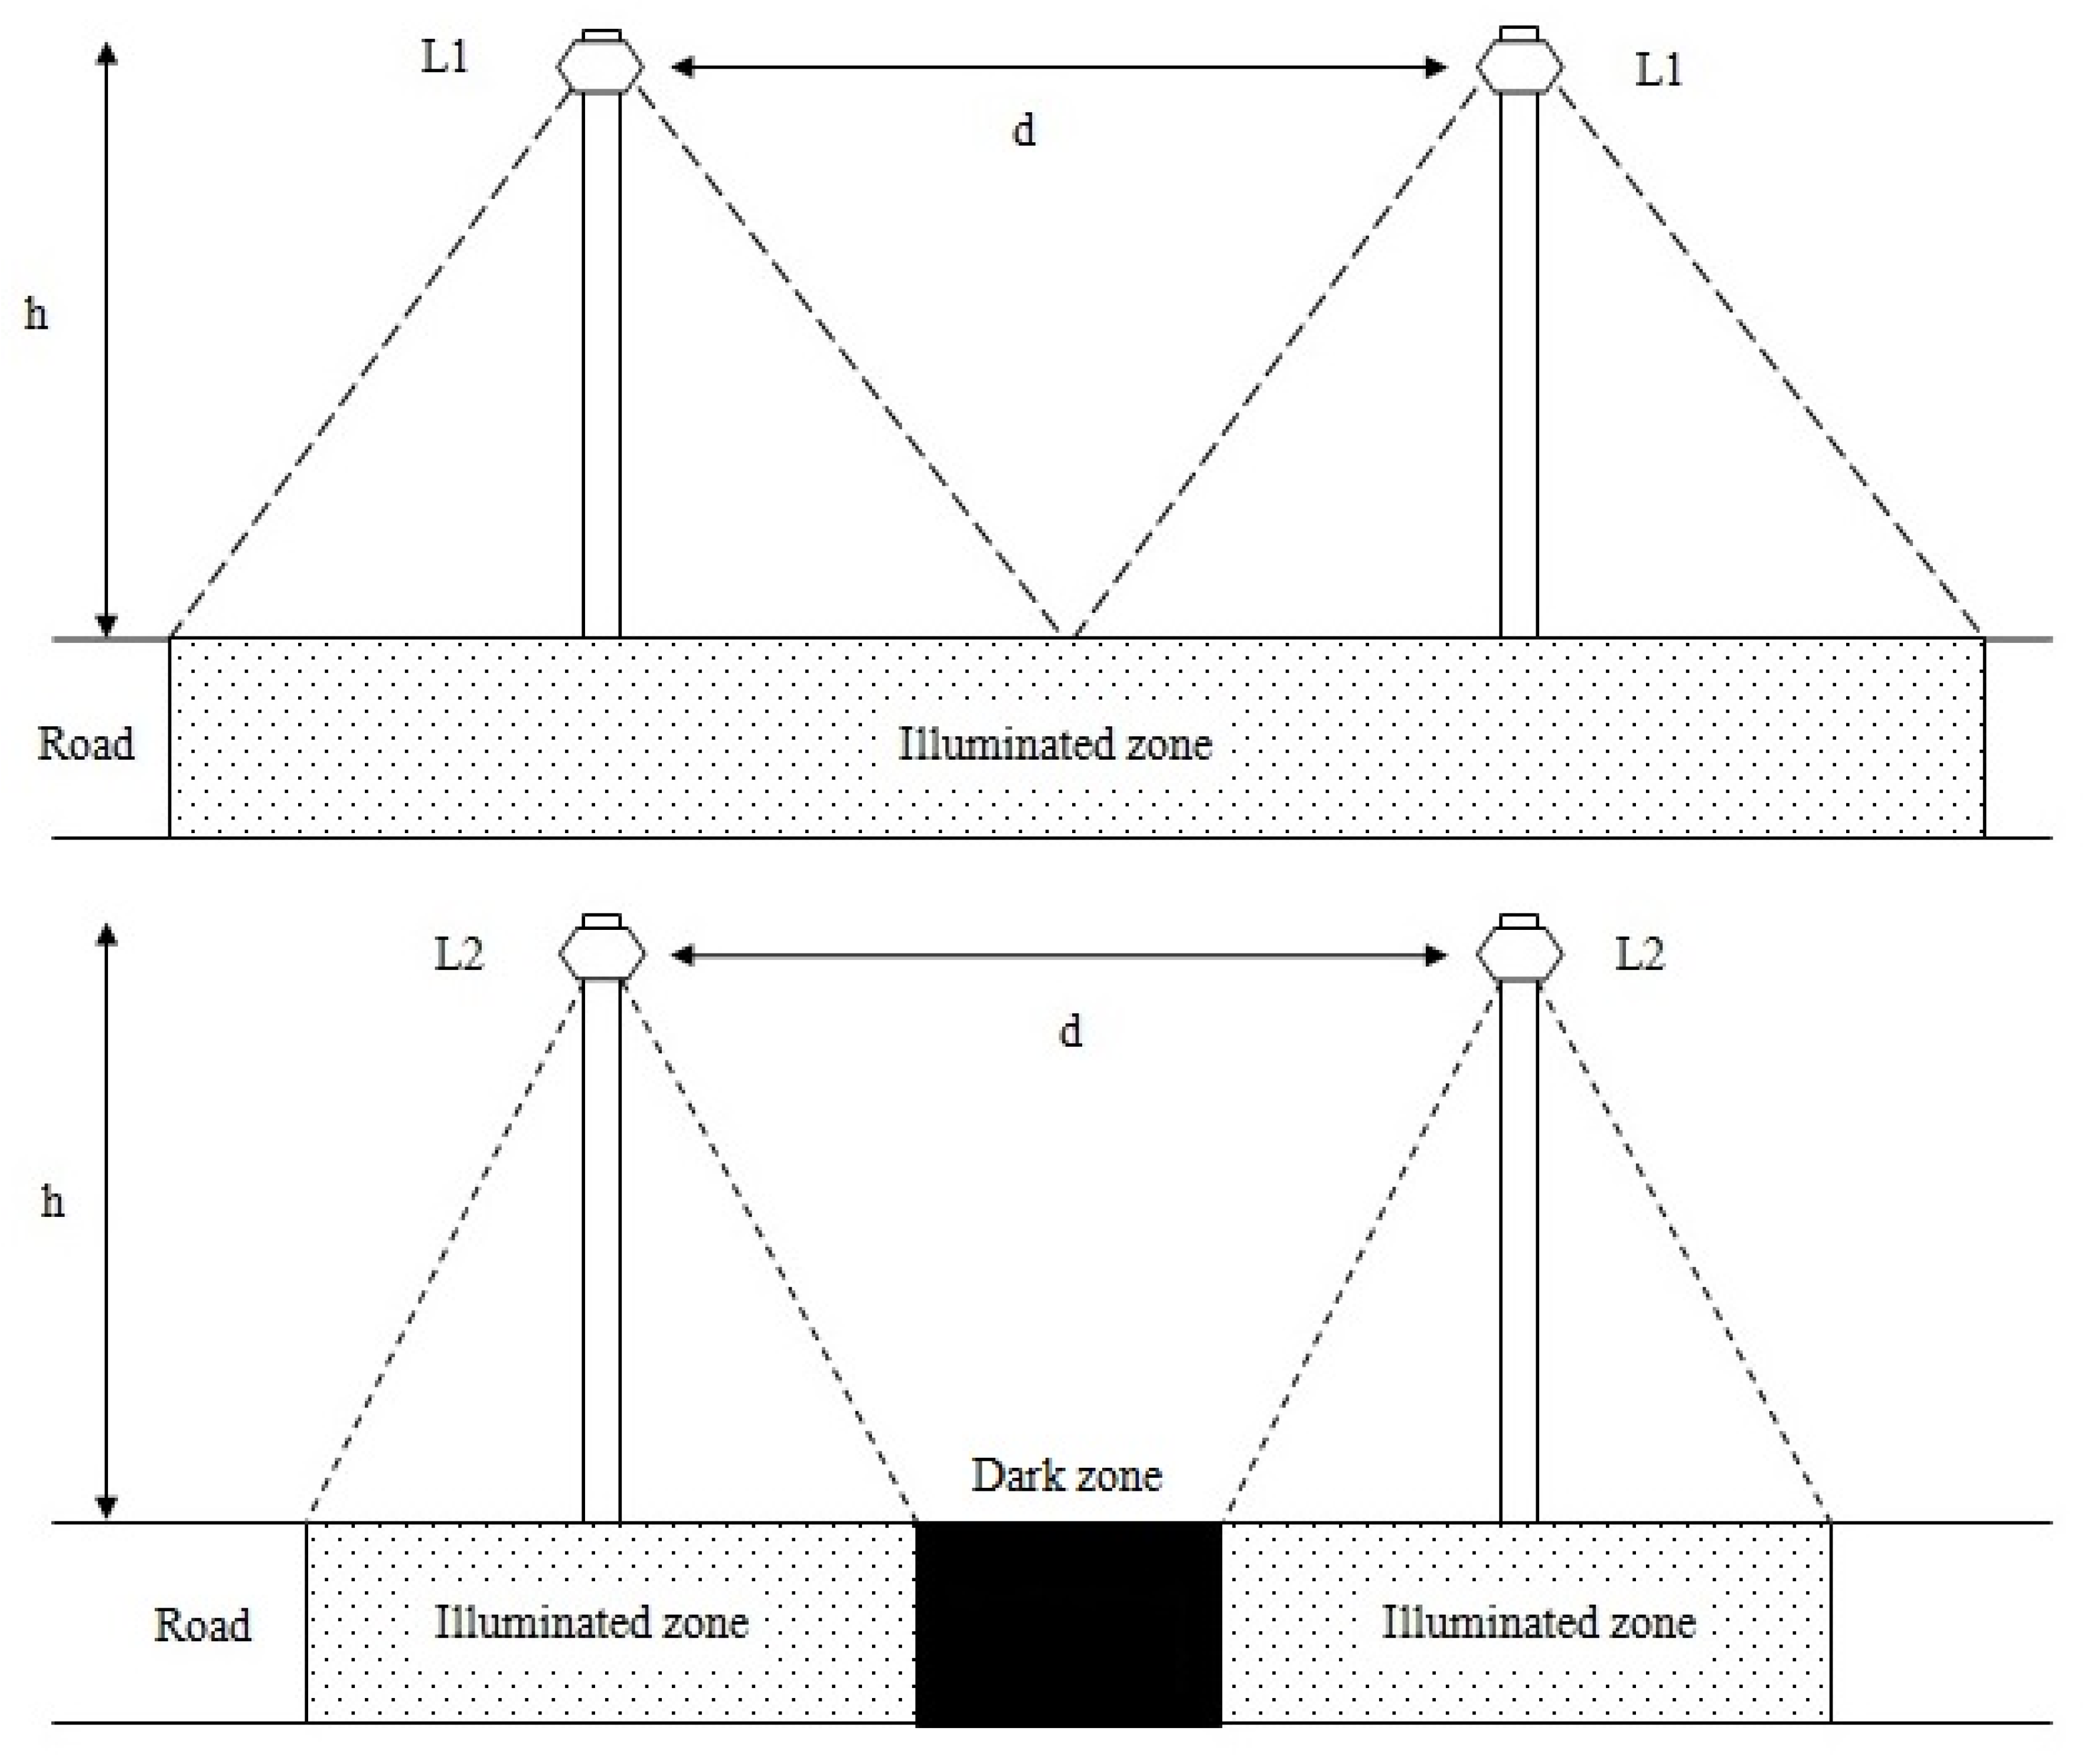
Despite these advantages, it is very important to remark that the replacement of HPS lighting installations by LED technologies or other light sources (induction, metal halide, etc.) using the former poles without changing their disposition or height must be carefully calculated and planned. The reason is that the light distribution of each luminaire could not accurately couple with the other in the installation, causing a bad uniformity (
Figure 1) or unsuitable levels of illumination on the ground [
24].
Installations that are out of regulation after these changes have been frequent when the matrix of light intensities of LED luminaries were not incorporated into the calculation programs or the replacement have been carried out just with rough estimations based on the luminous flux, but ignoring average uniformities.
According to the reasons above, the project for this replacement must consider only luminaries whose intensity matrix is included in lighting software, like DIALux, so that the relevant calculations are performed. Previously, the city of Baeza shows this information about lighting points: Fluorescence (1%); halides (0.001%); metal halide (20%); mixed light (0.007%); mercury vapor (27%); and sodium vapor high pressure (51.002%).
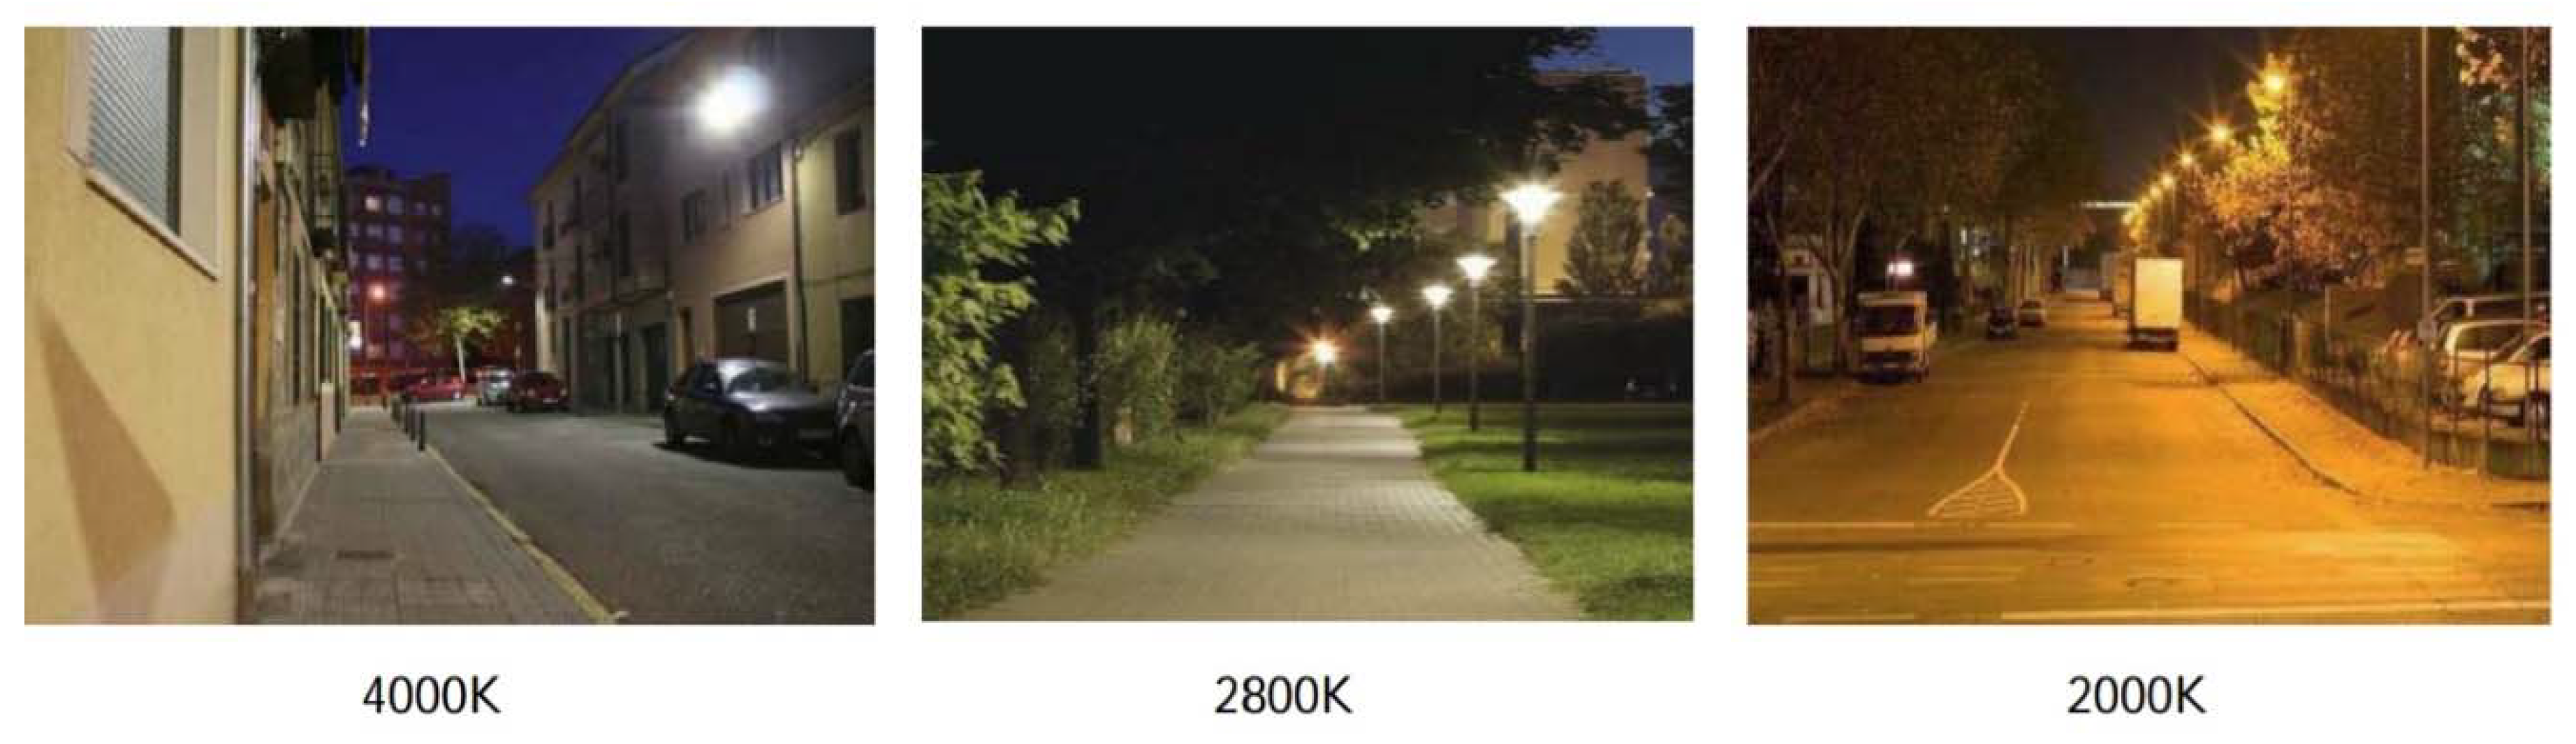
Figure 2 shows the different temperatures proposed for lighting after the installation of the LED technology. The 2000 K lamps were used for residential areas using high pressure sodium technology, the 2800 K for the old town with LED technology, and 4000 K for the rest of lamps with LED technology.
In addition, the change of HPS by LED technology has also a remarkable cost that dissuaded the town hall when first proposed. These costs are shown in
Table 3.
- Step 1:
LED replacement.
The consideration of all the factors above and the subsequent financial calculations yields the following results in terms of amortization.
Table 4 presents the information about the project that is useful to evaluate the economic feasibility of the project, while
Table 5 shows the human resource cost.
According to all this information, we present the information of the cash-in flow of the project in
Table 5. We also keep in consideration the actualization of the price of the energy contract, annual energy consumption, revenues, labor, and maintenance costs.
The following is the formula for calculating the NPV:
where:
Ct (net cash inflow during the period t);
Co (total initial investment costs) = 1,511,987;
r (estimated discount rate) = 6%; and
t = 12 years.
Thus, the NPV = 601,086.13.
A positive net present value indicates that the projected earnings generated by a project or investment (in present euros) exceeds the anticipated costs (in present euros). Generally, an investment with a positive NPV will be a profitable one and one with a negative NPV will result in a net loss. This concept is the basis for the net present value rule, which dictates that the only investments that should be made are those with positive NPV values.
- Step 2:
Biomass plant
Regarding the biomass central, the information is shown in
Table 5. The comparison between the energy that the biomass central can supply (15,985 MWh/year) and the energy consumed by the new public lighting installation (590 MWh/year) clearly shows that the central can power the public lighting. The remaining energy, if injected into the public lines, can help to amortize the investment as shown in the calculations below. The price of injecting the remaining energy is calculated (
FPM):
where:
FPM = Final price of market of the energy injected;
P = Government bonus for clean energies;
DMP = Daily market price;
CR = Complement for reactive energy;
PG = Power guarantee (GP): The plants that come to the market will receive a complement for a guarantee of power when using a manageable primary energy;
EfC = Complement for efficiency all the plants that exceed the minimum REE required will receive a complement for efficiency; and
Deviations (DES): All facilities will be charged a deviation cost for the variation between the forecast and the actual export.
According to the last market price average and the estimation of the other parameters, the results shows that the price will be around the FMP = 0.09 €/kWh, as conditioned by the changing government regulation. So, based on the information of
Table 4, we build
Table 6 where the VPN of biomass plant installation will be analyzed.
According to all this information, we present the information of the cash-in flow of the project in
Table 6, including the actualization of the price of the energy contract, energy consumption, revenues, labor costs (
Table 7), and maintenance costs.
where:
Co (total initial investment costs) = 5,200,000;
R (estimated discount rate) = 6%; and
t = 12 years.
Thus, the NPV = € 473,540.92; and
TIR: 4%.
A positive net present value indicates that the projected earnings generated by a project or investment (in present euros) exceeds the anticipated costs (also in present euros). Generally, an investment with a positive NPV will be a profitable one and one with a negative NPV will result in a net loss. This concept is the basis for the net present value rule, which dictates that the only investments that should be made are those with positive NPV values.
5. Conclusions
Although the use of waste produced in other activities, like agriculture (biomass), to produce energy is continuously increasing, the “in situ” power of public lighting installations is not frequent. It has important advantages in terms of avoided power loss and self-organization of districts in economic and environmental terms. The importance of agro-energetic district [
28] and the innovation and competitiveness [
29,
30] press to the cities to transition to more sustainable model.
Within this framework, this article highlights the importance of biomass as a technological-energetic nutrient under the paradigm of circular economy. In this sense, this research shows us that it is very important to create energy districts, with the main objective that they are configured as platforms for the valorization of energy technological nutrients derived from biomass to supply energy and be more efficient from an environmental and economic point of view.
Likewise, this research shows that it is important to foster collaboration between biomass producers, processing companies, and public administrations to develop projects that generate more environmental and economic sustainability. It will lead to the achievement of positive synergies for all stakeholders of the ecosystems where they are carried out.
As main advantages of this proposal, the following can be highlighted:
- (1)
Feasibility of changing traditional HPS lighting to LED without a strong investment nor credits: This change can be paid for with the surplus of energy after powering the installation of the considered city. The annual cost of public lighting of Baeza of the year 2017 shows this feasibility;
- (2)
The valuation of the agricultural waste generates financial inputs and palliates the massive migration from rural areas to cities;
- (3)
The CO2 emissions are remarkably decreased, which helps countries to fulfill the international requirements and protocols in this matter;
- (4)
The gains after powering the city (in this case Baeza, in the south of Spain) and paying for the change to LED can be an important source for the progress of these rural areas;
- (5)
The energy autonomy of small regions, without dependence on big producers or expensive energy transport with large lines and expensive projects, will foster their socioeconomic development based on their own strengths of each small region.
Finally, as future research, one could compare what is best for the city if excess energy is used in another public building or injected into the network. The effectiveness of the use of storage batteries for nightly energy supplies could also be analyzed. Furthermore, these ideas could be also applied to companies or industries, such as building [
31].

 ,
, 

