Article

Integrated Sizing and Energy Management for Four-Wheel-Independently-Actuated Electric Vehicles Considering Realistic Constructed Driving Cycles

1
National Engineering Laboratory for Electric Vehicles, Beijing Institute of Technology, Beijing 100081, China
2
Collaborative Innovation Center of Electric Vehicles in Beijing, Beijing Institute of Technology, Beijing 100081, China
*
Author to whom correspondence should be addressed.
Energies 2018, 11(7), 1768; https://doi.org/10.3390/en11071768
Submission received: 18 May 2018 / Revised: 28 June 2018 / Accepted: 2 July 2018 / Published: 5 July 2018
(This article belongs to the Collection Electric and Hybrid Vehicles Collection)

Abstract

:
This paper presents an integrated optimization framework of sizing and energy management for four-wheel-independently-actuated electric vehicles. The optimization framework consists of an inner and an outer layer that are responsible for energy management, i.e., torque allocation, and powertrain parameter optimizations. The optimal torque allocation in the inner layer is achieved via the dynamic programming (DP) method while the desirable powertrain parameters in the outer layer are pursued based on the exhaustive method. In order to verify the proposed optimization framework, two driving cycles are constructed to represent the comprehensive and realistic driving conditions. One cycle is built by combining six typical driving cycles, which cover urban, high-way and rural driving styles to enhance representativeness. The other one is synthesized using the Markov chain method based on a vast quantity of real-time operating data of electric vehicles in Beijing. Simulation results demonstrate that the proposed strategy decreases the power consumption by 15.1% and 13.3%, respectively, in the two driving cycles, compared to the non-optimal, even-torque-allocation strategy.

Graphical Abstract

1. Introduction

1.1. Motivation

The rapid development of electric vehicles (EVs) represents a paradigm transition towards green and sustainable transportation [1,2,3]. The progression of EVs’ mass-adoption and renewable energy penetration are also expected to drastically cut transportation-related emissions and substantially reduce dependency on fossil fuels [4]. Recently, four-wheel-independently-actuated electric vehicles (FWIA EVs) have gained tremendous attention thanks to their potential for lower electricity consumption and better vehicle handling performance [5]. Four in-wheel motors are respectively installed in each wheel hub and can be collaboratively controlled for vehicle propulsion [6,7]. This distributed powertrain structure significantly simplifies the drivetrain by eliminating the transmission shaft, differential and final drive [8]. Through appropriate torque allocation, it is possible to optimize the efficiency performance of working motors, thus contributing to an increased overall efficiency of the vehicle powertrain. The extent to which the vehicle performance can be enhanced is strongly dependent on the powertrain sizing, including the battery pack and in-wheel motors, as well as energy management. Clearly, there would be a tradeoff between improved vehicle performance and powertrain sizing that is directly associated with costs. Besides, energy management should also be included in the process of powertrain sizing due to their inherent relationship. Thus, it is imperative to developing a framework that simultaneously considers powertrain sizing and energy management synthesis with the aim of improving the vehicle efficiency [9]. It is significant to increase the driving range per charge and help reduce the “range anxiety” of consumers.

1.2. Literature Review

In FWIA EVs, the over-actuation property gives rise to the energy management problem. To be specific, energy management can be boiled down to torque allocation in which the power demands for each motor is assigned to realize the desired targets set by an upper controller. These targets can be realized by the utility of only front-axle motors or by even torque contributions from four in-wheel motors. A cost function that includes power losses of motors, tire slip or other criteria is always included to realize secondary goals while fulfilling vehicle dynamics stability requirements [10,11]. For minimizing power losses of motors, Yuan et al. established a motor loss model to characterize the relationship between the motor efficiency and torque at given speeds, and then proposed a torque distribution scheme to improve the overall powertrain efficiency for a midsized EV equipped with front- and rear-axle motors [12]. Considering tire slip loss, Nam et al. presented a robust wheel slip control system to improve the powertrain efficiency for a personal EV by minimizing the energy loss resulting from undesired wheel spin [13]. Furthermore, Zhang et al. proposed an online implementable control scheme to reduce the power loss of motors in traction conditions and increase the braking recuperation in braking conditions for in-wheel motor EVs [14]. However, these studies only intended to optimize the powertrain efficiency for a given powertrain configuration and invariably ignored the influence of powertrain sizing. In contrast, studies on simultaneous optimization of sizing and energy management have been extensively explored for electrified vehicles including fuel-cell electric vehicles (FCEVs), hybrid electric vehicles (HEVs) and plug-in electric vehicles (PHEVs) [15,16]. The use of the Pontryagin maximum principle (PMP) [17], dynamic programming (DP) [18], stochastic dynamic programming (SDP) [19] for energy management of HEVs and PHEVs, which can provide direct reference for FWIA EV energy management, has been well-documented. Given a known driving cycle, the DP algorithm can readily derive the global optimal control sequence [20]. Nevertheless, it requires a complete knowledge of the driving profile that is unattainable in realistic driving conditions, which prevents its feasibility in real-time embedded controllers. Despite the fact that the DP algorithm cannot be used in online applications, it can be used as the benchmark energy management strategy to search for the optimal component sizing based on certain driving cycles [21]. It is well acknowledged the applied driving cycles impose significant influence on the de facto performance of energy management strategies as indicated in [22]. Therefore, it is also of critical importance to synthesize a practical driving cycle that reflects the real-world working conditions of the designed vehicles to the maximum content.
There are two approaches for typical vehicle driving condition representation. One is to use a series of steady-state speeds and accelerations to develop a driving cycle [23]. The other is to capture the characteristics of daily traffic using the Markov chain and state transition matrices based on recorded data. Certification driving cycles such as the Federal Test Procedure (FTP-75) and the New European Driving Cycle (NEDC) have been ubiquitously used to evaluate energy consumption in the process of energy management development [24]. However, there exist a considerable number of scenarios in practical driving conditions that cannot be fully captured by any of the developed certification driving cycles, which would curtain the efficacy of the developed energy management [25]. For instance, Wang et al. found that the current performance indicators for EVs such as electricity consumption rate based on the NEDC cycle underestimate their fuel reduction benefits in Beijing due to the mismatch between the real-world driving conditions and the certification driving cycle [26]. It is worth noting that automotive makers are more likely to develop their energy management strategies based on the certification driving cycles in order to maximize the vehicle performance in certification tests; but this may result in an outcome where the best potential of the vehicle cannot be unleashed. In this study, massive operating data of EVs in Beijing was obtained from the Service and Management Center for EVs (SMC-EV) in Beijing, which includes the real-time vehicle position and speed with an update frequency of 1 Hz. This provides the foundation for driving cycle synthesis with more representativeness, and consequently facilitates to developing more efficient energy management models.

1.3. Contributions of This Study

In order to maximize the vehicle performance, a framework of integrated sizing and energy management for FWIA EVs is proposed, which comprises of an inner and an outer layer. The inner layer employs the DP algorithm based on the comprehensive driving cycle to obtain the optimal torque allocation with the objective of optimizing the overall vehicle efficiency. A realistic driving cycle is built using the Markov chain based on a vast quantity of recorded data, which provides high-fidelity driving condition representation. The outer layer is designed to search for the optimal sizing of main powertrain components including the rated capacity of the battery pack and the rated power of in-wheel motors. The main contributions of this study include two aspects. Firstly, a realistic driving cycle is built based on the real-time operating data of EVs, including around-the-clock speed and acceleration information of the monitored electric vehicles. Secondly, the DP algorithm is used to derive the optimal torque allocation while the component sizing is exhaustibly searched with the objective of energy consumption minimization. Simulation results have verified the superiority of the proposed strategy in comparison to the baseline evenly-torque-allocation strategy, which accomplishes the power consumption reduction by 15.1% and 13.3%, respectively, in two driving cycles.

1.4. Orgnization of This Paper

The remainder of this paper is organized as follows: Section 2 presents the powertrain architecture and system modeling for the studied FWIA EV. Section 3 elaborates the building process of the driving cycle based on the real-time data of the monitored electric vehicles. Section 4 provides the detailed problem formulation of combined component sizing and energy management. Section 5 presents simulation results and discussion, followed by the key conclusions summarized in Section 6.

2. Powertrain Architecture and System Modeling

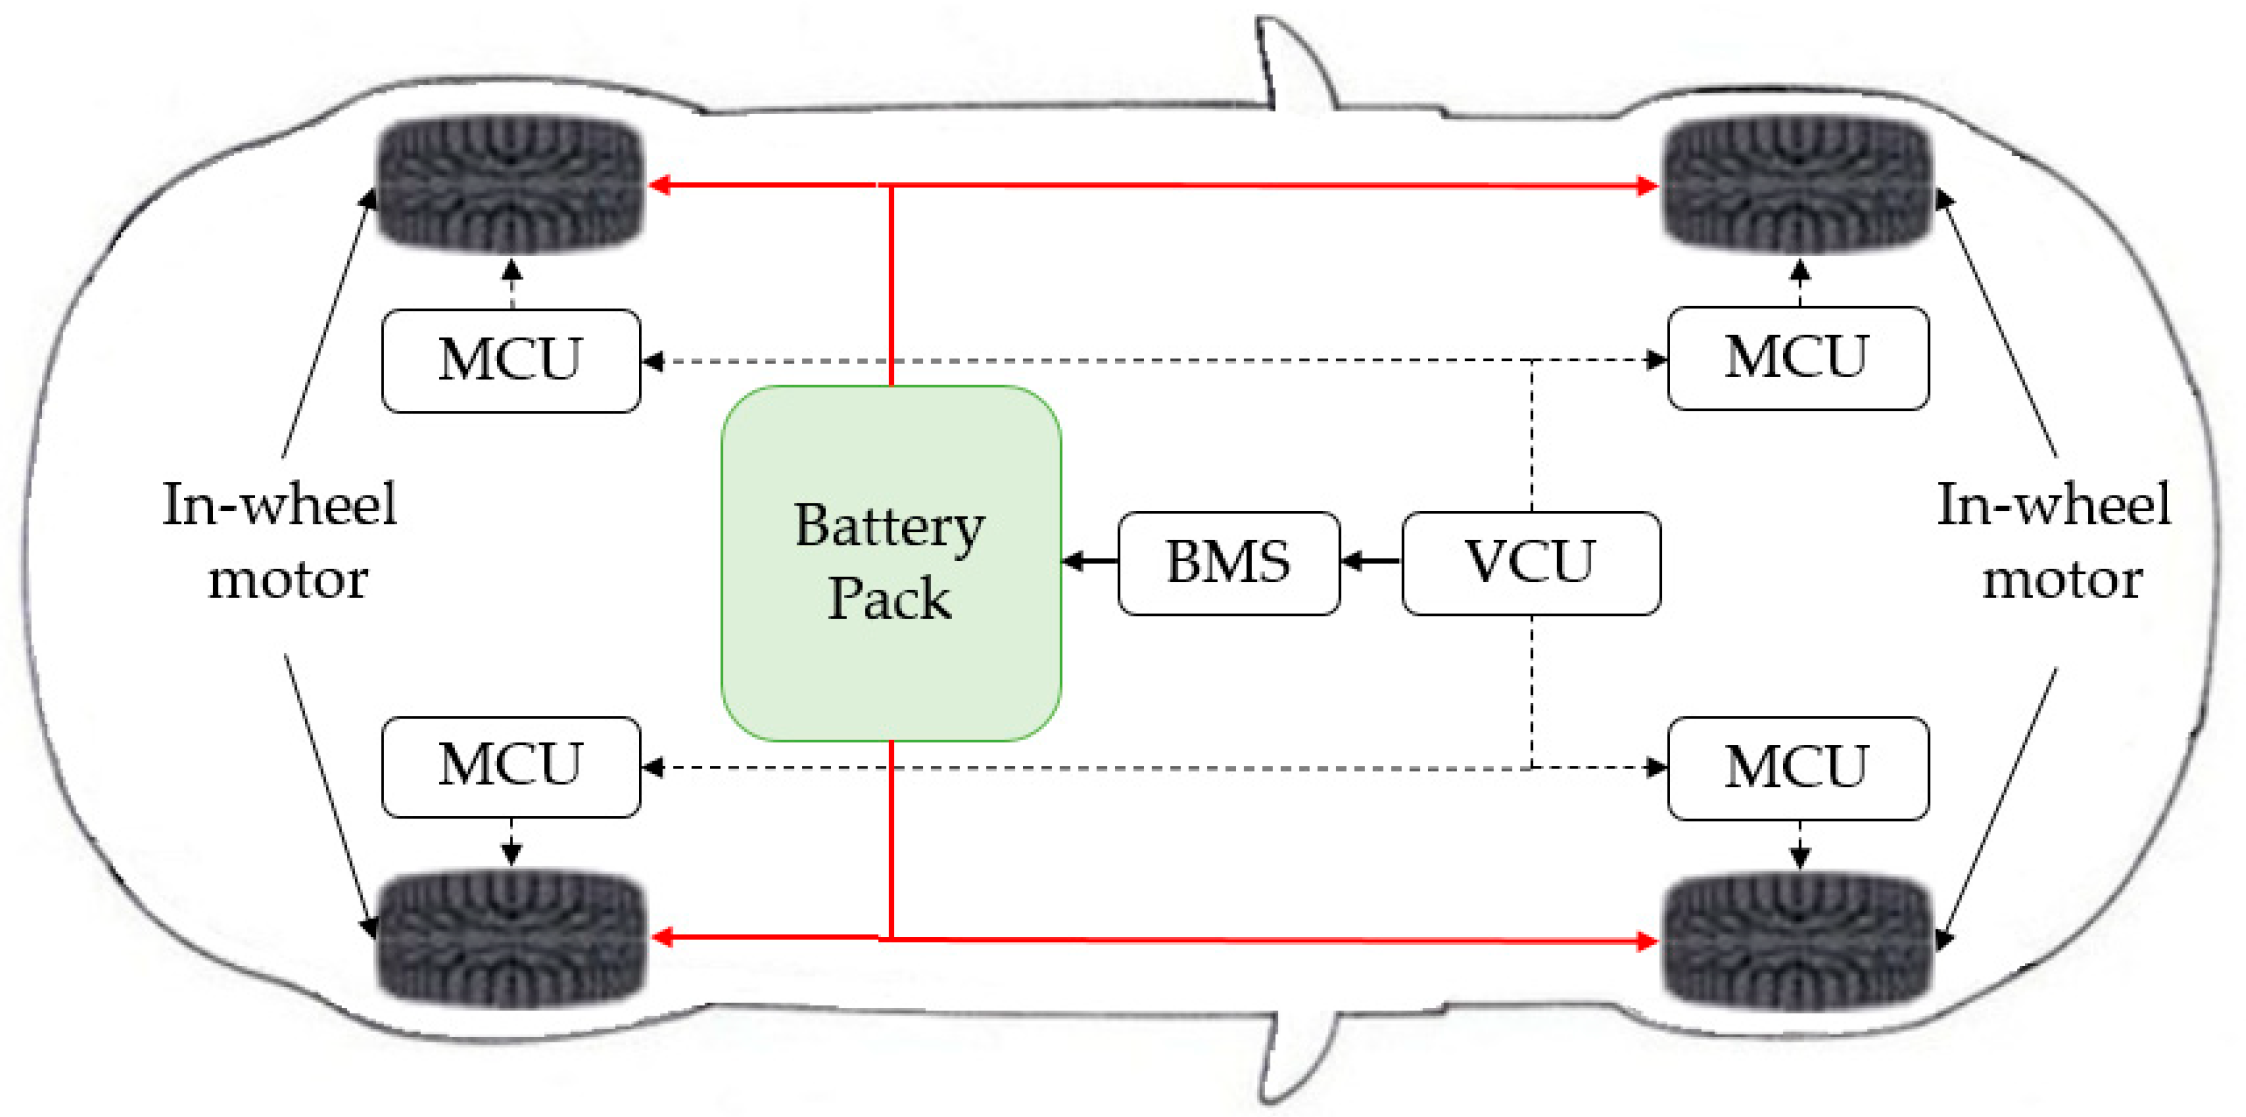
2.1. Powertrain Architecture

A four-wheel-independently-actuated electric vehicle with in-wheel motors is studied. Its main configuration is illustrated in Figure 1.
The main components of the studied FWIA EV include four in-wheel motors with their respective control units (MCUs), a vehicle control unit (VCU), a battery pack and associated management system (BMS). The in-wheel motors are installed inside wheel hubs and can be controlled by their MCUs for direct propulsion. For simplicity, the following assumptions are made:
  • The employed in-wheel motors are identical and with the same characteristics;
  • There are no time delays during motor control implementation.

2.2. System Modeling

2.2.1. Vehicle Model
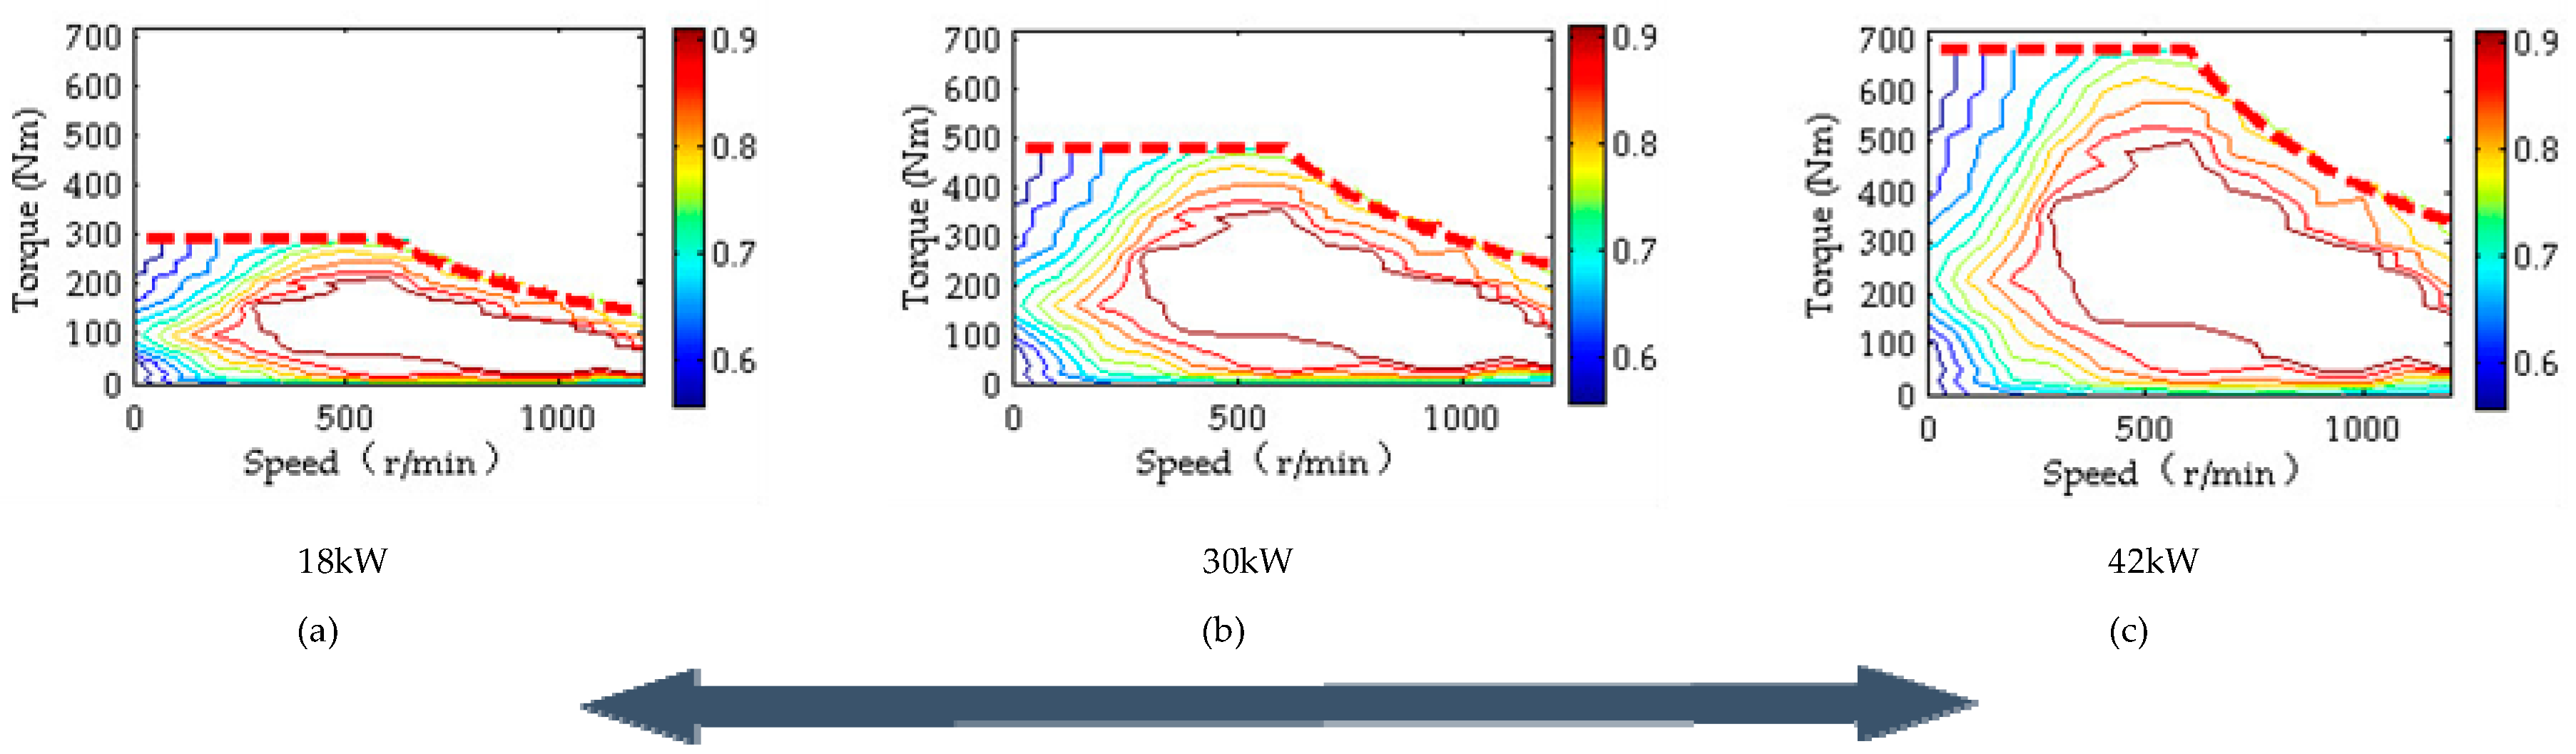
According to the longitudinal vehicle dynamics, the equation of motion can be derived as:
m d V d t = F t o t a l 0.5 C d ρ A f V 2 C r m g cos ( θ ) m g sin ( θ )
where m is the vehicle mass, V is the vehicle velocity, Ftotal is the total driving force, Cd is the aerodynamic drag coefficient, Af is the frontal area of the vehicle, ρ is the air density, Cr is the rolling resistance coefficient, g is the gravitational acceleration, and θ is the road grade.
Assuming that the rotational inertial of each wheel is ignored, the driving torque at each wheel can be expressed as:
T i = F i r = { r 2 λ F t o t a l , i = 1 , 2 r 2 ( 1 λ ) F t o t a l , i = 3 , 4
where λ denotes the torque distribution coefficient, which is used to realize torque allocation between the front- and rear-axles. It is worth noting that λ = 1 means the vehicle is propelled only by the front-axle motors while λ = 0 means the rear-axle drive only. Fi represents the driving force of the i-th wheel.
Since this study only deals with the longitudinal dynamics, the torque and power distribution can be expressed as:
T t o t a l = T 1 + T 2 + T 3 + T 4
P t o t a l = T 1 ω 1 + T 2 ω 2 + T 3 ω 3 + T 4 ω 4
where T1, T2, T3 and T4 mean the torques generated by the front-left, front-right, rear-left and rear-right baseline motor, respectively; ω1, ω2, ω3 and ω4 represent the angular velocity of the front-left, front-right, rear-left and rear-right baseline motor, respectively.

2.2.2. Motor Model

In-wheel motors are responsible for providing the driving forces for vehicle propulsion. In quasi-static vehicle simulations, energy consumption can be computed from the static efficiency map of the motor. The motor efficiency can be approximately calculated by [27]:
η m o t o r = f ( T m o t o r , ω m o t o r , ϕ m o t o r )
where ηmotor and ϕ m o t o r represent the efficiency and rating power of the motor, respectively.
Conventionally, the efficiency map of the motor is obtained through dynamometer tests. In order to establish a generic motor model that can accommodate different motor sizes, the efficiency map is made scalable and dependent on motor sizes.
To be specific, the efficiency map of the baseline motor is taken as a benchmark, and different motor parameters and their efficiency maps can be obtained by scaling the axis of torque relative to the baseline motor, as shown in Figure 2. The formula can be expressed as:
T n e w = T b a s e × α
where α is the scaling factor.
Figure 2b shows the efficiency map of the known baseline motor. Based on the principle of proportional scaling, the efficiency maps of scaled motors are shown in Figure 2a,c.
For FWIA EVs, efficient torque split can optimize the working efficiencies of the motors based on their external characteristic curves and efficiency maps. A deterministic algorithm can be adopted to derive the optimal torque allocation. By combining Equations (3), (4), and (6), the total driving power can be derived by:
P o u t , t o t a l = T b a s e × ω 1 × α 1 + T b a s e × ω 2 × α 1 + T b a s e × ω 3 × α 2 + T b a s e × ω 4 × α 2
where Pout,total is the total driving power, Tbase is the torque of the baseline motor, α1 and α2 mean the scaling factor for the front- and rear-axle motors, respectively.
As the angular velocity and driving torque of each motor on the same axle are the same, Equation (7) can be simplified as:
P o u t , t o t a l = 2 T b a s e × ω × ( α 1 + α 2 )
where α1 and α2 can be the same or not.
The vehicle control unit computes an optimal torque allocation between the front- and rear-axles, and the required power from the battery system can be obtained by:
P i n , t o t a l = T t o t a l × ω × λ 2 η 1 ( T t o t a l 2 , ω , α 1 ) + T t o t a l × ω × ( 1 λ ) 2 η 2 ( T t o t a l 2 , ω , α 2 )
where η1 and η2 represent the efficiencies of the front- and rear-axle motors, respectively.

2.2.3. Battery Model

The upper and lower limits of the battery State-Of-the-Charge (SOC) are needed in order to maintain the battery SOC within a certain range. Despite that various battery models have been developed in the literature, the following model is adopted in this study due to its ease of implementation and acceptable accuracy. That is:
S O C = ( I b a t t Q m a x )
P b a t t = V o c I b a t t I b a t t 2 R b a t t
where Ibatt, Pbatt, Voc and Rbatt are the discharging current, output power, terminal voltage and internal resistance of the battery system, respectively.

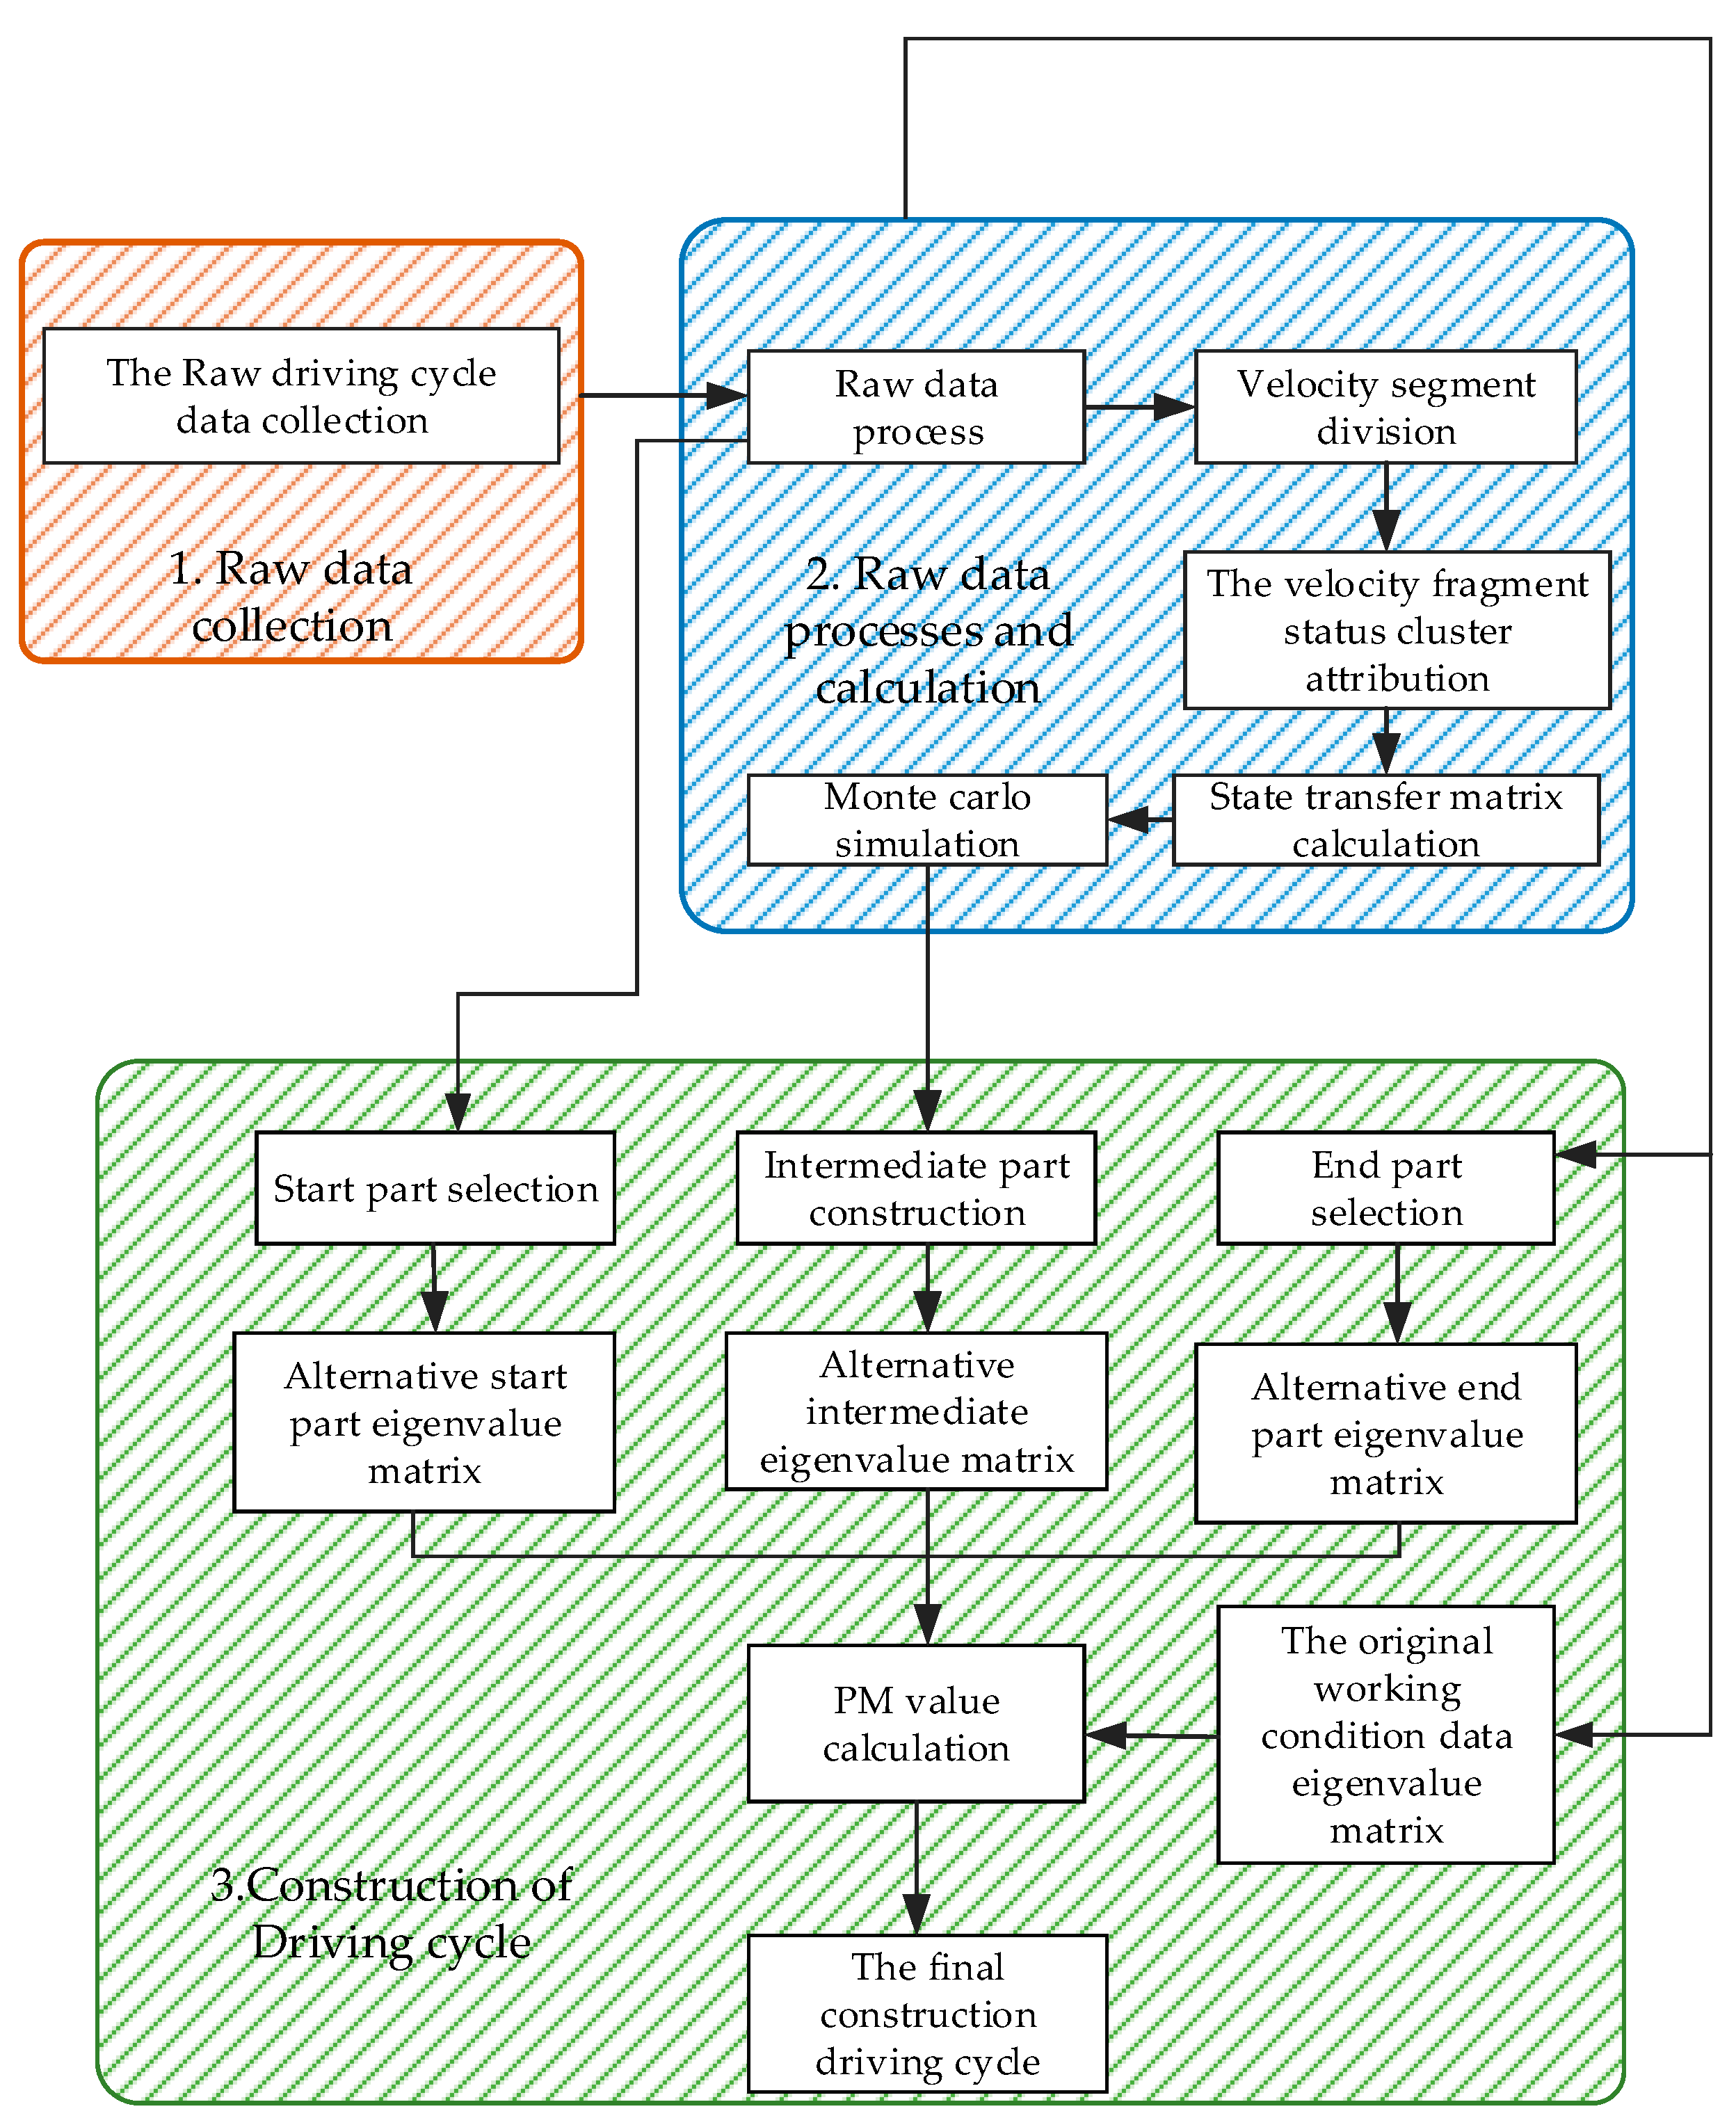
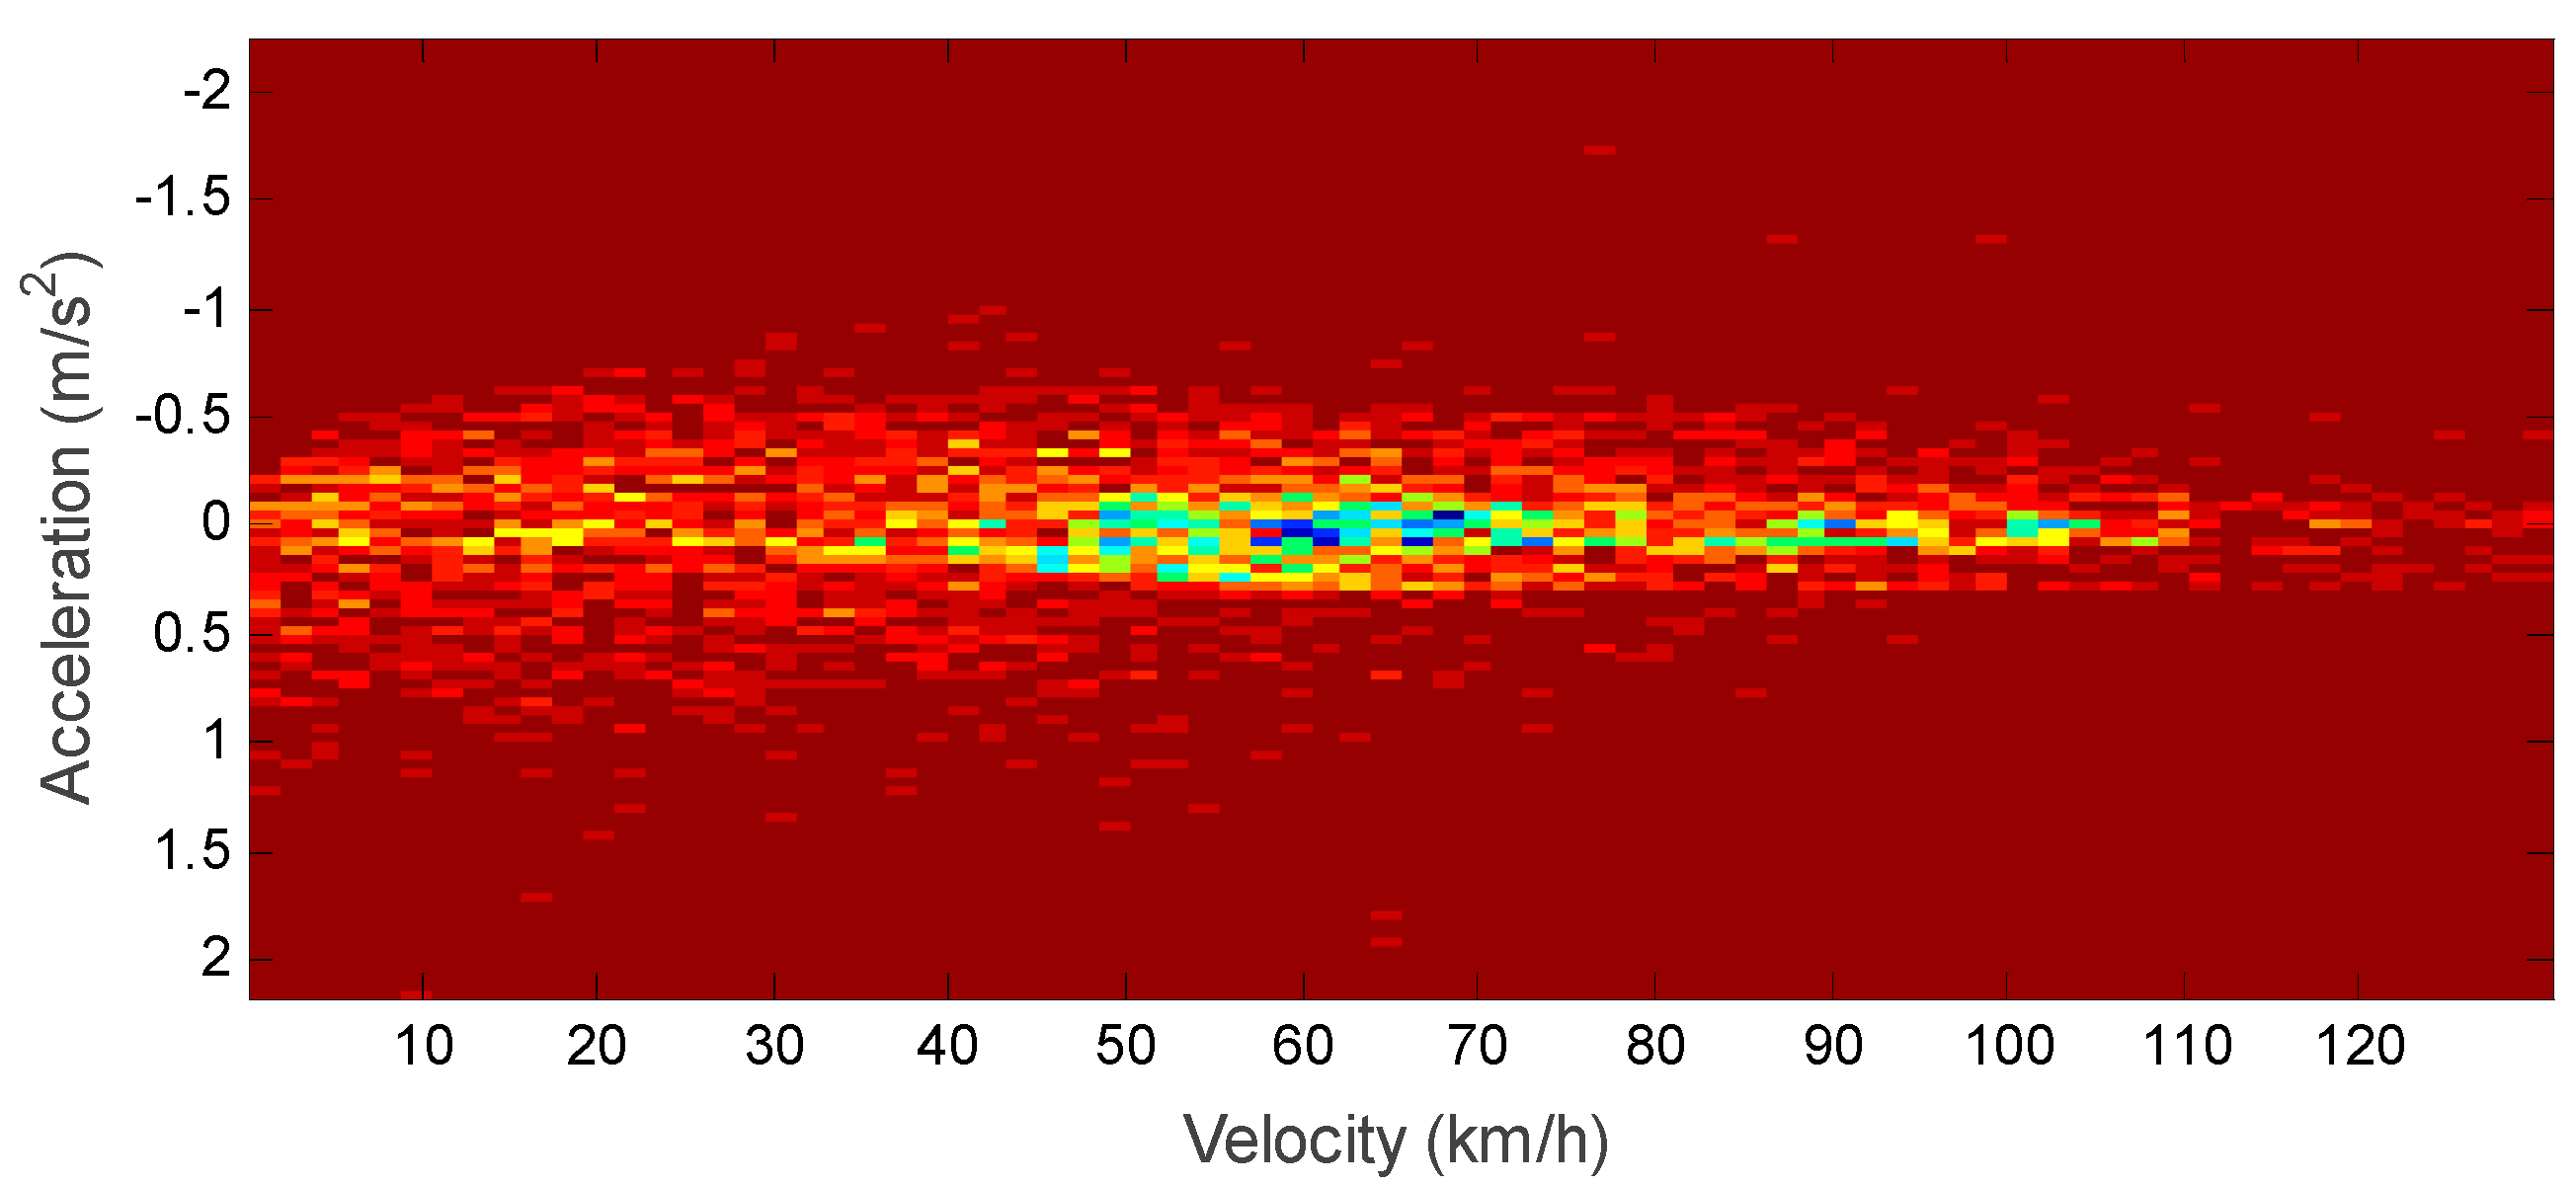
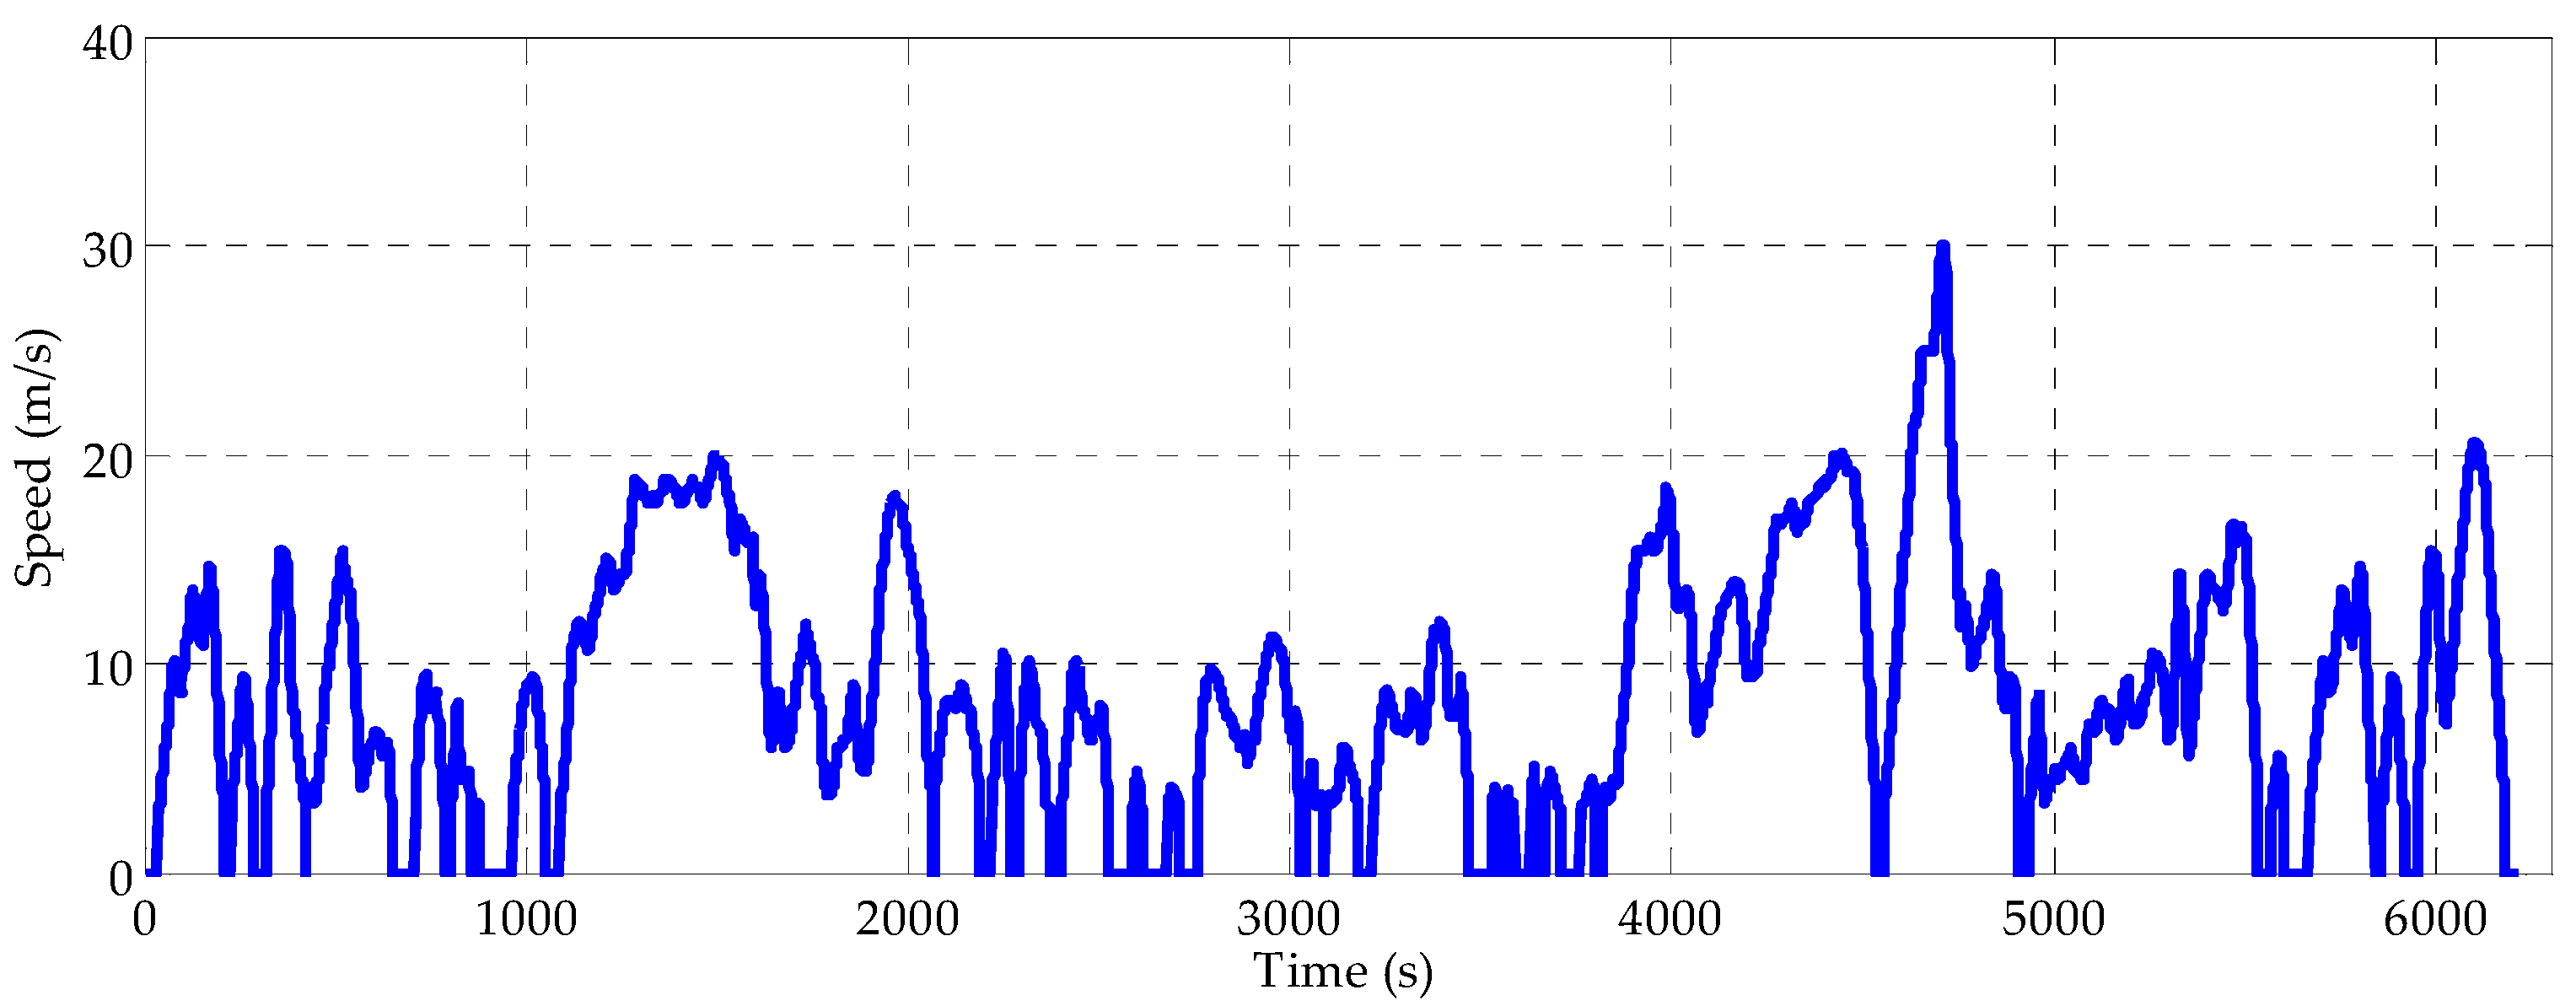
3. Driving Cycle Construction Based on the Markov Chain

Generally, the driving conditions of a vehicle can be described with a speed vs. time curve. The curve is influenced by multiple factors such as the terrain and road conditions as well as the drivers’ habits. Therefore, the concept of the stochastic process can be introduced to studying the driving cycle construction. The characteristic of the Markov process is that the subsequent state depends only on the current state and independent of the previous states. This property is known as “no aftereffect”. A driving cycle is constructed in this study based on the Markov chain method, and the main process is delineated in Figure 3.

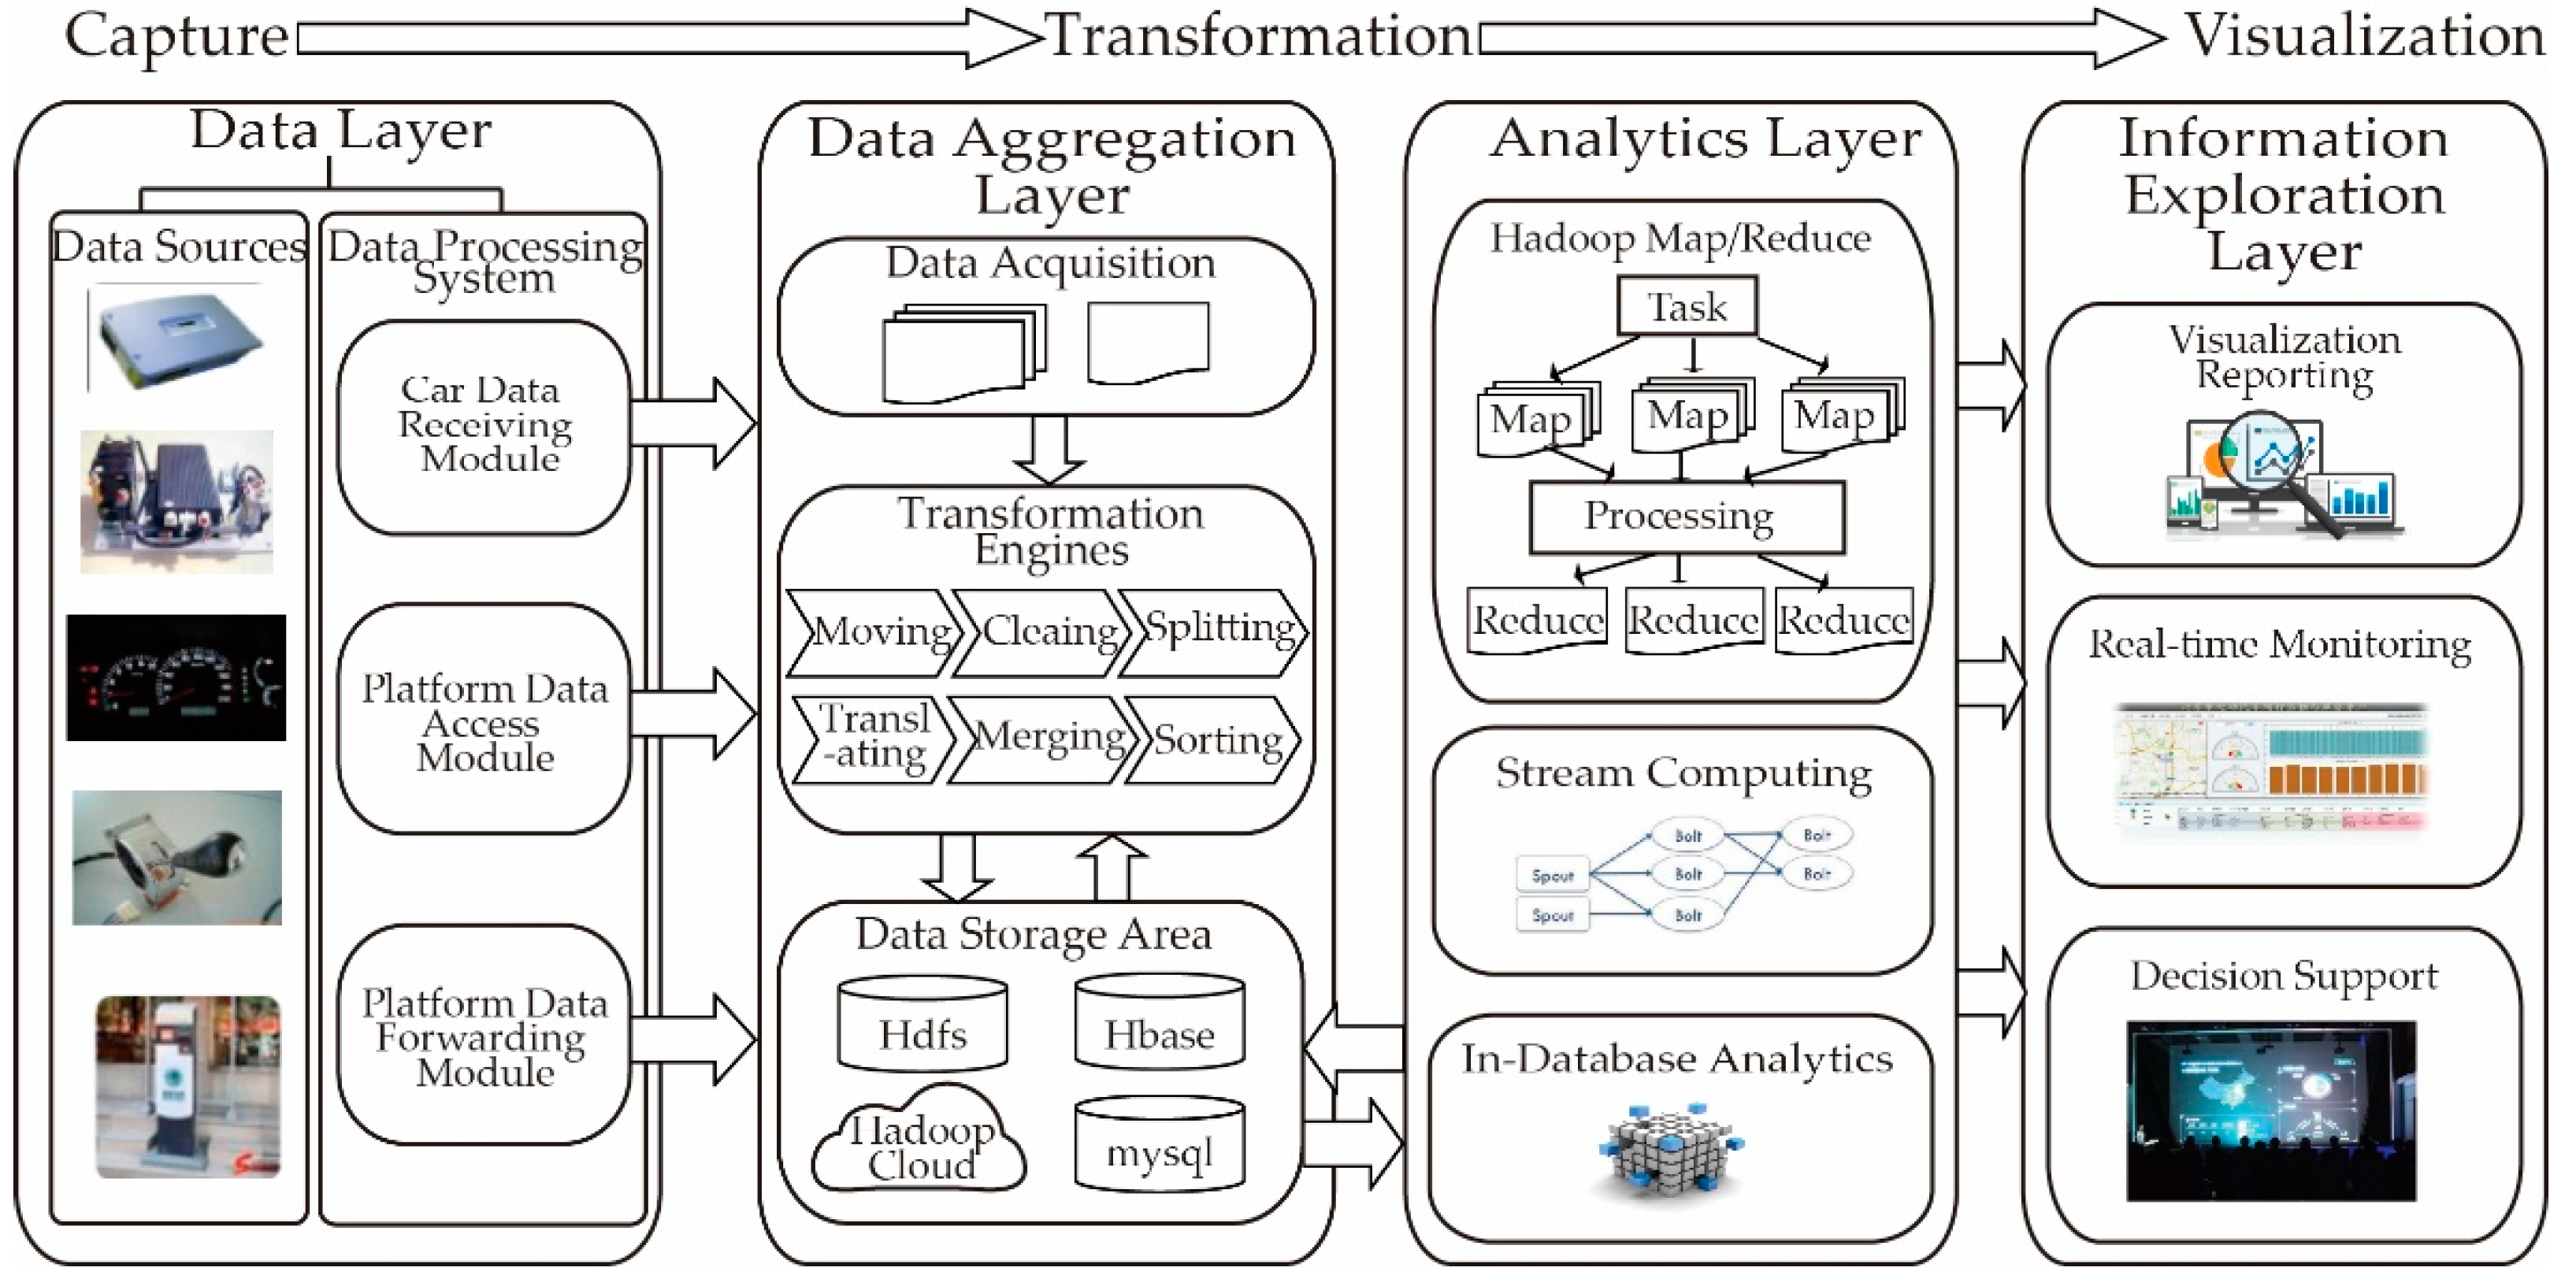
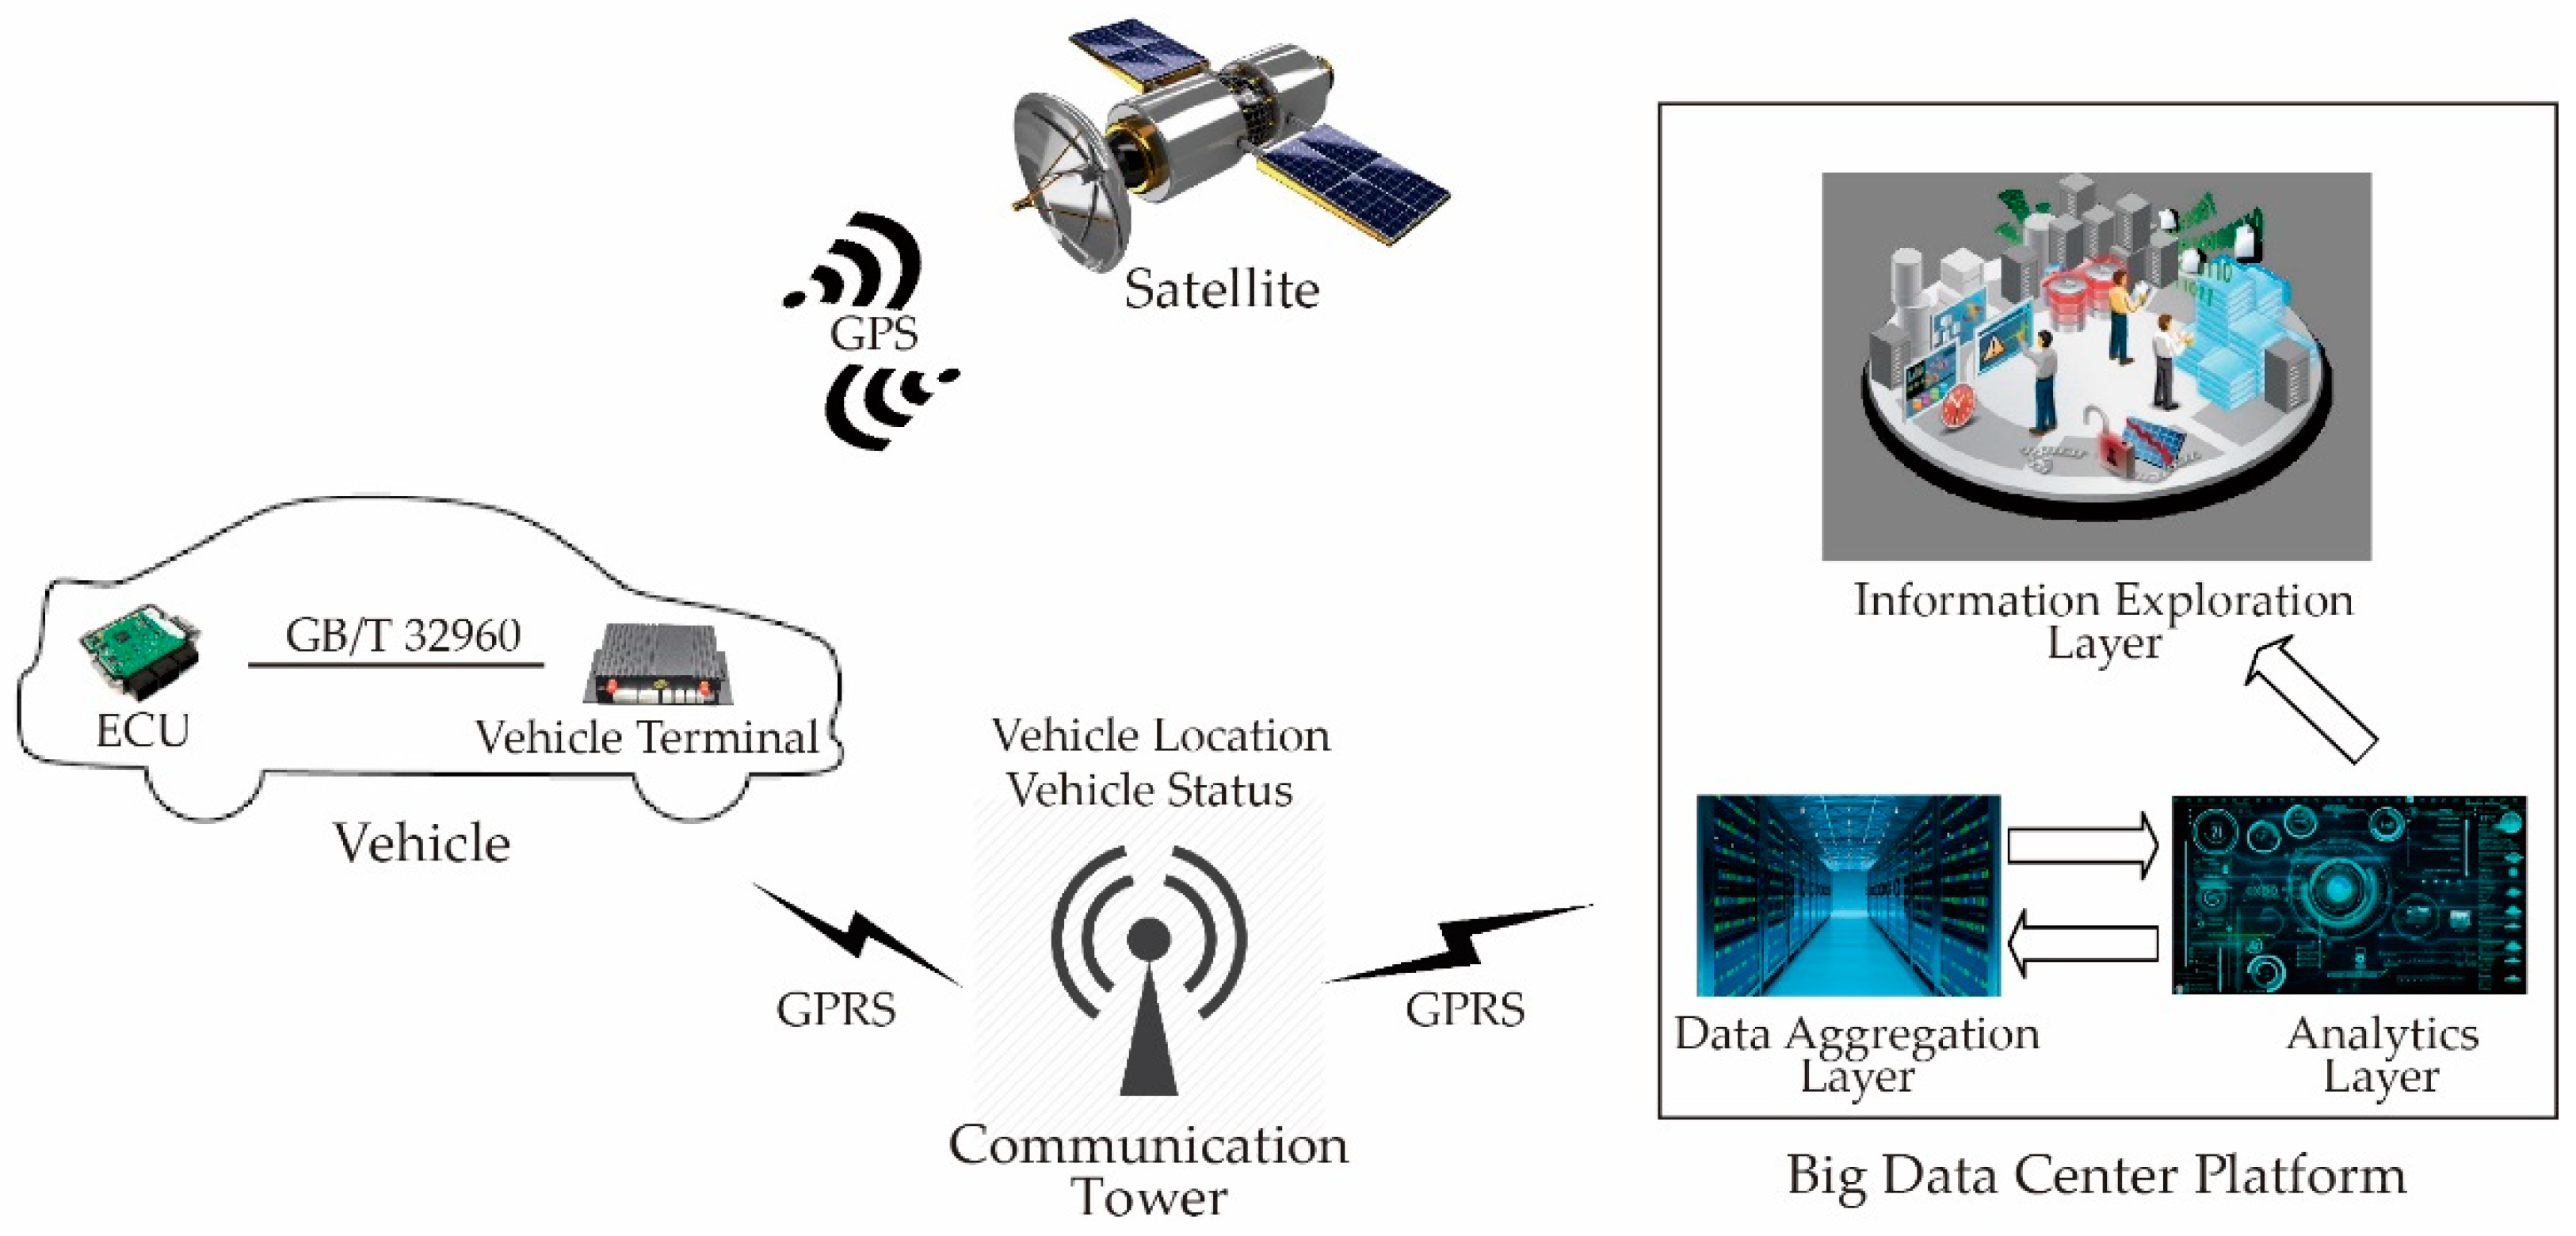
3.1. Raw Data Collection

With the development of data-analysis tools, such as the extensible markup language, database management systems and Hadoop-added analytics modules, large quantity of data can be processed and analyzed more efficiently. With the maturity of big data techniques, the massive data of EVs such as real-time speed and position of the vehicle and other operating state information becomes more storable and usable. Thus, governments and enterprises have increased interest in making use of these data for helping the technological development and mass-adoption of EVs. All the data used in this study was collected from the SMC-EV in Beijing, which has the capacity of data collection, storage and processing for a wide range of EV models. The main functionalities of the SMC-EV in Beijing is sketched in Figure 4. It can be seen that the big data analytics architecture consists of the data layer, data aggregation layer, analytics layer and information exploration layer.
Different data storage clusters at the data aggregation layer can obtain a huge amount of operating data by means of their own acquisition methods, such as vehicle information terminal and Global Positioning System (GPS). In Figure 5, the vehicle terminal is utilized to collect the required operating information of EVs and communicate with the Electronic Control Unit (ECU) through an internal protocol. The collected vehicle information is transferred in real-time to the SMC-EV in Beijing through the General Packet Radio Service (GPRS) network. As the platform interfaces with the analytics layer, the received data can be written to the services’ Hbase database. The analytics layer is used for statistical analysis of the collected data. At the same time, it is able to dig out the latent information of the vehicle, including working condition statistics, maximum speed statistics, velocity and acceleration distribution, which provides data support for constructing the driving cycle in the following part.

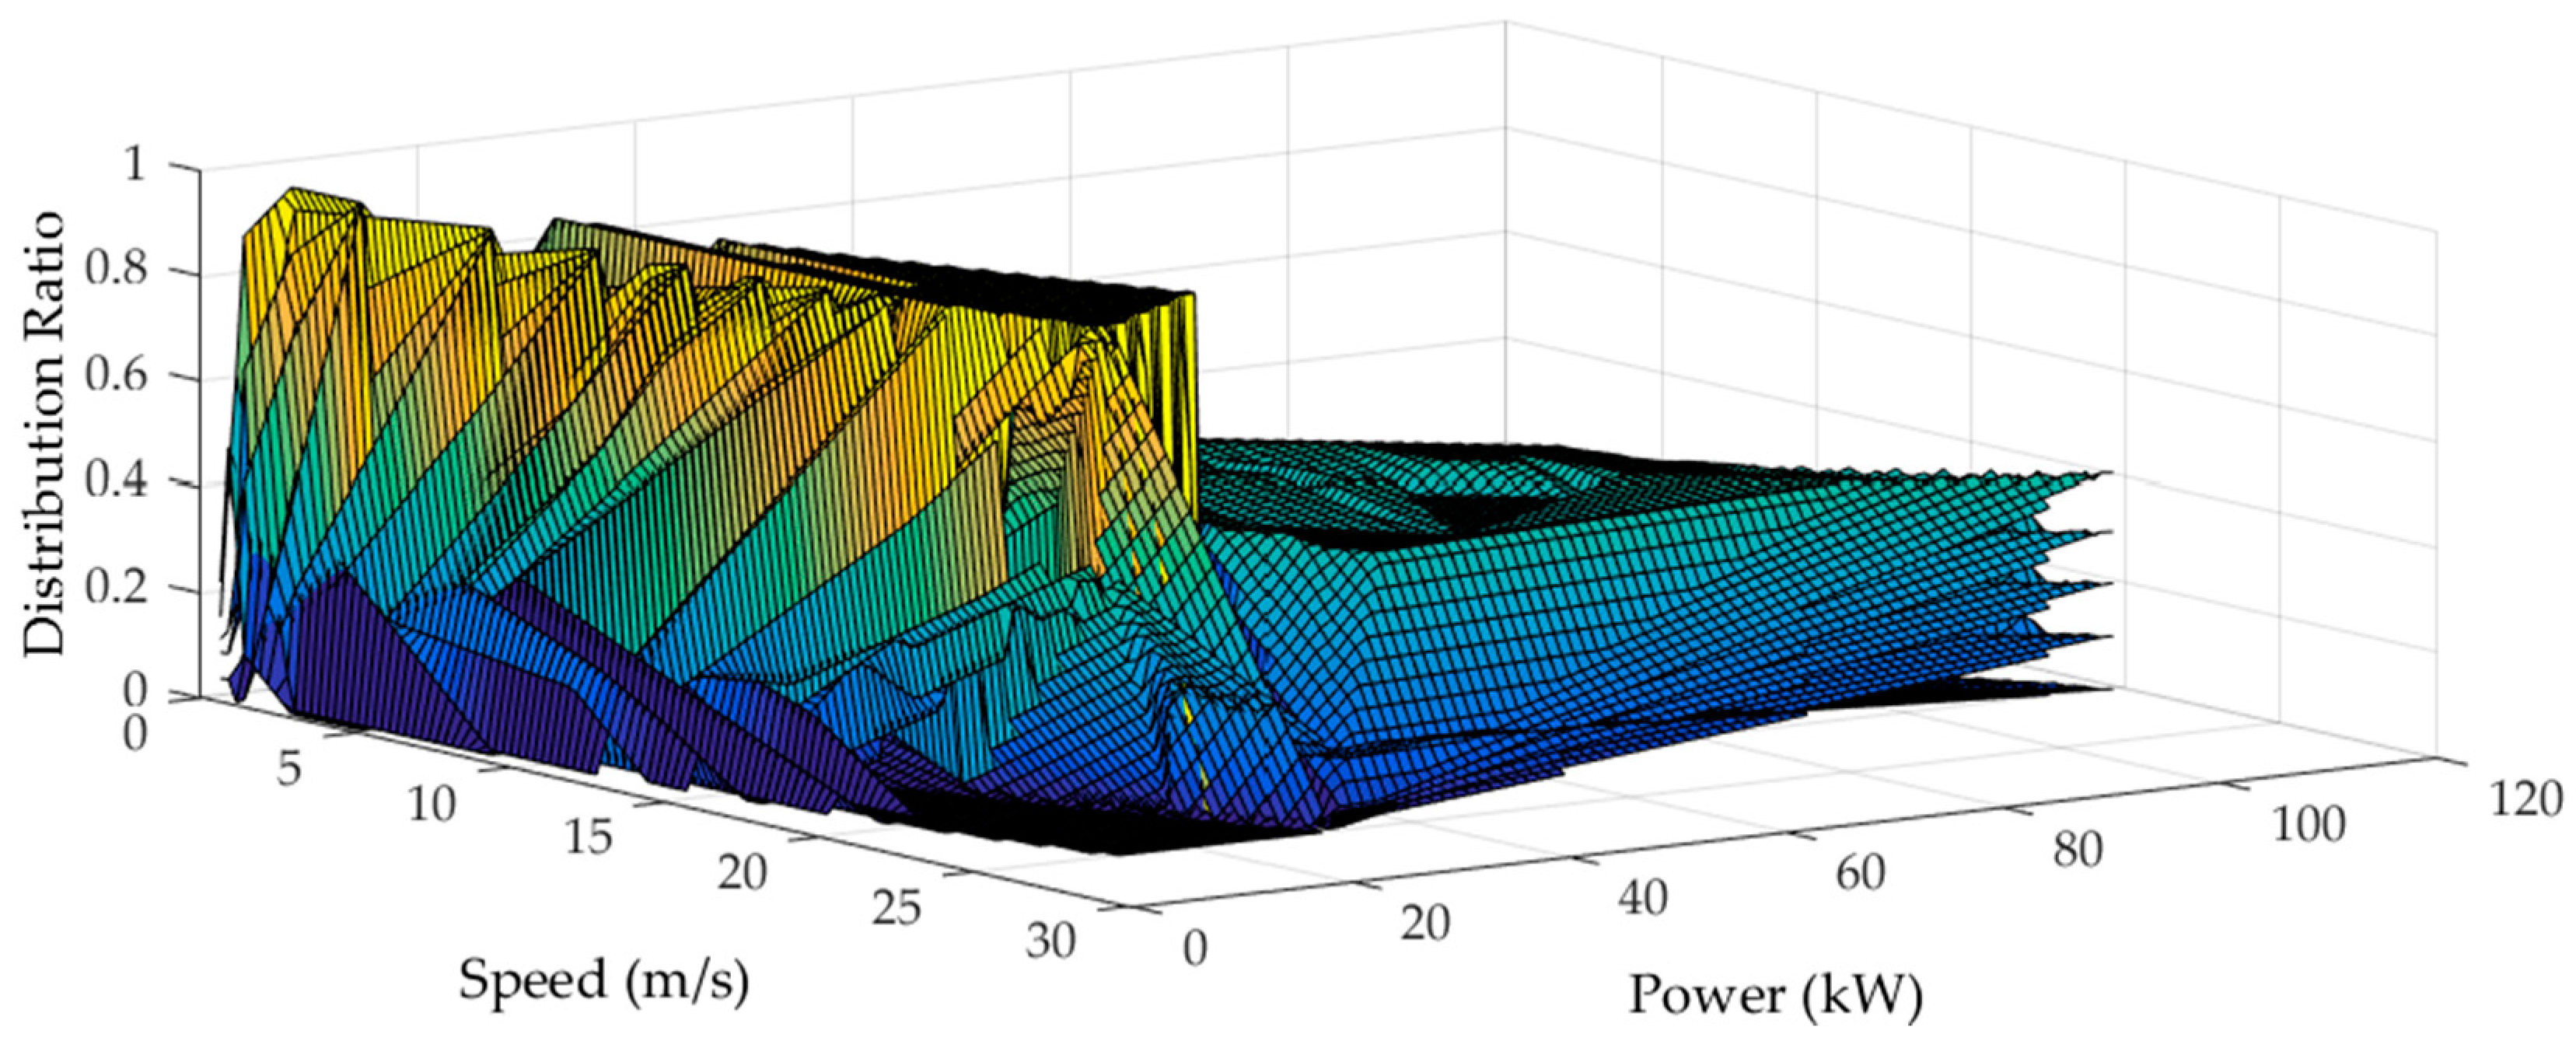
3.2. Data Processing and Calculation

It is difficult to avoid data leakage and distortion in the data collection and transmission process. Thus, the raw data is cleaned and processed, and the obtained data samples are shown in Figure 6. Seven velocity states clusters are classified through vehicle speed segmentation. The detailed classification is shown in Table 1.
As the speed and acceleration of the vehicles are modeled as the Markov chain, the state transition matrix can be calculated from the statistical frequency information of the data samples as:
T i j = n i j n i
where nij is the number of times that the velocity state cluster transitioning from vi to vj appears, ni is the total number of appearance times of vi.
According to the velocity segment database and Equation (12), the corresponding number of transition velocity segments are classified. The state transition matrix for the seven velocity states clusters are shown in Equation (13):
T i j = [ 0.6139 0.2487 0.0890 0.038 0.0065 0.0026 0.0013 0.3245 0.3641 0.2257 0.0708 0.0115 0.0033 0 0.1140 0.1868 0.3289 0.2529 0.0843 0.0281 0.0050 0.0388 0.1041 0.2152 0.3263 0.2363 0.0617 0.0176 0.0088 0.0328 0.1269 0.2451 0.3085 0.2079 0.0700 0.0057 0.0171 0.0486 0.0971 0.2400 0.3457 0.2457 0 0.0111 0.0111 0.0306 0.0972 0.2167 0.6333 ]
The Monte Carlo method is used here to generate the random numbers with the value between (0, 1). If the generated number r satisfies Equation (14), the velocity segment is selected randomly from the relevant velocity segments, which are obtained from the n-th velocity state clusters. The velocity difference between the first value of velocity in this segment and the last value of velocity in the previous segment should be less than 1 km/h. Meanwhile, the used velocity segments are deleted with the aim to maintain the difference of alternative velocity segments:
j = 1 n 1 T i j < r < j = 1 n T i j    ( 1 i 7 , 1 j 7 , n 7 )
The driving construction is divided into three parts, i.e., the beginning, middle and end part. The complete driving cycle is shown in Figure 7.

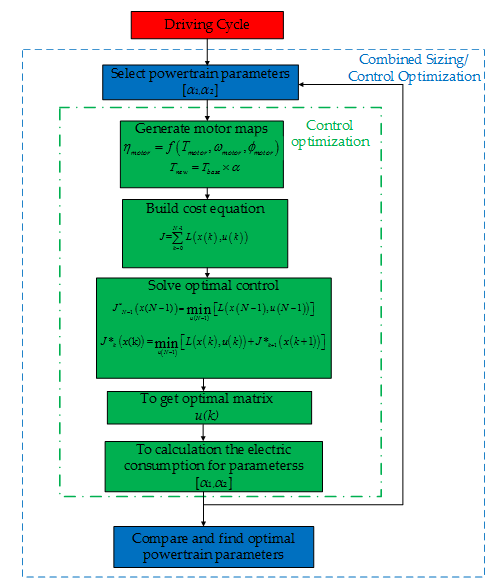
4. Integrated Sizing/Control Optimization of the Four-Wheel-Independently-Actuated Electric Vehicles (FWIA EVs)

4.1. Control Optimization of the FWIA EV

Based on the Bellman’s principle of optimality, the Dynamic Programming (DP) algorithm provides an optimal energy management through an exhaustive search of the complete control and state grids. This gives rise to the “curse of dimension” problem, which may incur unacceptable computational burden when there are a considerable number of states. Besides, a complete knowledge of driving profile is needed when applying the DP algorithm. However, the exact future power demand is usually unknown and the computational burden is prohibitive in case of multiple system states. Therefore, applying the DP to realize optimal power allocation for FWIA EVs usually serves a benchmark for other energy management strategies.

4.1.1. Problem Formulation

The state variable is the battery SOC and the control variable is λ. The discrete state-space representation of the vehicle model can be expressed as:
x ( k + 1 ) = f ( x ( k ) , u ( k ) )
where x(k) is the system state and u(k) is the control input at the time instance k, and the sampling time interval is set to be 1 s.
The aim of DP derivation is to find the optimal control input u(k) that can minimize the electricity consumption for a specific driving cycle, and thus the objective function can be formulated as:
J = k = 0 N - 1 L ( x ( k ) , u ( k ) )
where N is the time length of the driving cycle and L is the instantaneous cost at the time instance k.
The newly-constructed driving cycle is constructed based on the real-time operating data of EVs in Beijing, a typical megacity. In order to increase the representativeness and comprehensiveness of the used driving cycle for the optimal control law derivation, the target driving cycle is formed by concatenate the newly-constructed driving cycle with other six typical driving cycles.

4.1.2. The Dynamic Programming Implementation

The main advantage of DP is that it can easily deal with constrained nonlinear problems. The major formulations of the DP method can be described by Equations (17) and (18):
Step N − 1:
J * N 1 ( x ( N 1 ) ) = min u ( N 1 ) [ L ( x ( N 1 ) , u ( N 1 ) ) ]
Step k, for 0 ≤ k < N − 1:
J * k ( x ( k ) ) = min u ( N 1 ) [ L ( x ( k ) , u ( k ) ) + J * k + 1 ( x ( k + 1 ) ) ]
where J*k(x(k)) is the optimal cost-to-go function at state x(k) starting from time instant k. It represents the optimal cost that the system originates from state x(k) to the final stage under the optimal law, x(k + 1) is the state at the time instance k + 1 when the control variable u(k) is applied to state x(k) at the time instance k.
The above recursive equations are solved backwards to find the optimal control policy while satisfying the inequality constraints and the equality constraints.

4.1.3. Rule Extraction

Knowing the complete driving profile, the DP algorithm is able to obtain the optimal power allocation. Based on this merit, a speed-based torque allocation rule can be extracted by running the DP under driving cycles that cover a wide range of speed. Thereby, the optimal torque allocation ratios under different speeds and power demands can be finally derived. This serves as an implementable look-up table torque allocation strategy based on DP for real-time energy management. The resulting look-up table is illustrated in Figure 8.

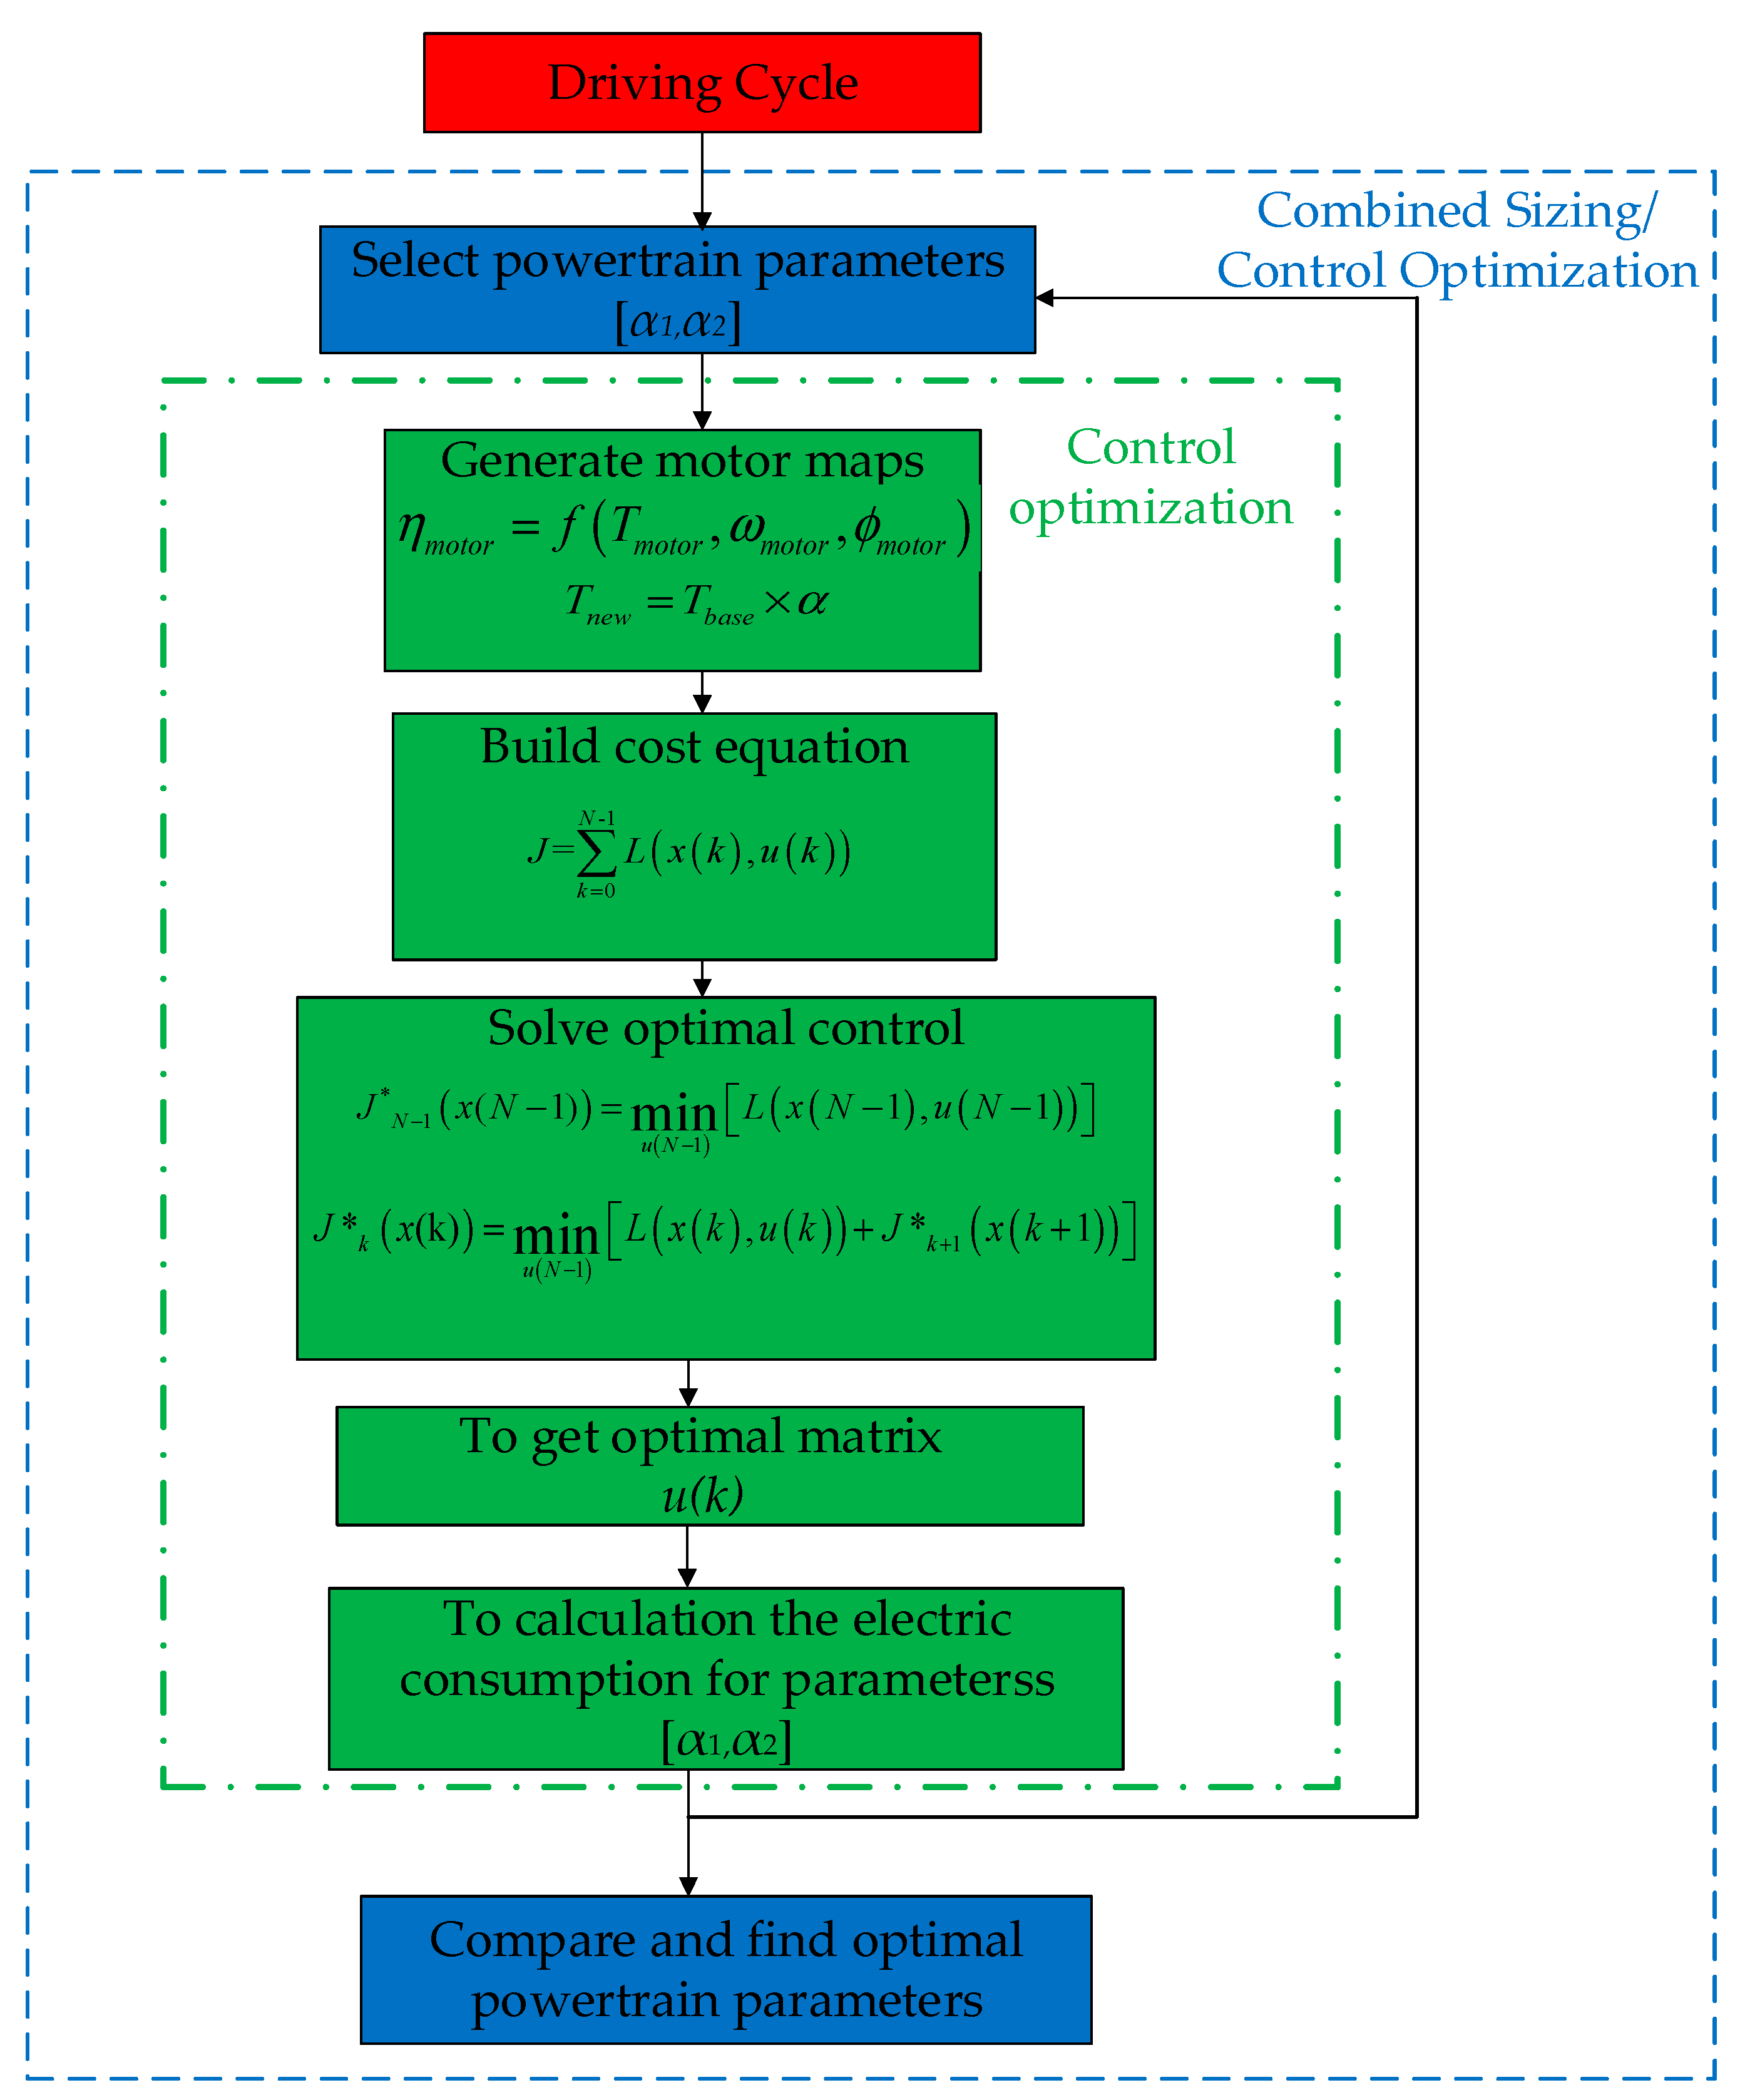
4.2. Combined Sizing/Control Optimization of the FWIA EV

For a specific driving cycle, the optimal torque/power allocation is extracted in Section 4.1.3. As shown in Figure 9, a combined sizing/control optimization process is formulated. The sizes of the front- and rear-axle motors are adjusted by α1 and α2, and then the specified motors are used in energy management development.
The formula of the combined sizing/control optimization can be described as:
J 1 = min P i n , t o t a l = k = 0 N 1 T t o t a l × ω × λ 2 η 1 ( T t o t a l 2 , ω , α 1 ) + T t o t a l × ω × ( 1 λ ) 2 η 2 ( T t o t a l 2 , ω , α 2 )
The constraints of state and control variables are given by:
{ S O C ( k + 1 ) = S O C ( k ) I b a t t Q m a x ( k ) S O C m i n < S O C ( k ) < S O C m a x T i _ m i n T i ( k ) T i _ m a x ω m i n < ω ( k ) < ω m a x I b a t t _ m i n < I b a t t ( k ) < I b a t t _ m a x P b a t t _ m i n < P b a t t ( k ) < P b a t t _ m a x 0 < λ < 1 0.1 α 1 0.5 0.5 α 2 0.9

5. Simulation Results and Discussions

In order to examine the effectiveness of the proposed combined sizing and control optimization approach, four disparate cases are presented here for comparison:
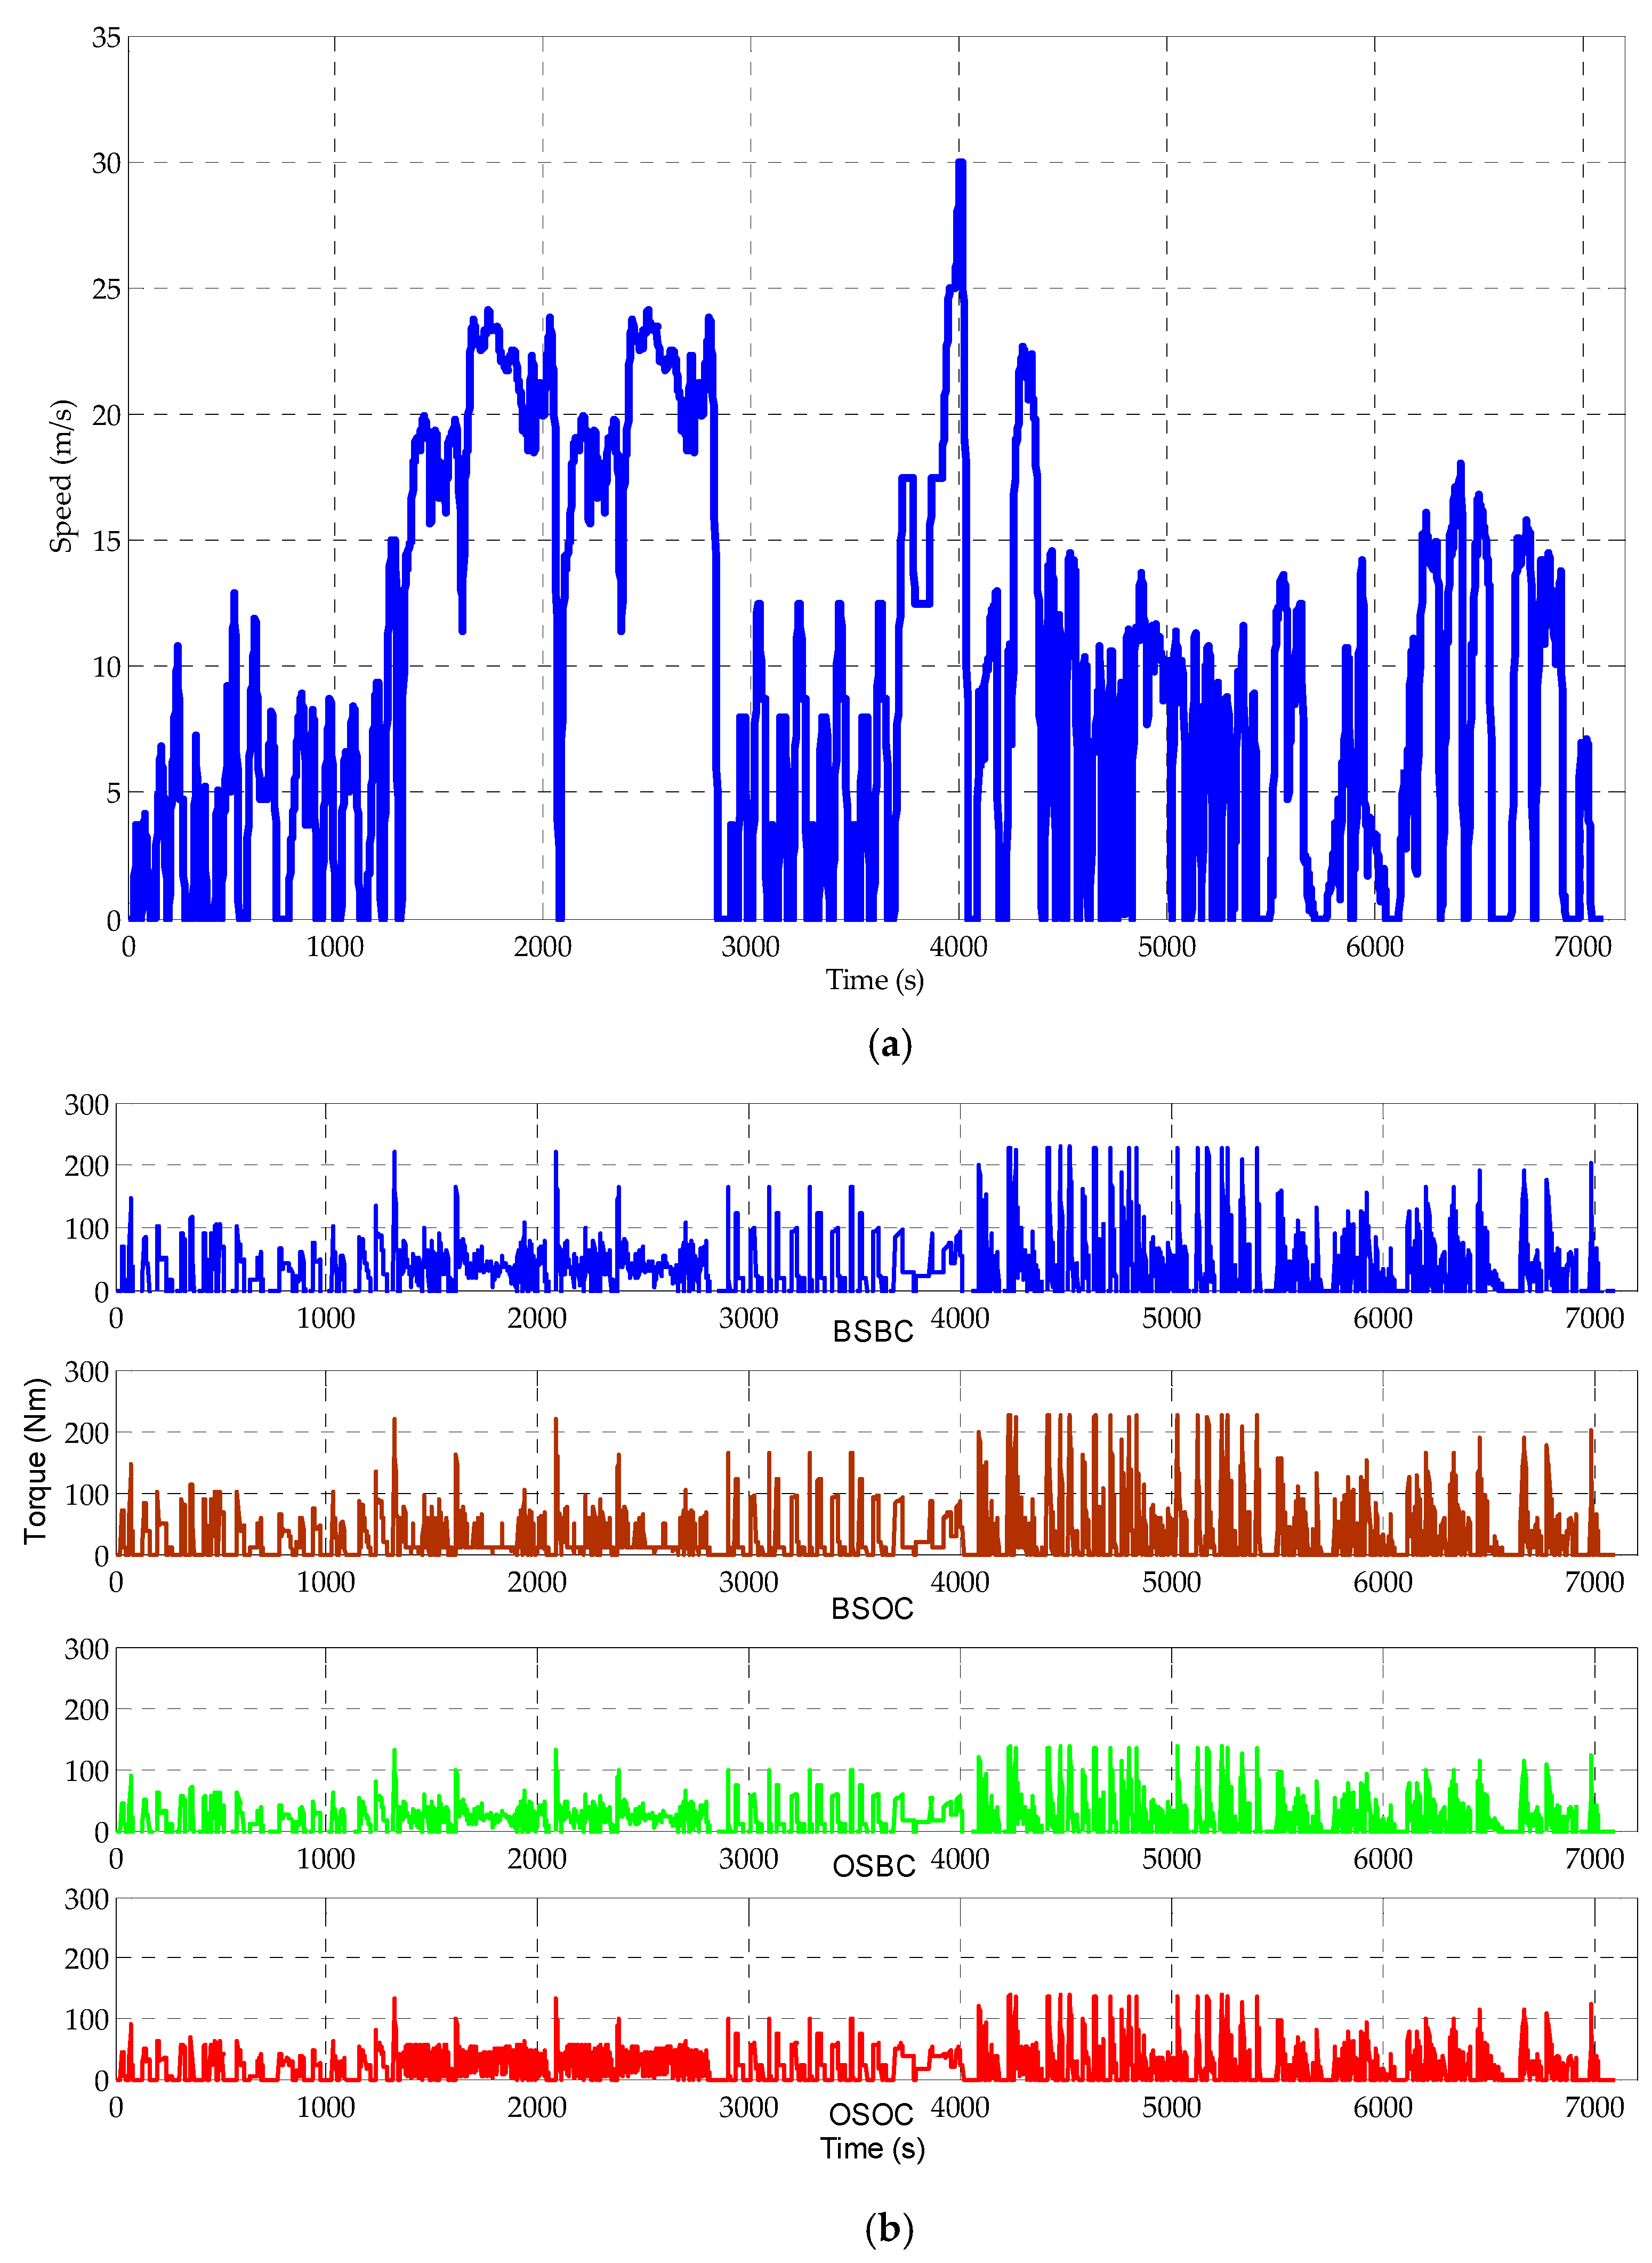
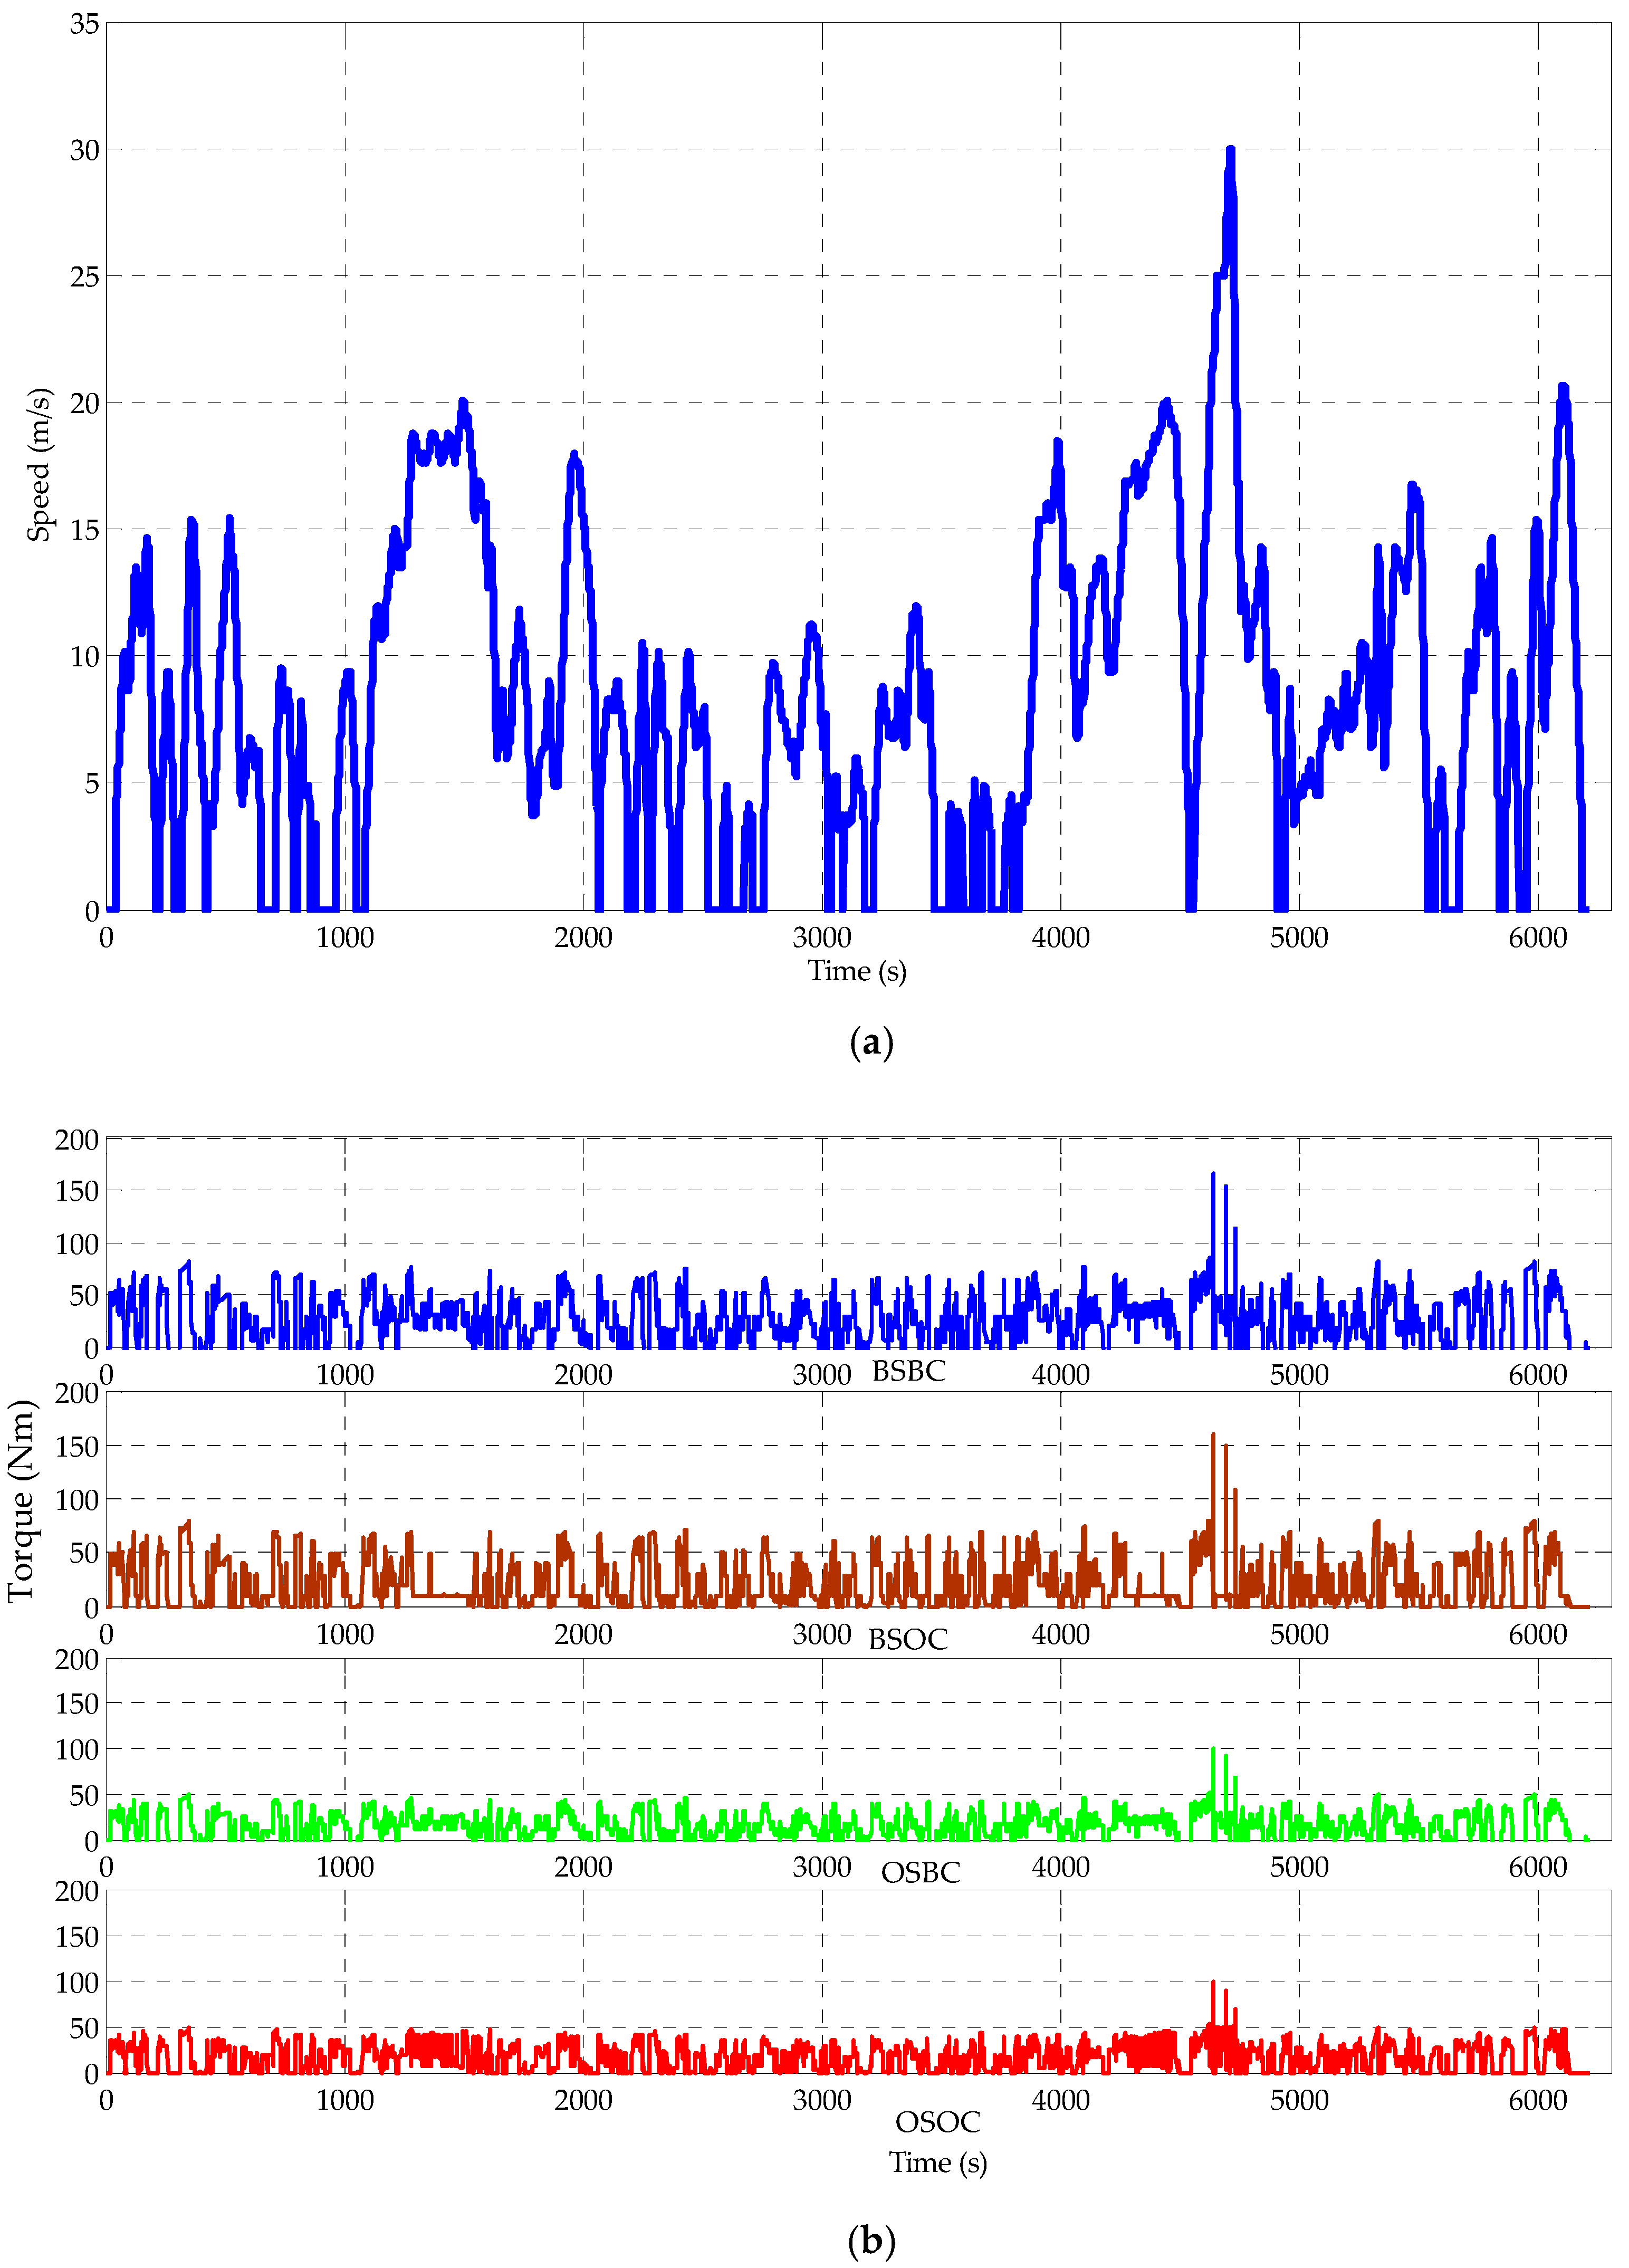
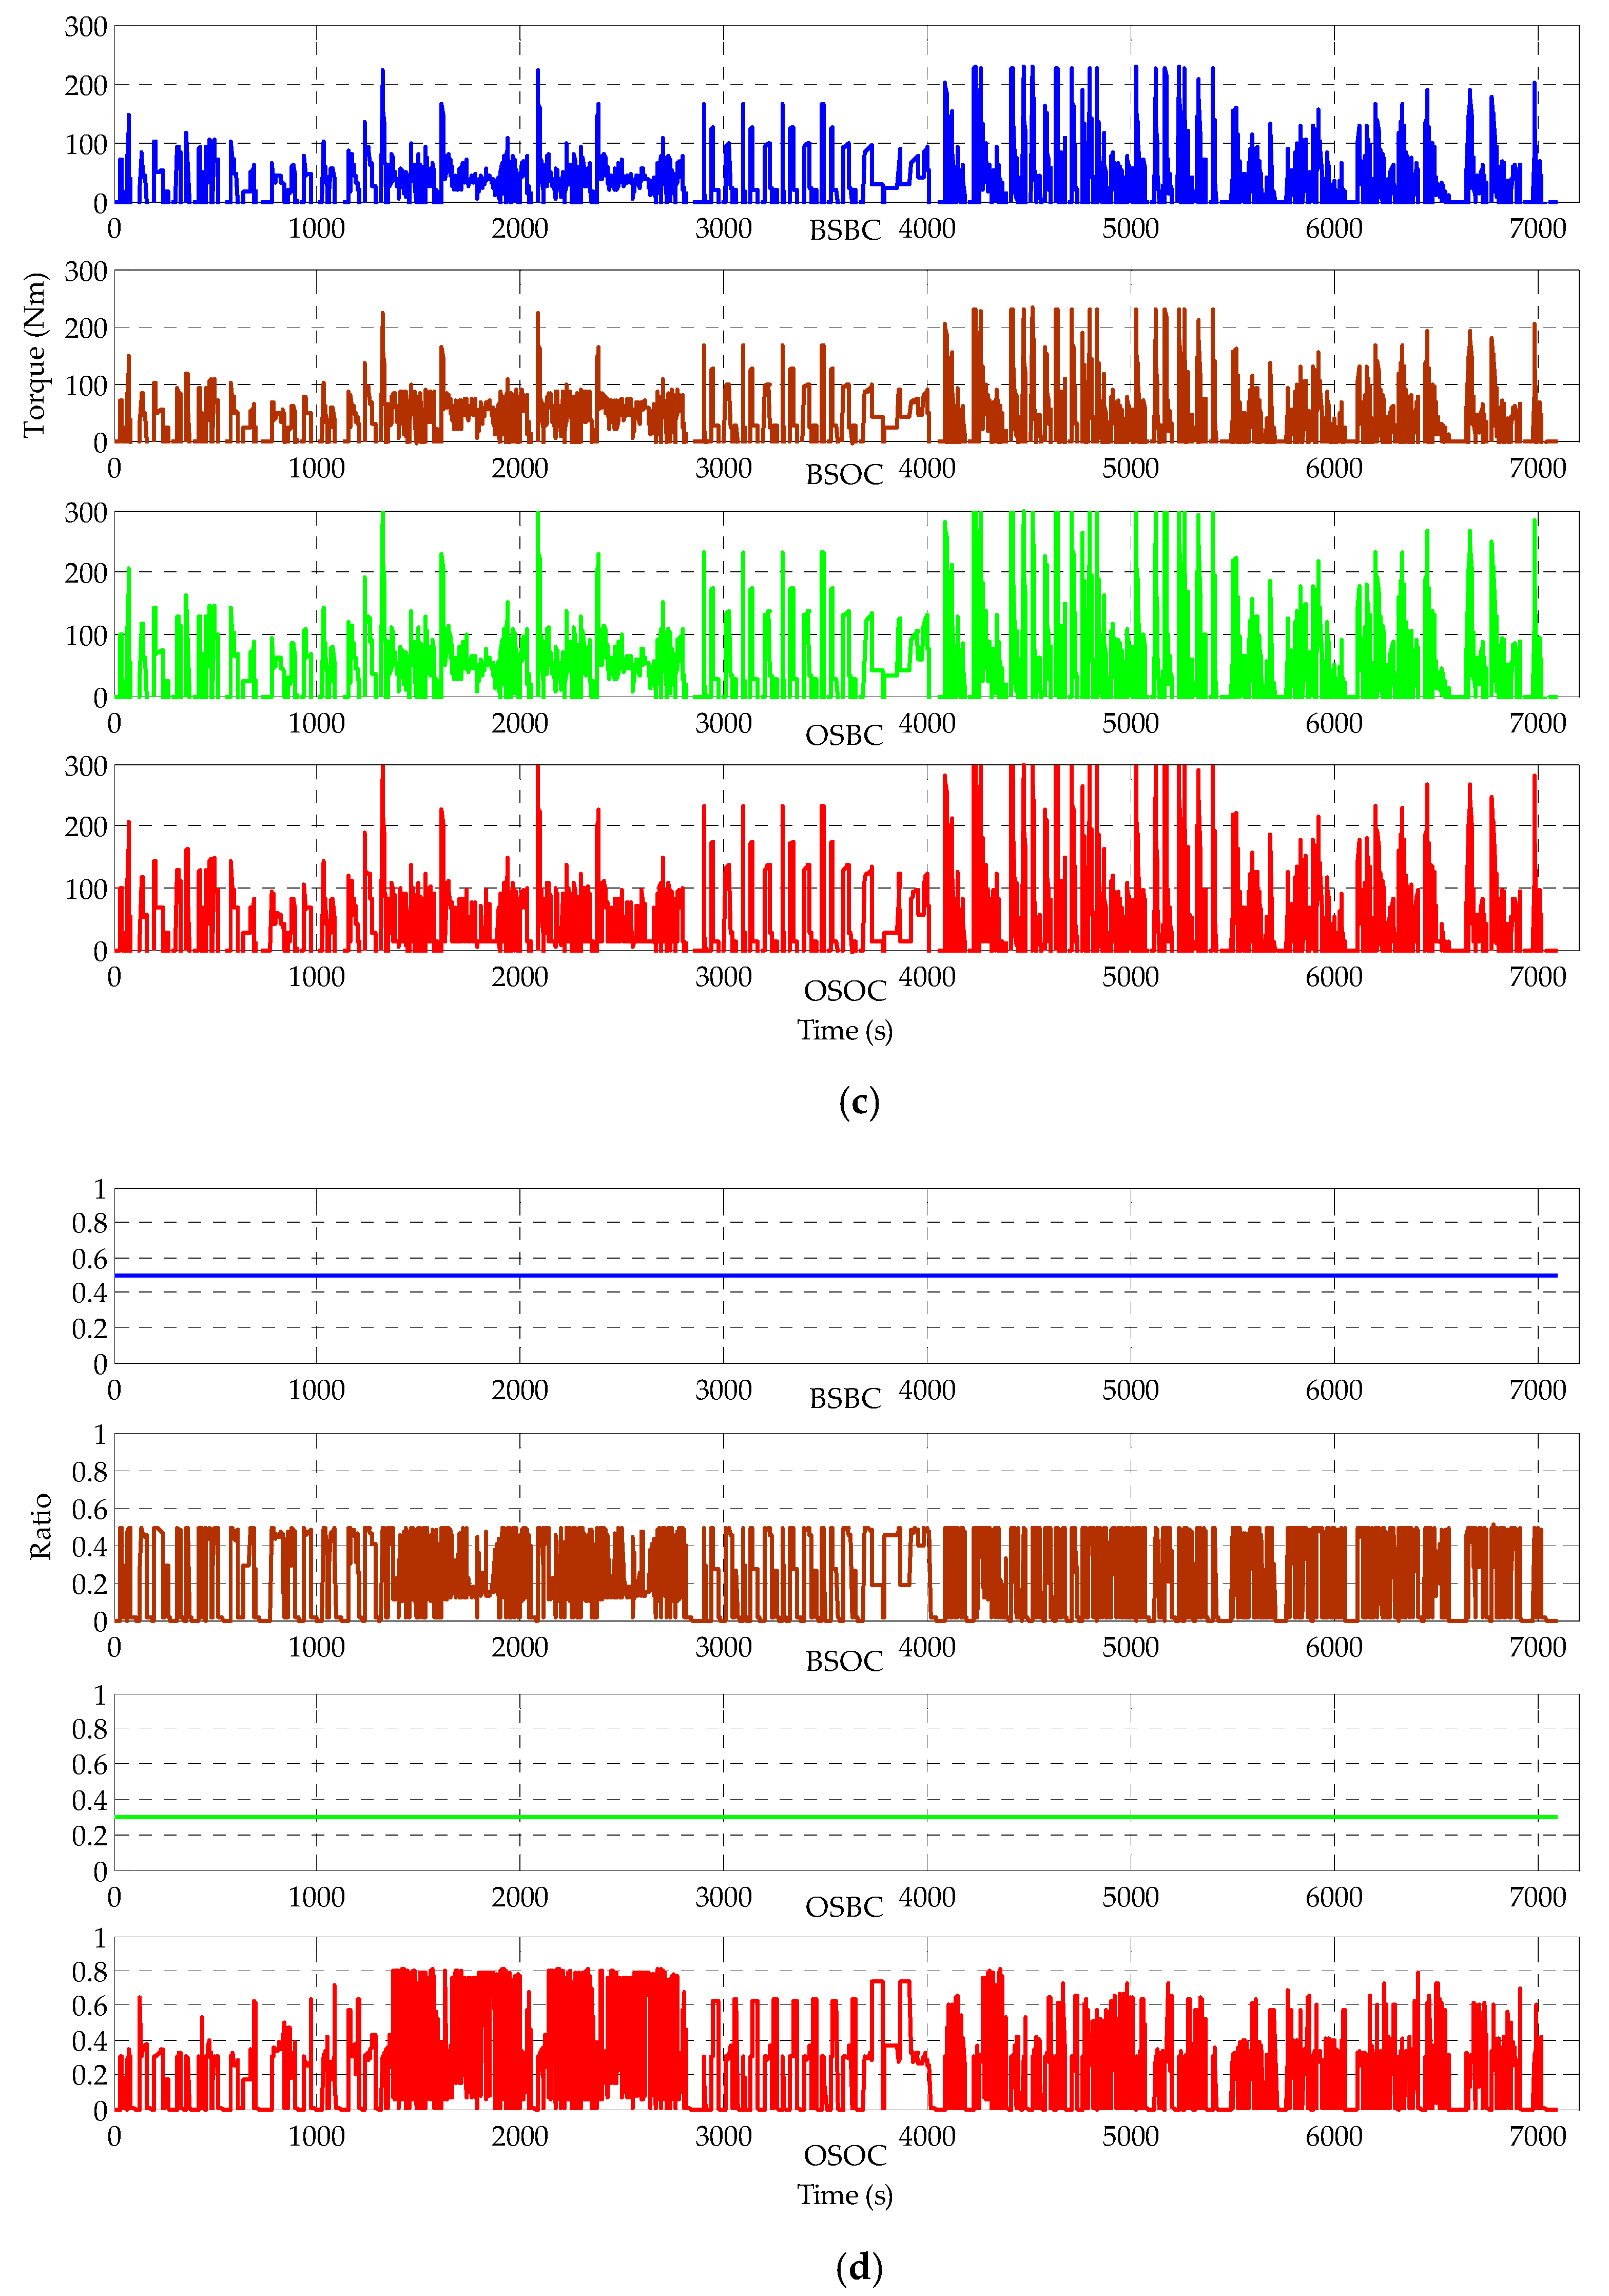
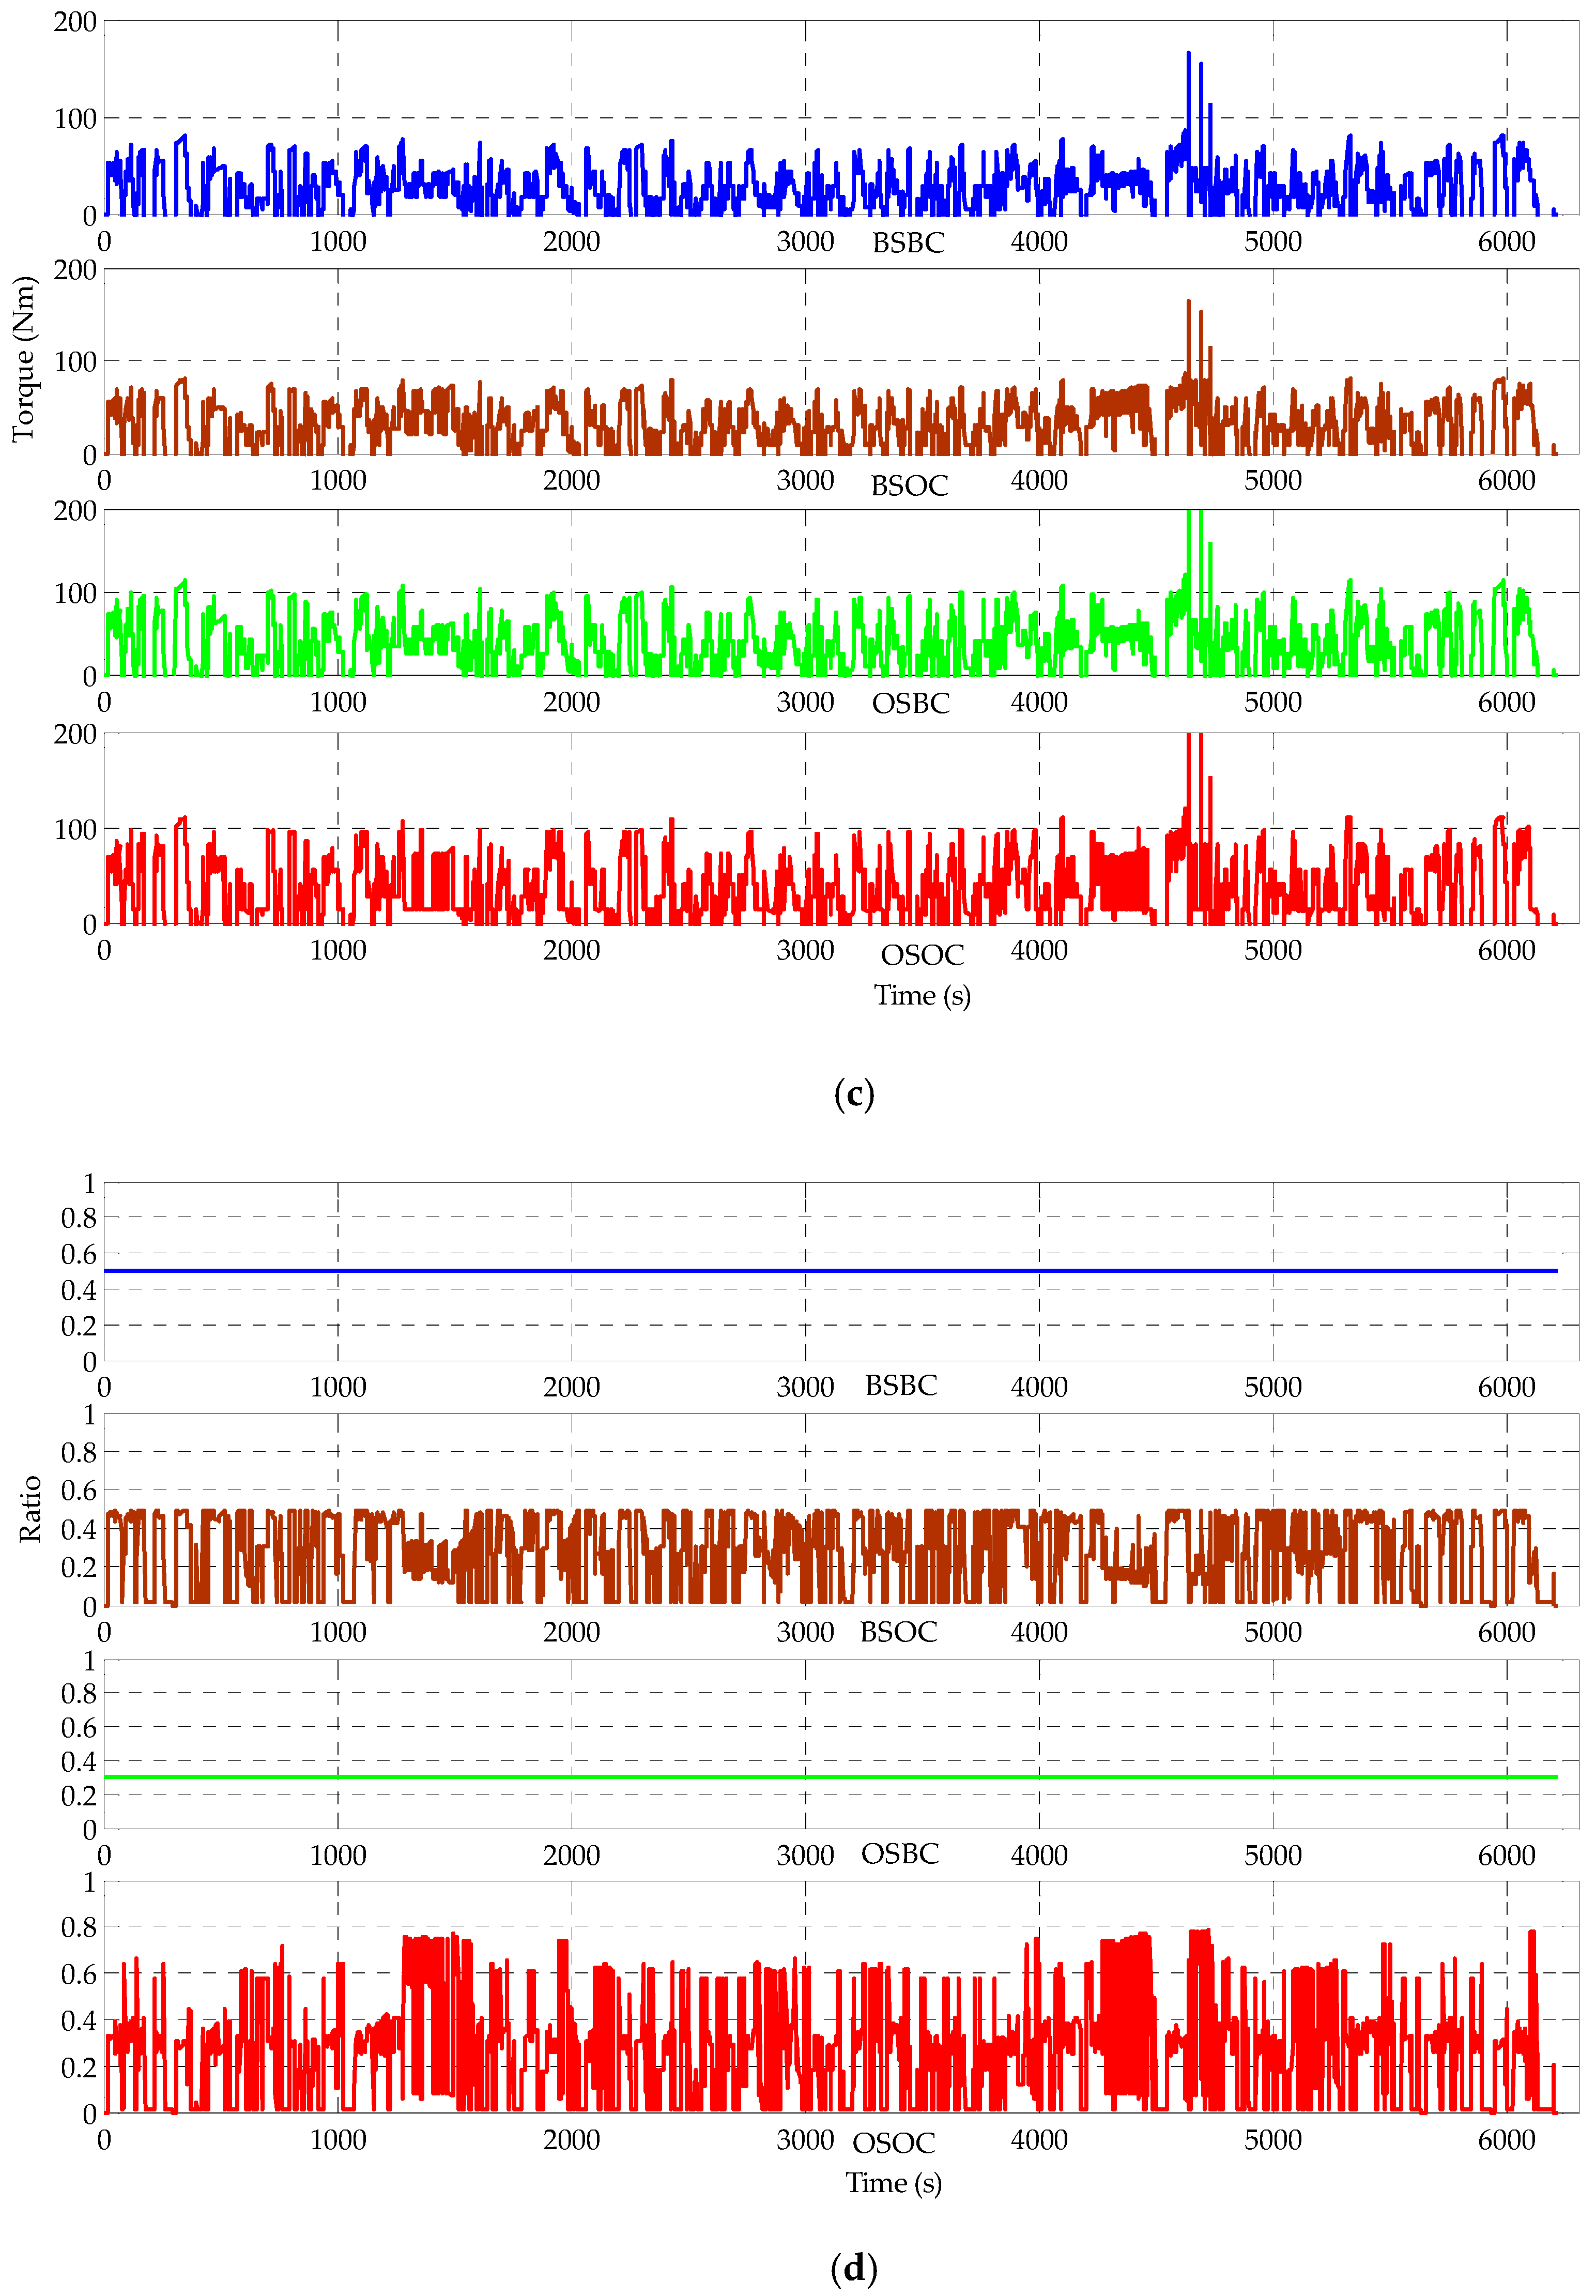
  • Baseline motor sizing + baseline control (BSBC). Four in-wheel motors with the same rated power of 30 kW are used, and a basic control strategy in which a constant proportion of power allocation for the front- and rear-axle motors is adopted as:
λ = T 1 + T 2 T 1 + T 2 + T 3 + T 4
  • Baseline sizing + optimal control (BSOC). Four in-wheel motors with the same rated power of 30 kW are also selected. However, the DP algorithm described in the study is adopted for optimal power allocation;
  • Optimal sizing + baseline control (OSBC). The baseline control strategy described by Equation (21) is used, and the sizes of both the front- and rear-axle motors are left for optimization;
  • Optimal sizing + optimal control (OSOC). This presents the combined sizing/control optimization described in the previous section.
The energy consumption of a vehicle is strongly related to the driving cycles. In this study, six typical driving cycles have been selected and directly concatenated to construct a hybrid driving cycle to enhance the comprehensiveness and representativeness of the applied driving cycle. The six selected driving cycles include the New York City Cycle (NYCC), Urban Dynamometer Driving Schedule (UDDS), West Virginia Suburban Cycle (CYC_WVUSUB), Highway Fuel Economy Cycle (HWFET), CHINACITY and NEDC. Therein, the NYCC represents the congestion conditions commonly encountered in city downtowns; the UDDS represents the typical urban driving conditions with higher speed and more frequent stop-and-go maneuvers; the CYC_WVUSUB represents a medium-speed driving cycle; the HWFET represents the high-speed road conditions with high speed and smooth driving; the CHINACITY represents China’s urban driving conditions; the NEDC is the light-duty vehicle emission fuel consumption test condition commonly used in the design of automobiles. The peak power demand for the studied vehicle is 120 kW. The front-axle motor power ratio is selected from 0.1 to 0.5 with an interval of 0.1. That is, the peak power of the front-axle motors is selected as 6 kW while the peak power of the rear-axle motors is 54 kW, when the motor power ratio is selected as 0.1. Once the sizes of the front- and rear-axle motors are determined, the corresponding optimal control strategy can be extracted based on the DP algorithm. The optimization result is shown in Table 2.
The profile of the hybrid driving cycle is illustrated in Figure 10a. Correspondingly, the required torque and power can be derived based on Equation (1), and the optimal torque allocation strategy extracted from the DP algorithm can be used. The torque allocation under four described cases are depicted in Figure 10b–d. It can be seen that the torque distribution ratio fluctuates between 0 and 1 in the case of OSOC, which is more conducive to making full use of the high-efficiency regions of the motor to achieve better overall electricity consumption reduction.
As shown in Figure 11, the operating points of the front- and rear-axle motors are shown the same under the case of BSBC, many of which are located in the low-efficiency regime.
Figure 12 shows the results under the case of OSOC. It can be seen that the front-axle motors work in the high-efficiency region while the rear-axle motors operate in the low-efficiency area in the majority of the time. However, the overall efficiency of the drivetrain system is higher than that under the case of BSBC.
Table 3 lists the energy consumption of the vehicle under the constructed driving cycle. It is worth noting the power requirements of the driving cycle is different from the hybrid driving cycle, and the DP-based energy management is also used.
The profile of the constructed driving cycle is illustrated in Figure 13a. Correspondingly, the required torque and power can be derived based on Equation (1), and the optimal power allocation strategy extracting from the DP algorithm was implemented. The torque allocation under four described cases are depicted in Figure 13b–d. It can be seen that the torque distribution ratio fluctuates between 0 and 1 in the case of OSOC, which results in a better utilization of the high-efficiency region of the motor to achieve better overall electricity consumption reduction.
Figure 14 shows that the actual working points of the front- and rear-axle motors are identical under the case of BSBC and the constructed driving cycle. Figure 15 shows the rear-axle motors have more points in the high-efficiency regions than the front-axle motors under the case of OSOC and the constructed driving cycle. This can be ascribed to the optimal torque allocation which tries to optimize the working points of the motors from the perspective of overall drivetrain efficiency improvement. As illustrated in Figure 15, despite of some efficiency sacrifice for the rear-axle motors, the working efficiency of the front-axle motors is significantly enhanced, thus leading to the overall efficiency optimization for the whole drivetrain.
Table 4 summarizes the energy consumption of the studied vehicle under the hybrid driving cycle in the four cases, and their specific energy consumption are 186.7565, 184.2159, 159.9320, and 158.5735 Wh/km, respectively. In comparison with the case of BSBC, the energy consumption improvements achieved in the cases of BSOC, OSBC and OSOC are 1.3603%, 14.3633%, and 15.0908%, respectively. It can be concluded that: (a) without optimal sizing, the energy consumption reduction through optimal control as the case of BSOC is not evident; (b) the optimal sizing represented by the case of OSBC would significantly improve the energy consumption; and (c) the optimal sizing/control as the case of OSOC can substantially improve the energy consumption. Under the constructed driving cycle, the specific energy consumption in the four cases are 143.6563, 141.0674, 126.1764, and 124.4990 Wh/km, respectively. Compared with the case of BSBC, the energy consumption reduction in the cases of BSOC, OSBC and OSOC are 1.8021%, 12.1679%, and 13.3355%, respectively. The improvement trend is consistent with that observed under the hybrid driving cycle.
Table 5 summarizes the simulation results obtained from the case of OSOC. In order to examine the results under the situations of different peak power requirements, the baseline power is increased by 10%, 20% and 30%, respectively. The same procedures are used to examine the energy consumption under the two driving cycles, with the results listed in Table 5. It can be seen that the optimal sizing ratios under the two driving cycles and different baseline peak powers are almost the same, i.e., α1 = 0.3. However, the total energy consumptions under both driving cycles see a slight increase along with the increasing baseline peak power. These results validate the effectiveness of the proposed combined sizing/control optimization method.

6. Conclusions

This paper proposes a combined sizing and control optimization for a four-wheel-independently-actuated electric vehicle (FWIA EV). A new driving cycle is constructed using the Markov chain based on the real-world data collected from SMC-EV in Beijing for electric vehicles. With the objective of minimizing the energy consumption, DP is used to extract the optimal power allocation once the motor sizes of the front- and rear-axle motors are determined. Four cases are studied to verify the superiority of the proposed scheme under the constructed driving cycle and a hybrid driving cycle that merged six typical driving cycles. Simulation results verified the superiority of our presented scheme:
  • Simulation results indicate that the improvement in energy consumption in three cases, i.e., BSOC, OSBC and OSOC, compared with that in the BSBC case is 1.3603%, 14.3633%, and 15.0908% in the hybrid driving cycle and 1.8021%, 12.1679%, and 13.3355% in the constructed driving cycle, respectively.
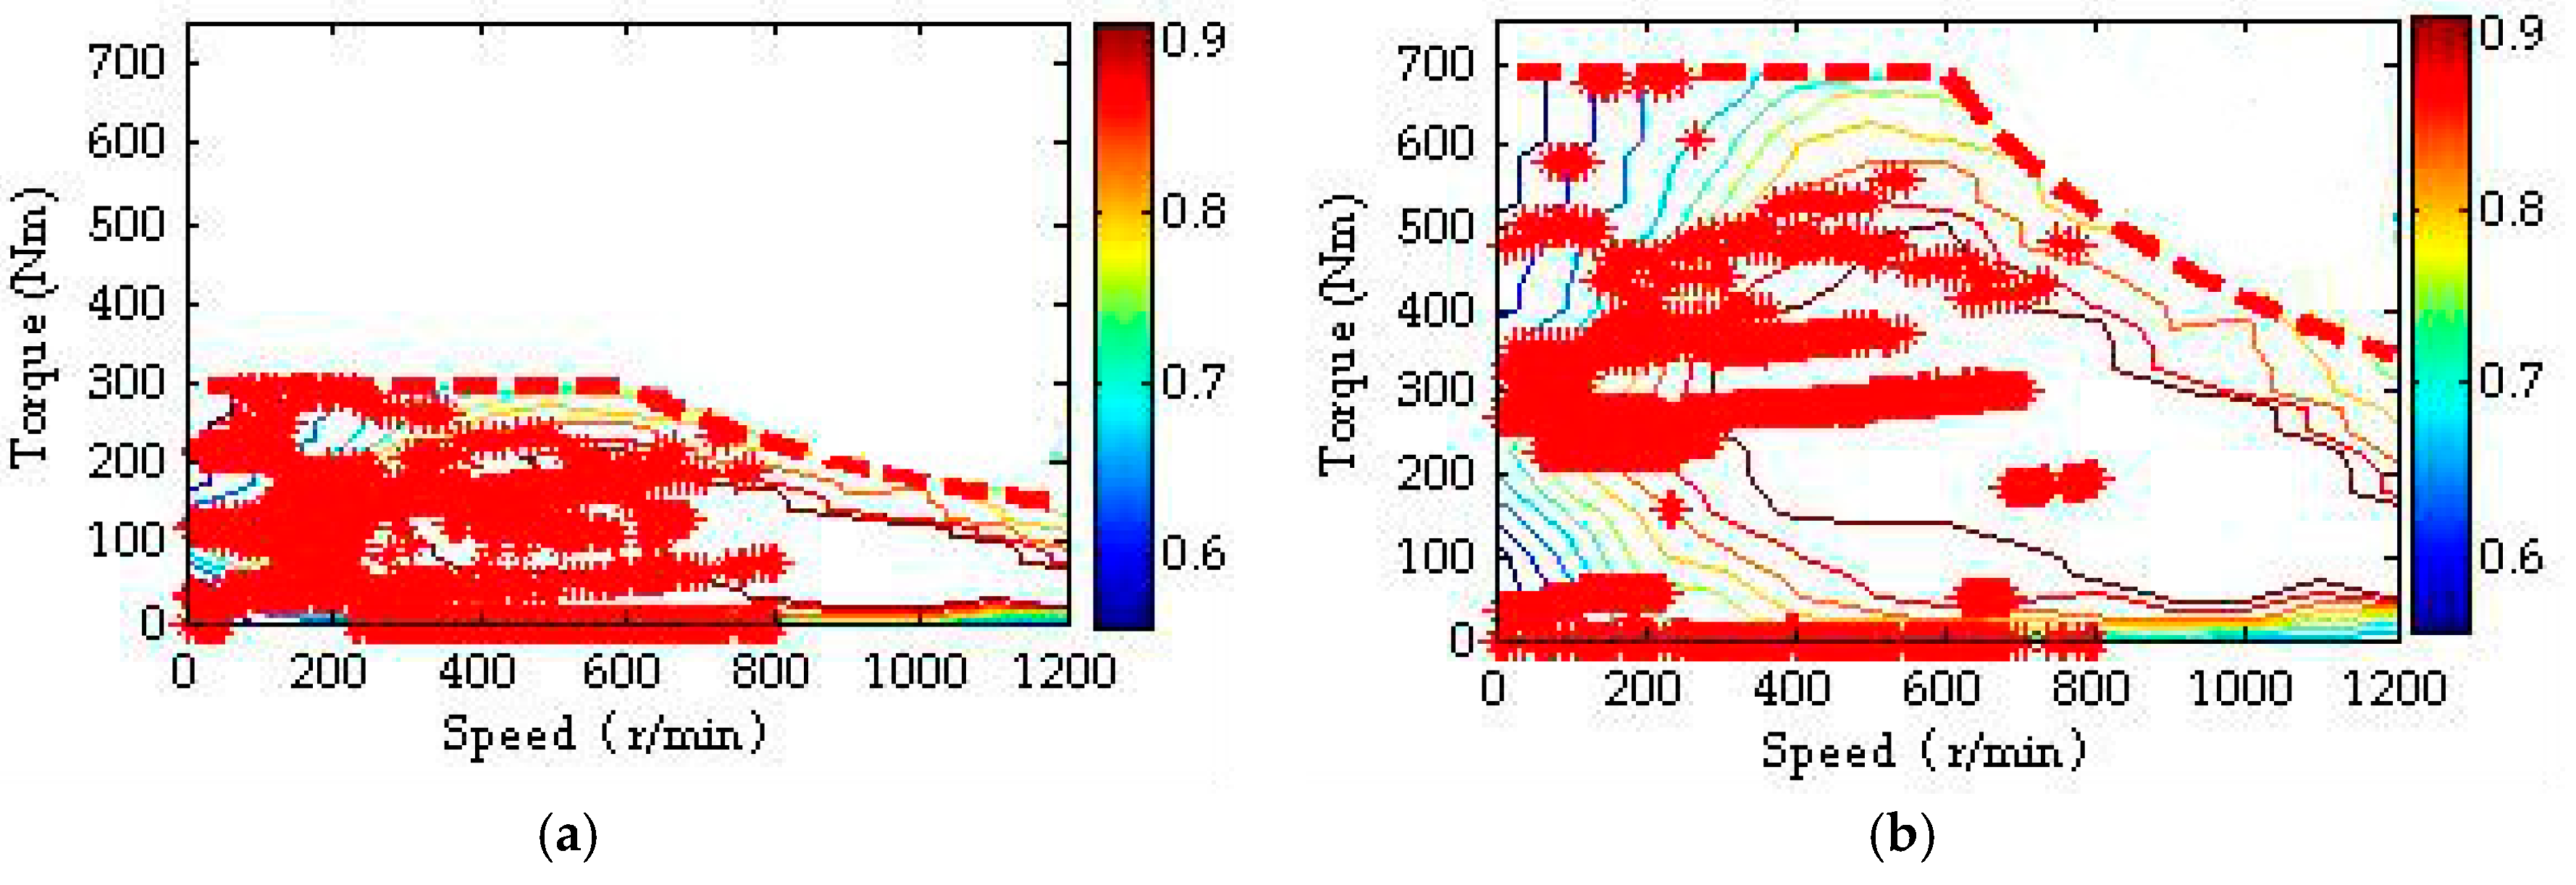
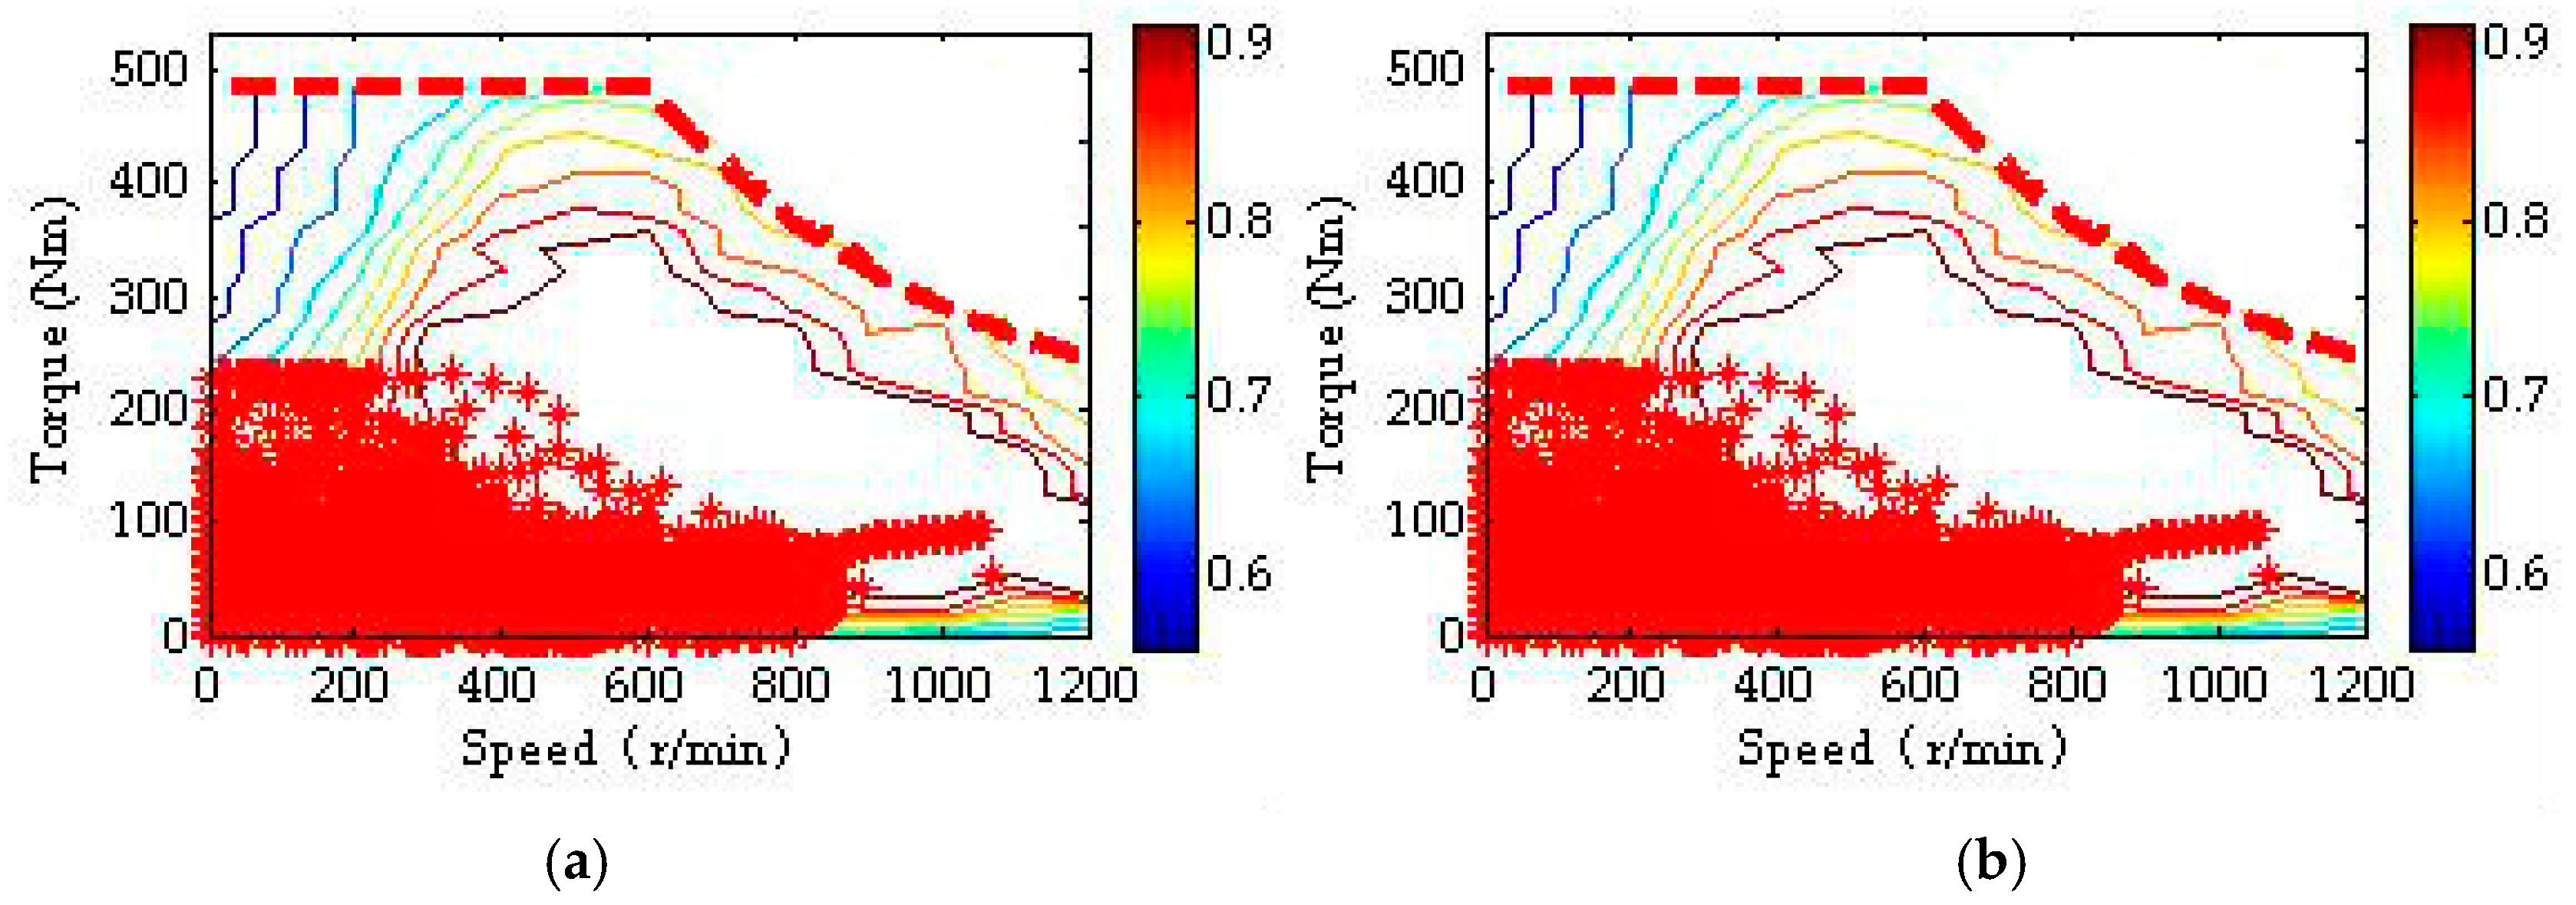
  • The optimal total motor power is searched to be 1.3 times of the motor baseline power in our example via the proposed method.
Although the effectiveness of our proposed scheme has been verified through simulation study, our future work will focus on its experimental validation and imbedded control system development.

Author Contributions

Z.W. and C.Q. conceived this paper, and completed the paper writing. L.Z. discussed the methodology and provided the resources. J.Z. and W.Y. processed the related data and validated the simulation results.

Funding

This research was funded by the Ministry of Science and Technology of the People’s Republic of China grant number 2017YFB0103600.

Acknowledgments

The authors disclosed receipt of the following financial support for the research, authorship, and/or publication of this article: This study was supported in part by the Ministry of Science and Technology of the People’s Republic of China [Grant number 2017YFB0103600].

Conflicts of Interest

The authors declare no conflict of interest. The founding sponsors had no role in the design of the study; in the collection, analyses, or interpretation of data; in the writing of the manuscript, and in the decision to publish the results.

Nomenclature

mVehicle massVVehicle velocity
CdAerodynamic drag coefficientFtotalTotal driving force
ρAir densityAfFrontal area of the vehicle
gGravitational accelerationCrRolling resistance coefficient
λAxle distribution coefficientθRoad grade
T1Front-left baseline motorFiDriving force of the i-th wheel
T3Rear-left baseline motorT2Front-right baseline motor
ω1Angular velocity of the front-left baseline motorT4Rear-right baseline motor
ω3Angular velocity of the rear-left baseline motorω2Angular velocity of the front-right baseline motor
ηmotorEfficiency of the motorω4Angular velocity of the rear-right baseline motor
αScaling factor ϕ m o t o r Rating power of the motor
TbaseTorque of the baseline motorPout,totalTotal driving power
α2Scaling factor for rear-axle motorsα1Scaling factor for the front-axle motors
η2Efficiencies of the rear-axle motorsη1Efficiencies of the front -axle motors
PbattOutput powerIbattDischarging current
RbattInternal resistanceVocTerminal voltage
LInstantaneous costNTime length of the driving cycle

References

  1. Zhang, L.; Hu, X.; Wang, Z.; Sun, F.; Dorrell, D. A review of supercapacitor modeling, estimation, and applications: A control/management perspective. Renew. Sustain. Energy Rev. 2018, 81, 1868–1878. [Google Scholar] [CrossRef]
  2. Zhang, L.; Hu, X.; Wang, Z.; Sun, F.; Deng, J.; Dorrell, D. Multiobjective optimal sizing of hybrid energy storage system for electric vehicles. IEEE Trans. Veh. Technol. 2018, 67, 1027–1035. [Google Scholar] [CrossRef]
  3. Amini, M.; Karabasoglu, O. Optimal operation of interdependent power systems and electrified transportation networks. Energies 2018, 11, 196. [Google Scholar] [CrossRef]
  4. Mumtaz, S.; Ali, S.; Ahmad, S.; Khan, L.; Hassan, S.Z.; Kamal, T. Energy management and control of plug-in hybrid electric vehicle charging stations in a grid-connected hybrid power system. Energies 2017, 10, 1923. [Google Scholar] [CrossRef]
  5. Wang, Y.; Wang, Z.; Zhang, L.; Liu, M.; Zhu, J. Lateral stability enhancement based on a novel sliding mode prediction control for a four-wheel-independently-actuated electric vehicle. IET Intell. Transp. Syst. 2018. [Google Scholar] [CrossRef]
  6. Wang, Z.; Wu, J.; Zhang, L.; Wang, Y. Vehicle sideslip angle estimation for a four-wheel-independent-drive electric vehicle based on a hybrid estimator and a moving polynomial Kalman smoother. Proc. Inst. Mech. Eng. Part K J. Multi-Body Dyn. 2018. [Google Scholar] [CrossRef]
  7. Wang, Z.; Wang, Y.; Zhang, L.; Liu, M. Vehicle stability enhancement through hierarchical control for a four-wheel-independently-actuated electric vehicle. Energies 2017, 10, 947. [Google Scholar] [CrossRef]
  8. Wang, Z.; Qu, C.; Zhang, L.; Xue, X.; Wu, J. Optimal component sizing of a four-wheel independently-actuated electric vehicle with a real-time torque distribution strategy. IEEE Access 2018. [Google Scholar] [CrossRef]
  9. Hung, Y.-H.; Wu, C.-H. A combined optimal sizing and energy management approach for hybrid in-wheel motors of EVs. Appl. Energy 2015, 139, 260–271. [Google Scholar] [CrossRef]
  10. Gu, J.; Ouyang, M.; Lu, D.; Li, J.; Lu, L. Energy efficiency optimization of electric vehicle driven by in-wheel motors. Int. J. Automot. Technol. 2013, 14, 763–772. [Google Scholar] [CrossRef]
  11. Chen, Y.; Wang, J. Fast and global optimal energy-efficient control allocation with applications to over-actuated electric ground vehicles. IEEE Trans. Control Syst. Technol. 2012, 20, 1202–1211. [Google Scholar] [CrossRef]
  12. Yuan, X.; Wang, J. Torque distribution strategy for a front-and rear-wheel-driven electric vehicle. IEEE Trans. Veh. Technol. 2012, 61, 3365–3374. [Google Scholar] [CrossRef]
  13. Nam, K.; Hori, Y.; Lee, C. Wheel slip control for improving traction-ability and energy efficiency of a personal electric vehicle. Energies 2015, 8, 6820–6840. [Google Scholar] [CrossRef]
  14. Zhang, X.; Göhlich, D.; Li, J. Energy-efficient toque allocation design of traction and regenerative braking for distributed drive electric vehicles. IEEE Trans. Veh. Technol. 2018, 67, 285–295. [Google Scholar] [CrossRef]
  15. Hu, X.; Murgovski, N.; Johannesson, L.M.; Egardt, B. Comparison of three electrochemical energy buffers applied to a hybrid bus powertrain with simultaneous optimal sizing and energy management. IEEE Trans. Intell. Transp. Syst. 2014, 15, 1193–1205. [Google Scholar] [CrossRef]
  16. Zou, Y.; Sun, F.; Hu, X.; Guzzella, L.; Peng, H. Combined optimal sizing and control for a hybrid tracked vehicle. Energies 2012, 5, 4697–4710. [Google Scholar] [CrossRef]
  17. Kim, N.; Cha, S.W.; Peng, H. Optimal equivalent fuel consumption for hybrid electric vehicles. IEEE Trans. Control Syst. Technol. 2012, 20, 817–825. [Google Scholar]
  18. Scordia, J.; Desbois-Renaudin, M.; Trigui, R.; Jeanneret, B.; Badin, F. Global optimisation of energy management laws in hybrid vehicles using dynamic programming. Int. J. Veh. Des. 2005, 39, 349–367. [Google Scholar] [CrossRef]
  19. Moura, S.J.; Callaway, D.S.; Fathy, H.K.; Stein, J.L. Tradeoffs between battery energy capacity and stochastic optimal power management in plug-in hybrid electric vehicles. J. Power Sour. 2010, 195, 2979–2988. [Google Scholar] [CrossRef]
  20. Wang, H.; Huang, Y.; Khajepour, A.; Song, Q. Model predictive control-based energy management strategy for a series hybrid electric tracked vehicle. Appl. Energy 2016, 182, 105–114. [Google Scholar] [CrossRef]
  21. Sun, C.; Hu, X.; Moura, S.J.; Fun, F. Velocity predictors for predictive energy management in hybrid electric vehicles. IEEE Trans. Control Syst. Technol. 2015, 23, 1197–1204. [Google Scholar]
  22. Amjad, S.; Neelakrishnan, S.; Rudramoorthy, R. Review of design considerations and technological challenges for successful development and deployment of plug-in hybrid electric vehicles. Renew. Sustain. Energy Rev. 2010, 14, 1104–1110. [Google Scholar] [CrossRef]
  23. He, H.; Guo, J.; Peng, J.; Tan, H.; Sun, C. Real-time global driving cycle construction and the application to economy driving pro system in plug-in hybrid electric vehicles. Energy 2018, 152, 95–107. [Google Scholar]
  24. Lee, T.-K.; Adornato, B.; Filipi, Z. Synthesis of real-world driving cycles and their use for estimating phev energy consumption and charging opportunities: Case study for Midwest/U.S. IEEE Trans. Veh. Technol. 2011, 60, 4153–4163. [Google Scholar] [CrossRef]
  25. Brady, J.; O’Mahony, M. Development of a driving cycle to evaluate the energy economy of electric vehicles in urban areas. Appl. Energy 2016, 177, 165–178. [Google Scholar] [CrossRef]
  26. Wang, H.; Zhang, X.; Ouyang, M. Energy consumption of electric vehicles based on real-world driving patterns: A case study of Beijing. Appl. Energy 2015, 157, 710–719. [Google Scholar] [CrossRef]
  27. Lukic, S.M.; Emado, A. Modeling of electric machines for automotive applications using efficiency maps. In Proceedings of the Electrical Insulation Conference and Electrical Manufacturing and Coil Winding Technology Conference, Indianapolis, IN, USA, 25–25 September 2003. [Google Scholar]
Figure 1. The architecture of the powertrain structure of a typical Four-wheel-independently-actuated Electric Vehicle (FWIA EV). MCU: Motor Control Unit; VCU: Vehicle Control Unit; BMS: Battery Management System.
Energies 11 01768 g001
Figure 2. The efficiency maps of the (b) baseline and (a,c) two scaled motors.
Energies 11 01768 g002
Figure 3. Flowchart of the driving cycle construction based on the Markov chain.
Energies 11 01768 g003
Figure 4. Big data analytics architecture of the Service and Management Center for EVs (SMC-EV) in Beijing.
Energies 11 01768 g004
Figure 5. The schematic of data collection and communication process. ECU-Electronic Control Unit; GPS: Global Positioning System; GPRS: General Packet Radio Service.
Energies 11 01768 g005
Figure 6. Velocity-acceleration diagrams of the speed datasets. (The red-scale shows the density function of velocity and acceleration).
Energies 11 01768 g006
Figure 7. Constructing the driving cycle using the Markov process based on large quantity of recorded data.
Energies 11 01768 g007
Figure 8. The optimal power and the distribution ratio allocation rule at different speeds.
Energies 11 01768 g008
Figure 9. Flowchart of the combined power management/design optimization.
Energies 11 01768 g009
Figure 10. Demand speed and torque distribution of the front and rear wheel motors under the hybrid driving cycle. (a) Driving cycle; (b) the torque distribution of the front-axle motors; (c) the torque distribution of the rear-axle motors; (d) the distribution ratio of the front-axle motors.
Energies 11 01768 g010aEnergies 11 01768 g010b
Figure 11. Operating region for (a) the front-axle motors and (b) the rear-axle motors under the case of BSBC and hybrid driving cycle.
Energies 11 01768 g011
Figure 12. Operating region for (a) the front-axle motors and (b) the rear-axle motors under the case of OSOC and hybrid driving cycle.
Energies 11 01768 g012
Figure 13. Demand speed and torque distribution of the front and rear wheel motors under the constructed driving cycle. (a) Driving cycle; (b) the torque distribution of the front-axle motors; (c) the torque distribution of the rear-axle motors; (d) the distribution ratio of the front-axle motors.
Energies 11 01768 g013aEnergies 11 01768 g013b
Figure 14. Operating points for (a) the front-axle motors and (b) the rear-axle motors under the case of BSBC and constructed driving cycle.
Energies 11 01768 g014
Figure 15. Operating points for (a) the front-axle motors and (b) the rear-axle motors under the case of OSOC and constructed driving cycle.
Energies 11 01768 g015
Table 1. Velocity state cluster classification rule.
Velocity State Cluster1267
Velocity interval (km/h)[0, 15)[15, 30)[75, 90)[90, +∞)
Table 2. The total consumed-energy for the vehicle with the power ratio of the front-axle motors varies from 0.1 to 0.5.
Power RatioEnergy Consumption (J)
0.13.6905 × 107
0.23.6784 × 107
0.33.5878 × 107
0.43.6773 × 107
0.53.6892 × 107
Table 3. The total consumed-energy for the front motor power ratio which was from 0.1 to 0.5.
Power RatioEnergy Consumption (J)
0.12.3761 × 107
0.22.3653 × 107
0.32.2746 × 107
0.42.3647 × 107
0.52.3746 × 107
Table 4. Energy consumption in four cases.
Driving CycleSpecific Energy Consumption in Four Cases (Wh/km)Energy Improvement (%)
(2) to (1)
(3) to (1)
(4) to (1)
Hybrid (1) 186.7565
(2) 184.2159
(3) 159.9320
(4) 158.5735
1.3603%
14.3633%
15.0908%
Construction (1) 143.6563
(2) 141.0674
(3) 126.1764
(4) 124.4990
1.8021%
12.1679%
13.3355%
Table 5. Energy consumption in four cases.
Total Power (kW)Optimal Sizing ResultsEnergy Consumption (Wh/km)
α1α2
HybridConstructionHybridConstructionHybridConstruction
10.30.30.70.7158.57124.4990
1.10.30.30.70.7160.02126.4101
1.20.30.30.70.7161.58128.3831
1.30.30.30.70.7163.09130.3923

