Reducing Biomass Utilization in the Ethiopia Energy System: A National Modeling Analysis

Department of Energy Systems Research, Ajou University, Suwon 16499, Korea
*
Author to whom correspondence should be addressed.
Energies 2018, 11(7), 1745; https://doi.org/10.3390/en11071745
Submission received: 12 May 2018
/
Revised: 20 June 2018
/
Accepted: 30 June 2018
/
Published: 3 July 2018
(This article belongs to the Section A: Sustainable Energy)
Abstract
:With its target of becoming a middle-income country by 2025, Ethiopia has set ambitious targets in its Growth Transformation Plan (GTP) II, such as increasing power generation capacity from 4.18 to 17.21 GW during the 2016–2020 period. However, according to the 2015 IEA energy balance table, Ethiopia depends heavily on biomass for its final energy use. In final energy service sectors, biomass takes more than 90% of the final energy consumption (36.9 out of 40.9 MTOE), 99% of which is consumed in the residential sector. Therefore, it is very important to achieve biomass utilization in the energy sector targets of Ethiopia. This paper aims to analyze the biomass consumption in the Ethiopia energy system, and discuss related policies. An integrated assessment model is chosen for its national energy modeling, and to simulate policy scenarios in a comprehensive and consistent manner. After building a reference case, three scenarios are developed: (1) higher Gross Domestic Product (GDP) and urbanization rate, (2) efficiency improvement of biomass technologies, and (3) sensitivity analysis of urbanization. It is found that biomass still holds the largest share of energy consumption in the future, which increases even more in the high GDP and urbanization scenario. Increasing efficiency of biomass technology can reduce biomass consumption, but the “rebound effect” is observed, which increases the energy service demand, thus dampening the effect of biomass efficiency improvement.
1. Introduction
Economic growth, measured by GDP, is usually correlated with energy or electricity consumption growth. There can be a unidirectional causality from economic growth to energy consumption [1]. High economic growth can induce high energy consumption, due to the increase in purchasing power. On the other hand, economic growth can be modeled as a function of production inputs, including energy. To support and achieve a high level of economic growth, the supply of energy should also be increased. However, the exact causality between the two is inconclusive, and depends on various factors, as discussed in Ozturk [2], which surveys the literature of energy/electricity arrays and the economic growth nexus.
With that in mind, Ethiopia has set ambitious targets through its Growth Transformation Plan (GTP) I and II for the 2010–2015 and 2016–2020 periods, respectively [3]. Both mid-term plans are set to reach an important milestone of becoming a middle income country by 2025. Among GTP II targets for the energy sector are increasing power generating capacity by 400% from (4.18 to 17.21) GW, and increasing per capita energy consumption by 1400% from (86 to 1269) kWh [4].
Currently, Ethiopia depends heavily on biomass as an energy source, which accounted for 45.8 out of 49.9 MTOE of total primary energy supply in 2015. In the final sectors, biomass takes more than 90% of final energy consumption (36.9 out of 40.9 MTOE), 99% of which is consumed in the residential sector [5].
The main energy resource used in electricity generation is hydropower. The electricity power system consumes 832 KTOE of hydropower, 65 KTOE of other renewables including geothermal, solar, etc., and 1 KTOE of oil products, and produces 898 KTOE of electricity. In the final sector, 38.7% of electricity is consumed in the residential sector, 33.7% is consumed in the industry sector, and 26.9% is consumed in commercial and public services.
Ethiopia has also set a challenging environmental target through its Nationally Determined Contribution (NDC), which dictates 64% abatement of greenhouse gas emissions from the Business-As-Usual (BAU) level by 2030 [6]. It can be inferred, then, that Ethiopia aims to become a fast growing economy with over 9% of real GDP growth rate, but with lower emissions.
To achieve such targets, excessive biomass utilization cannot be overlooked. A study is required from this perspective to assess the impacts of biomass utilization on the overall energy system in Ethiopia via various scenario analyses. What would be the effect of higher GDP and urbanization rate, and socioeconomic changes that are expected in the future? How great is the effect of biomass technology improvement? Can improving the electricity system affect biomass utilization? Those are some of the research questions to be answered in this study.
In this study, an integrated assessment model, the Global Change Assessment Model (GCAM), is chosen as the main analysis tool. The model is flexible enough to explicitly accommodate most of the detailed technologies within the model for future competition. GCAM adopts logit equations for technology competition, avoiding corner solutions in linear programming models. The whole energy system is represented so that each detailed step of energy flows can be separately modeled and captured. In addition, GCAM is open source software.
2. Literature Review
The energy system in Ethiopia is currently dominated by biomass energy. One way to reduce the dependency on biomass is to increase the penetration of electricity, which is currently dominated by hydropower. However, hydropower might have issues of intermittency due to the lack of water supply, especially in the dry season, or in the possibility of drought. Because of that, some studies have been conducted as efforts to explore the diversification possibility in the electricity sector. For example, Asress et al. [7] explored the wind energy potential in Ethiopia, while Bekele and Tadesse [8] explored the hybrid type of energy generation.
Other studies venture to find better utilization of biomass itself, before electrification can reach the area. For example, Gwavuya et al. [9] analyzed the transition of traditional biomass utilization, which is based on dung and firewood (mainly consumed by people of very low income) to biogas. In another case, Tucho and Nonhebel [10] discussed bio-waste (straw, manure) utilization for cooking. It also points out the possible direct environment impacts of externality caused by high biomass utilization, the most important of which is the deforestation threat.
Tucho and Nonhebel [10] then warn that even when more efficient tools are used (biogas, briquette) instead of the traditional “three stones stove”, the majority of households would still not be able to be self-sufficient, due to the limitations of both land and cattle ownership.
Regarding energy consumption patterns between rural and urban, several surveys are available. For example, Mulugetta [11] discusses the consumption patterns in rural Ethiopia. It also provides the national energy balance disaggregated into urban and rural households, albeit from an old source (1992). Another piece of data comes from Wolde-Ghiorghis [12], which slightly updates the data to the year 1996. In both articles, the energy utilization in rural areas is found to be higher than that of urban areas, both in total, and per capita.
Comparing this information with that of other developing countries, especially African countries, can be difficult, due to the lack of important data. Some of the most readily available data comes from the India case, such as reported by Pachauri [13], which analyse the household energy requirements in India. It shows that the energy requirement per capita in urban areas is higher than rural areas by 25% on average. However, it is interesting to note that Pachauri and Jiang [14] provides different information. In an attempt to analyze the household energy transition in India and China, the energy utilization per capita in rural areas is found to be higher than that of urban areas. But even though the structure of energy mix is relatively similar, rural areas consume a lot more biomass, while urban areas diversify their energy into electricity, LPG, and other sources.
3. Model and Data
3.1. Global Change Assessment Model
GCAM is an integrated assessment model with interlinked representation of the economy, energy, agriculture, land use, emission, climate, and water system. It was developed by the Joint Global Change Research Institute (JGCRI), a joint research group between the Pacific Northwest National Laboratory (PNNL) and the University of Maryland [15,16,17]. GCAM has been widely used to evaluate the impacts of socioeconomic development, climate policy, technology and resource development, and energy policies. For example, it has been used to analyze energy and climate issues, and has contributed to high-level modeling and assessment forums, such as the Intergovernmental Panel on Climate Change (IPCC) and the Energy Modeling Forum (EMF).
The energy system in GCAM is composed of many interconnected sectors. Each sector produces outputs that utilize several technologies that differ in cost, efficiency, and input fuels. The technologies within a sector compete with each other, in order to satisfy the output demand of that sector [18]. The technology competition in GCAM is governed by the logit-type equation, which was originally developed by McFadden [19].
GCAM is an equilibrium model that seeks to balance supply and demand across the markets of goods. The main “goods” here are energy, agriculture products, and—when the carbon policy is applied—carbon. In general, the algorithm to find the model solution is to: (1) choose a set of initial energy prices; (2) calculate the model resource supplies; (3) calculate the end-use demands; (4) calculate the energy (fuel) needed to satisfy the end-use demands; (5) check if the supplies equal the demands; and (6) solve the model by minimizing the difference between supply and demand by changing the price sets, and iterate the steps, until the given tolerance level is achieved.
3.2. Energy Balance of Ethiopia
Based on the energy balance provided by the Ethiopian government, in the 2014–2015 period, it is shown that 90.14% of the total final energy consumption in Ethiopia is consumed in the household sector. Within the household sector, 98.3% of the total final energy comes from primary and delivered biomass energy. It can also be seen that 99.2% of the total final primary biomass energy is being consumed in households. From the total final energy consumption, 86.74% comes from the primary biomass energy [20]. Please note that although the exact numbers are not the same as those of the IEA Energy Balance, the structure of this local data gathered from the Ministry of Water, Infrastructure and Energy of Ethiopia (MOWIE) [20] in principle agrees with its IEA counterpart. For example, the biomass energy use in final energy use is high in both IEA (90%) and MOWIE (86%), and the same applies with biomass utilization in the household (99% in the case of IEA, and 98% in the case of MOWIE). It is also worth noting that the period covered in each energy balance is different, since the Ethiopia report covers July 2014–June 2015, instead of the full period of 2015. These data indicate that the other sectors (commercial, industry, transportation) consume less primary biomass energy in their mixture.
However, it must be noted that in GCAM, the data from the IEA energy balance is used to provide the historical trend for detailed energy products and flows (flow in the energy balance table indicates the elements of row, showing the flow of energy including production, transformation, and final usage type), for most, if not all, of the countries. This is due to the global nature of GCAM. For this study, the chosen approach is to utilize the IEA version of the Ethiopian energy balance to construct the base of the national model. Then, the detailed domestic energy balance, as well as other locally available information (surveys, documents, reports), are used for further augmentation of the model whenever necessary. It must also be noted that although the industry, transportation, and power sectors are modeled for this study, the whole discussion in this study is focused on the building sector and biomass utilization.
3.3. Building Sector in Ethiopia
The building sector modeling of GCAM-Ethiopia is focused on the household and commercial/other consumers’ part of Ethiopia’s energy balance. For the detailed building sector modeling in GCAM-Ethiopia, additional information, such as the energy consumption by energy service type (heating, cooling, cooking, lighting, etc.) for both urban and rural areas are required. The general idea is to divide the building sector into residential (which is further divided into urban and rural areas), and commercial buildings. It is assumed that the rural commercial area is quite small in size, and the data is expected to be even more difficult to gather. As such, a single representation of the commercial sector is chosen.
One piece of information is extracted from a national survey [21], which summarizes the percentage distribution of households by the source of energy for lighting and cooking, divided into urban and rural, as shown in Table 1. In the case of lighting, the various forms of electricity (private, shared, and battery) are aggregated into electricity, while “Firewood” and “Other” are combined into biomass. In the case of cooking, most of the fuels (collected firewood, purchased firewood, charcoal, leaves/dung cakes, and others) are combined into biomass, while butane gas is changed to gas.
Another piece of information is the “urban population and urbanization level of 2007 and 2012 by regional states” table, which comes from the Central Statistical Agency (CSA)’s 2007 census and projection by a consultant [22], as shown in Table 2.
Since the given information is limited, a couple of additional assumptions are made: first it is assumed that the building sector does not consume energy for heating and cooling. Meanwhile, it is assumed that hot water technology is only required for commercial buildings, especially for hotels (it is noted that not all government buildings in the capital city, Addis Ababa, have air conditioners installed; the same applies to most of the hotels). Residential buildings are assumed to not yet require hot water. Another assumption is made to allocate all LPG and refinery gas usage in the residential sector to cooking in urban regions.
According to MoWIE [20], biomass accounts for 89.3% of the total final energy consumption. In particular, for residential sector energy consumption, 98.3% is accounted for by biomass. Documentation on the survey result of cooking and lighting energy consumption (Table 1) only reports the percentage of energy product consumption pattern. That is, information on the physical quantity of the energy use, either in kcal, KTOE, or TJ, is not available. The same for the urban versus rural energy consumption. Therefore, the per capita energy consumption of urban and rural areas cannot be calculated based on the given information. Several other studies, such as Shanko and Lankew [23], only provide information on the percentage of usage based on local surveys, instead of nationally aggregated energy consumption.
A closer examination of Mulugetta [11] provides some information on this issue: Providing examples clearly differentiates the total final energy consumption of urban and rural areas. The urban vs. rural area final energy consumptions are 892 and 11,814 KTOE, respectively, showing the urban energy consumption is only 7.55% of that of the rural. This case is based on the population of 56.4 million with an urbanization rate of 13%, showing an urban population of only 15.1% of the rural population. With and denoting E, P, U, and R as energy consumption, population, urban, and rural, respectively, urban per capita energy consumption for the given case, per capita energy consumption of urban to rural, is found to be 0.5 (This value can vary between countries. For example, Chaturvedy et al. [24] reported that in India, the urban energy consumption per capita is larger than that of urban area. Meanwhile, Yu, et al. [25] reported that in China, the urban energy consumption per capita is only around 0.366 of its rural counterpart.):
Another report from Wolde-Ghiorgis [12] shows similar information in 1996. The data reported here suggests that out of 644,749 TJ (15,399 KTOE) energy consumption in the household sector, 602,184 TJ (14,383 KTOE) comes from rural households, while the urban residential sector consumes 42,565 TJ (1017 KTOE). This shows that urban energy consumption is still low in comparison to that of rural, which is at 7.07%. However, as mentioned above, there is no recent information for Ethiopia that is reliable enough to be used in this study.
Instead of using a readily available compact dataset, through a combination of the information on per capita energy consumption with the survey results on energy consumption pattern [21], and utilization of the energy balance table [5], it is possible to disaggregate the energy balance table for urban and rural cases. However, several assumptions are required, considering the lack of information on energy consumption. One of such assumptions is taken to calculate the 2010 value of urban/rural energy consumption ratio from the value found in Mulugetta [11], which is 0.5. The assumption is that urbanization would increase the energy consumption per capita in the urban areas by the same rate, while the rural area energy consumption per capita is held constant. Based on this calculation, the ratio of urban/rural energy consumption per capita is calculated to be 0.69.
In addition, the energy services required by each sector assume that there is no heating and cooling demand for both the residential (urban, rural) and commercial sectors. Also, it is assumed that there is no hot water for the residential sector, only in the commercial sector.
Regarding the consumed fuels, another assumption is that ‘LPG and refinery gas’ consumption in the residential areas is assigned exclusively for cooking service in urban areas.
Figure 1 shows the general construction process of building energy consumption data for the base year. It must be noted that in GCAM, the base year used is 2010. Table 3 is then created based on the above design. Orange-highlighted data are taken directly from the energy balance. Such data is used as the anchor for the disaggregation process.
4. Scenario Development
4.1. Reference Scenario
To analyze the energy sector in Ethiopia, several scenarios composed of several components are examined. The first component is socioeconomics. In this component, two scenarios are developed, the reference, and high level of GDP. The data for this scenario are based on the work of the Korea Development Institution [26] Table 4 displays the GDP scenarios used for the analysis in this study.
The GDP in GCAM is represented as a function of population, base year GDP, labor force, and labor productivity growth. For the population, Figure 2 shows the value used in GCAM in comparison with other population projection, specifically that of the Central Statistical Agency of Ethiopia (CSA) [22] and the United Nations (UN). The exact values of the three projections are different, which can be explained by the difference in underlying assumptions and modeling used to create the projection. But as can be seen, the value used in GCAM approaches that of CSA at the end of the given period. However, it should be noted that this value is considerably smaller than that of the UN projection.
For the assumption of urban population, Figure 3 shows the scenarios for the urbanization rate.
The reference scenario (baseline GDP and medium urbanization rate) is used as the basis for all other scenarios that follow.
4.2. Alt-1 (High GDP and High Urbanization Rate)
Turok and McGranahan [27] argue that “government should seek out ways of enabling forms of urbanization that contribute to growth, poverty reduction and environmental sustainability, rather than encouraging (or discouraging) urbanization per se”, based on evidence from various studies conducted in Asia and African countries. In short, a scenario on the urbanization rate alone would not be adequate. As mentioned earlier, the economic growth is usually correlated with the growth in energy consumption. When bidirectional causality exists, the change in electricity consumption can affect economic growth, which in turn affects energy demand [28]. It must be noted, though, that the exact causality (energy to economy, economy to energy, or both/bidirectional) is, at best, inconclusive and depends on various factors, such as the model and data used to estimate the causality [2]. The Alt-1 scenario modifies the socioeconomics assumption from the reference case, assuming that high GDP level (high growth) is accompanied by high urbanization rate.
4.3. Alt-2 (High Biomass Efficiency Compared to Reference Case)
The first policy measure that can be taken to improve the utilization of biomass is by increasing the efficiency of biomass utilization technologies. The Alt-2 scenario models the improvement of biomass energy utilization, especially in the building sector (residential and commercial). This scenario is chosen due to the importance and huge utilization of biomass in this sector. Discussions on biomass efficiency improvement, including that of the cook stove, can be found in Accenture [29] Shanko and Lakew [23], ADB [30], and many others. Table 5 shows that in the Alt-2 scenario, biomass efficiency is assumed to increase two times by as early as 2025.
4.4. Alt-3 (Sensitivity Analysis: Urban/Rual Energy Consumption Rate)
It is noted that at present, there is insufficient information to portray the urban versus rural energy consumption pattern of Ethiopia. Therefore, sensitivity analysis is conducted to assess the impact of varied rate of energy consumption for the rural and urban residential sectors.
In the current study, the ratio of energy utilization in urban versus rural areas is 1:6.84. This comes from the urban/rural ration of energy consumption per capita, which is 0.69, and the population information. For the purpose of sensitivity analysis, two scenarios of energy consumption are created: R65 and R70, denoting the energy consumption ratio in urban versus rural areas of 1:6.5 and 1:7.0, respectively. Table 6 summarizes the urban/rural energy consumption sensitivity analysis.
5. Results and Discussion
In general, the reference case of the Ethiopian energy system can be explained using Figure 4, which shows the primary energy consumption. This figure clearly shows that biomass is still the primary energy in use in Ethiopia.
Figure 5 shows the final energy consumption for the reference case. Biomass still holds the most important role in satisfying the final energy demand in Ethiopia. By replacing it, some electricity and liquids (petroleum products) increase the diversity of energy consumption pattern in Ethiopia. By 2035, the share of biomass in final energy consumption is reduced from 91.8% in 2010 to 77%.
5.1. Scenario Results: High GDP and Urbanization Rate (Alt-1)
Figure 6 shows the interactions between the two urban population scenarios and two income level scenarios. The high urbanization level generally reduces energy demand, since urban energy consumption is lower than rural energy consumption. However, it should be noted that this does not mean that the urban households demand less energy service than the rural counterpart. The inefficient use of energy in rural areas is the reason for this phenomenon. As expected, the high GDP level also results in a high level of energy demand.
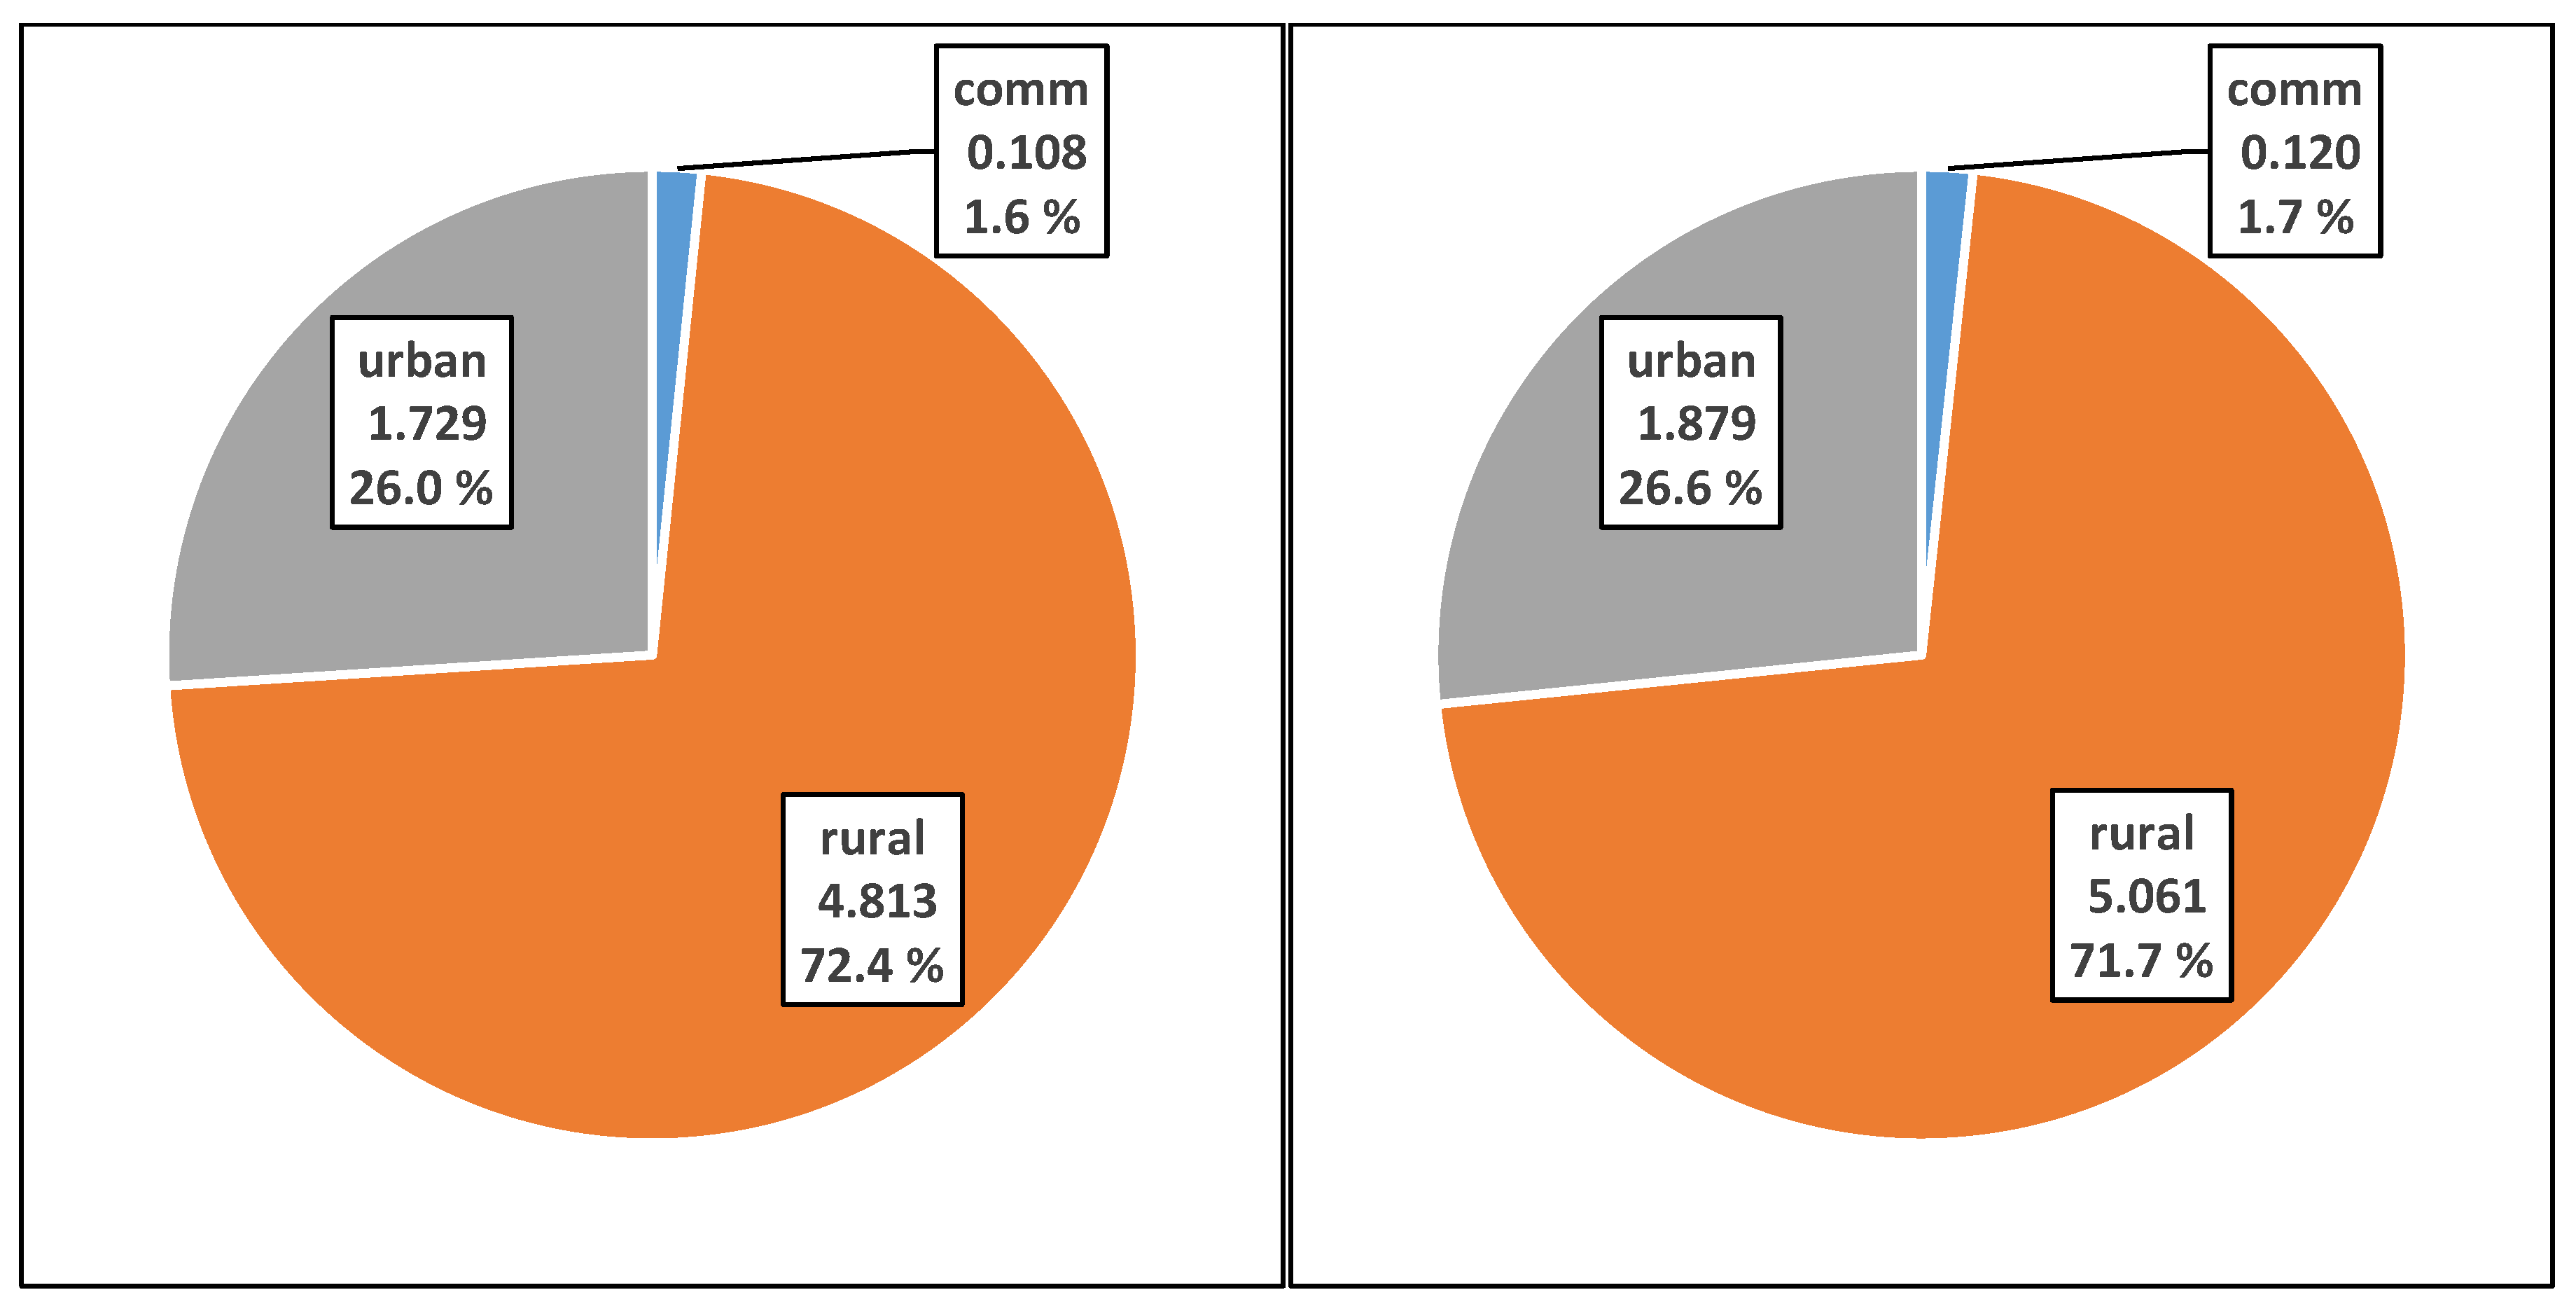
Figure 7 shows the distribution of building energy demand for Ref and Alt-1 scenarios, which, as explained before, differ in terms of GDP and urbanization rate. Due to the difference in GDP, energy demand is also different, with higher GDP requiring higher energy demand. Also, as a result of different urbanization rates, the energy demand in rural and urban areas differs between scenarios, albeit slightly. The share of rural energy demand in Alt-1 scenario is slightly lower than the Ref scenario (0.68%). Figure 8 further elaborates this result. The Alt-1 scenario with its higher urbanization rate has a lower share of rural energy demand (71.7%) than the Ref scenario (72.4%), although the energy demand value itself is higher (5.061 EJ in the Alt-1 scenario. compared to 4.813 EJ in the Ref. scenario).
The change of urbanization rate also affects biomass energy use in the building sector. Table 7 compares the reference and high urbanization rates for the reference GDP. A higher urbanization rate reduces biomass energy demand, by 0.63%. On the other hand, the demand of electricity is slightly increased, by around 0.59%.
5.2. Scenario Results: High Biomass Efficiency (Alt-2)
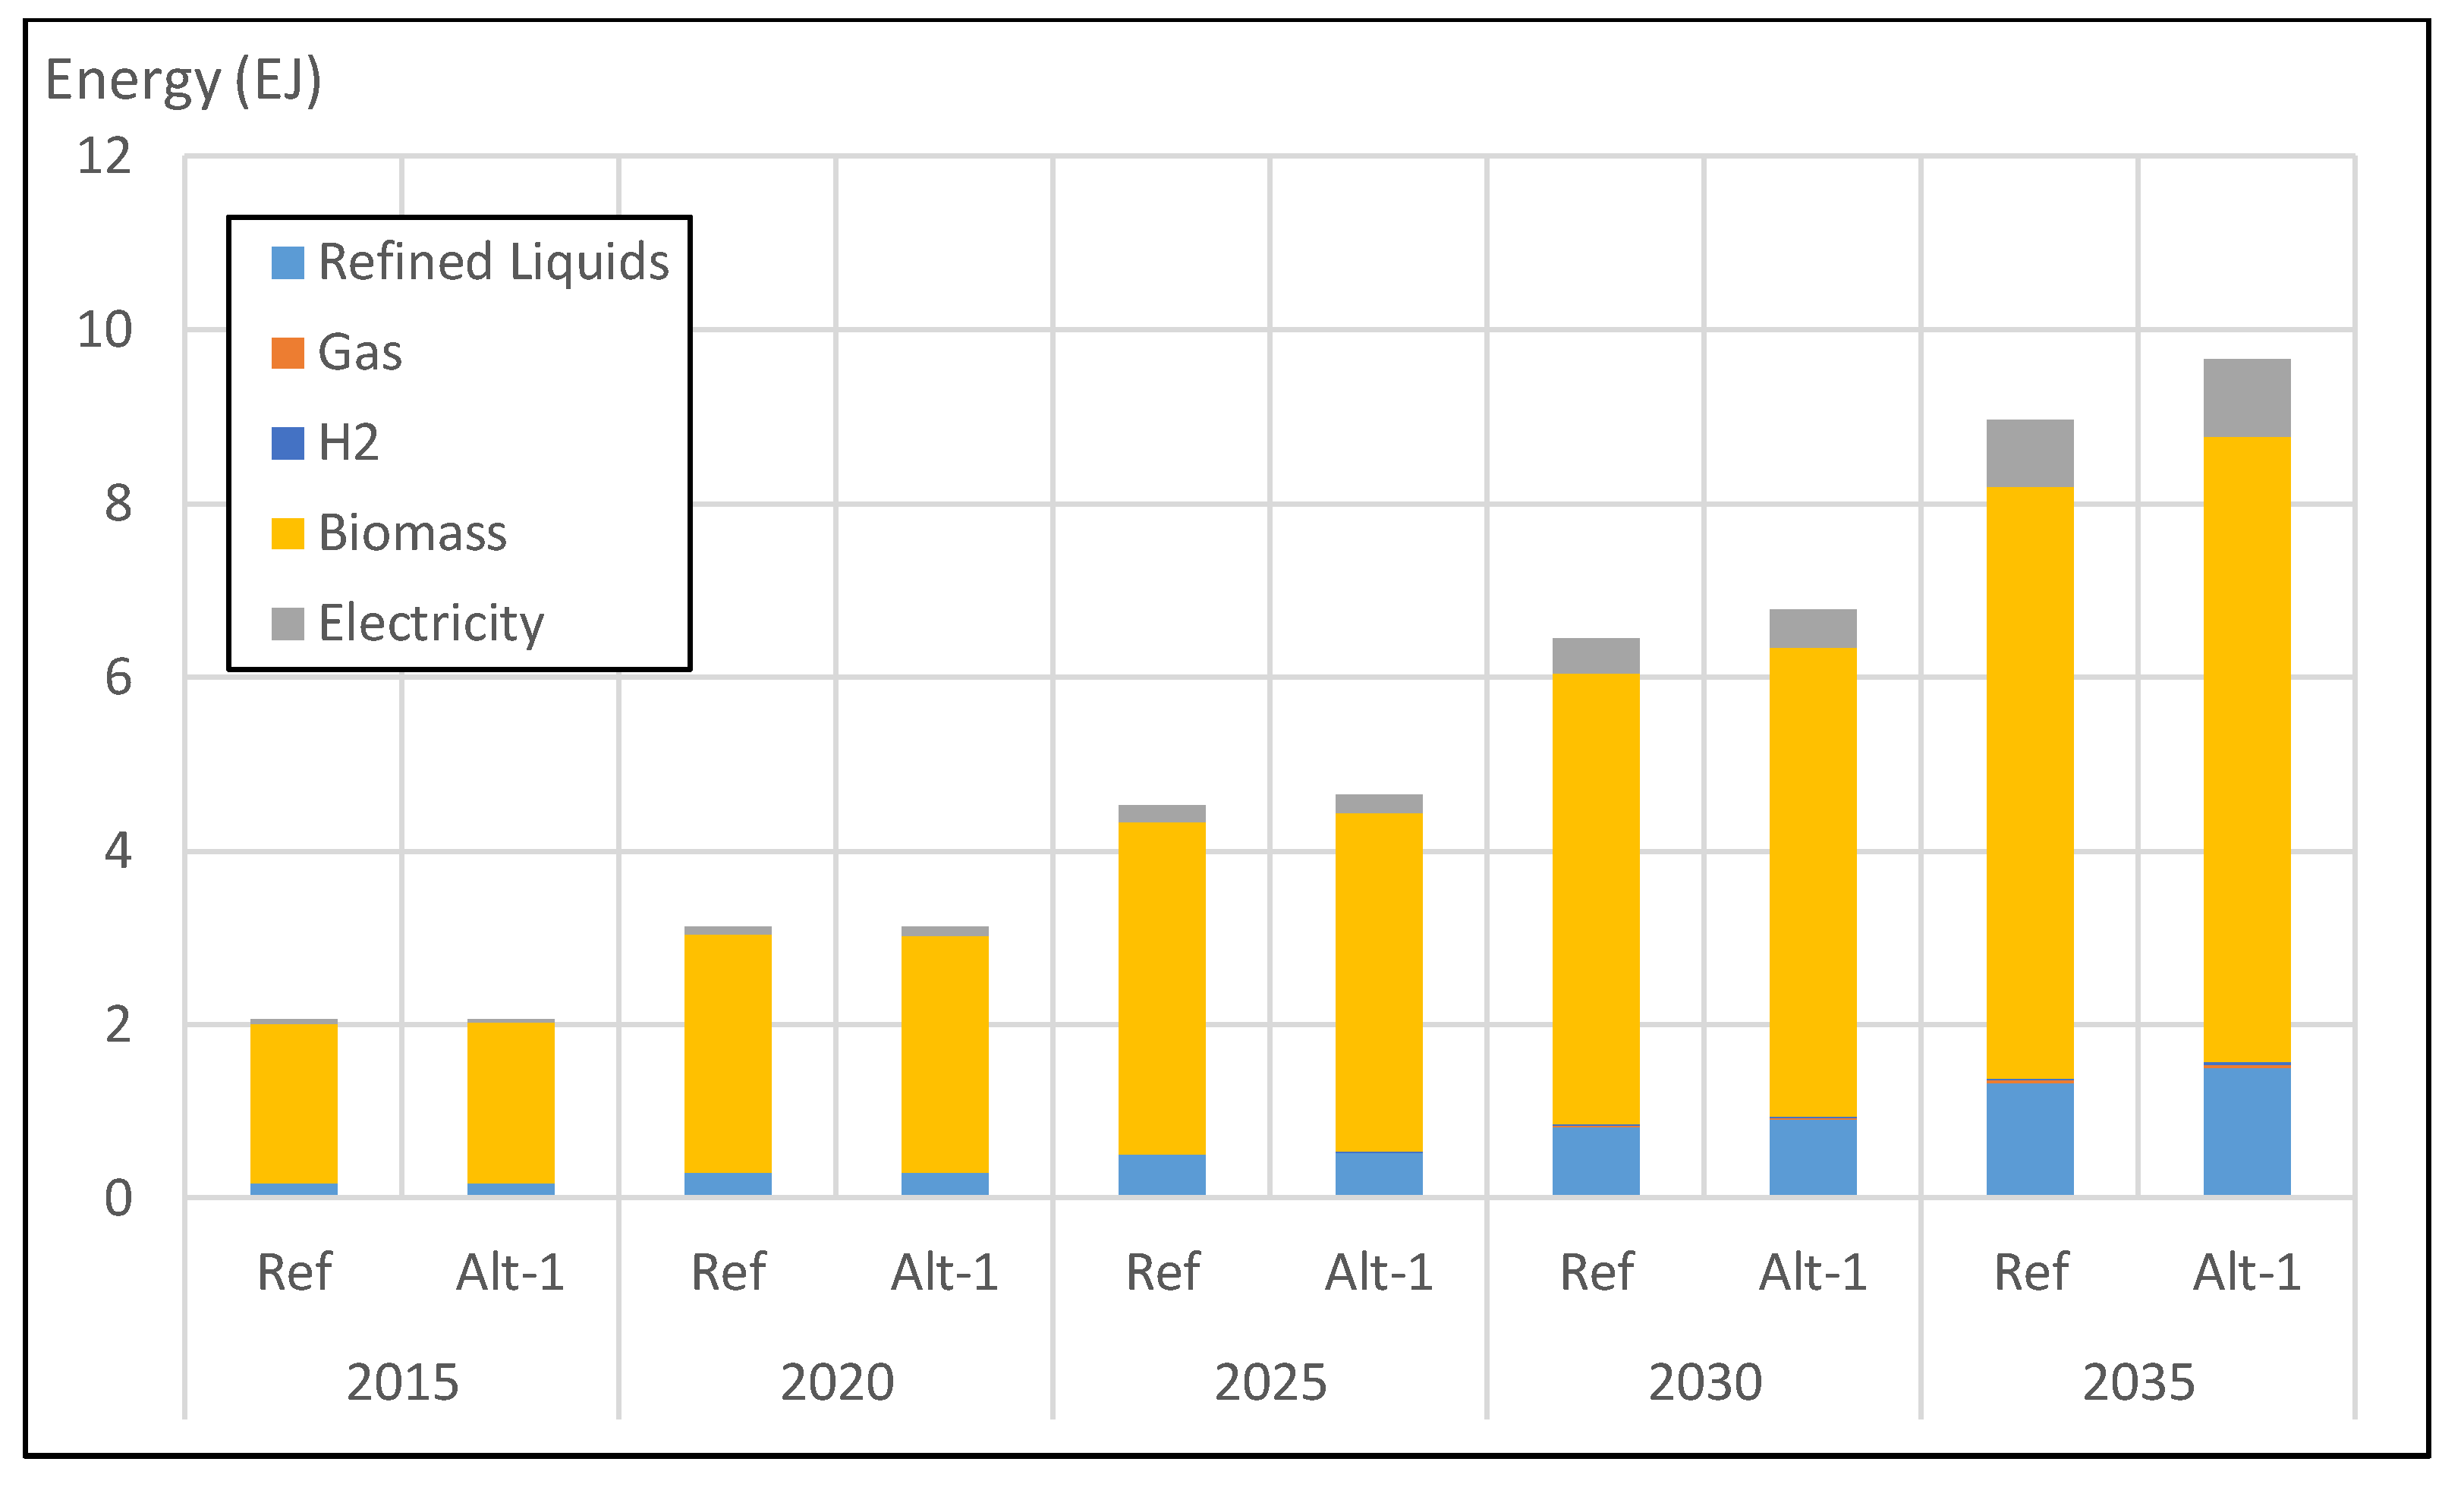
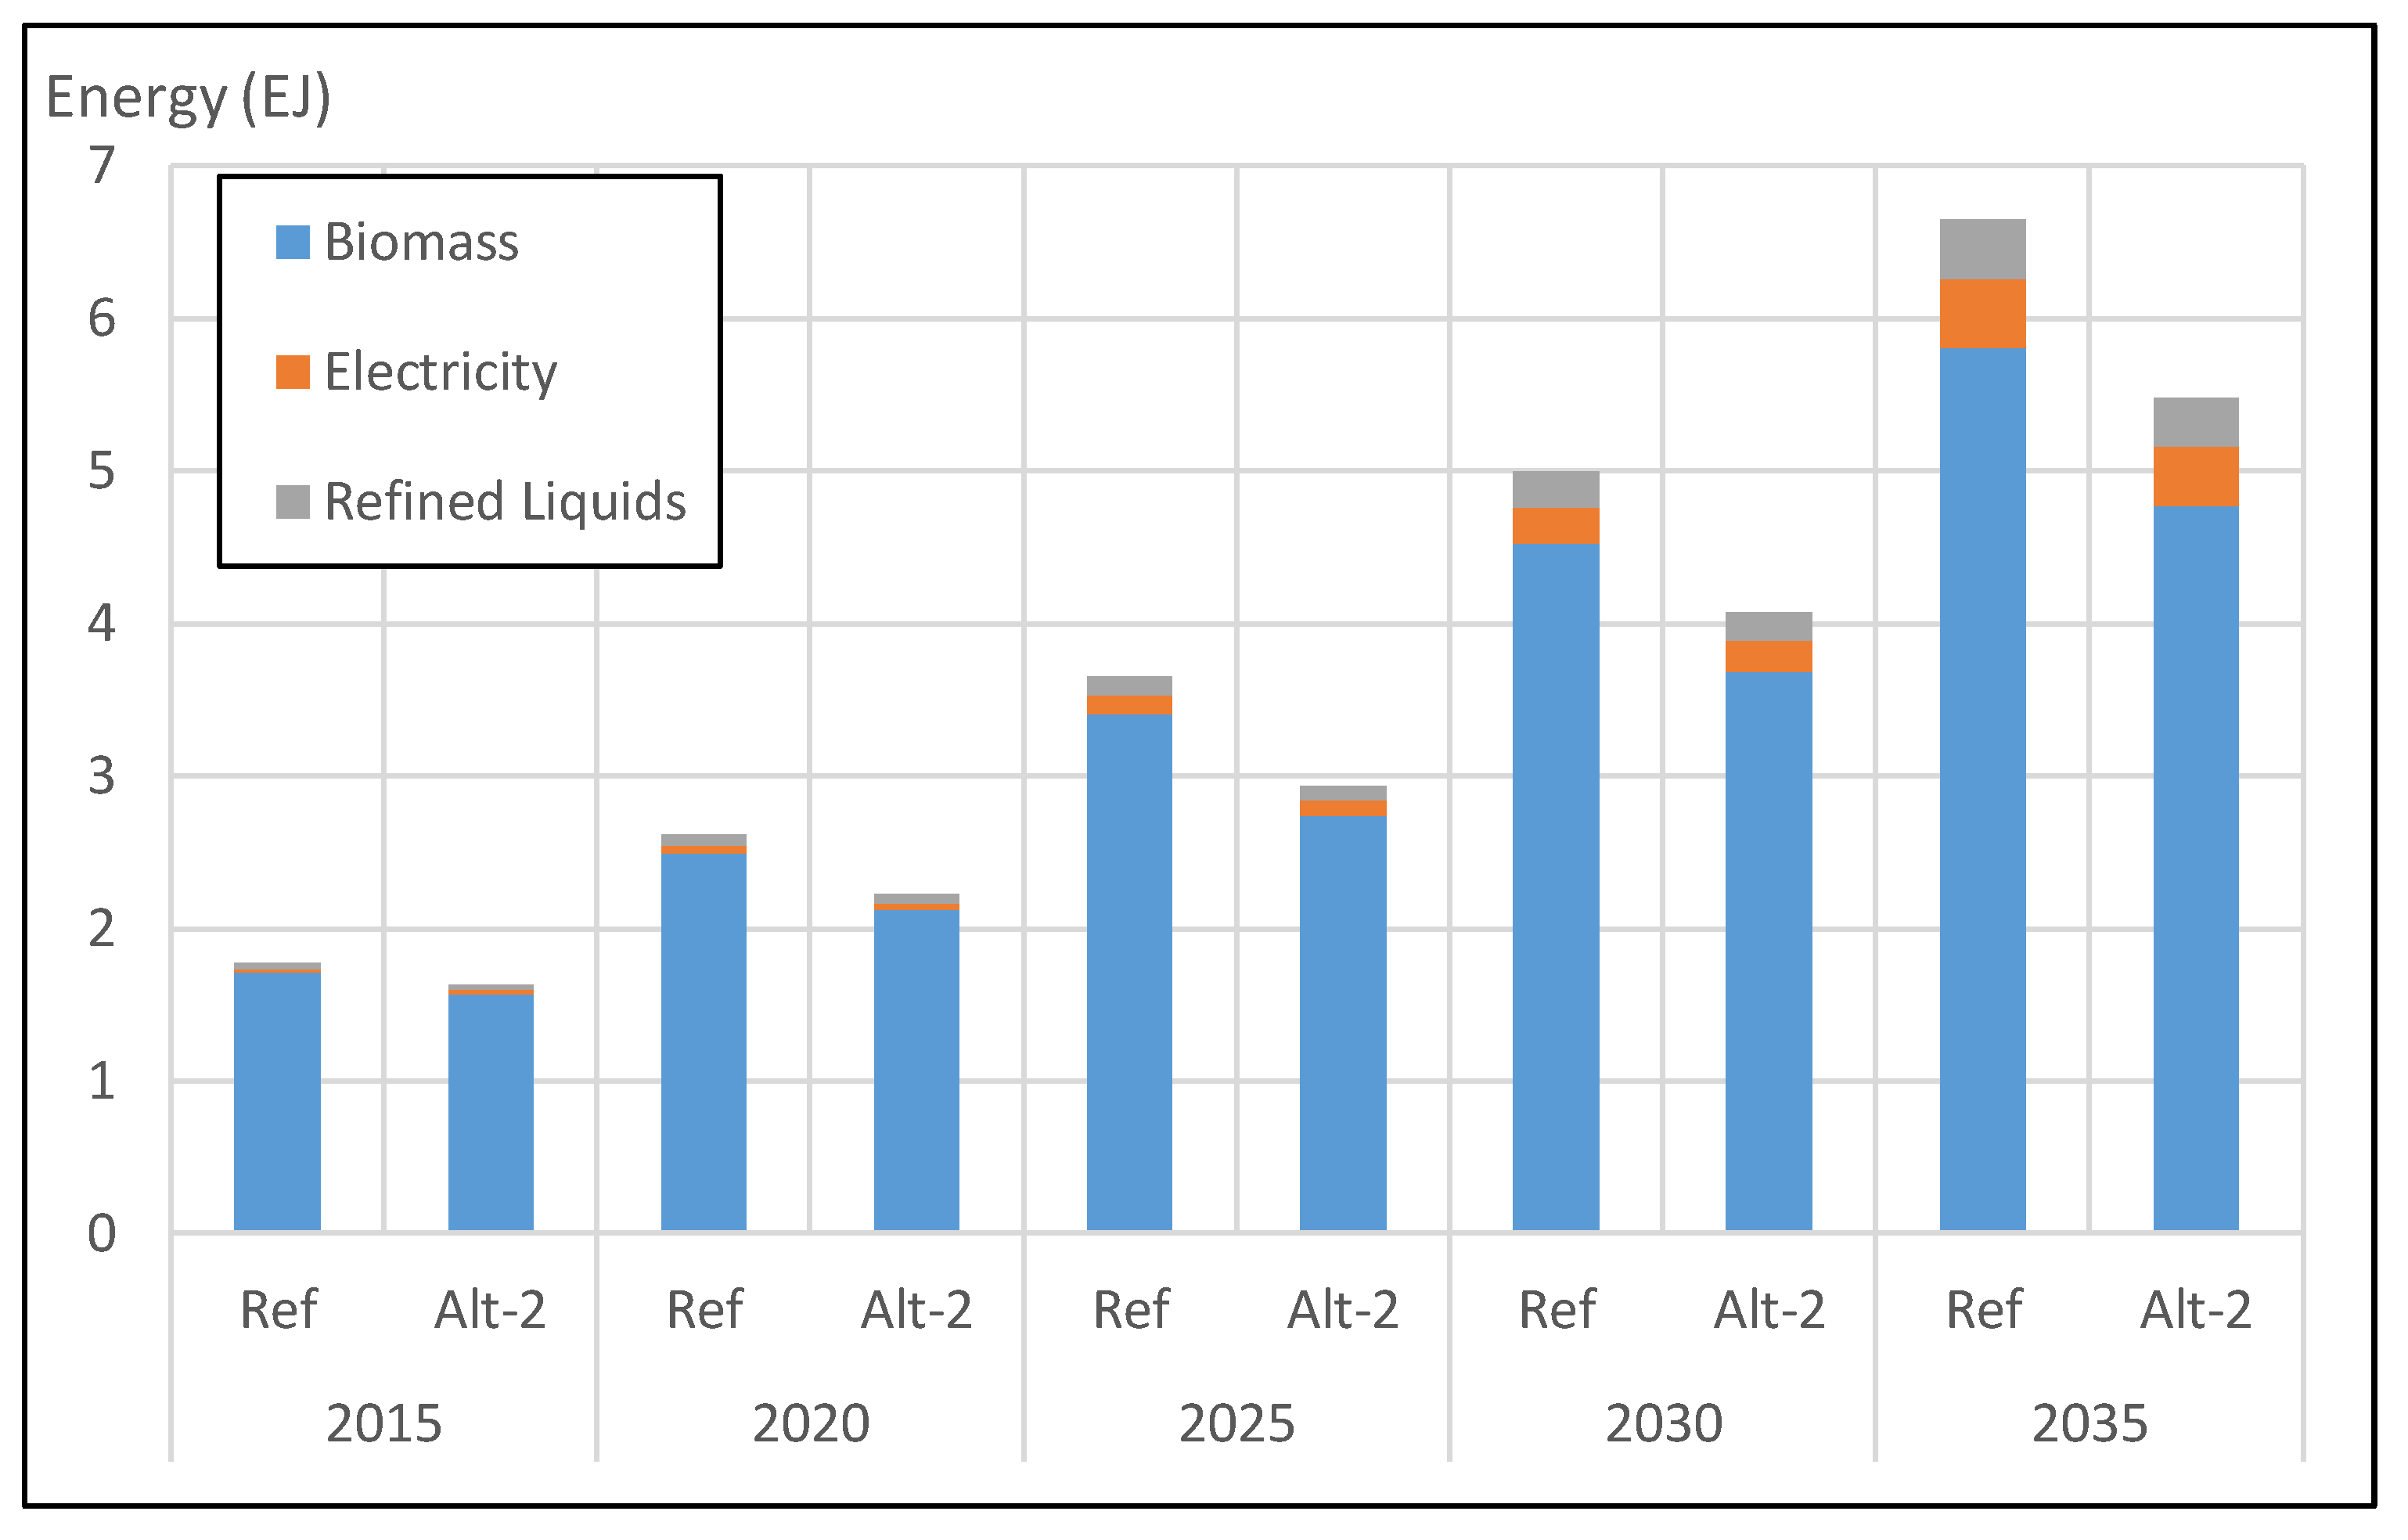
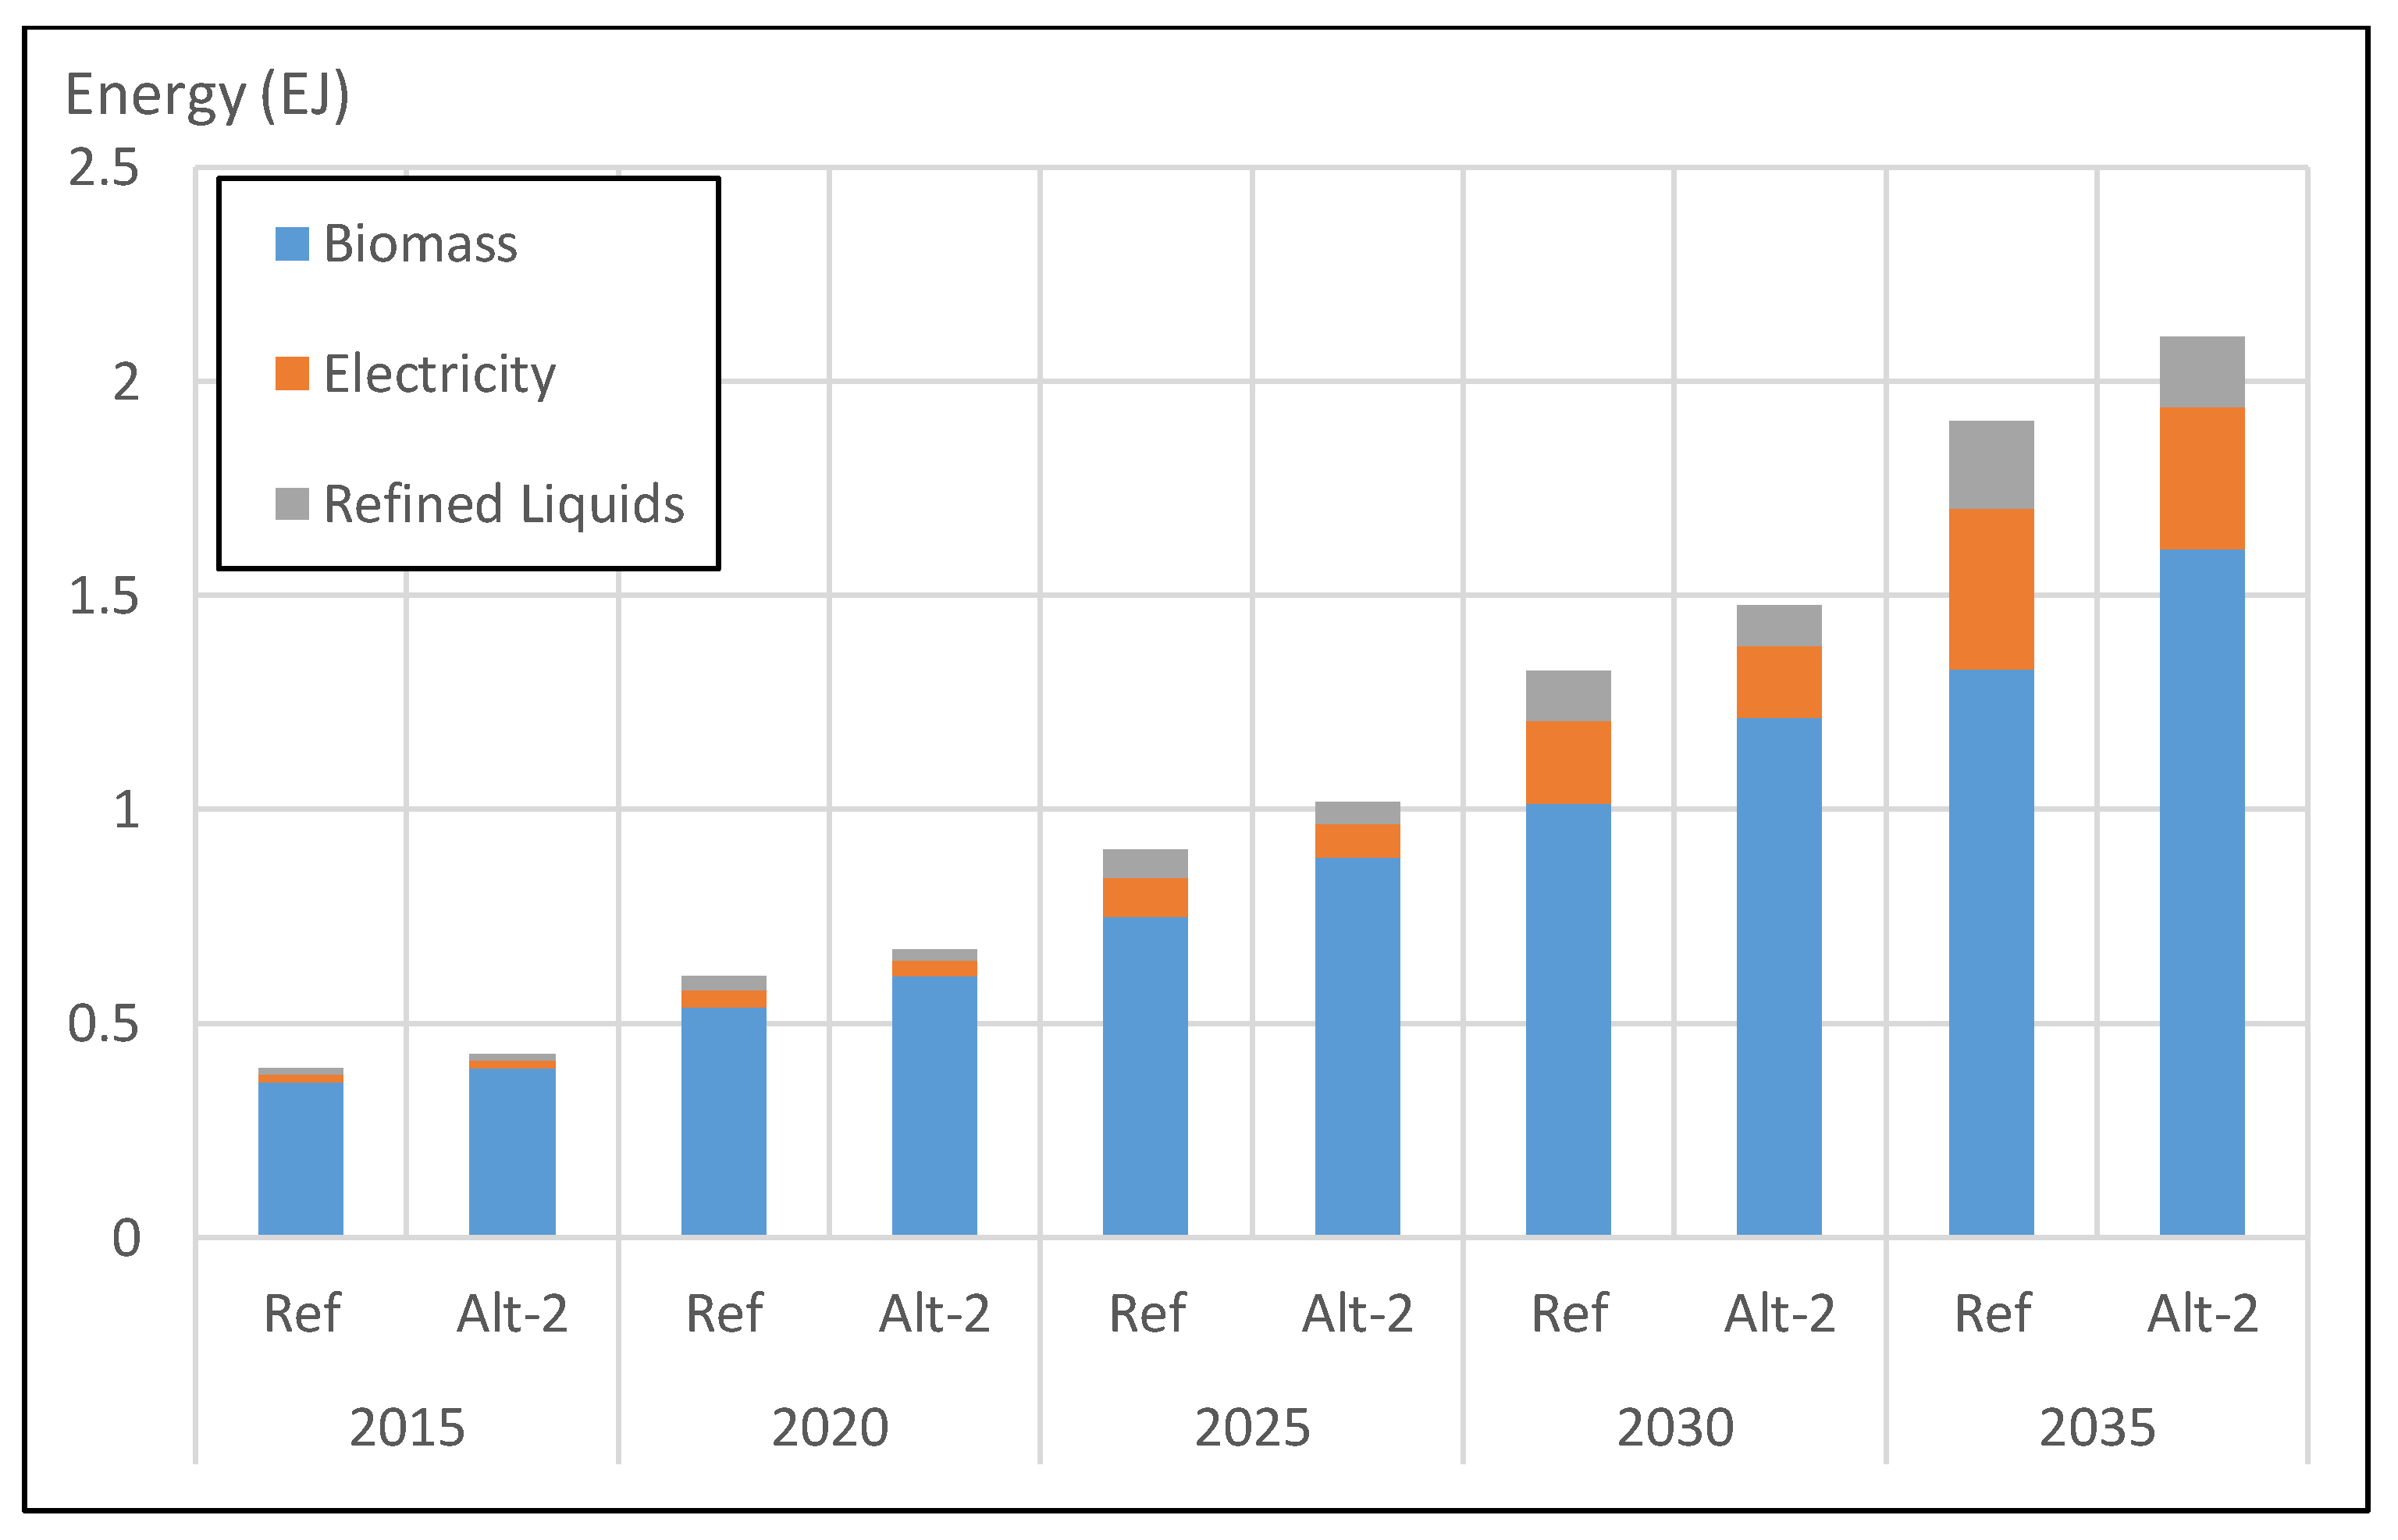
Figure 9 shows the impact of increasing biomass efficiency. As shown, the improvement of efficiency in biomass utilization reduces the overall utilization of energy/fuel in the building sector. This can be achieved through the increased energy services that can be enjoyed by the same amount of energy input. Relatively abundant energy service provided by efficient utilization of biomass also reduces the need for other forms of energy, such as electricity and refined liquids.
Figure 10 shows the energy services produced and enjoyed by the consumers in the residential and commercial sectors of Ethiopia. Interestingly, even though the energy demand level in the building sector is reduced due to higher biomass technology efficiency, the energy service output, for cooking, lighting, appliances, etc., is actually increased. This implies that consumers come to consume increased energy services due to efficiency improvement, while the required energy input is reduced.
One important feature that can explain this phenomenon is the “rebound effect”, which reduces the expected impact from the implementation of new technology. Further discussion on the “rebound effect” in energy efficiency and consumption can be found in a survey done by Greening, Greene and Difglio [31]. Due to the benefit of increased biomass energy efficiency in the building sector, consumers tend to increase their energy demand more than before. Another impact of this biomass efficiency improvement is that since it becomes relatively cheaper than other technologies, the demand of competing technologies, such as electricity, is reduced, due to the substitution effect, compared to the reference case.
5.3. Scenario Results: Power T&D Loss Reduction (Alt-3)
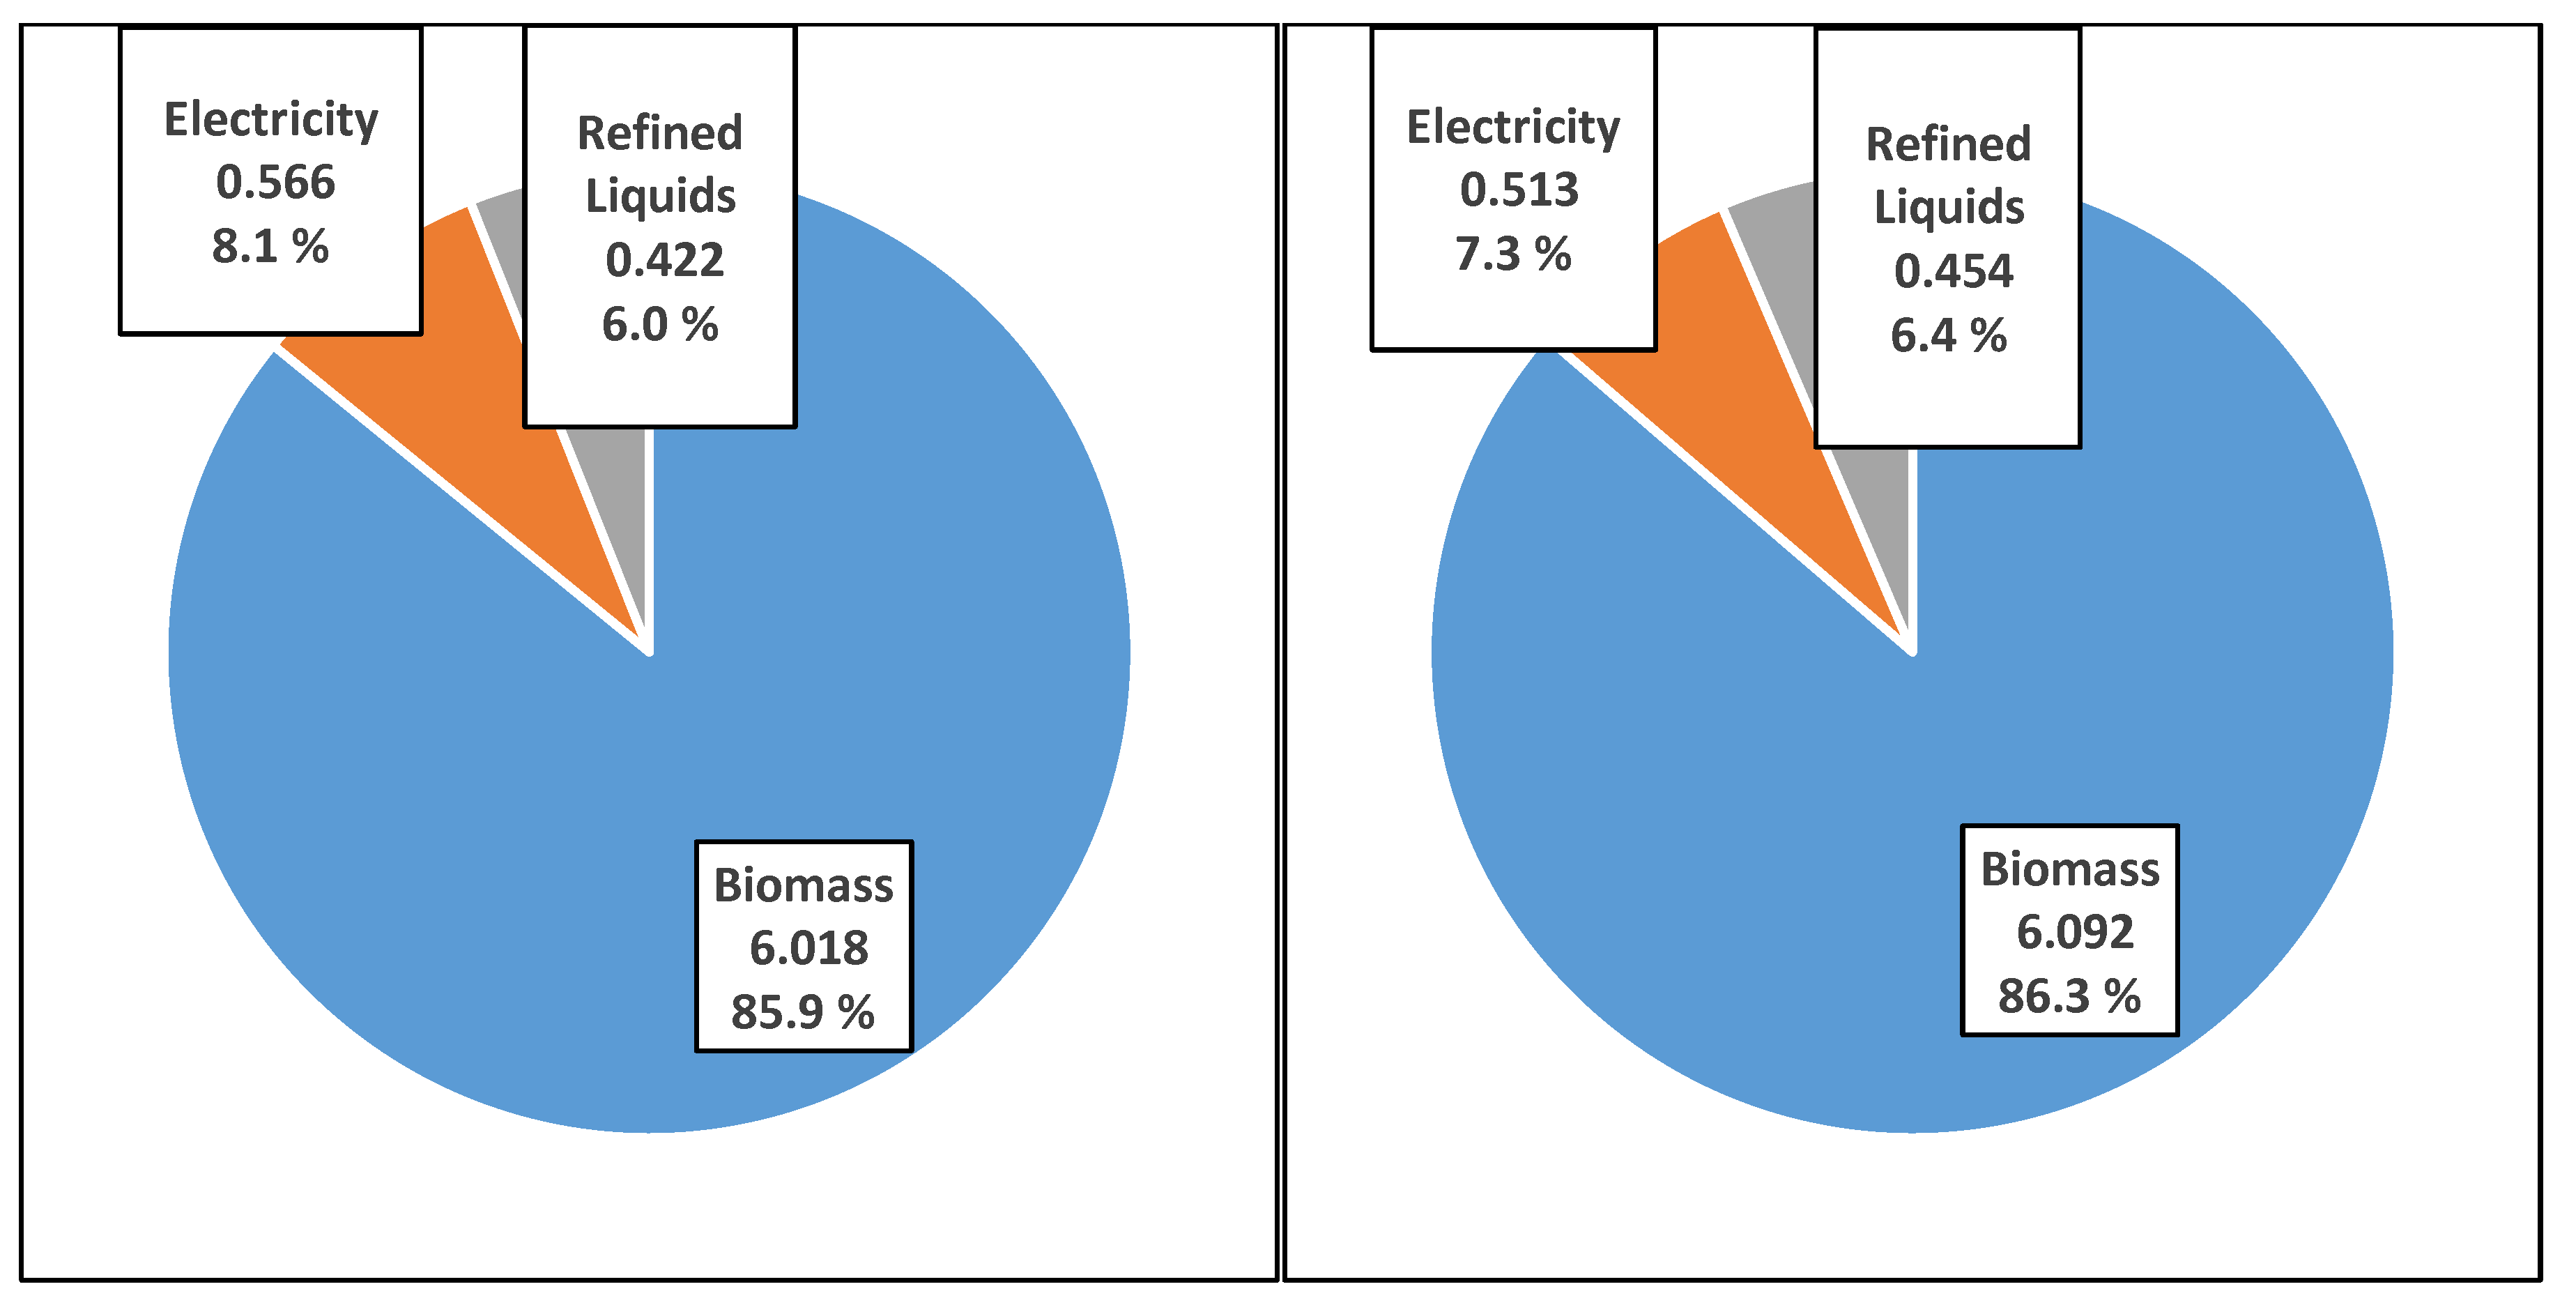
Another measure that can affect biomass energy reduction in the building sector is the increase of power T&D efficiency. Figure 11 shows the change in energy mix in the building sector when the reference scenario is changed into the Alt-3 scenario, which has low power T&D losses. As expected, the electricity demand is increased, due to better transmission and distribution. As a positive side effect, the resulting biomass demand is reduced slightly from 86.3 to 85.9%. Another impact of this policy is the overall conservation effect, which is the reduction of energy demand in all final sectors (building, industry, and transportation).
5.4. Sensitivity Analysis: Urban/Rural Energy Consumption Rate (Alt-4)
Based on the different level of energy consumption rate by Urban vs. Rural areas, Table 8 shows the energy consumption pathways for the simulation period in the building sectors. This shows that for both scenarios, the ratio of Urban/Rural energy consumption increases over time, which can be attributed to urbanization and increasing energy efficiency. However, depending on the starting point ratio, the future rate differs. The lower starting point rate (R65) produces a 2035 ratio of 2.35, while the higher starting point rate (R70) produces a 2035 ratio of 2.47.
Based on the total energy consumption in both residential sectors (urban and rural) and the commercial sector, the higher rate of Urban/Rural energy consumption (R70) results in lower total energy consumption, compared to the lower rate of Urban/Rural energy consumption (R65). This can be caused by the change in energy consumption per capita caused by the sensitivity scenario. When the total rural energy consumption is higher, while the rural population is constant, the energy consumption per capita becomes lower, and vice versa. This factor then affects the future projection of energy consumption in the residential building sectors.
6. Concluding Remarks
In this study, an integrated assessment model (GCAM) is adopted to analyze biomass utilization and related policies in Ethiopia. Although detailed information on energy use by building type, energy service, and fuel are not available in the process of the energy system modeling of Ethiopia, secondary information sources and educated judgments are made to disaggregate the building sector into the urban, rural, and commercial types. Then, three scenarios are developed to analyze the energy system in Ethiopia, which are on socioeconomics (GDP and urbanization level), biomass efficiency, and energy consumption by urban vs. rural, respectively.
The reference case shows that until 2035, biomass will remain the main energy fuel utilized in the building sector. However, it is found that due to the difference in energy demand patterns between the urban and rural sectors, the higher GDP and urbanization level (Alt-1 scenario) can induce the reduction of overall energy demand, especially that of biomass utilization.
The high biomass efficiency scenario (Alt-2) shows that increasing biomass efficiency will reduce the biomass demand, compared to the reference case. However, interestingly, the amount of energy services enjoyed by the consumer in the high efficiency case is expected to be higher than those in the reference case. This means that highly efficient technology creates some kind of “rebound effect”, which slightly reduces the intended impact of biomass demand reduction.
The role of electrification is analyzed through the T&D Loss scenario (Alt-3). It is shown that when the T&D system is more efficient, or in other words, when there is lower T&D loss, electricity becomes relatively cheaper than other energy types. Due to this effect, electricity demand becomes higher, showing a shift from other energy use, such as biomass. This phenomenon implies that the reduction of biomass demand can also be achieved through the improvement of power transmission and distribution systems.
The Urban/Rural energy consumption sensitivity analysis shows that the ratio of Urban/Rural energy consumption keeps increasing over time for both scenarios (higher/lower), which can be attributed to urbanization and increasing energy efficiency. It is also found that the higher rate of Urban/Rural energy consumption results in lower total energy consumption. In essence, it is suggested that Ethiopia must find an alternative fuel to biomass, even though it could only be a partial replacement.
Author Contributions
S.K. proposed the idea for the paper; S.K. and Z.Y. collected data and information, and also designed the study and methodology; Z.Y. created the Ethiopia national model, and ran the scenarios; and Z.Y. wrote the paper draft. All authors contributed to the writing of the paper.
Funding
This work was supported by KDI and UNDP as a part of 15-year perspective plan consultation project for National Planning Commission (NPC), Ethiopia; and was supported by the Technology Development Program to Solve Climate Changes of the National Research Foundation (NRF) funded by the Ministry of Science, ICT & Future Planning (2017M1A2A2081253).
Conflicts of Interest
The authors declare they have no conflict of interest. The founding Sponsors had no role in the design of the study; in the collection, analyses, or interpretation of data; in the writing of the manuscript; and in the decision to publish the results.
References
- Nyasha, S.; Gwenhure, Y.; Odhiambo, N.M. Energy Consumption and Economic Growth in Ethiopia: A Dynamic Causal Linkage; Economic Research Working Paper Series; University of South Africa (UNISA): Pretoria, South Africa, 2016. [Google Scholar]
- Ozturk, I. A literature survey on energy–growth nexus. Energy Policy 2010, 38, 340–349. [Google Scholar] [CrossRef]
- Ministry of Finance and Economic Development (MoFED). Federal Democratic Republic of Ethiopia. Growth and Transformation Plan (GTP) 2010/11-2014/15. 2010. Available online: http://www.ethiopians.com/Ethiopia_GTP_2015.pdf (accessed on 30 June 2018).
- National Planning Commission (NPC). Growth and Transformation Plan II (GTP II) (2015/16-2019/20); NPC: Addis Ababa, Ethiopia, 2016.
- International Energy Agency. Ethiopia: Balances for 2015. 2016. Available online: https://www.iea.org/statistics/statisticssearch/report/?country=Ethiopia&product=balances&year=2015 (accessed on 23 October 2017).
- Federal Democratic Republic of Ethiopia. Intended Nationally Determined Contribution (INDC) of the Federal Democratic Republic of Ethiopia. 2015. Available online: http://www4.unfccc.int/ndcregistry/PublishedDocuments/Ethiopia%20First/INDC-Ethiopia-100615.pdf (accessed on 30 June 2018).
- Asress, M.B.; Simonovic, A.; Komarov, D.; Stupar, S. Wind energy resource development in Ethiopia as an alternative energy future beyond the dominant hydropower. Renew. Sustain. Energy Rev. 2013, 23, 366–378. [Google Scholar] [CrossRef]
- Bekele, G.; Tadesse, G. Feasibility study of small Hydro/PV/Wind hybrid system for off-grid rural electrification in Ethiopia. Appl. Energy 2012, 97, 5–15. [Google Scholar] [CrossRef]
- Gwavuya, S.G.; Abele, S.; Barfuss, I.; Zeller, M.; Müller, J. Household energy economics in rural Ethiopia: A cost-benefit analysis of biogas energy. Renew. Energy 2012, 48, 202–209. [Google Scholar] [CrossRef]
- Tucho, G.T.; Nonhebel, S. Bio-wastes as an alternative household cooking energy source in Ethiopia. Energies 2015, 8, 9565–9583. [Google Scholar] [CrossRef]
- Mulugetta, Y. Energy in Rural Ethiopia: Consumption Patterns, Associated Problems, and Prospects for a Sustainable Energy Strategy. Energy Sources 1999, 21, 527–539. [Google Scholar] [CrossRef]
- Wolde-Ghiorgis, W. Renewable energy for rural development in Ethiopia: The case for new energy policies and institutional reform. Energy Policy 2002, 30, 1095–1105. [Google Scholar] [CrossRef]
- Pachauri, S. An analysis of cross-sectional variations in total household energy requirements in India using micro survey data. Energy Policy 2004, 32, 1723–1735. [Google Scholar] [CrossRef]
- Pachauri, S.; Jiang, L. The household energy transition in India and China. Energy Policy 2008, 36, 4022–4035. [Google Scholar] [CrossRef] [Green Version]
- Kim, S.H.; Edmonds, J.; Lurz, J.; Smith, S.J.; Wise, M. The ObjECTS framework for integrated assessment: Hybrid modeling of transportation. Energy J. 2006, 27, 63–91. [Google Scholar] [CrossRef]
- Brenkert, A.L.; Smith, A.J.; Kim, S.H.; Pitcher, H.M. Model Documentation for the MiniCAM; PNNL, Tech. Rep. PNNL-14337; Pacific Northwest National Laboratory: Richland, WA, USA, 2003.
- Joint Global Change Research Institute (JGCRI). GCAM v4.4 Documentation: Global Change Assessment Model (GCAM): Documentation for GCAM. Available online: http://jgcri.github.io/gcam-doc/ (accessed on 30 June 2018).
- Clarke, J.F.; Edmonds, J.A. Modelling energy technologies in a competitive market. Energy Econ. 1993, 15, 123–129. [Google Scholar] [CrossRef]
- McFadden, D.; Zarembka, P. Frontiers in Econometrics; Academic Press: Cambridge, MA, USA, 1974; pp. 105–142. [Google Scholar]
- Ministry of Water; Infrastructure and Energy (MoWIE); Federal Democratic Republic of Ethiopia. Energy Balance 2014/2015; MoWIE: Addis Ababa, Ethiopia, 2016.
- Federal Democratic Republic of Ethiopia. Welfare Monitoring Survey 2011—Statistical Report Volume II; Central Statistics Agency: Addis Ababa, Ethiopia, 2012. [Google Scholar]
- Central Statistical Agency. Population Projections for Ethiopia, 2007–2037; Central Statistical Agency: Addis Ababa, Ethiopia, 2013. [Google Scholar]
- Shanko, M.; Lakew, H. Final Report: Household Energy Baseline Survey in Snnpr. Giz: Eco—Bio-Energy Department, 2011. Available online: https://energypedia.info/images/temp/a/a8/20120831080119!phpMYQU8O.pdf (accessed on 30 June 2018).
- Chaturvedi, V.; Eom, j.; Clarke, L.E.; Shukla, P.R. Long term building energy demand for India: Disaggregating end use energy services in an integrated assessment modeling framework. Energy Policy 2014, 64, 226–242. [Google Scholar] [CrossRef]
- Yu, S.; Eom, J.; Zhou, Y.; Evans, M.; Clarke, L. Scenarios of building energy demand for China with a detailed regional representation. Energy 2014, 67, 284–297. [Google Scholar] [CrossRef]
- Korea Development Institute. Strengthening the Capacity of NPC/CD; KDI: Seoul, Korea, 2017. [Google Scholar]
- Turok, I.; McGranahan, G. Urbanization and economic growth: The arguments and evidence for Africa and Asia. Environ. Urban. 2013, 25, 465–482. [Google Scholar] [CrossRef]
- Environment for Development (EFD). The Residential Demand for Electricity in Ethiopia; Discussion Paper Series EfD DP 15-07. April 2015. Available online: http://www.efdinitiative.org/sites/default/files/publications/efd-dp-15-07.pdf (accessed on 30 June 2018).
- Accenture. Rwanda Market Assessment Sector Mapping, Accenture Development Partnerships, April 2012. Available online: https://cleancookstoves.org/binary-data/RESOURCE/file/000/000/170-1.pdf (accessed on 30 June 2018).
- Asia Development Bank (ADB). The Saemaul Undong Movement in the Republic of Korea: Sharing Knowledge on Community-Driven Development. 2012. Available online: https://www.adb.org/sites/default/files/publication/29881/saemaul-undong-movement-korea.pdf (accessed on 30 June 2018).
- Greening, L.A.; Greene, D.L.; Difiglio, C. Energy efficiency and consumption—The rebound effect—A survey. Energy Policy 2000, 28, 389–401. [Google Scholar] [CrossRef]
Figure 1.
Construction of the Building Energy Consumption Data for the Base Year.

Figure 2.
Population information in GCAM.
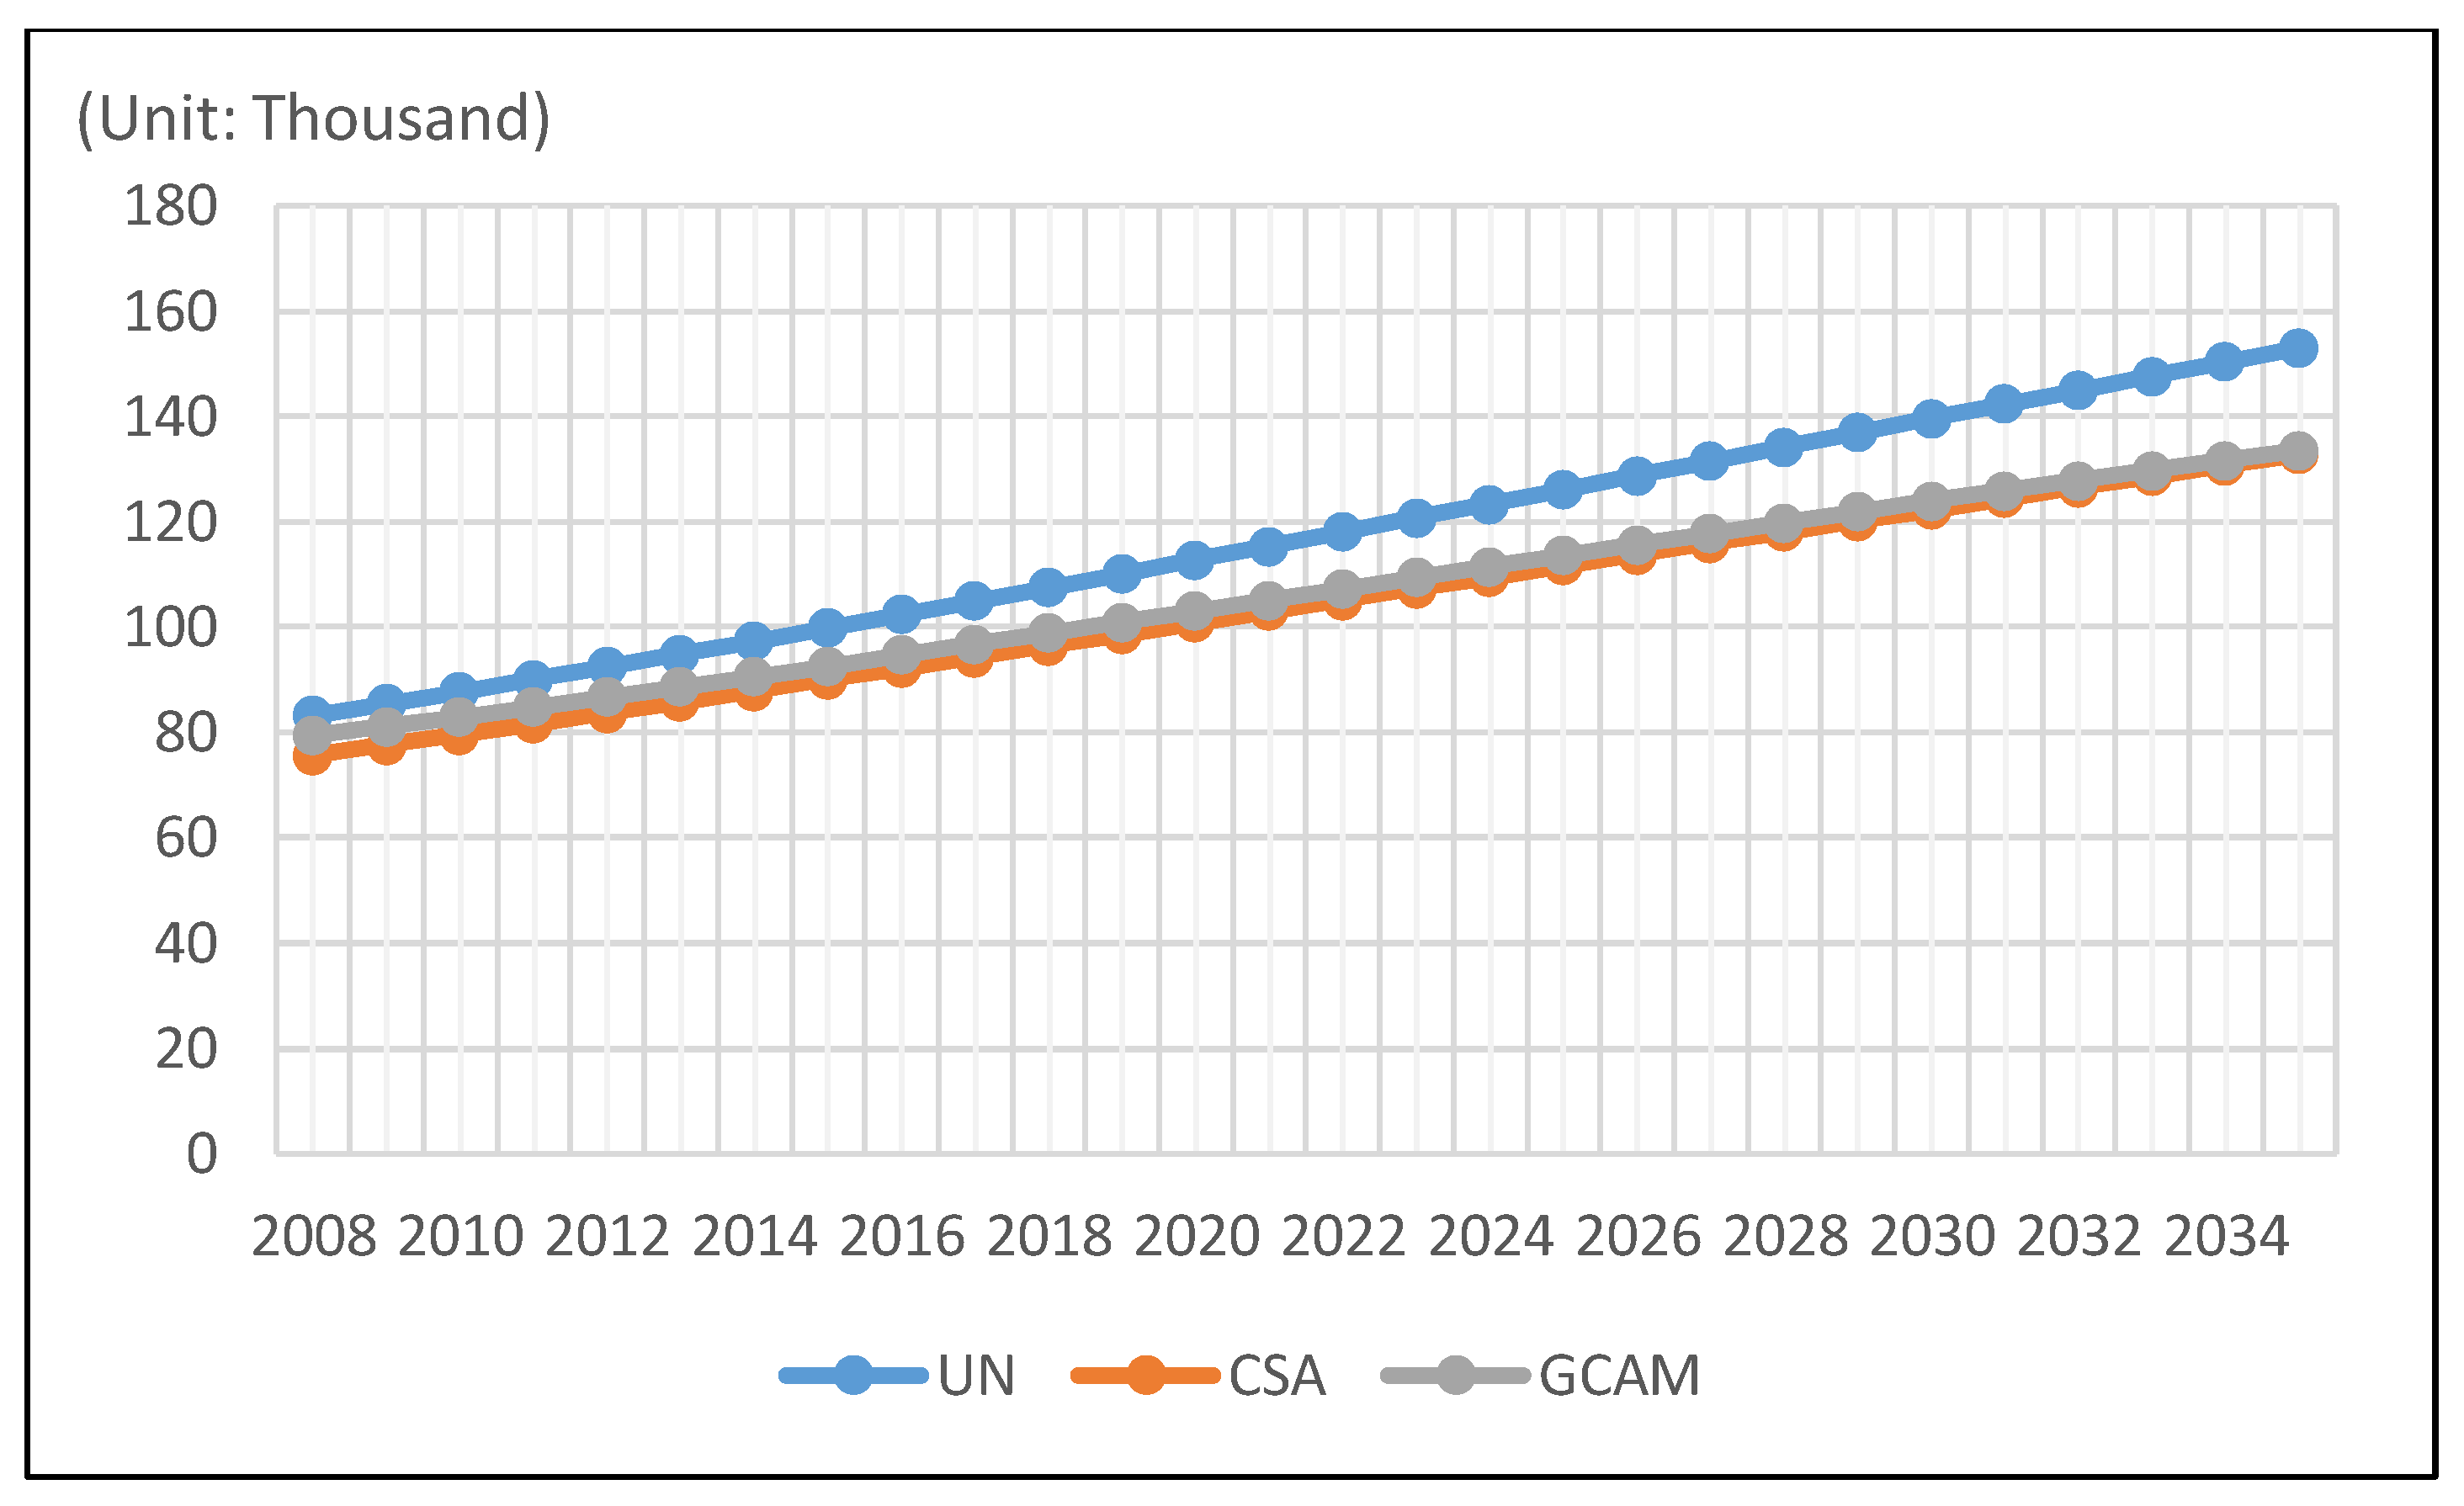
Figure 3.
Scenarios for the Urbanization Rate.
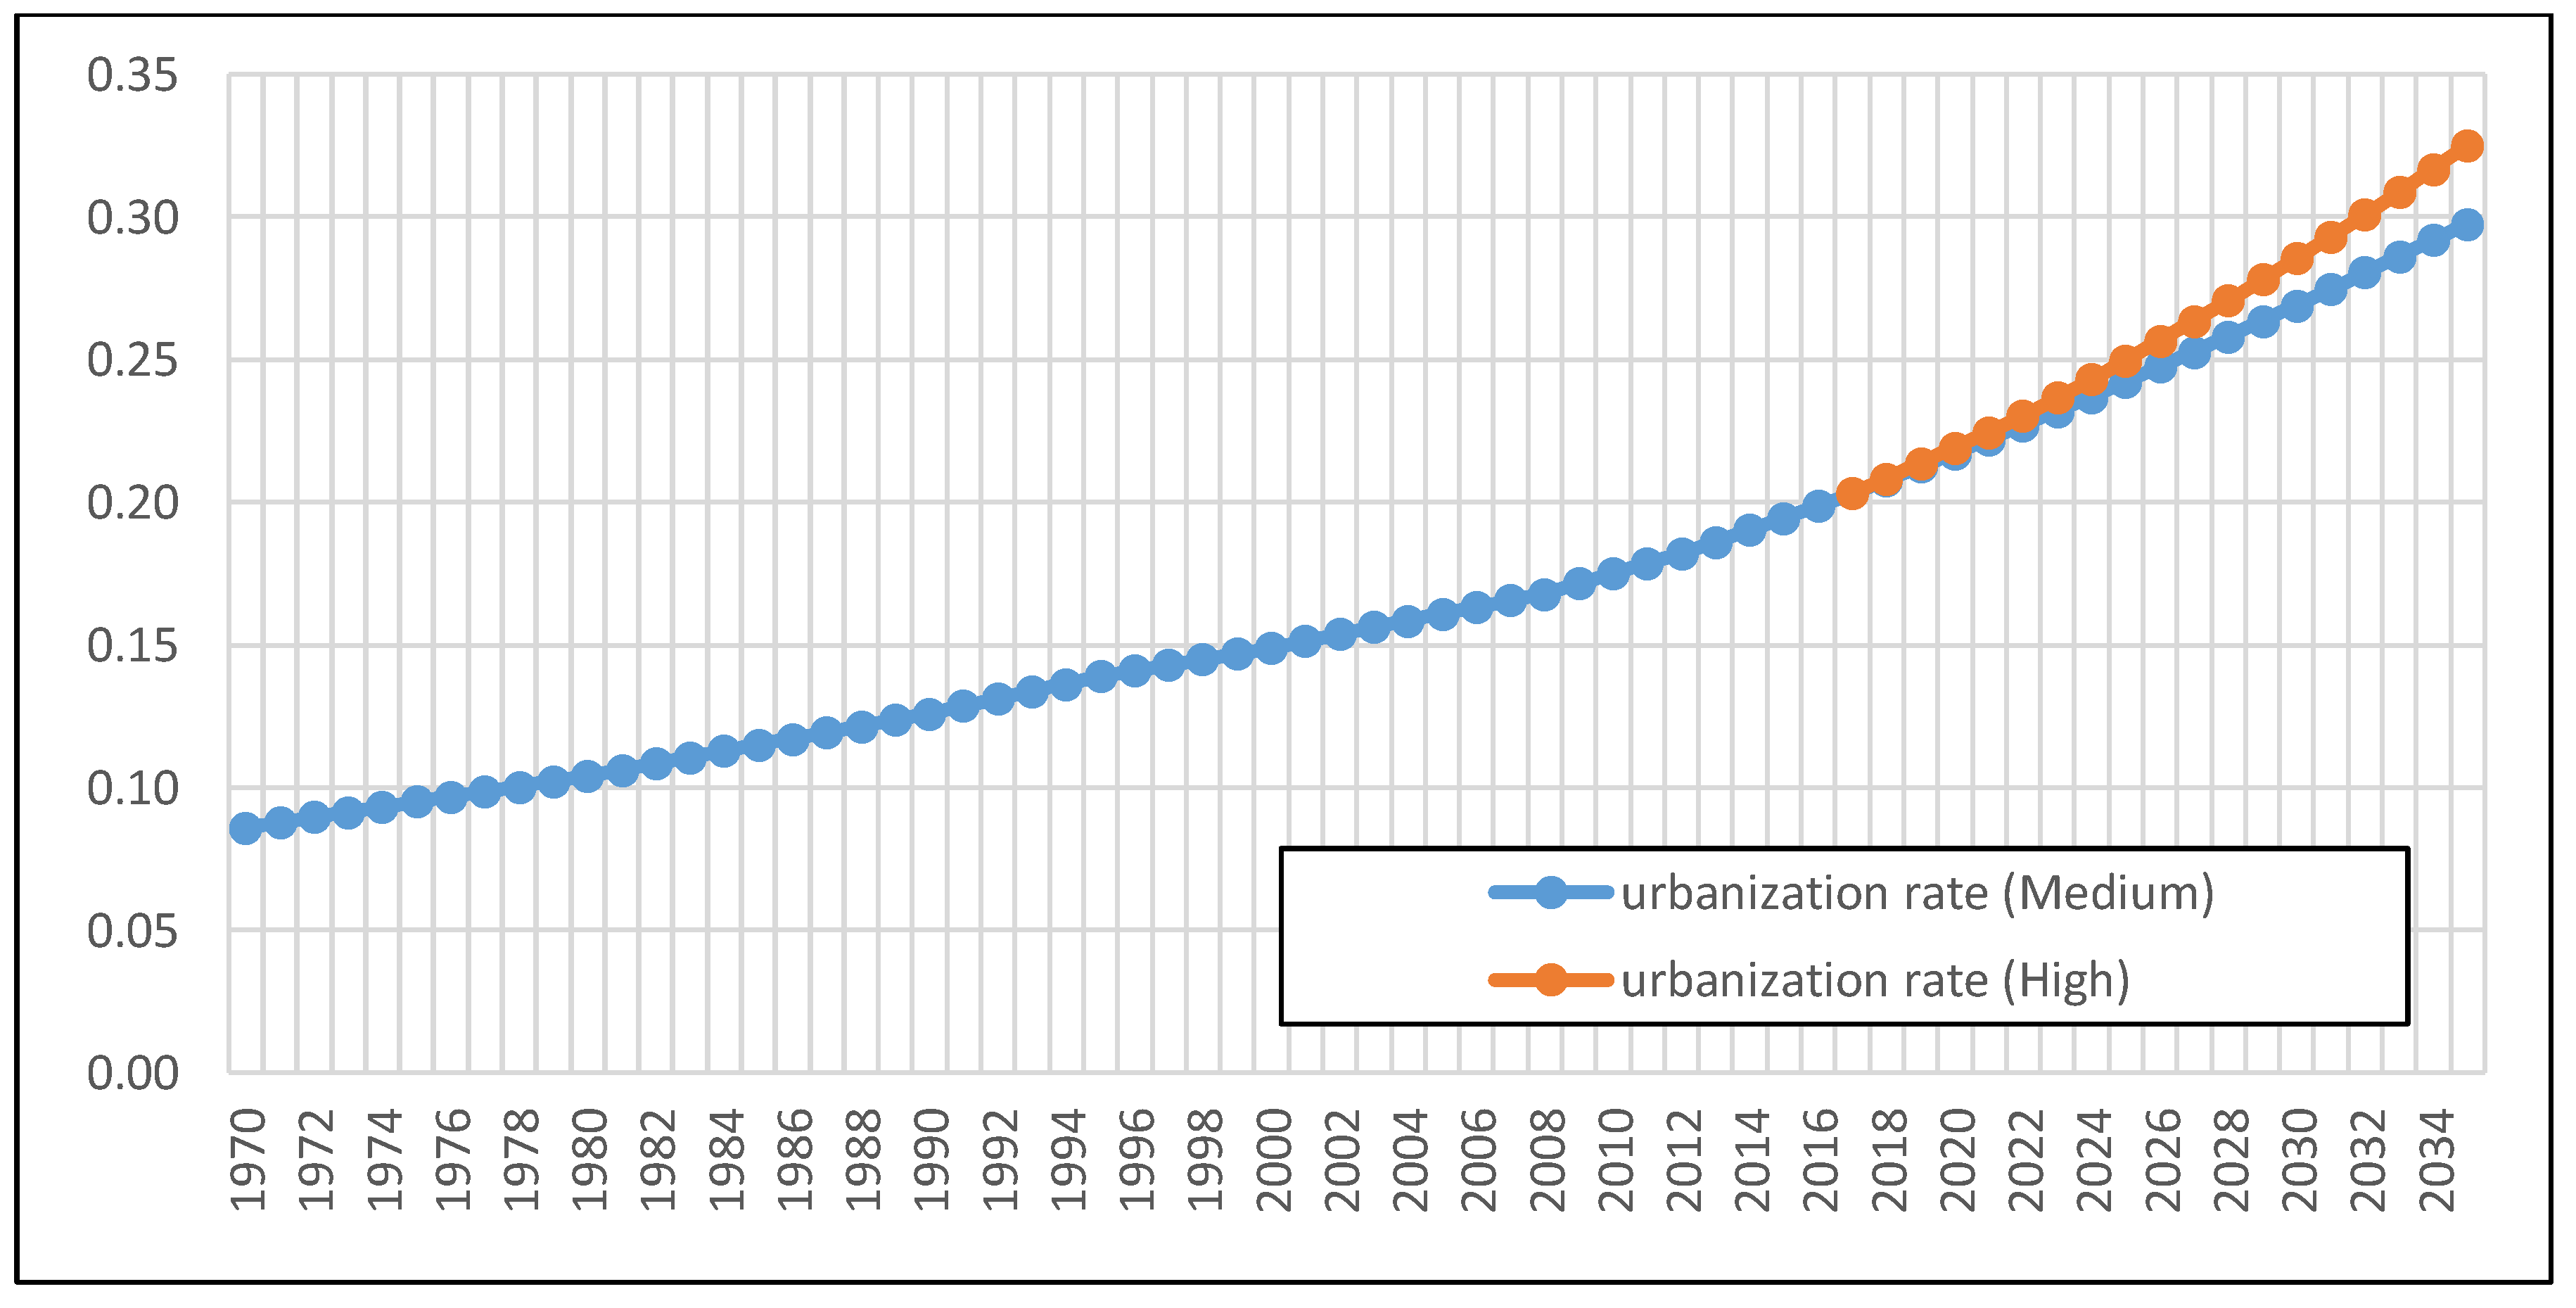
Figure 4.
Primary Energy Demand for Reference Case (Unit: EJ).
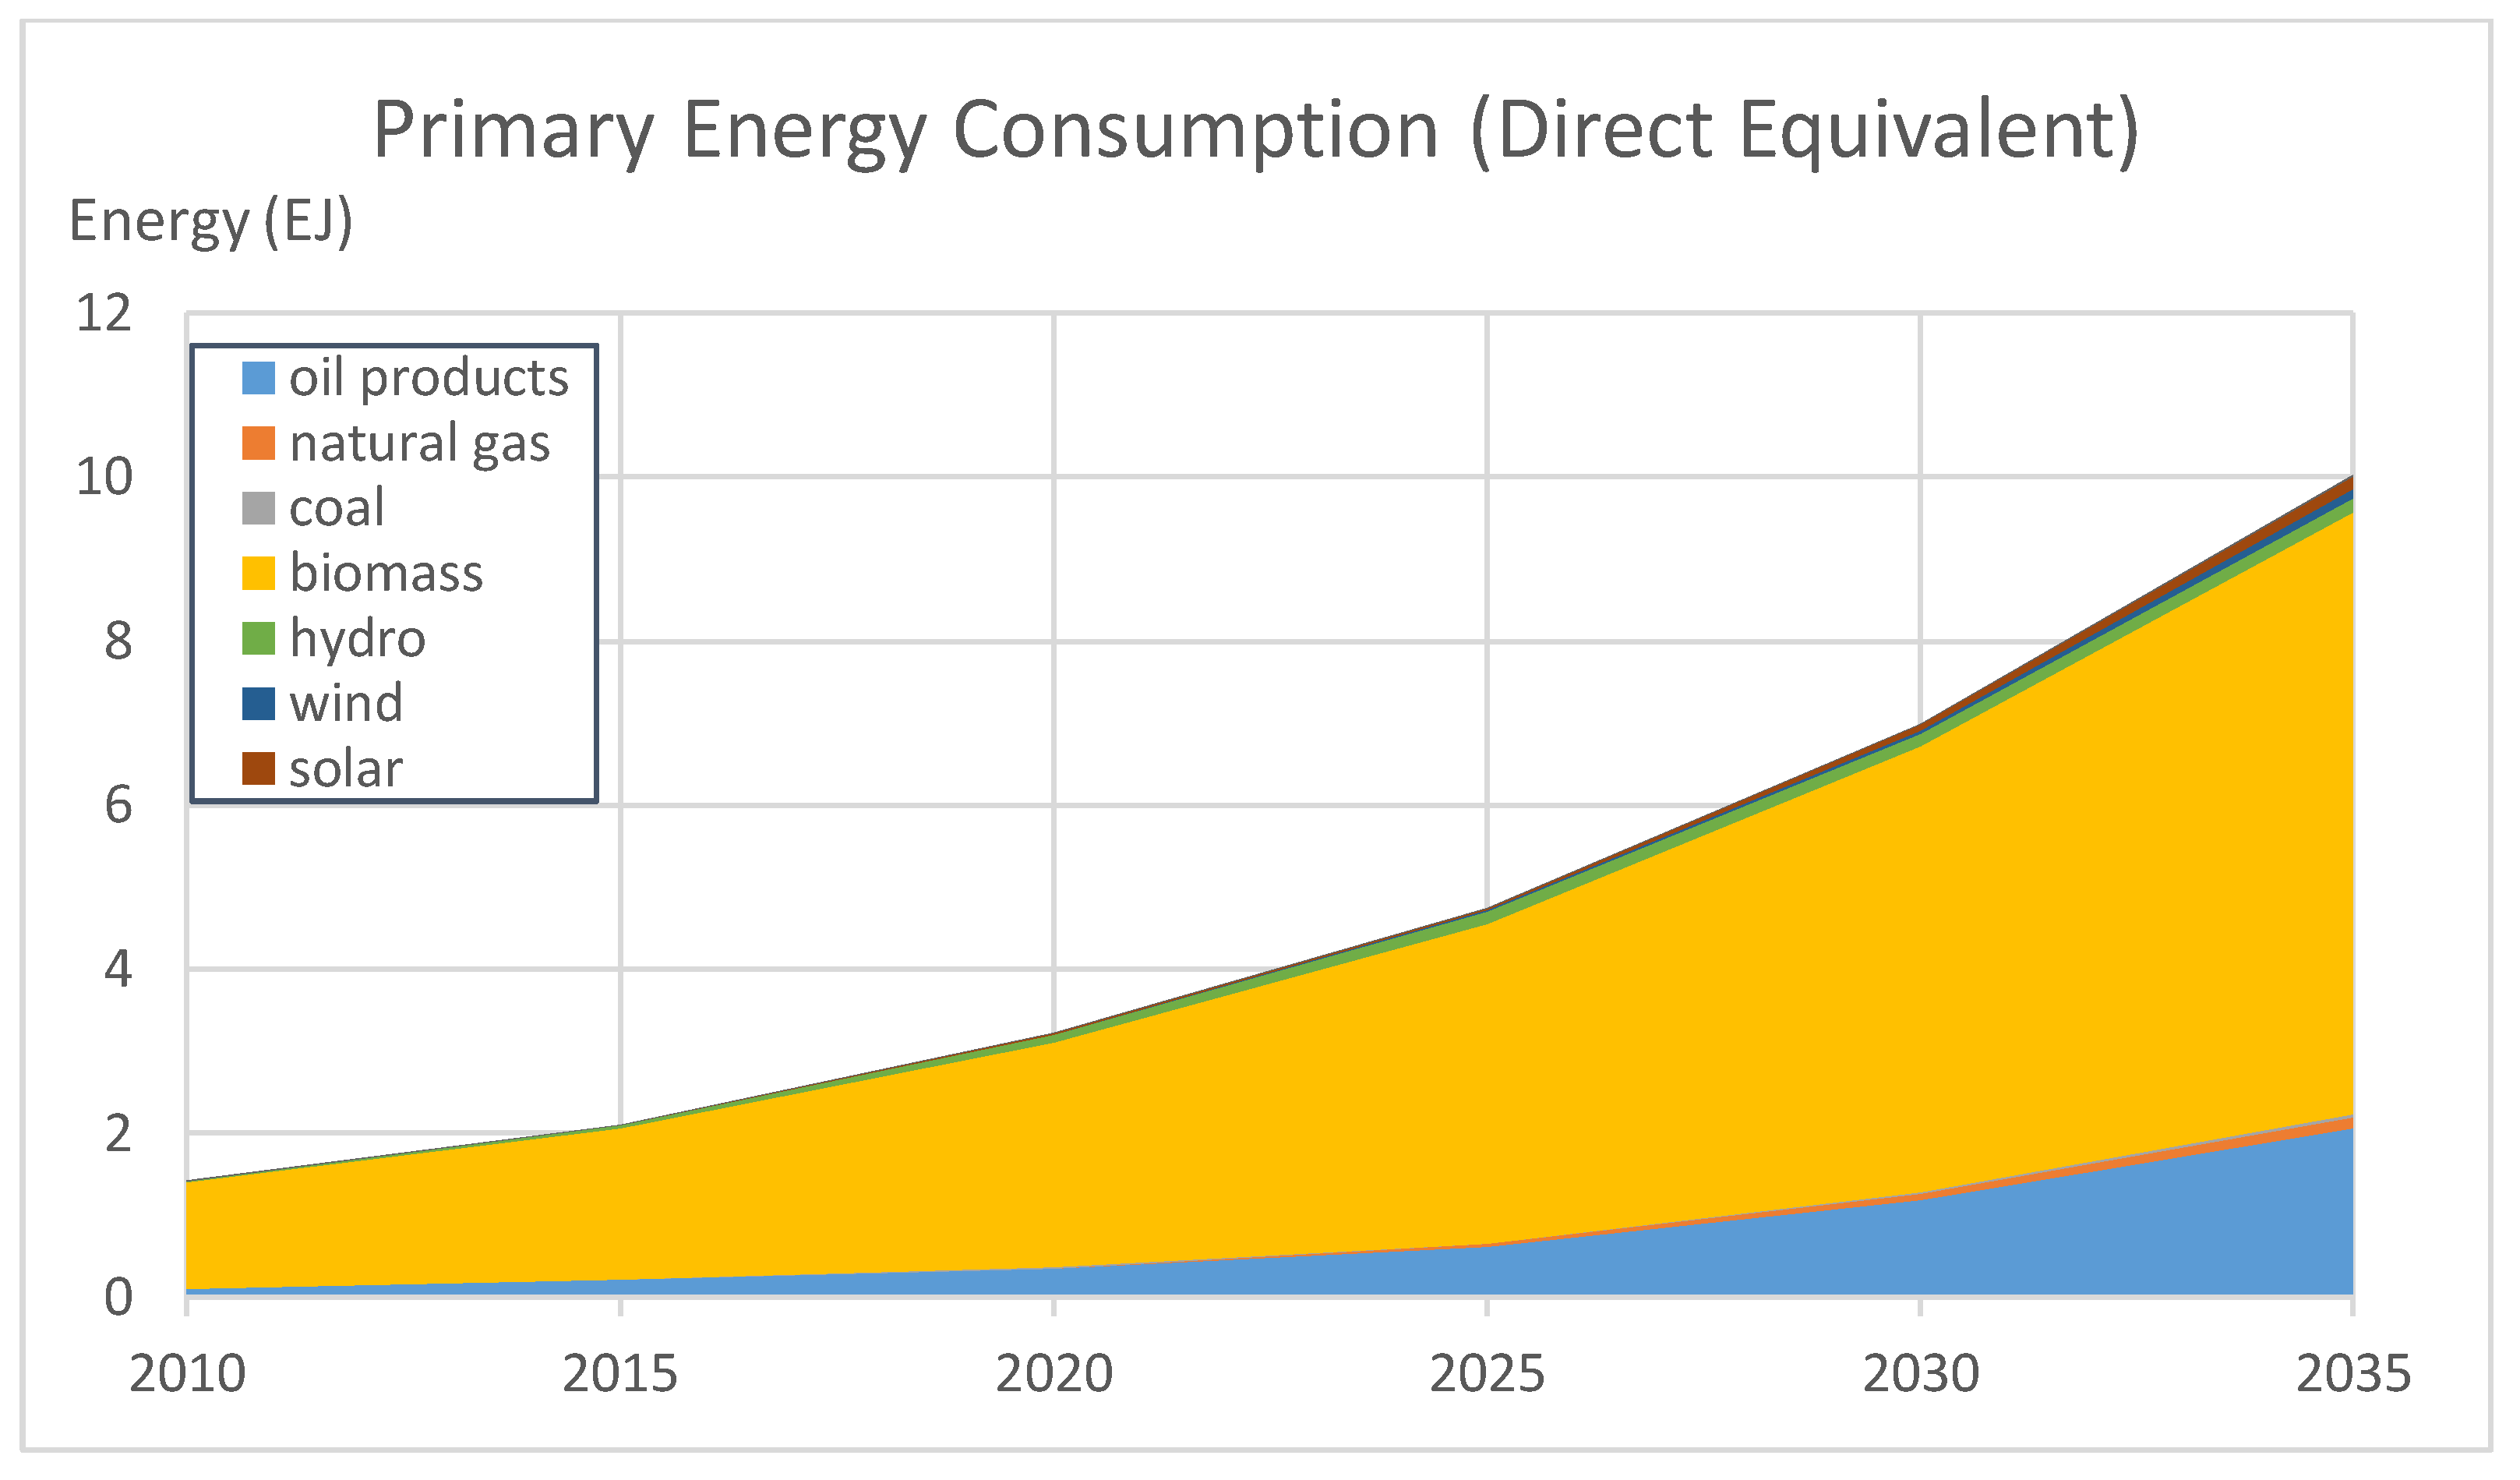
Figure 5.
Final Energy Demand for the Reference Case (Unit: EJ).
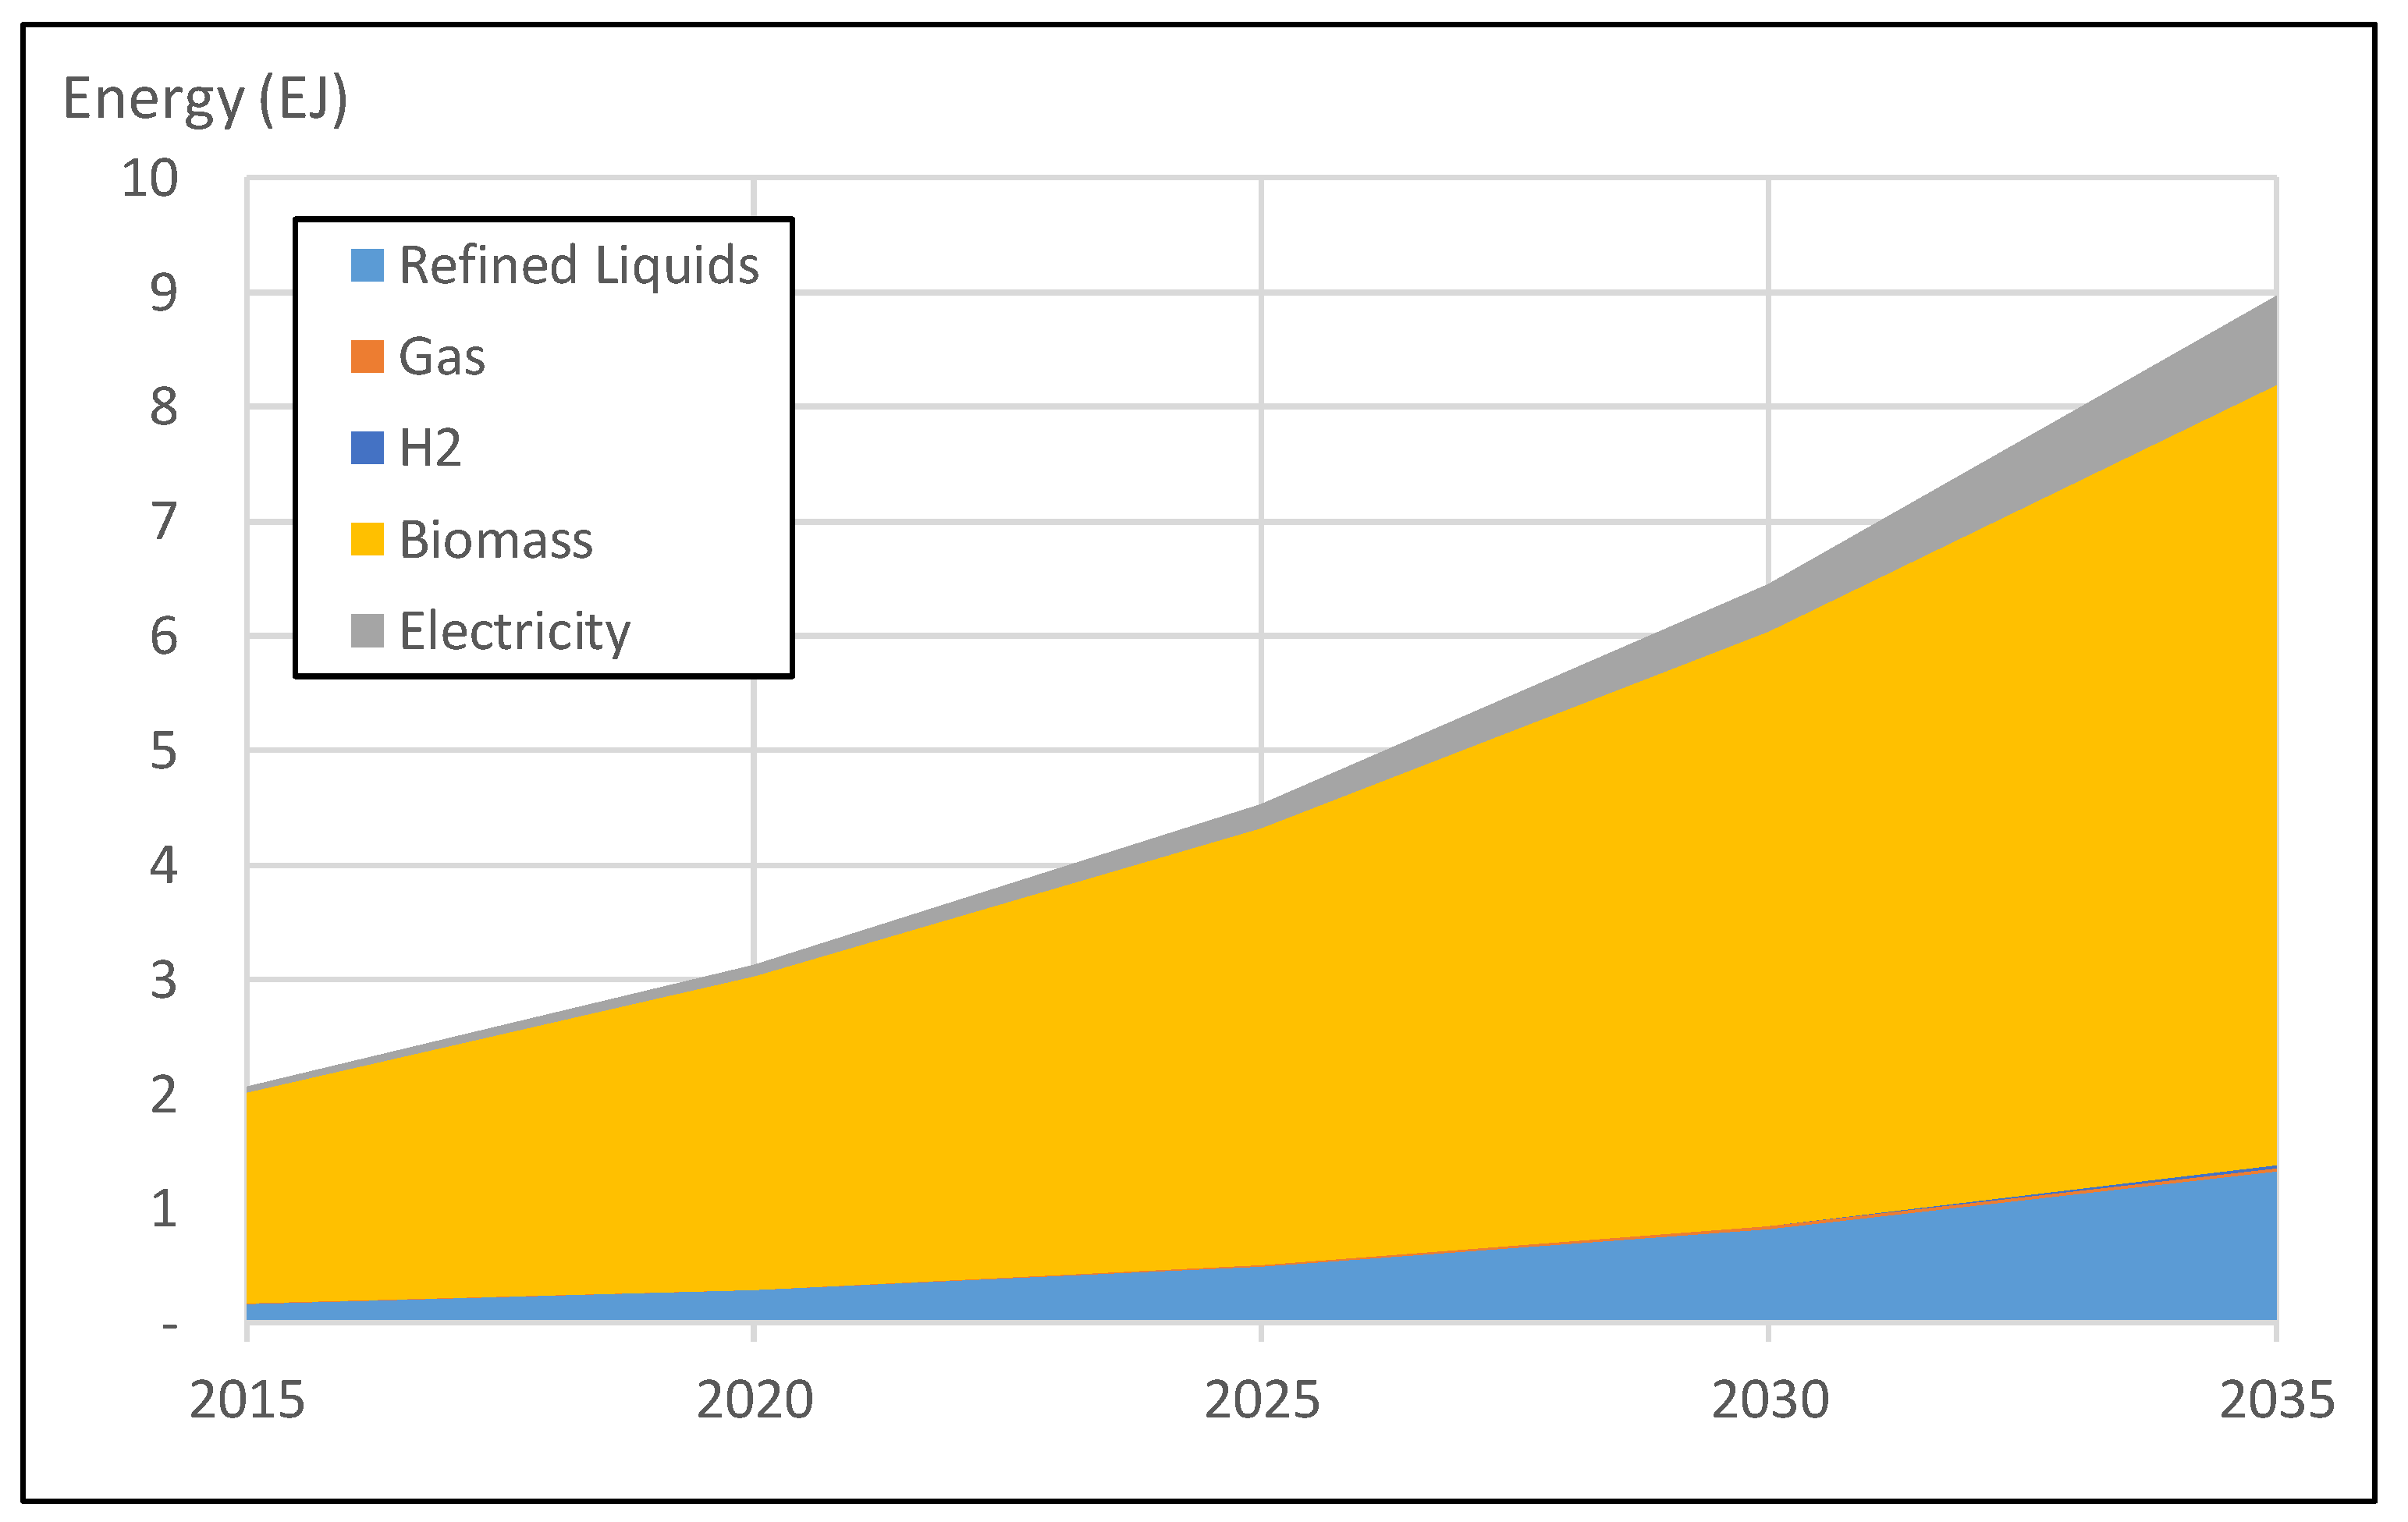
Figure 6.
Final Energy Demand by GDP and Urban Population Scenario (Unit: EJ).

Figure 7.
Distribution of Building Energy Demand for the Ref. and Alt-1 Scenarios (Unit: EJ).
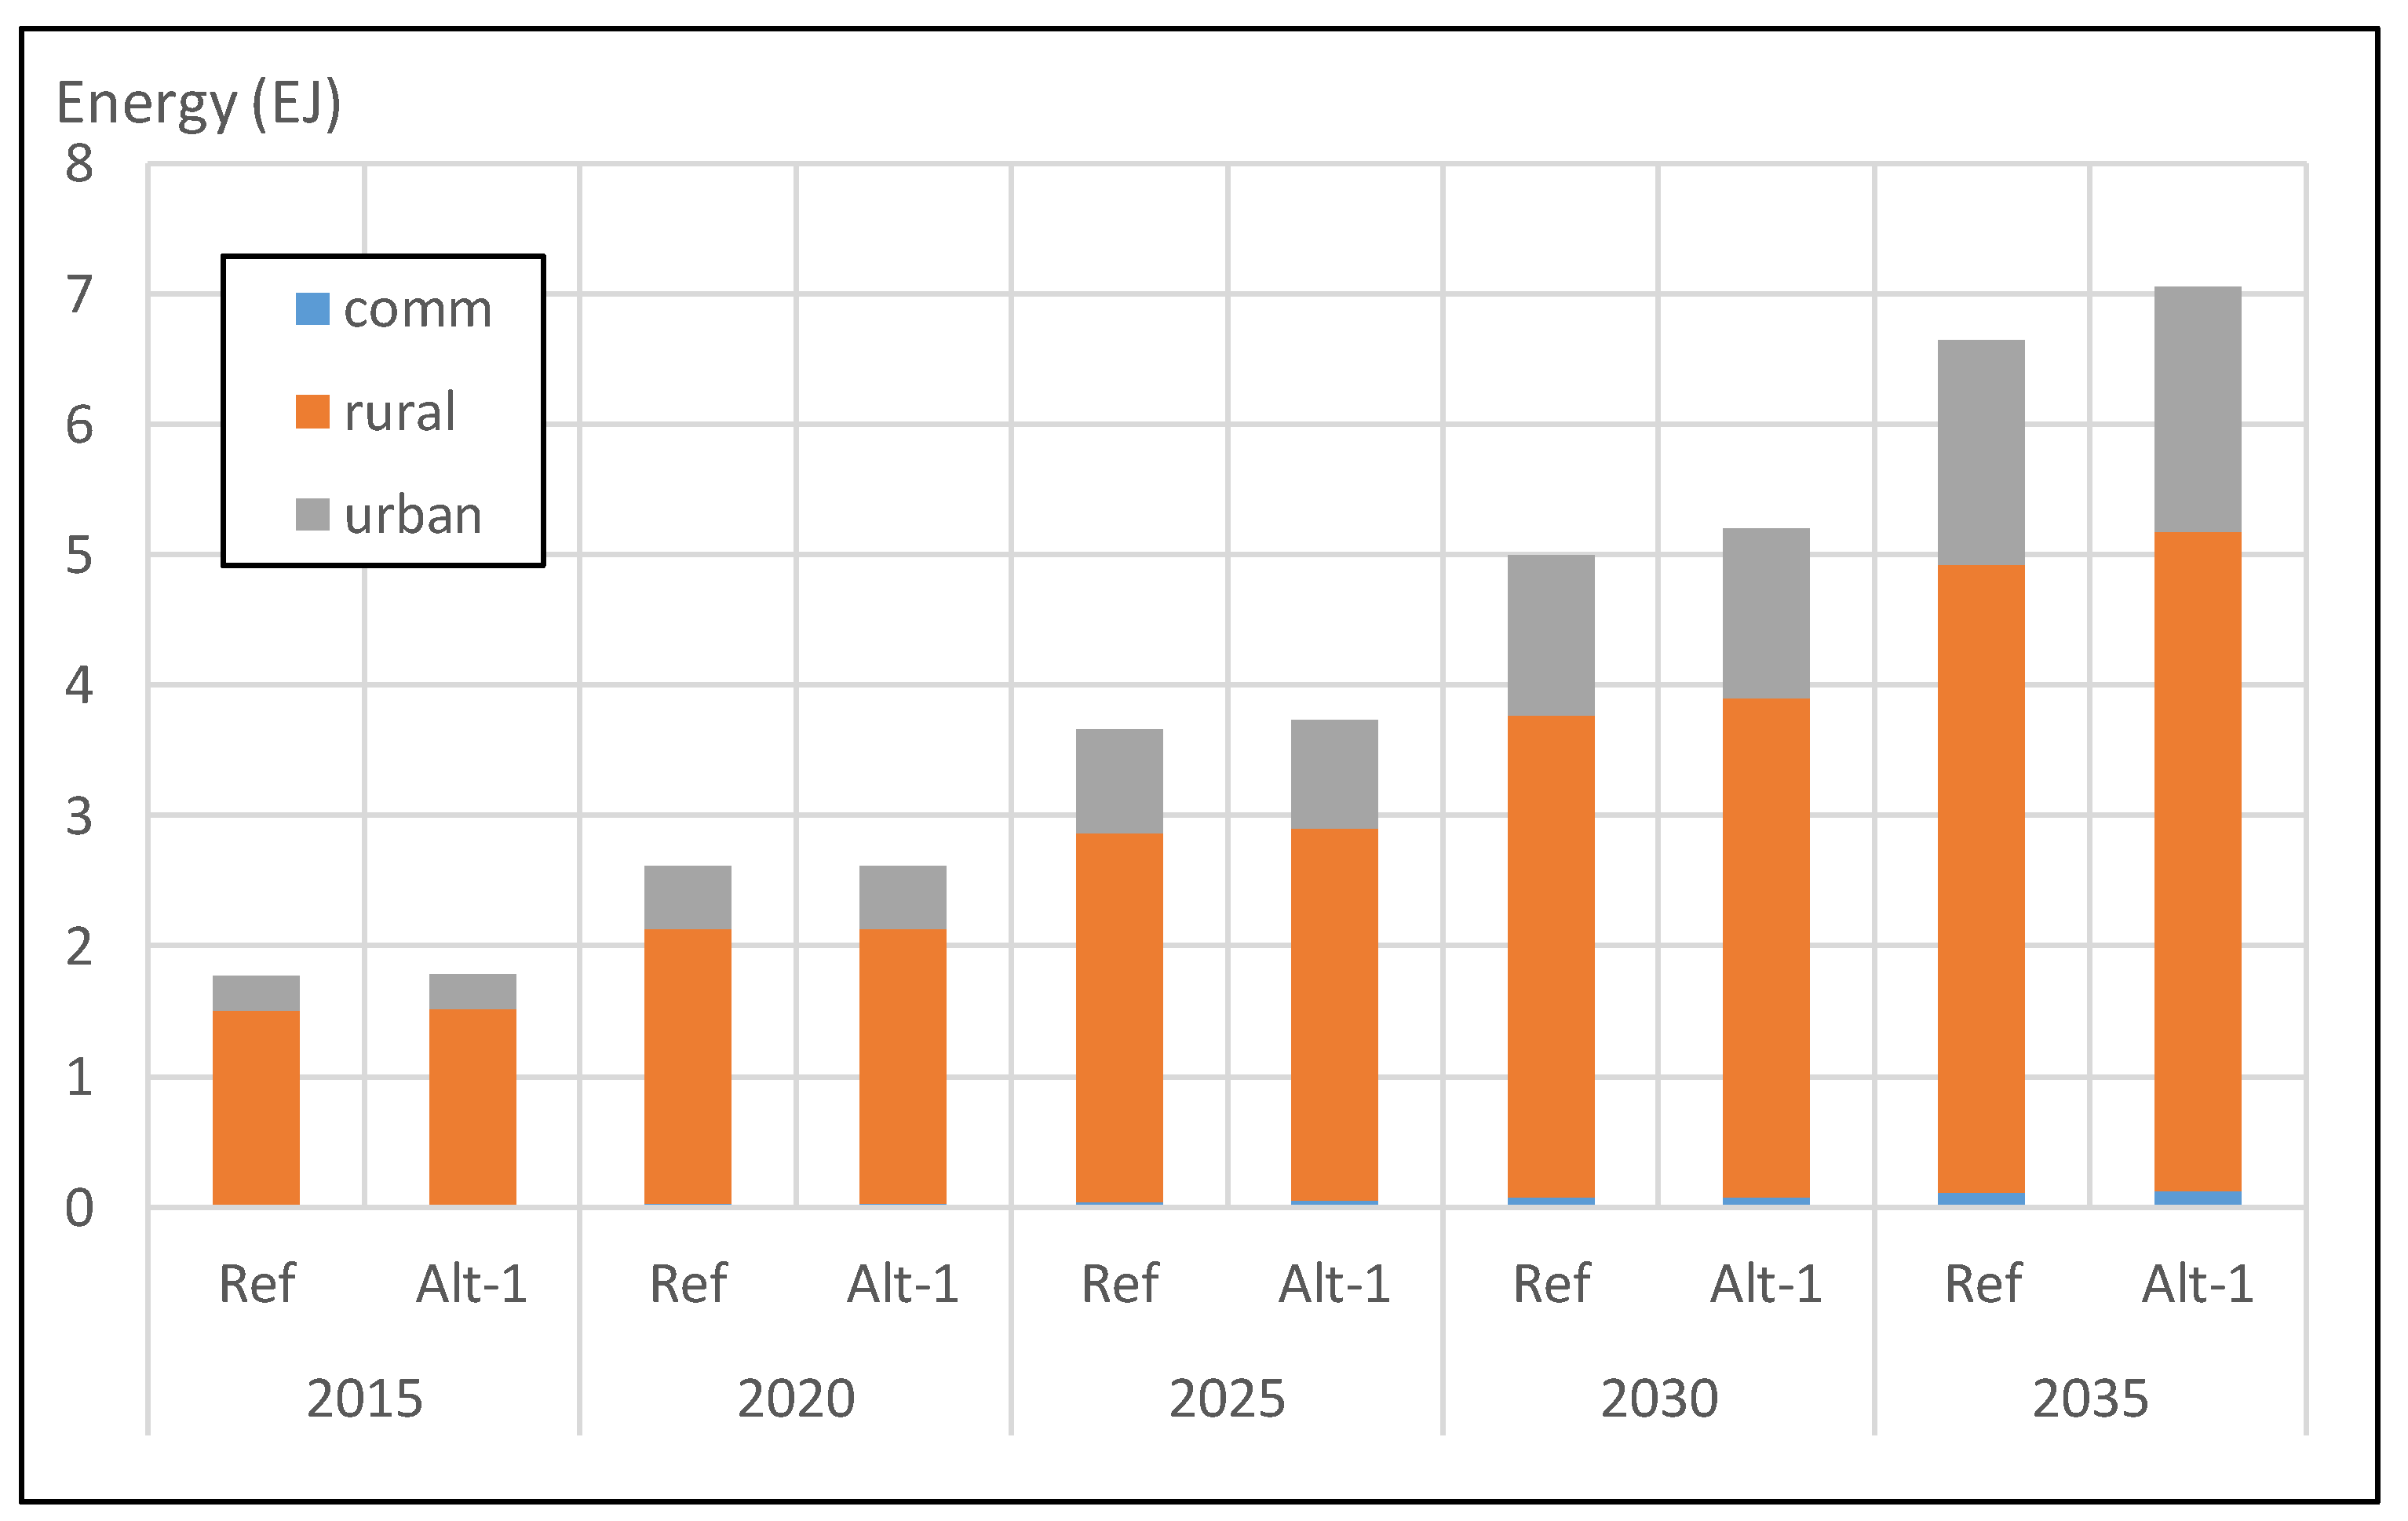
Figure 8.
Energy Demand Mix in the Building Sector in Ref Scenario (left), and Alt-1 Scenario (right) in 2035 (Unit: EJ).
Figure 8.
Energy Demand Mix in the Building Sector in Ref Scenario (left), and Alt-1 Scenario (right) in 2035 (Unit: EJ).

Figure 9.
Comparison of Energy Demand in the Building Sector due to Biomass Efficiency Improvement, Ref. vs. Alt-2 Scenario (Unit: EJ).
Figure 9.
Comparison of Energy Demand in the Building Sector due to Biomass Efficiency Improvement, Ref. vs. Alt-2 Scenario (Unit: EJ).

Figure 10.
Comparison of Energy Service Output in the Building Sector due to Biomass Efficiency Improvement, Ref. vs. Alt-2 Scenario (Unit: EJ).
Figure 10.
Comparison of Energy Service Output in the Building Sector due to Biomass Efficiency Improvement, Ref. vs. Alt-2 Scenario (Unit: EJ).

Figure 11.
Energy Mix in the Building Sector in the High GDP Scenario (left), and High GDP + T&D Loss Reduction (right), in 2035.
Figure 11.
Energy Mix in the Building Sector in the High GDP Scenario (left), and High GDP + T&D Loss Reduction (right), in 2035.


Table 1.
Percentage of Lighting and Cooking Technology/Fuel Utilization, 2011 (Unit: %).
| Lighting | Cooking | |||||
|---|---|---|---|---|---|---|
| Country | Rural | Urban | Country | Rural | Urban | |
| Biomass | 11.7 | 14.7 | 0.6 | 96.32 | 99.68 | 83.93 |
| Kerosene | 52.3 | 64.4 | 7.7 | 1.18 | 0.17 | 4.93 |
| Gas | - | - | - | 0.25 | 0.04 | 1.05 |
| Electricity | 35.8 | 20.82 | 91.2 | 1.32 | 0.01 | 6.18 |
| Total 1 | 99.8 | 99.92 | 99.5 | 99.07 | 99.9 | 96.09 |
1 The original source of data does not give a total of 100% when all types of fuel are aggregated.
Table 2.
Population of Ethiopia.
| Region | No. of Towns | 2007 Population | 2012 Population | Urbanization Level | |||
|---|---|---|---|---|---|---|---|
| Total [R + U] | Urban | Total [R + U] | Urban | 2007 | 2012 | ||
| Total | 1062 | 73,918,505 | 11,934,697 | 84,020,599 | 14,625,190 | 16.1 | 17.4 |
Table 3.
Disaggregated Energy Balance Table for the Building Sector (2010, KTOE).
| Item Unit: ktoe | Light Petroleum Products | LPG and Refinery Gas | Electricity | Primary Biomass Energy | Derived Biomass Energy | Total Energy | ||
|---|---|---|---|---|---|---|---|---|
| Residential | Urban | Heating | 0 | |||||
| Cooling | 0 | |||||||
| Cooking | 3 | 9 | 3 | 3478 | 110 | 3602 | ||
| Hot Water | - | |||||||
| Lighting | 4 | - | 40 | 25 | 1 | 70 | ||
| Appliances | - | - | 4 | - | - | 4 | ||
| Urban Sub-Total | 7 | 9 | 47 | 3503 | 111 | 3676 | ||
| Rural | Heating | - | ||||||
| Cooling | - | |||||||
| Cooking | 1 | - | 0 | 21,462 | 678 | 22,140 | ||
| Hot Water | - | |||||||
| Lighting | 248 | - | 64 | 3165 | 100 | 3577 | ||
| Appliances | - | - | 16 | - | - | 16 | ||
| Rural Sub-Total | 249 | - | 80 | 24,627 | 777 | 25,734 | ||
| Residential Sub-Total | 256 | 9 | 127 | 28,130 | 888 | 29,410 | ||
| Commercial | Heating | - | ||||||
| Cooling | - | |||||||
| Cooking | - | - | 4 | 181 | 17 | 202 | ||
| Hot Water | - | - | 8 | 20 | 2 | 30 | ||
| Lighting | - | - | 64 | 1 | 0 | 65 | ||
| Appliances | - | - | 7 | - | - | 7 | ||
| Commercial Sub-Total | - | - | 83 | 202 | 19 | 304 | ||
| Total | 256 | 9 | 210 | 28,332 | 907 | 29,714 | ||
Table 4.
GDP Scenario.
| Nominal GDP (Billion Birr) 1 | Real GDP | Nominal Growth Rate | Real Growth Rate | Inflation Rate | |||||||
|---|---|---|---|---|---|---|---|---|---|---|---|
| Base | High | Base | High | Base | High | Base | High | Base | High | ||
| 2010/11 | 2011 | 515 | 515 | 478.9 | 478.9 | - | - | - | - | - | - |
| 2011/12 | 2012 | 747 | 747 | 520.3 | 520.3 | 45.09 | 45.09 | 8.65 | 8.65 | 36.44 | 36.44 |
| 2012/13 | 2013 | 867 | 867 | 575.4 | 575.4 | 16.00 | 16.00 | 10.58 | 10.58 | 5.42 | 5.42 |
| 2013/14 | 2014 | 1061 | 1061 | 634.4 | 634.4 | 22.37 | 22.37 | 10.26 | 10.26 | 12.10 | 12.10 |
| 2014/15 | 2015 | 1298 | 1298 | 700.3 | 700.3 | 22.35 | 22.35 | 10.39 | 10.39 | 11.97 | 11.97 |
| 2015/16 | 2016 | 1528 | 1528 | 753.3 | 753.3 | 17.73 | 17.73 | 7.56 | 7.56 | 10.16 | 10.16 |
| 2016/17 | 2017 | 1828 | 1852 | 833.3 | 841.6 | 19.61 | 21.17 | 10.63 | 11.73 | 8.98 | 9.44 |
| 2017/18 | 2018 | 2233 | 2299 | 918.9 | 939.7 | 22.15 | 24.16 | 10.27 | 11.65 | 11.89 | 12.51 |
| 2018/19 | 2019 | 2718 | 2852 | 1011.5 | 1049.4 | 21.76 | 24.07 | 10.08 | 11.68 | 11.68 | 12.39 |
| 2019/20 | 2020 | 3299 | 3534 | 1111.8 | 1171.8 | 21.38 | 23.91 | 9.92 | 11.66 | 11.47 | 12.25 |
| 2020/21 | 2021 | 3995 | 4375 | 1219.9 | 1307.6 | 21.10 | 23.80 | 9.73 | 11.59 | 11.37 | 12.21 |
| 2021/22 | 2022 | 4825 | 5408 | 1336.0 | 1457.8 | 20.76 | 23.62 | 9.52 | 11.49 | 11.24 | 12.13 |
| 2022/23 | 2023 | 5807 | 6671 | 1460.1 | 1623.3 | 20.36 | 23.35 | 9.28 | 11.35 | 11.08 | 12.00 |
| 2023/24 | 2024 | 6963 | 8207 | 1592.1 | 1805.3 | 19.91 | 23.02 | 9.04 | 11.21 | 10.87 | 11.81 |
| 2024/25 | 2025 | 8316 | 10,064 | 1732.1 | 2005.0 | 19.42 | 22.63 | 8.80 | 11.06 | 10.62 | 11.57 |
| 2025/26 | 2026 | 9886 | 12,299 | 1880.1 | 2224.0 | 18.88 | 22.21 | 8.55 | 10.92 | 10.34 | 11.29 |
| 2026/27 | 2027 | 11,699 | 14,976 | 2036.6 | 2464.2 | 18.34 | 21.77 | 8.32 | 10.80 | 10.02 | 10.97 |
| 2027/28 | 2028 | 13,782 | 18,172 | 2201.9 | 2728.2 | 17.81 | 21.34 | 8.12 | 10.71 | 9.69 | 10.63 |
| 2028/29 | 2029 | 16,165 | 21,977 | 2376.9 | 3019.1 | 17.29 | 20.94 | 7.95 | 10.66 | 9.34 | 10.27 |
| 2029/30 | 2030 | 18,883 | 26,502 | 2562.8 | 3341.2 | 16.81 | 20.59 | 7.82 | 10.67 | 8.99 | 9.92 |
| Average Growth (2018–2030) | 19.69 | 22.72 | 9.03 | 11.19 | 10.66 | 11.53 | |||||
1 Nominal GDP scenarios are developed, first, to satisfy the target of becoming a middle-income country by 2025.
Table 5.
Efficiency Improvement Scenario for Alt-2.
| Year | 2015 | 2020 | 2025 | 2030 | 2035 |
|---|---|---|---|---|---|
| Efficiency Improvement | 20% | 35% | 50% | 50% | 50% |
Table 6.
Derivation of Energy Consumption Rate Urban vs. Rural and the Sensitivity Analyses.
| Urban | Rural | ||
|---|---|---|---|
| Reference | Population | 17.49 | 82.51 |
| Energy/Capita | 0.69 | 1 | |
| Energy Consumption | 12.06 | 82.51 | |
| Energy Cons. Rate | 1.00 | 6.84 | |
| R65 | Energy Cons. Rate | 1.00 | 6.50 |
| R70 | Energy Cons. Rate | 1.00 | 7.00 |
Table 7.
Comparison of Building Energy Demand by Fuel between Two Urbanization (Urb.) Rates using the Reference GDP.
Table 7.
Comparison of Building Energy Demand by Fuel between Two Urbanization (Urb.) Rates using the Reference GDP.
| Urb. Rate | Fuel | 2010 | 2015 | 2020 | 2025 | 2030 | 2035 | Units |
|---|---|---|---|---|---|---|---|---|
| Medium | biomass | 1.2237 | 1.7107 | 2.4943 | 3.4085 | 4.5221 | 5.8084 | EJ |
| High | biomass | 1.2237 | 1.7107 | 2.4919 | 3.3967 | 4.4977 | 5.7715 | EJ |
| Medium | electricity | 0.0088 | 0.0245 | 0.0544 | 0.1159 | 0.2362 | 0.4486 | EJ |
| High | electricity | 0.0088 | 0.0245 | 0.0544 | 0.1161 | 0.2370 | 0.4513 | EJ |
| Medium | refined liquids | 0.0151 | 0.0355 | 0.0683 | 0.1302 | 0.2334 | 0.3927 | EJ |
| High | refined liquids | 0.0151 | 0.0355 | 0.0683 | 0.1305 | 0.2346 | 0.3958 | EJ |
Table 8.
Energy Consumption by Different Urban vs. Rural Energy Consumption Rate, EJ.
| 2010 | 2015 | 2020 | 2025 | 2030 | 2035 | ||
|---|---|---|---|---|---|---|---|
| R65 | Comm | 0.013 | 0.019 | 0.030 | 0.047 | 0.074 | 0.114 |
| Rural | 1.071 | 1.208 | 1.641 | 2.176 | 2.887 | 3.807 | |
| Urban | 0.164 | 0.264 | 0.462 | 0.749 | 1.141 | 1.619 | |
| Rur/Urb | 6.513 | 4.569 | 3.553 | 2.905 | 2.530 | 2.352 | |
| Total | 1.248 | 1.492 | 2.132 | 2.972 | 4.102 | 5.540 | |
| R70 | Comm | 0.013 | 0.019 | 0.030 | 0.047 | 0.074 | 0.114 |
| Rural | 1.081 | 1.214 | 1.645 | 2.180 | 2.891 | 3.812 | |
| Urban | 0.154 | 0.249 | 0.435 | 0.708 | 1.082 | 1.541 | |
| Rur/Urb | 7.013 | 4.883 | 3.779 | 3.079 | 2.671 | 2.473 | |
| Total | 1.248 | 1.482 | 2.110 | 2.935 | 4.047 | 5.467 |
© 2018 by the authors. Licensee MDPI, Basel, Switzerland. This article is an open access article distributed under the terms and conditions of the Creative Commons Attribution (CC BY) license (http://creativecommons.org/licenses/by/4.0/).
Share and Cite
MDPI and ACS Style
Yurnaidi, Z.; Kim, S. Reducing Biomass Utilization in the Ethiopia Energy System: A National Modeling Analysis. Energies 2018, 11, 1745. https://doi.org/10.3390/en11071745
AMA Style
Yurnaidi Z, Kim S. Reducing Biomass Utilization in the Ethiopia Energy System: A National Modeling Analysis. Energies. 2018; 11(7):1745. https://doi.org/10.3390/en11071745
Chicago/Turabian StyleYurnaidi, Zulfikar, and Suduk Kim. 2018. "Reducing Biomass Utilization in the Ethiopia Energy System: A National Modeling Analysis" Energies 11, no. 7: 1745. https://doi.org/10.3390/en11071745
Note that from the first issue of 2016, this journal uses article numbers instead of page numbers. See further details here.