Electrical Energy Producing Greenhouse Shading System with a Semi-Transparent Photovoltaic Blind Based on Micro-Spherical Solar Cells

 ,
,
Abstract
:1. Introduction
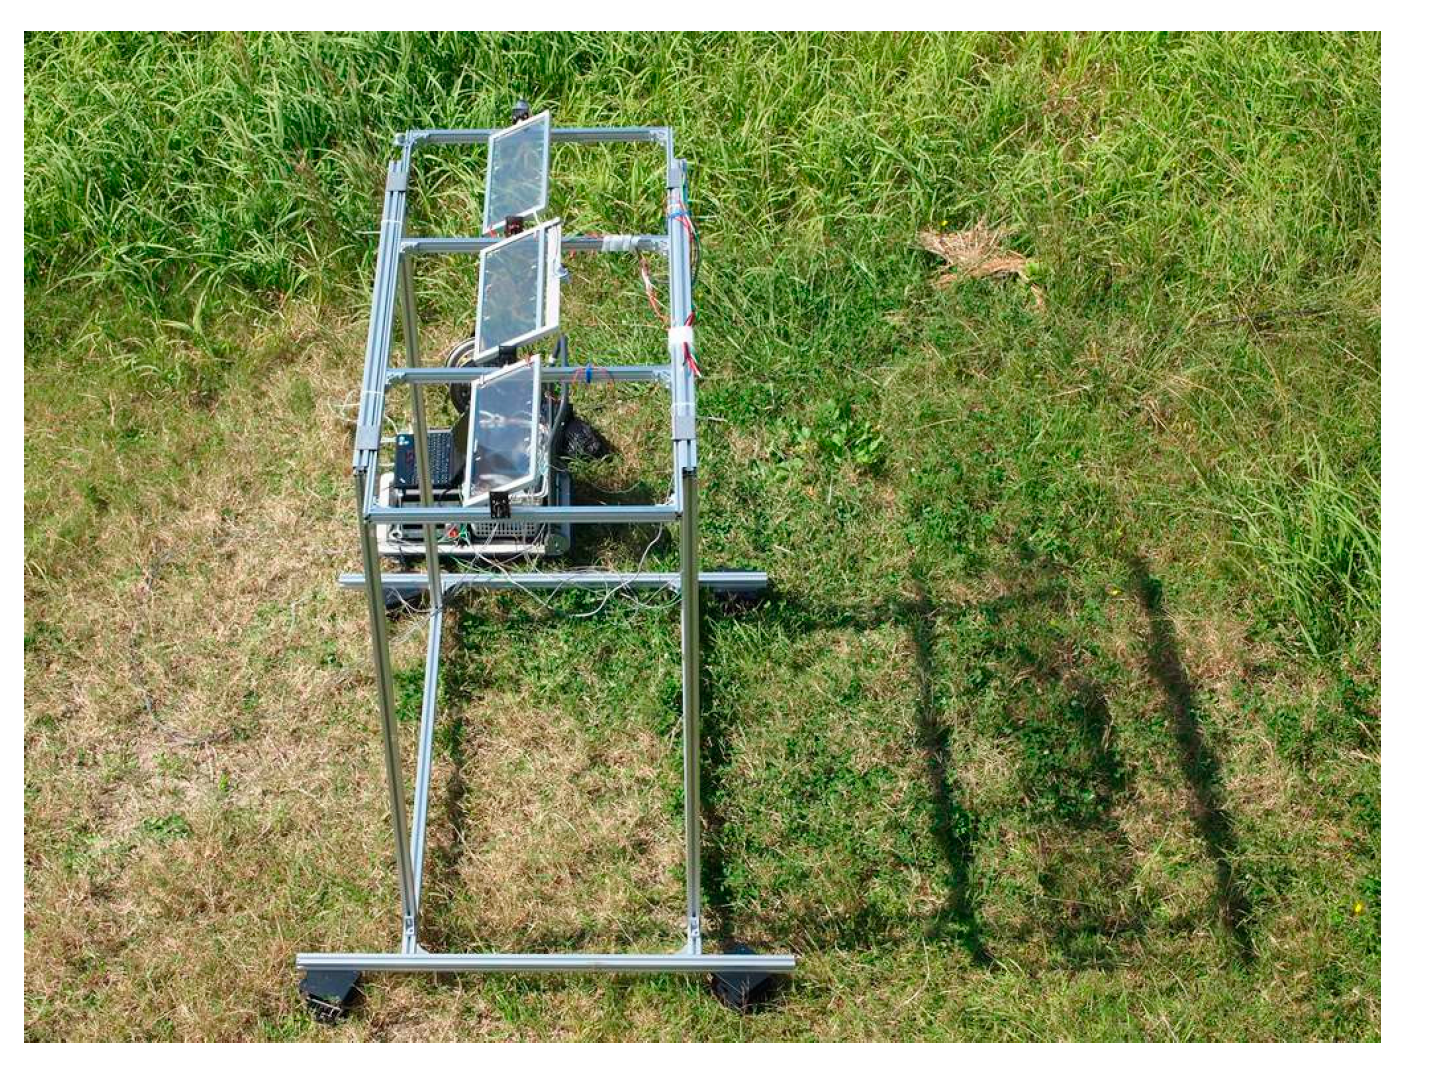
2. Development and Operational Testing of the Prototype PV-Blind System
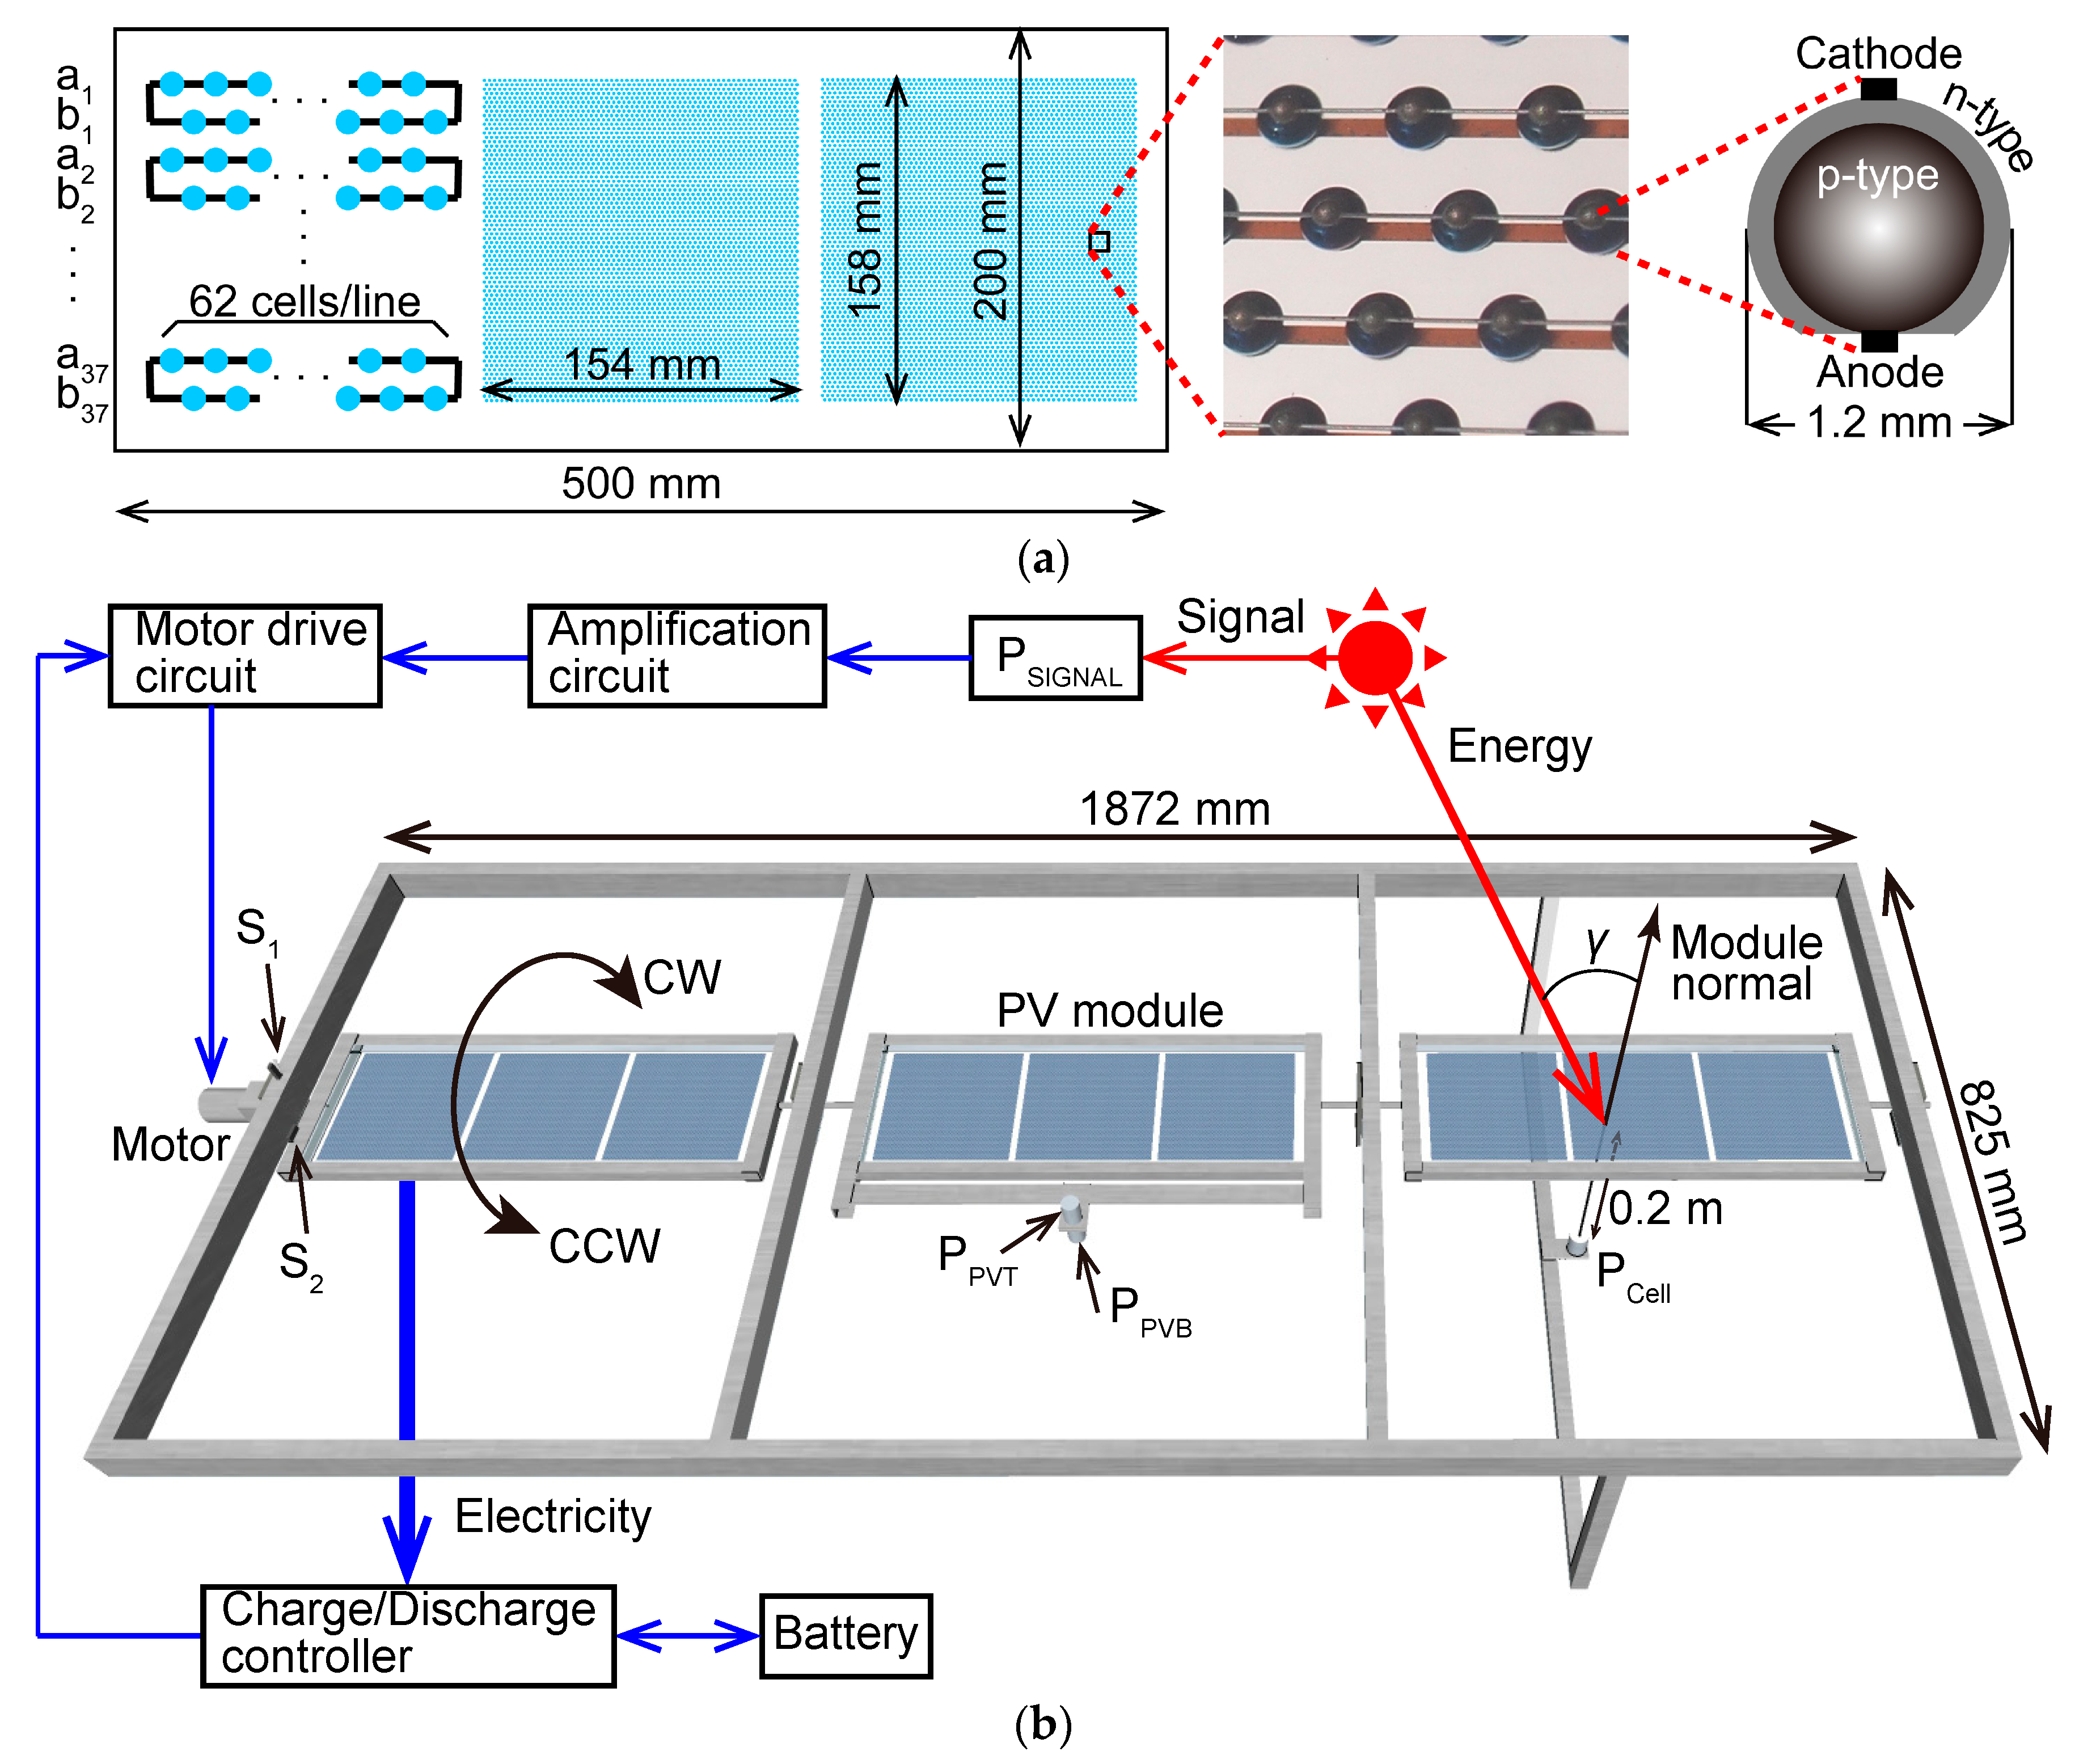
2.1. Bifacial Semi-Transparent PV Modules Used as Blind Blades
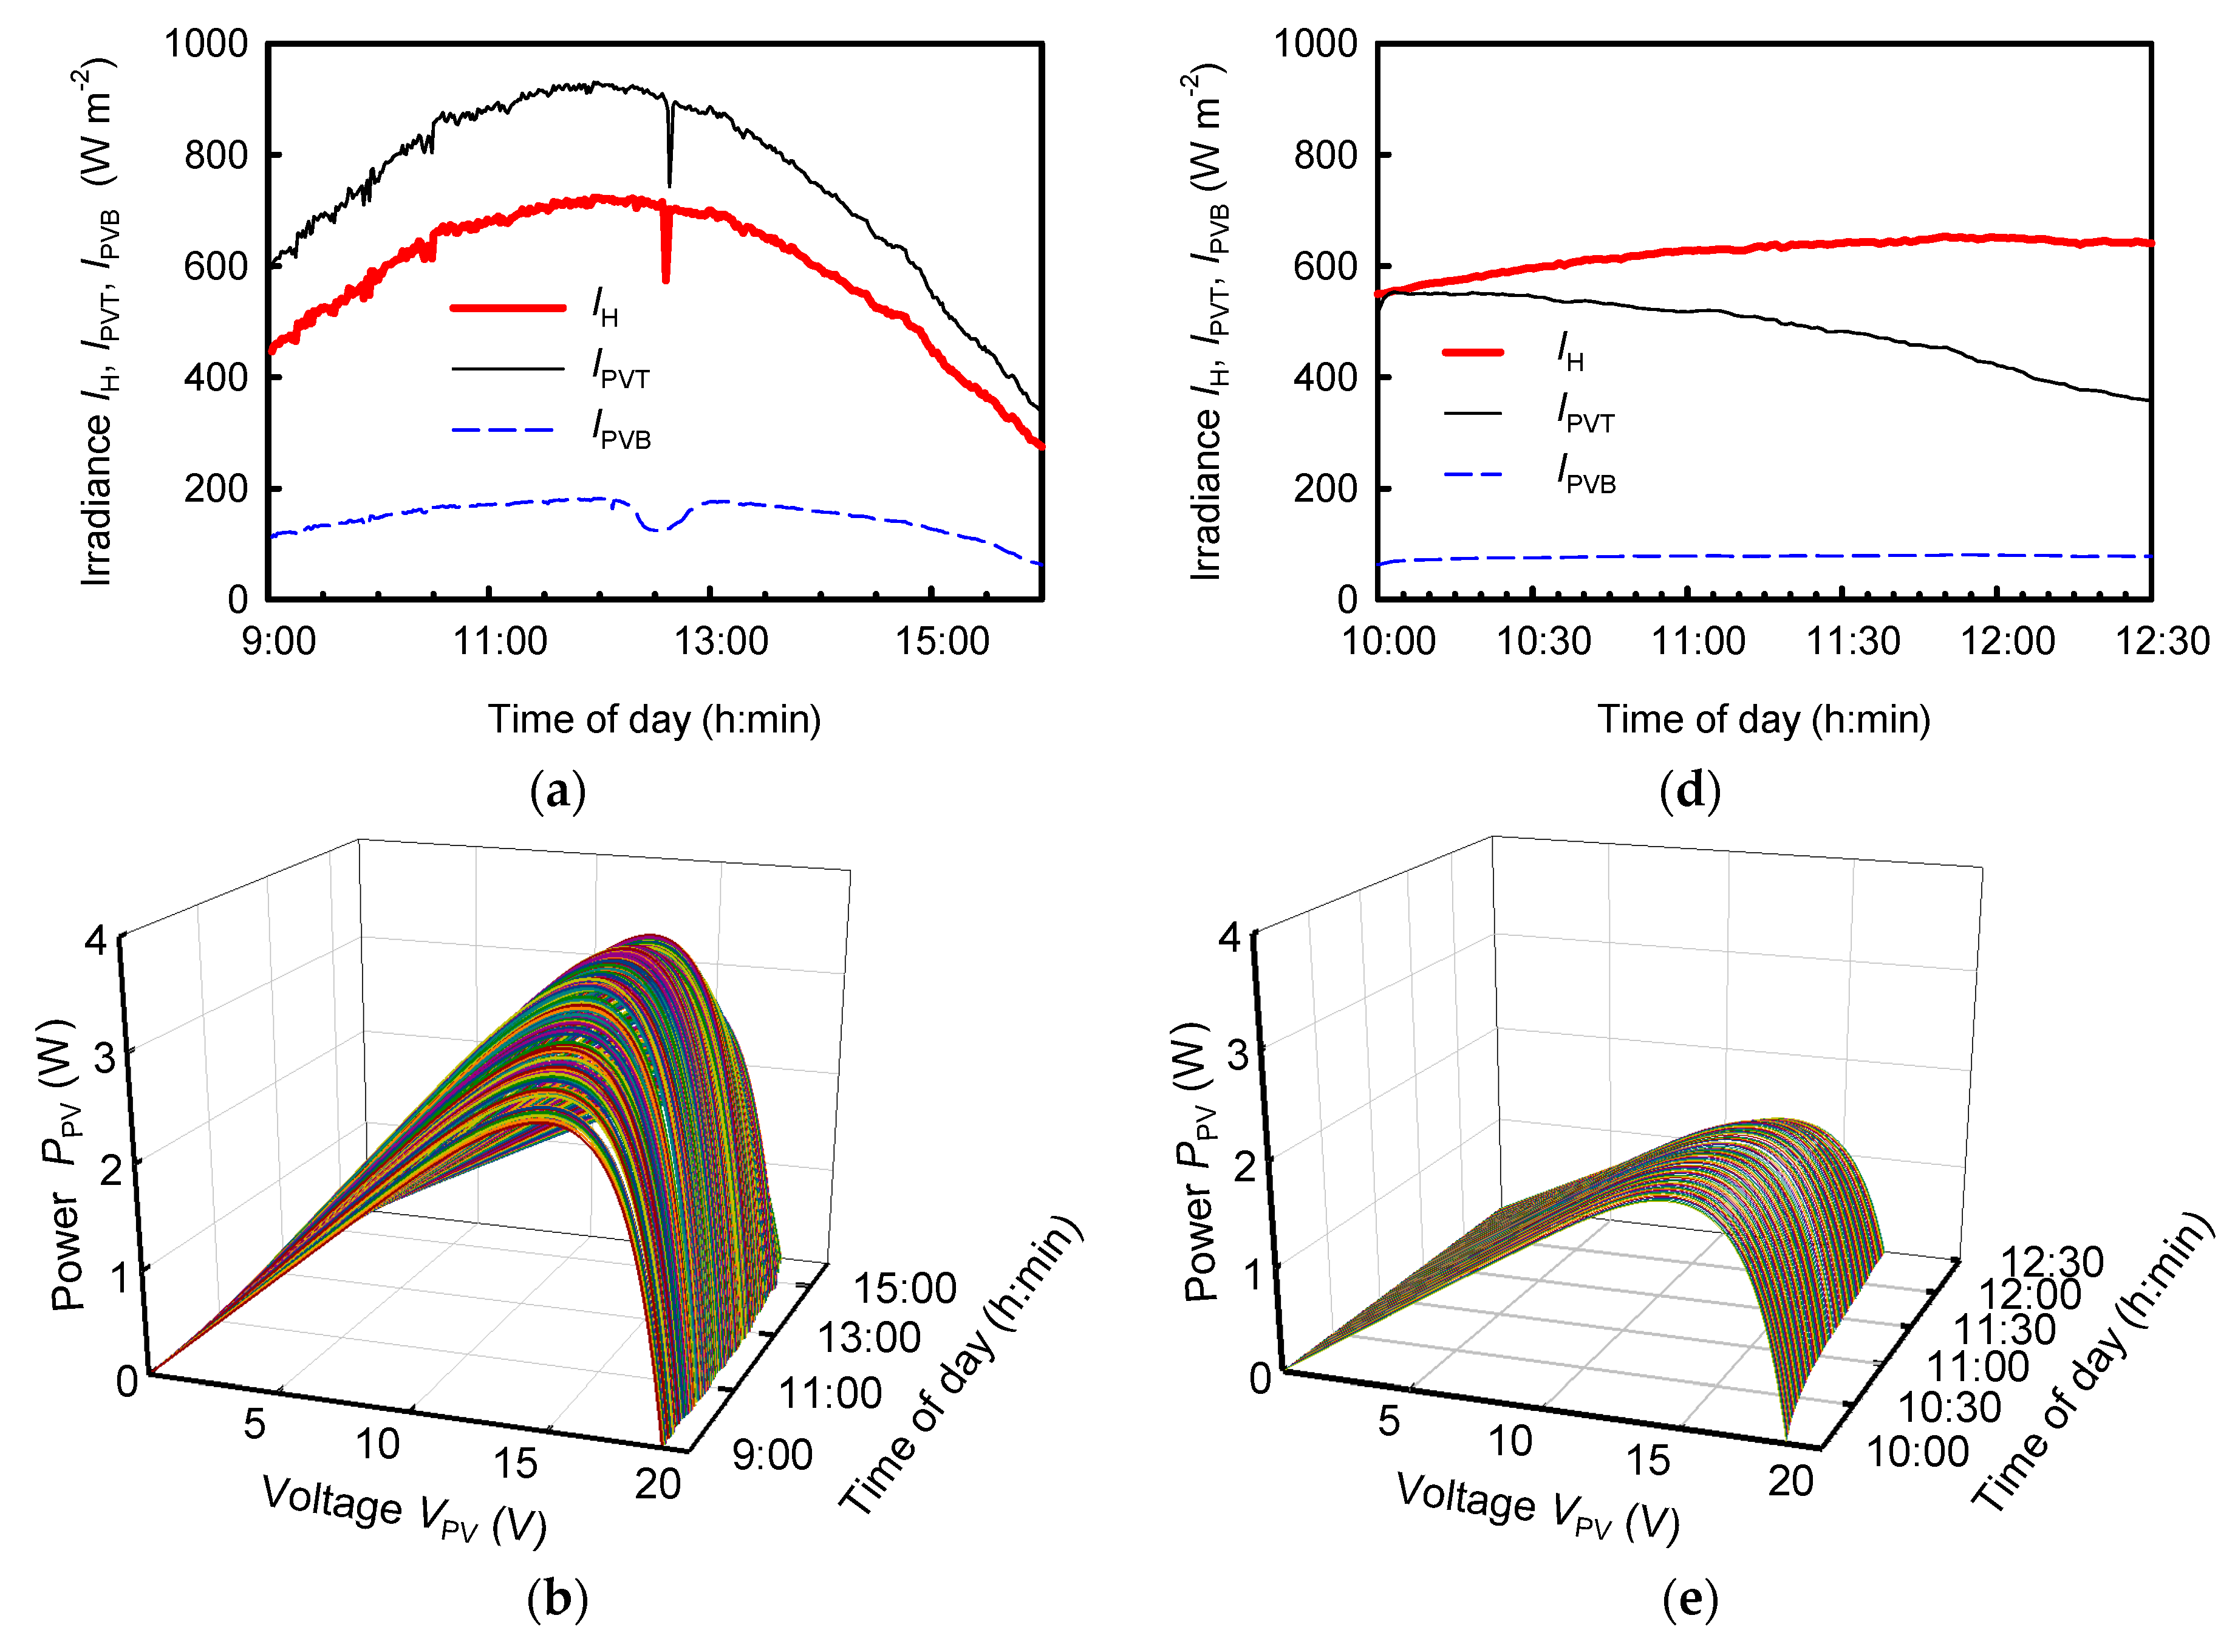
2.2. Sunlight to Electricity Conversion Characteristics of the PV Blind
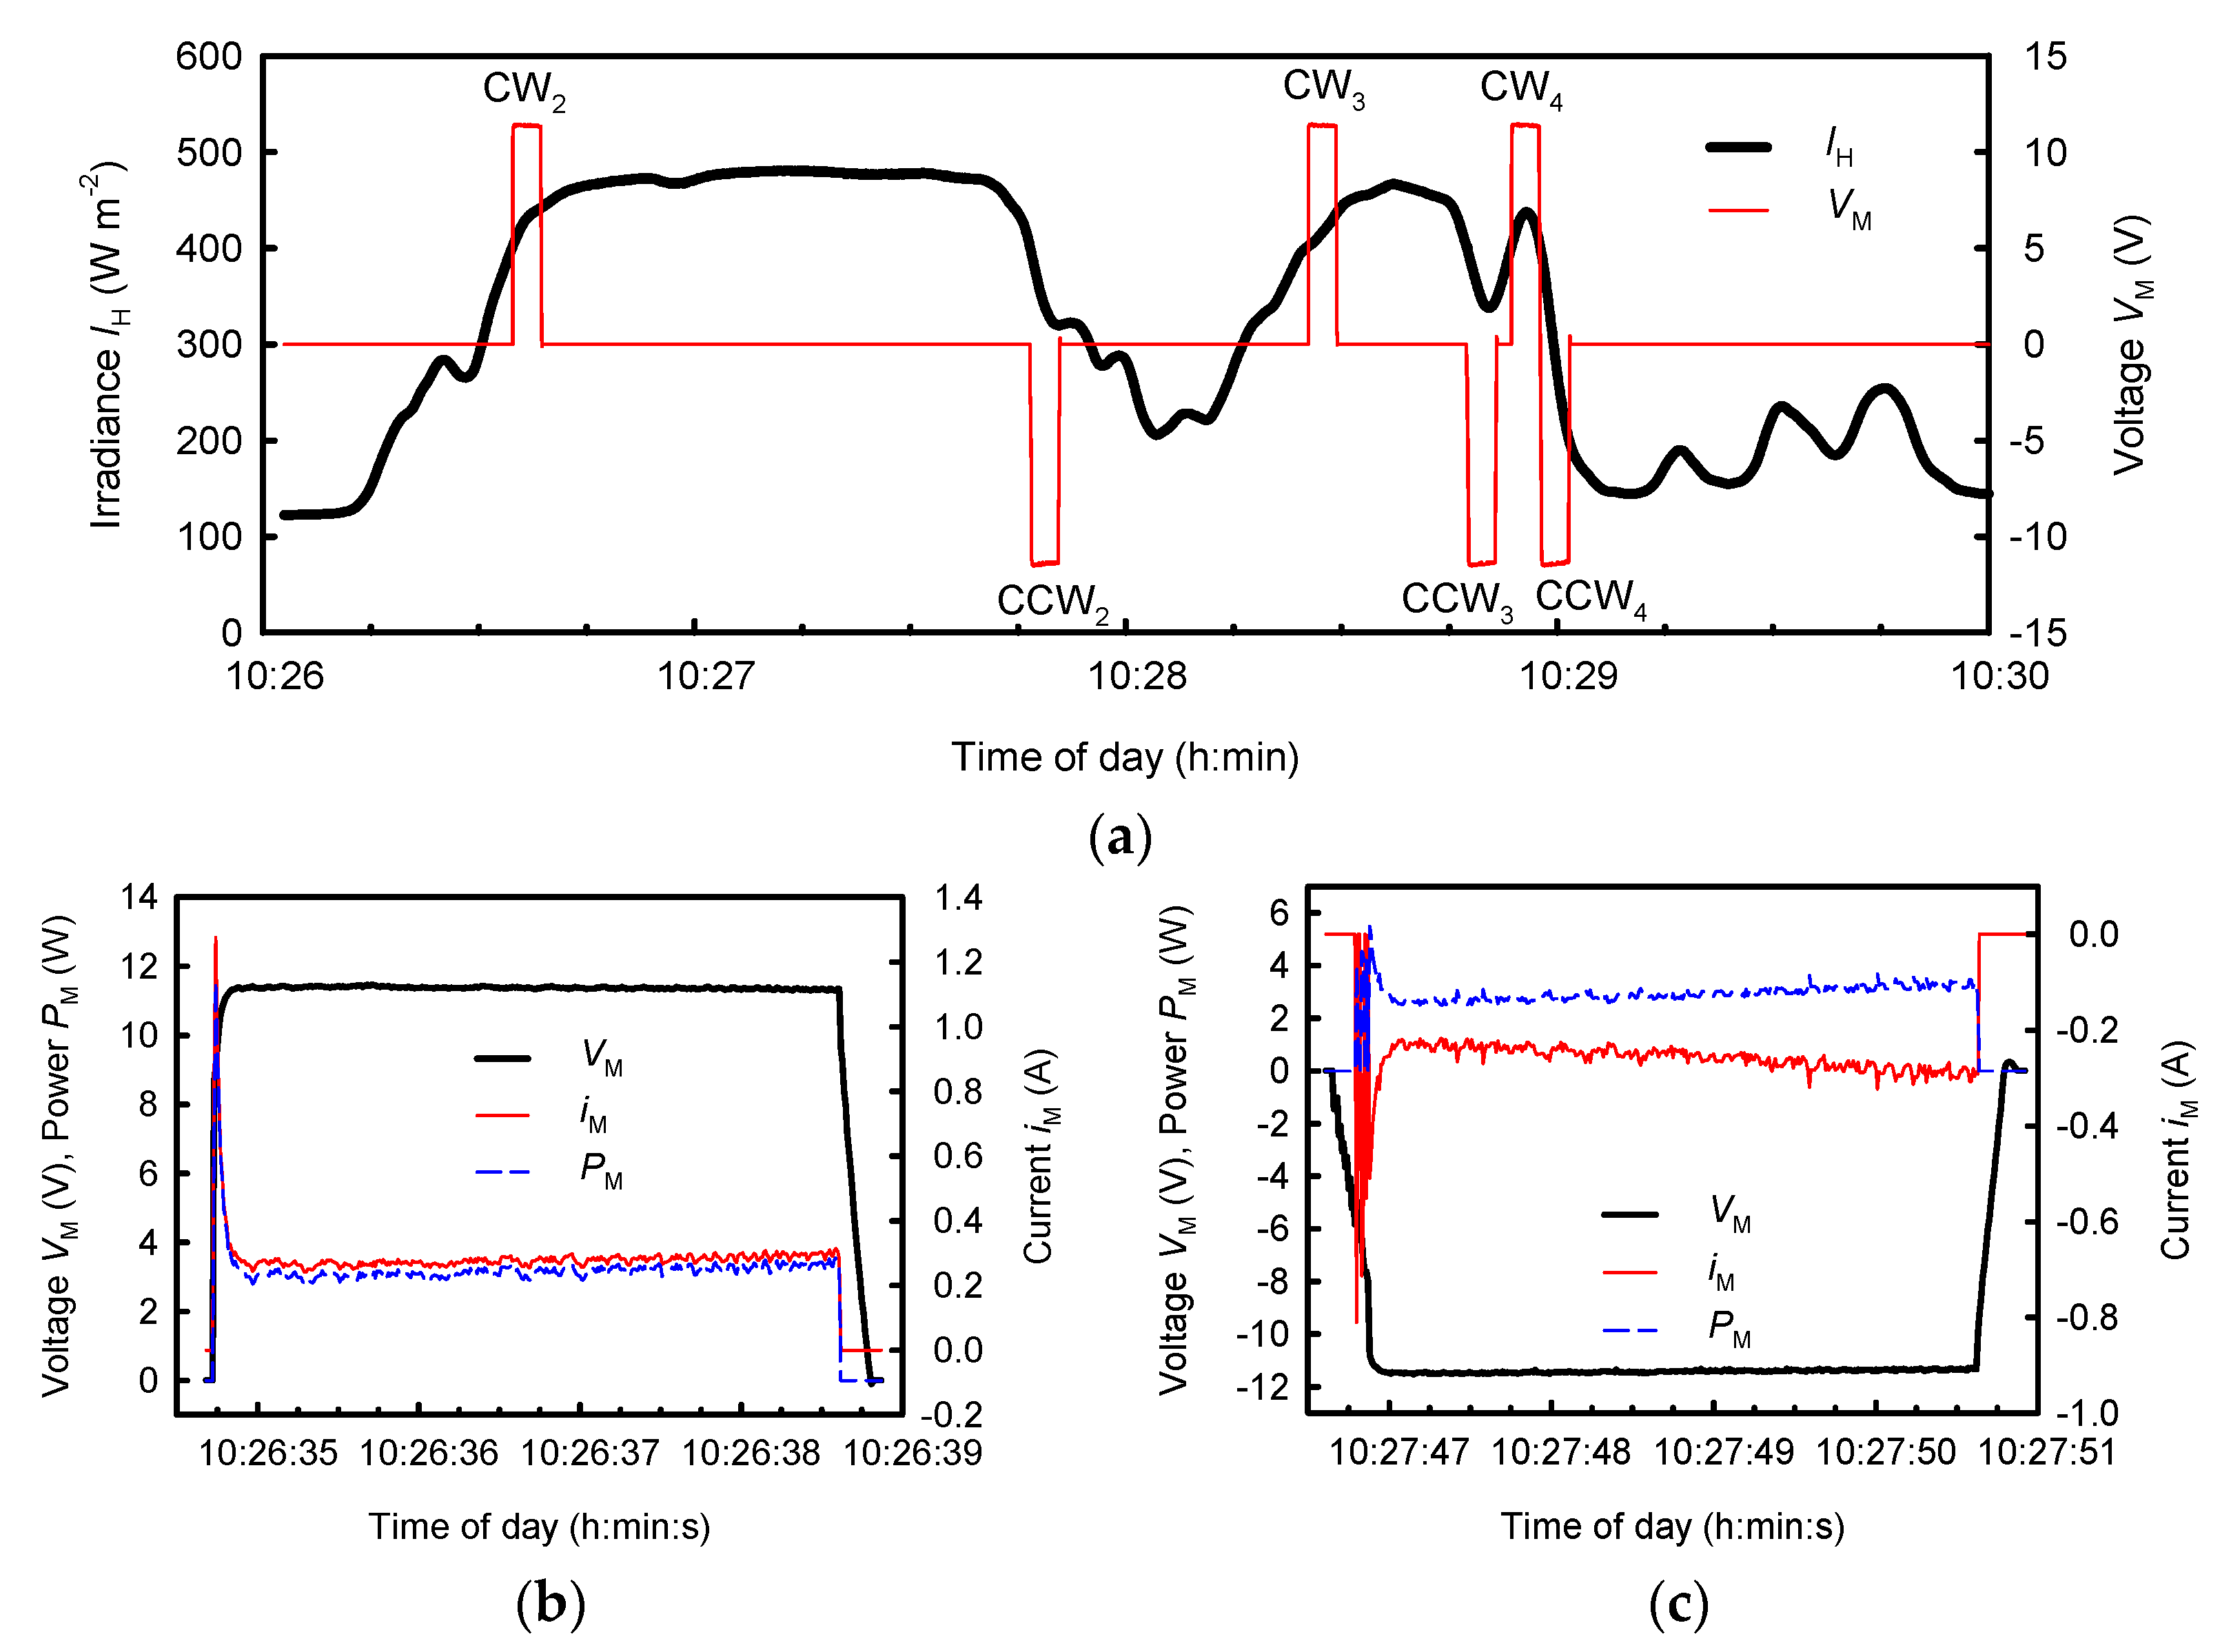
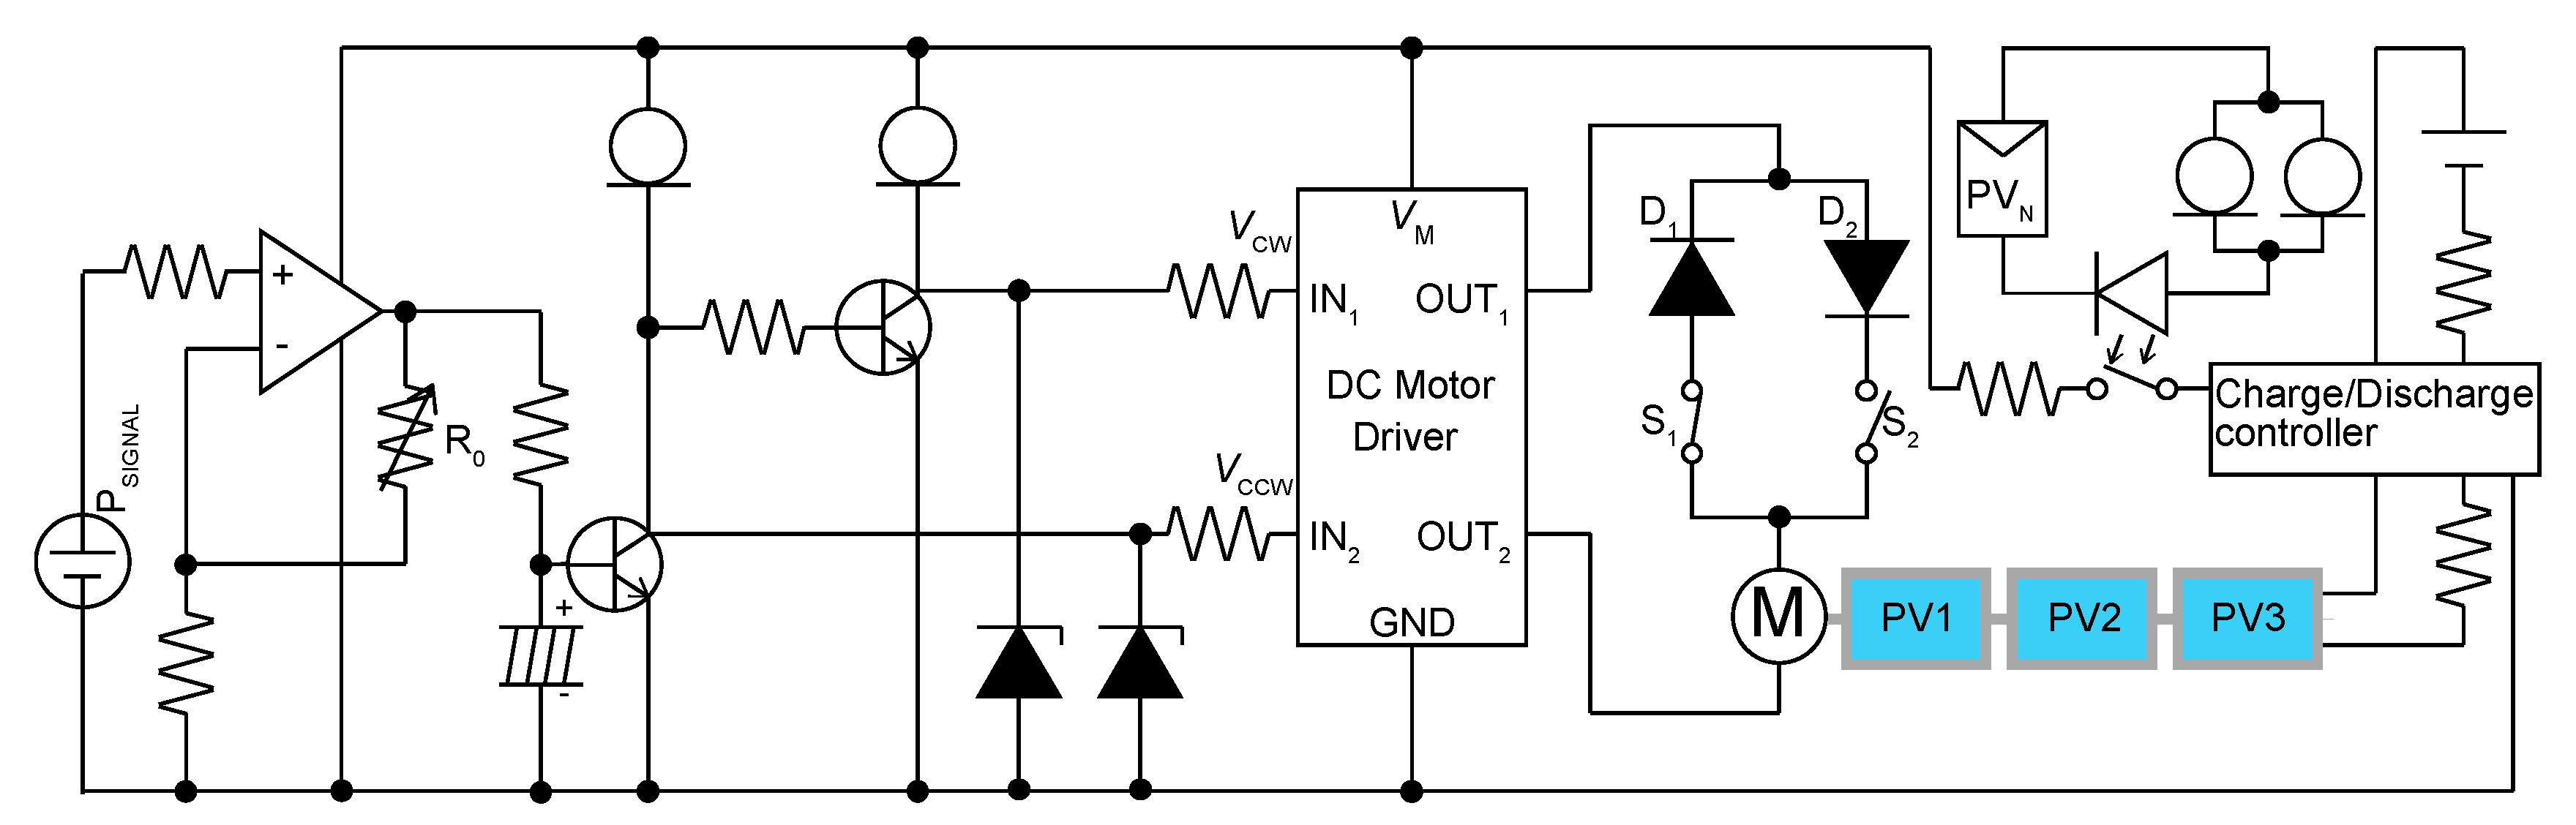
2.3. PV-Blind Control Circuit
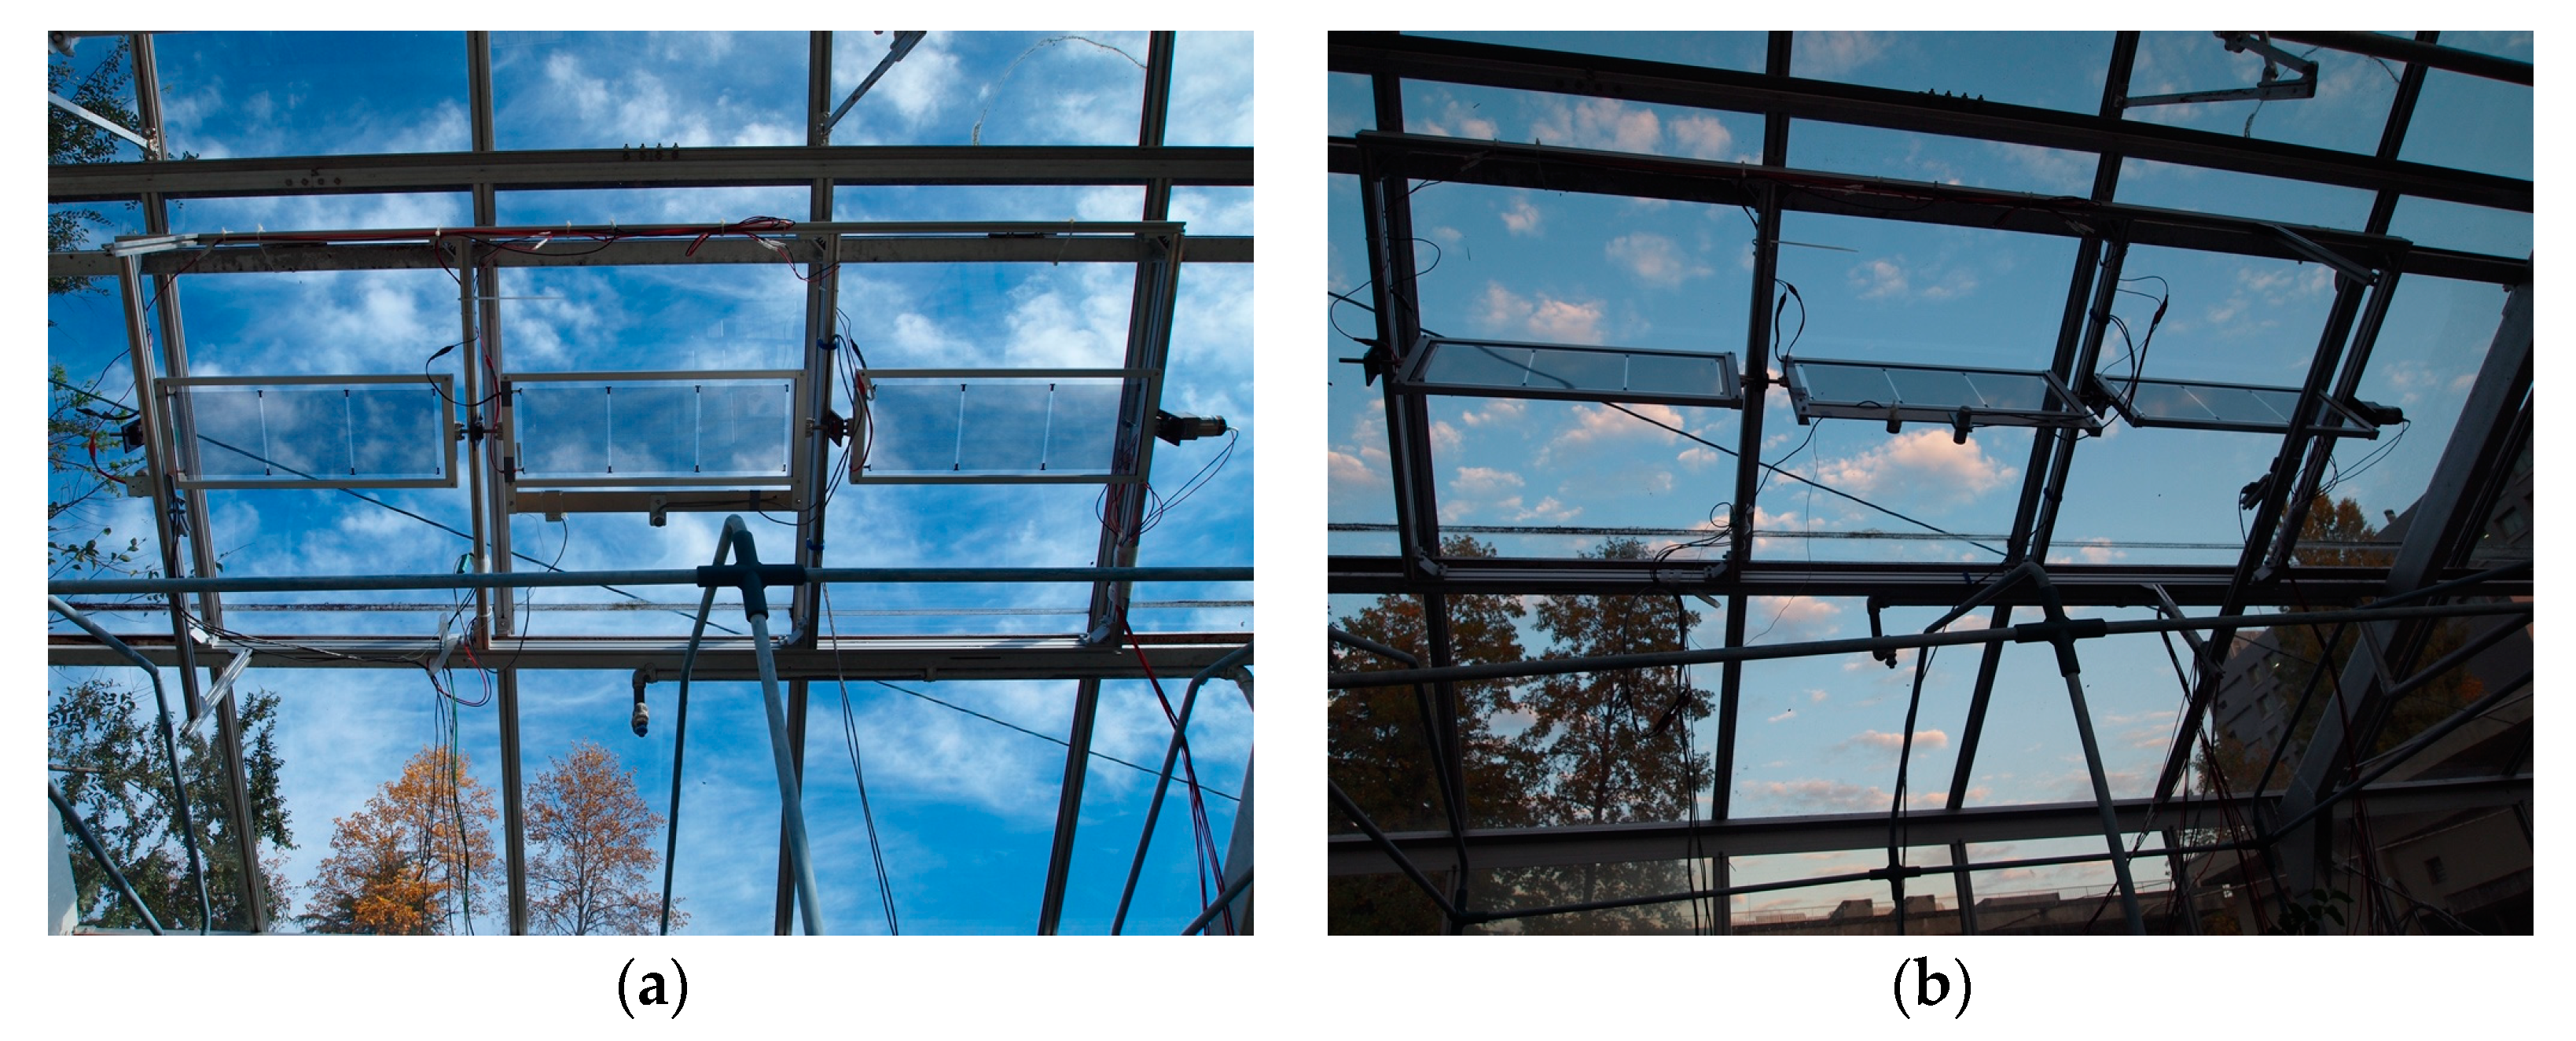
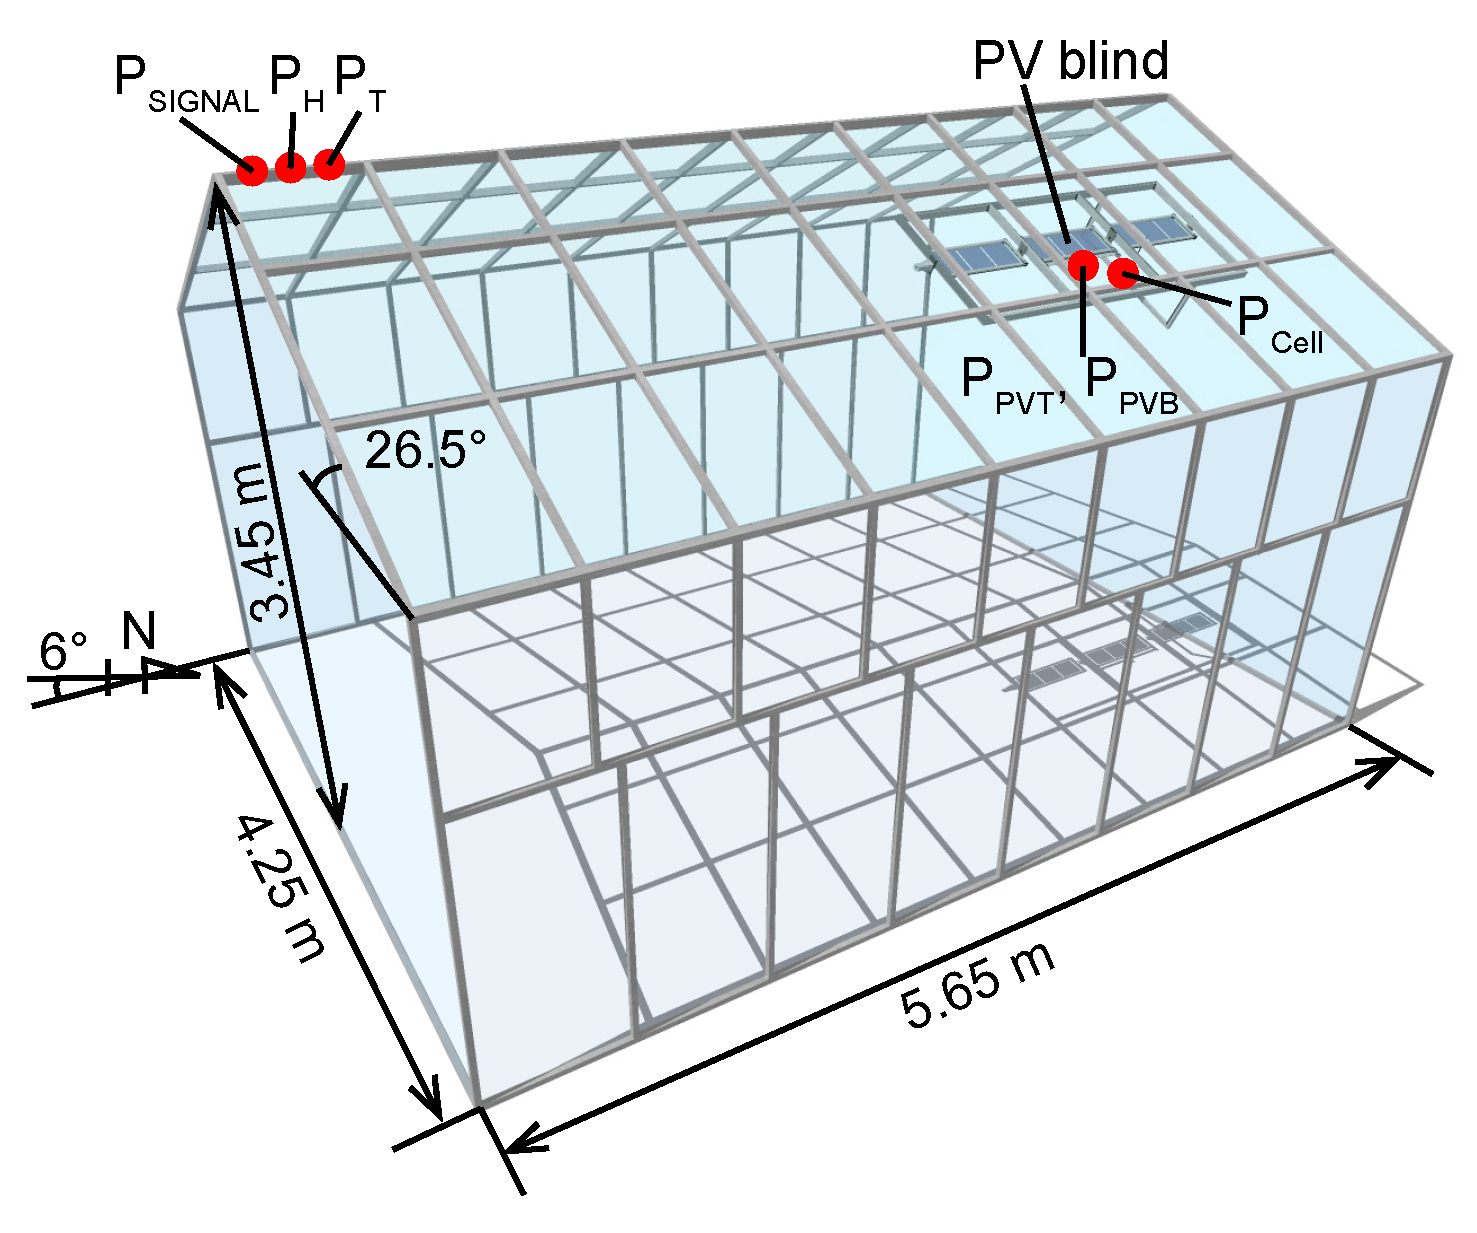
2.4. Verification of the PV Blind Characteristics at the Test Greenhouse
2.5. Energy Balance of PV Blind System Operations
3. Results
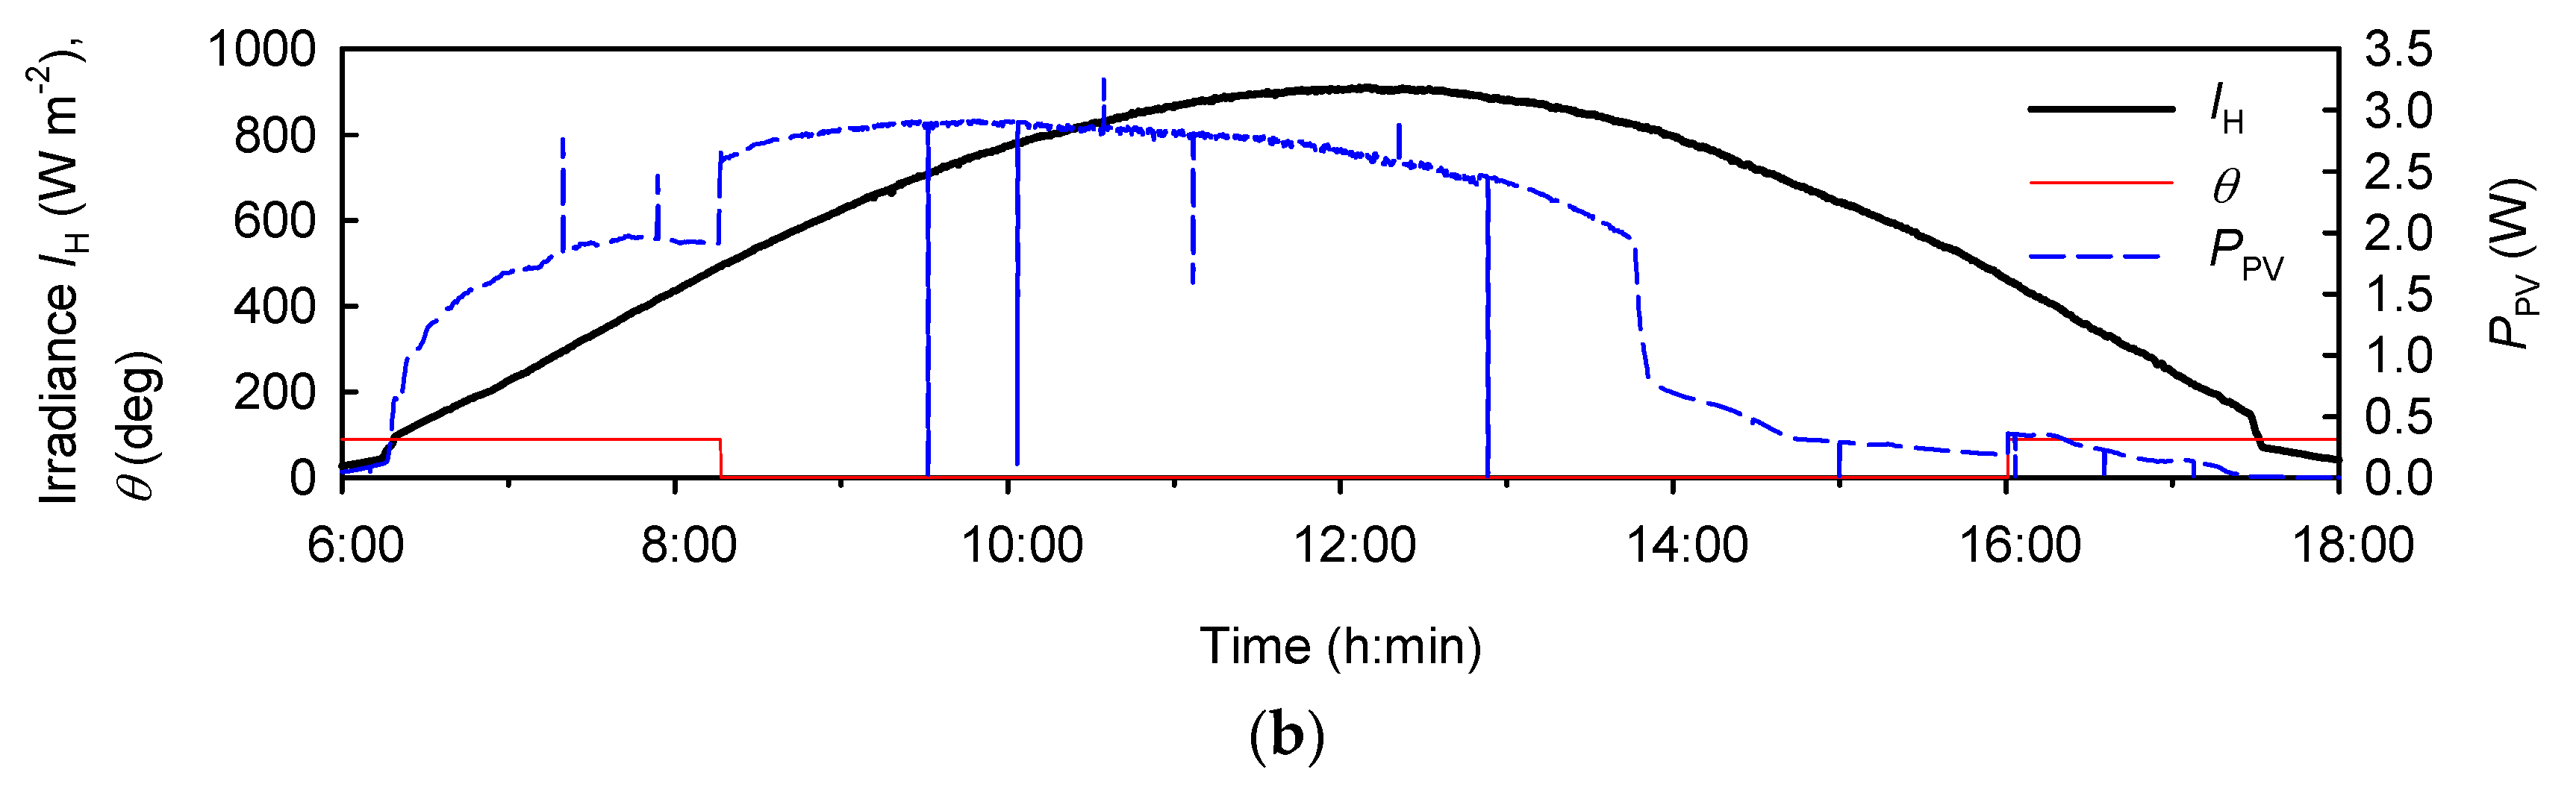
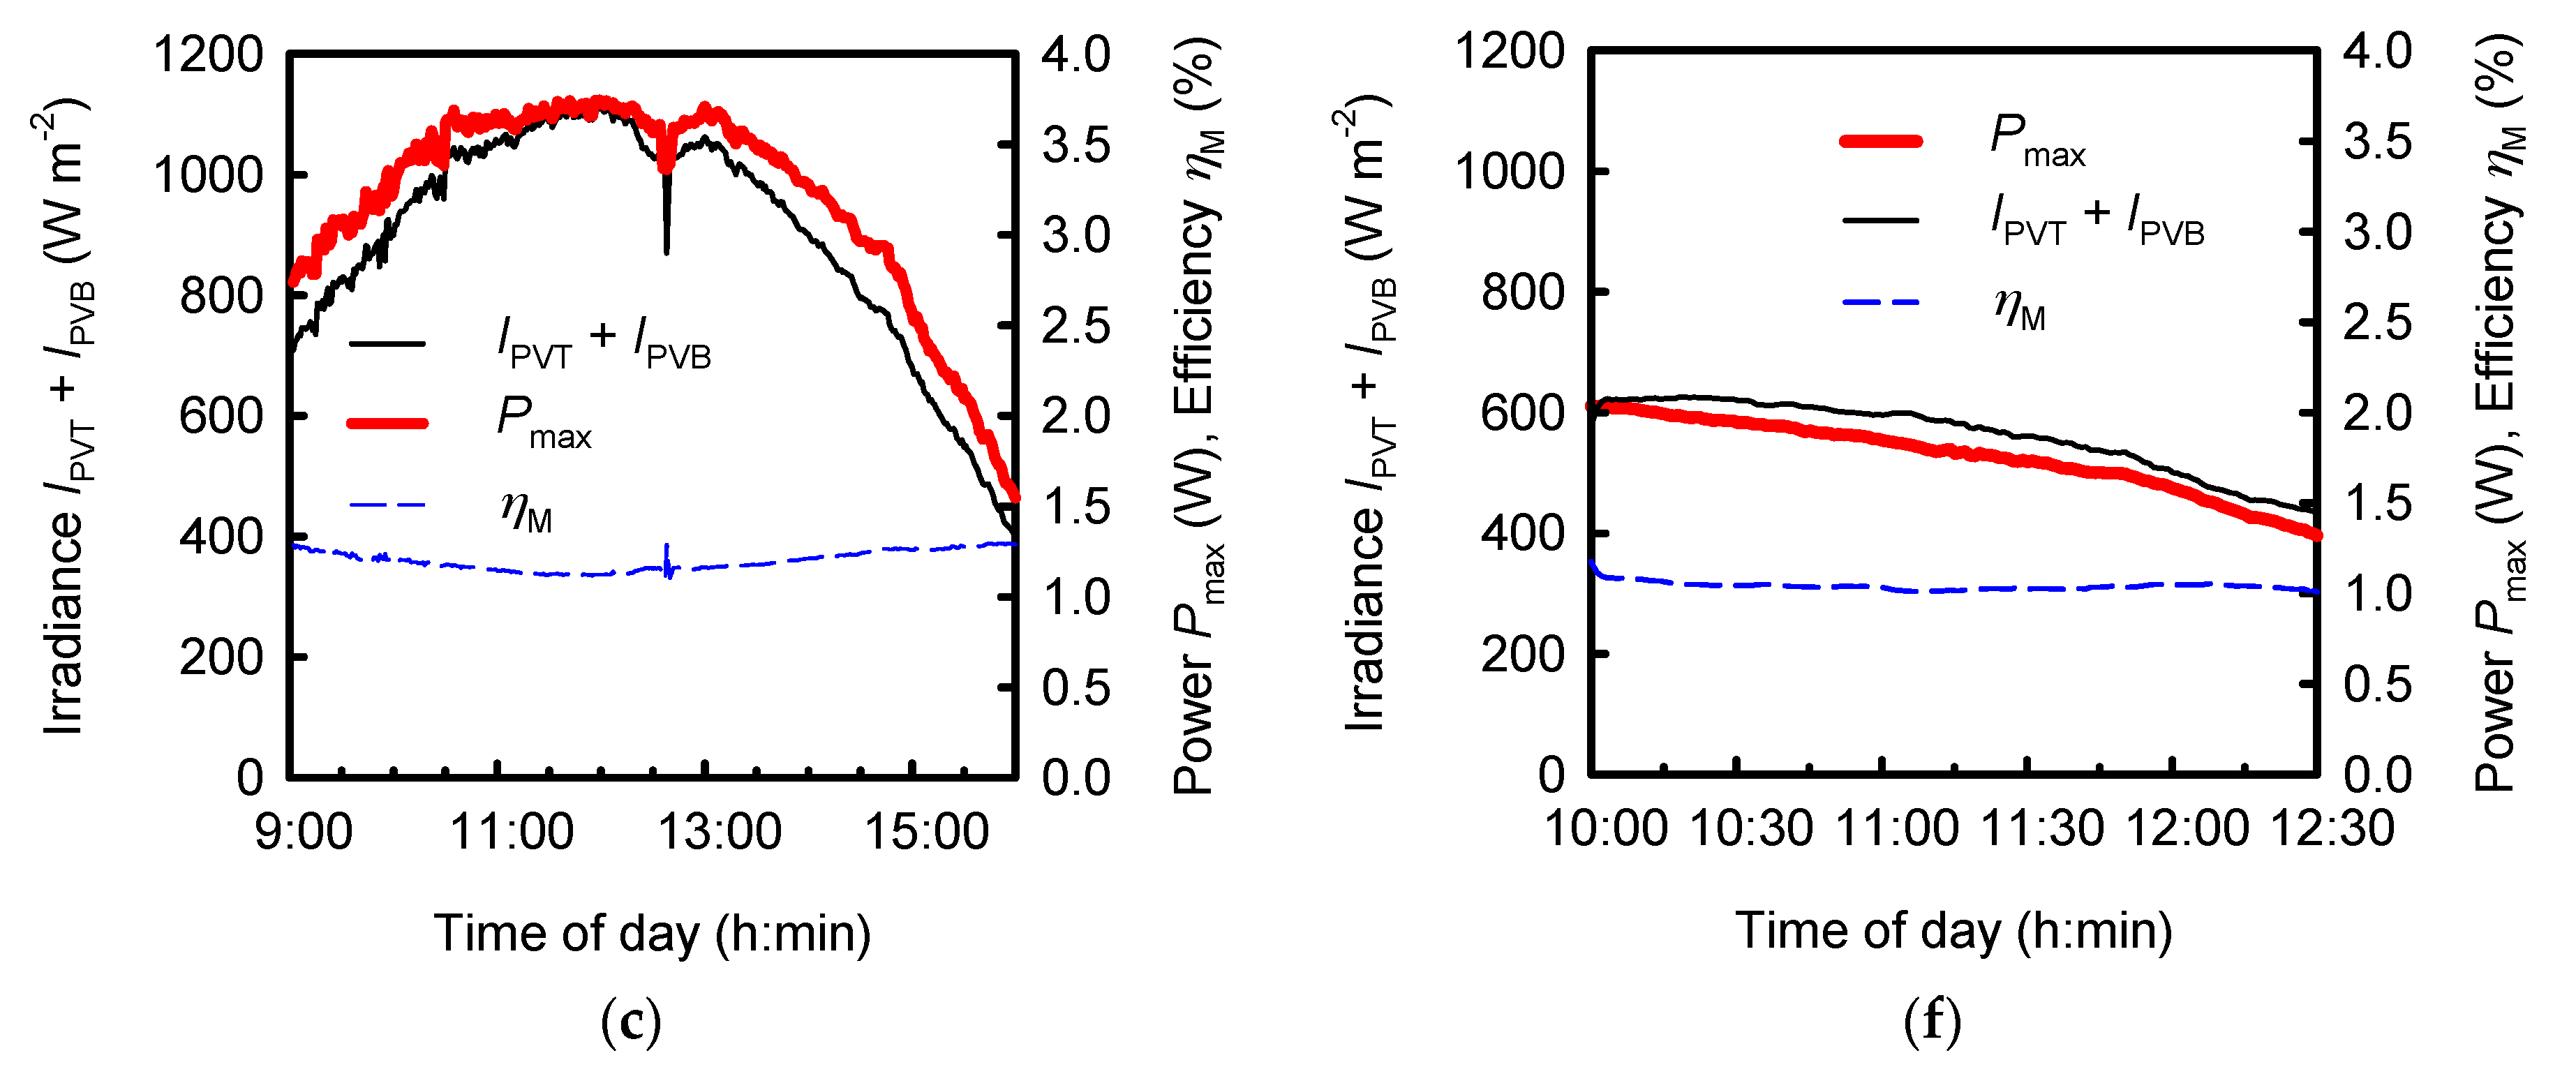
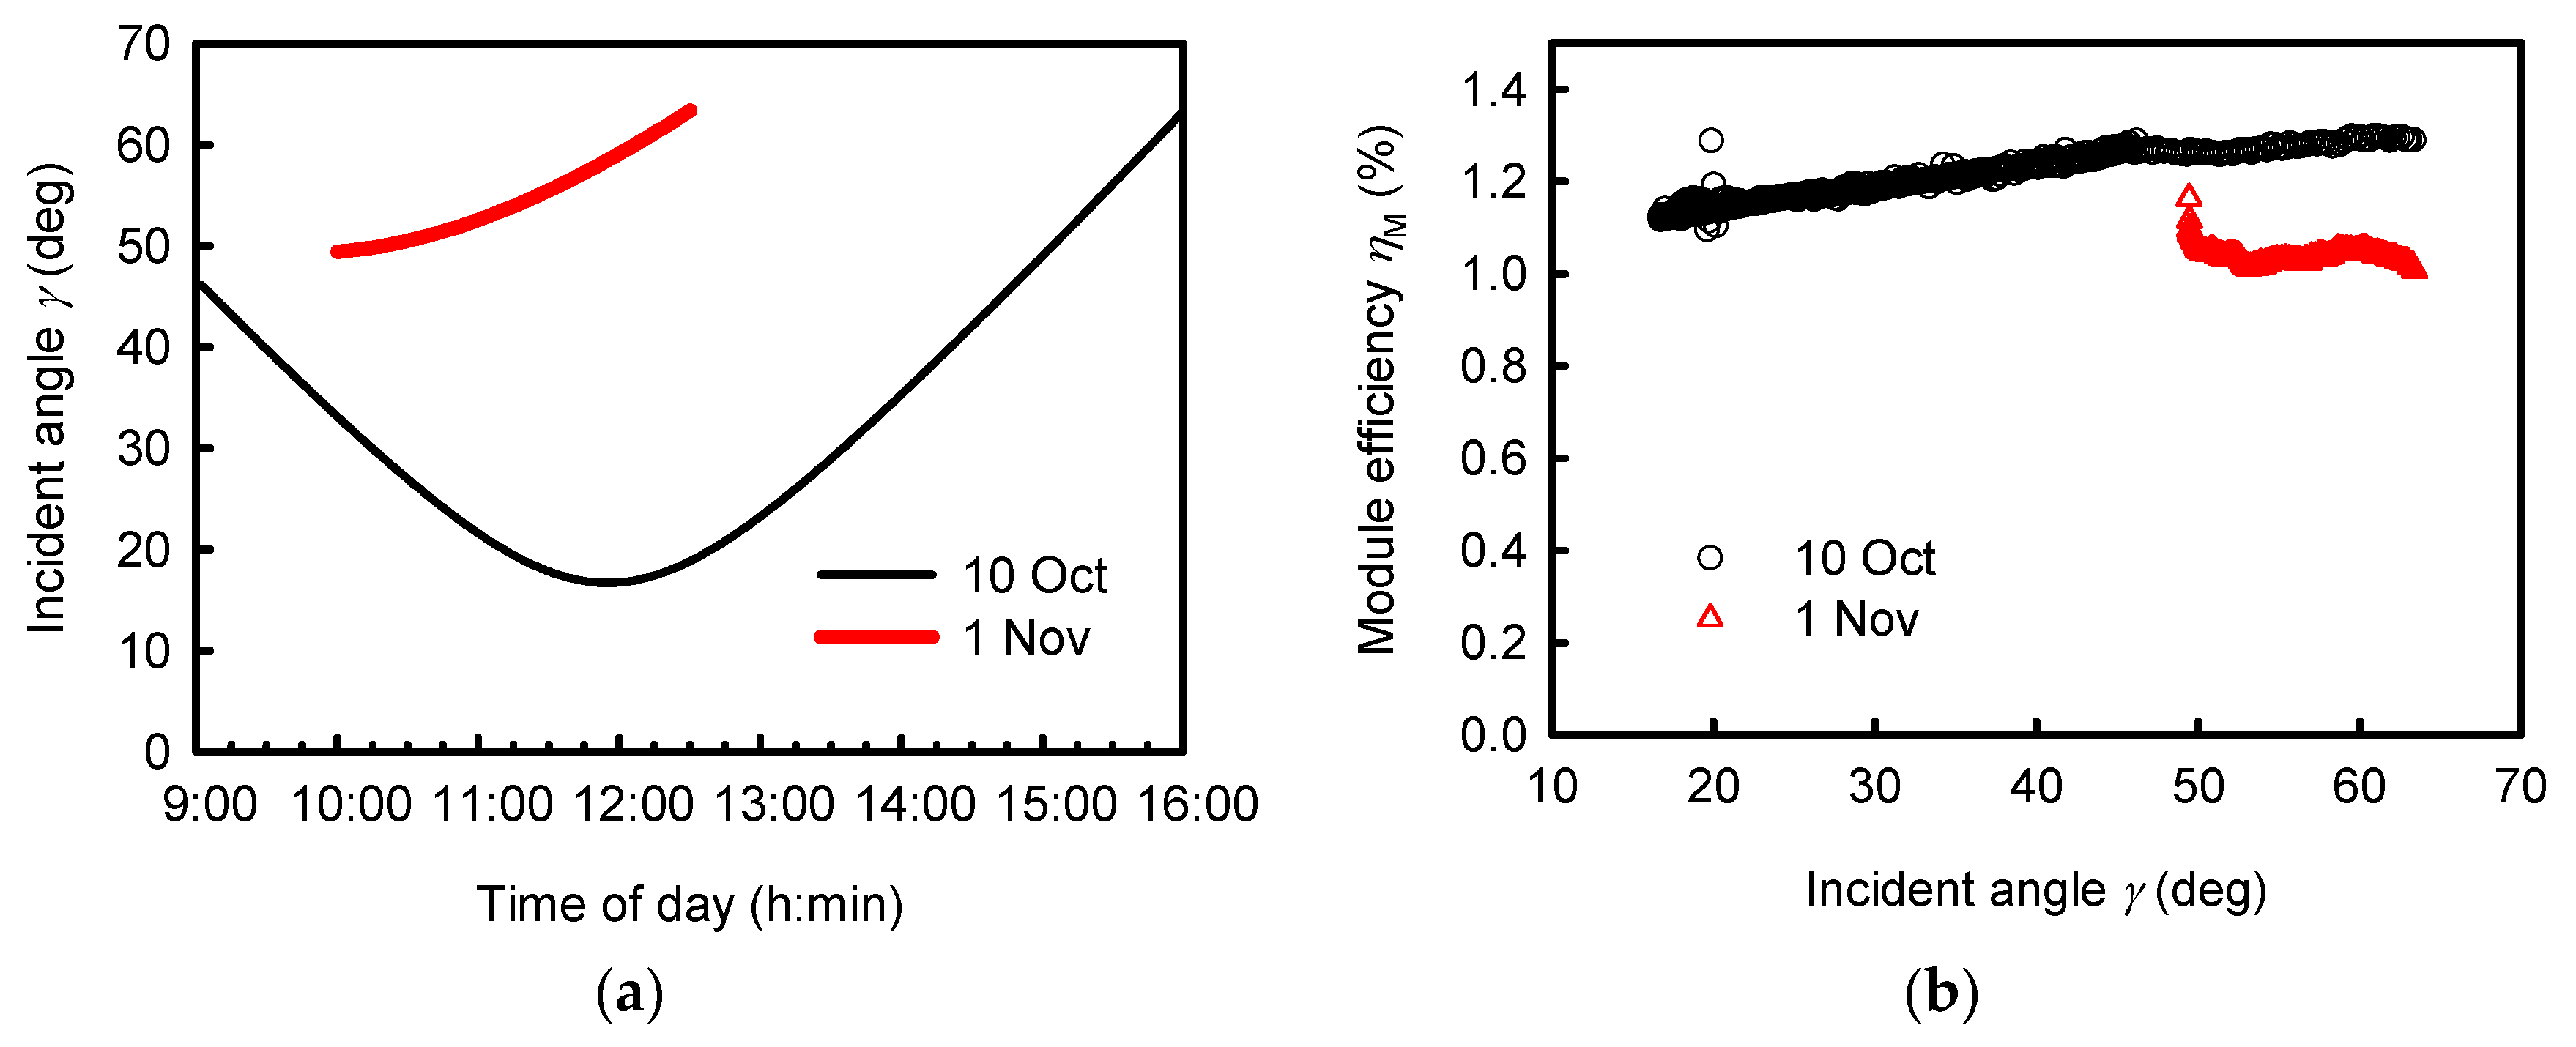
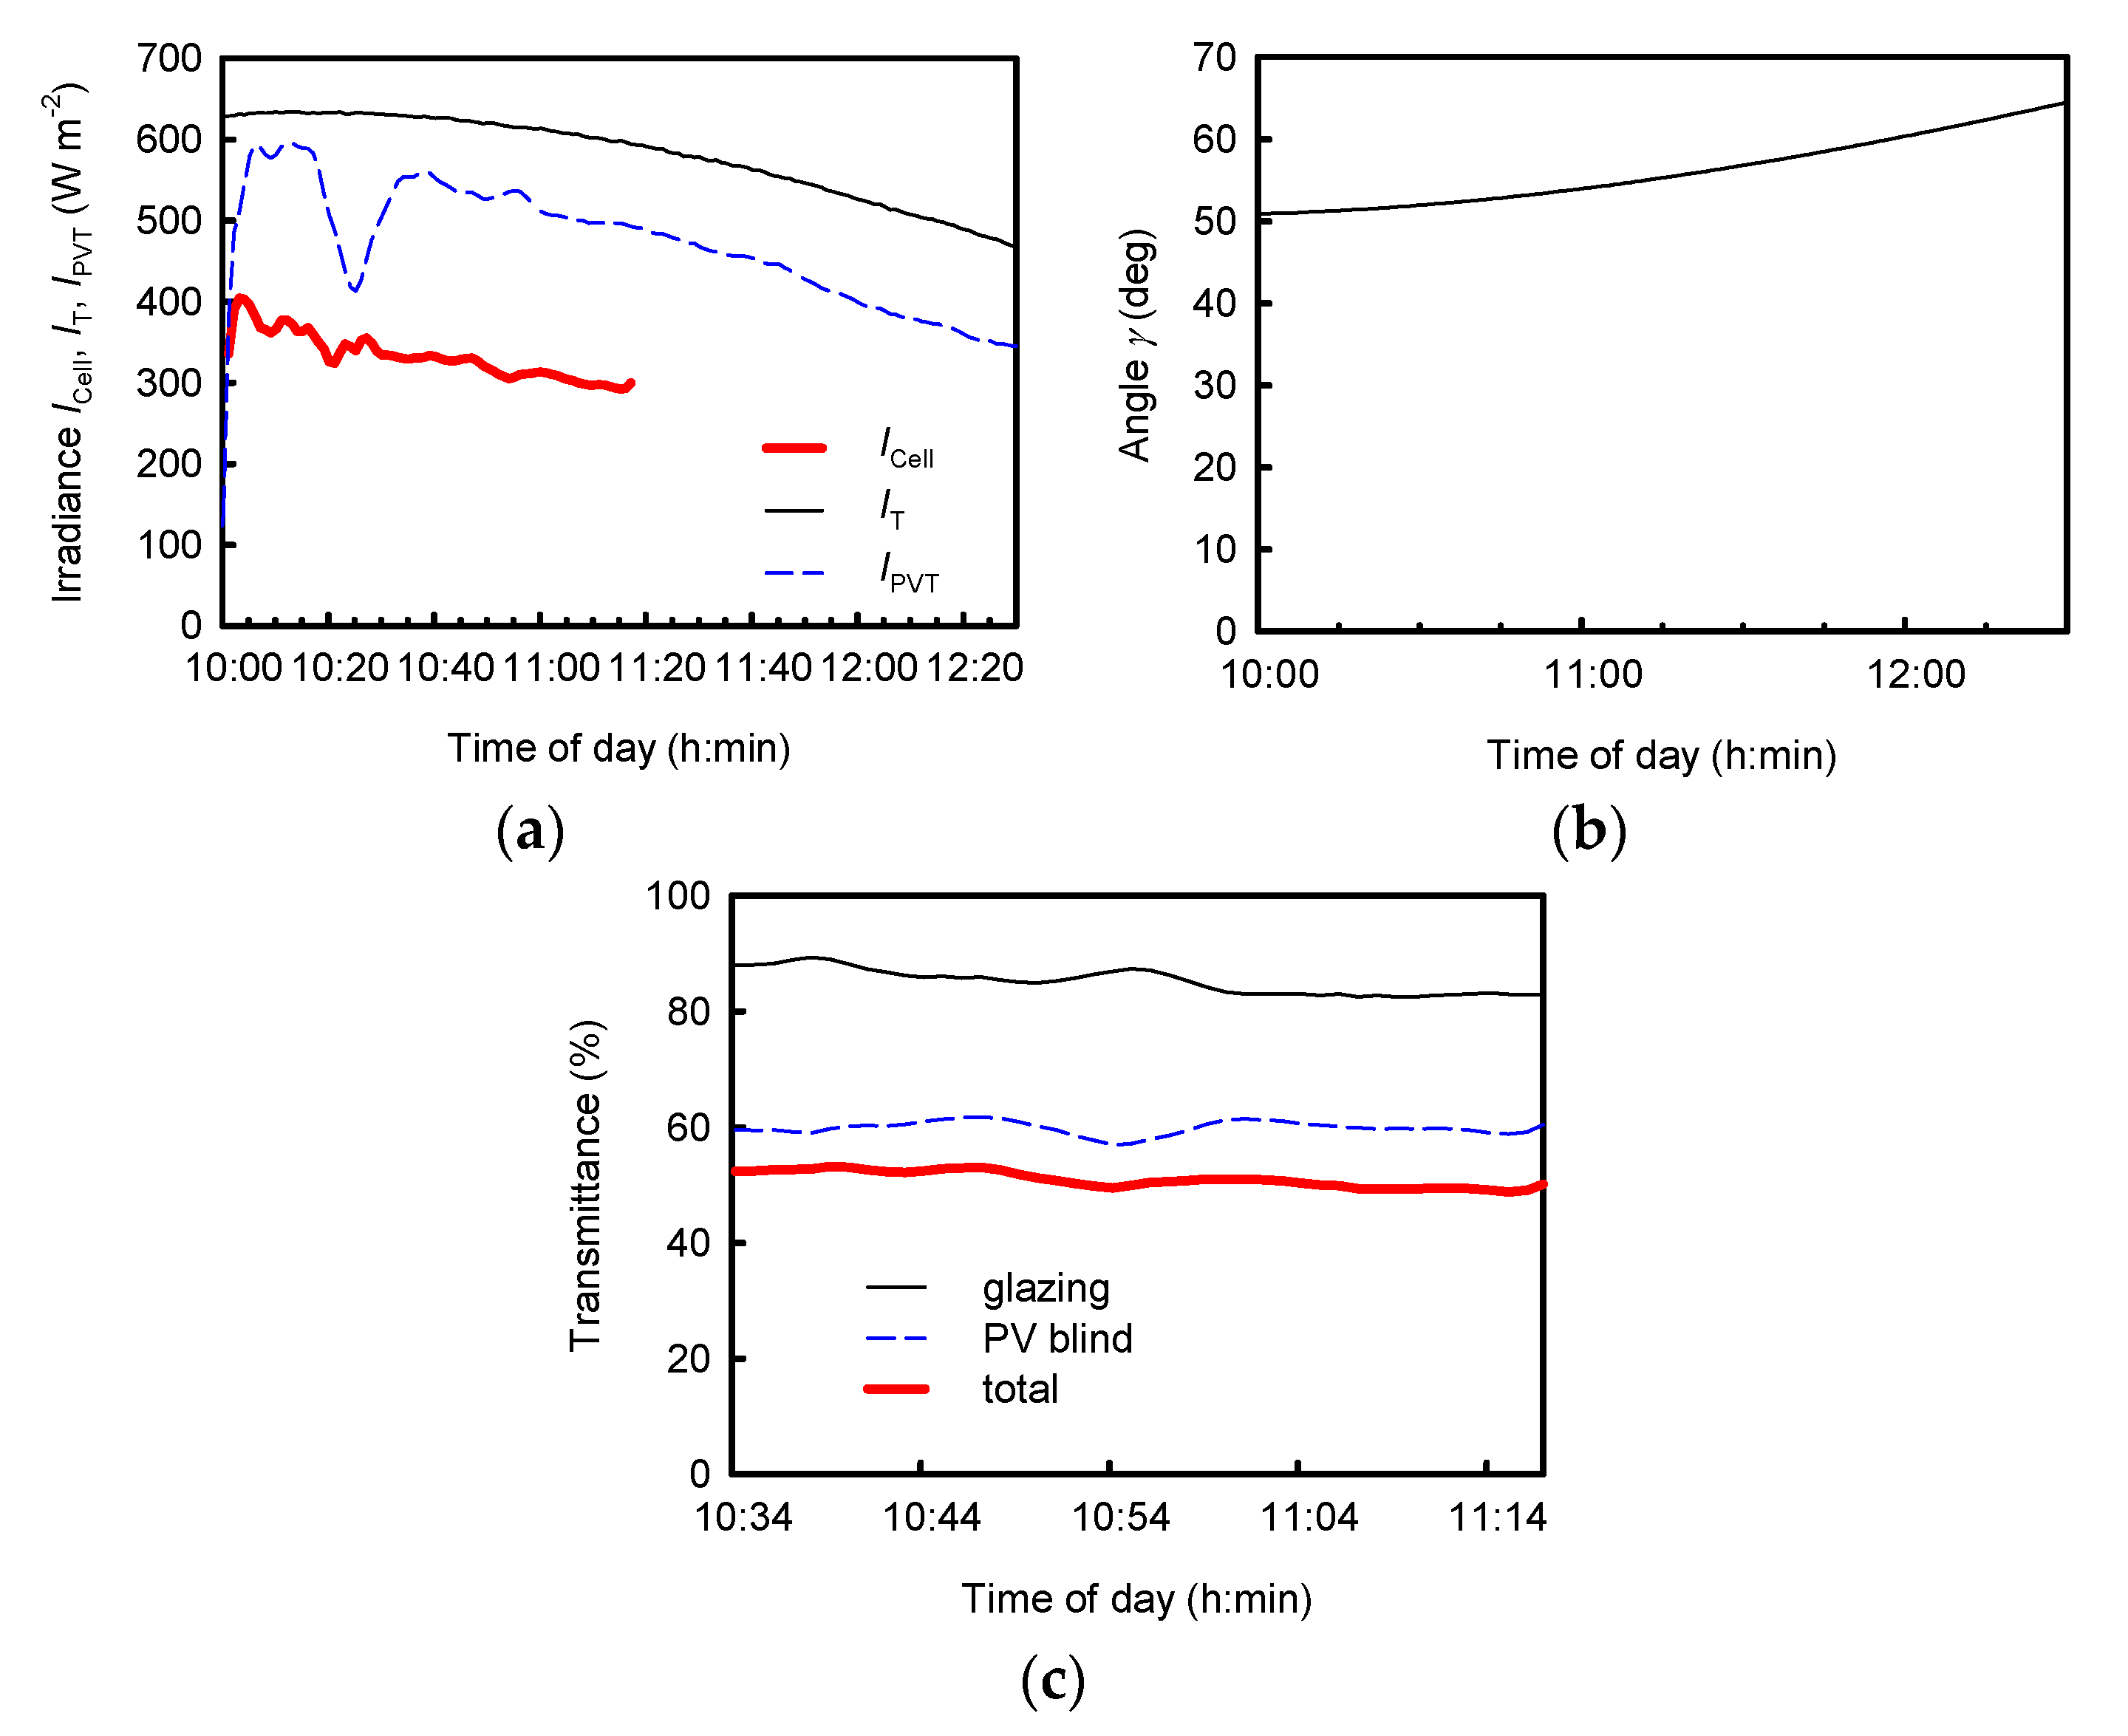
3.1. Sunlight to Electricity Conversion Characteristics of the PV Blind
3.2. Sunlight Transmittance of the PV Blind
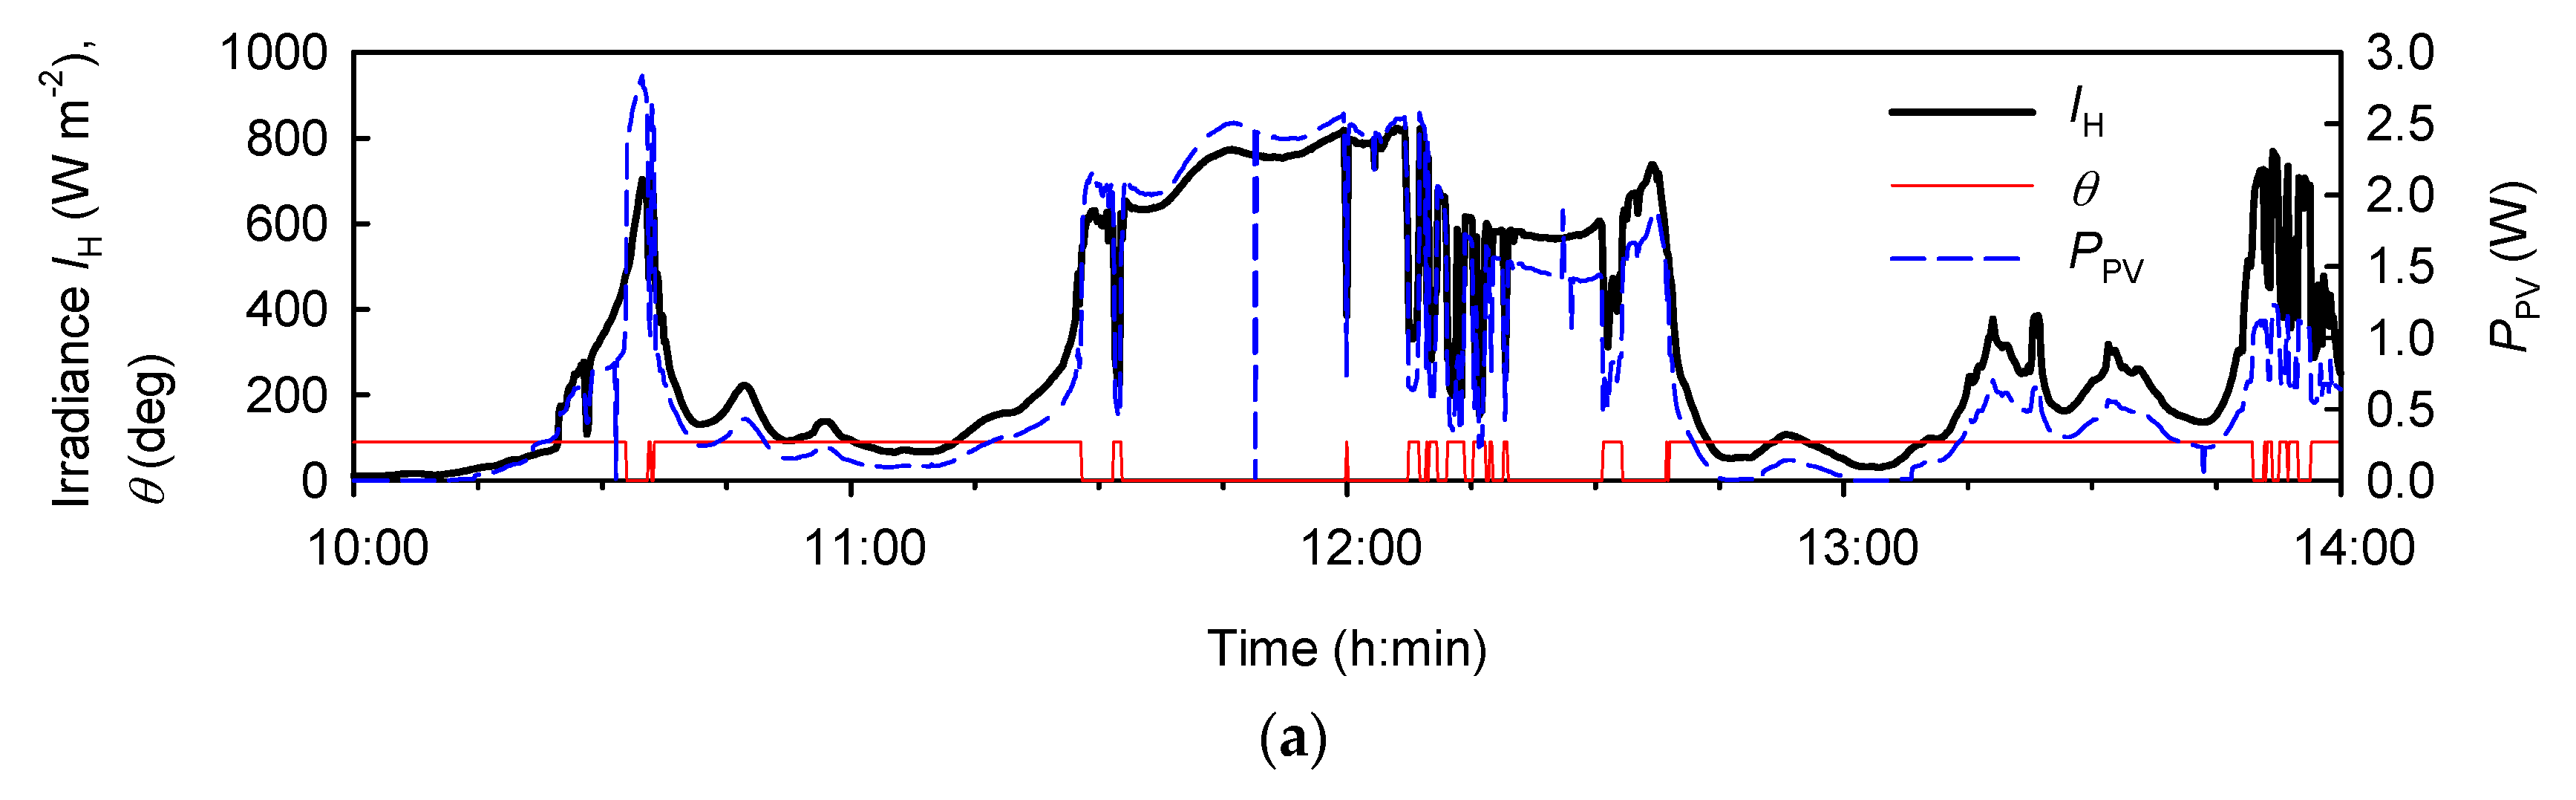
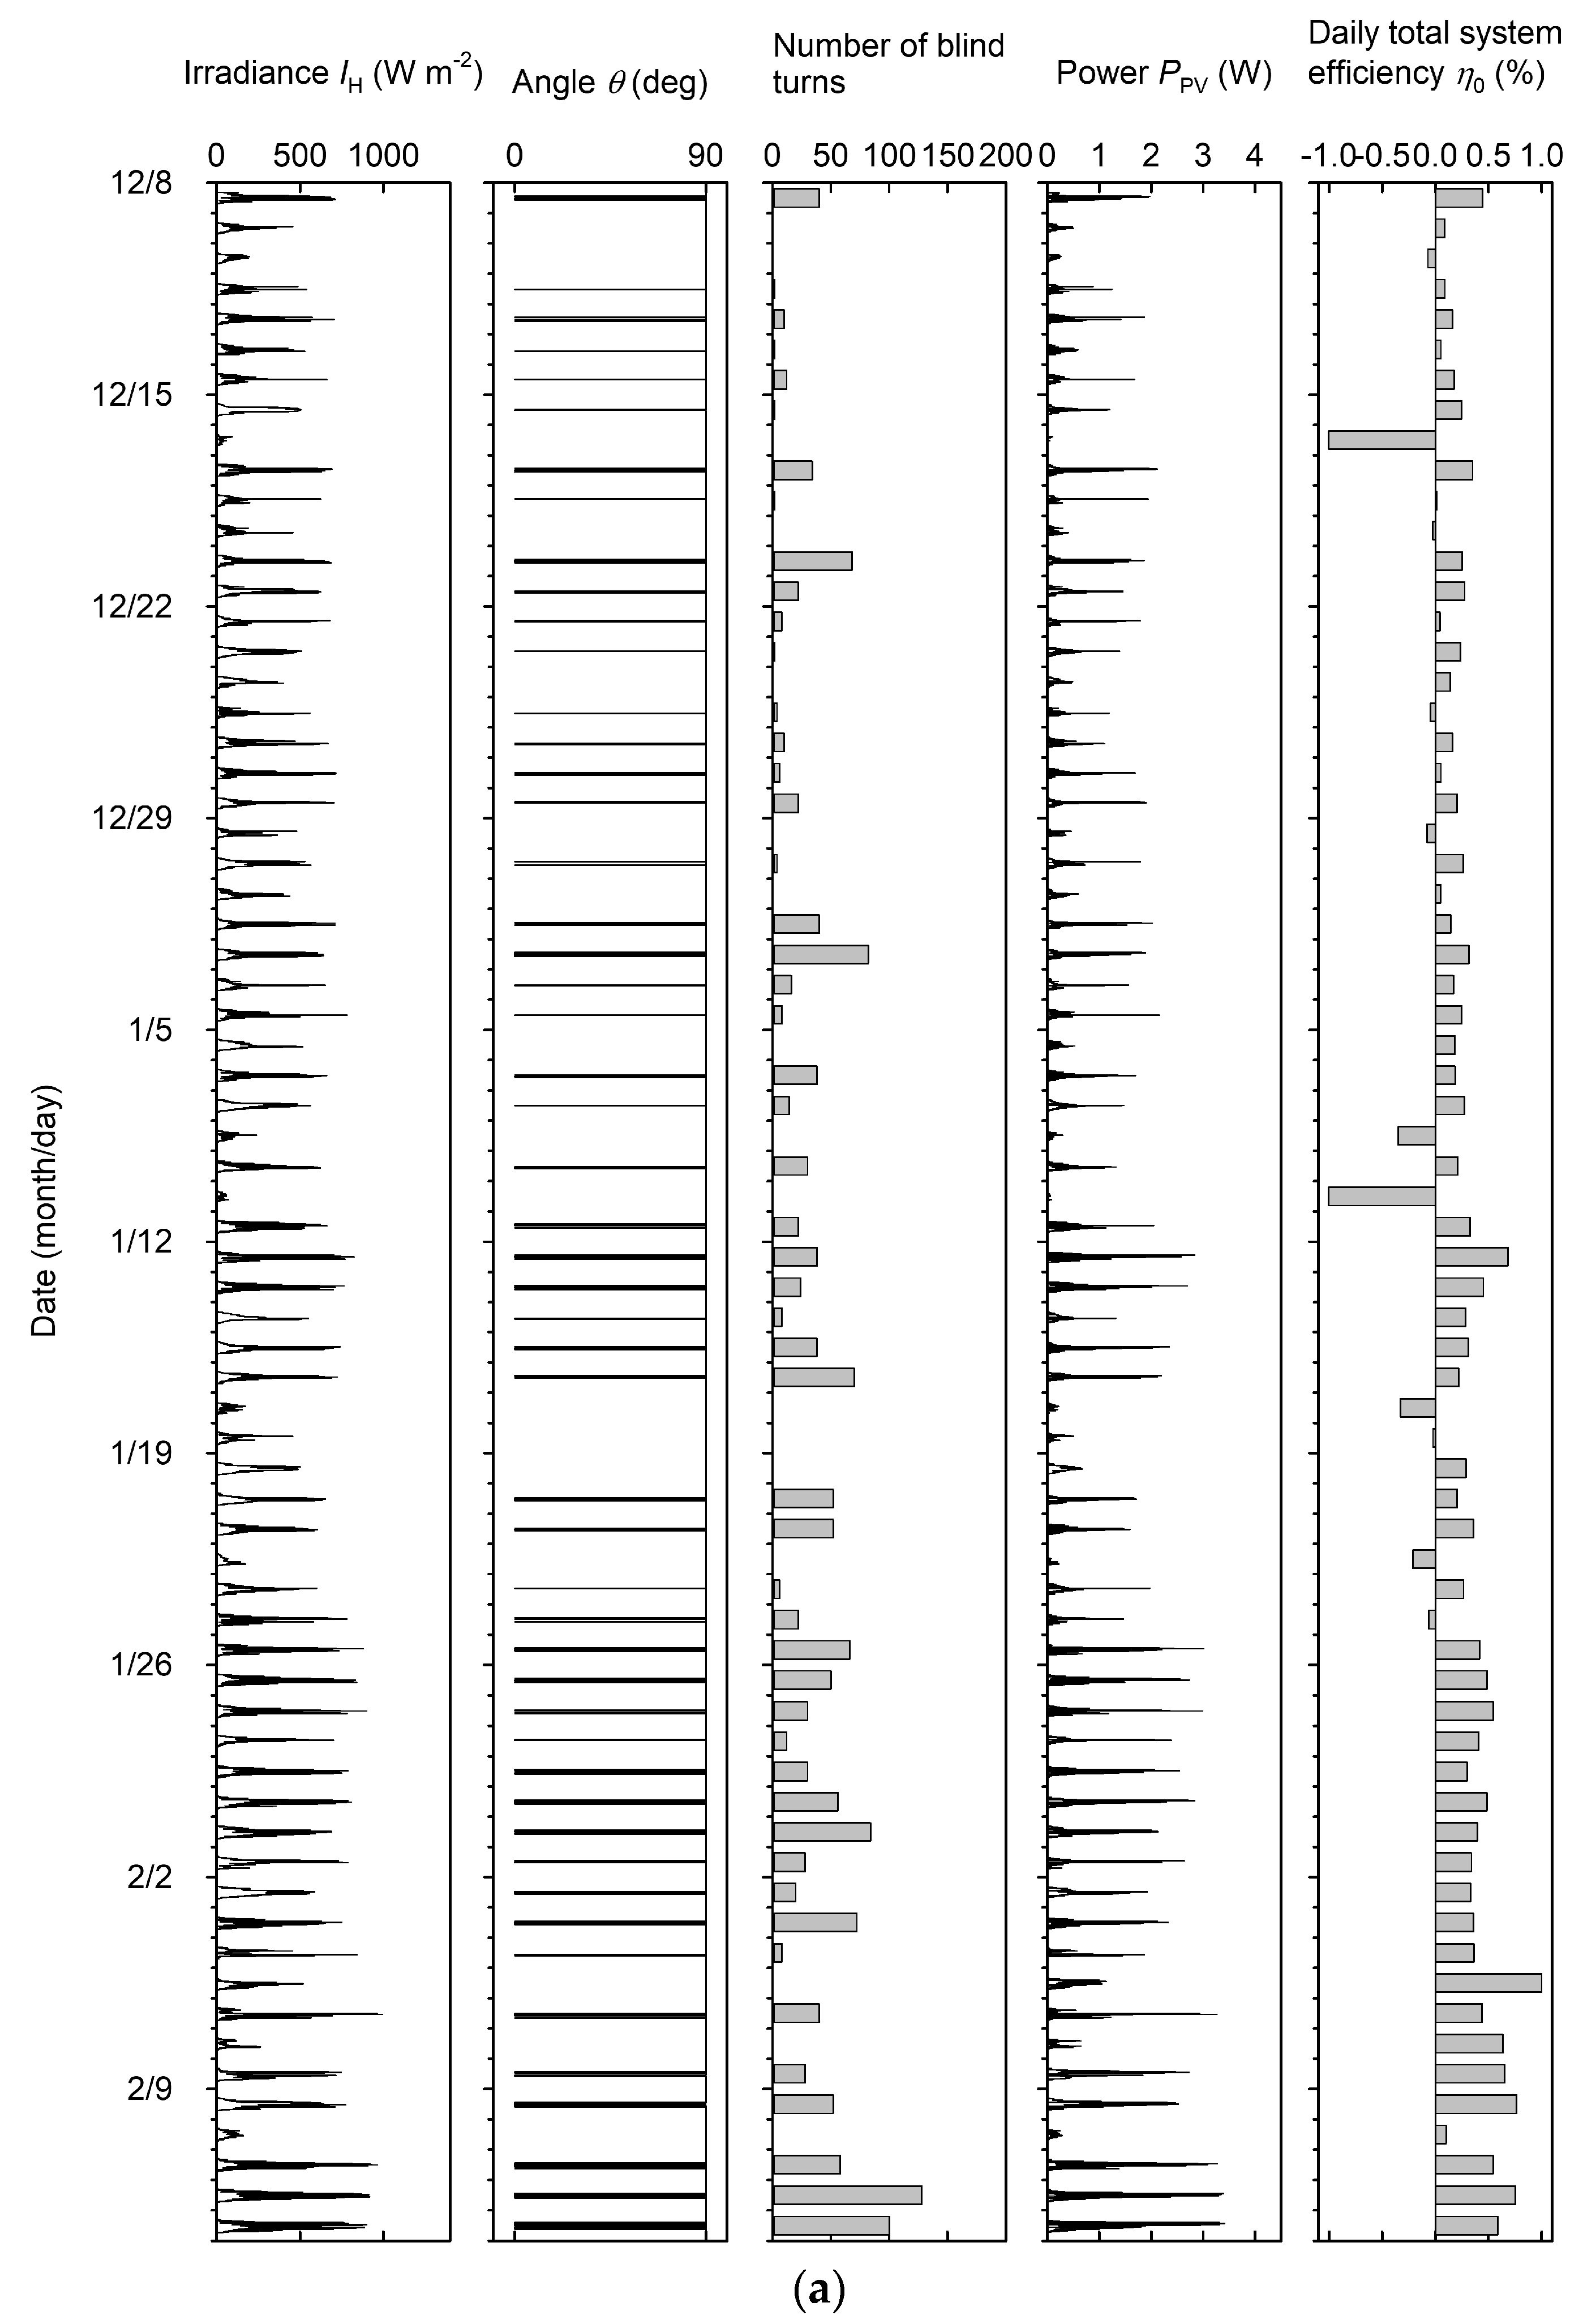
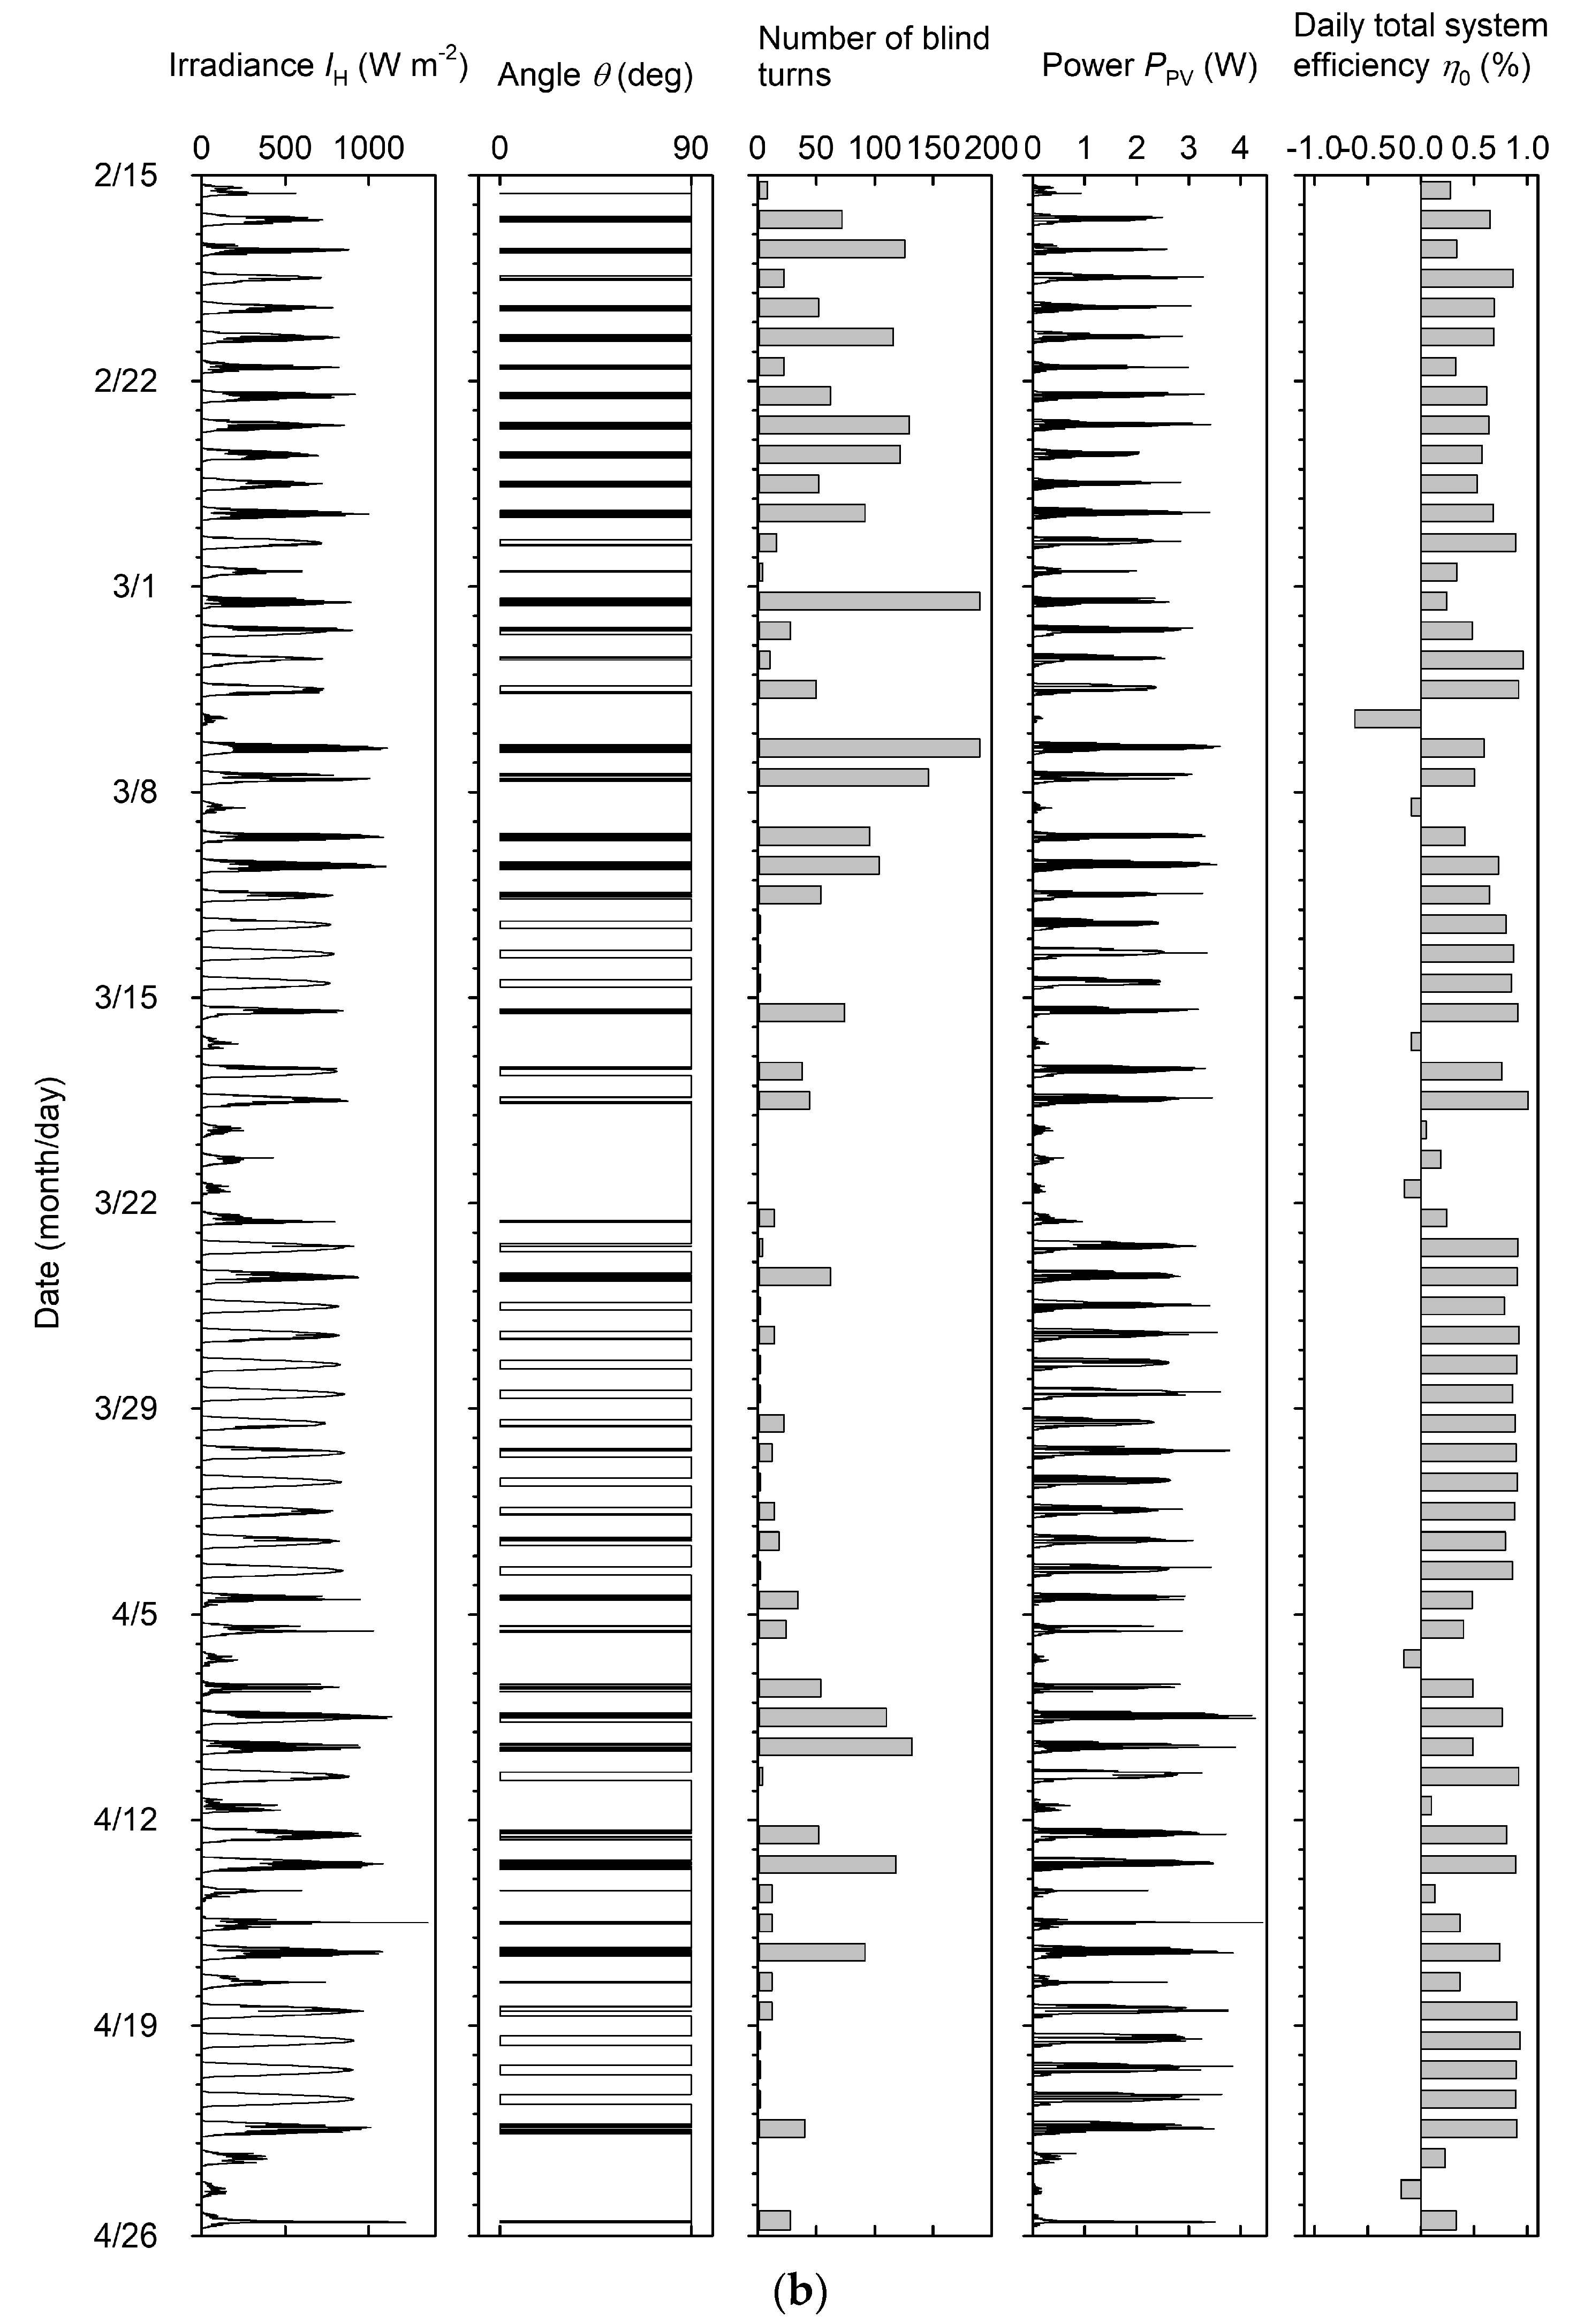
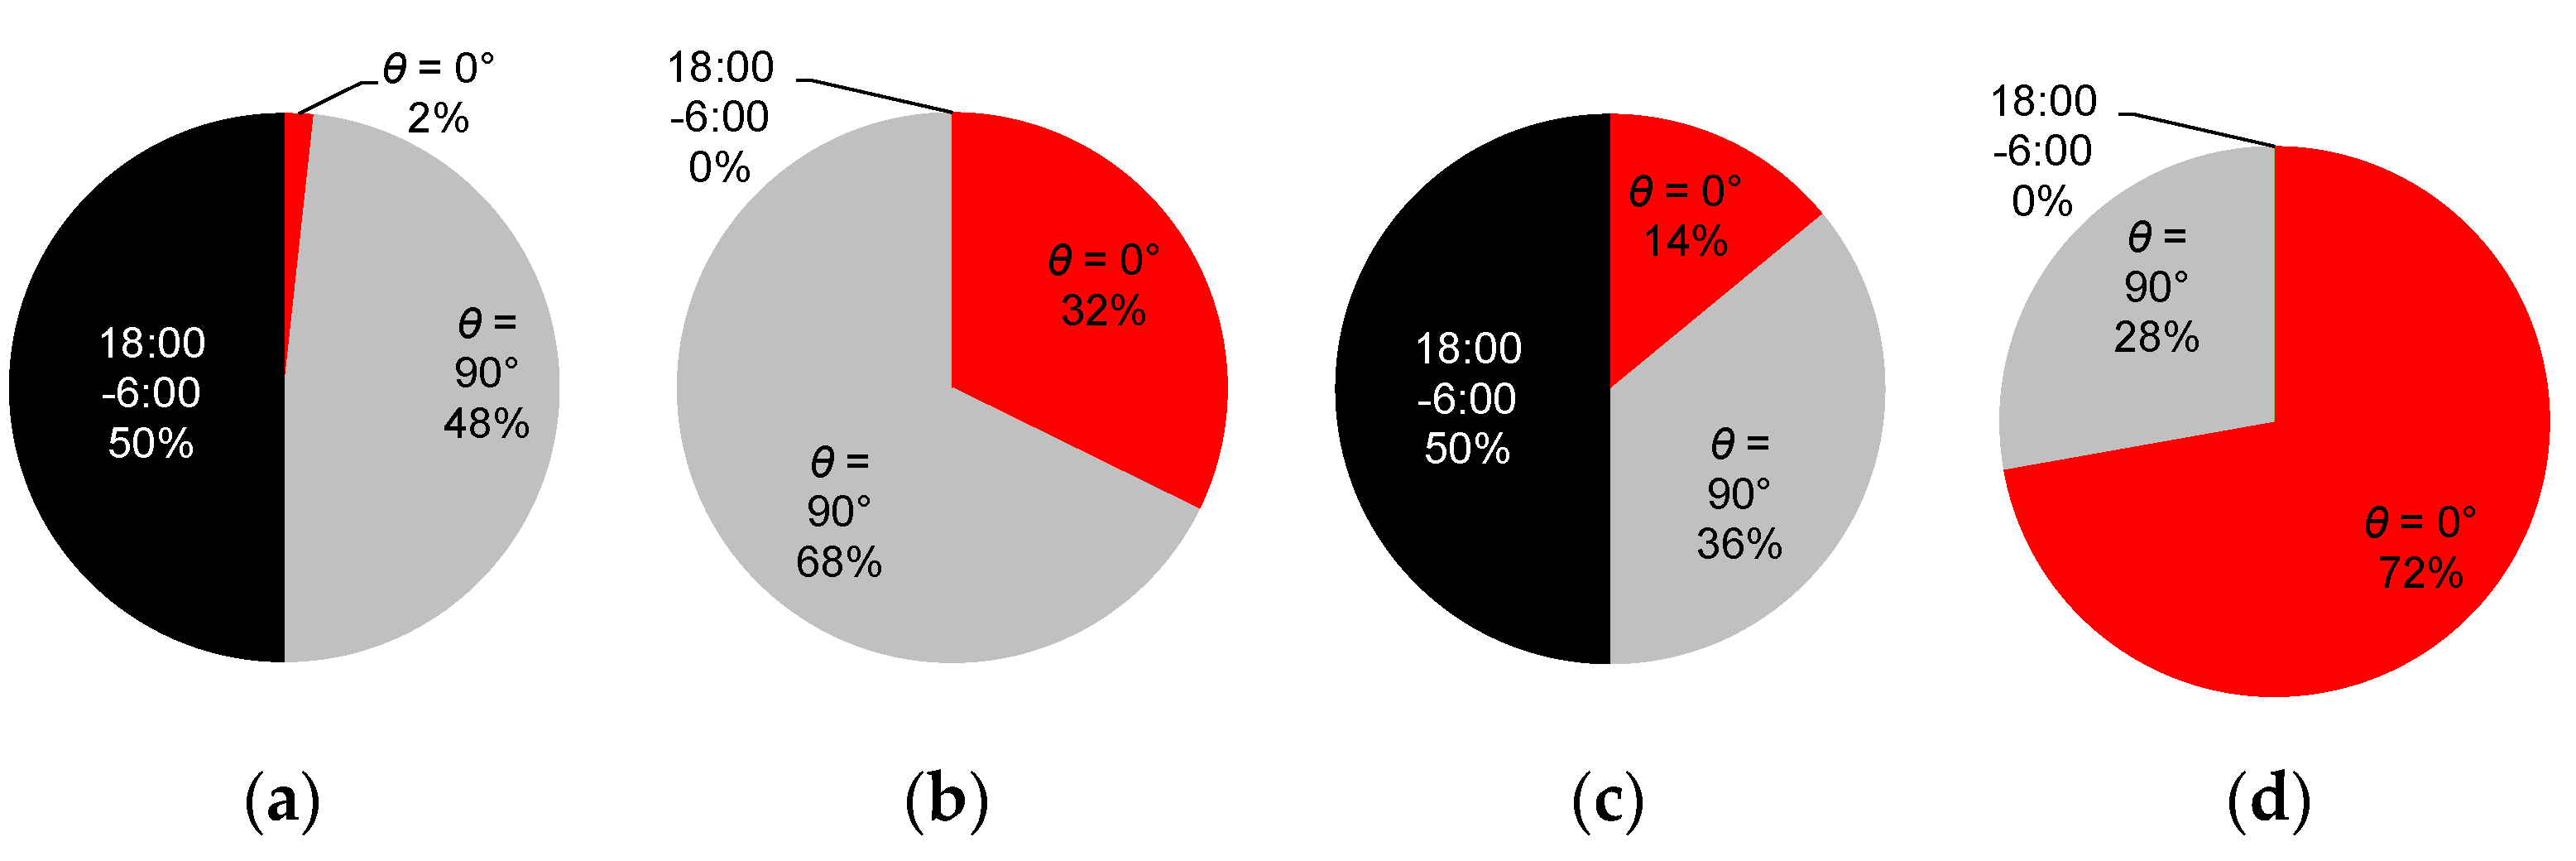
3.3. Observations of the PV Blind Rotations in Response to Irradiance
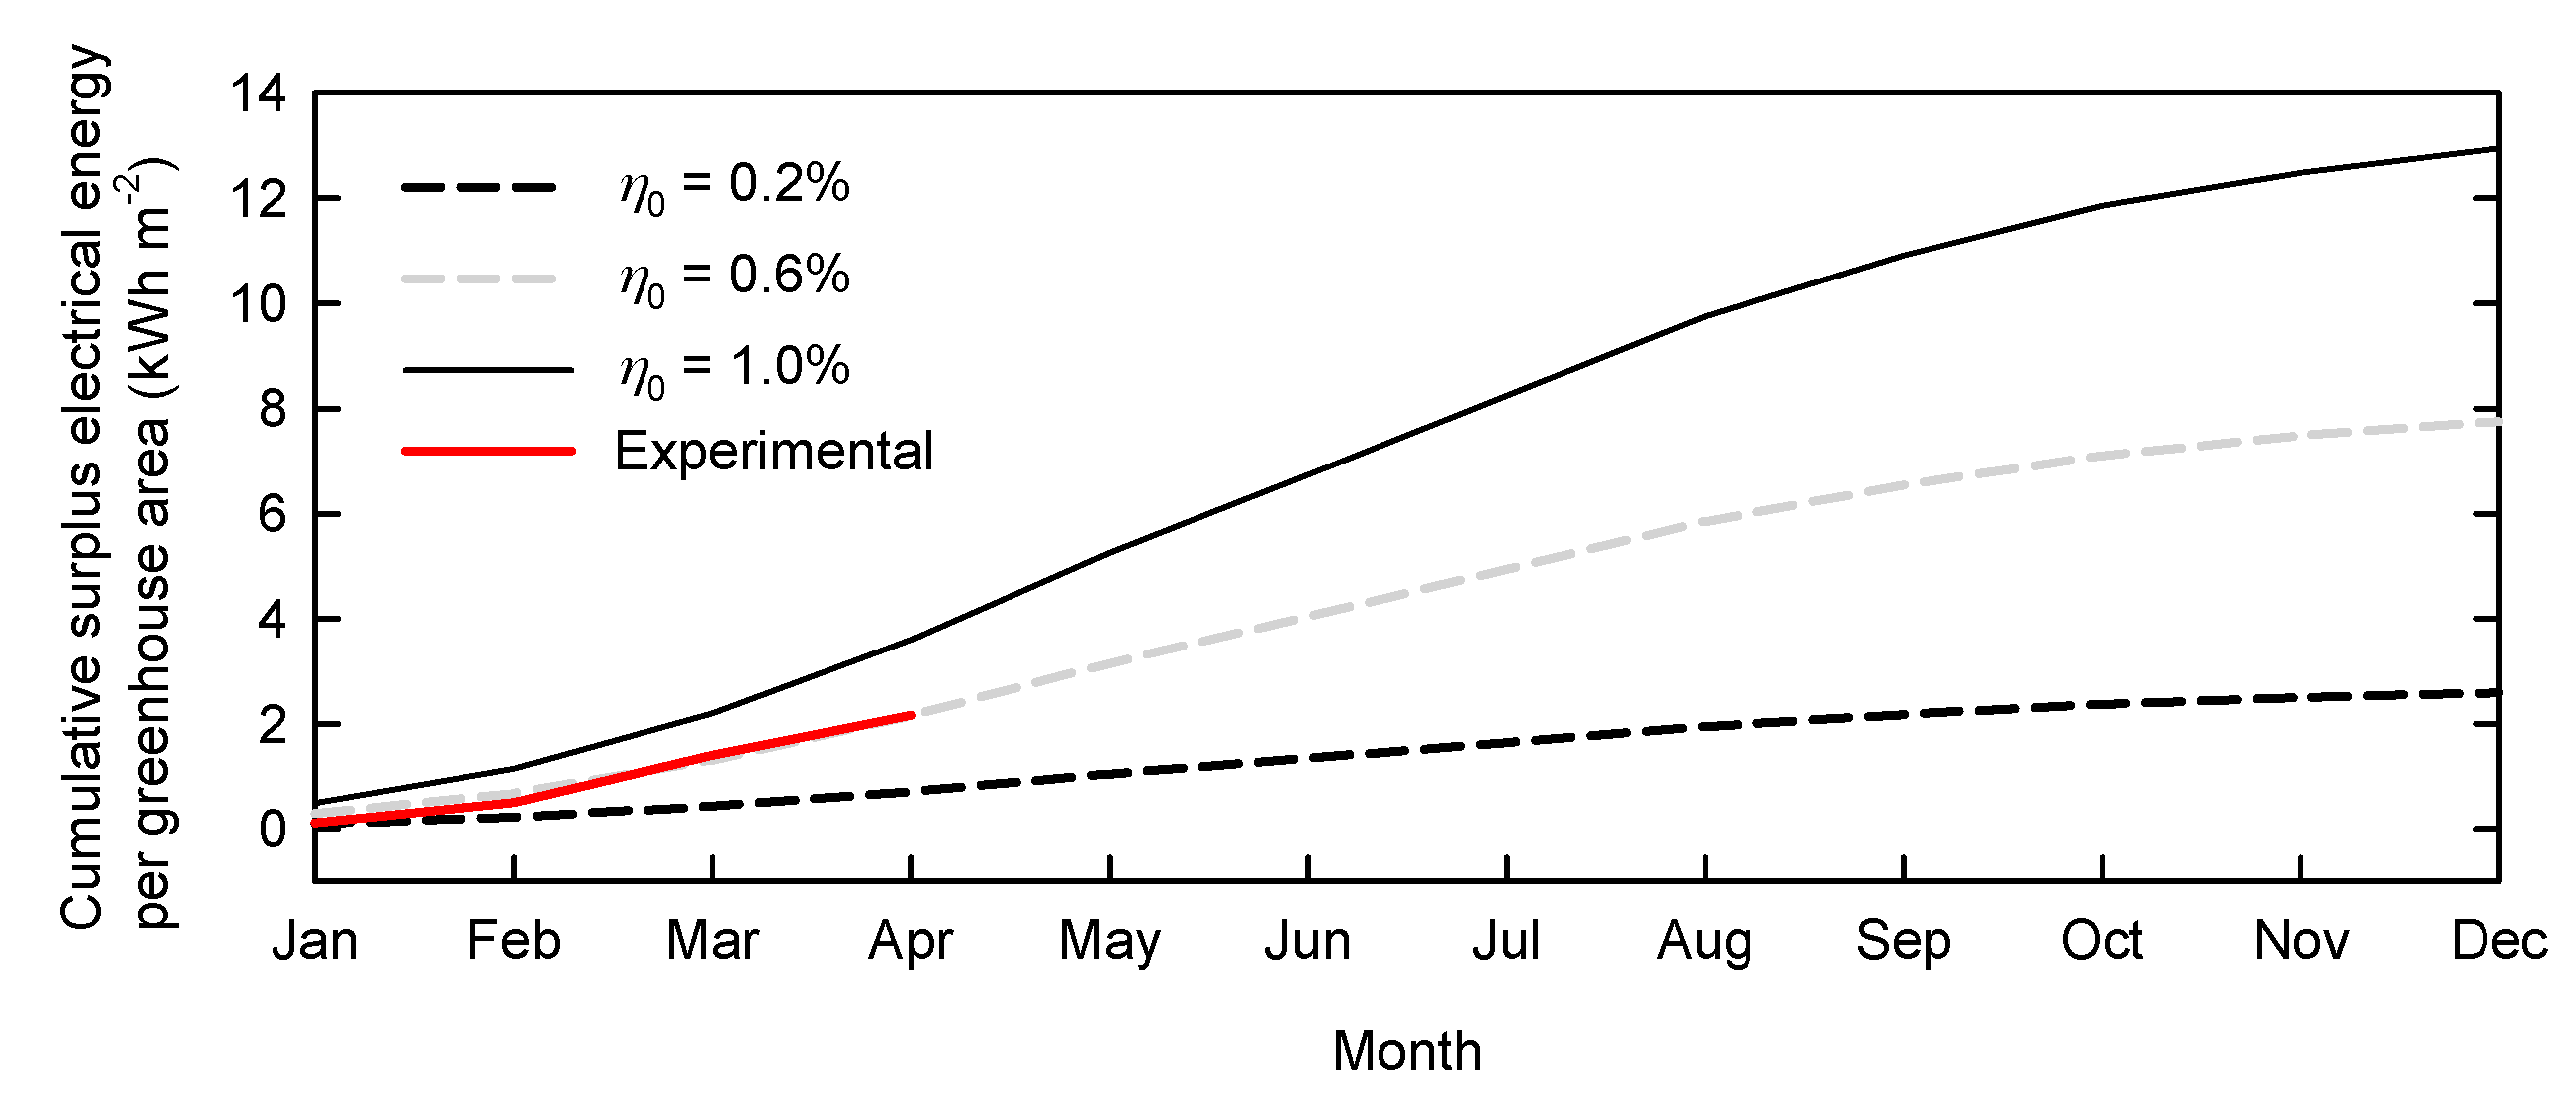
3.4. Energy Balance of the PV Blind System
4. Discussion
5. Conclusions
Supplementary Materials
Author Contributions
Funding
Acknowledgments
Conflicts of Interest
References
- Dias, G.M.; Ayer, N.W.; Khosla, S.; Acker, R.V.; Young, S.B.; Whitney, S.; Hendricks, P. Life cycle perspectives on the sustainability of Ontario greenhouse tomato production: Benchmarking and improvement opportunities. J. Clean Prod. 2017, 140, 831–839. [Google Scholar] [CrossRef]
- Ntinas, G.K.; Neumair, M.; Tsadilas, C.D.; Meyer, J. Carbon footprint and cumulative energy demand of greenhouse and open-field tomato cultivation systems under Southern and Central European climatic conditions. J. Clean Prod. 2017, 142, 3617–3626. [Google Scholar] [CrossRef]
- Cuce, E.; Harjunowibowo, D.; Cuce, P.M. Renewable and sustainable energy saving strategies for greenhouse systems: A comprehensive review. Renew. Sustain. Energy Rev. 2016, 64, 34–59. [Google Scholar] [CrossRef]
- Hassanien, R.H.E.; Li, M.; Lin, W.D. Advanced applications of solar energy in agricultural greenhouses. Renew. Sustain. Energy Rev. 2016, 54, 989–1001. [Google Scholar] [CrossRef]
- Squatrito, R.; Sgroi, F.; Tudisca, S.; Trapani, A.M.D.; Testa, R. Post Feed-in scheme photovoltaic system feasibility evaluation in Italy: Sicilian case studies. Energies 2014, 7, 7147–7165. [Google Scholar] [CrossRef]
- Al-Ibrahim, A.; Al-Abbadi, N.; Al-Helal, I. PV greenhouse system—System description, performance and lesson learned. Acta Hortic. 2006, 710, 251–264. [Google Scholar] [CrossRef]
- Juang, P.; Kacira, M. System dynamics of a photovoltaic integrated greenhouse. Acta Hortic. 2014, 1037, 107–112. [Google Scholar] [CrossRef]
- Al-Shamiry, F.M.S.; Ahmad, D.; Sharif, A.R.M.; Aris, I.; Janius, R.; Kamaruddin, R. Design and development of a photovoltaic power system for tropical greenhouse cooling. Am. J. Appl. Sci. 2007, 4, 386–389. [Google Scholar] [CrossRef]
- Blanco, I.; Anifantis, A.S.; Pascuzzi, S.; Mugnozza, G.S. Hydrogen and renewable energy sources integrated system for greenhouse heating. J. Agric. Eng. Res. 2013, 44. [Google Scholar] [CrossRef]
- Russo, G.; Anifantis, A.S.; Verdiani, G.; Mugnozza, G.S. Environmental analysis of geothermal heat pump and LPG greenhouse heating systems. Biosyst. Eng. 2014, 127, 11–23. [Google Scholar] [CrossRef]
- Martínez, D.L.V.; Ureña, L.J.B.; Aiz, F.D.M.; Martínez, A.L. Greenhouse Agriculture in Almería. A Comprehensive Techno-Economic Analysis; Cajamar Caja Rural: Andalusia, Spain, 2016; ISBN 9788495531759. [Google Scholar]
- Abdel-Ghany, A.M.; Picuno, P.; Al-Helal, I.; Alsadon, A.; Ibrahim, A.; Shady, M. Radiometric characterization, solar and thermal radiation in a greenhouse as affected by shading configuration in an arid climate. Energies 2015, 8, 13928–13937. [Google Scholar] [CrossRef]
- Yano, A.; Furue, A.; Moriyama, T.; Ide, O.; Tsuchiya, K. Development of a greenhouse shading screen controller driven by photovoltaic energy. J. Jpn. Soc. Agric. Mach. 2007, 69, 57–64. [Google Scholar]
- García, M.L.; Medrano, E.; Sánchez-Guerrero, M.C.; Lorenzo, P. Climatic effects of two cooling systems in greenhouses in the Mediterranean area: External mobile shading and fog system. Biosyst. Eng. 2011, 108, 133–143. [Google Scholar] [CrossRef]
- López-Marín, J.; Gálvez, A.; González, A.; Egea-Gilabert, C.; Fernández, J.A. Effect of shade on yield, quality and photosynthesis-related parameters of sweet pepper plants. Acta Hortic. 2012, 956, 545–552. [Google Scholar] [CrossRef]
- Lorenzo, P.; Sánchez-Guerrero, M.C.; Medrano, E.; García, M.L.; Caparrós, I.; Giménez, M. External greenhouse mobile shading: Effect on microclimate, water use efficiency and yield of a tomato crop grown under different salinity levels of the nutrient solution. Acta Hortic. 2003, 609, 181–186. [Google Scholar] [CrossRef]
- Ahemd, H.A.; Al-Faraj, A.A.; Abdel-Ghany, A.M. Shading greenhouses to improve the microclimate, energy and water saving in hot regions: A review. Sci. Hortic. 2016, 201, 36–45. [Google Scholar] [CrossRef]
- Aroca-Delgado, R.; Pérez-Alonso, J.; Callejón-Ferre, A.J.; Velázquez-Martí, B. Compatibility between crops and solar panels: An overview from shading systems. Sustainability 2018, 10, 743. [Google Scholar] [CrossRef]
- Mashonjowa, E.; Ronsse, F.; Mhizha, T.; Milford, J.R.; Lemeur, R.; Pieters, J.G. The effects of whitening and dust accumulation on the microclimate and canopy behaviour of rose plants (Rosa hybrida) in a greenhouse in Zimbabwe. Sol. Energy 2010, 84, 10–23. [Google Scholar] [CrossRef]
- Yano, A.; Kadowaki, M.; Furue, A.; Tamaki, N.; Tanaka, T.; Hiraki, E.; Kato, Y.; Ishizu, F.; Noda, S. Shading and electrical features of a photovoltaic array mounted inside the roof of an east–west oriented greenhouse. Biosyst. Eng. 2010, 106, 367–377. [Google Scholar] [CrossRef]
- Pérez-Alonso, J.; Pérez-García, M.; Pasamontes-Romera, M.; Callejón-Ferre, A.J. Performance analysis and neural modelling of a greenhouse integrated photovoltaic system. Renew. Sustain. Energy Rev. 2012, 16, 4675–4685. [Google Scholar] [CrossRef]
- Fatnassi, H.; Poncet, C.; Bazzano, M.M.; Brun, R.; Bertin, N. A numerical simulation of the photovoltaic greenhouse microclimate. Sol. Energy 2015, 120, 575–584. [Google Scholar] [CrossRef]
- Marucci, A.; Monarca, D.; Colantoni, A.; Campiglia, E.; Cappuccini, A. Analysis of the internal shading in a photovoltaic greenhouse tunnel. J. Agric. Eng. 2017, 48. [Google Scholar] [CrossRef]
- Marucci, A.; Zambon, I.; Colantoni, A.; Monarca, D. A combination of agricultural and energy purposes: Evaluation of a prototype of photovoltaic greenhouse tunnel. Renew. Sustain. Energy Rev. 2018, 82, 1178–1186. [Google Scholar] [CrossRef]
- Colantoni, A.; Monarca, D.; Marucci, A.; Cecchini, M.; Zambon, I.; Battista, F.D.; Maccario, D.; Saporito, M.G.; Beruto, M. Solar radiation distribution inside a greenhouse prototypal with photovoltaic mobile plant and effects on flower growth. Sustainability 2018, 10, 855. [Google Scholar] [CrossRef]
- Yano, A.; Onoe, M.; Nakata, J. Prototype semi-transparent photovoltaic modules for greenhouse roof applications. Biosyst. Eng. 2014, 122, 62–73. [Google Scholar] [CrossRef]
- Cossu, M.; Yano, A.; Li, Z.; Onoe, M.; Nakamura, H.; Matsumoto, T.; Nakata, J. Advances on the semi-transparent modules based on micro solar cells: First integration in a greenhouse system. Appl. Energy 2016, 162, 1042–1051. [Google Scholar] [CrossRef] [Green Version]
- Kadowaki, M.; Yano, A.; Ishizu, F.; Tanaka, T.; Noda, S. Effects of greenhouse photovoltaic array shading on Welsh onion growth. Biosyst. Eng. 2012, 111, 290–297. [Google Scholar] [CrossRef]
- Ureña-Sánchez, R.; Callejón-Ferre, Á.J.; Pérez-Alonso, J.; Carreño-Ortega, Á. Greenhouse tomato production with electricity generation by roof-mounted flexible solar panels. Sci. Agric. 2012, 69, 233–239. [Google Scholar] [CrossRef] [Green Version]
- Hassanien, R.H.E.; Li, M.; Yin, F. The integration of semi-transparent photovoltaics on greenhouse roof for energy and plant production. Renew. Energy 2018, 121, 377–388. [Google Scholar] [CrossRef]
- Tani, A.; Shiina, S.; Nakashima, K.; Hayashi, M. Improvement in lettuce growth by light diffusion under solar panels. J. Agric. Meteorol. 2014, 70, 139–149. [Google Scholar] [CrossRef] [Green Version]
- Hassanien, R.H.E.; Li, M. Influences of greenhouse-integrated semi-transparent photovoltaics on microclimate and lettuce growth. Int. J. Agric. Biol. Eng. 2017, 10, 11–22. [Google Scholar] [CrossRef]
- Tripanagnostopoulos, G.; Kavga, A.; Souliotis, M.; Tripanagnostopoulos, Y. Greenhouse performance results for roof installed photovoltaics. Renew. Energy 2017, 111, 724–731. [Google Scholar] [CrossRef]
- Kavga, A.; Trypanagnostopoulos, G.; Zervoudakis, G.; Tripanagnostopoulos, Y. Growth and physiological characteristics of lettuce (Lactuca sativa L.) and Rocket (Eruca sativa Mill.) plants cultivated under photovoltaic panels. Not. Bot. Horti Agrobot. 2018, 46, 206–212. [Google Scholar] [CrossRef]
- Buttaro, D.; Renna, M.; Gerardi, C.; Blando, F.; Santamaria, P.; Serio, F. Soilless production of wild rocket as affected by greenhouse coverage with photovoltaic module. Acta Sci. Pol. Hortorum Cultus 2016, 15, 129–142. [Google Scholar]
- Sonneveld, P.J.; Swinkels, G.L.A.M.; Bot, G.P.A.; Flamand, G. Feasibility study for combining cooling and high grade energy production in a solar greenhouse. Biosyst. Eng. 2010, 105, 51–58. [Google Scholar] [CrossRef]
- Sonneveld, P.J.; Swinkels, G.L.A.M.; Campen, J.; van Tuijl, B.A.J.; Janssen, H.J.J.; Bot, G.P.A. Performance results of a solar greenhouse combining electrical and thermal energy production. Biosyst. Eng. 2010, 106, 48–57. [Google Scholar] [CrossRef]
- Emmott, C.J.M.; Röhr, J.A.; Campoy-Quiles, M.; Kirchartz, T.; Urbina, A.; Ekins-Daukes, N.J.; Nelson, J. Organic photovoltaic greenhouses: A unique application for semi-transparent PV? Energy Environ. Sci. 2015, 8, 1317–1328. [Google Scholar] [CrossRef]
- Yang, F.; Zhang, Y.; Hao, Y.; Cui, Y.; Wang, W.; Ji, T.; Shi, F.; Wei, B. Visibly transparent organic photovoltaic with improved transparency and absorption based on tandem photonic crystal for greenhouse application. Appl. Opt. 2015, 54, 10232–10239. [Google Scholar] [CrossRef] [PubMed]
- Dos Reis Benatto, G.A.; Corazza, M.; Roth, B.; Schütte, F.; Rengenstein, M.; Gevorgyan, S.A.; Krebs, F.C. Inside or outside? Linking outdoor and indoor lifetime tests of ITO-free organic photovoltaic devices for greenhouse applications. Energy Technol. 2017, 5, 338–344. [Google Scholar] [CrossRef]
- Kim, J.-J.; Kang, M.; Kwak, O.K.; Yoon, Y.-J.; Min, K.S.; Chu, M.-J. Fabrication and characterization of dye-sensitized solar cells for greenhouse application. Int. J. Photoenergy 2014, 2014, 376315. [Google Scholar] [CrossRef]
- Allardyce, C.S.; Fankhauser, C.; Zakeeruddin, S.M.; Grätzel, M.; Dyson, P.J. The influence of greenhouse-integrated photovoltaics on crop production. Sol. Energy 2017, 155, 517–522. [Google Scholar] [CrossRef]
- Liu, W.; Liu, L.; Guan, C.; Zhang, F.; Li, M.; Lv, H.; Yao, P.; Ingenhoff, J. A novel agricultural photovoltaic system based on solar spectrum separation. Sol. Energy 2018, 162, 84–94. [Google Scholar] [CrossRef]
- Souliotis, M.; Tripanagnostopoulos, Y.; Kavga, A. The use of Fresnel lenses to reduce the ventilation needs of greenhouses. Acta Hortic. 2006, 719, 107–114. [Google Scholar] [CrossRef]
- Sonneveld, P.J.; Swinkels, G.L.A.M.; van Tuijl, B.A.J.; Janssen, H.J.J.; Campen, J.; Bot, G.P.A. Performance of a concentrated photovoltaic energy system with static linear Fresnel lenses. Sol. Energy 2011, 85, 432–442. [Google Scholar] [CrossRef]
- Vadiee, A.; Martin, V. Solar blind system—Solar energy utilization and climate mitigation in glassed buildings. Energy Procedia 2014, 57, 2023–2032. [Google Scholar] [CrossRef]
- Vadiee, A.; Yaghoubi, M. Enviro-economic assessment of energy conservation methods in commercial greenhouses in Iran. Outlook Agric. 2016, 45, 47–53. [Google Scholar] [CrossRef]
- Vadiee, A.; Yaghoubi, M. Exergy analysis of the solar blind system integrated with a commercial solar greenhouse. Int. J. Renew. Energy Res. 2016, 6, 1189–1199. [Google Scholar]
- Vadiee, A.; Yaghoubi, M.; Martin, V.; Bazargan-Lari, Y. Energy analysis of solar blind system concept using energy system modelling. Sol. Energy 2016, 139, 297–308. [Google Scholar] [CrossRef]
- Marucci, A.; Monarca, D.; Cecchini, M.; Colantoni, A.; Cappuccini, A. Analysis of internal shading degree to a prototype of dynamics photovoltaic greenhouse through simulation software. J. Agric. Eng. 2015, 46. [Google Scholar] [CrossRef]
- Marucci, A.; Cappuccini, A. Dynamic photovoltaic greenhouse: Energy efficiency in clear sky conditions. Appl. Energy 2016, 170, 362–376. [Google Scholar] [CrossRef]
- Marucci, A.; Cappuccini, A. Dynamic photovoltaic greenhouse: Energy balance in completely clear sky condition during the hot period. Energy 2016, 102, 302–312. [Google Scholar] [CrossRef]
- Green, M.A.; Hishikawa, Y.; Warta, W.; Dunlop, E.D.; Levi, D.H.; Hohl-Ebinger, J.; Ho-Baillie, A.W.Y. Solar cell efficiency tables (version 50). Prog. Photovolt. Res. Appl. 2017, 25, 668–676. [Google Scholar] [CrossRef]
- Al Dakheel, J.; Aoul, K.T. Building applications, opportunities and challenges of active shading systems: A state-of-the-art review. Energies 2017, 10, 1672. [Google Scholar] [CrossRef]
- Li, Z.; Yano, A.; Cossu, M.; Yoshioka, H.; Kita, I.; Ibaraki, Y. Shading and electric performance of a prototype greenhouse blind system based on semi-transparent photovoltaic technology. J. Agric. Meteorol. 2018, in press. [Google Scholar]
- Biancardo, M.; Taira, K.; Kogo, N.; Kikuchi, H.; Kumagai, N.; Kuratani, N.; Inagawa, I.; Imoto, S.; Nakata, J. Characterization of microspherical semi-transparent solar cells and modules. Sol. Energy 2007, 81, 711–716. [Google Scholar] [CrossRef]
- Taira, K.; Nakata, J. Silicon cells: Catching rays. Nat. Photonics Technol. Focus 2010, 4, 602–603. [Google Scholar] [CrossRef]
- Yano, A.; Furue, A.; Kadowaki, M.; Tanaka, T.; Hiraki, E.; Miyamoto, M.; Ishizu, F.; Noda, S. Electrical energy generated by photovoltaic modules mounted inside the roof of a north–south oriented greenhouse. Biosyst. Eng. 2009, 103, 228–238. [Google Scholar] [CrossRef]
- Tudisca, S.; Trapani, A.M.D.; Sgroi, F.; Testa, R.; Squatrito, R. Assessment of Italian energy policy through the study of a photovoltaic investment on greenhouse. Afr. J. Agric. Res. 2013, 8, 3089–3096. [Google Scholar] [CrossRef]
- Sgroi, F.; Tudisca, S.; Trapani, A.M.D.; Testa, R.; Squatrito, R. Efficacy and efficiency of Italian energy policy: The case of PV systems in greenhouse farms. Energies 2014, 7, 3985–4001. [Google Scholar] [CrossRef]
- Cossu, M.; Ledda, L.; Deligios, P.A.; Sirigu, A.; Murgia, L.; Pazzona, A.; Yano, A. Solar light distribution inside a greenhouse with the roof area entirely covered with photovoltaic panels. Acta Hortic. 2017, 1182, 47–55. [Google Scholar] [CrossRef]
- Castellano, S.; Santamaria, P.; Serio, F. Solar radiation distribution inside a monospan greenhouse with the roof entirely covered by photovoltaic panels. J. Agric. Eng. 2016, 47. [Google Scholar] [CrossRef]
- Castellano, S. Photovoltaic greenhouses: Evaluation of shading effect and its influence on agricultural performances. J. Agric. Eng. 2014, 45. [Google Scholar] [CrossRef]
- Castellano, S. Influence of geometry on shading effect inside photovoltaic greenhouses. Acta Hortic. 2017, 1170, 813–819. [Google Scholar] [CrossRef]
- Cossu, M.; Murgia, L.; Ledda, L.; Deligios, P.A.; Sirigu, A.; Chessa, F.; Pazzona, A. Solar radiation distribution inside a greenhouse with south-oriented photovoltaic roofs and effects on crop productivity. Appl. Energy 2014, 133, 89–100. [Google Scholar] [CrossRef]
- Cossu, M.; Ledda, L.; Urracci, G.; Sirigu, A.; Cossu, A.; Murgia, L.; Pazzona, A.; Yano, A. An algorithm for the calculation of the light distribution in photovoltaic greenhouses. Sol. Energy 2017, 141, 38–48. [Google Scholar] [CrossRef]
- Cossu, M.; Yano, A.; Murgia, L.; Ledda, L.; Deligios, P.A.; Sirigu, A.; Chessa, F.; Pazzona, A. Effects of the photovoltaic roofs on the greenhouse microclimate. Acta Hortic. 2017, 1170, 461–468. [Google Scholar] [CrossRef]
- Xue, J. Photovoltaic agriculture—New opportunity for photovoltaic applications in China. Renew. Sustain. Energy Rev. 2017, 73, 1–9. [Google Scholar] [CrossRef]
- Japan Meteorological Agency: Monthly Mean Global Solar Radiation. Available online: http://www.data.jma.go.jp/obd/stats/etrn/view/monthly_s3_en.php?block_no=47741&view=11 (accessed on 1 March 2018).
- Yano, A.; Tsuchiya, K.; Nishi, K.; Moriyama, T.; Ide, O.; Ishizaka, A.; Toya, M. Development of a power saving greenhouse side window controller driven by photovoltaic energy. J. Jpn. Soc. Agric. Mach. 2005, 67, 100–110. [Google Scholar]
- Yano, A.; Tsuchiya, K.; Nishi, K.; Moriyama, T.; Ide, O. Development of a greenhouse side-ventilation controller driven by photovoltaic energy. Biosyst. Eng. 2007, 96, 633–641. [Google Scholar] [CrossRef]
- Rocamora, M.C.; Tripanagnostopoulos, Y. Aspects of PV/T solar system application for ventilation needs in greenhouses. Acta Hortic. 2006, 719, 239–246. [Google Scholar] [CrossRef]
- Carreño-Ortega, A.; Galdeano-Gómez, E.; Pérez-Mesa, J.C.; Galera-Quiles, M.D.C. Policy and environmental implications of photovoltaic systems in farming in southeast Spain: Can greenhouses reduce the greenhouse effect? Energies 2017, 10, 761. [Google Scholar] [CrossRef]
- Campiotti, C.; Dondi, F.; Genovese, A.; Alonzo, G.; Catanese, V.; Incrocci, L.; Bibbiani, C. Photovoltaic as sustainable energy for greenhouse and closed plant production system. Acta Hortic. 2008, 797, 373–378. [Google Scholar] [CrossRef]
- Wang, T.; Wu, G.; Chen, J.; Cui, P.; Chen, Z.; Yan, Y.; Zhang, Y.; Li, M.; Niu, D.; Li, B.; et al. Integration of solar technology to modern greenhouse in China: Current status, challenges and prospect. Renew. Sustain. Energy Rev. 2017, 70, 1178–1188. [Google Scholar] [CrossRef]
- Blando, F.; Gerardi, C.; Renna, M.; Castellano, S.; Serio, F. Characterisation of bioactive compounds in berries from plants grown under innovative photovoltaic greenhouses. J. Berry Res. 2018, 8, 55–69. [Google Scholar] [CrossRef]
- Melis, A. Solar energy conversion efficiencies in photosynthesis: Minimizing the chlorophyll antennae to maximize efficiency. Plant Sci. 2009, 177, 272–280. [Google Scholar] [CrossRef]
- Zhu, X.-G.; Long, S.P.; Ort, D.R. Improving photosynthetic efficiency for greater yield. Ann. Rev. Plant Biol. 2010, 61, 235–261. [Google Scholar] [CrossRef] [PubMed]


| Dimensions | 500 mm × 200 mm × 11 mm |
|---|---|
| Weight per module | 2.23 kg |
| Cross-sectional structure | 3.8 mm glass plate/3.0 mm resin including the cells and conductors/3.8 mm glass plate |
| Rated output per module * | 1.2 W |
| Cell type | mono-crystalline silicon (Sphelar®; Sphelar Power Corp., Kyoto, Japan) |
| Cell diameter | 1.2 mm |
| Number of cells per module | 13,764 |
| Cell density in the semi-transparent zone (154 mm × 158 mm) | 18.9 cell cm−2 |
| Front view occupation (%) of the opaque materials in the semi-transparent zone | 31% including the cells and the conductors |
| Number of PV modules per blind | 3 |
| R0 (Ω) | CW/CCW Rotation | Blind Rotation Start Time * | Threshold IH (W m−2) | Rotation Duration t (s) | Energy e (J) |
|---|---|---|---|---|---|
| 661 | CW1 | 10:09:19 | 369 | 4.0 | 14.5 |
| CCW1 | 10:17:37 | 362 | 4.2 | 14.1 | |
| 597 | CW2 | 10:26:35 | 402 | 3.9 | 12.6 |
| CCW2 | 10:27:47 | 397 | 3.8 | 11.3 | |
| CW3 | 10:28:25 | 402 | 3.9 | 12.6 | |
| CCW3 | 10:28:48 | 397 | 3.8 | 11.3 | |
| CW4 | 10:28:54 | 401 | 3.9 | 12.4 | |
| CCW4 | 10:28:58 | 399 | 3.8 | 11.1 | |
| 534 | CCW5 | 11:06:02 | 438 | 3.7 | 9.9 |
| CW5 | 11:08:06 | 444 | 3.7 | 11.1 |
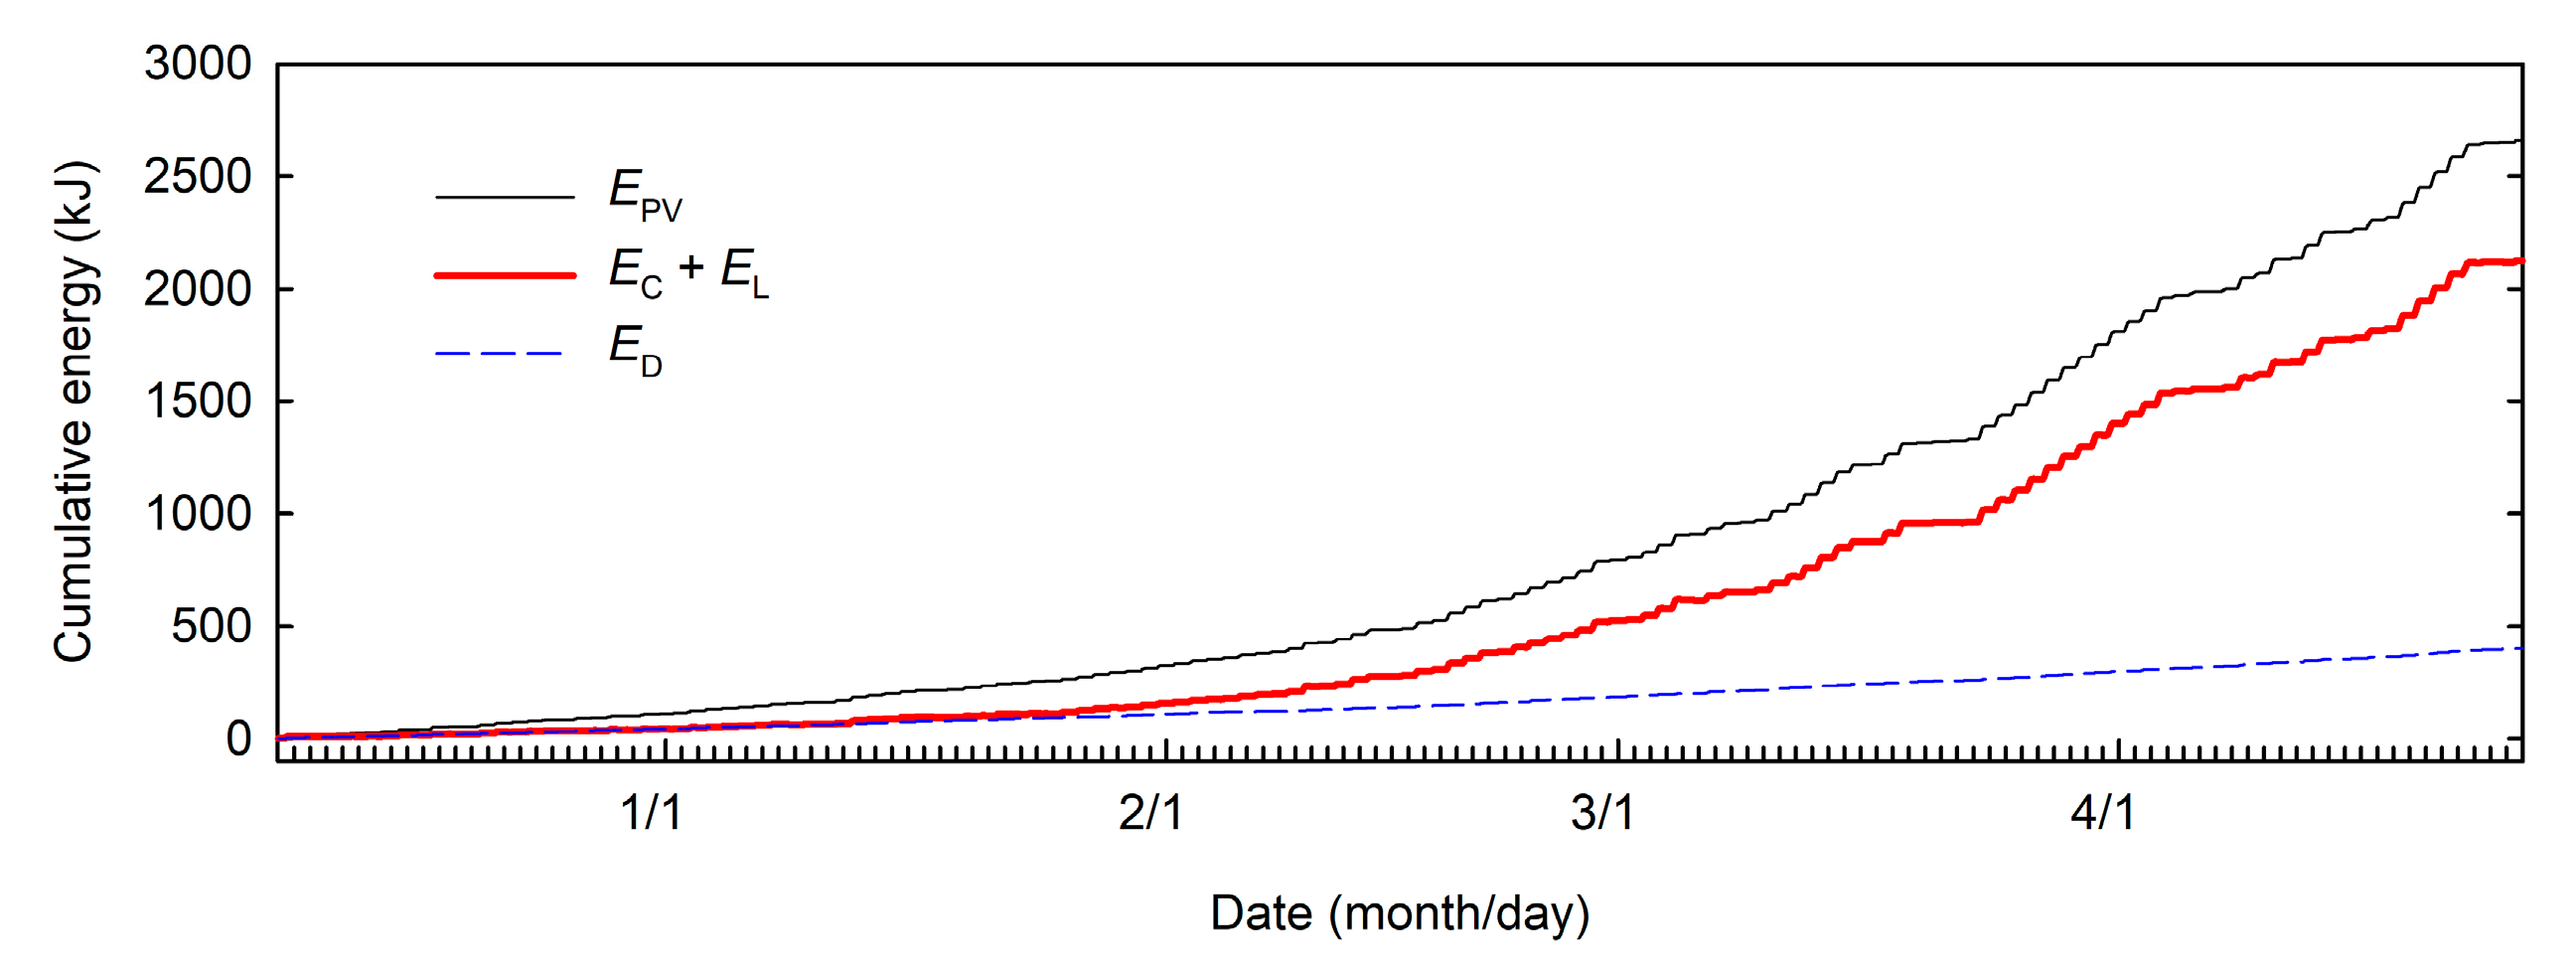
| EPV | EC + EL * | ED | Ei | |
|---|---|---|---|---|
| kJ | 2659.10 | 2125.26 | 398.80 | 135.04 |
| kJ day−1 | 19.27 | 15.40 | 2.89 | 0.98 |
| Wh m−2 day−1 | 19.94 | 15.93 | 2.99 | 1.01 |
| Location | Electrical Load | Energy Demand (kWh m−2 Year−1) | Reference |
|---|---|---|---|
| Japan | side-ventilation controller | 0.1 | [70,71] |
| Northern Europe | typical electricity consumption in northern European greenhouses | 2–7 | [38] |
| Mediterranean | heating, cooling, ventilation | 2–9 | [74] |
| Spain | window operation, pumps | 3 * | [29] |
| Spain | fans, irrigation and fertilization equipment, fuel burner, window-opening and screen motors, automatism for climate control, compressor, electrical resistance of the fuel reservoir | 7 | [72] |
| Greece | ventilation, cooling, lighting | 20 | [44] |
| Greece | low-level energy consumption greenhouse | 25 | [33] |
| China | cooling and ventilation | 30 | [75] |
| Saudi Arabia | fans, cooling pump, PC | 56 | [6] |
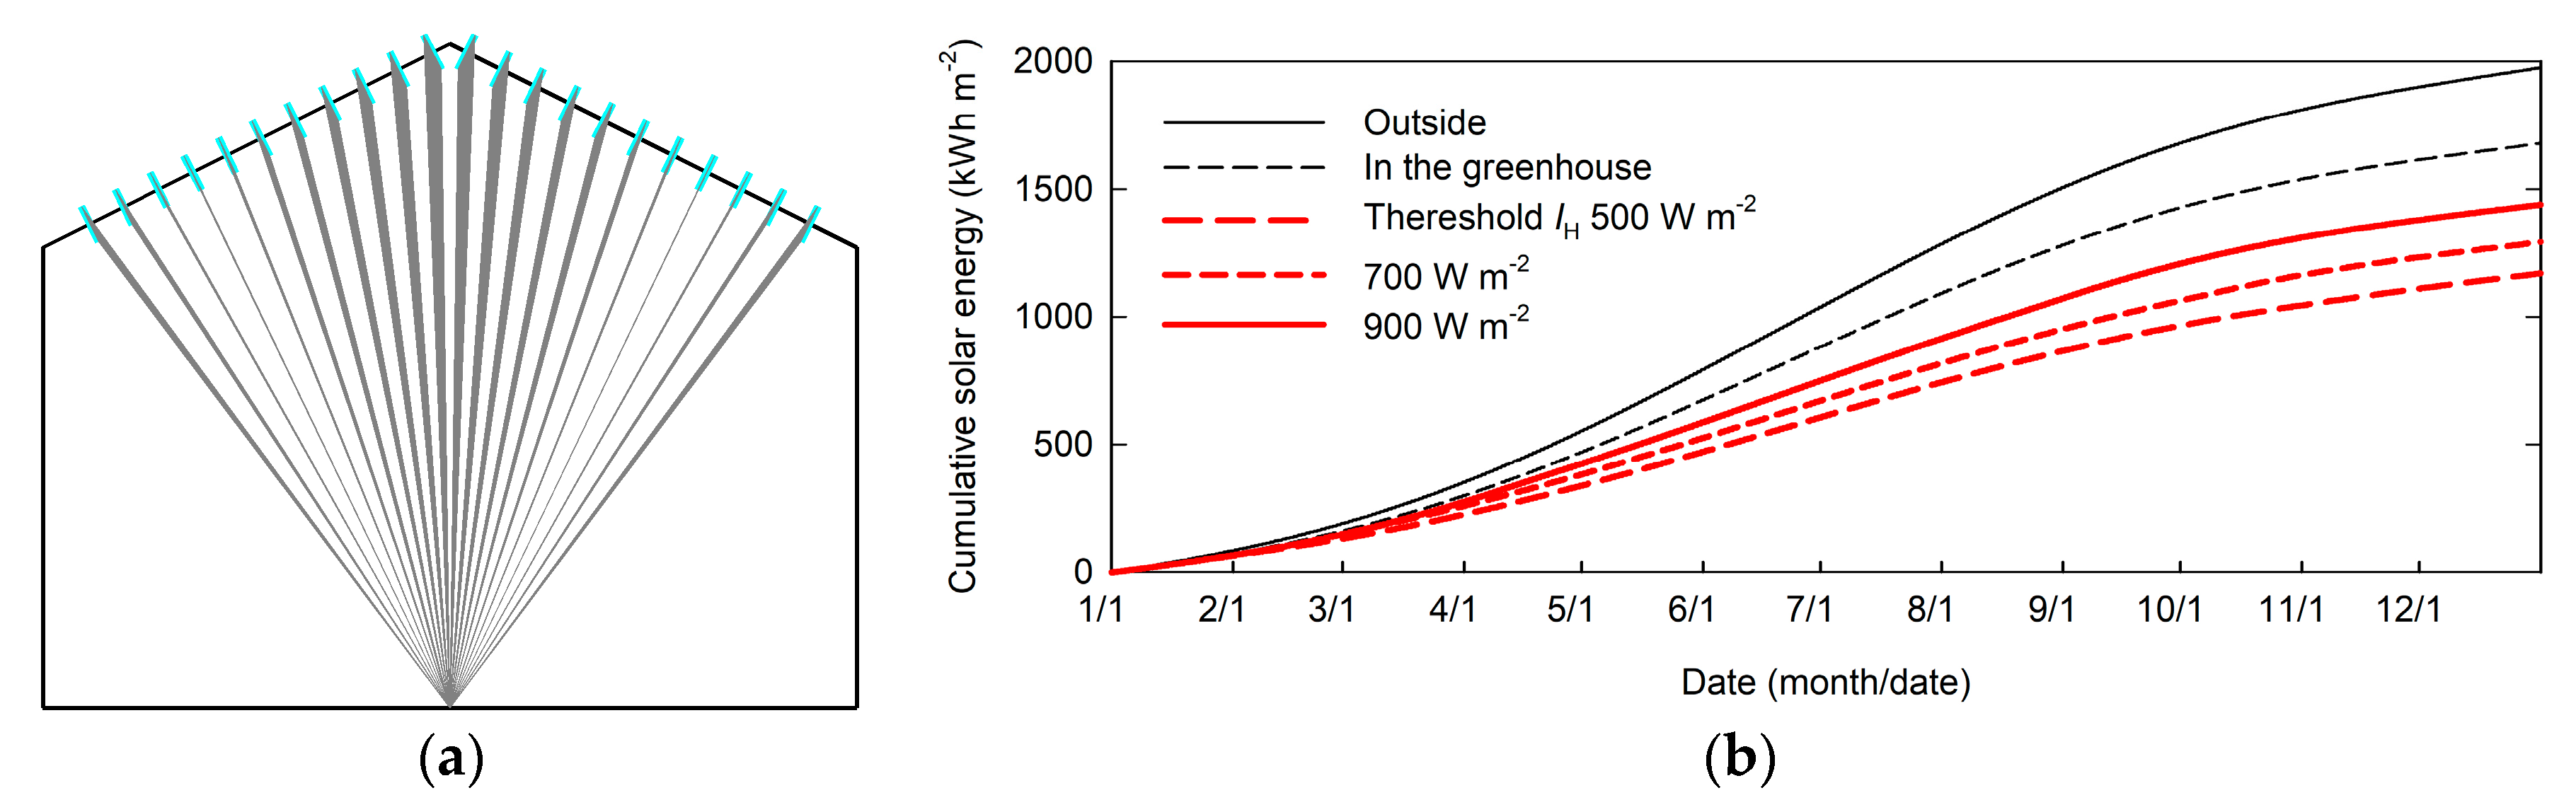
| Outside | Inside the Greenhouse ** | ||||
|---|---|---|---|---|---|
| Without PV Blind | PV Blind Overlapped with Glazing Roof | ||||
| Threshold IH (W m−2) | |||||
| 500 | 700 | 900 | |||
| kWh m−2 year−1 * | 1976 | 1679 | 1170 | 1292 | 1439 |
| % outside | 100 | 85 | 59 | 65 | 73 |
| % interior greenhouse without the PV blind | 118 | 100 | 70 | 77 | 86 |
© 2018 by the authors. Licensee MDPI, Basel, Switzerland. This article is an open access article distributed under the terms and conditions of the Creative Commons Attribution (CC BY) license (http://creativecommons.org/licenses/by/4.0/).
Share and Cite
Li, Z.; Yano, A.; Cossu, M.; Yoshioka, H.; Kita, I.; Ibaraki, Y. Electrical Energy Producing Greenhouse Shading System with a Semi-Transparent Photovoltaic Blind Based on Micro-Spherical Solar Cells. Energies 2018, 11, 1681. https://doi.org/10.3390/en11071681
Li Z, Yano A, Cossu M, Yoshioka H, Kita I, Ibaraki Y. Electrical Energy Producing Greenhouse Shading System with a Semi-Transparent Photovoltaic Blind Based on Micro-Spherical Solar Cells. Energies. 2018; 11(7):1681. https://doi.org/10.3390/en11071681
Chicago/Turabian StyleLi, Zhi, Akira Yano, Marco Cossu, Hidekazu Yoshioka, Ichiro Kita, and Yasuomi Ibaraki. 2018. "Electrical Energy Producing Greenhouse Shading System with a Semi-Transparent Photovoltaic Blind Based on Micro-Spherical Solar Cells" Energies 11, no. 7: 1681. https://doi.org/10.3390/en11071681