Study on EV Charging Peak Reduction with V2G Utilizing Idle Charging Stations: The Jeju Island Case


1
Department of Electrical Engineering, Gachon University, Gyeonggi-do 13120, Korea
2
Department of Electrical and Electronic Engineering, Hanseo University, Chungcheongnam-do 31962, Korea
*
Author to whom correspondence should be addressed.
Energies 2018, 11(7), 1651; https://doi.org/10.3390/en11071651
Submission received: 26 April 2018
/
Revised: 19 June 2018
/
Accepted: 22 June 2018
/
Published: 25 June 2018
(This article belongs to the Special Issue Energy Management in Vehicle–Grid–Traffic Nexus)
Abstract
:Electric vehicles (EVs), one of the biggest innovations in the automobile industry, are considered as a demand source as well as a supply source for power grids. Studies have been conducted on the effect of EV charging and utilization of EVs to control grid peak or to solve the intermittency problem of renewable generators. However, most of these studies focus on only one aspect of EVs. In this work, we demonstrate that the increased demand resulting from EV charging can be alleviated by utilizing idle EV charging stations as a vehicle-to-grid (V2G) service. The work is performed based on data from Jeju Island, Korea. The EV demand pattern in 2030 is modeled and forecasted using EV charging patterns from historical data and the EV and charging station deployment plan of Jeju Island’s local government. Then, using a Monte Carlo simulation, charging and V2G scenarios are generated, and the effect of V2G on peak time is analyzed. In addition, a sensitivity analysis is performed for EV and charging station deployment. The results show that the EV charging demand increase can be resolved within the EV ecosystem.
1. Introduction
The global automobile market is rapidly changing from internal combustion engine cars to environmentally friendly ones because of concerns regarding the environment and air pollution. Electric vehicles (EVs), which use an electric battery and a motor, are emerging as effective alternatives for environmental improvements. Korea aims to provide 200,000 eco-friendly cars by 2020, and the local government of Jeju, the largest island off the coast of Korea, announced a plan in September 2013 to build a “carbon-free island” by 2030 [1]. According to the plan, all commercial vehicles will be changed to EVs by 2030. The increased number of EVs will increase electric charging demand, requiring Jeju Island to make preparations to address the power peak problem. A vehicle-to-grid (V2G) technique could be a good solution to this problem.
Studies related to EVs have been performed from various viewpoints, e.g., (1) the influence of EV penetration into the power system; (2) EV operating algorithms; (3) EV charging prices; (4) power demand forecasting according to EV supply; (5) technical analysis of and effect on the power system using V2G.
Prior research related to the influence of EV penetration into the power system includes analysis of the voltage sensitivity of the distribution system according to EV charging location [2], analysis of the effects on the power system [3,4,5], and study of the stability of the system using EVs [6,7,8]. Research related to EV operating algorithms has addressed operating optimal charge/discharge processes through power system analysis [9], economic operating algorithms for photovoltaic (PV) installation near EV charging stations [10], analysis of PV and EV connection through the charging algorithm [11], and micro-grid optimal power flow control with EV charging infrastructure [12].
EV price-related studies have considered a cost–benefit analysis from multiple stakeholder perspectives [13], a demand response (DR) program for optimizing the demand according to EV charging loads and tariffs [14], analysis of EV charging costs with mutual benefit of perspectives taken into account [15], EV charge/discharge optimization according to dynamic tariffs [16], and design of tariffs and analysis of their benefits [17,18,19].
Research related to EV demand forecasting has included forecasting EV charging demand based on real data [20], EV load forecasting by region [21], and EV load forecasting with weather and traffic taken into account [22]. Particularly, the demand pattern modeling is most of the important parts in EV demand forecasting. In [23], an aggregated EV model is proposed to predict the total electricity demand. Autoregressive integrated moving average (ARIMA) based modeling is developed to take daily driving patterns and distances as an input parameter to determine EV demand forecasting [24]. Data-driven demand pattern modeling is also researched as a fuzzy-based characterization model [25] and a big data-based clustering model [26]. However, these researches generally focus on short-term modeling and forecasting. Among the EV load forecasting studies, [1,27] only performed forecasting charging demand in Jeju in 2030, and [27] considered fuel efficiency and average mileage data for each car based on the number of EV supply stations in Jeju in 2030, classified by type and size.
Research related to the technical analysis of and effect on a power system using V2G has addressed the overall definition and concepts of V2G [28,29], charge/discharge optimal algorithms [30,31,32,33,34], V2G system architecture and standards [35,36], a technical study of V2G [37], and its effect on the distribution network when V2G was implemented [38,39]. As such, studies related to EV charging demand forecasting and V2G were performed but failed to forecast charging demand by considering real EV operating patterns and estimate V2G possible capacity and amount of peak loss based on existing charger infrastructure.
This study focuses on the peak power problem caused by the increased demand resulting from EV charging. The peak power problem is an important issue not only for power grid operators but also for local authorities and urban development. The main contribution of this paper is to show that, by using the Jeju case, the spread of EVs would not cause a serious problem with respect to peak power demand increase, as long as EV charging infrastructure can be appropriately operated. Specifically, to resolve the grid peak power increase by EVs, V2G utilizing idle charging stations is proposed. For this, the EV charging contribution at peak time is forecast based on actual EV charging data and an EV transition plan. A charging distribution model is then developed for EV charging and V2G modeling. Using the modeling and Erlang’s formula, it is analyzed that the state of EV charging station is enough to use V2G. A Monte Carlo simulation is performed to generate the charging scenarios for the individual station. V2G operations are performed using idle charging stations by considering EV charging scenarios generated from the simulation to forecast and analyze the effect of V2G on Jeju Island. As a result, it is shown that any problems with the system’s peak power increase caused by EV use can be resolved within the EV ecosystem. Additional sensitivity analysis for EV charging station supply changes is performed and shows that the approach also works even if the EV station supply is reduced to about 50% of the current scenario.
2. Outline of the Jeju Island Power System and EV Transition Plan
2.1. Status of Jeju Island’s EV Transition Plan and Demand Forecast
Jeju’s EV transition plan based on the goal of a “carbon-free island” was divided into three stages. The first stage focuses on public institutions and rental vehicles, replacing 10% of these 29,000 vehicles by 2017. The second stage focuses on buses and rental vehicles, replacing 30% of these 94,000 vehicles by 2020. The final stage aims to switch 100% of the 377,000 commercial vehicles by 2030 [1]. According to the transition plan, the target vehicles are divided into five categories: business, freight and special vehicles, rental cars, buses, and taxis; their anticipated proportions of the total number of vehicles in 2030 are 62%, 22%, 9%, 6%, and 1%, respectively [1]. As of September 2017, the number of EVs deployed was 8242, which represents 2.25% of the 366,713 total number of registered vehicles. Of these, 73% are personal, including those operated for business, 25% are rental cars, and 2% are taxis, and the numbers of buses and freight and special vehicles are 63 and 2, respectively. The number of buses and freight and special vehicles are less than 1% of total EV supply so far.
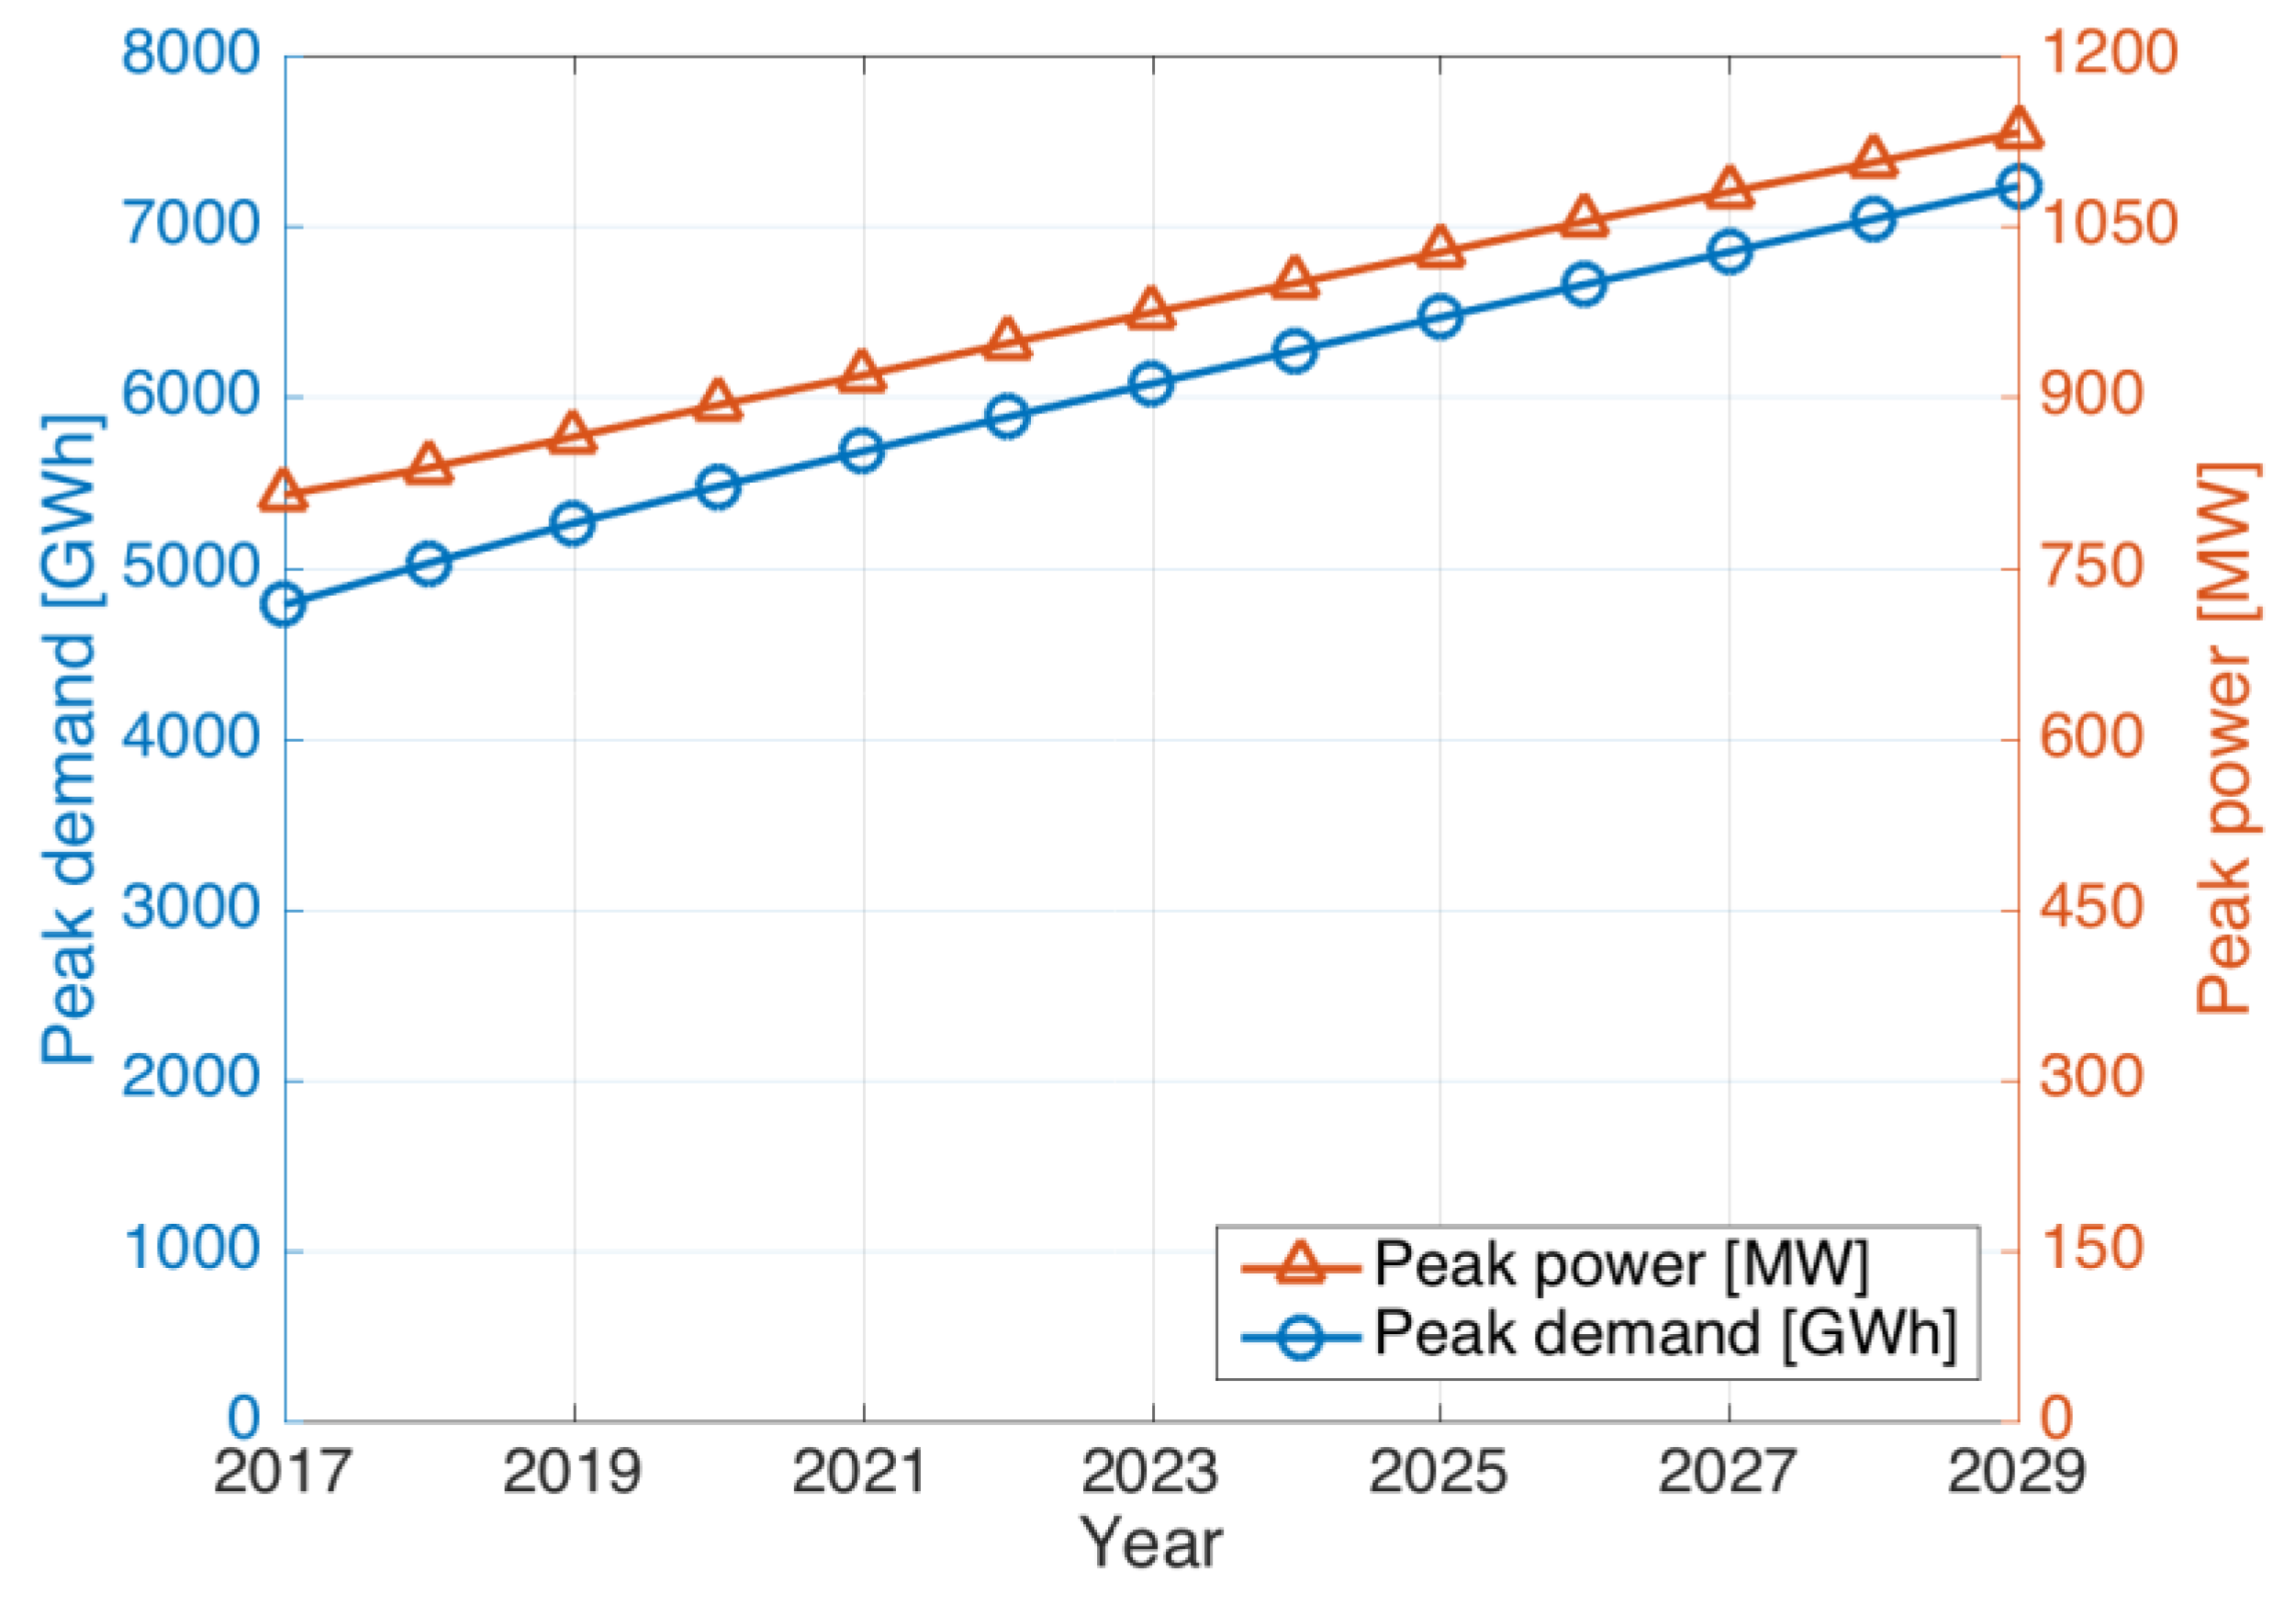
Jeju’s electricity sales amount was 4,738,201 MWh, and the peak power was 840 MW in 2016, occurring during summer dinner time, 12 August, 18:00 [1]. According to the 7th Electric Power Supply and Demand plan of Korea, Jeju’s power demand and peak power in 2029 are forecasted to be 7234 GWh, and 1132 MW, respectively, yielding growth of factors of 1.5 and 1.3, respectively, from 2016 values, as shown in Figure 1 [40].
2.2. Analysis of EV Charging Pattern
EV charging patterns were analyzed by using Jeju’s EV charging operation data from a commercial charging company obtained between January and September 2017. The data include individual data of the type of vehicles, charging time, and charging amount, etc. Bus, freight and special EVs are not included in this analysis because too few of these vehicles are deployed, and, furthermore, most of these types of vehicles would not use commercial charging stations. Charging station data include commercial fast and slow chargers but not personal slow chargers because most personal slow chargers would be used at night and the impact on the grid would be limited.
2.2.1. EV Charging Amount per Visit
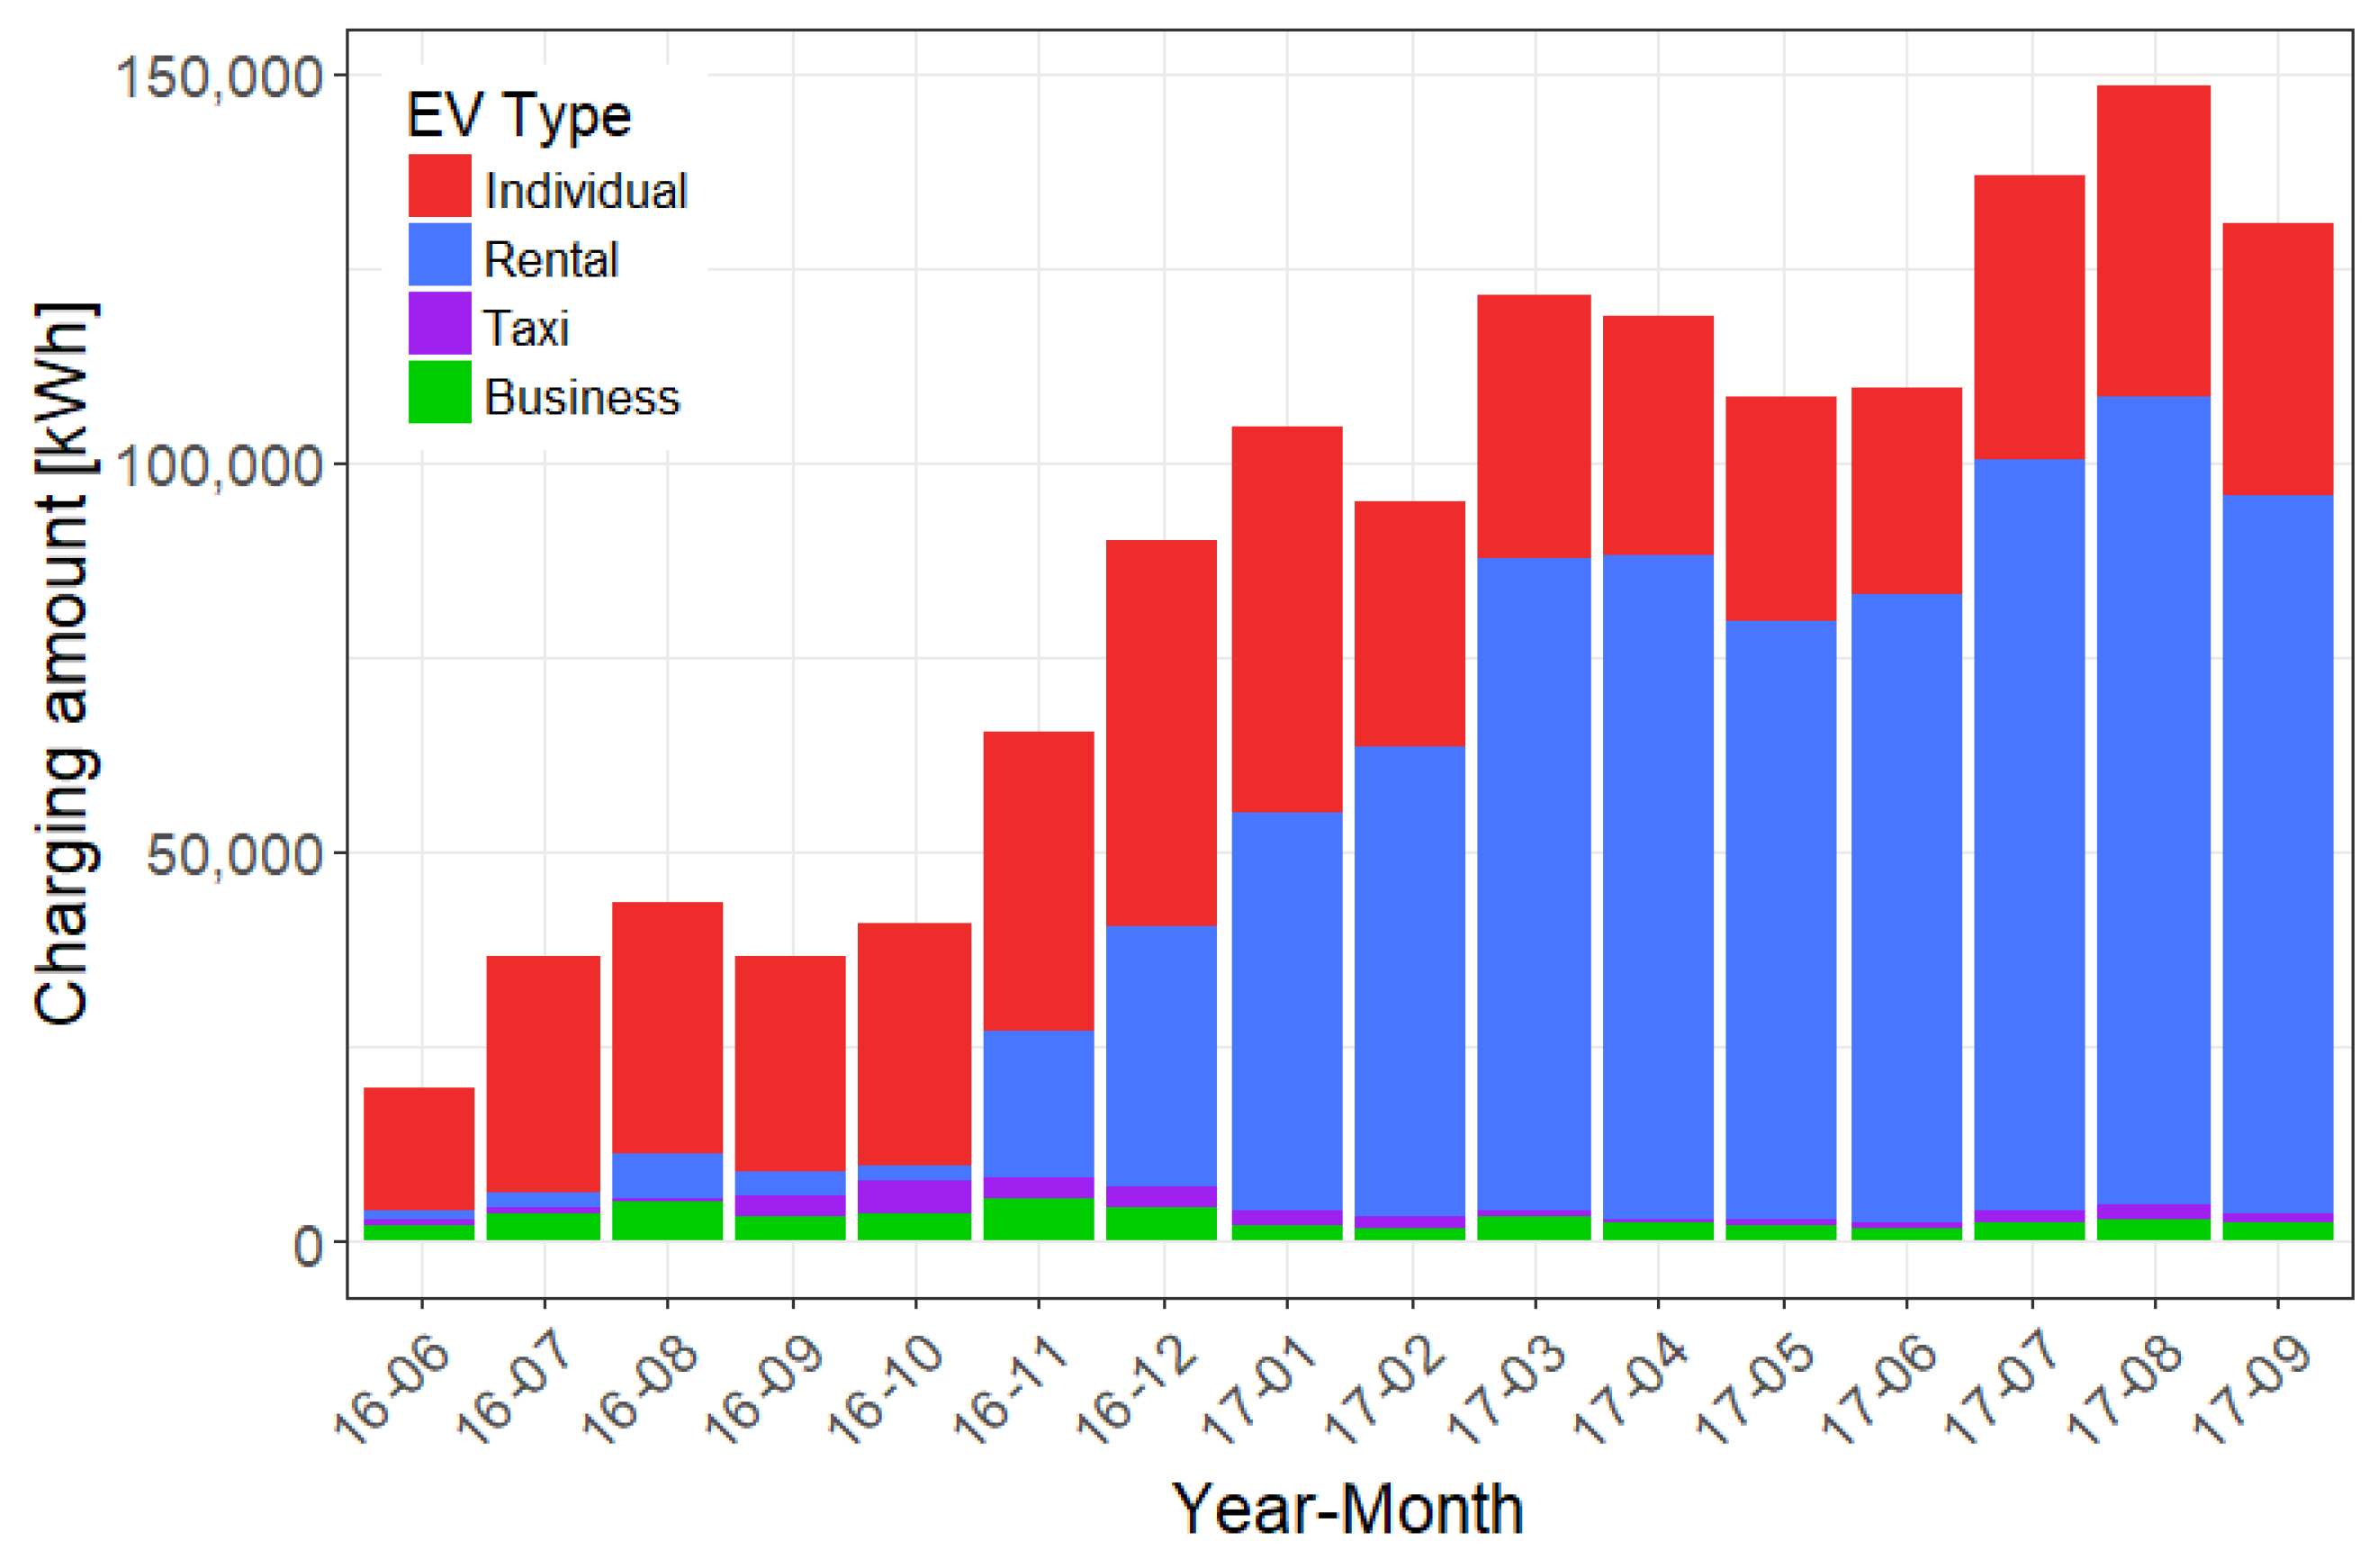
The number of EVs registered in Jeju increases linearly while the monthly charging does not increase in proportion to the number of EVs, as shown in Figure 2. Figure 2 shows the charging amount by type of EV: personal was 80% of the total in June 2016, with 9% for business, 8% for rentals, and 4% for taxis. From November 2016, the proportion of rental charging amount increased, and, by September 2017, 70% of the total charging amount was for rental EVs. This shows that the supply of rental EVs is growing much faster than that of others.
The charging amount distribution per visit at the charging stations is shown in Figure 3, and it is modeled using a Weibull probability distribution. In this case, the actual charging amounts in 2017 are mostly distributed between 0 and 30 kWh, because 30 kWh is the common capacity of the EV batteries in Jeju. However, to consider the effect of an increase of EV battery capacity owing to cost reduction, it is assumed that the statistical distribution pattern of charging stays the same but that the charging amount would be increased by the increase in EV battery capacity. In this study, EV battery capacity in 2030 was set to 90 kWh based on an EV battery capacity forecast [41]. The charging amount distribution per visit in 2030 was set to follow W(2.4, 43) using a Weibull probability distribution, as shown in Figure 3. Here, the average charging amounts per visit are 12.2 and 37.8 kWh in 2017 and 2030, respectively. This is a reasonable assumption because driving patterns are independent of EV battery capacity, and the charging time per visit would be the same or shorter than before to provide same or better service quality.
2.2.2. Analysis of EV Charging Pattern
EVs have different charging patterns depending on their types, as shown in Figure 4. For example, rental cars charge more than twice as much compared to other types. This is reasonable because the driving distances of rental cars tend to be higher than for others. Individual cars are charged most often during commute times, 08:00 and 18:00, rental cars are charged most frequently in the afternoon, 11:00 to 17:00, and business cars are charged typically during office hours, 10:00 to 17:00. Charging patterns depend somewhat on EV type, despite some differences, but most charging at commercial charging stations occurs during the daytime. As reviewed in the previous section, demand charging pattern modeling is an important part of the forecasting. However, uncertainty is too great to make long-term forecasts. In this study, it is assumed that the charging pattern for each EV type remains the same from 2017 to 2030.
2.3. EV Charging Demand Forecast
The annual EV charging demand and peak power for Jeju in 2030 were predicted based on the analysis of the EV charging patterns obtained from the previous section and the EV transition plan. Battery swapping is the most commonly used method for buses to shorten the charging time, as buses have large battery capacity compared to that of passenger vehicles [42,43]. For such vehicles, battery charging can be performed with slow charging or charging in advance at night to reduce electricity costs. Consequently, the effect on peak power by charging demand for buses is limited. For a similar reason, freight and special EVs were not considered in the EV charging demand forecast. The composition of EVs by type would be different between 2017 and 2030, as 2017 is the early stage of EV transition. Therefore, the EV type composition change should be considered for forecasting power charging demand. The forecasted annual charging power demand can be calculated as
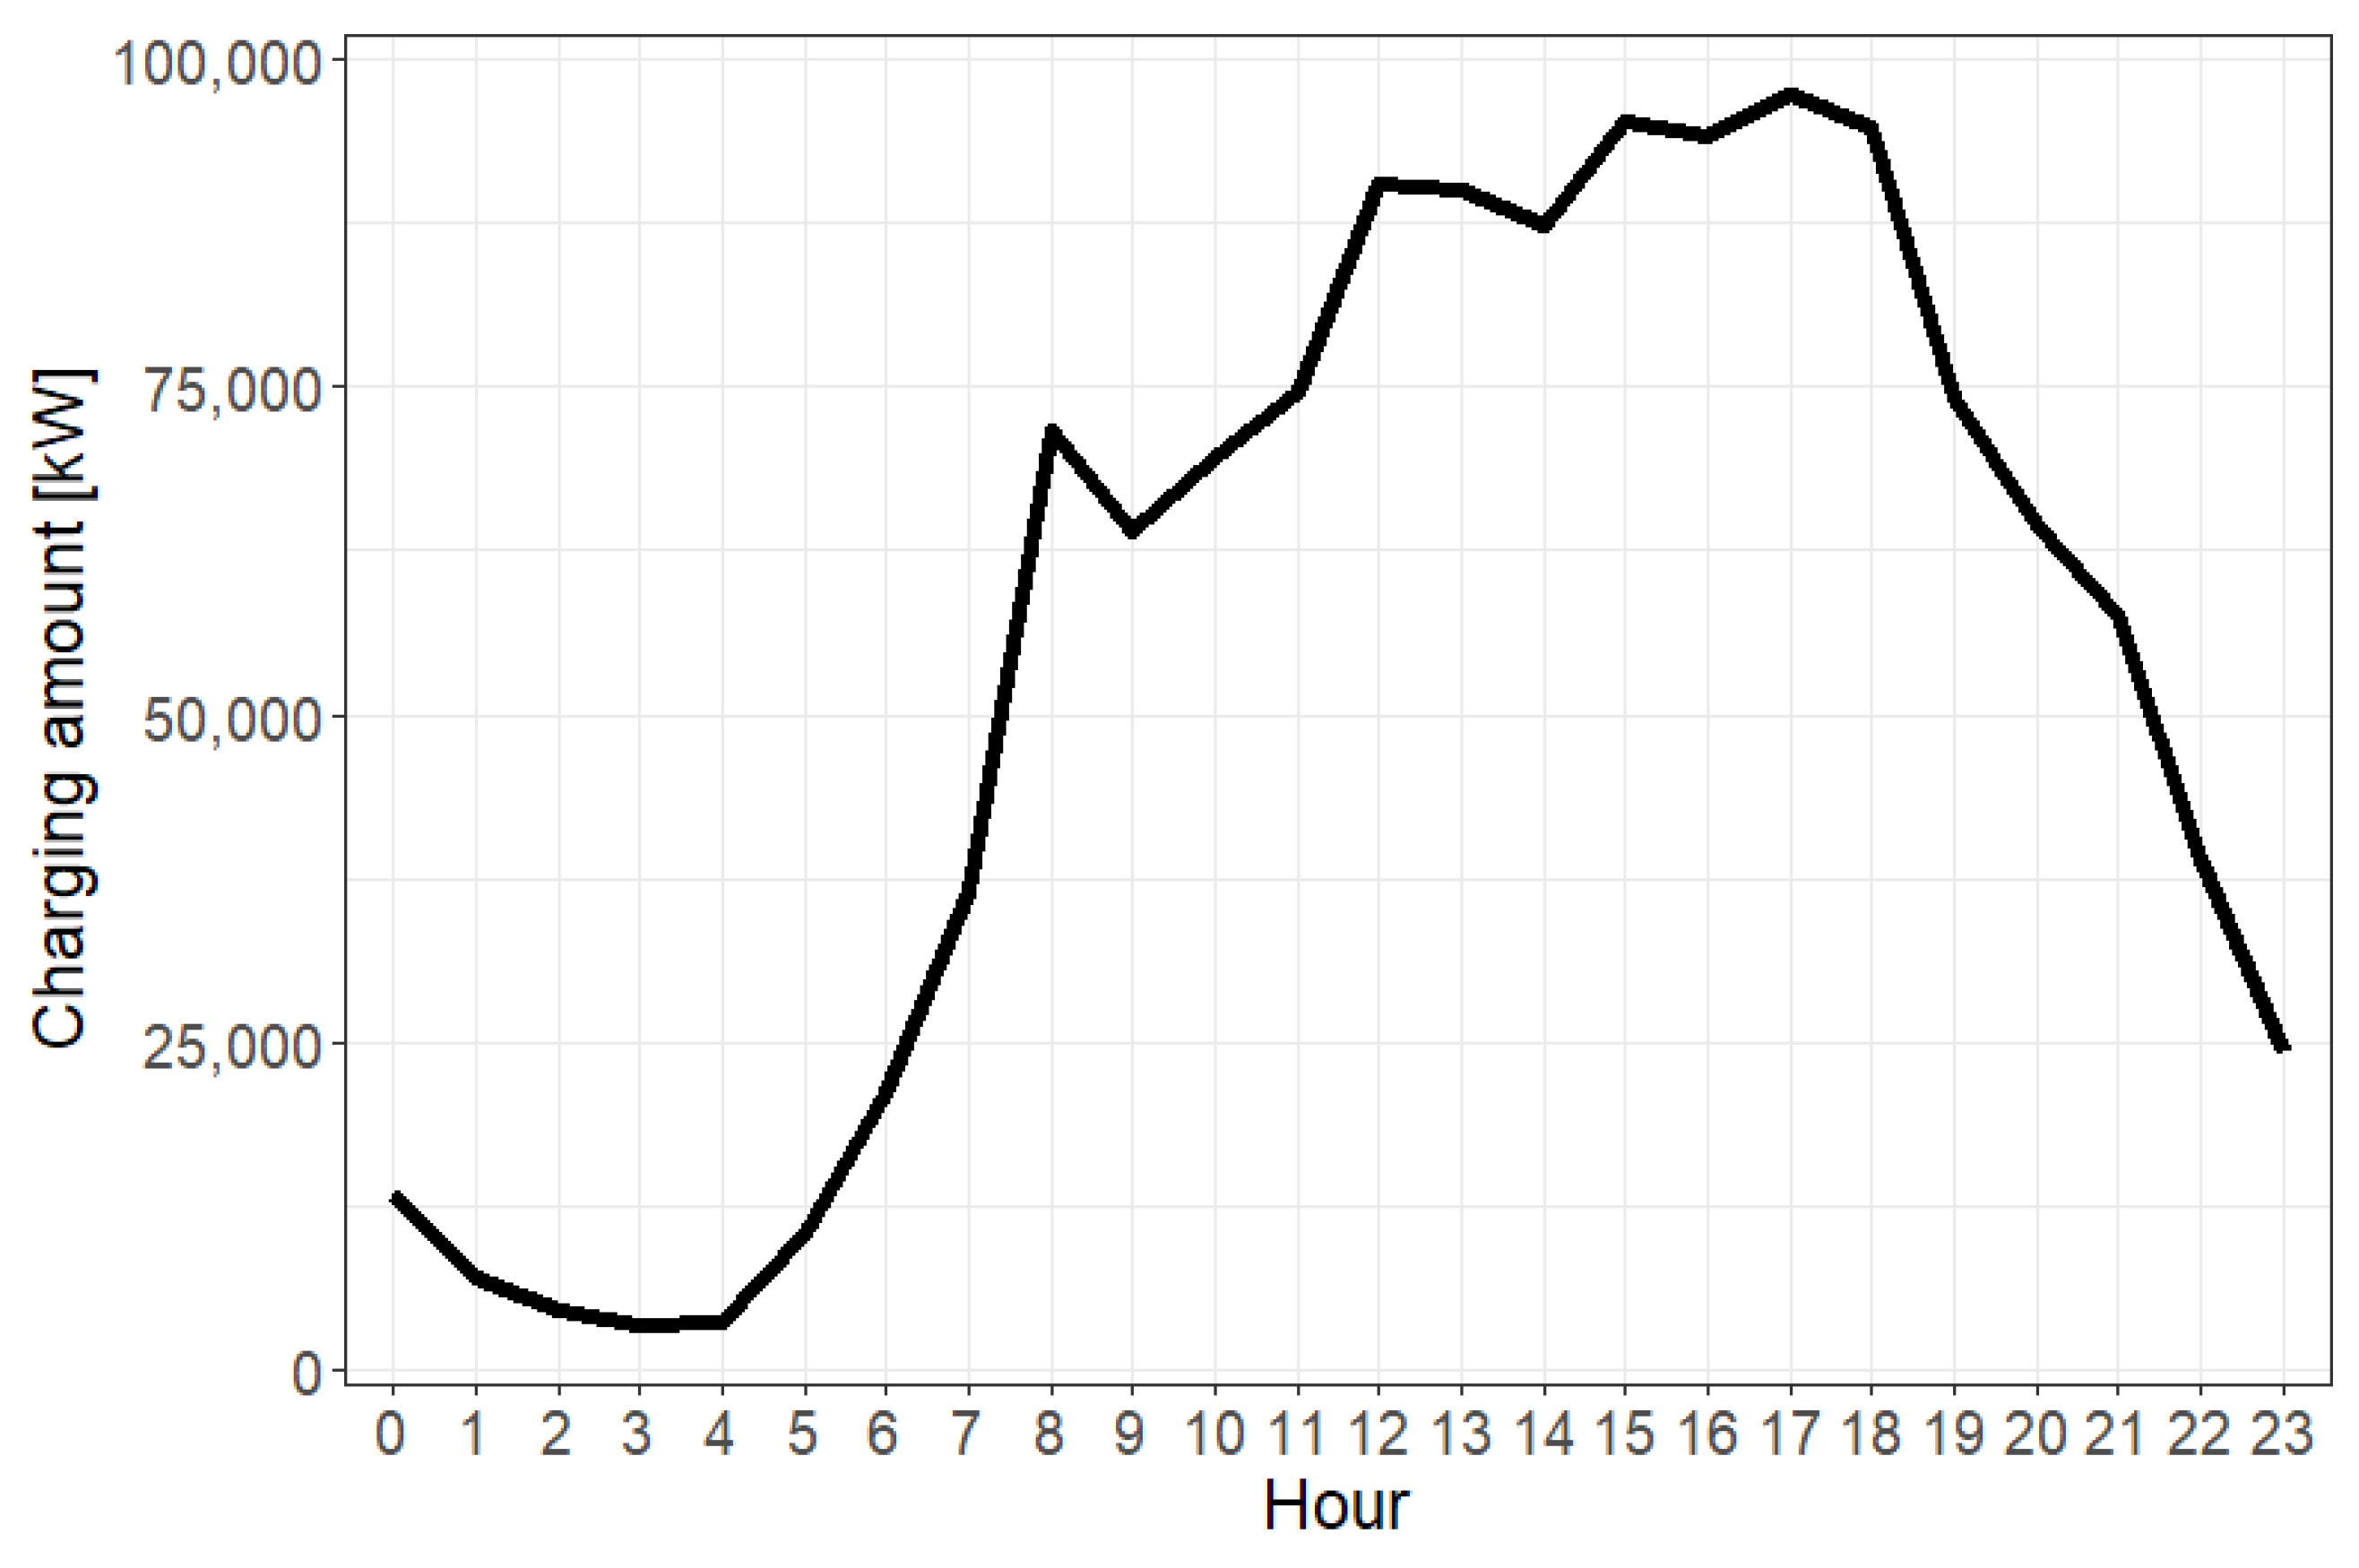
where i is the element of G, a set of EV types, is year Y’s hourly EV charging power demand at time t (kWh/h), is the average charging amount of type-i EVs at time t (kWh/h), represents year Y’s number of EVs, and is the proportion of type-i EVs in year Y (in percent). The resulting hourly EV charging pattern for a day in 2030 can be forecast as shown in Figure 5. The EV charging peak appears at 18:00, which is the same as Jeju’s grid peak hour in 2017. The peak power at 18:00 in 2030 is forecasted as 94,766 kW.
2.4. EV Charging Station Installation
As of December 2017, EV chargers in Jeju consist of 86% for personal use and 14% for commercial use. All of the personal use chargers are slow chargers and are not the target of this study. Commercial chargers consist of 649 slow and 374 fast chargers. In 2030, all slow chargers will be used only for personal use, and 4353 fast chargers will be installed for commercial use. The capacities of slow and fast chargers are 7–8 kW, and 50 kW, respectively, in 2017. However, it is expected that the capacity of fast chargers will increase to meet the EV battery capacity increase mostly as a result of cost reduction. In this study, it is assumed that the capacity of a fast charging station reaches 150 kW. This is a reasonable assumption given the forecasted EV battery size [41].
3. EV Station Operation to Reduce EV Charging Peak
As described above, the considered EV charging power accounts for 8.4% of Jeju’s total peak power in 2030. This could have a huge impact on power grid operation without anything being done to improve the situation. In this study, an idle charging station utilization approach is applied to reduce the impact on the power grid caused by EVs.
3.1. Idle EV Charging Station Estimation
To analyze the EV station status, the total capacity available for V2G and the state of the EV station are measured. The total EV charging capacity, can be calculated from the number of supplied chargers, , and the power consumption per charger, , as follows:
The charging capacity of EV chargers is expected to be 150 kW in 2020 (up from the current value of 50 kW) [44]. The total EV charging capacity, , is estimated as 653,100 kW given the EV charger supply plan in Jeju [1].
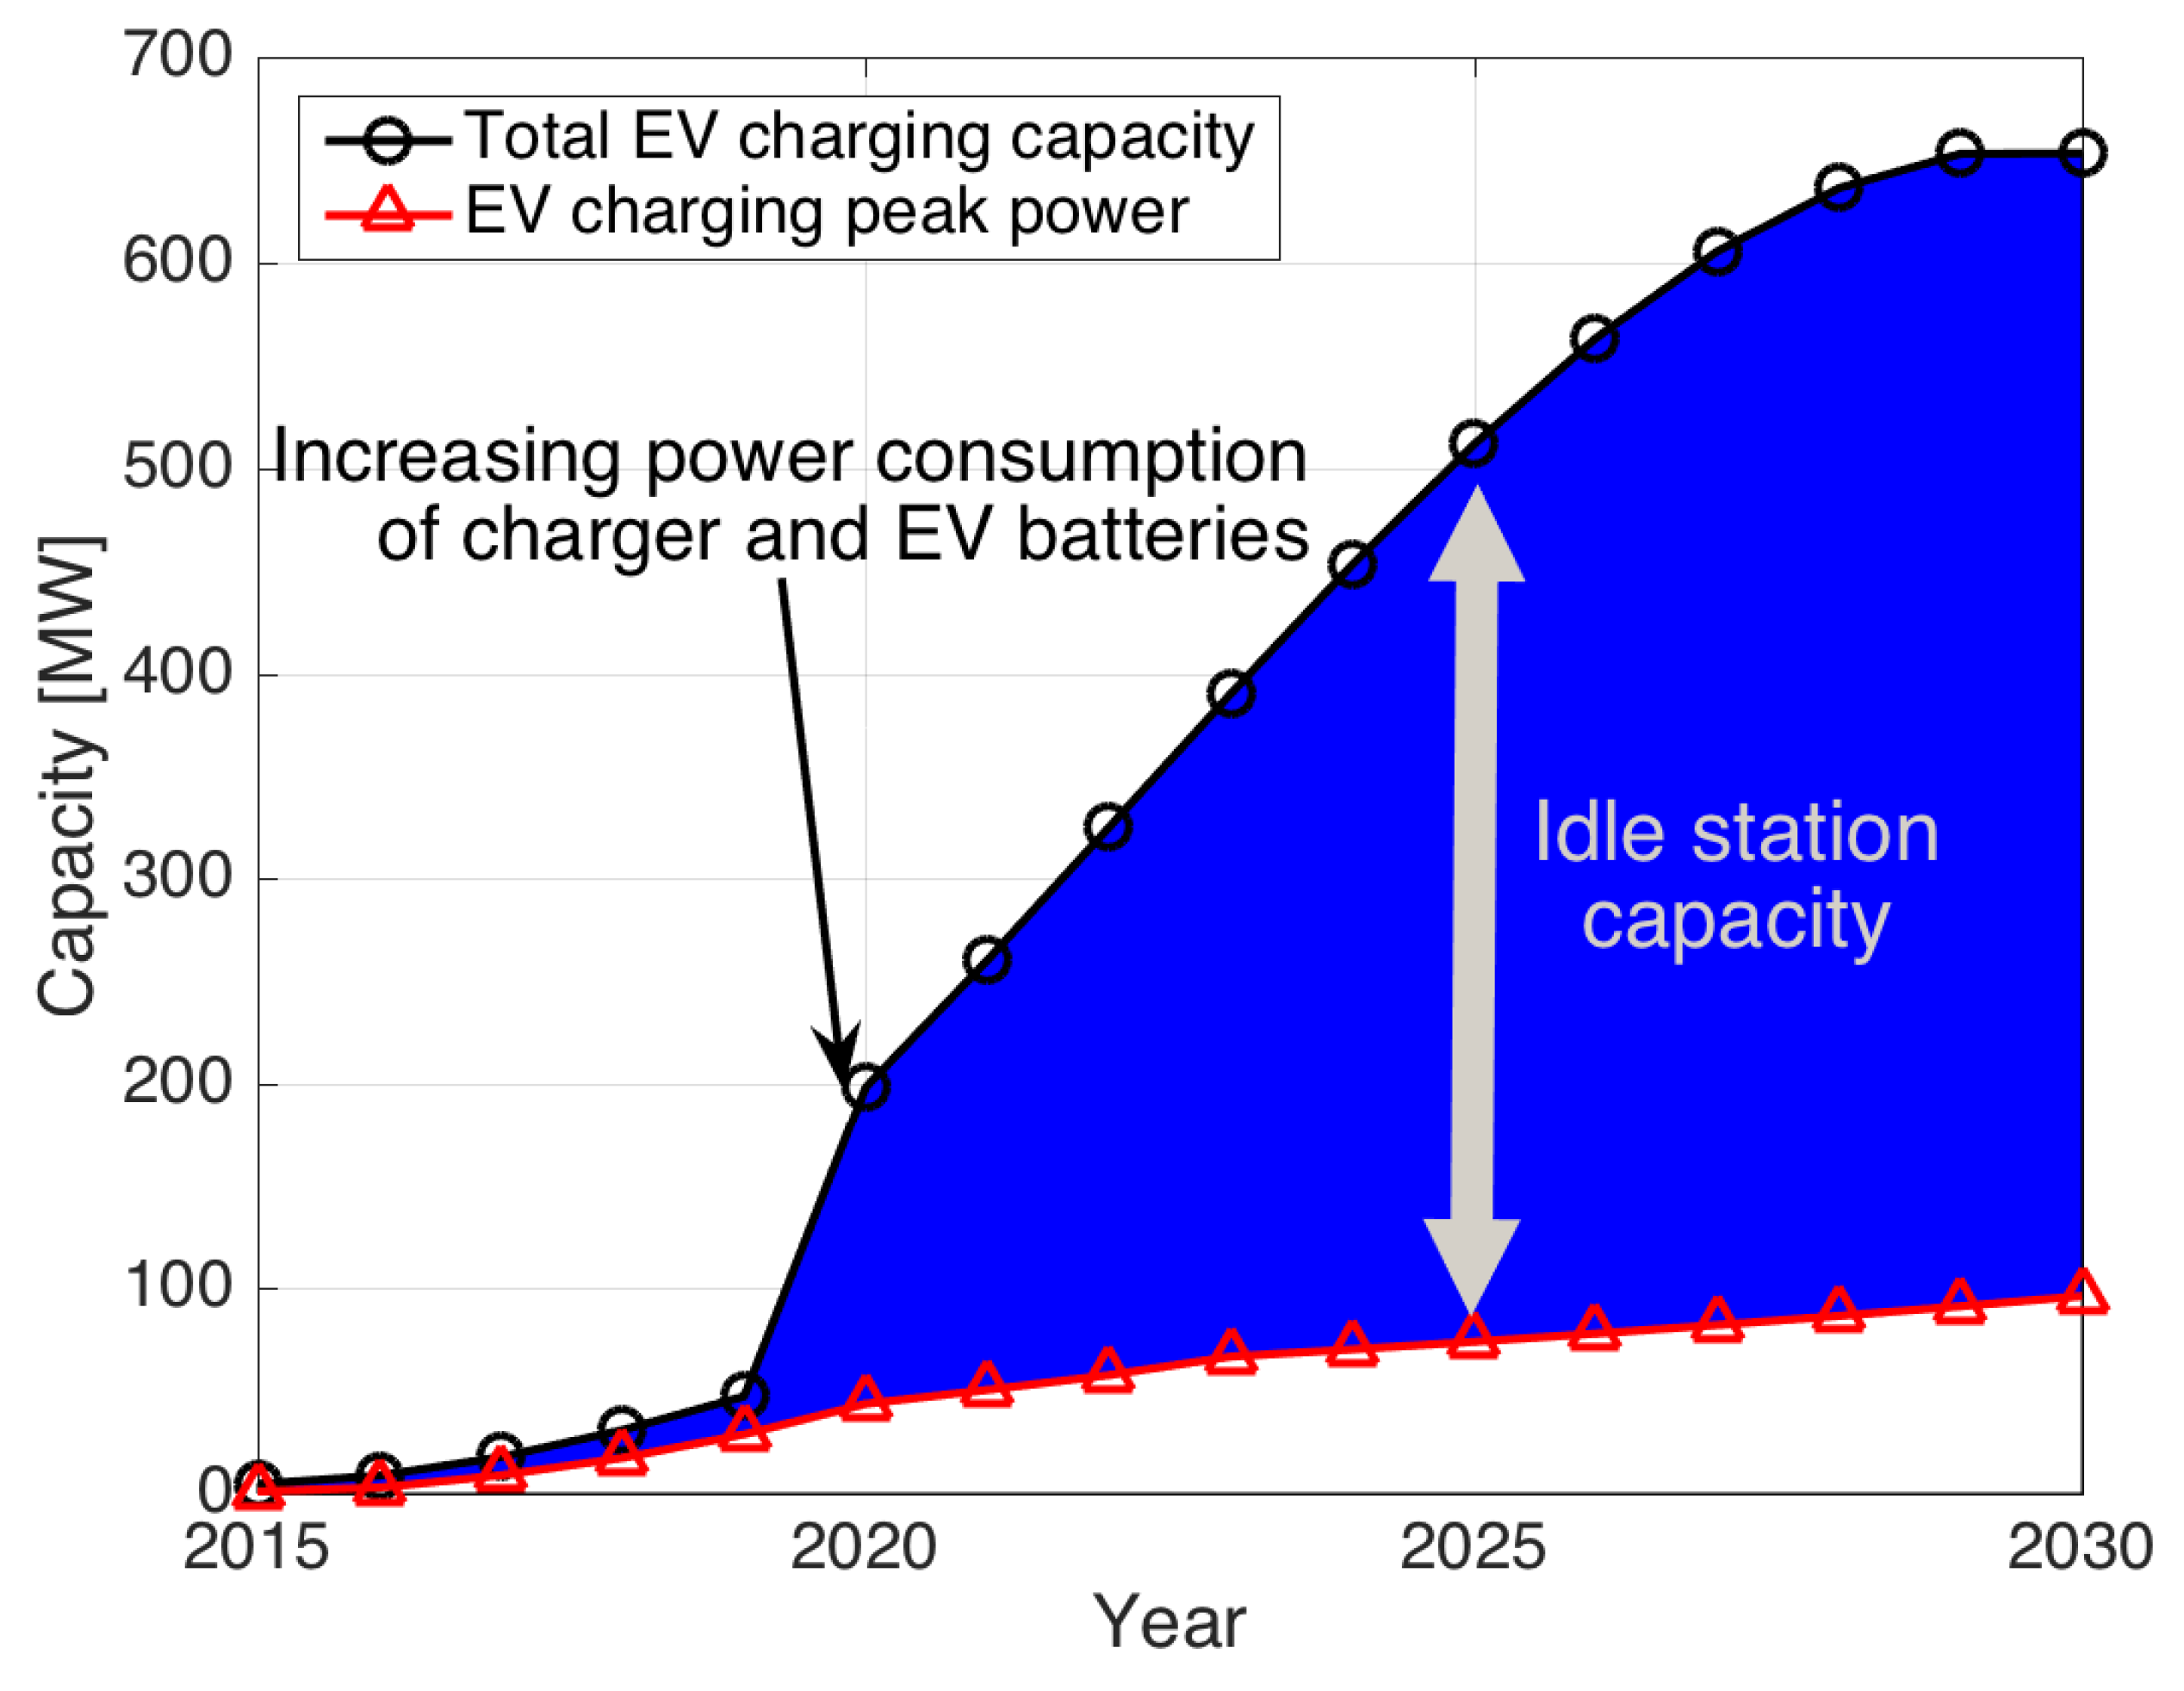
The amount of idle station capacity in year Y at time t, , is the remaining capacity excluding EV charging power :
The total idle station capacity for each year is estimated as the blue range in Figure 6 according to the number of EVs and EV station supply plan. The Jeju EV charging power at peak time is approximated as 94,766 kW in 2030, so the total idle station capacity is 558,334 kW. This means that a maximum of 83% of chargers can be used for V2G operation during peak times.
Erlang’s formula with parallel servers was applied to analyze the state of the EV station according to EV arrivals with a Poisson process and a Weibull distributed charging time [45]. The number of servers, r, becomes the EV station number, e.g., 4350 in the 2030 Jeju scenario. Considering the characteristics of EV type, the arrival rate and service time of EV type m is expressed as and . The total arrival rate is denoted . The arrival rate and service time are determined in relation to the number of EVs, driving pattern and the battery capacity of EV types.
Let , , and be the traffic intensity of station i, the probability all stations are idle, and the probability all stations are busy. The probability an EV of type m is assigned to station i is calculated as
where is the correlation factor related to the number of station, traffic intensity, and station preference. Assuming exponential service times, it is approximated as [46]
Using (4), the intensity of station i is calculated as
and, the average EV station utilization is measured as
In (5) and (7), the average intensity of a station, , is the average intensity of stations measured as the ratio of the mean arrival rate over the mean service time,
The state of station could be iteratively measured with the characteristic and preference of each EV using from (4) to (7). However, an estimation is required about the individual profile of each EV in 2030. To show the overall performance, the state of station could be analyzed using the average intensity of a station in (8).
For Jeju in 2030, the average number of charged EVs becomes 2507 at peak time. Based on that, the mean arrival rate of EVs and mean service time at a station are and , respectively. So, the average intensity of a state in the 2030 Jeju scenario with is 0.15. This tells us that the probability that the station is empty for V2G operation during peak times becomes 85%, which is the same as mentioned above.
In addition, the state of a station is changed by V2G. To show the effect of EV by V2G, the average waiting time for an EV in an EV charging station is calculated as
and this value approximately becomes 0 in the 2030 Jeju scenario. These results show that EV charging stations have enough capacity to use V2G.
3.2. Idle EV Charging Station Operation Strategy
To utilize an idle EV charging station, V2G technology is applied. The station operator can call available vehicles to idle stations for V2G by proposing incentives to attract vehicle owners. According to the EV charging estimation, <3% of the entire vehicle fleet is being charged at any one time and only 15% of station capacity is occupied during grid peak hour. This means that the number of potential vehicles that can participate in V2G is large enough even if the state of charge and driving status vary and that the number of idle stations is also large enough for V2G operation. This study focuses on the effect of V2G, not the pricing and specific operation algorithms.
4. Case Study
A case study was performed based on Jeju’s EV charging demand forecasting model by using Monte Carlo simulation, which is generally used to obtain numerical results using random sampling [45]. The models obtained earlier on charging distribution and charging amount per visit were applied.
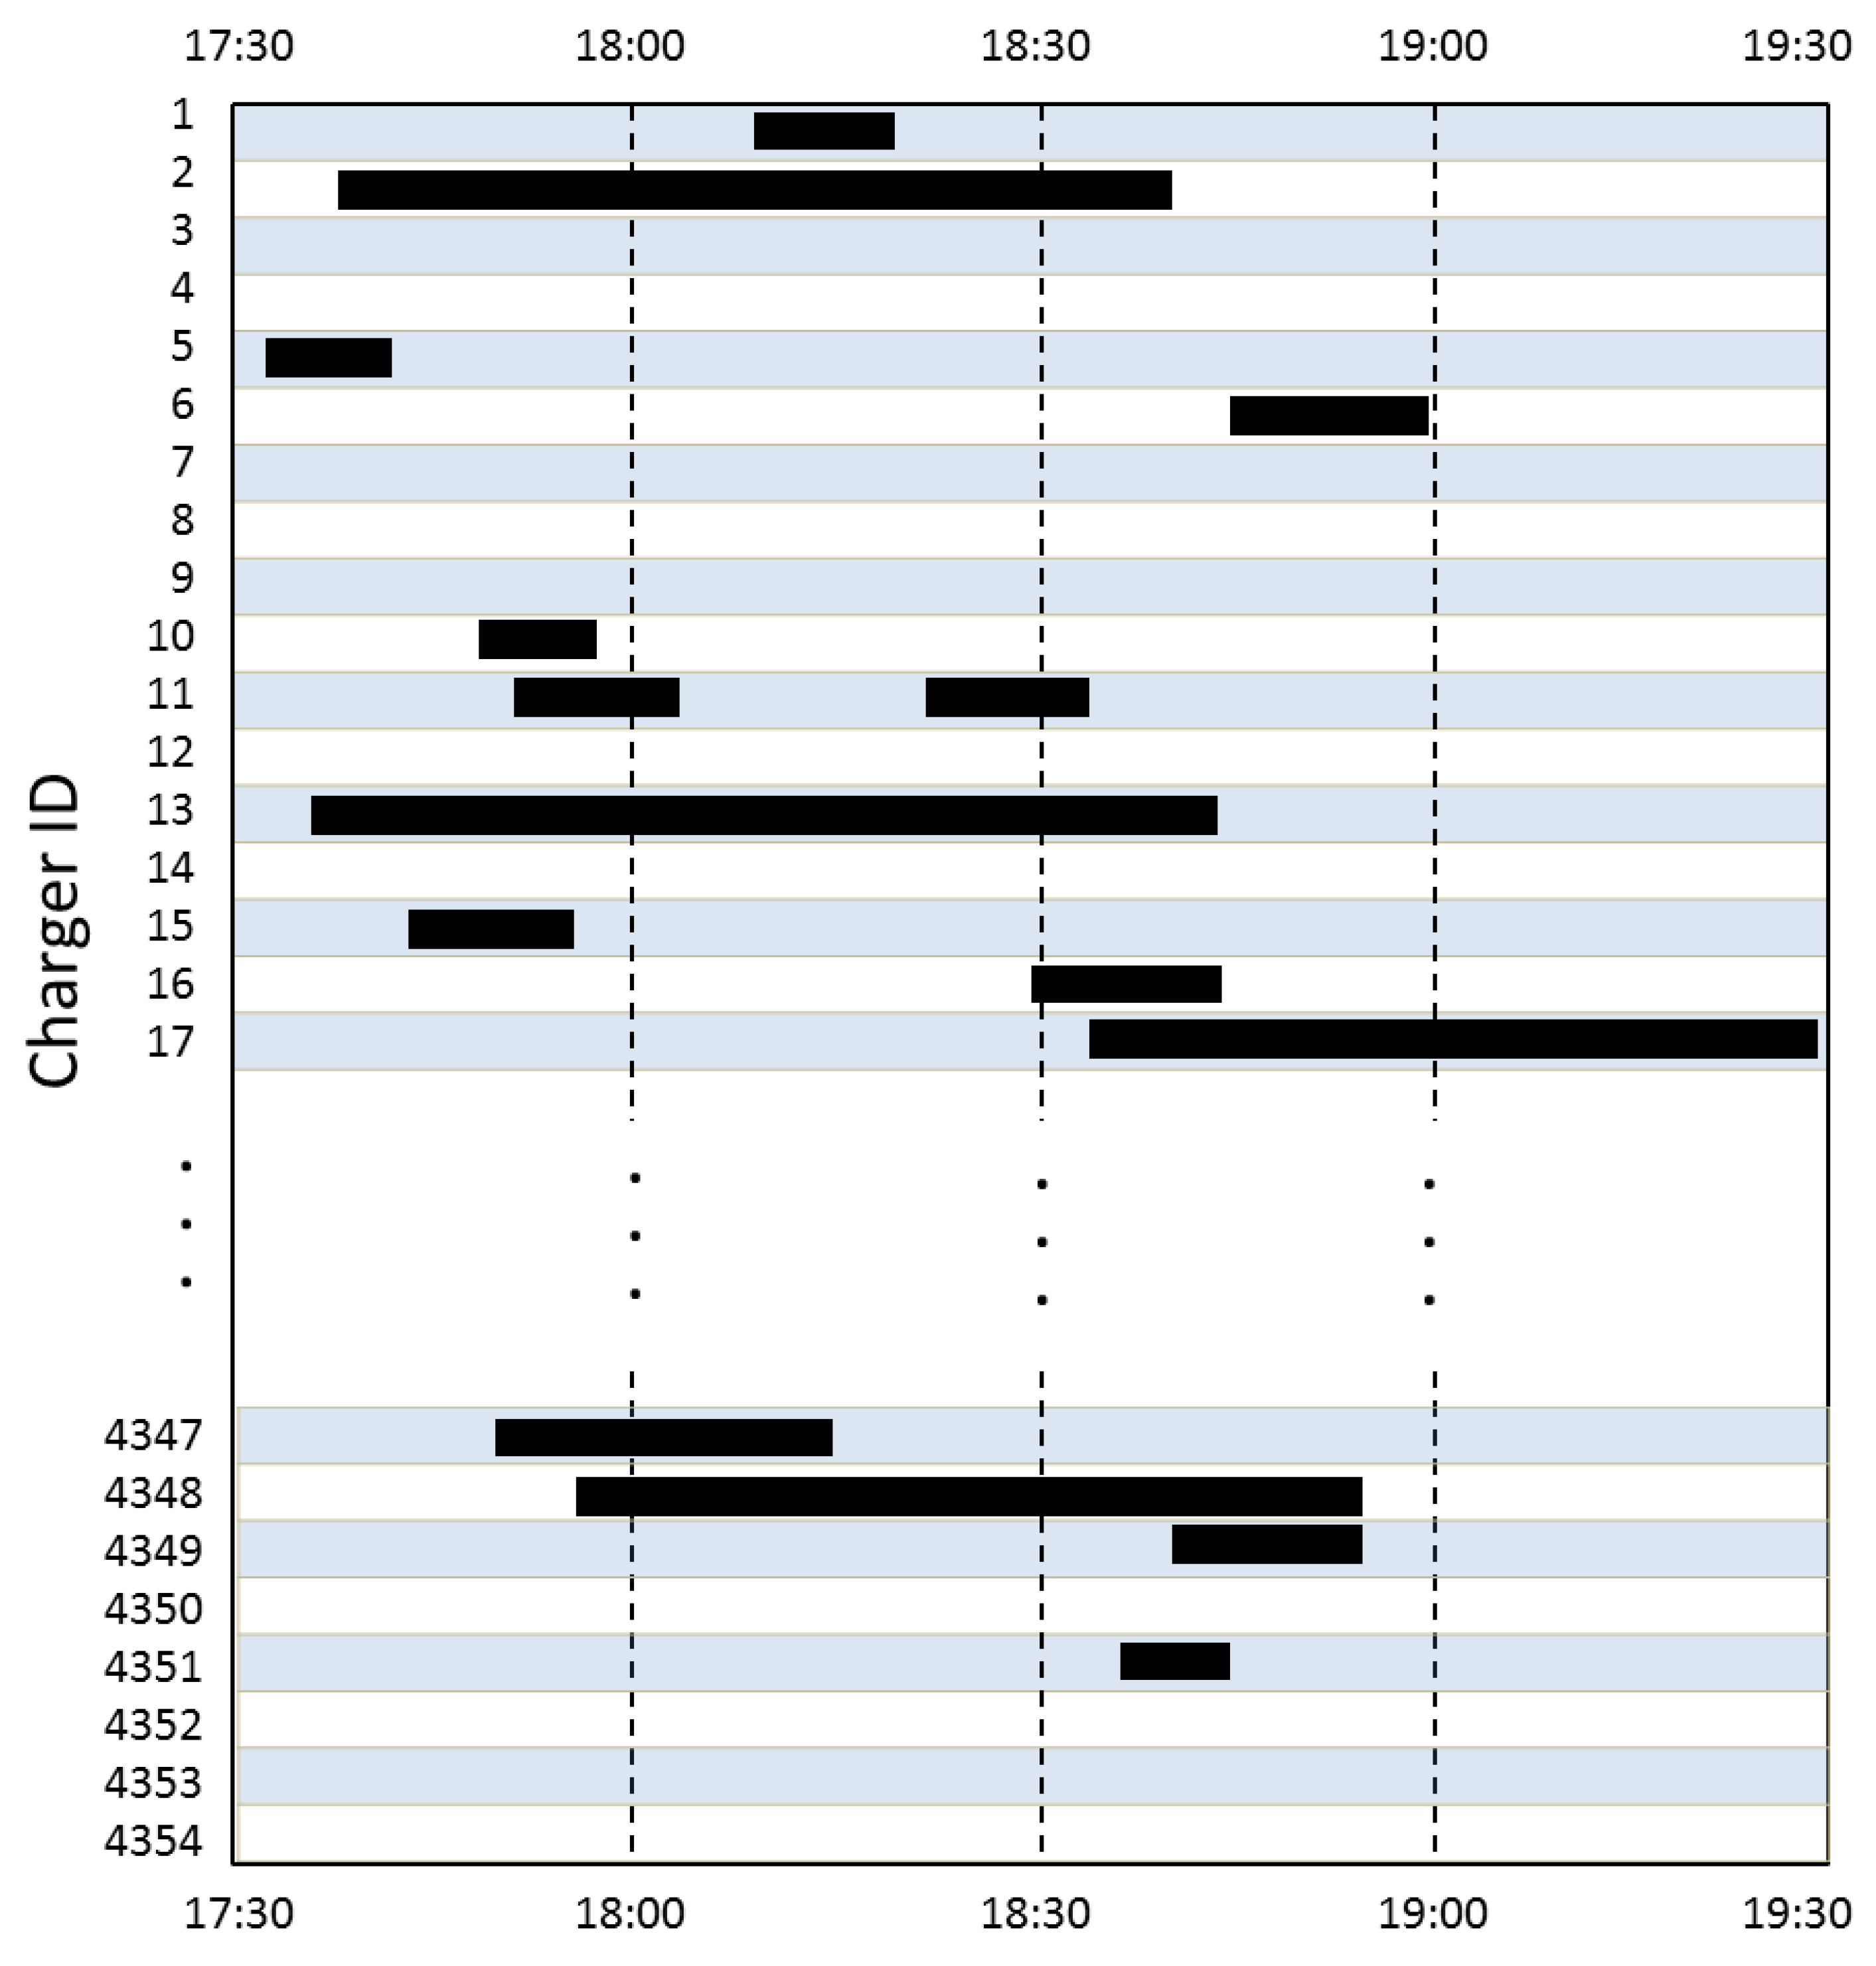
The EV charging simulation was performed for 17:30–19:30 to consider the boundary effect of charging because the expected peak time is 18:00–19:00. The number of charging stations was 4354, and all of them were fast chargers as discussed earlier. The charging distribution model per visit obtained in Section 2.2.1 was applied. The EV battery capacity was set to 90 kWh and the charge and discharge rates were both 1.6, which is same as the current rate as a conservative assumption. A sample of the simulation results is shown in Figure 7. The black lines represent charging. In this case, the peak power was 93,736 kW with a total of 2833 visits during 18:00–19:00.
For V2G, the V2G capacity per visit was set to 37.8 kWh, which is the same amount of anticipated average charge per visit in 2030; 15.1 min of interconnection time is required for pure power provisioning. In this case study, an extra 10 min time was added for V2G to facto in spare time. That means at least 25 min is required to use an idle charging station for V2G. The maximum number of vehicles required for V2G is <3000, which is much smaller than the number of EVs in 2030 (377,000). The vehicles required for V2G is thus <0.8% of the entire Jeju EV fleet. Therefore, it reasonable to assume that there are enough V2G participants if the appropriate reward is provided, which is not the focus of this study.
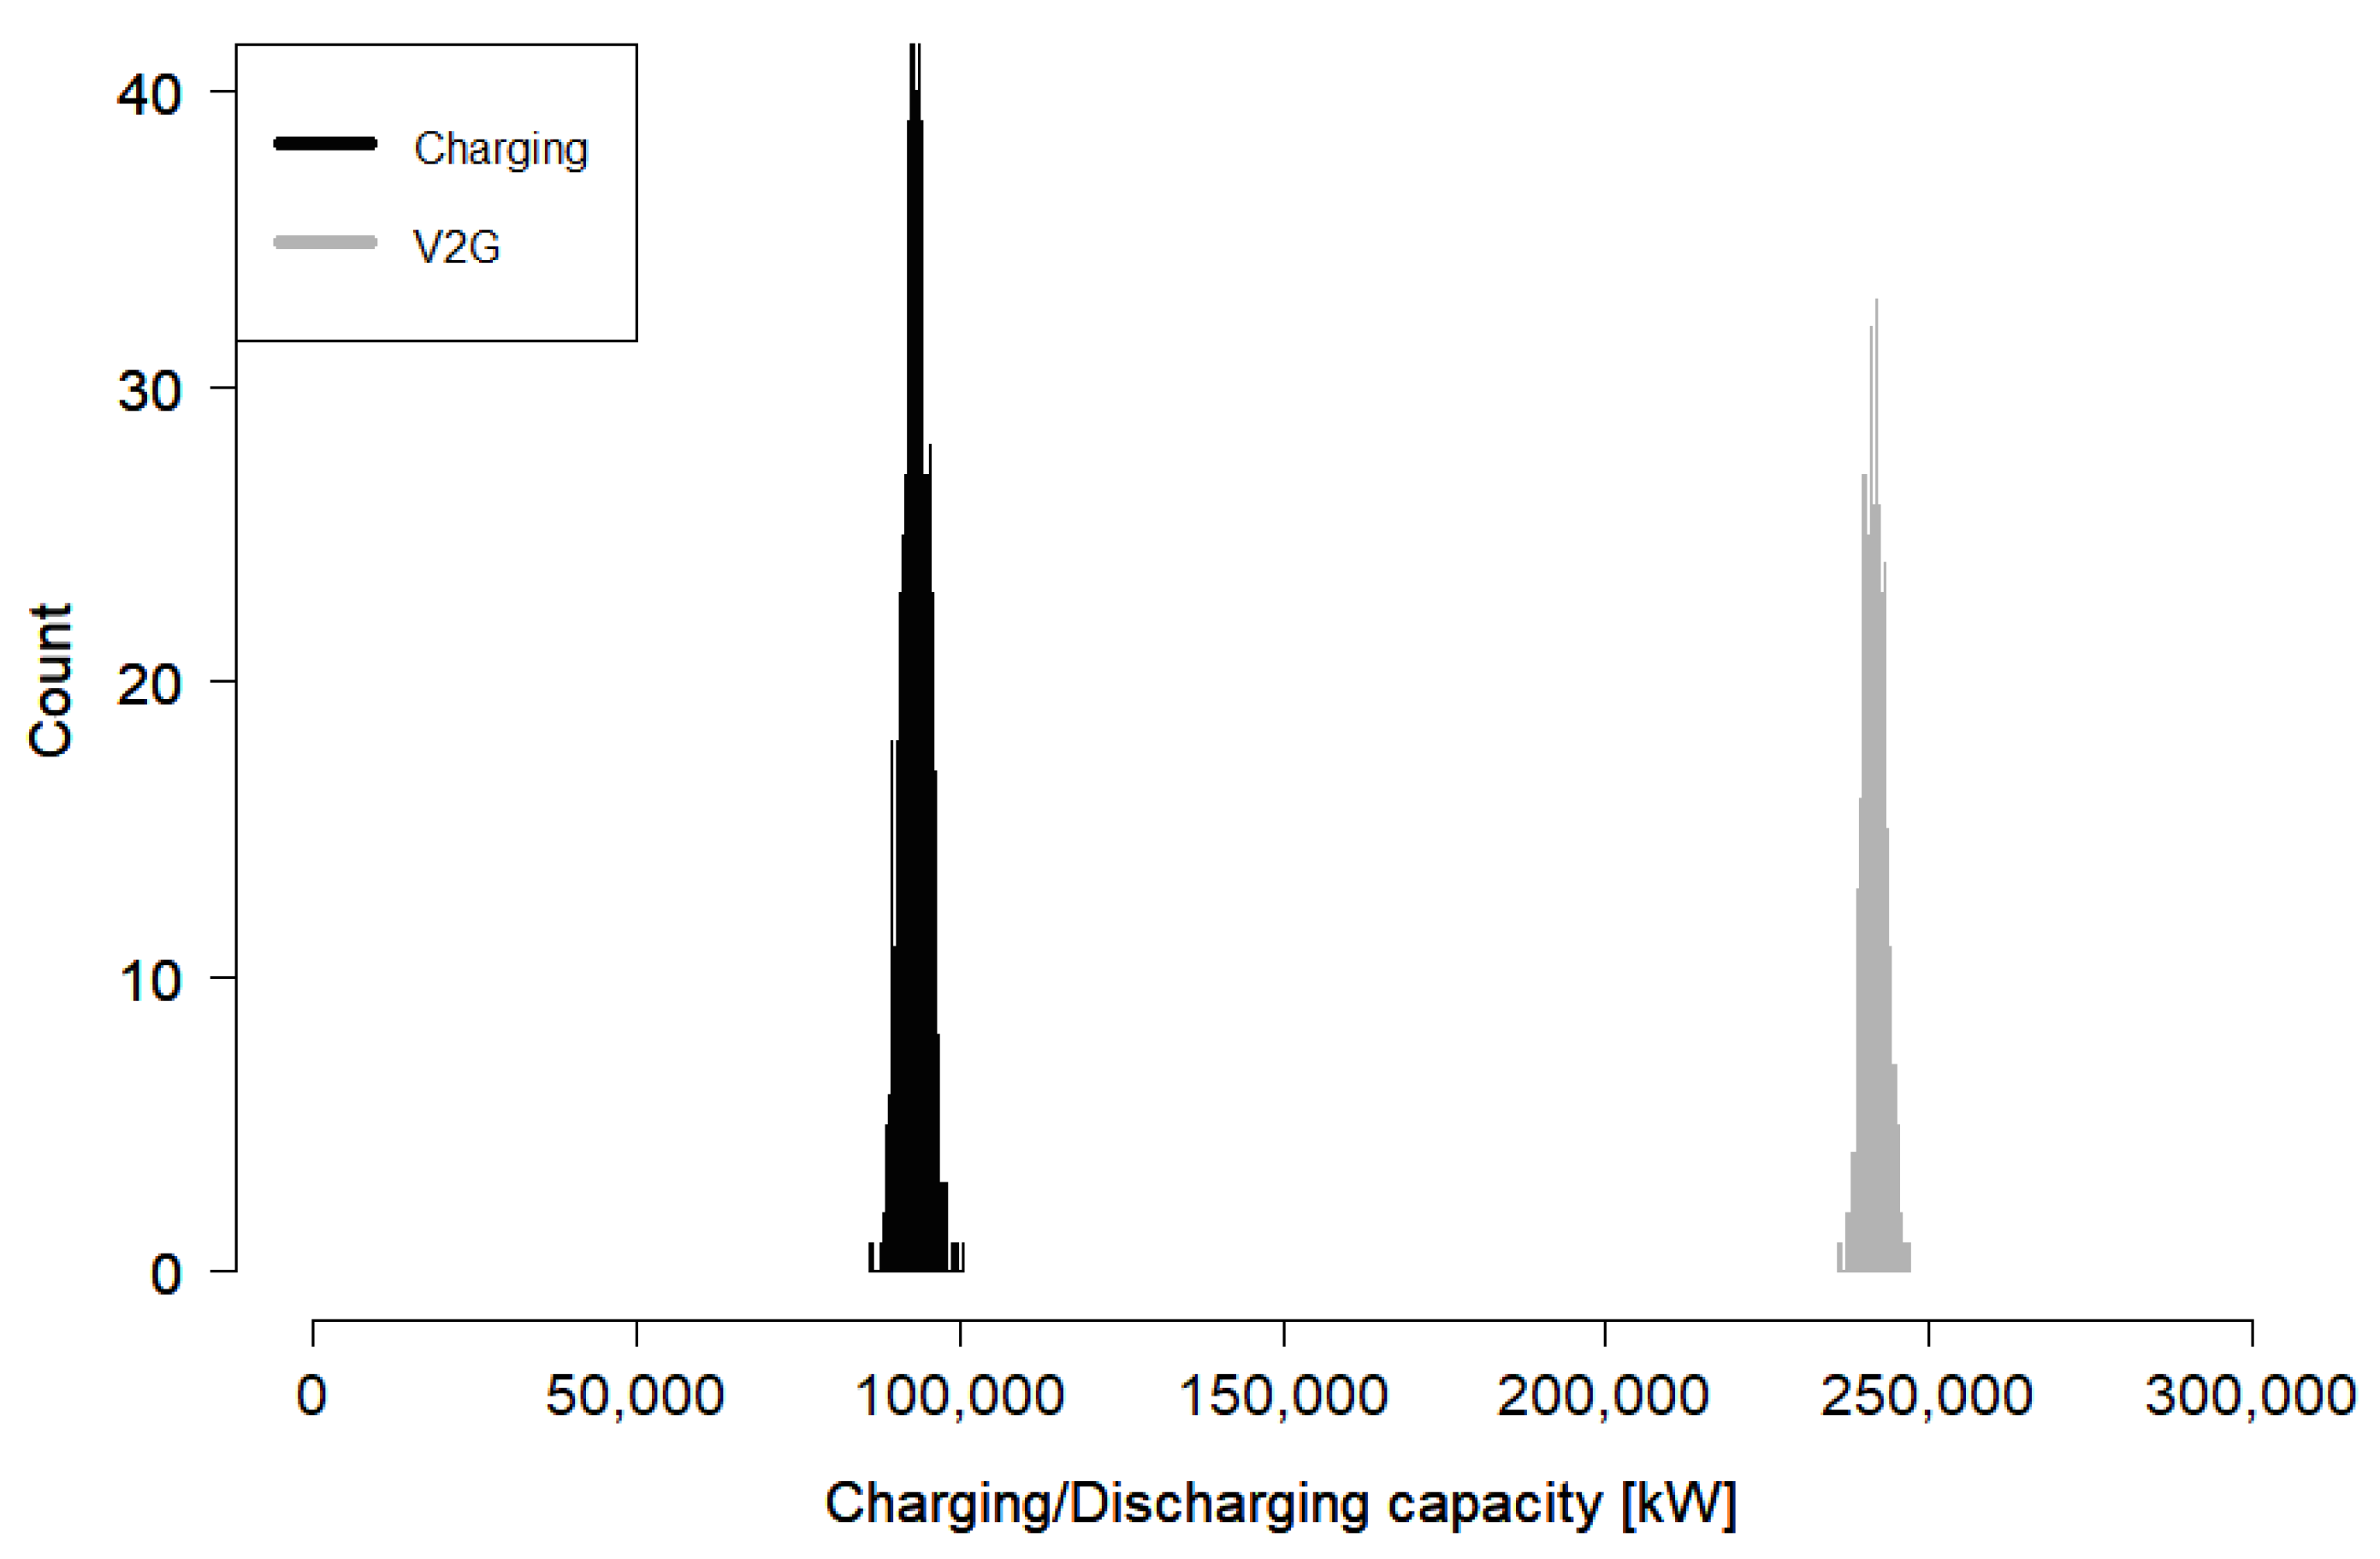
The entire simulation was conducted 1000 times, and the results of charging peak demand and V2G power in the peak hours are shown in Figure 8. The average of the charging peaks is 93,009 kW and V2G power is 241,498 kW. This means that V2G can easily resolve or cancel out the charging demand as usual.
In addition, the sensitivity of varying the number of EV charging stations was addressed. A relative EV station supply ratio of 1 is used according to the current EV station supply plan. These experiments can have an equivalent effect to that of a changing EV supply.
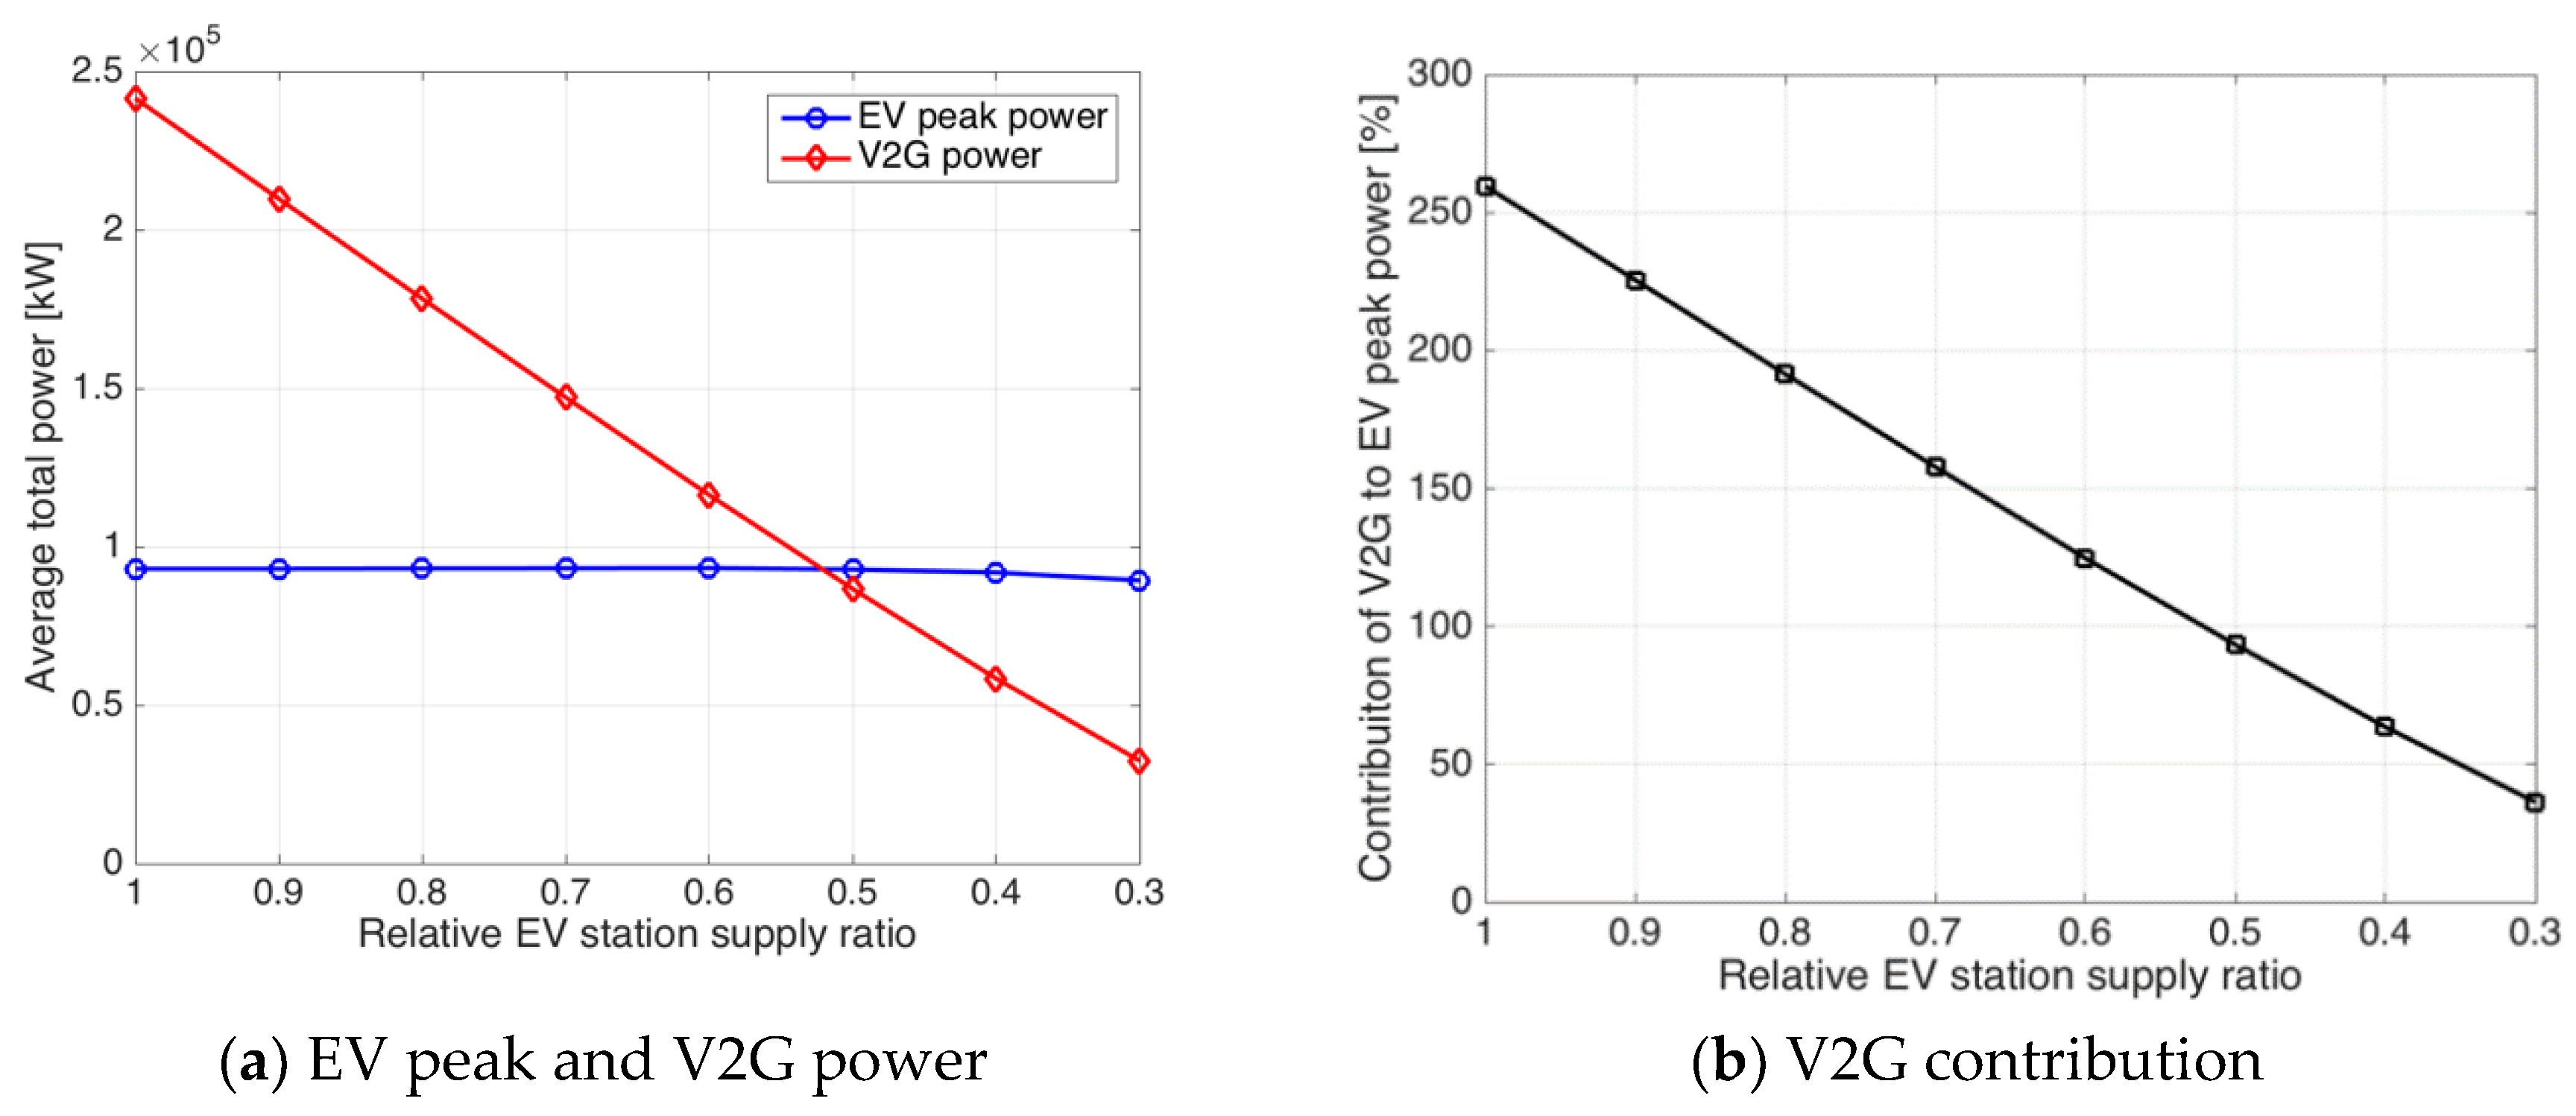
In Figure 9a, the blue line with circles and red line with diamonds present the EV and V2G power at peak time when the relative EV station supply ratio is changed from 1 to 0.3. The V2G power linearly decreases with a reduction in the relative EV station supply ratio. This is because the availability of V2G is related to the number of empty EV stations coupled with the average intensity , as shown in (8). Although EV peak power decreases, the amount is not large. Therefore, the contribution of V2G appears only as the V2G power decrease shown in Figure 9b. However, even if the EV station supply is reduced to about 50% of the current scenario, the effect of EV charging at peak time can be alleviated by V2G.
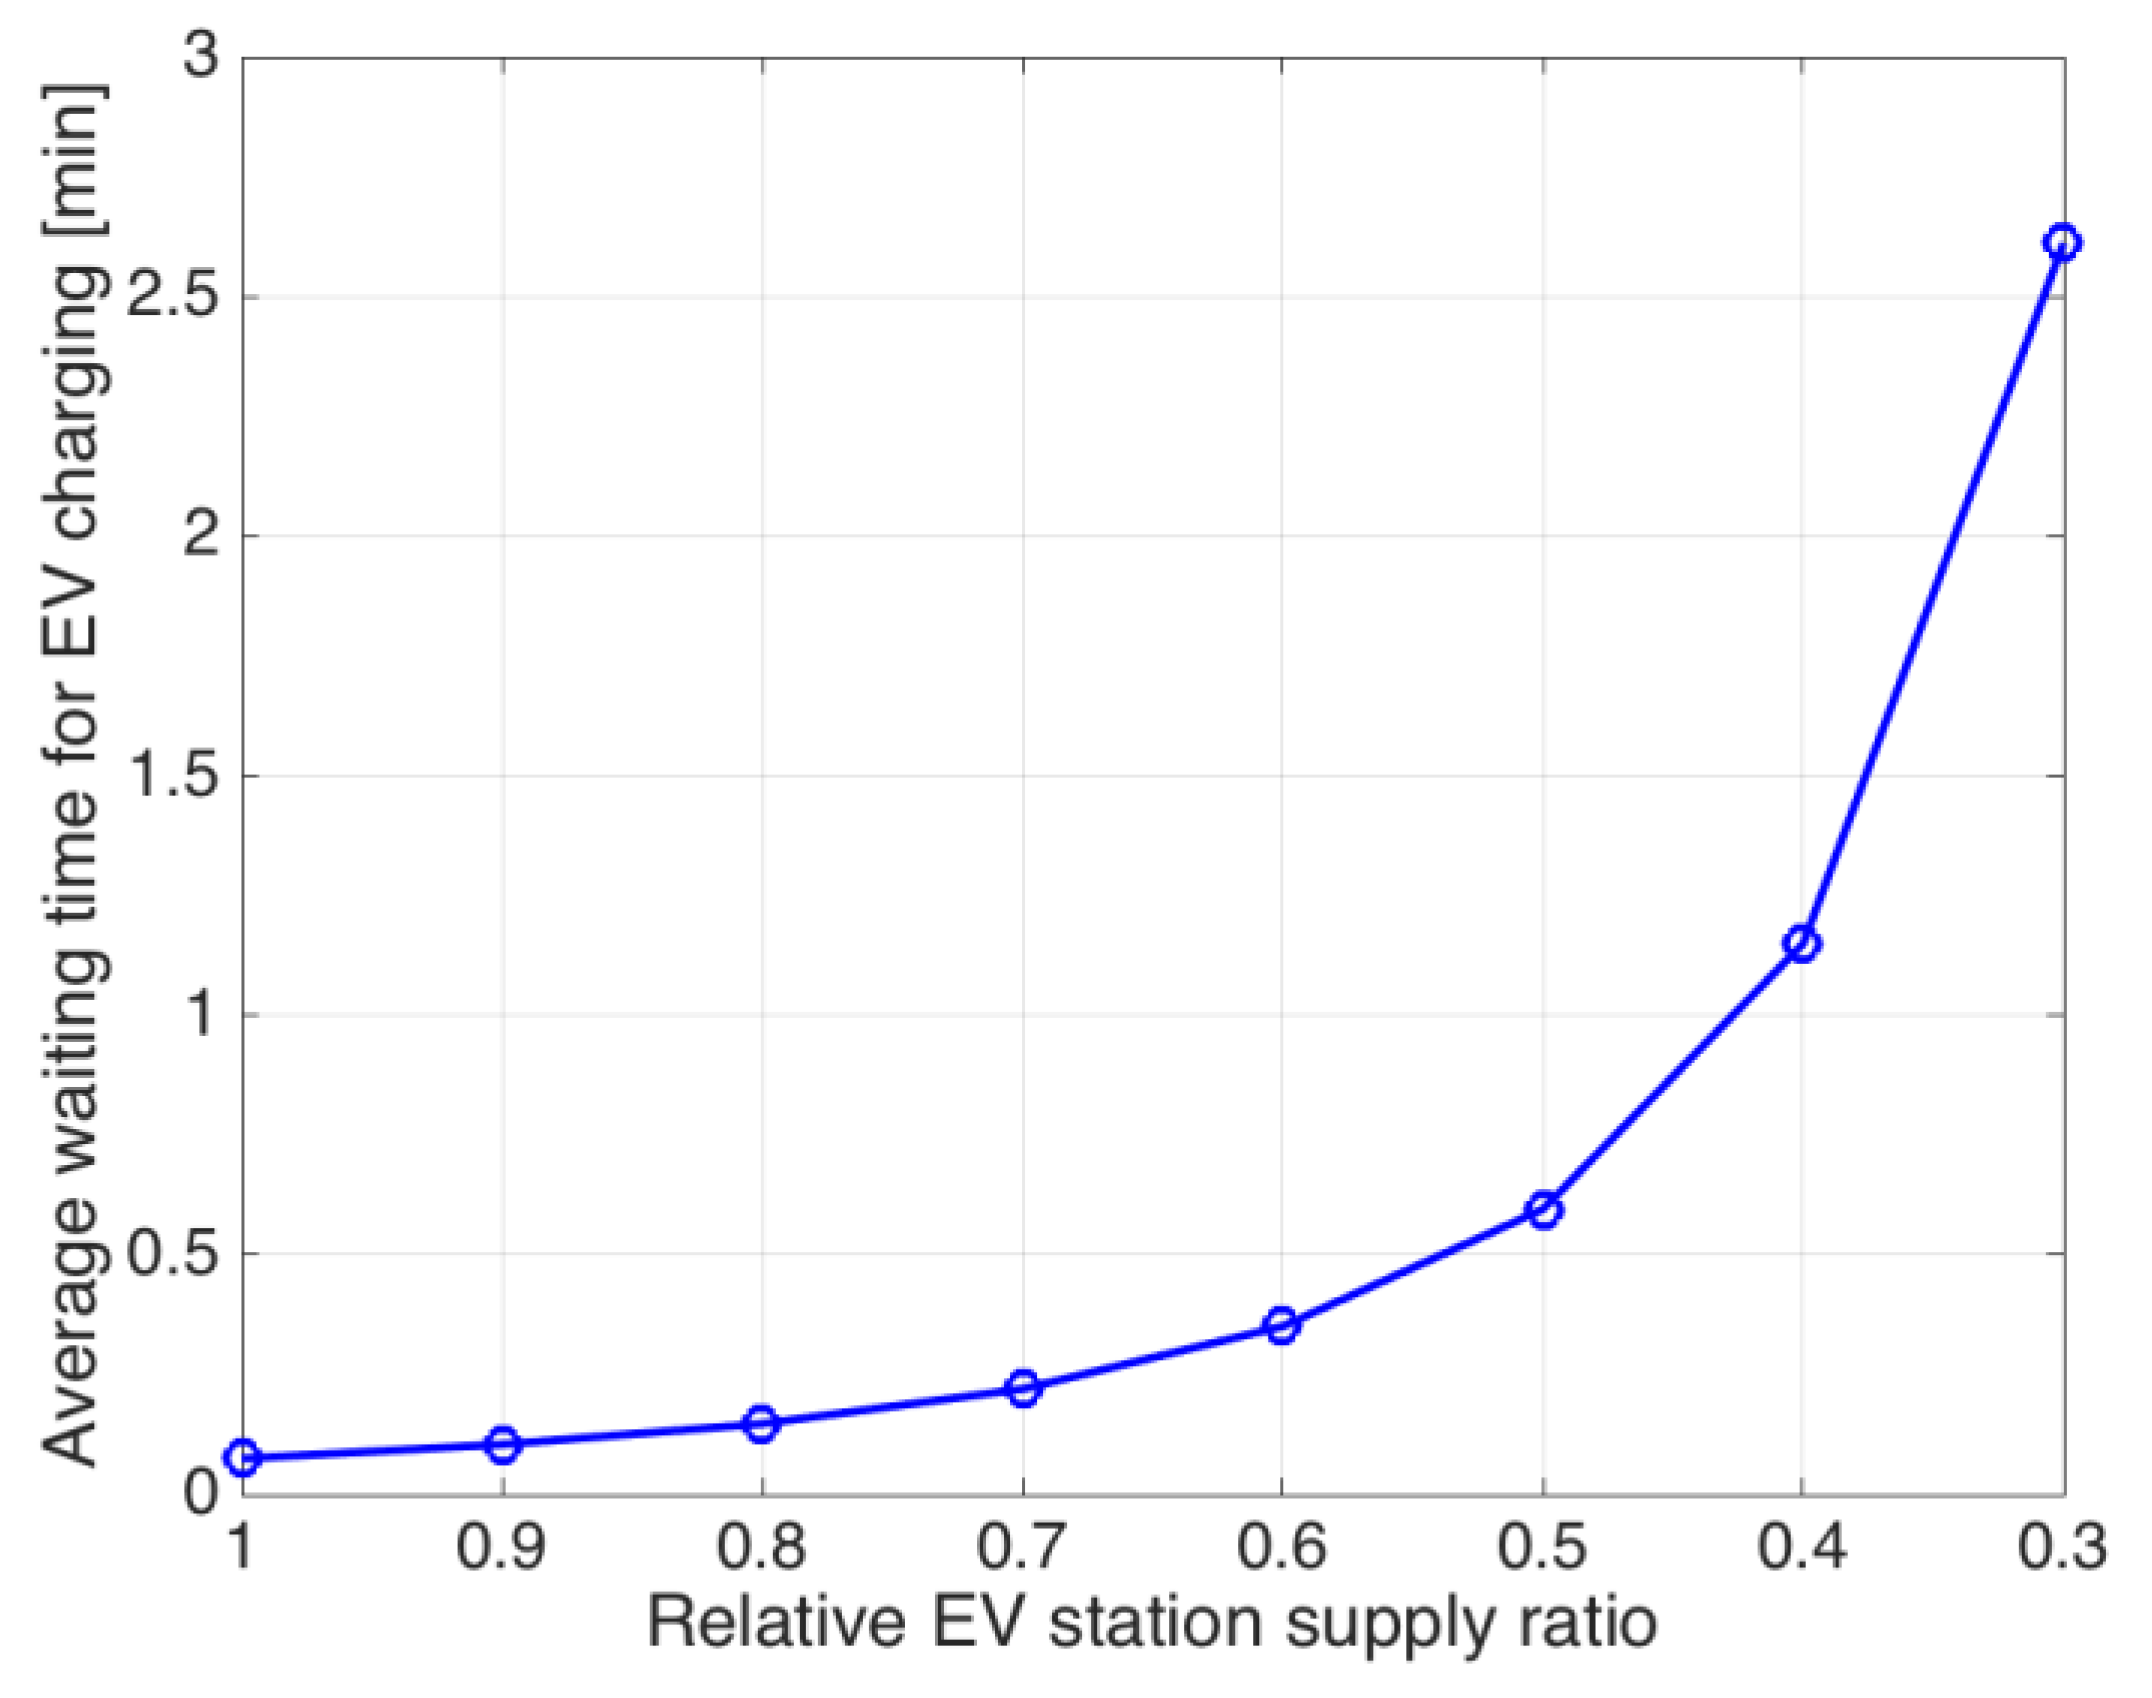
Figure 10 shows the average waiting time for EV charging according to the relative EV supply ratio. It expresses why the EV peak power is reduced with the relative EV station supply ratio reduction in Figure 9a. If the EV station is less supplied than the plan, the mean arrival rate of an EV, , will increase and the average waiting time for EV charging would grow exponentially according to (9). However, if the supply of the EV station is spread more than 90% of the current plan, the average waiting time for EV charging will increase by less than 50% (from 0.07 min to 0.1 min). Even in this case, V2G can solve the peak power problem caused by EV charging, as shown in Figure 9b.
5. Conclusions
In this study, the annual charging power demand and peak power generated by EVs distributed in Jeju in 2030 were predicted. Then, to resolve the grid peak power increase by EVs, V2G utilizing idle charging stations was proposed. To forecast the impact of V2G, a Monte Carlo simulation was performed by using the EV charging distribution model obtained from the current EV charging data. As a result, it was proven that the grid peak increase by EV charging can be easily resolved or canceled out by utilizing V2G with idle charging stations. In addition, by performing a sensitivity analysis for EV and charging station supply changes, it was also shown that the approach is effective.
This paper introduced the guidance to V2G utilizing idle charging stations. This research will be extended with several problems for future study. First this study analyzed the overall performance with average values. The study will be extended considering the effect exerted by the characteristics and preference of each EV type and station. Similarly, this study used the profile in the EV charger supply plan. The study will be researched according to the demand pattern modeling and supply forecasting with the EV ecosystem deployment.
Author Contributions
S.-Y.S. conceptualized and designed the structure of the manuscript. H.H. and E.O. performed data analysis and investigation. H.H. wrote the original draft, and E.O. and S.-Y.S. reviewed and edited the manuscript. All the authors have read and approved the final manuscript.
Funding
This research was funded by the Korea Institute of Energy Technology Evaluation and Planning (KETEP) and the Ministry of Trading, Industry & Energy (MOTIE) of the Republic of Korea (No. 20174030201470 and 20151210200240).
Conflicts of Interest
The authors declare no conflict of interest.
References
- Electric Vehicle Mid and Long-Term Mater Plan (2015–2030). Available online: https://www.jeju.go.kr/files/convert/201611/5d537e85-572b-4db1-977f-6c3f7738dca8.pdf.htm (accessed on 23 June 2018).
- Mao, T.; Lau, W.H.; Shum, C.; Chung, H.; Tsang, K.F.; Tse, N.C.F. A Schedule-control Aided Strategy for Charging Large Number of EVs under Normal and Line Failure Scenarios. IEEE Access 2017, 5, 10846–10857. [Google Scholar] [CrossRef]
- Huber, M.; Trippe, A.; Kuhn, P.; Hamacher, T. Effects of Large Scale EV and PV Integration on Power Supply Systems in the Context of Singapore. In Proceedings of the 3rd IEEE PES Innovative Smart Grid Technologies (ISGT Europe), Berlin, Germany, 14–17 October 2012; pp. 1–8. [Google Scholar]
- Shareef, M.; Islam, M.; Mohamed, A. A Review of the Stage-of-the-art Charging Technologies, Placement Methodologies, and Impacts of Electric Vehicles. Renew. Sustain. Energy Rev. 2016, 64, 403–420. [Google Scholar] [CrossRef]
- Price, A. Study of the Impact and Mitigation Measures Associated with Widespread Electric Vehicle Use in an Urban Electricity Network. Master’s Thesis, University of Strathclyde Engineering, Glasgow, Scotland, 2016. [Google Scholar]
- Cheng, L.; Chang, Y.; Huang, R. Mitigating Voltage Problem in Distribution System with Distributed Solar Generation Using Electric Vehicles. IEEE Trans. Sustain. Energy 2015, 6, 1475–1484. [Google Scholar] [CrossRef]
- Reiner, U.; Elsinger, C.; Leibfried, T. Distributed Self Organising Electric Vehicle Charge Controller System: Peak power demand and grid load reduction with adaptive EV charging stations. In Proceedings of the IEEE International Electric Vehicle Conference, Greenville, SC, USA, 4–8 March 2012; pp. 1–5. [Google Scholar]
- Hoog, J.; Alpcan, T.; Brazil, M.; Thomas, D.A.; Mareels, I. A Market Mechanism for Electric Vehicle Charging Under Network Constraints. IEEE Trans. Smart Grid 2016, 7, 827–836. [Google Scholar] [CrossRef]
- Xie, D.; Chu, H.; Gu, C.; Li, F.; Zhang, Y. A Novel Dispatching Control Strategy for EVs Intelligent Integrated Stations. IEEE Trans. Smart Grid 2017, 8, 802–811. [Google Scholar] [CrossRef]
- Chaudhari, K.; Ukil, A.; Kumar, K.N.; Manandhar, U.; Kollimalla, S.K. Hybrid Optimization for Economic Deployment of ESS in PV Integrated EV Charging Stations. IEEE Trans. Ind. Inform. 2018, 14, 106–116. [Google Scholar] [CrossRef]
- Ugirumurera, J.; Haas, Z.J. Optimal Capacity Sizing for Completely Green Charging Systems for Electric Vehicles. IEEE Trans. Transp. Electr. 2017, 3, 565–577. [Google Scholar] [CrossRef]
- Abronzini, U.; Attaianese, C.; D’Arpino, M.; Monaco, M.D.; Tomasso, G. Power Converters for PV Systems with Energy Storage: Optimal Power Flow Control for EV’s Charging Infrastructures. In Proceedings of the PCIM Europe 2016, International Exhibition and Conference for Power Electronics, Intelligent Motion, Renewable Energy and Energy Management, Nuremberg, Germany, 10–12 May 2016; pp. 1–7. [Google Scholar]
- Verzijlbergh, R.A.; Lukszo, Z.; Ilić, M.C. Comparing Different EV Charging Strategies in Liberalized Power Systems. In Proceedings of the 9th International Conference on the European Energy Market, Florence, Italy, 10–12 May 2012; pp. 1–8. [Google Scholar]
- Zhang, P.; Qian, K.; Zhou, C.; Stewart, B.; Hepburn, D. Demand Response for Optimisation of Power Systems Demand due to EV Charging Load. In Proceedings of the Asia-Pacific Power and Energy Engineering Conference, Shanghai, China, 27–29 March 2012; pp. 1–4. [Google Scholar]
- Shortt, A.; O’Malley, M. Quantifying the Long-Term Impact of Electric Vehicles on the Generation Portfolio. IEEE Trans. Smart Grid 2014, 5, 71–83. [Google Scholar] [CrossRef]
- Bitencourt, L.A.; Borba, B.S.M.C.; Maciel, R.S.; Fortes, M.Z.; Ferreira, V.H. Optimal EV Charging and Discharging Control Considering Dynamic Pricing. In Proceedings of the IEEE Manchester PowerTech, Manchester, UK, 18–22 June 2017; pp. 1–6. [Google Scholar]
- Wang, Y.; Ai, X.; Yan, L.; Gao, Z.; Li, L.; Liu, S.; Han, H. A Game-Theoretic Mode for EV Discharging Price and Its Application. In Proceedings of the IEEE Conference and Expo Transportation Electrification Asia-Pacific (ITEC Asia-Pacific), Beijing, China, 31 August–3 September 2014; pp. 1–4. [Google Scholar]
- Eldjalil, C.D.A.; Said, D.; Khoukhi, L.; Mouftah, H.T. A Novel Pricing Policy for G2V and V2G Services. In Proceedings of the 14th IEEE Annual Consumer Communications & Networking Conference (CCNC), Las Vegas, NV, USA, 8–11 January 2017; pp. 634–635. [Google Scholar]
- Mao, T.; Lau, W.; Shum, C.; Chung, H.S.; Tsang, K.F.; Tse, N.C.F. A Regulation Policy of EV Discharging Price for Demand Scheduling. IEEE Trans. Power Syst. 2018, 33, 1275–1288. [Google Scholar] [CrossRef]
- Xie, F.; Huang, M.; Li, J. Research on Electric Vehicle Charging Station Load Forecasting. In Proceedings of the International Conference on Advanced Power System Automation and Protection, Beijing, China, 16–20 October 2011; Volume 3, pp. 2055–2060. [Google Scholar]
- Guo, C.; Qi, W.; Li, W.; Hang, D.; Hou, P.; Xiao, X. A Method of Electric Vehicle Charging Load Forecasting Based on the Number of Vehicles. In Proceedings of the International Conference on Sustainable Power Generation and Supply (SUPERGEN), Hangzhou, China, 8–9 September 2012; pp. 1–5. [Google Scholar]
- Wang, X.; Nie, Y.; Cheng, K.W.E.; Mei, J. Forecast of Urban EV Charging Load and Smart Control Concerning Uncertainties. In Proceedings of the International Symposium on Electrical Engineering (ISEE), Hong Kong, China, 14 December 2016; pp. 1–7. [Google Scholar]
- Darabi, Z.; Ferdowsi, M. Aggregated impact of plug-in hybrid electric vehicles on electricity demand profile. IEEE Trans. Sustain. Energy 2011, 2, 501–508. [Google Scholar] [CrossRef]
- Amini, M.H.; Kargariane, A.; Karabasoglu, O. ARIMA-based decoupled time series forecasting of electric vehicle charging demand for stochastic power system operation. Electr. Power Syst. Res. 2016, 140, 378–390. [Google Scholar] [CrossRef]
- Xydas, E.; Marmaras, C.; Cipcigan, L.M.; Jenkins, N.; Carroll, S.; Barker, M. A data-driven approach for characterising the charging demand of electric vehicles: A UK case study. Appl. Energy 2016, 162, 763–771. [Google Scholar] [CrossRef]
- Arias, M.B.; Bae, S. Electric vehicle charging demand forecasting model based on big data technologies. Appl. Energy 2016, 183, 327–339. [Google Scholar] [CrossRef]
- A Study on the Influence of EV and Wind Power Deployment Policies on Jeju Power System. Available online: https://www.kpx.or.kr/www/downloadBbsFile.do?atchmnflNo=27203 (accessed on 23 June 2018).
- Sovacool, B.K.; Hirsh, R.F. Beyond Batteries: An Examination of the Benefits and Barriers to Plug-in Hybrid Electric Vehicles and Vehicle to Grid Transition. Energy Policy 2009, 37, 1095–1103. [Google Scholar] [CrossRef]
- A Test of Vehicle-to-Grid (V2G) for Energy Storage and Frequency Regulation in the PJM System. Available online: https://www1.udel.edu/V2G/resources/test-v2g-in-pjm-jan09.pdf (accessed on 23 June 2018).
- Wang, B.; Hu, Y.; Zeng, F. A User Cost and Convenience Oriented EV Charging and Discharging Scheduling Algorithm in V2G Based Microgrid. In Proceedings of the International Conference on Circuits, Devices and Systems (ICCDS), Chengdu, China, 5–8 September 2017; pp. 156–162. [Google Scholar]
- Zhou, Y.; Xu, G.; Chang, M. Demand Side Management for EV Charging/Discharging Behaviours with Particle Swarm Optimization. In Proceedings of the 11th World Congress on Intelligent Control and Automation, Shenyang, China, 29 June–4 July 2014; pp. 3660–3664. [Google Scholar]
- Chekired, D.A.E.; Dhaou, S.; Khoukhi, L.; Mouftah, H.T. Dynamic Pricing Model for EV Charging-Discharging Service Based on Cloud Computing Scheduling. In Proceedings of the 13th International Wireless Communications and Mobile Computing Conference (IWCMC), Valencia, Spain, 26–30 June 2017; pp. 1010–1015. [Google Scholar]
- Liu, M.; Crisostomi, E.; Gu, Y.; Shorten, R. Optimal Distributed Consensus Algorithm for Fair V2G Power Dispatch in a Microgrid. In Proceedings of the IEEE International Electric Vehicle Conference (IEVC), Florence, Italy, 17–19 December 2014; pp. 1–7. [Google Scholar]
- Molina, D.; Hubbard, C.; Lu, C.; Turner, S.; Harley, R. Optimal EV Charge-Discharge Schedule in Smart Residential Buildings. In Proceedings of the IEEE Power and Energy Society Conference and Exposition in Africa: Intelligent Grid Integration of Renewable Energy Resources (PowerAfrica), Johannesburg, South Africa, 9–13 July 2012; pp. 1–8. [Google Scholar]
- Santos, V.D.N.; Gonçalves, J.M.R.; Tavares, P.F. An Innovative Information and Communication Technology Architecture to the V2G Concept Implementation. In Proceedings of the 51st International Universities Power Engineering Conference (UPEC), Coimbra, Portugal, 6–9 September 2016; pp. 1–5. [Google Scholar]
- Saltanovs, R.; Krivchenkov, A.; Krainyukov, A. Analysis of Effective Wireless Communications for V2G Applications and Mobile Objects. In Proceedings of the IEEE 58th International Scientific Conference on Power and Electrical Engineering of Riga Technical University (RTUCON), Riga, Latvia, 12–13 October 2017; pp. 1–5. [Google Scholar]
- Khasa, P.; Ravi; Jain, D.K. Simultaneous charging and discharging integrating EV for V2G and G2V. In Proceedings of the 7th India International Conference on Power Electronics (IICPE), Patiala, India, 17–19 November 2016; pp. 1–5. [Google Scholar]
- Lin, X.; Sun, J.; Ai, S.; Xiong, X.; Wan, Y.; Yang, D. Distribution network planning integrating charging stations of electric vehicle with V2G. Int. J. Electr. Power Energy Syst. 2014, 63, 507–512. [Google Scholar] [CrossRef]
- Ma, Y.; Zhang, B.; Zhou, X.; Gao, Z.; Wu, Y.; Yin, J.; Xu, X. An Overview on V2G Strategies to Impacts from EV Integration into Power System. In Proceedings of the Chinese Control and Decision Conference (CCDC), Yinchuan, China, 28–30 May 2016; pp. 2895–2900. [Google Scholar]
- Kim, H.C.; Kang, N.H. Jeju Power Grid Operation Report (2016); KPX: Jeju, Korea, 2017. [Google Scholar]
- Berckmans, G.; Messagie, M.; Smekens, J.; Omar, N.; Vanhaverbeke, L.; Mierlo, J.V. Cost Projection of State of the Art Lithium-Ion Batteries for Electric Vehicles Up to 2030. Energies 2017, 10, 1314. [Google Scholar] [CrossRef]
- Shao, S.; Guo, S.; Qiu, X. A Mobile Battery Swapping Service for Electric Vehicles Based on a Battery Swapping Van. Energies 2017, 10, 1667. [Google Scholar] [CrossRef]
- Zhao, J.-L.; Xiao, L.; Lu, S.-Y.; Zhang, H.-D.; Qi, H. Operation Mode Analysis of Electric Vehicle Charging and Battery Swap Station. In Proceedings of the International Conference on Electronic & Mechanical Engineering and Information Technology, Shenyang, China, 7 September 2012. [Google Scholar]
- Low-Carbon Cars in Germany. Available online: https://www.camecon.com/wp-content/uploads/2017/10/Low-carbon-cars-in-Germany-Final-Technical-Report.pdf (accessed on 23 June 2018).
- Adan, I.; Resing, J. Queueing System; Department of Mathematics and Computing Science, Eindhoven University of Technology: Eindhoven, The Netherlands, 2015. [Google Scholar]
- Chaiken, J.M.; Larson, R.C. Methods for Allocating Urban Emergency Units: A Survey. Manag. Sci. 1972, 19, 110–130. [Google Scholar] [CrossRef]
Figure 1.
Power supply and demand in Jeju (2017–2029).

Figure 2.
EV charging state by type in Jeju.

Figure 3.
Distribution of EV charging amount per visit.
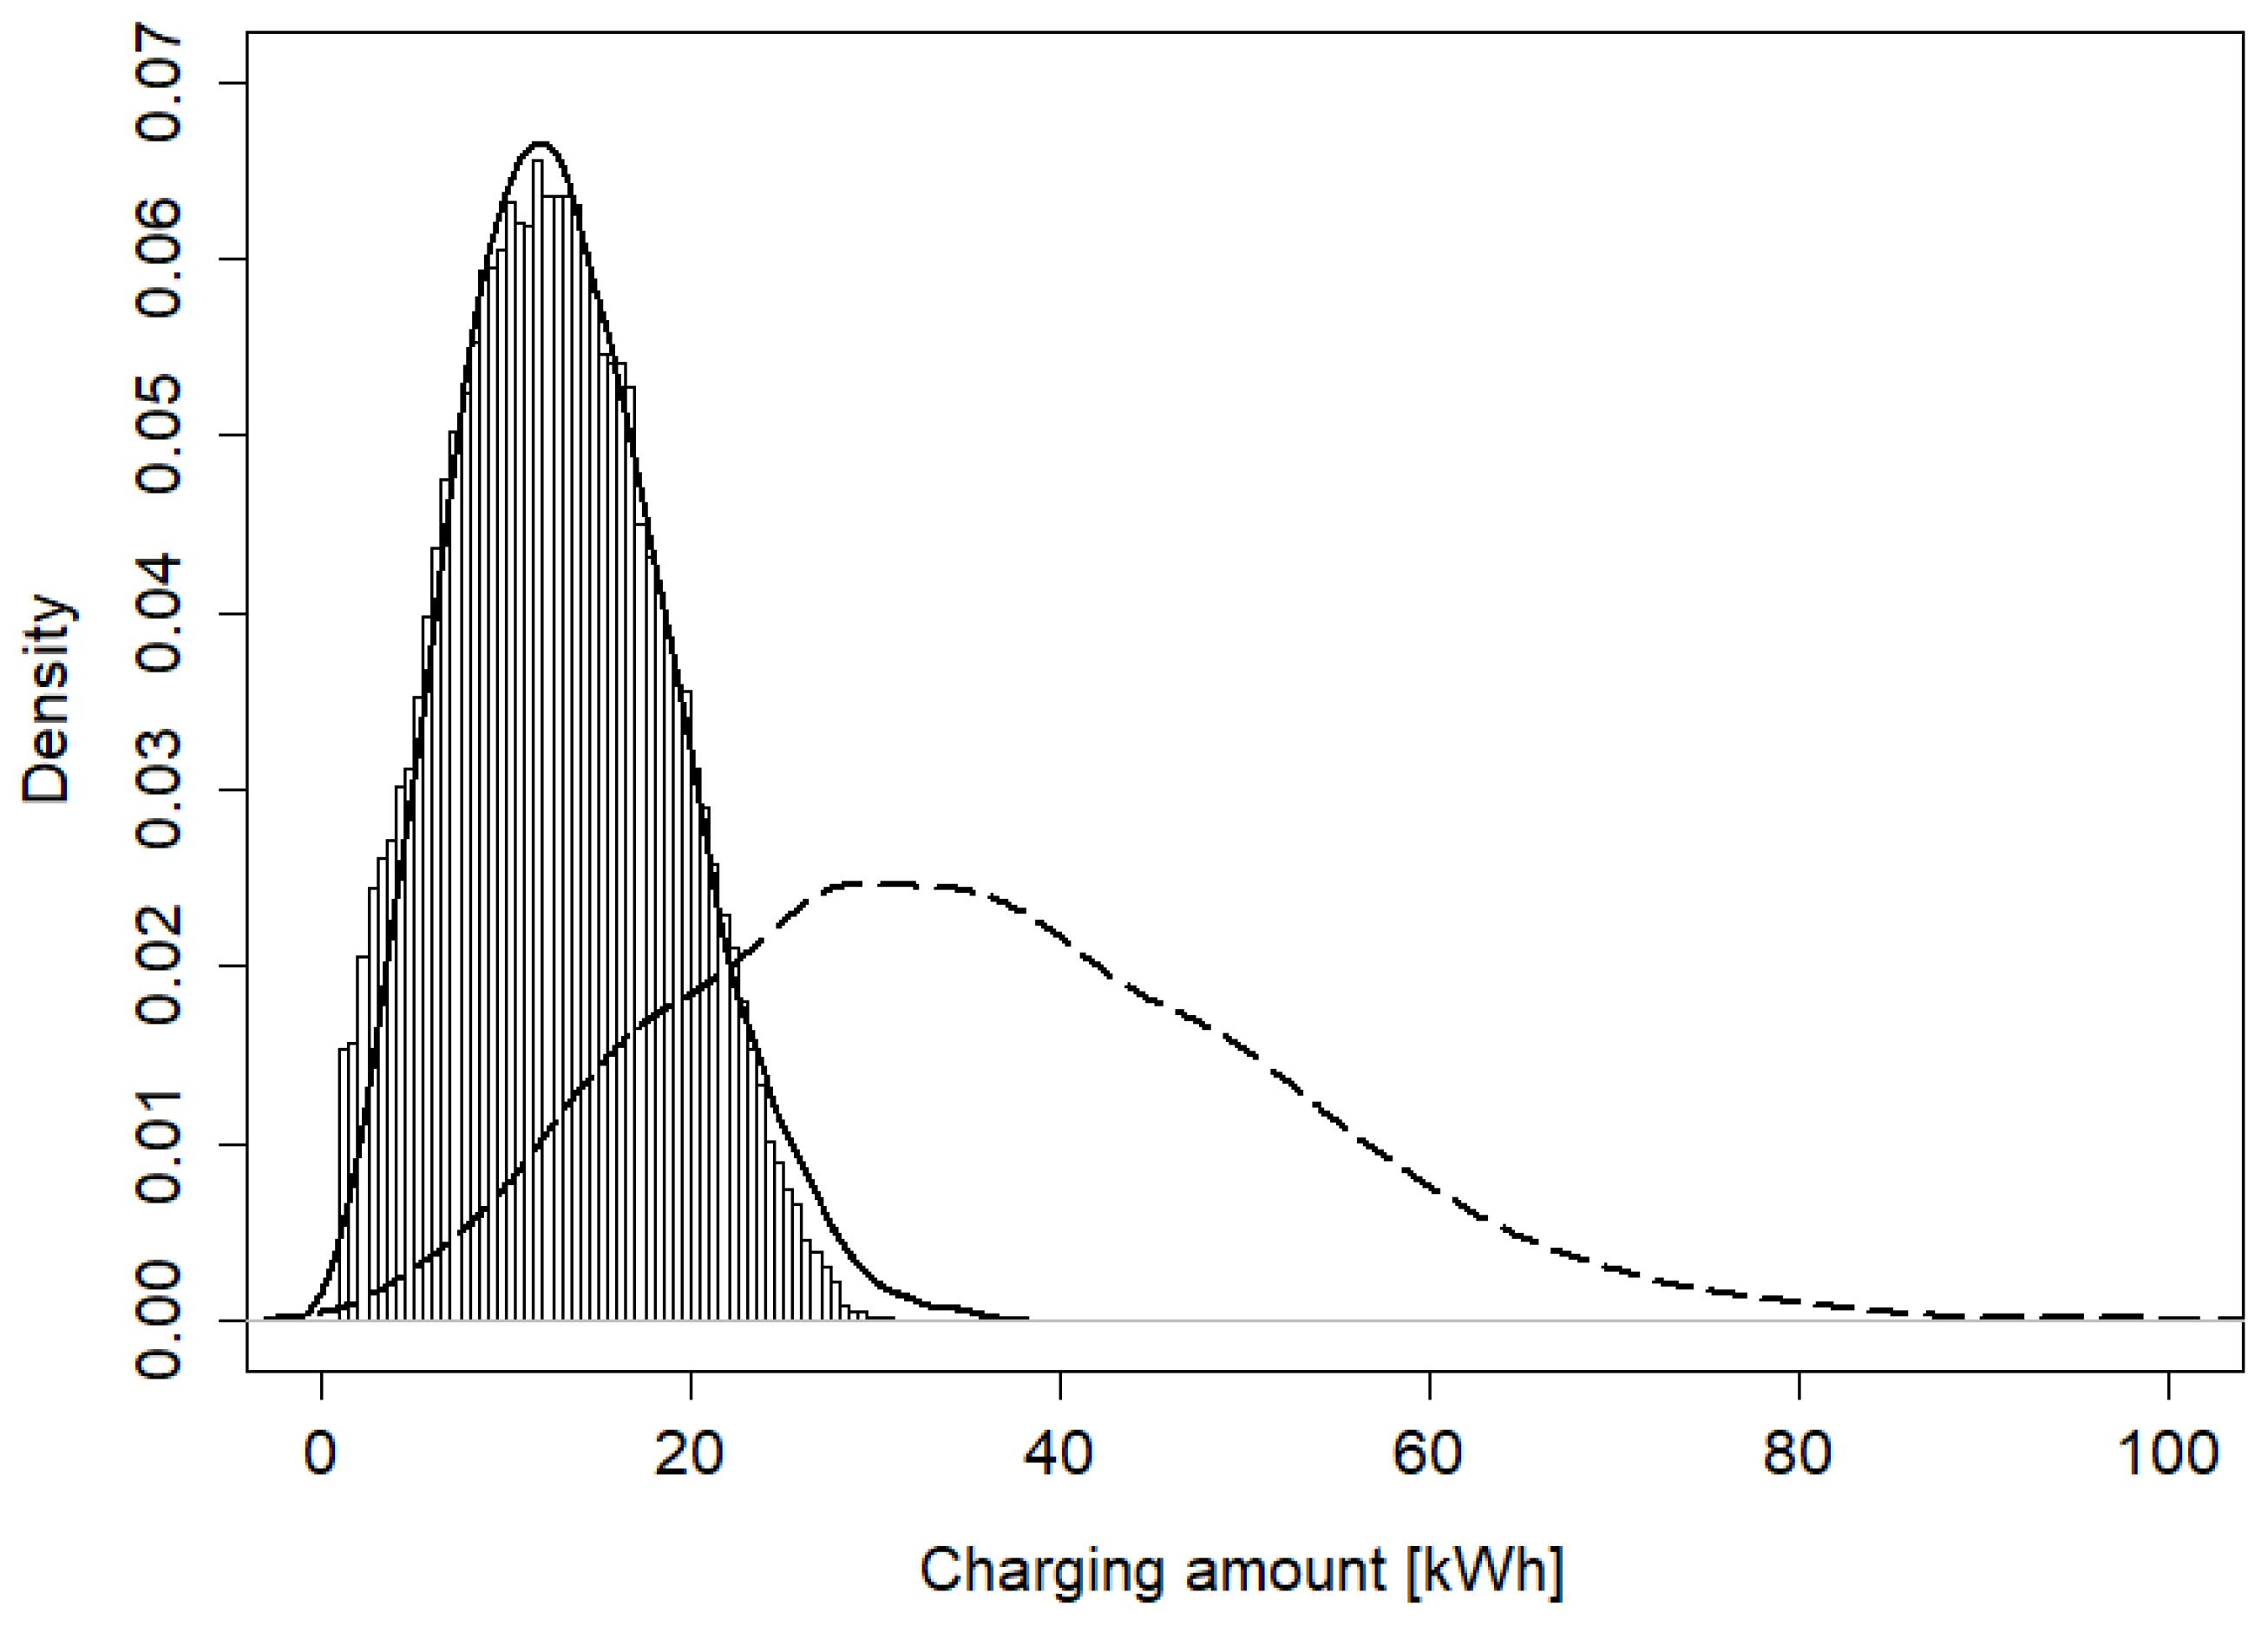
Figure 4.
Monthly average EV charging pattern per hour by type.
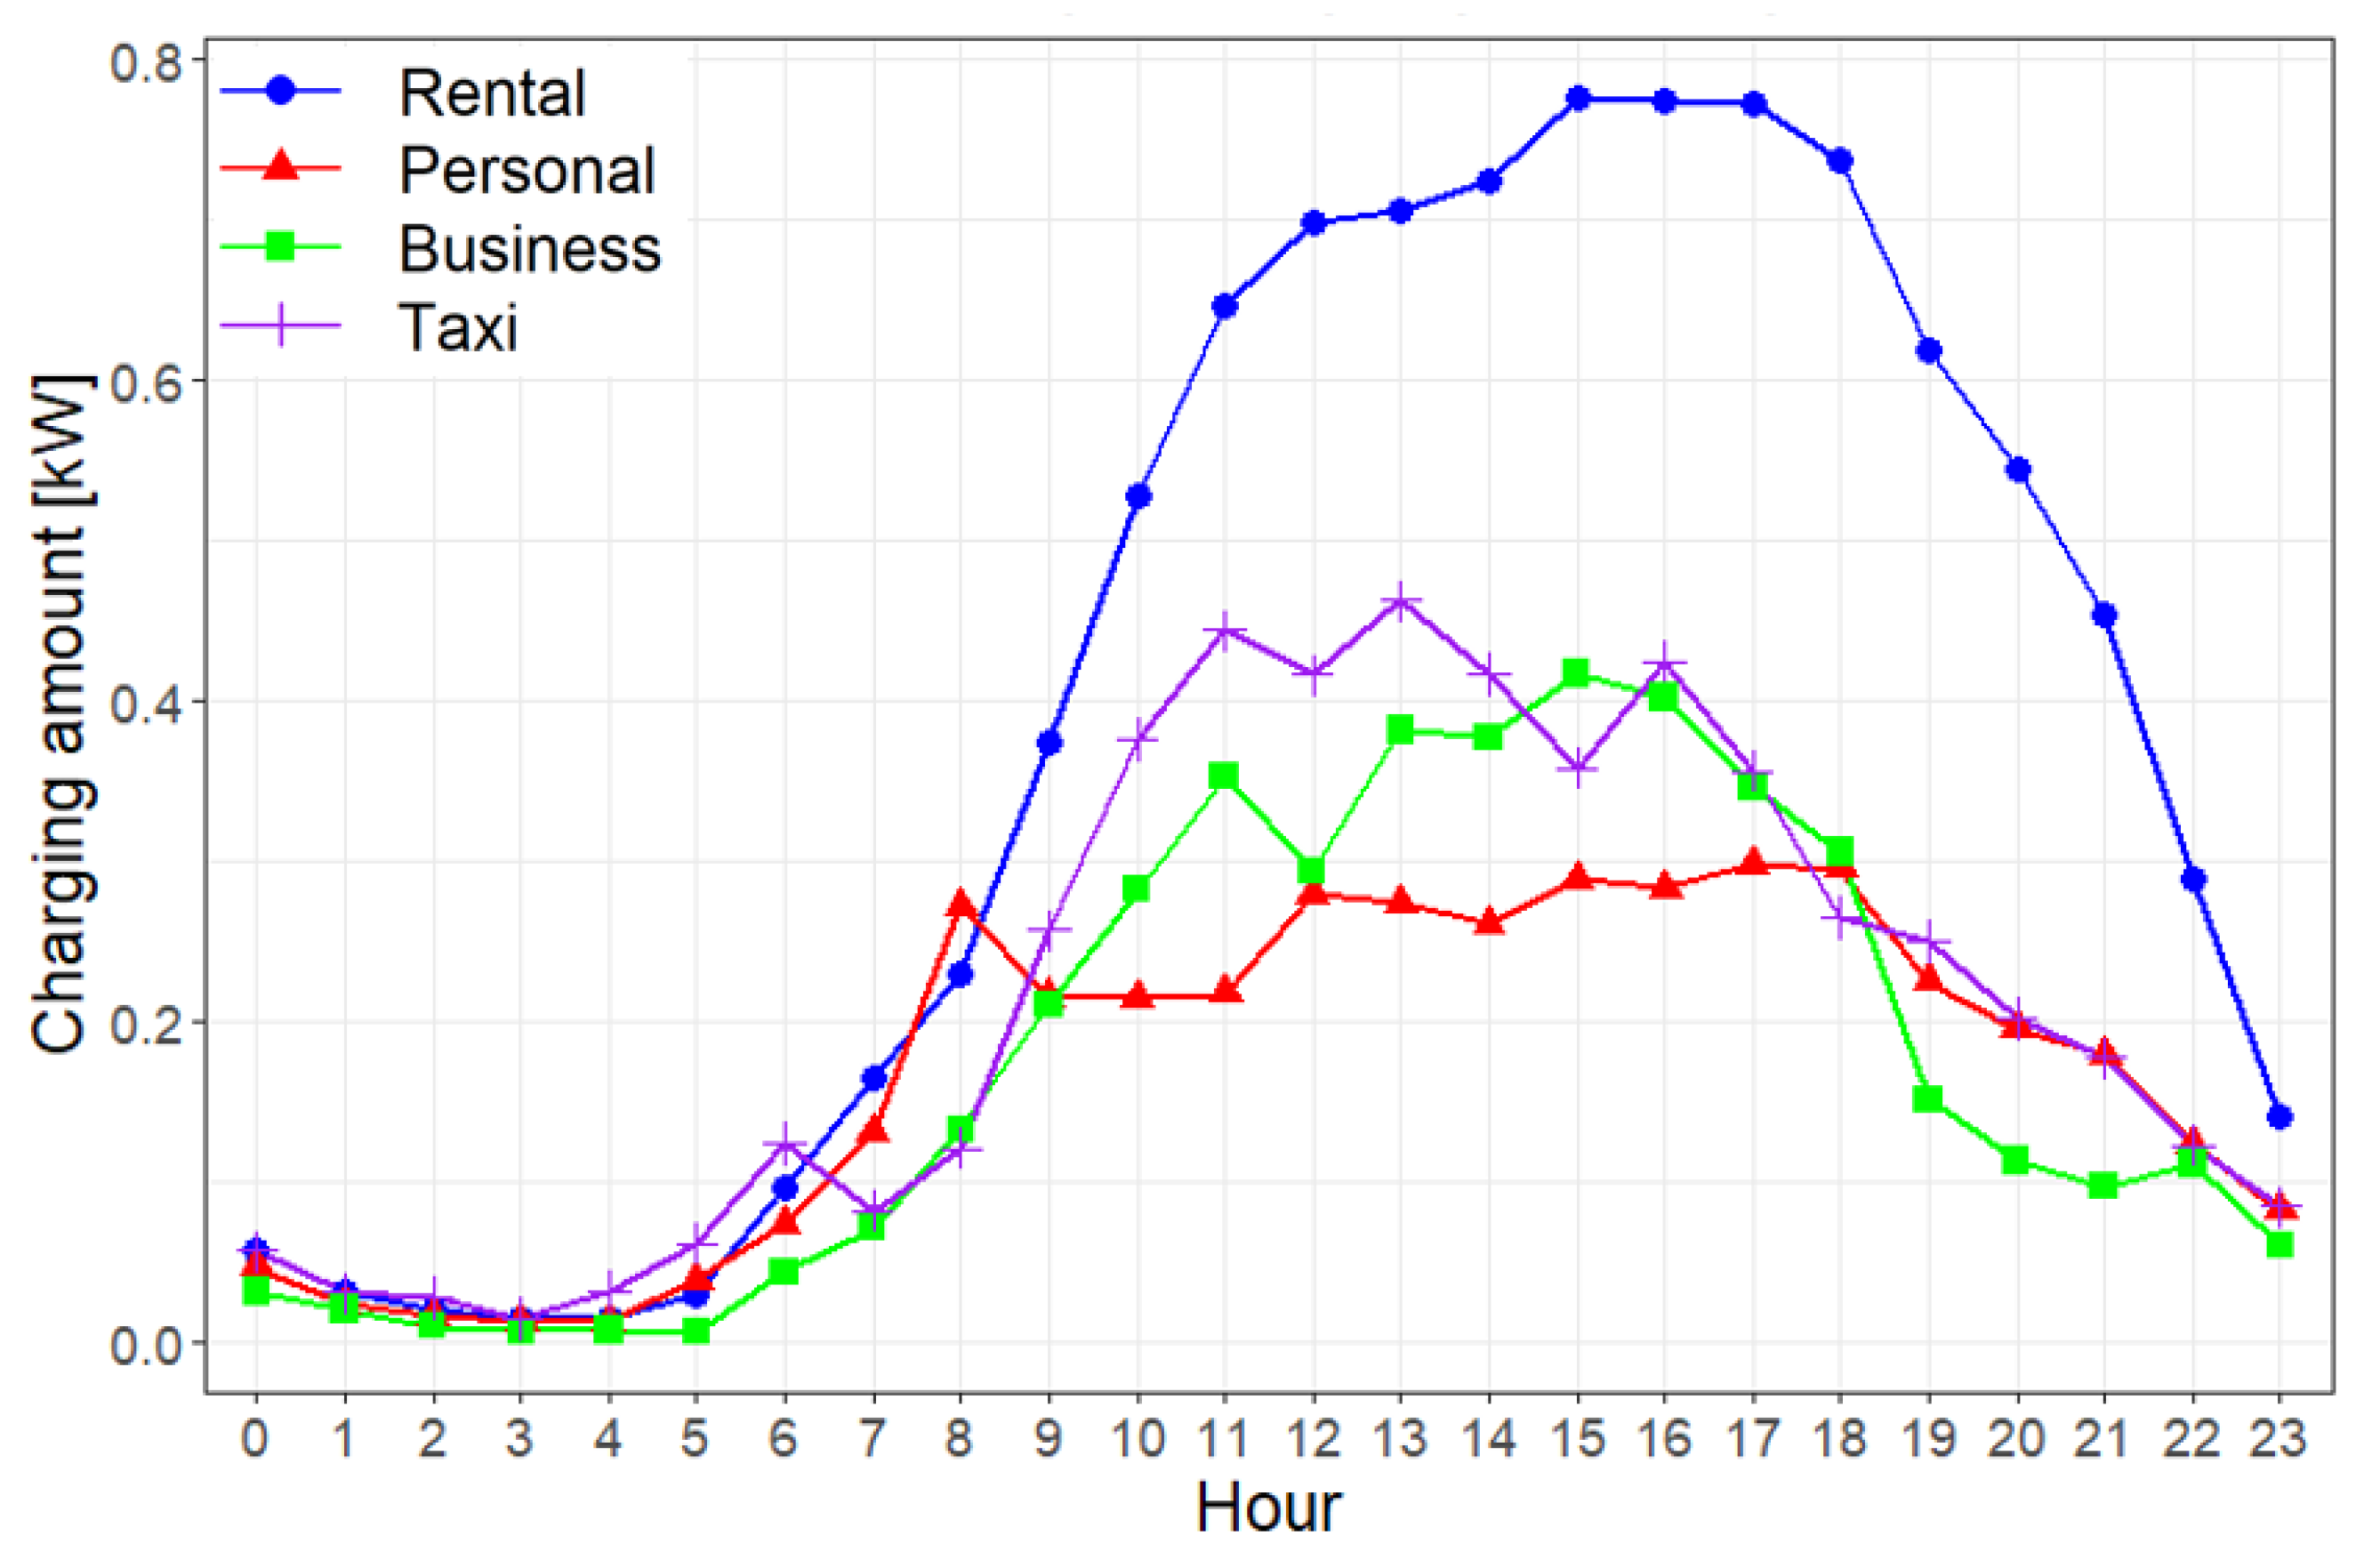
Figure 5.
Hourly EV charging pattern for commercial charging stations in 2030.

Figure 6.
Idle station capacity estimation.

Figure 7.
EV charging simulation example using Monte Carlo simulation.

Figure 8.
Result of EV charging and V2G discharging capacity distribution for Jeju at peak time in 2030 obtained from Monte Carlo simulation.
Figure 8.
Result of EV charging and V2G discharging capacity distribution for Jeju at peak time in 2030 obtained from Monte Carlo simulation.

Figure 9.
Change of EV peak and V2G power and V2G contribution when relative EV supply ratio is reduced from 1 to 0.3.
Figure 9.
Change of EV peak and V2G power and V2G contribution when relative EV supply ratio is reduced from 1 to 0.3.

Figure 10.
Average waiting time for EV charging according to the relative EV supply ratio.

© 2018 by the authors. Licensee MDPI, Basel, Switzerland. This article is an open access article distributed under the terms and conditions of the Creative Commons Attribution (CC BY) license (http://creativecommons.org/licenses/by/4.0/).
Share and Cite
MDPI and ACS Style
Han, H.-S.; Oh, E.; Son, S.-Y. Study on EV Charging Peak Reduction with V2G Utilizing Idle Charging Stations: The Jeju Island Case. Energies 2018, 11, 1651. https://doi.org/10.3390/en11071651
AMA Style
Han H-S, Oh E, Son S-Y. Study on EV Charging Peak Reduction with V2G Utilizing Idle Charging Stations: The Jeju Island Case. Energies. 2018; 11(7):1651. https://doi.org/10.3390/en11071651
Chicago/Turabian StyleHan, Hye-Seung, Eunsung Oh, and Sung-Yong Son. 2018. "Study on EV Charging Peak Reduction with V2G Utilizing Idle Charging Stations: The Jeju Island Case" Energies 11, no. 7: 1651. https://doi.org/10.3390/en11071651
Note that from the first issue of 2016, this journal uses article numbers instead of page numbers. See further details here.