Article

Three-Stage Anaerobic Sequencing Batch Reactor (ASBR) for Maximum Methane Production: Effects of COD Loading Rate and Reactor Volumetric Ratio

by
Achiraya Jiraprasertwong
1,
Kornpong Vichaitanapat
1,
Malinee Leethochawalit
2 and
Sumaeth Chavadej
1,3,*
1
The Petroleum and Petrochemical College, Chulalongkorn University, Bangkok 10330, Thailand
2
Innovative Learning Center, Srinakharinwirot University, Bangkok 10110, Thailand
3
Center of Excellence on Petrochemical and Materials Technology, Chulalongkorn University, Bangkok 10330, Thailand
*
Author to whom correspondence should be addressed.
Energies 2018, 11(6), 1543; https://doi.org/10.3390/en11061543
Submission received: 15 May 2018 / Revised: 31 May 2018 / Accepted: 5 June 2018 / Published: 13 June 2018
(This article belongs to the Section A: Sustainable Energy)

Abstract

:
A three-stage anaerobic sequencing batch reactor system was developed as a new anaerobic process with an emphasis on methane production from ethanol wastewater. The three-stage anaerobic sequencing batch reactor system consisted of three bioreactors connected in series. It was operated at 37 °C with a fixed recycle ratio of 1:1 (final effluent flow rate to feed flow rate) and the washout sludge from the third bioreactor present in the final effluent was allowed to be recycled to the first bioreactor. The pH of the first bioreactor was controlled at 5.5, while the pH values of the other two bioreactors were not controlled. Under the optimum chemical oxygen demand loading rate of 18 kg/m3d (based on the feed chemical oxygen demand load and total volume of the three bioreactors) with a bioreactor volumetric ratio of 5:5:20, the system provided the highest gas production performance in terms of yields of both hydrogen and methane and the highest overall chemical oxygen demand removal. Interestingly, the three-stage anaerobic sequencing batch reactor system gave a much higher energy production rate and a higher optimum chemical oxygen demand loading rate than previously reported anaerobic systems since it was able to maintain very high microbial concentrations in all bioreactors with very high values of both alkalinity and solution pH, especially in the third bioreactor, resulting in sufficient levels of micronutrients for anaerobic digestion.

Graphical Abstract

1. Introduction

The production of biogas via anaerobic digestion processes has gained increasing interest worldwide due to being environmentally friendly and having a high energy yield [1,2,3,4,5,6,7,8,9,10]. The use of a two-stage process can improve process efficiency in terms of biogas production compared to single-stage anaerobic systems [11,12,13,14,15]. The anaerobic digestion process consists of four sequential steps: (i) hydrolysis (organic polymers are hydrolysed to water-soluble organic monomers such as sugars, and amino acids); (ii) acidogenesis (water-soluble organic monomers are converted to short chain fatty acids, carbon dioxide (CO2), hydrogen (H2), and alcohols by acidogens); (iii) acetogenesis (large molecular weight organic acids are further consumed by acetogens to produce acetic acid (HAc), CO2 and H2) and (iv) methanogenesis (acetic acid is finally converted to methane (CH4) and CO2, and H2 is also consumed with CO2 to produce CH4) [2,16,17]. The groups of bacteria involved in each step have different growth rates and require different environmental conditions [14]. Accordingly, a three-stage anaerobic process was hypothesized to give a higher process performance than single- and two-stage anaerobic processes, since it could provide suitable conditions in each bioreactor to meet the environmental requirements for each step of anaerobic decomposition. Indeed, previous work has stated that a three-stage upflow anaerobic sludge blanket (UASB) system could provide high values for both the overall chemical oxygen demand (COD) removal and the total energy yield [18].
In this study, a three-stage anaerobic sequencing batch reactor (ASBR) system treating ethanol wastewater under a mesophilic temperature was operated at different COD loading rates to produce both H2 and CH4 with an emphasis on maximum CH4 production. The pH of the first bioreactor was controlled at 5.5, whereas the pH values of the other two bioreactors were not controlled. In order to minimize the quantity of the NaOH solution used for pH adjustment, the final effluent from the third bioreactor was recycled to the first bioreactor with a fixed recycle ratio of 1:1 (final effluent flow rate to feed flow rate). To maximize the CH4 production efficiency, the washout sludge present in the final effluent was recycled to the first bioreactor. Based on the different growth rates of the three groups of bacteria, the volumetric ratio of the three bioreactors was varied in order to maximize the production rate of CH4.

2. Materials and Methods

2.1. Seed Sludge Preparation

The seed sludge, which had been collected from the bottom of the UASB treating ethanol wastewater at Sapthip Co., Ltd., Lopburi, Thailand, was filtered through a 1 mm sieve in order to remove all large solid particles. For the first bioreactor, the seed sludge was heat-treated by boiling at 95 °C for 15 min to eliminate any H2-consuming bacteria and to enrich principally H2-producing bacteria [19,20,21,22], while the sieved seed sludge without heat-treatment was directly added to the second and third bioreactors. After adding the seed sludge, tap water was used to fill up all three bioreactors. The microbial concentration, in terms of mixed liquid volatile suspended solids (MLVSS), for the start-up in this study was about 5700 mg/L for each bioreactor.

2.2. Substrate Preparation

The ethanol wastewater was kindly supplied by the same factory, which uses cassava roots as the raw material for ethanol production. The ethanol wastewater mainly came from the bottom of the distillation columns, and it also contained a large quantity of unfermented cassava roots. Hence, it was sieved to remove these large solid particles and kept at 4 °C until use. The ethanol wastewater was used in this study without nutrient addition because it had a COD:nitrogen:phosphorous (COD:N:P) ratio of 100:2.3:0.7 (by weight) (Table 1), indicating that sufficient amounts of nitrogen and phosphorus were available for anaerobic decomposition according to the theoretical threshold ratio of COD:N:P of 100:1:0.4 [19,23,24].

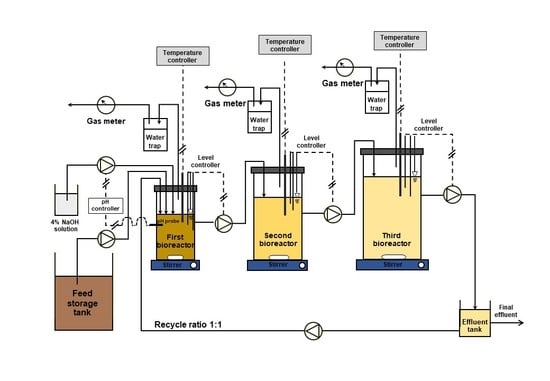
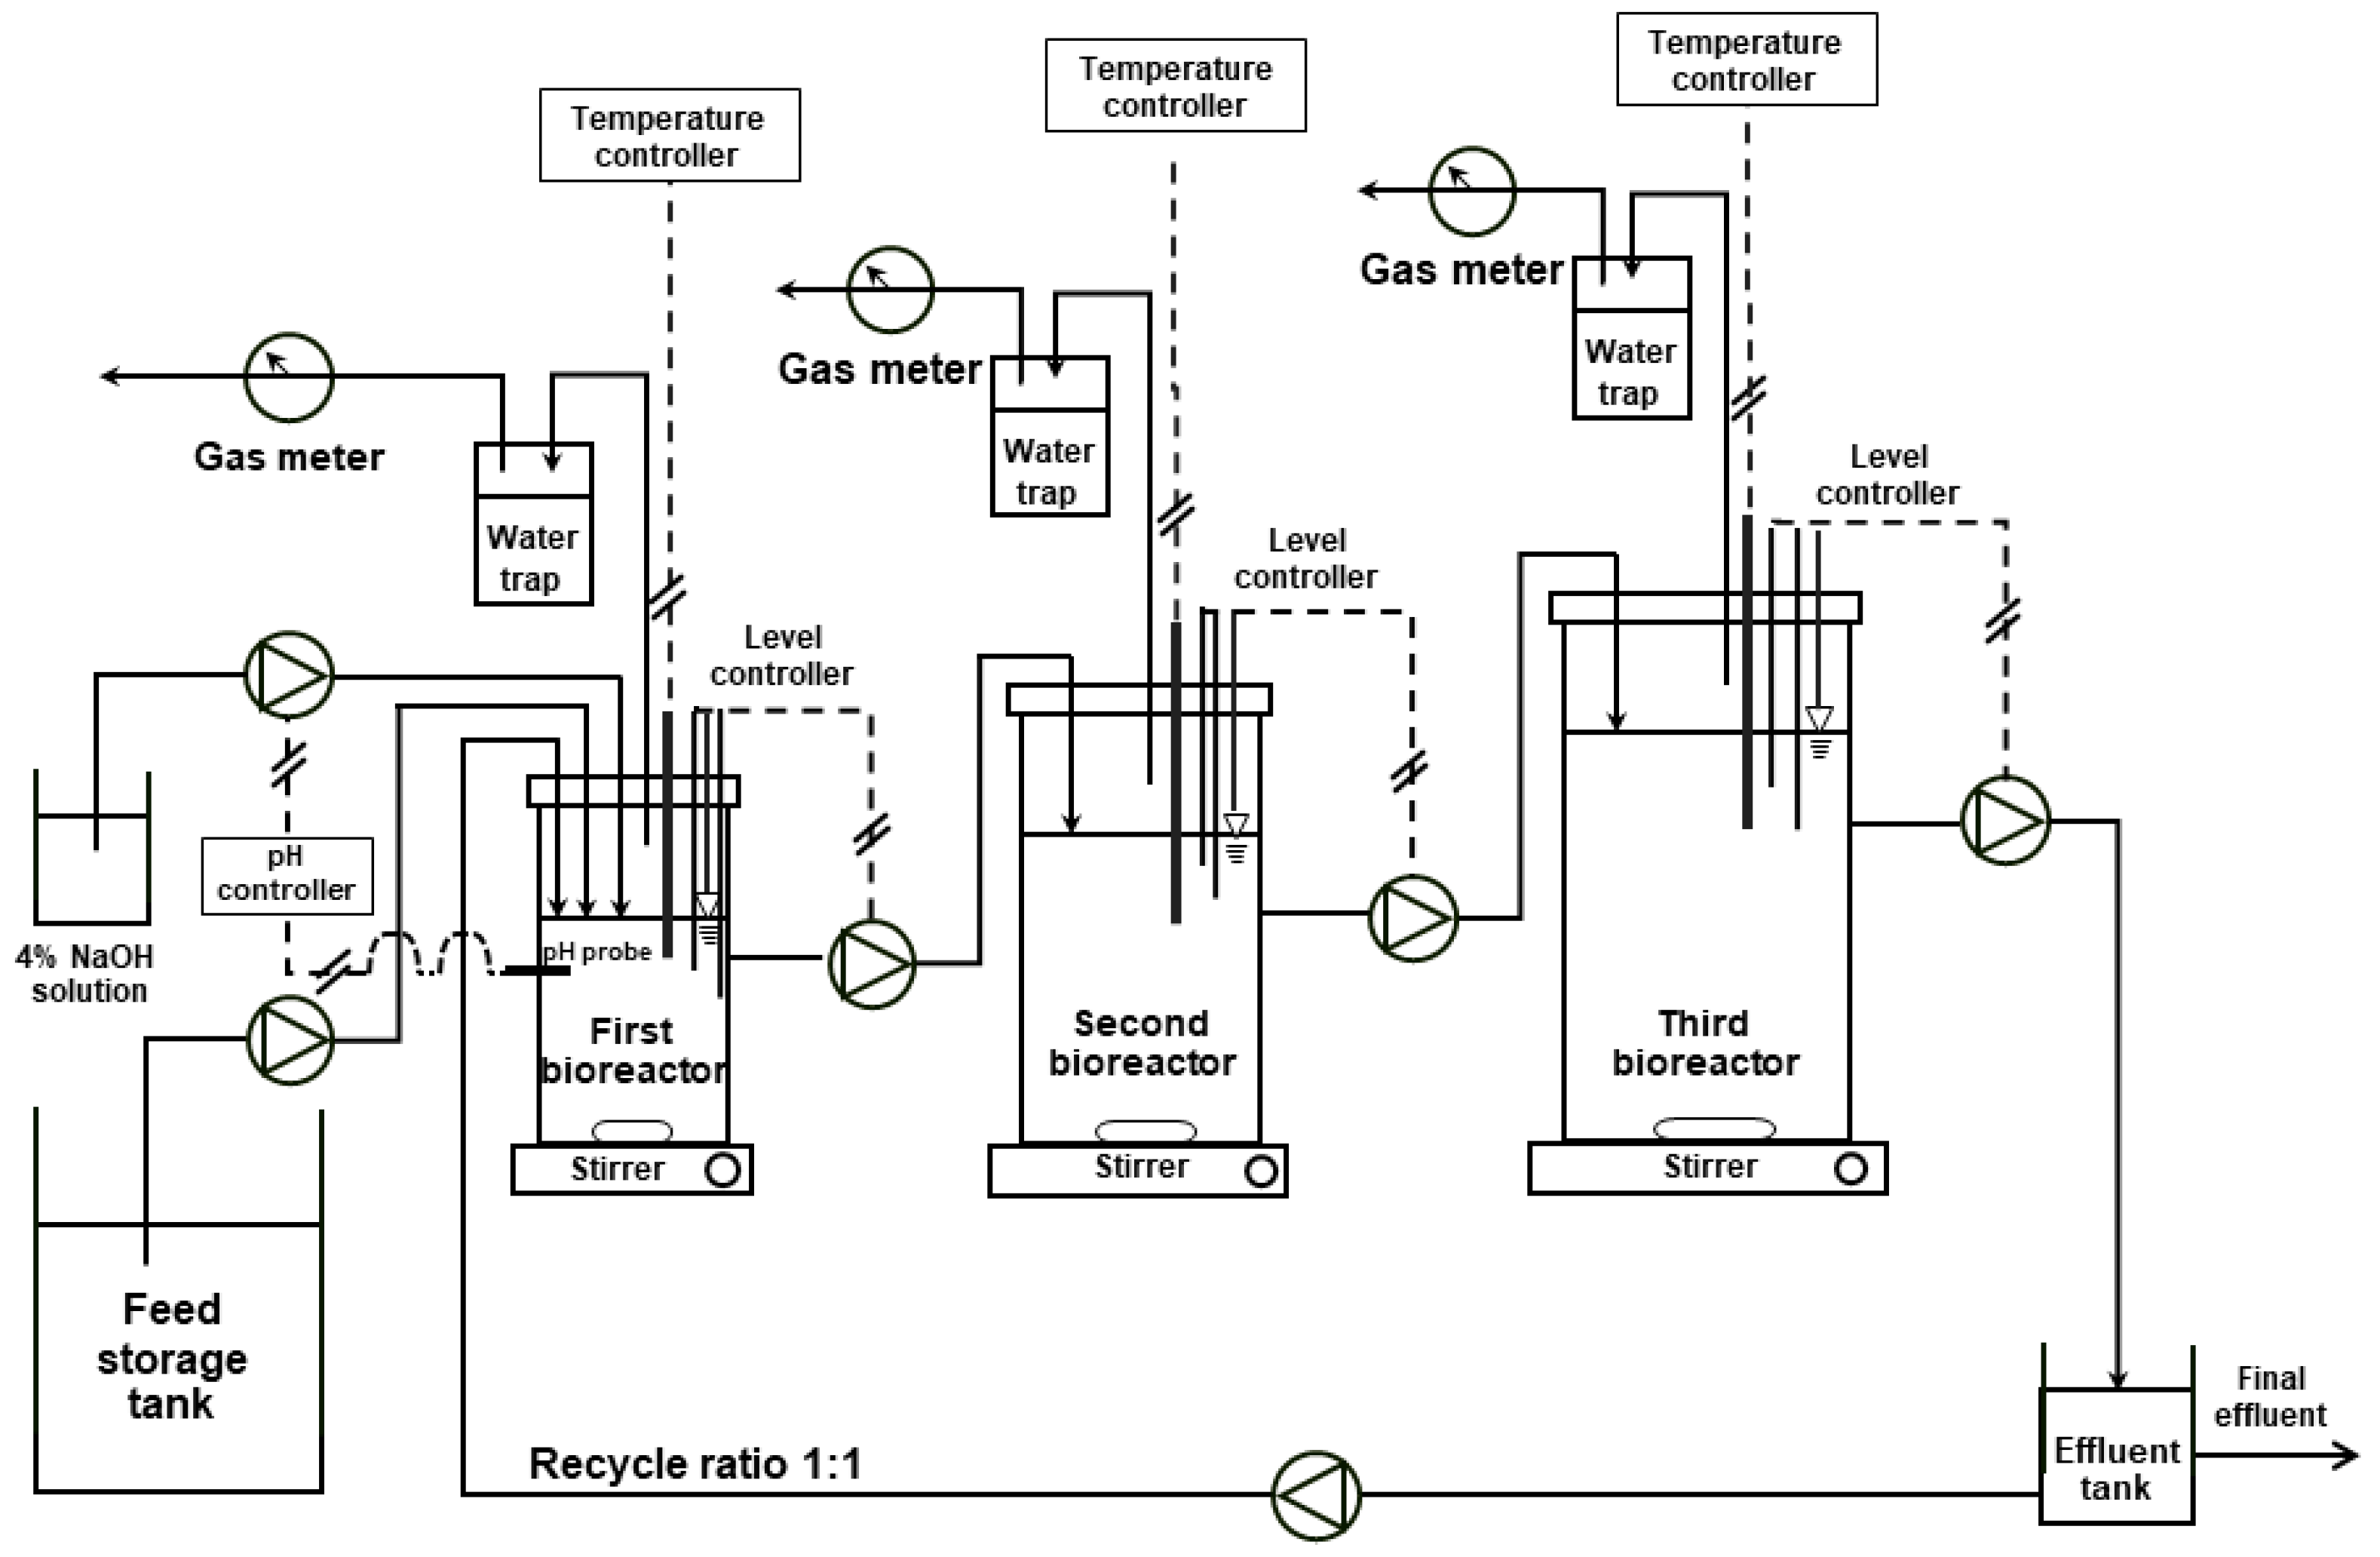
2.3. ASBR Setup and Operation

Figure 1 schematically illustrates the experimental set up of the three-stage ASBR system, which consisted of three bioreactors connected in series. All bioreactors were made from polyvinyl chloride pipes in order to inhibit the photosynthetic activities of bacteria and algae. The temperature of each bioreactor was controlled at 37 °C using a temperature controller connected to a heater [5]. The three-stage ASBR system was operated at either 6 or 8 cycles per day. At 6 cycles/d, each cycle of operation consisted of feeding (15 min), reacting (120 min), settling (90 min) and decanting (15 min). The time for all steps of each cycle was set by a programmable logic controller (PLC). The pH in the first bioreactor was controlled at 5.5 using a pH controller (Extech, 48PH2, Waltham, MA, USA) [5] with a dosing pump for feeding a 4% (w/v) NaOH solution, while the pH value in the other two bioreactors was not controlled. In order to minimize the consumption of NaOH for pH adjustment in the first bioreactor, the effluent of the third bioreactor was fed to the first bioreactor at a constant recycle ratio of 1:1 (final effluent flow rate to feed flow rate).
For the feeding step, both the ethanol wastewater and the final effluent (without sedimentation) were introduced to the first bioreactor using two separate peristaltic pumps. For the reacting step, a magnetic stirrer (400 rpm) was used to obtain homogeneous mixing in each bioreactor. For the settling step, the microbial cells in all three bioreactors were allowed to settle by turning off the magnetic stirrers. For the final decanting step, the clarified liquid in each bioreactor was drained out by a peristaltic pump connected with a level probe. For any desired COD loading rate, the studied system was operated to reach a steady state condition before taking effluent and produced gas samples for analyses and measurements. The steady state was justified when the COD values and gas production rates of each bioreactor were invariant over time (<5% standard derivation).
For the first part, the three-stage ASBR system was operated at a COD loading rate range of 15–21 kg/m3d at 6 cycles/d because it was a continuation from previous work, where the optimum COD loading rate was 15 kg/m3d [25]. The liquid working volumes were fixed at 4, 6 and 20 L for the first, second and third bioreactors, respectively. In this set up, the system was found to provide the highest CH4 production efficiency at a COD loading rate of 18 kg/m3d. The higher optimum COD loading rate in the present study than that obtained from the previous investigation [25], resulted from the higher microbial concentrations in all bioreactors and the recycled methanogens present in the final effluent to the first bioreactor in the present work.
For the second part, the three-stage ASBR system was operated at a fixed COD loading rate of 18 kg/m3d, a fixed total volume of all three bioreactors of 30 L and 8 cycles/d with different volumetric ratios of the three bioreactors of 4:6:20, 5:5:20, 4:8:18 and 6:6:18 (L:L:L). For the operation of 8 cycles/d, the total time for each 3-h cycle consisted of 10 min of feeding, 70 min of reacting, 90 min of settling and 10 min of decanting.

2.4. Measurements and Analytical Methods

The gas production rate of each bioreactor was measured by a gas meter (TGO5/5, Ritter, Germany). The produced gas composition was determined by gas chromatography using a Perkin-Elmer AutoSystem instrument (Waltham, MA, USA) equipped with a thermal conductivity detector (TCD) and two packed columns in series (HayeSep D 100/120 mesh and Altech, Molecular sieve (Flemington, NJ, USA)). The injector, column and detector temperatures were kept constant at 150, 60 and 200 °C, respectively. Argon was used as a carrier gas. The feed and effluent (taken from the decanting step) samples were analysed for COD, total volatile fatty acids (VFA) concentration, VFA composition, volatile suspended solids (VSS), nitrogen and phosphorus. The COD values were determined by the dichromate oxidation method using a controllable heating block (DRB200, HACH, Loveland, CO, USA), and the absorbance was measured by a spectrophotometer (DR3800, HACH, Loveland, CO, USA) according to Standard Methods [26]. The VFA composition and total VFA concentration were determined by a high-performance liquid chromatograph (HPLC; LC-20A, Shimadzu, Kyoto, Japan), with a refractive index detector (RID; RID-20A, Shimadzu, Japan) and an Aminex HPX-87H column, (Bio-Rad Lab, Hercules, CA, USA). A 5 mM H2SO4 solution was used as the mobile phase at a flow rate of 0.6 mL/min at 60 °C. All trace elements, including Fe, Cu, Ni, Co, Mn, Zn, and Mo and Na present in feed and effluent samples were analysed by atomic absorption spectrophotometry (AAS; SpectrAA 300, Varian Inc., Palo Alto, CA, USA). The VSS of the effluent samples taken from the decanting step and the MLVSS taken during the reacting step were used to represent the microbial washout from each bioreactor and the microbial concentration in each bioreactor, respectively. Both VSS and MLVSS were analysed according to Standard Methods [26]. Organic nitrogen was analysed by the diazotization and cadmium reduction method while inorganic nitrogen components were analysed by the salicylate method with TNT persulfate digestion (HACH, Loveland, CO, USA). The total phosphorous contents in the feed and effluent samples were determined by the molybdovanadate method with the acid persulfate digestion method (HACH, Loveland, CO, USA).

2.5. Calculation

For any studied COD loading rate, all experimental data were averaged with error bars from at least 5 data points obtained under the steady state condition. The process performance of the three-stage ASBR system was determined in terms of the gas production rates, yields and specific gas production rates (SHPR for H2 and SMPR for CH4) of H2 and CH4, as described in our previous studies [20,23,24,27]. This following section is divided by subheadings. It should provide a concise and precise description of the experimental results, their interpretation as well as the experimental conclusions that are drawn.

3. Results and Discussion

3.1. Part I: Effect of COD Loading Rate

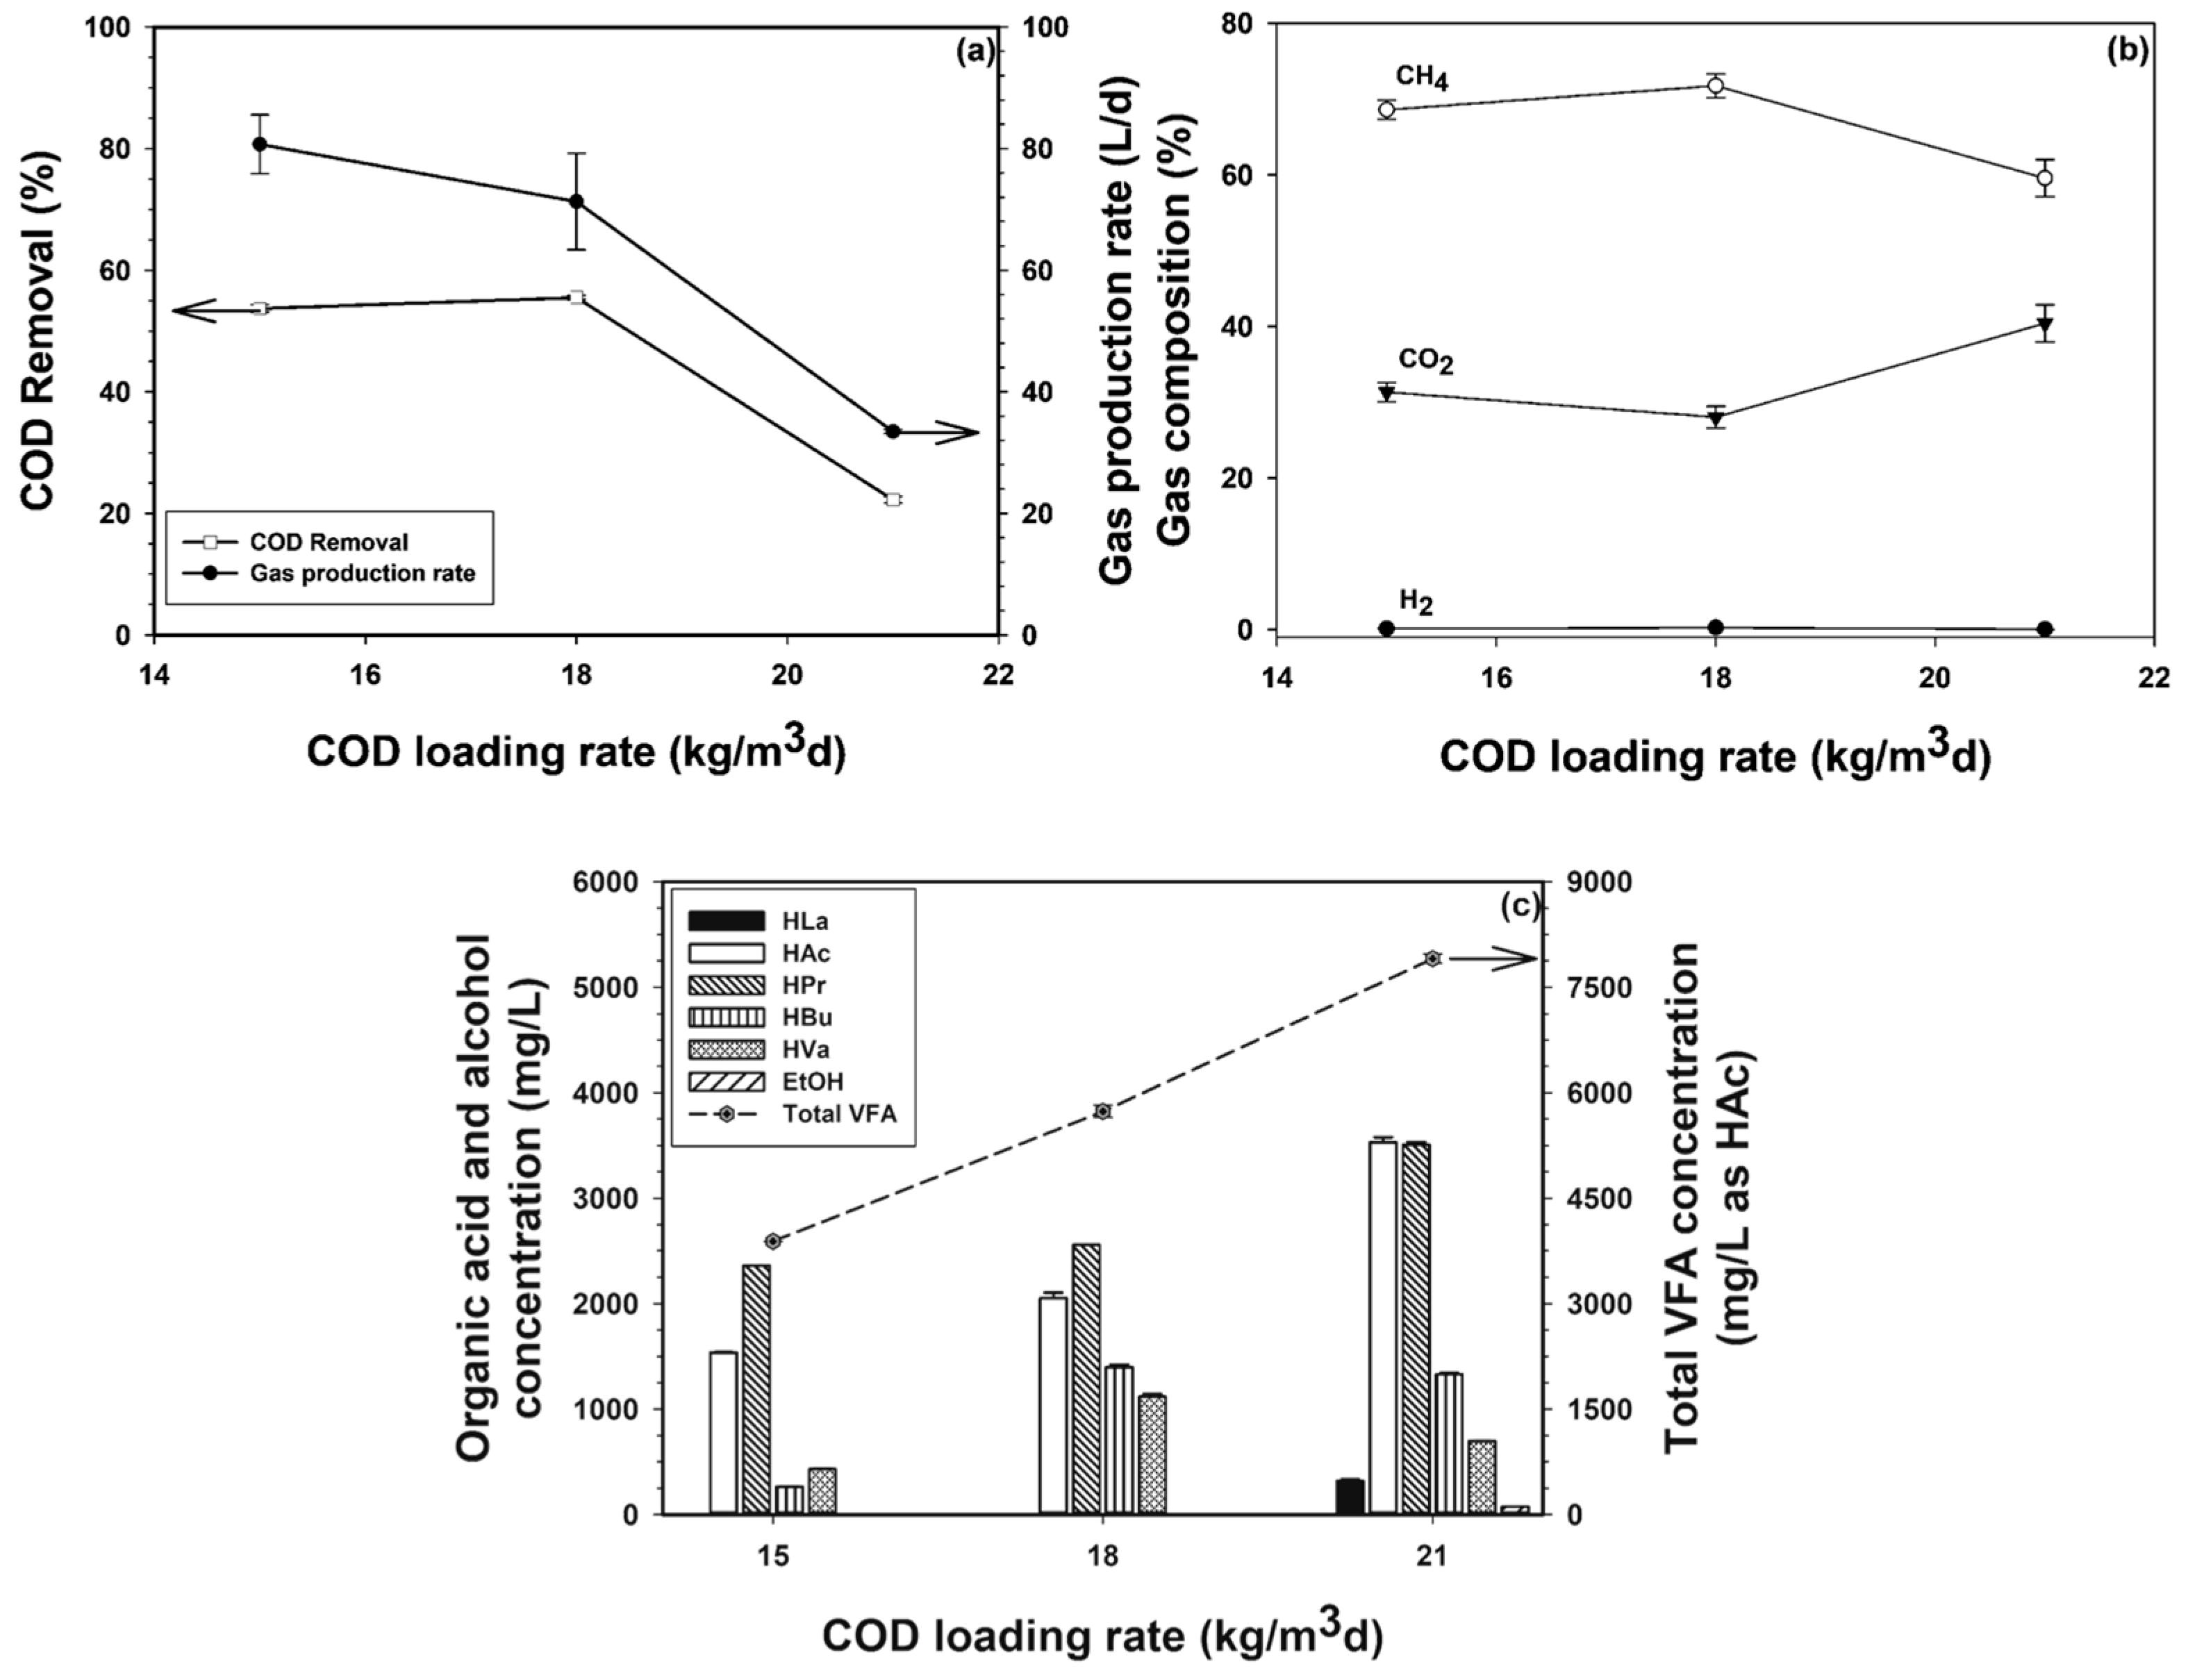
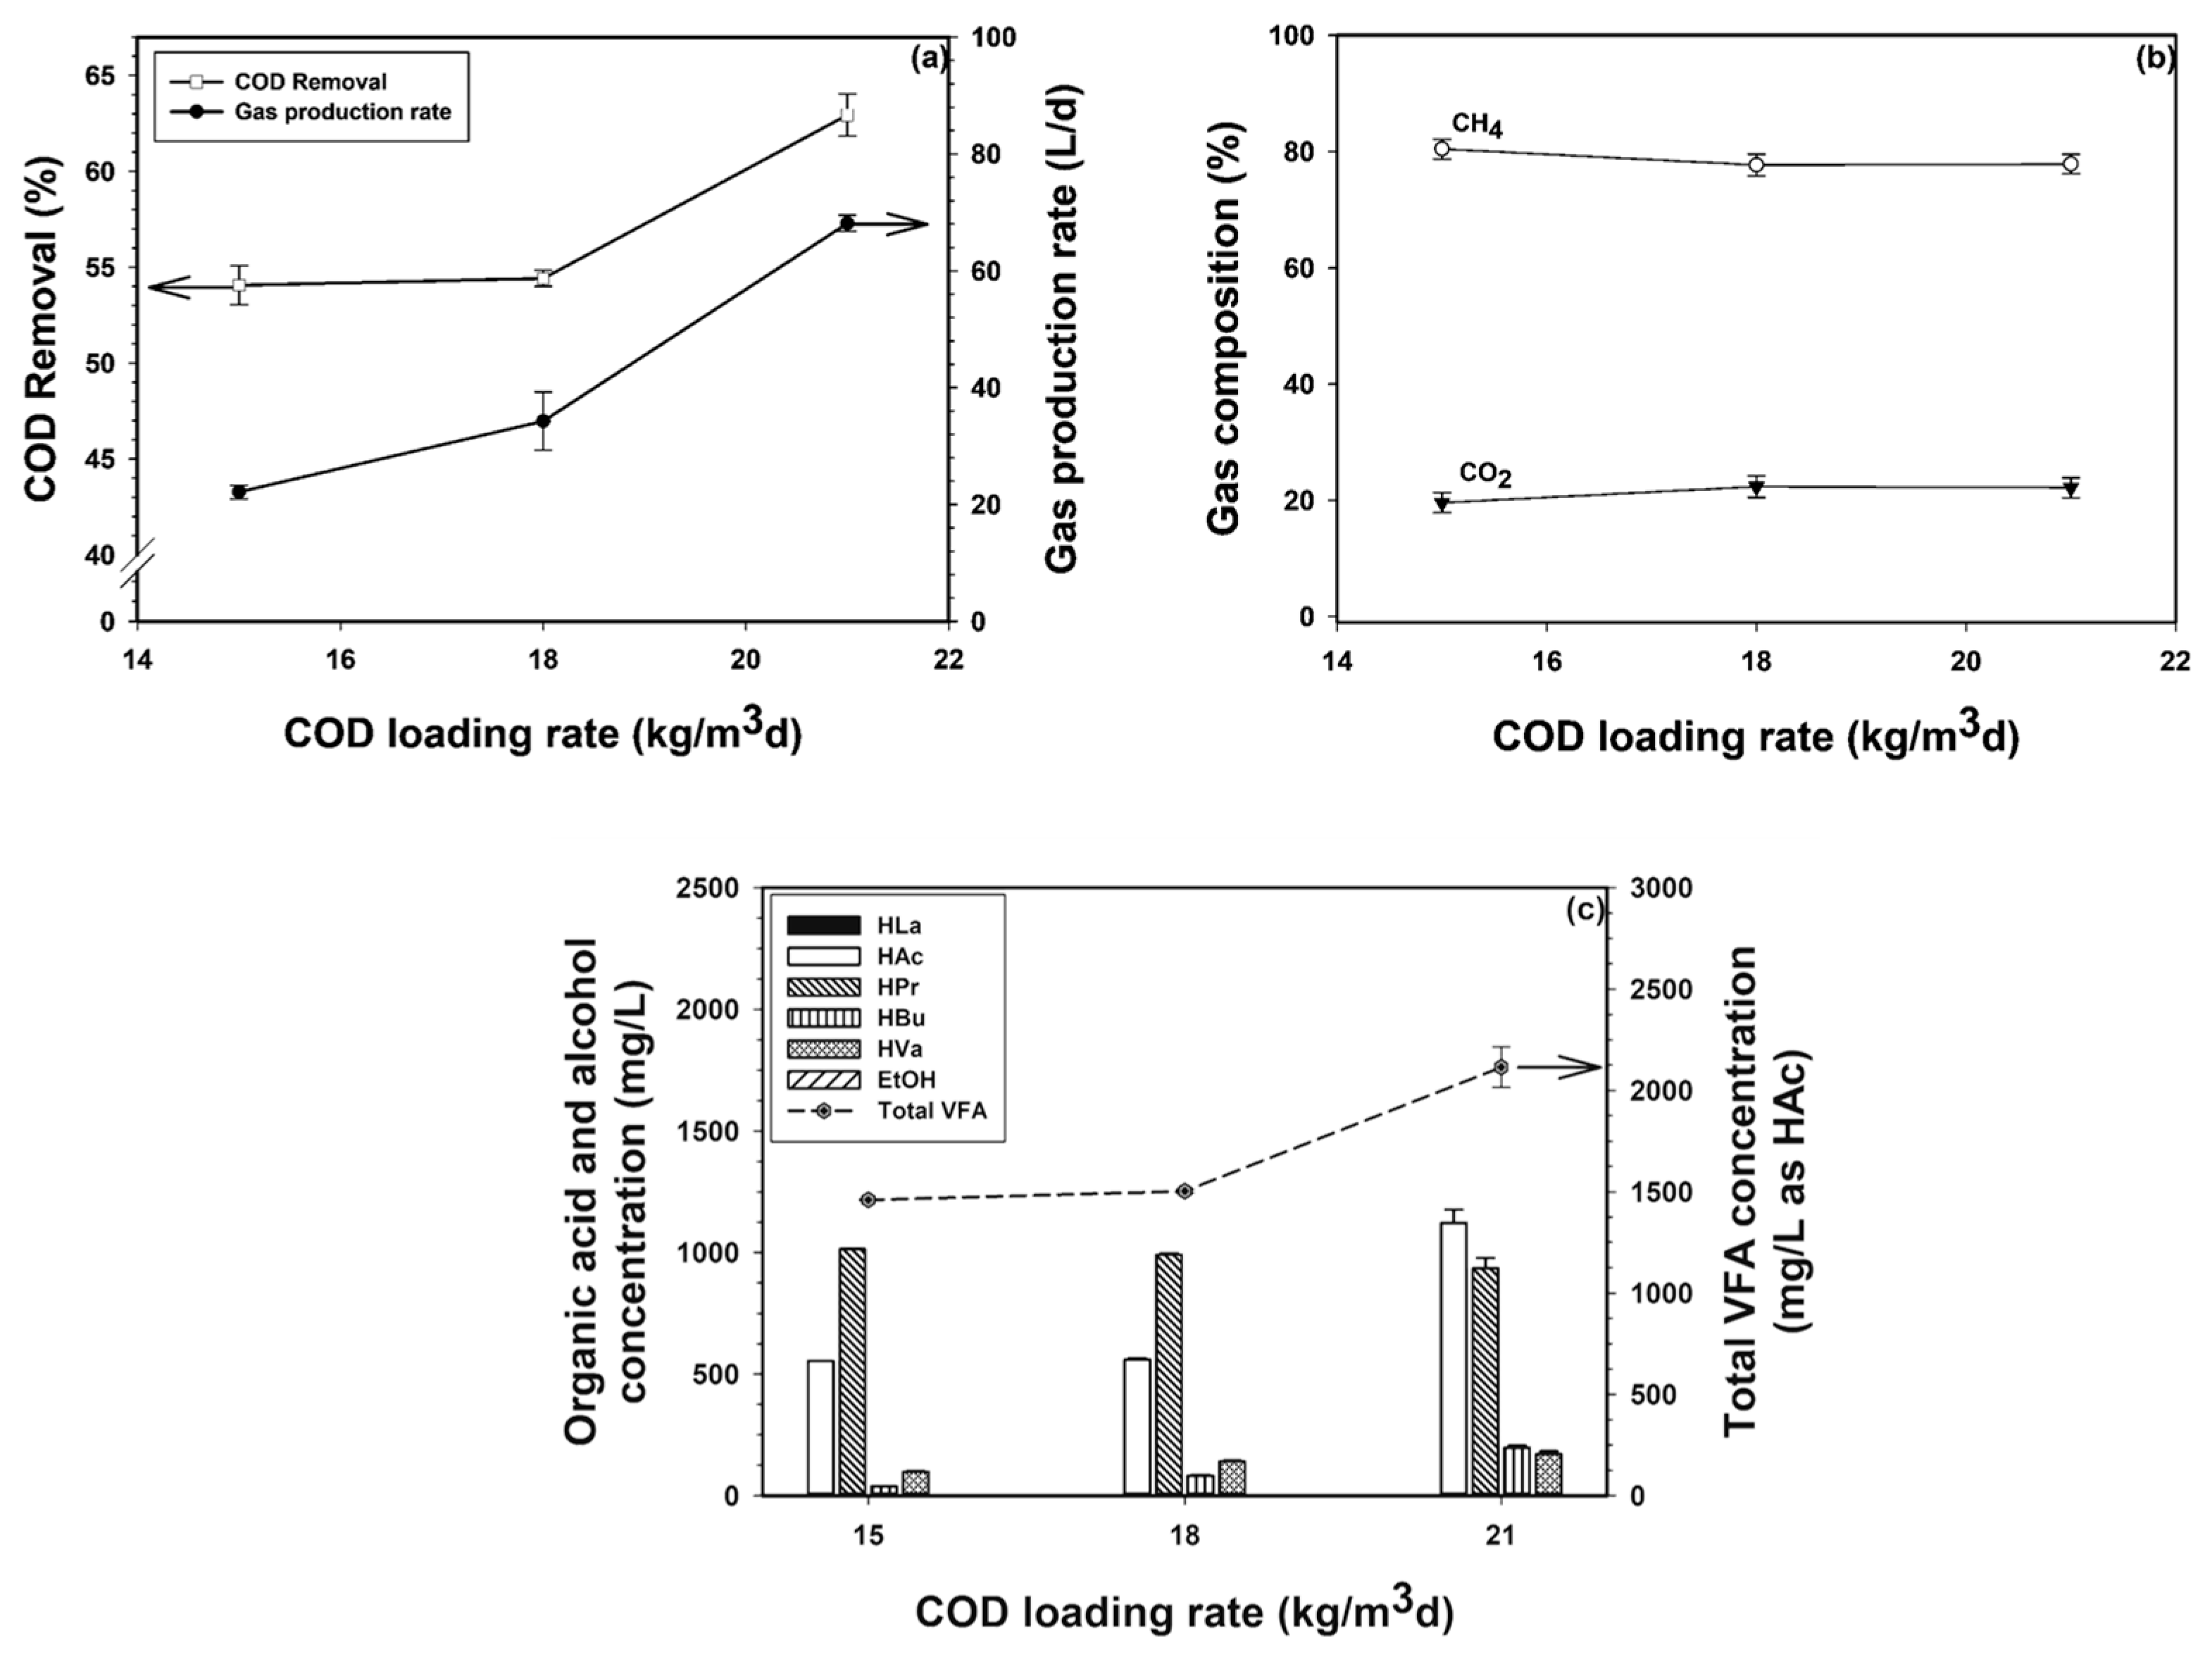
3.1.1. Process Performance of the First Bioreactor

Figure 2a shows the effect of the COD loading rate on the COD removal level and gas production rate in the first bioreactor. Both the COD removal and gas production rate increased when the COD loading rate was increased from 15 to 18 kg/m3d to maximum values of 49.6% for COD removal and 11.8 L/d for gas production. This can be explained by the fact that higher COD loading rates gave higher levels of available substrates for the microbes to produce gaseous products. However, further increasing the COD loading rate from 18 to 21 kg/m3d drastically decreased both the COD removal level and gas production rate. This was likely to be due to the toxicity resulting from VFA accumulation, as experimentally confirmed by the results of VFA (Figure 2c) and discussed below.
As shown in Figure 2b, the composition of gas produced by the first bioreactor consisted mainly of CO2 and CH4 with a small amount of H2. The CH4 concentration slightly decreased with an increasing COD loading rate, while the CO2 concentration showed the opposite trend. The H2 content in the produced gas was very low (less than 3%) and only slightly varied with the COD loading rate. The very low H2 concentration in the first bioreactor resulted from the accumulation of the methanogens, which was caused by the sludge presented in the final effluent from the third bioreactor being recycled to the first bioreactor. Hence, most of the produced H2 was consumed in the first bioreactor.
Figure 2c shows the total VFA concentration and VFA composition as a function of the COD loading rate. The total VFA concentration progressively increased with an increasing COD loading rate. The composition of the produced gas varied, depending on the COD loading rate. For any given COD loading rate, the produced VFA contained large amounts of lactic acid (HLa), acetic acid (HAc), and propionic acid (HPr) with small quantities of butyric acid (HBu) and valeric acid (HVa). Note that HLa was the most prevalent organic acid, in terms of concentration, in the studied range of the COD loading rate. The very high HLa concentrations in the first bioreactor of the studied three-stage ASBR were very different from those previously reported in single- and two-stage anaerobic systems, which, in contrast, showed very low concentrations of HLa [20,28,29]. The very high concentration range of HLa in the first bioreactor of the studied three-stage ASBR system resulted from the high COD loading rates, which were about three- and two-fold higher than those used in single- and two-stage high rate anaerobic systems, respectively. The high COD loading rate range with the acidic condition of pH 5.5 observed in this study suggests that the acidogenic step was dominant in the first bioreactor and so the main products were various organic acids with a small amount of ethanol (EtOH), as shown in the following biochemical reactions summarized in Equations (1)–(9) [20,28,29].
C6H12O6 + 2H2O → 2CH3COOH (HAc) + 2CO2 + 4H2
C6H12O6 → CH3(CH2)2COOH (HBu) + 2CO2 + 2H2
C6H12O6 + 2H2 → 2CH3CH2COOH (HPr) + 2H2O
CH3CH2COOH (HPr) + CH3(CH2)2COOH (HBu) → CH3(CH2)3COOH (HVa) + CH3COOH (HAc)
CH3CH2COOH (HPr) + CH3COOH (HAc) + H2 → CH3(CH2)3COOH (HVa) + 2H2O
CH3CH2COOH (HPr) + 2CO2 + 6H2 → CH3(CH2)3COOH (HVa) + 4H2O
C6H12O6 → 2CH3CHOHCOOH (HLa)
C6H12O6 → 2CH3CH2OH (EtOH) + 2CO2
In addition, EtOH can be also produced from the reaction between HAc and H2, as shown in Equation (9) [24].
CH3COOH (HAc) + 2H2 → CH3CH2OH (EtOH) + H2O
As shown in Figure 2c, the total VFA concentration steadily increased with an increasing COD loading rate. In other words, VFA gradually accumulated in the system when the COD loading rate increased [30]. The results show that the toxic level of total VFA to the acidogens was around 10,000 mg/L as HAc, which is consistent with previous reports [20,23]. Interestingly, among all of the produced VFAs, the highest increase was HPr and followed by HLa and HAc while HBu and HVa varied insignificantly when the COD loading rate increased. Again, the results suggest that the acidogenic step was dominant in the first bioreactor. The unusually high concentration of HLa resulted from the very high COD loading rate conditions.

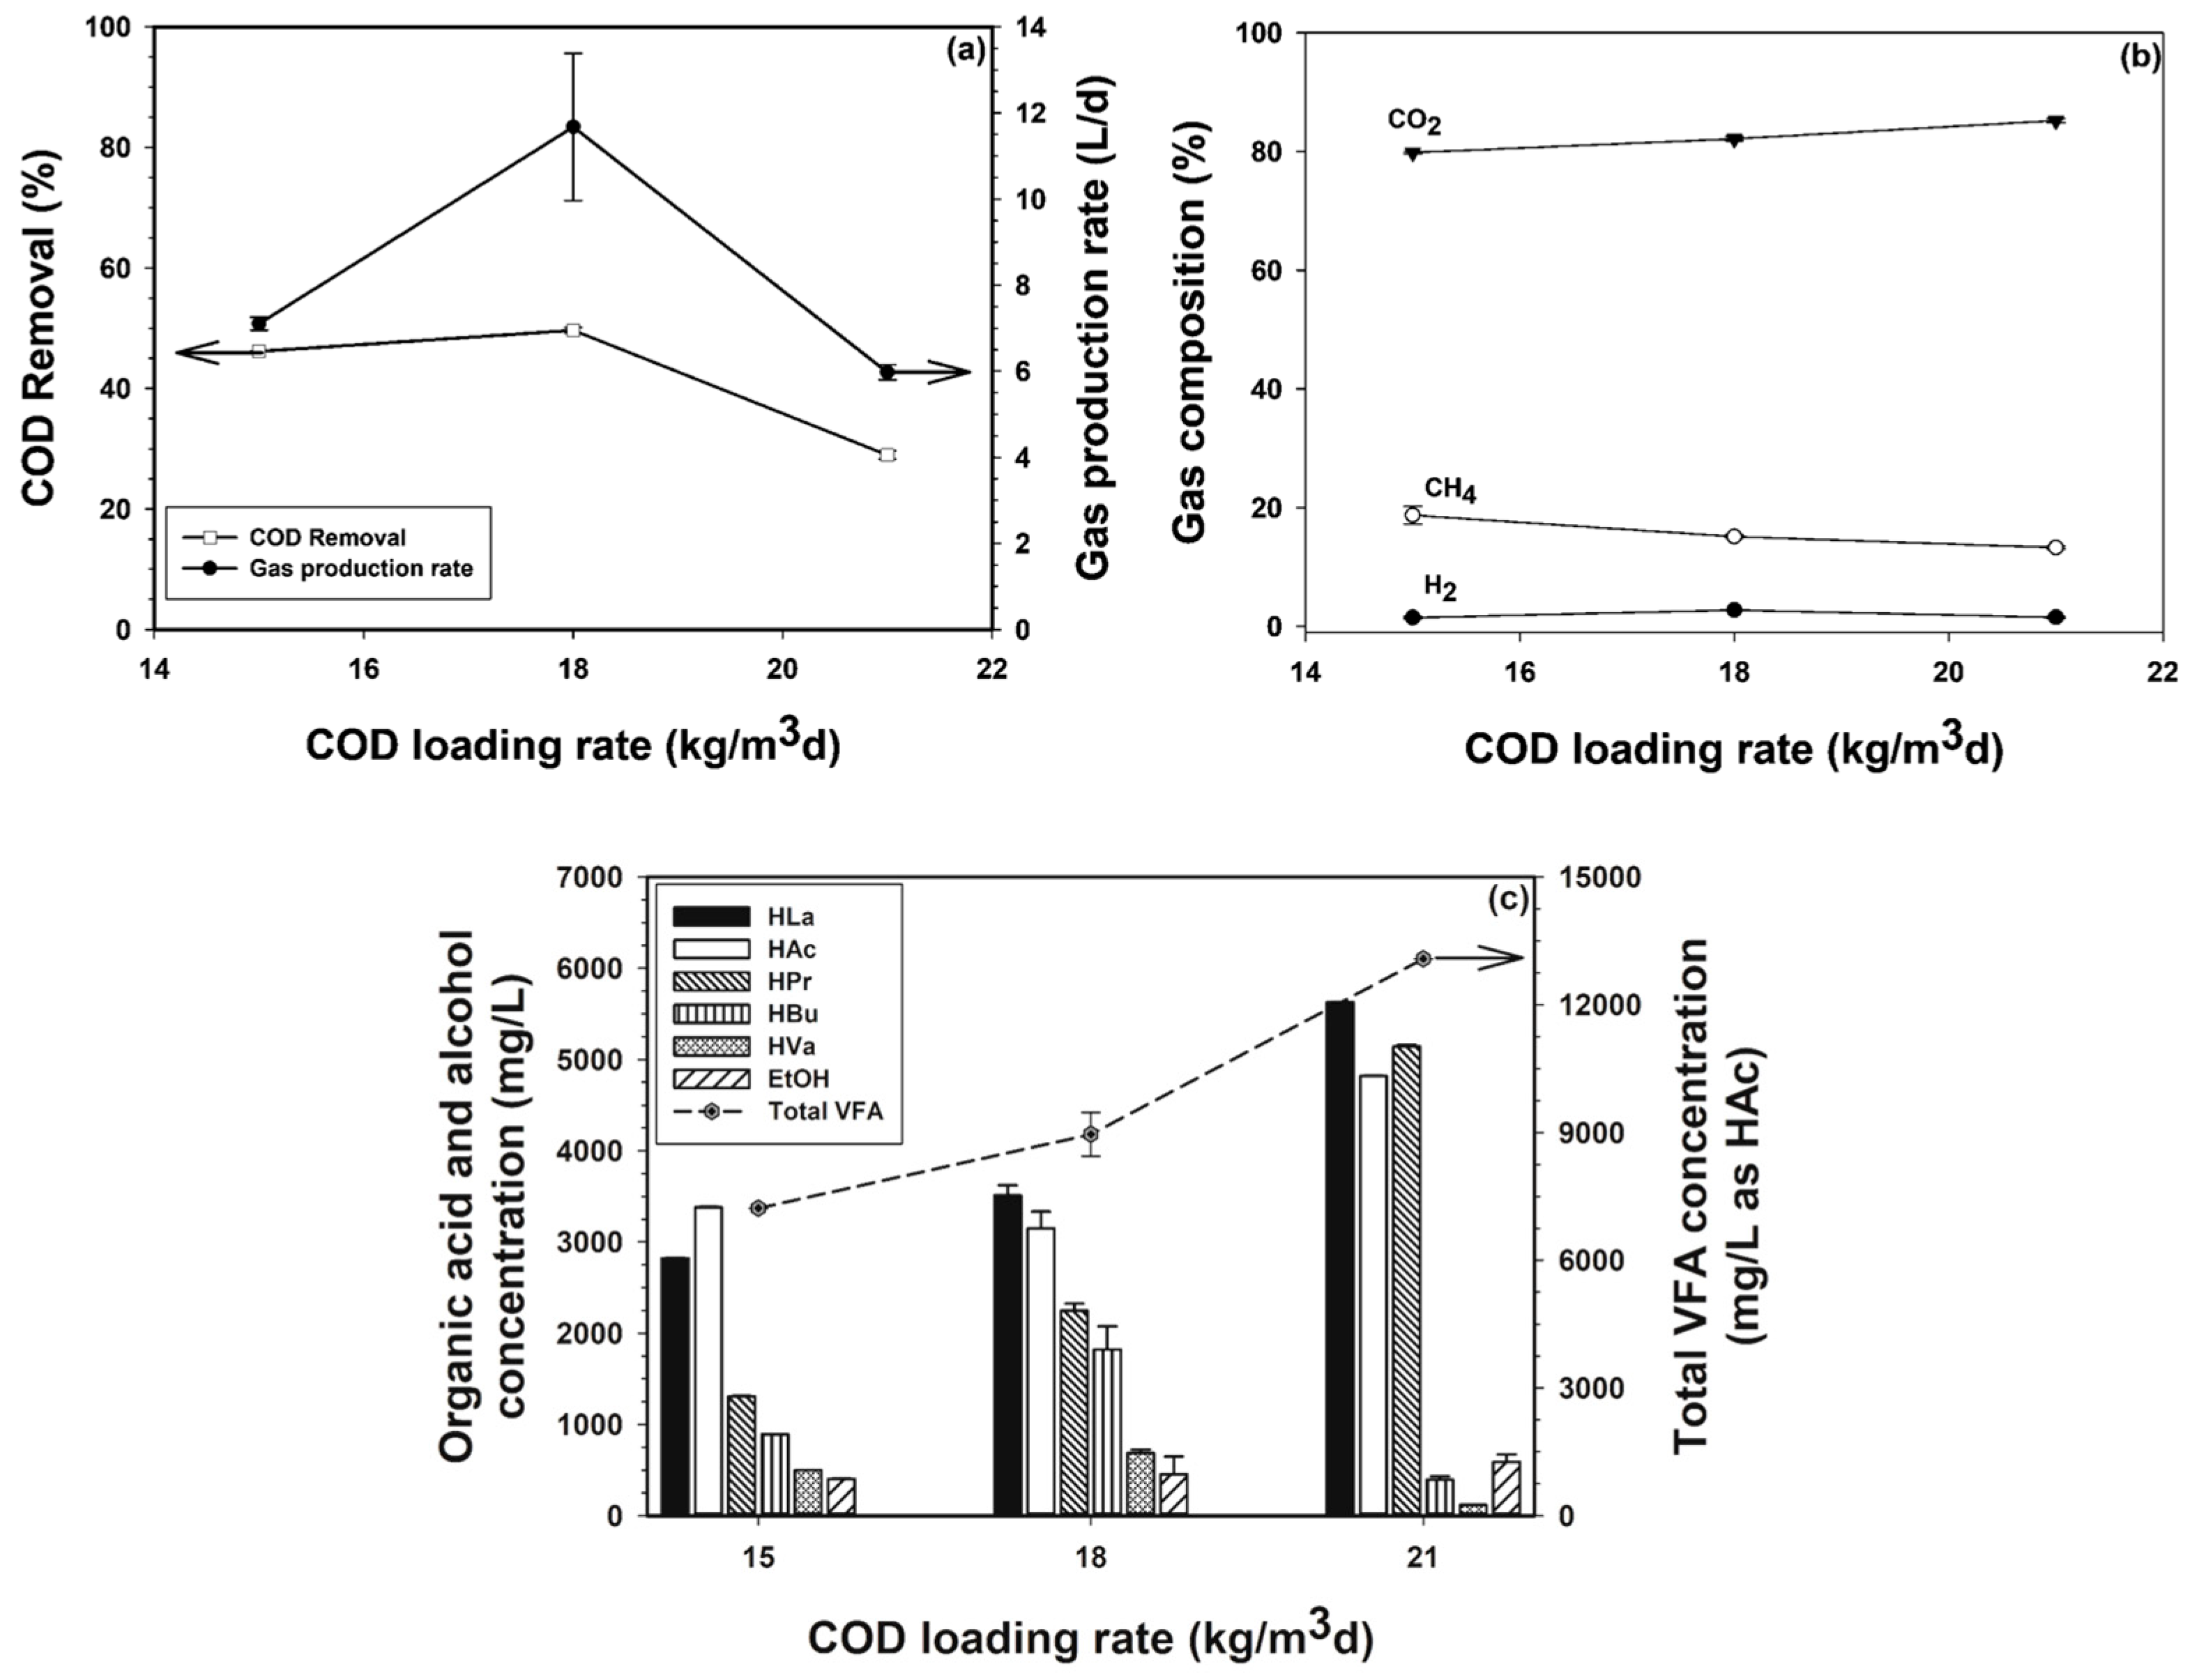
3.1.2. Process Performance of the Second Bioreactor

The effects of the COD loading rate on the COD removal and gas production rate of the second bioreactor are presented in Figure 3a. The COD removal profile showed the same trend as that in the first bioreactor. The highest COD removal of 55.5% was obtained at the optimum COD loading rate of 18 kg/m3d, while the lowest COD removal of 22.2% was found at the highest COD loading rate of 21 kg/m3d. The gas production rate steadily declined as the COD loading rate increased.
The biogas produced in the second bioreactor contained mainly CH4 and CO2 with a small content of H2 (lower than 1%). The CH4 concentration slightly increased with an increasing COD loading rate and reached a maximum value at a COD loading rate of 18 kg/m3d and then declined significantly at the higher COD loading rate of 21 kg/m3d. The profile of CO2 content in the produced biogas exhibited the opposite trend to that of CH4. The same explanation for the effect of the COD loading rate on the process performance of the first bioreactor can be used for that of the second bioreactor.
Figure 3c shows the total VFA concentration and VFA composition as a function of the COD loading rate. The total VFA concentration linearly increased with an increasing COD loading rate. At a COD loading rate lower than the optimum value, the produced VFAs contained mainly HPr and HAc with small amounts of HBu and HVa. When the COD loading rate increased from 15 to 18 kg/m3d, all organic acids increased significantly except for a small increase in HPr. At the highest COD loading rate, representing the overload condition, the formation of HLa appeared with increased levels of all of the organic acids. The decreased COD removal, gas production rate and %CH4 beyond the optimum COD loading rate (18 kg/m3d) resulted from the toxicity of the VFA accumulation. The VFA compositions and the produced gas in the first and second bioreactors suggest that the acetogenic step was dominant with significant methanogenic activity in the second bioreactor under these high COD loading rates. The profile of total VFA concentration in the second bioreactor indicated that the toxicity level of VFA to the acetogens was around 6000 mg/L as HAc.

3.1.3. Process Performance of the Third Bioreactor

The COD removal and gas production rate in the third bioreactor steadily increased with an increasing COD loading rate (Figure 4a). As shown in Figure 4b, the produced gas contained only CH4 and CO2 without H2. The concentrations of both CH4 and CO2 remained almost unchanged under the studied COD loading rates. A comparison of the CH4 contents in the produced gas in all three bioreactors revealed a very high CH4 concentration (about 80%) in the produced gas of the third bioreactor, suggesting that methanogenesis with a high hydrogenotrophic pathway activity was dominant in the system.
As shown in Figure 4c, the total VFA concentration increased with an increasing COD loading rate. The produced VFAs contained mainly HAc and HPr with small amounts of HBu and HVa. All VFAs increased with increasing COD loading rates, with the highest increase being observed for HAc. The results suggest that the rate of the acetogenic step increased with an increasing COD loading rate in the third bioreactor.
The increased gas production rate and COD removal with increasing COD loading levels suggest that the process was not markedly affected by the inhibition of methanogens by the accumulation of VFA under these high COD loading rates. Previous studies at lower COD loading rates found the toxic level of VFA to methanogens to be in the range of 400–800 mg/L as HAc [24,25]. The very high tolerance ability of the methanogens in the third bioreactor to withstand the very high VFA concentration (up to 2100 mg/L as HAc) resulted from the high total alkalinity (about 6500 mg/L as CaCO3) and high solution pH (7.5) in the third bioreactor. The higher the alkalinity and pH, the higher the fraction of produced VFA in dissociated (ionized) forms which are less toxic than the free acid forms. This is one reason why the developed three-stage ASBR system could provide an optimum COD loading rate that was much higher than those of both single- and two-stage anaerobic processes.

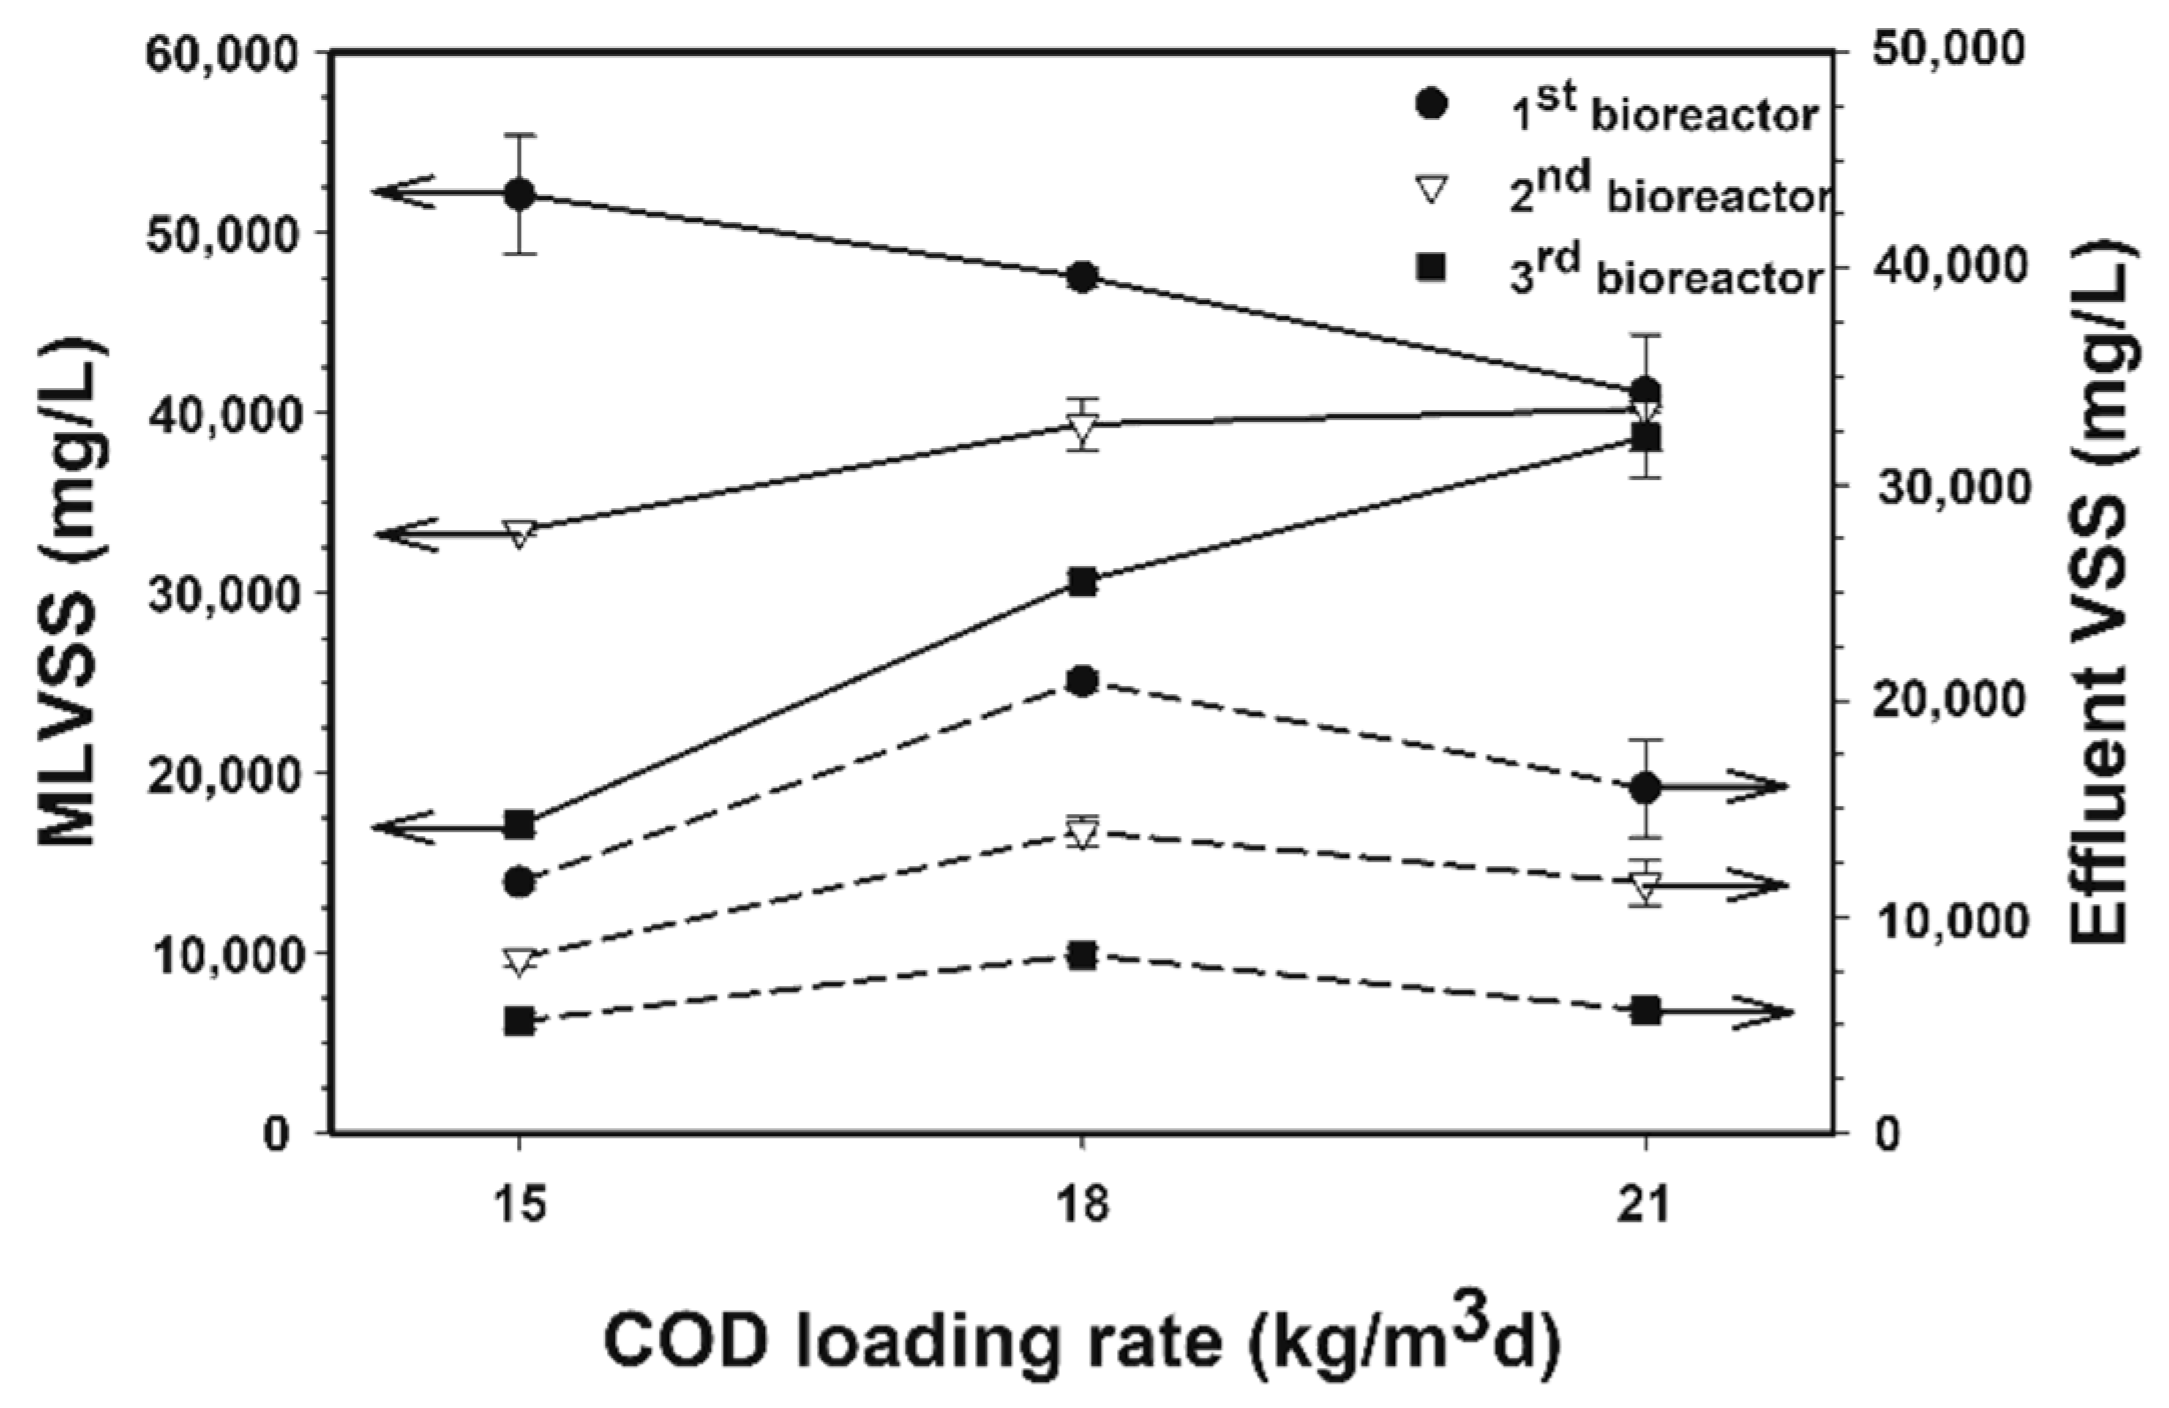
3.1.4. Microbial Concentrations and Microbial Washout Levels

The effects of the COD loading rate on the MLVSS (representing the microbial concentration) and the effluent VSS (representing the microbial washout) of each bioreactor are shown in Figure 5. For the first bioreactor, as the COD loading rate increased, the MLVSS gradually decreased, while the second and third bioreactors both showed the opposite trend. The microbial washout profile of each bioreactor increased and reached a maximum level at the optimum COD loading rate. Beyond the optimum COD loading rate, the microbial washout slightly decreased when the COD loading rate increased from 18 to 21 kg/m3d. The very high concentrations of microbial cells in all bioreactors resulted from both the recycling of the microbial sludge from the third bioreactor to the first bioreactor and the long operation time (12–24 months) without the withdrawal of excess sludge from the system under the high COD loading rate conditions. The very high microbial concentration in all bioreactors was the main reason why the three-stage ASBR system exhibited a high process performance, compared to single- and two-stage anaerobic processes.

3.1.5. Micronutrients

Sufficient quantities of nutrients are needed for both high bacterial activity and growth in anaerobic digestion [31]. Apart from the macronutrients N and P, trace elements (micronutrients), such as Co, Cu, Fe, Mo, Mn, Ni and Zn, are also essential for the metabolic activity of anaerobes [32,33,34]. Fundamentally, various divalent cations (M2+) can chemically combine with dissolved sulfide ion (S2−) dissociated from the produced hydrogen sulfide, as shown in Equations (10)–(13) to form insoluble metal sulfides [35], resulting in the shortage of some micronutrients in anaerobic bioreactors.
H2S(g) ↔ H2S(l)
H2S(l) ↔ H+ + HS
HS- ↔ H+ + S2−
M2+ + S2− ↔ MS(s)
The concentrations of some micronutrients in the feed and the effluents of all ASBR bioreactors at different COD loading rates compared to the theoretical values for anaerobic digestion are presented in Table 2. The ethanol wastewater contained sufficient amounts of all micronutrients. For any COD loading rate, the profiles of all micronutrient concentrations declined markedly after passing through each bioreactor, presumably due to the precipitation of metal sulfides from the reaction of the produced sulfide ions with all micronutrients in the form of divalent cations [34]. Surprisingly, all micronutrients were still present in sufficient amounts for anaerobic digestion in the studied three-stage ASBR system, in contrast to most single- and two-stage anaerobic systems that have a shortage of some micronutrients [34,36,37,38]. The results can be explained by the fact that the three-stage ASBR system of this study had a very high VFA concentration with an extremely high alkalinity and solution pH (5000–5400 mg/L as CaCO3 and pH 6–7 for the second bioreactor and 6000–6500 mg/L as CaCO3 and pH 7.2–7.5 for the third bioreactor), especially in the third bioreactor, resulting in most of the produced H2S (less than 50 ppm in all three bioreactors under the studied COD loading rate) being neutralized. As a result, the system had a lower available amount of free sulfide (S2−) to react with all the micronutrients (divalent cations).

3.2. Part II: Effect of the Bioreactor Volumetric Ratio

In this part, the effect of a bioreactor volumetric ratio was investigated under the base operational conditions (8 cycles/d, 37 °C, COD loading rate of 18 kg/m3d and total ASBR volume of 30 L) by varying the liquid working volumetric ratio of the first:second:third bioreactors of 4:6:20, 5:5:20, 4:8:18 and 6:6:18 in order to determine the optimum bioreactor volumetric ratio for maximizing CH4 production.

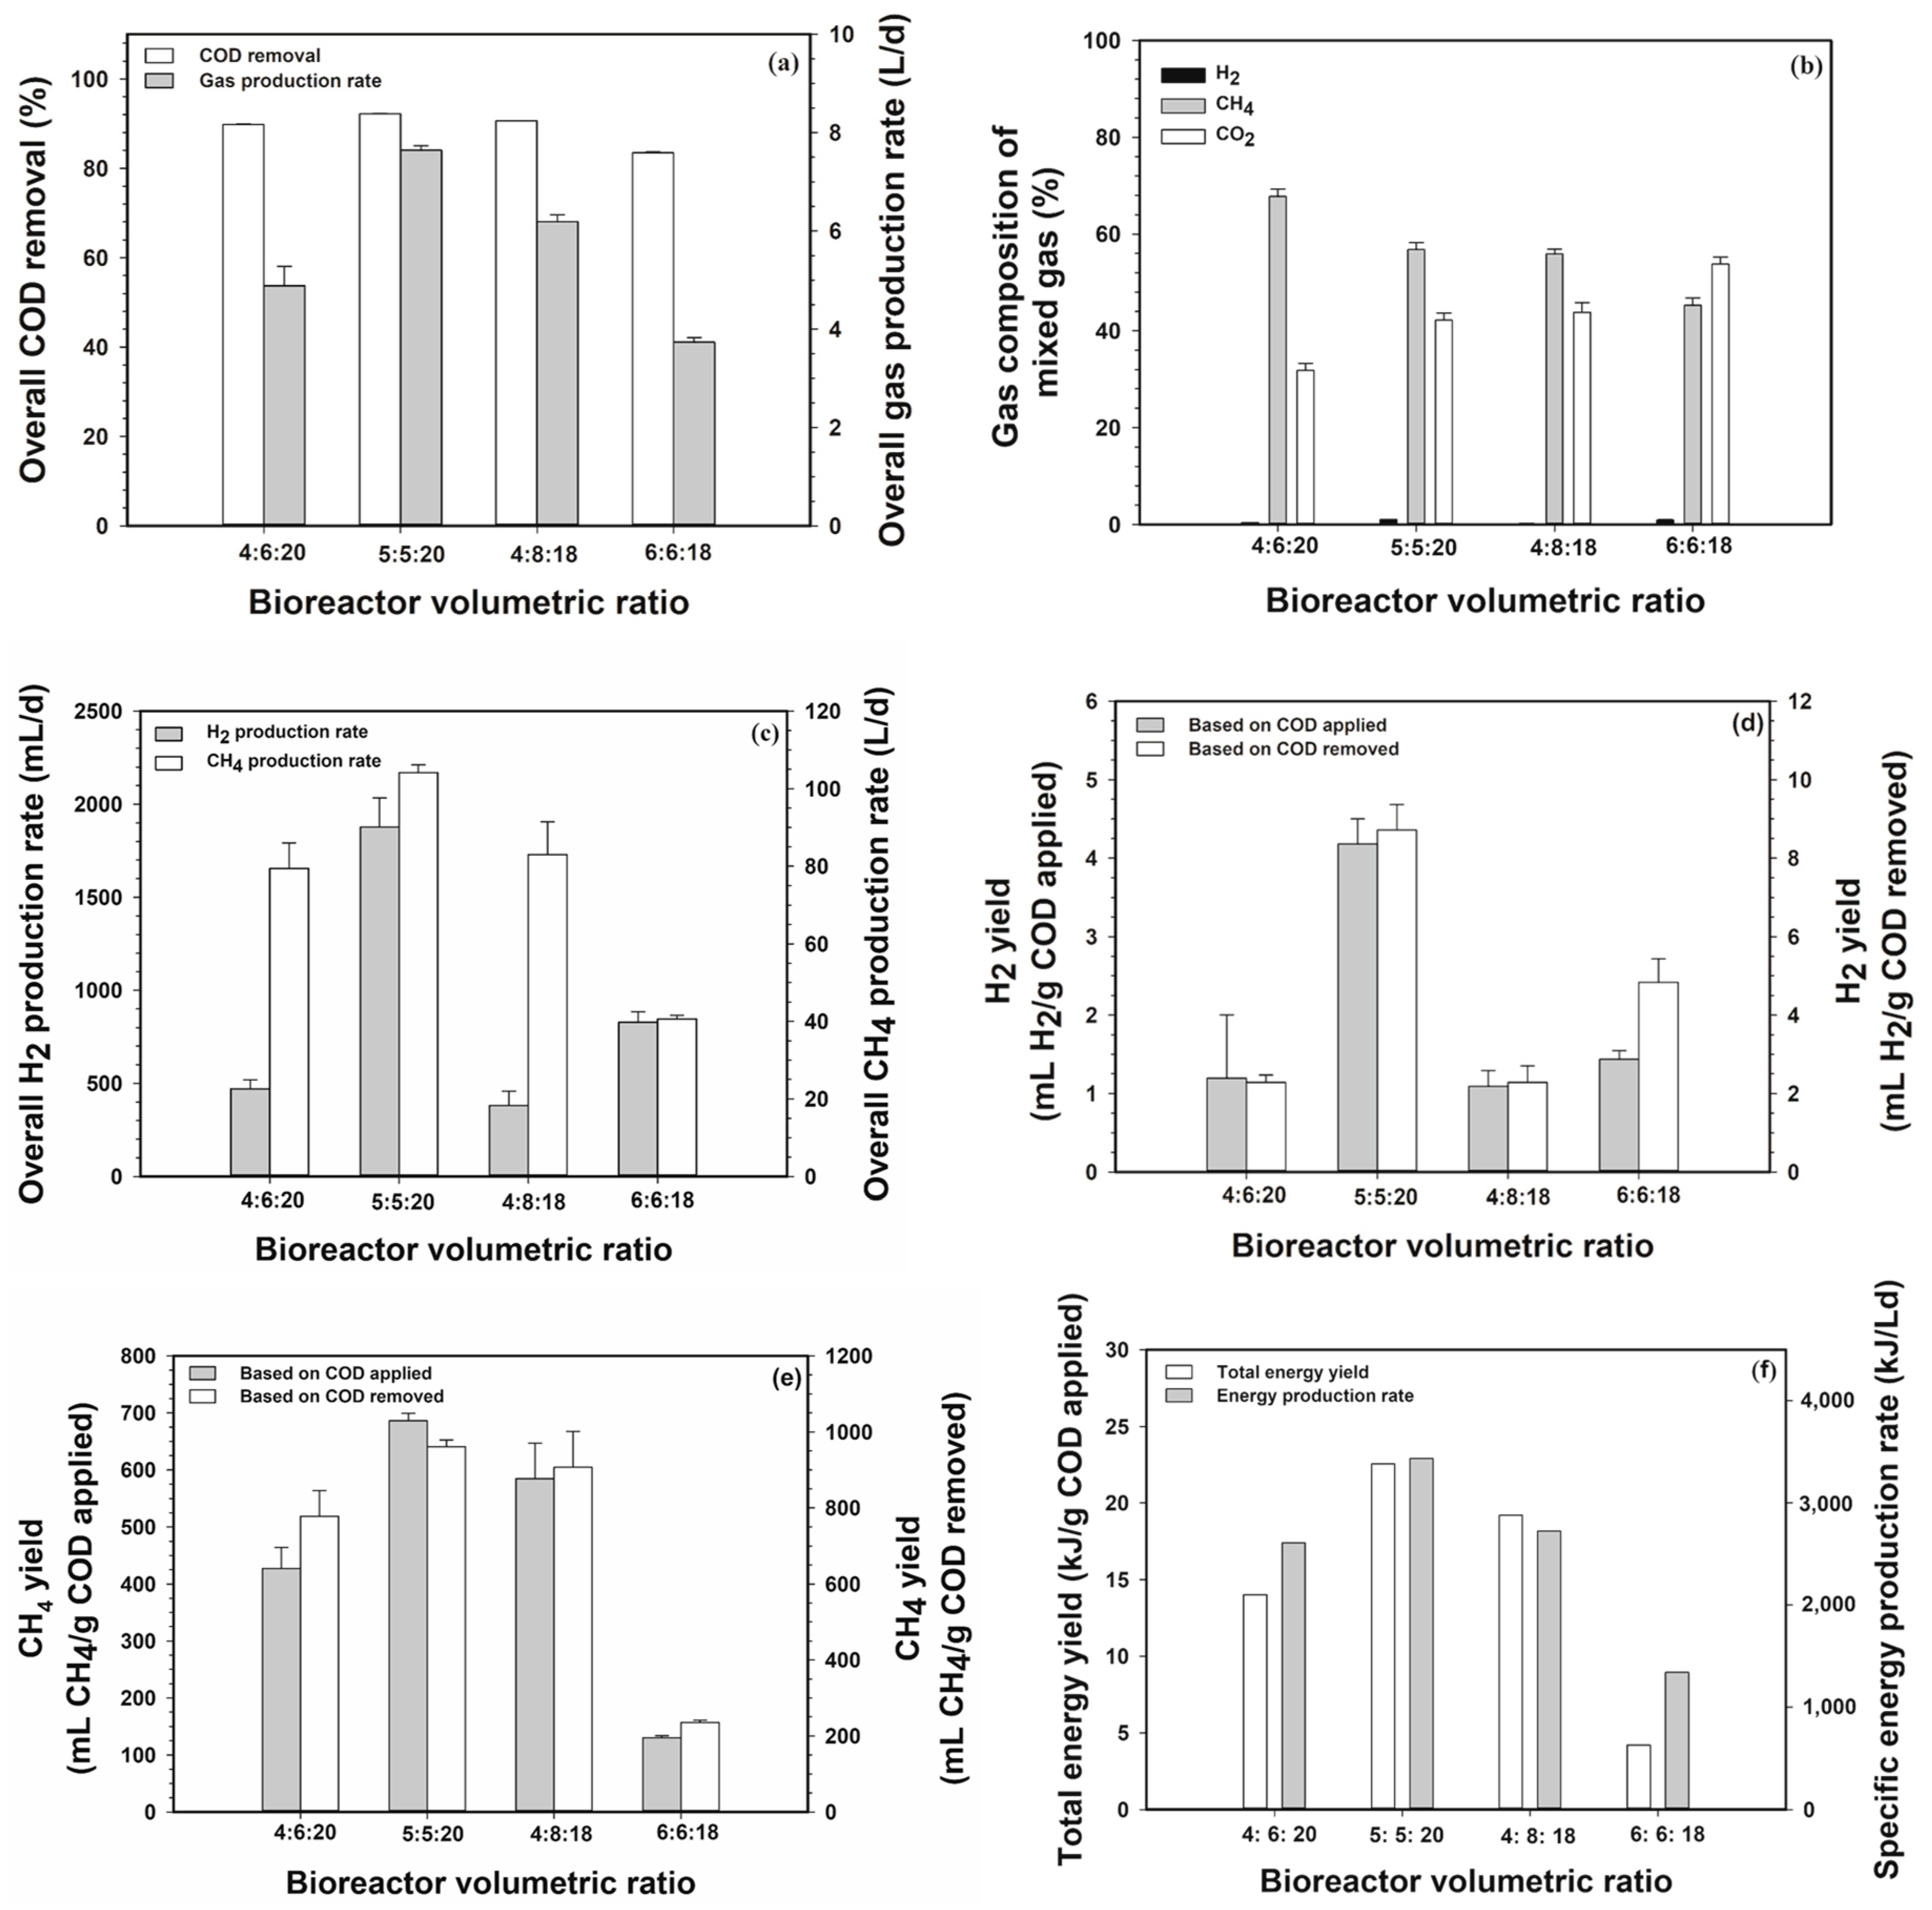
3.2.1. Overall COD Removal and Gas Production Rate

Figure 6a shows the effect of the bioreactor volumetric ratio on the overall COD removal and the overall gas production rate. Both the overall COD removal and gas production rate showed a similar trend with a maximum overall COD removal level (92.1%) and gas production rate (7.6 L/d) being obtained at the bioreactor volumetric ratio of 5:5:20, compared to 83.5% and 3.7 L/d, respectively, at a bioreactor volumetric ratio of 6:6:18, which corresponded to the results of MLVSS as discussed in Section 3.2.7.

3.2.2. Gas Composition of Mixed Gas

The composition of the mixed gas produced from the three bioreactors as a function of the volumetric ratio of the three bioreactors is shown in Figure 6b. The highest CH4 and lowest CO2 content were found at a bioreactor volumetric ratio of 4:6:20. However, the maximum H2 content was found at a volumetric ratio of 5:5:20, which correlated to the highest of MLVSS in the first ASBR bioreactor at this volumetric ratio, as further explained in Section 3.2.7. Moreover, it clearly showed that the volumetric ratio of 6:6:18 provided a higher value of CO2 content than CH4, suggesting that the lowest volume of the third bioreactor gave the lowest rate of the methanogenesis.

3.2.3. Overall H2 and CH4 Production Rates

Figure 6c shows the effect of the volumetric ratio on the H2 and CH4 production rates of the three-stage ASBR system operated at the constant COD loading rate of 18 kg/m3d. Both the H2 and CH4 production rates had similar trends to the gas production rates (Figure 6a). The three-stage ASBR system operated at the volumetric ratio of 5:5:20 also gave the highest H2 and CH4 production rates, suggesting that this volumetric ratio provided the highest activities for all three steps—acidogenesis, acetogenesis and methanogenesis—corresponding to the highest microbial concentrations in all three bioreactors as discussed in Section 3.2.7.

3.2.4. Overall H2 and CH4 Yields

The overall H2 and CH4 yields, based on both the COD applied and COD removed as a function of the volumetric ratio of the three-stage ASBR system are shown in Figure 6d,e, respectively. The three-stage ASBR system with a volumetric ratio of 5:5:20 provided the highest yields of both overall H2 and CH4, corresponding to the highest MLVSS values of all three bioreactors, as discussed in Section 3.2.7. Note that the effect of the volumetric ratio on the overall yields of H2 and CH4 was much greater than that on the overall COD removal.

3.2.5. Specific Energy Production Rate and Yield of Mixed Gas
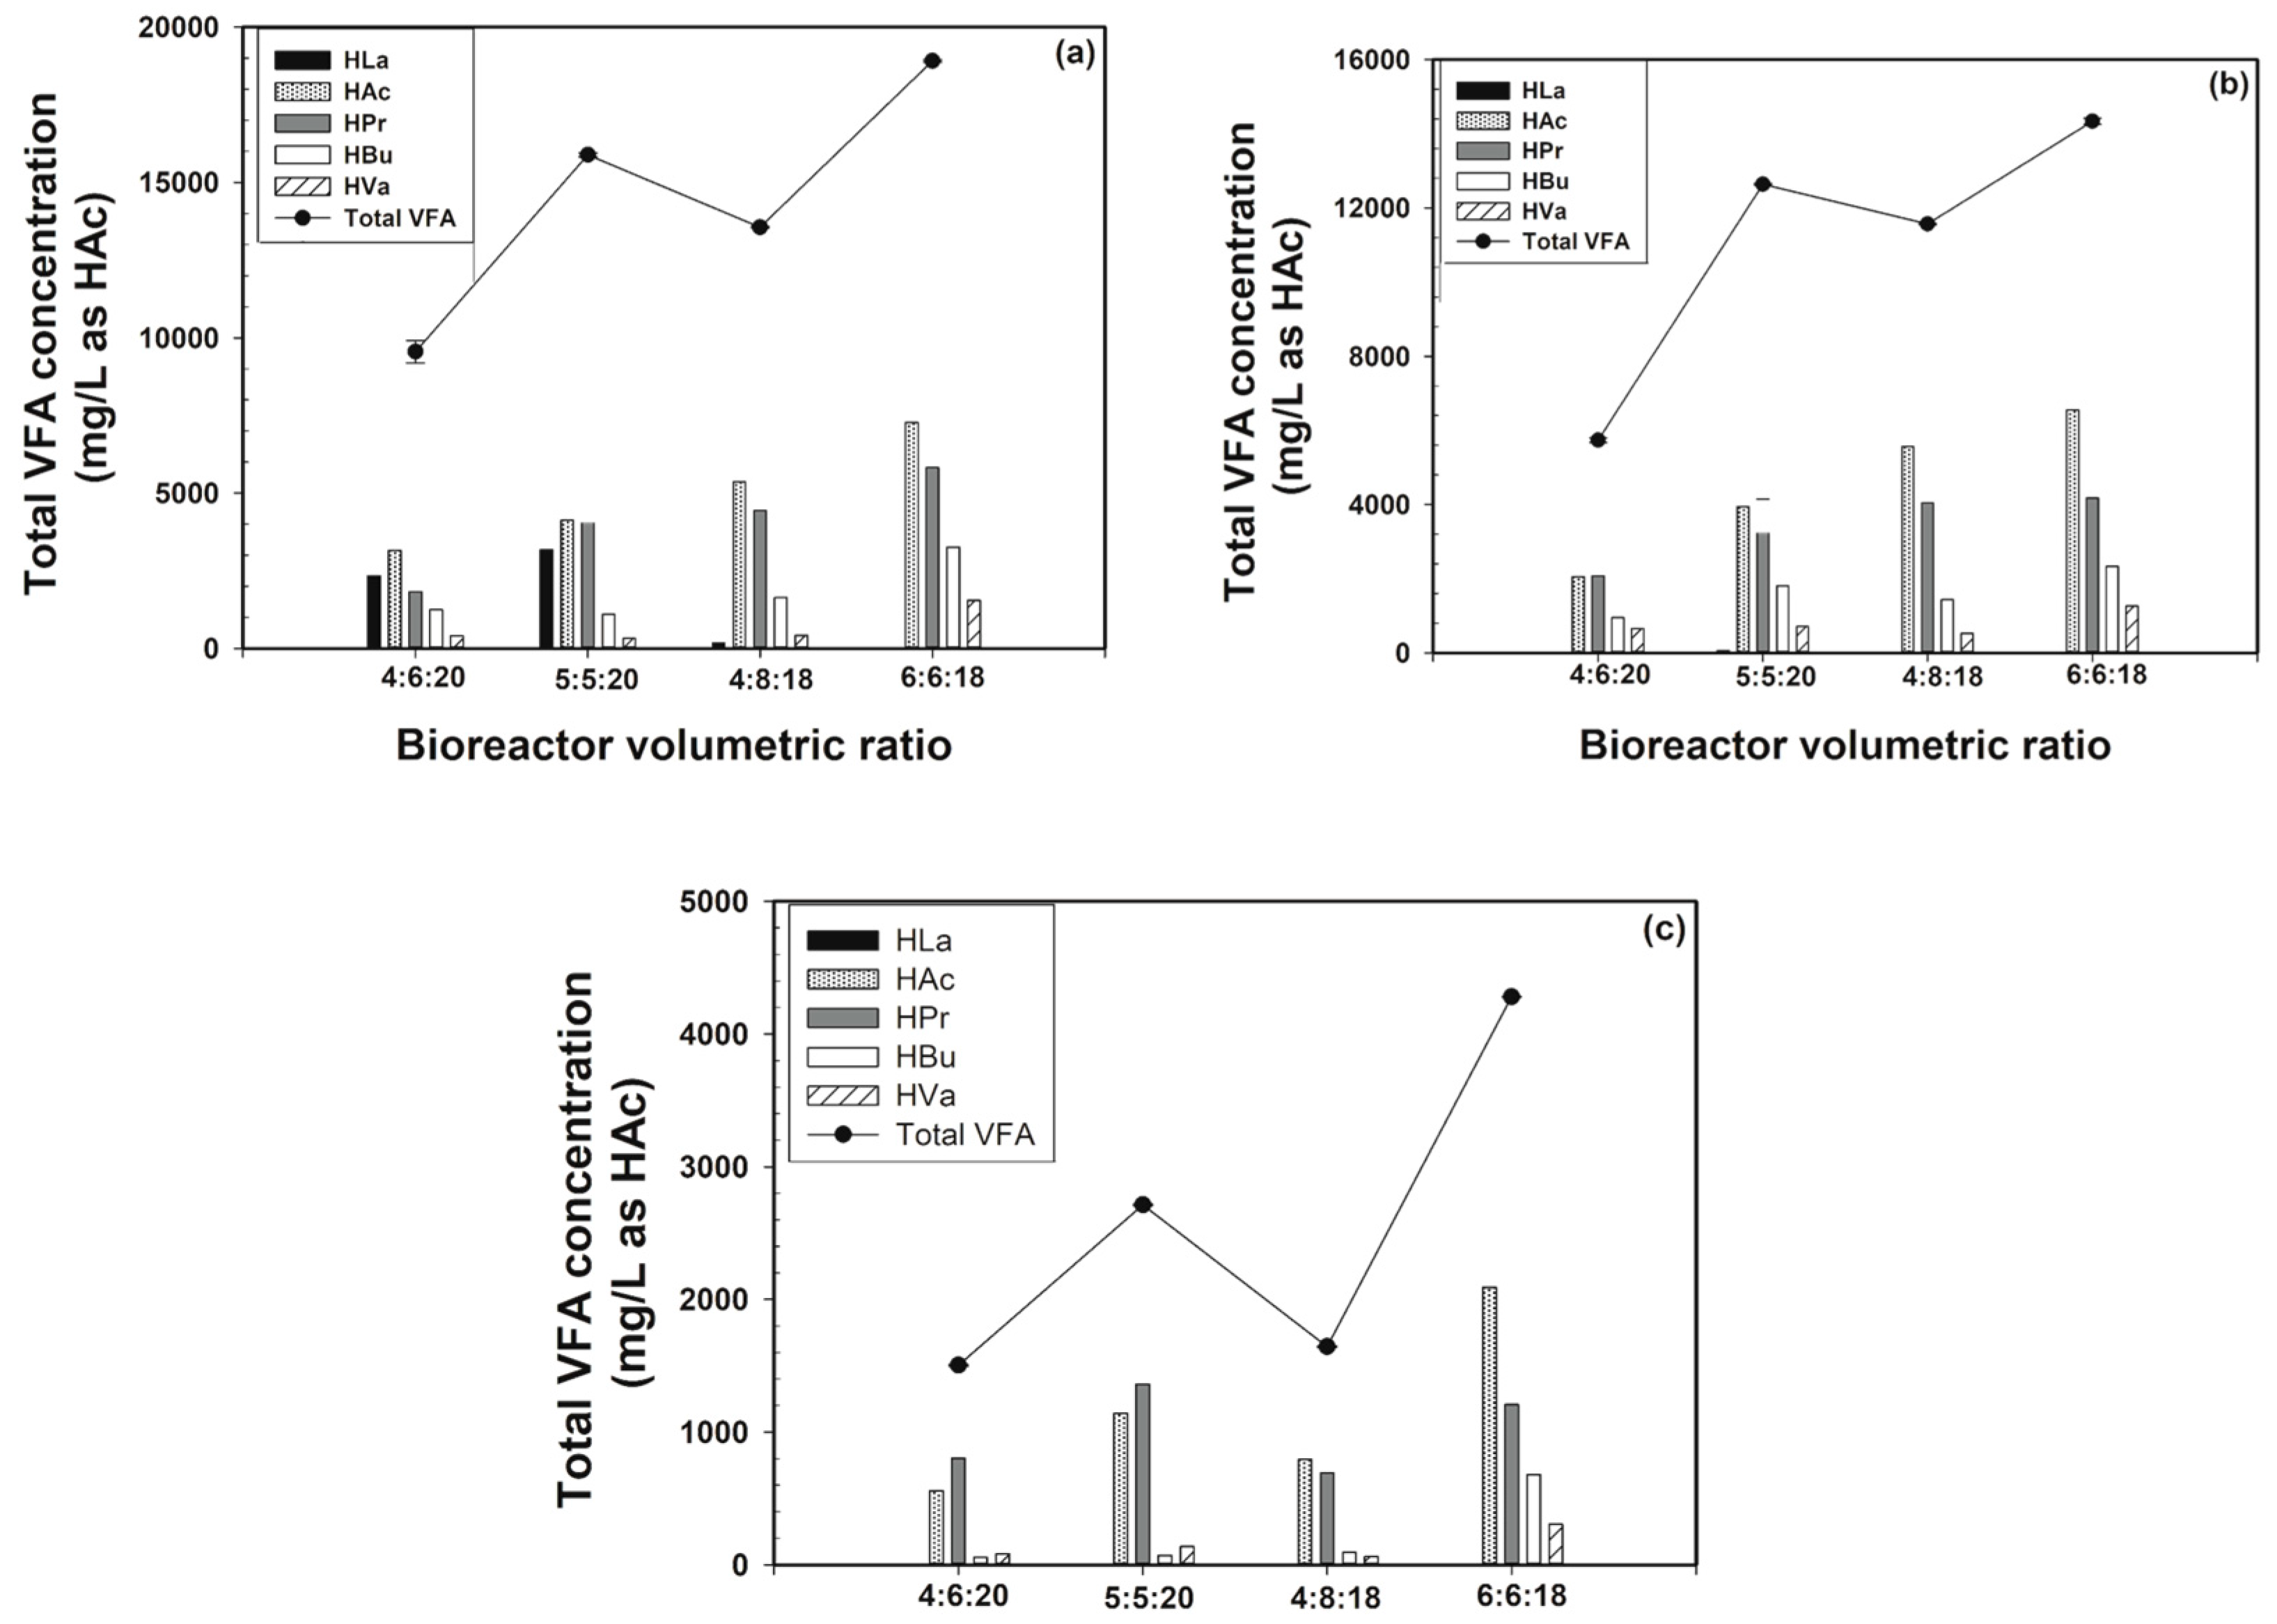
The specific energy production rate and yield of the mixed gas as a function of the bioreactor volumetric ratio are shown in Figure 6f. The values of the specific energy production rate and yield of the mixed gas were calculated based on the heating values of H2 and CH4 of 242 and 801 kJ/mol, respectively [1,39,40]. The profiles of both the specific energy production rate and yield showed similar trends to that of the CH4 yield since the mixed gas mostly contained CH4 with a very small portion of H2. At the optimum bioreactor volumetric ratio of 5:5:20, the system gave the highest process performance in terms of overall COD removal, gas production rates and yields and specific energy production rate and yield.

3.2.6. VFA Levels

The total VFA concentration in each bioreactor as a function of the volumetric ratio is shown in Figure 7, where the total VFA concentration in each bioreactor tended to increase when the volumetric ratio increased. The increasing volumetric ratio simply increased either the volume of the first or second bioreactor, leading to an increase in either the acidogenic or acetogenic activity at the expense of the methanogenic activity. Interestingly, the formation of HLa appeared only in the first bioreactor with low volumetric ratios of 4:6:20 and 5:5:20, suggesting that the high COD loading rate conditions caused the formation of HLa.

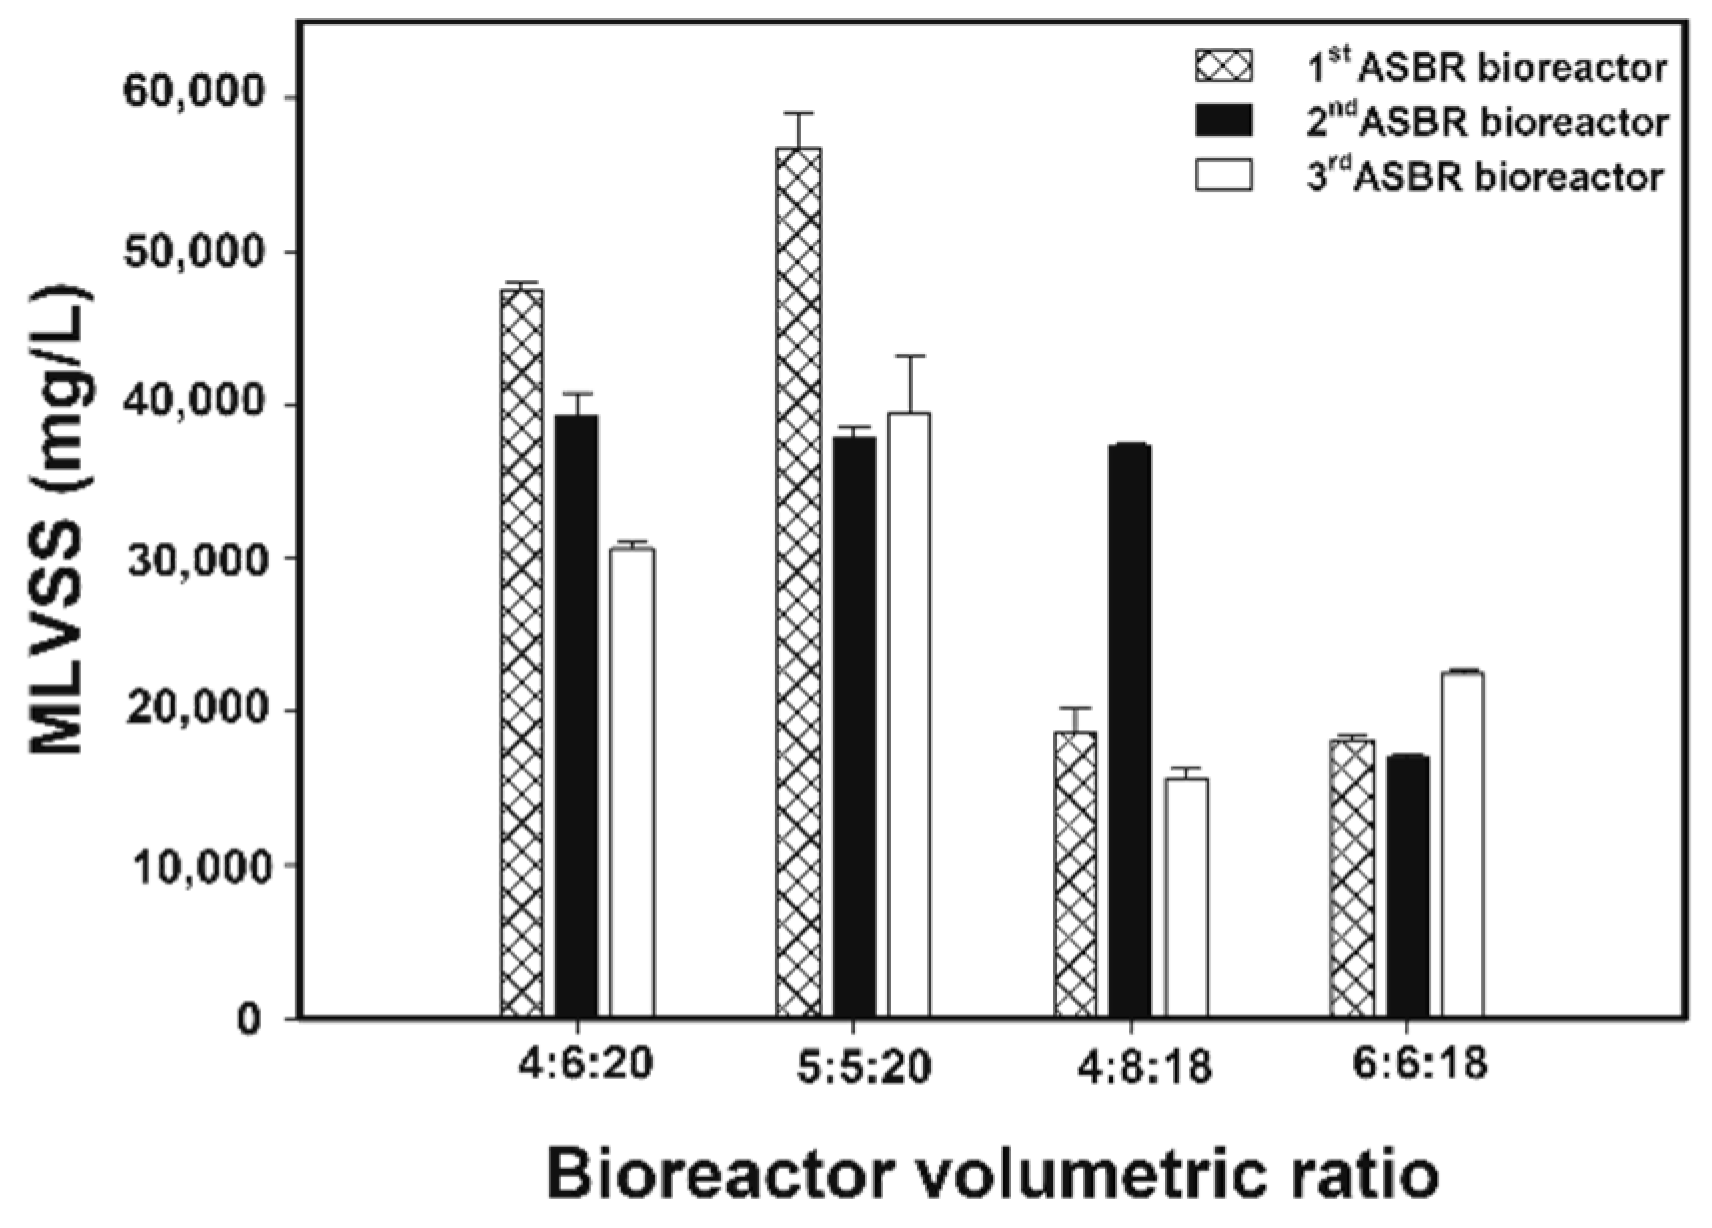
3.2.7. Microbial Concentrations

The MLVSS values of each bioreactor at different volumetric ratios are shown in Figure 8. Interestingly, the volumetric ratio of 5:5:20 provided the highest microbial concentrations (MLVSS) in all three bioreactors, suggesting that a good balance of all three steps (acidogenesis, acetogenesis and methanogenesis) was achieved at this volumetric ratio. Thus, either higher or lower volumetric ratios than the optimum could lead to increased microbial washout from all bioreactors. The highest obtained microbial concentration at the optimum volumetric ratio of 5:5:20 was responsible for the maximum process performance of the studied three-stage ASBR system in terms of gas yields and COD removal.

3.2.8. Comparison of Process Performance

As shown in Table 3, the studied three-stage ASBR system exhibited a superior process performance, specifically, a much higher optimum COD loading rate and energy production yield, compared to both single- and two-stage anaerobic processes treating various wastewaters. This is because the three-stage ASBR system is able to provide very high concentrations of microbial cells in all bioreactors and proper environmental conditions in each bioreactor for the main three steps of anaerobic digestion.

4. Conclusions

A three-stage ASBR system was developed and tested for the separate production of H2 and CH4 with an emphasis on CH4 production by recycling both the effluent and washout sludge from the third bioreactor to the first bioreactor. The studied three-stage ASBR system had a very high optimum COD loading rate of 18 kg/m3d because of the very high microbial concentrations in all three bioreactors without any deficit of micronutrients, due to the high alkalinity and solution pH in the system, especially in the third bioreactor. Under the optimum COD loading rate condition of 18 kg/m3d and bioreactor volumetric ratio of 5:5:20, the three-stage ASBR system provided a very high energy production yield compared with the single- and two-stage anaerobic processes used for treating various wastewaters.

Author Contributions

Conceptualization, A.J., K.V., M.L. and S.C.; Methodology, A.J. and K.V.; Software, A.J.; Validation, A.J., K.V. and S.C.; Formal Analysis, A.J. and K.V.; Investigation, A.J. and K.V.; Resources, S.C.; Data Curation, A.J.; Writing-Original Draft Preparation, A.J.; Writing-Review & Editing, M.L. and S.C.; Visualization, A.J.; Supervision, S.C.; Project Administration, S.C.; Funding Acquisition, S.C.

Funding

This research was funded by a TRF senior scholar grant from the Thailand Research Fund (RTA 5780008), a TRF research grant (RDG 6050068), a research grant from The Minister of Energy (459042-AE1) and a research grant from National Science and Technology Development Agency (NSTDA, P-15-51254).

Acknowledgments

The authors thank Sapthip Co., Ltd., Thailand for providing the seed sludge and ethanol wastewater. The sustainable Petroleum and Petrochemicals Research Unit under the Center of Excellence on Petrochemical and Materials Technology, Chulalongkorn University is also acknowledged for providing research facilities and partial financial support.

Conflicts of Interest

The authors declare no conflict of interest.

Nomenclature

ASBR Anaerobic sequencing batch reactor
COD Chemical oxygen demand
CSTR Complete stirred tank reactor
Co, Co2+Cobalt
Cu, Cu2+Copper
Fe, Fe2+Iron
H2SHydrogen sulfide
M2+ Micronutrients (divalent cations)
MLVSS Mixed liquor volatile suspended solids
Mn, Mn2+Manganese
MSMetal sulfides
Mo, Mo2+Molybdenum
Ni, Ni2+Nickle
NNitrogen
PPhosphorous
SHPR Specific hydrogen production rate
SMPRSpecific methane production rate
TCD Thermal conductivity detector
TSSTotal suspended solids
VFA Volatile fatty acids
VSSVolatile suspended solids
UASB Upflow anaerobic sludge blanket
Zn, Zn2+Zinc

References

  1. Lin, R.; Cheng, J.; Yang, Z.; Ding, L.; Zhang, J.; Zhou, J.; Cen, K. Enhanced energy recovery from cassava ethanol wastewater through sequential dark hydrogen, photo hydrogen and methane fermentation combined with ammonium removal. Bioresour. Technol. 2016, 214, 686–691. [Google Scholar] [CrossRef] [PubMed]
  2. Stamatelatou, K.; Antonopoulou, G.; Lyberatos, G. Production of biogas via anaerobic digestion. Handb. Biofuels Prod. Process. Technol. 2011, 266–304. [Google Scholar] [CrossRef]
  3. Lin, C.-Y.; Lay, C.-H.; Sen, B.; Chu, C.-Y.; Kumar, G.; Chen, C.-C.; Chang, J.-S. Fermentative hydrogen production from wastewaters: A review and prognosis. Int. J. Hydrogen Energy 2012, 37, 15632–15642. [Google Scholar] [CrossRef]
  4. Demirel, B. The impacts of engineered nanomaterials (ENMs) on anaerobic digestion processes. Process Biochem. 2016, 51, 308–313. [Google Scholar] [CrossRef]
  5. Sreethawong, T.; Niyamapa, T.; Neramitsuk, H.; Rangsunvigit, P.; Leethochawalit, M.; Chavadej, S. Hydrogen production from glucose-containing wastewater using an anaerobic sequencing batch reactor: Effects of COD loading rate, nitrogen content, and organic acid composition. Chem. Eng. J. 2010, 160, 322–332. [Google Scholar] [CrossRef]
  6. Seneesrisakul, K.; Sutabutr, T.; Chavadej, S. The effect of temperature on the methanogenic activity in relation to micronutrient availability. Energies 2018, 11, 1057. [Google Scholar] [CrossRef]
  7. Papurello, D.; Iafrate, C.; Lanzini, A.; Santarelli, M. Trace compounds impact on SOFC performance: Experimental and modelling approach. Appl. Energy 2017, 208, 637–654. [Google Scholar] [CrossRef]
  8. Papurello, D.; Tomasi, L.; Silvestri, S.; Belcari, I.; Santarelli, M.; Smeacetto, F.; Biasioli, F. Biogas trace compound removal with ashes using proton transfer reaction time-of-flight mass spectrometry as innovative detection tool. Fuel Process. Technol. 2016, 145, 62–75. [Google Scholar] [CrossRef] [Green Version]
  9. Papurello, D.; Silvestri, S.; Tomasi, L.; Belcari, I.; Biasioli, F.; Santarelli, M. Biowaste for SOFCs. Energy Procedia 2016, 101, 424–431. [Google Scholar] [CrossRef]
  10. Molino, A.; Larocca, V.; Chianese, S.; Musmarra, D. Biofuels production by biomass gasification: A review. Energies 2018, 11, 811. [Google Scholar] [CrossRef]
  11. Liu, D.; Liu, D.; Zeng, R.J.; Angelidaki, I. Hydrogen and methane production from household solid waste in the two-stage fermentation process. Water Res. 2006, 40, 2230–2236. [Google Scholar] [CrossRef] [PubMed]
  12. Liu, X.; Li, R.; Ji, M.; Han, L. Hydrogen and methane production by co-digestion of waste activated sludge and food waste in the two-stage fermentation process: Substrate conversion and energy yield. Bioresour. Technol. 2013, 146, 317–323. [Google Scholar] [CrossRef] [PubMed]
  13. Diamantis, V.I.; Aivasidis, A. Comparison of single-and two-stage UASB reactors used for anaerobic treatment of synthetic fruit wastewater. Enzyme Microb. Technol. 2007, 42, 6–10. [Google Scholar] [CrossRef]
  14. Monlau, F.; Kaparaju, P.; Trably, E.; Steyer, J.P.; Carrere, H. Alkaline pretreatment to enhance one-stage CH4 and two-stage H2/CH4 production from sunflower stalks: Mass, energy and economical balances. Chem. Eng. J. 2015, 260, 377–385. [Google Scholar] [CrossRef]
  15. La Licata, B.; Sagnelli, F.; Boulanger, A.; Lanzini, A.; Leone, P.; Zitella, P.; Santarelli, M. Bio-hydrogen production from organic wastes in a pilot plant reactor and its use in a SOFC. Int. J. Hydrogen Energy 2011, 36, 7861–7865. [Google Scholar] [CrossRef]
  16. Sompong, O.; Suksong, W.; Promnuan, K.; Thipmunee, M.; Mamimin, C.; Prasertsan, P. Two-stage thermophilic fermentation and mesophilic methanogenic process for biohythane production from palm oil mill effluent with methanogenic effluent recirculation for pH control. Int. J. Hydrogen Energy 2016, 41, 21702–21712. [Google Scholar] [CrossRef]
  17. Müller, F.; Maack, G.-C.; Buescher, W. Effects of biogas substrate recirculation on methane yield and efficiency of a liquid-manure-based biogas plant. Energies 2017, 10, 325. [Google Scholar] [CrossRef]
  18. Jiraprasertwong, A. Production of biogas from cassava wastewater using a three-stage upflow anaerobic sludge blanket (UASB) reactor. Renew. Energ. 2018, in press. [Google Scholar]
  19. Intanoo, P.; Chaimongkol, P.; Chavadej, S. Hydrogen and methane production from cassava wastewater using two-stage upflow anaerobic sludge blanket reactors (UASB) with an emphasis on maximum hydrogen production. Int. J. Hydrogen Energy 2016, 41, 6107–6114. [Google Scholar] [CrossRef]
  20. Sreethawong, T.; Chatsiriwatana, S.; Rangsunvigit, P.; Chavadej, S. Hydrogen production from cassava wastewater using an anaerobic sequencing batch reactor: Effects of operational parameters, COD: N ratio, and organic acid composition. Int. J. Hydrogen Energy 2010, 35, 4092–4102. [Google Scholar] [CrossRef]
  21. Lay, J.-J.; Lee, Y.-J.; Noike, T. Feasibility of biological hydrogen production from organic fraction of municipal solid waste. Water Res. 1999, 33, 2579–2586. [Google Scholar] [CrossRef]
  22. Argun, H.; Kargi, F.; Kapdan, I.K.; Oztekin, R. Biohydrogen production by dark fermentation of wheat powder solution: Effects of C/N and C/P ratio on hydrogen yield and formation rate. Int. J. Hydrogen Energy 2008, 33, 1813–1819. [Google Scholar] [CrossRef]
  23. Intanoo, P.; Rangsunvigit, P.; Namprohm, W.; Thamprajamchit, B.; Chavadej, J.; Chavadej, S. Hydrogen production from alcohol wastewater by an anaerobic sequencing batch reactor under thermophilic operation: Nitrogen and phosphorous uptakes and transformation. Int. J. Hydrogen Energy 2012, 37, 11104–11112. [Google Scholar] [CrossRef]
  24. Intanoo, P.; Rangsanvigit, P.; Malakul, P.; Chavadej, S. Optimization of separate hydrogen and methane production from cassava wastewater using two-stage upflow anaerobic sludge blanket reactor (UASB) system under thermophilic operation. Bioresour. Technol. 2014, 173, 256–265. [Google Scholar] [CrossRef] [PubMed]
  25. Watcharanurak, T. Three-Stage ASBR System for Separate Production of H2 and CH4 from Ethanol Wastewater. Master’s Thesis, The Petroleum and Petrochemical College, Chulalongkorn University, Bangkok, Thailand, 2016. [Google Scholar]
  26. Association, A.P.H.; Association, A.W.W.; Federation, W.P.C.; Federation, W.E. Standard Methods for the Examination of Water and Wastewater, 23th ed.; American Public Health Association: Washington, DC, USA, 2017; Volume 1. [Google Scholar]
  27. Intanoo, P.; Suttikul, T.; Leethochawalit, M.; Gulari, E.; Chavadej, S. Hydrogen production from alcohol wastewater with added fermentation residue by an anaerobic sequencing batch reactor (ASBR) under thermophilic operation. Int. J. Hydrogen Energy 2014, 39, 9611–9620. [Google Scholar] [CrossRef]
  28. Venkata Mohan, S.; Mohanakrishna, G.; Sarma, P.N. Integration of acidogenic and methanogenic processes for simultaneous production of biohydrogen and methane from wastewater treatment. Int. J. Hydrogen Energy 2008, 33, 2156–2166. [Google Scholar] [CrossRef]
  29. Balachandar, G.; Khanna, N.; Das, D. Biohydrogen production from organic wastes by dark fermentation—Chapter 6. Biohydrogen 2013, 103–144. [Google Scholar] [CrossRef]
  30. Ali Shah, F.; Mahmood, Q.; Maroof Shah, M.; Pervez, A.; Ahmad Asad, S. Microbial ecology of anaerobic digesters: The key players of anaerobiosis. Sci. World J. 2014, 2014, 183752. [Google Scholar] [CrossRef] [PubMed]
  31. Linville, J.L.; Shen, Y.; Schoene, R.P.; Nguyen, M.; Urgun-Demirtas, M.; Snyder, S.W. Impact of trace element additives on anaerobic digestion of sewage sludge with in-situ carbon dioxide sequestration. Process Biochem. 2016, 51, 1283–1289. [Google Scholar] [CrossRef]
  32. Burgess, J.E.; Quarmby, J.; Stephenson, T. Micronutrient supplements for optimisation of the treatment of industrial wastewater using activated sludge. Water Res. 1999, 33, 3707–3714. [Google Scholar] [CrossRef]
  33. Choong, Y.Y.; Norli, I.; Abdullah, A.Z.; Yhaya, M.F. Impacts of trace element supplementation on the performance of anaerobic digestion process: A critical review. Bioresour. Technol. 2016, 209, 369–379. [Google Scholar] [CrossRef] [PubMed]
  34. Voelklein, M.A.; O’ Shea, R.; Jacob, A.; Murphy, J.D. Role of trace elements in single and two-stage digestion of food waste at high organic loading rates. Energy 2017, 121, 185–192. [Google Scholar] [CrossRef]
  35. Zhang, L.; De Schryver, P.; De Gusseme, B.; De Muynck, W.; Boon, N.; Verstraete, W. Chemical and biological technologies for hydrogen sulfide emission control in sewer systems: A review. Water Res. 2008, 42, 1–12. [Google Scholar] [CrossRef] [PubMed]
  36. Demirel, B.; Scherer, P. Trace element requirements of agricultural biogas digesters during biological conversion of renewable biomass to methane. Biomass Bioenergy 2011, 35, 992–998. [Google Scholar] [CrossRef]
  37. Thanh, P.M.; Ketheesan, B.; Yan, Z.; Stuckey, D. Trace metal speciation and bioavailability in anaerobic digestion: A review. Biotechnol. Adv. 2016, 34, 122–136. [Google Scholar] [CrossRef] [PubMed]
  38. Narra, M.; Balasubramanian, V.; Kurchania, A.; Pathak, B.S.; Shyam, M. Enhanced biogas production from rice straw by selective micronutrients under solid state anaerobic digestion. Bioresour. Technol. 2016, 220, 666–671. [Google Scholar] [CrossRef] [PubMed]
  39. Cheng, J.; Xie, B.; Zhou, J.; Song, W.; Cen, K. Cogeneration of H2 and CH4 from water hyacinth by two-step anaerobic fermentation. Int. J. Hydrogen Energy 2010, 35, 3029–3035. [Google Scholar] [CrossRef]
  40. Wang, Y.; Zhang, Y.; Meng, L.; Wang, J.; Zhang, W. Hydrogen–methane production from swine manure: Effect of pretreatment and VFAs accumulation on gas yield. Biomass Bioenergy 2009, 33, 1131–1138. [Google Scholar] [CrossRef]
  41. Searmsirimongkol, P.; Rangsunvigit, P.; Leethochawalit, M.; Chavadej, S. Hydrogen production from alcohol distillery wastewater containing high potassium and sulfate using an anaerobic sequencing batch reactor. Int. J. Hydrogen Energy 2011, 36, 12810–12821. [Google Scholar] [CrossRef]
  42. Antonopoulou, G.; Stamatelatou, K.; Venetsaneas, N.; Kornaros, M.; Lyberatos, G. Biohydrogen and methane production from cheese whey in a two-stage anaerobic process. Ind. Eng. Chem. Res. 2008, 47, 5227–5233. [Google Scholar] [CrossRef]
Figure 1. Schematic representation of the three-stage anaerobic sequencing batch reactor (ASBR) system.
Energies 11 01543 g001
Figure 2. Effect of the COD loading rate on the (a) COD removal and gas production rate, (b) gas composition and (c) total VFA concentration and VFA composition of the first bioreactor operated at 37 °C and 6 cycles/d.
Energies 11 01543 g002
Figure 3. Effect of the COD loading rate on the (a) COD removal and gas production rate, (b) gas composition and (c) total VFA concentration and VFA composition of the second bioreactor operated at 37 °C and 6 cycles/d.
Energies 11 01543 g003
Figure 4. Effect of the COD loading rate on the (a) COD removal and gas production rate, (b) gas composition and (c) total VFA concentration and VFA composition of the third bioreactor operated at 37 °C and 6 cycles/d.
Energies 11 01543 g004
Figure 5. Mixed liquid volatile suspended solids (MLVSS) and effluent VSS of the three-stage ASBR system.
Energies 11 01543 g005
Figure 6. Effect of the bioreactor volumetric ratio on the (a) overall COD removal and overall gas production rate, (b) composition of mixed gas, (c) H2 and CH4 production rates of mixed gas, (d) H2 yields, (e) CH4 yields and (f) total energy yield and specific energy production rate of mixed gas when the three-stage ASBR system was operated at a COD loading rate of 18 kg/m3d, 37 °C and 8 cycles/d.
Energies 11 01543 g006
Figure 7. Effect of the bioreactor volumetric ratio on the total VFA concentration and VFA composition of the (a) first, (b) second and (c) third bioreactors when the three-stage ASBR system was operated at a COD loading rate of 18 kg/m3d, 37 °C and 8 cycles/d.
Energies 11 01543 g007
Figure 8. Effect of the bioreactor volumetric ratio on the MLVSS when the three-stage ASBR system was operated at a COD loading rate of 18 kg/m3d, 37 °C and 8 cycles/d.
Energies 11 01543 g008
Table 1. Characteristics of the ethanol wastewater used in this study.
ParameterUnitsValue
pH-3.72
Total chemical oxygen demand (COD)mg/L80,000
Total volatile fatty acids (VFA) mg/L as HAc12,600
Ethanol concentrationmg/L530
Total suspended solids (TSS) mg/L31,700
Total phosphorous (P)mg/L1070
Total nitrogen (N)mg/L825
COD:N:Pby weight100:1.4:1.8
Table 2. Micronutrient concentrations in the three-stage ASBR system operated at 37 °C at different COD loading rates.
Trace ElementConcentration (mg/L)
Theoretical Values for Anaerobic Digestion [36] FeedCOD Loading Rate of 15 kg/m3dCOD Loading Rate of 18 kg/m3dCOD Loading Rate of 21 kg/m3d
Effluent ofEffluent ofEffluent of
1st ASBR Unit2nd ASBR Unit3rd ASBR Unit1st ASBR Unit2nd ASBR Unit3rd ASBR Unit1st ASBR Unit2nd ASBR Unit3rd ASBR Unit
Co2+0.10–5.000.110.170.130.110.190.170.150.170.170.15
Cu2+0.01–0.050.200.110.090.030.100.060.060.930.130.09
Fe2+0.10–0.4036.1237.977.495.3247.2120.947.4529.7625.456.36
Mn2+0.01–0.054.943.101.470.833.433.360.871.691.390.75
Mo2+0.10–0.701.200.320.320.320.740.630.210.420.210.21
Ni2+0.05–0.300.210.240.220.190.280.170.160.260.220.16
Zn2+0.10–1.001.410.440.430.271.370.300.264.400.530.25
Table 3. Comparison of the three-stage ASBR system with other studies.
SystemSubstrateProductionOptimum COD Loading Rate (kg/m3d)Temperature (°C)Volume of Bioreactor (L)CH4 Yield (mL CH4/g COD Applied)Energy Yield (kJ/g COD Applied)Overall COD Removal (%)Reference
One-stage ASBRAlcoholH260374-0.5032[41]
One-stage ASBREthanolH250.6554-0.2932[27]
One-stage ASBREthanolCH46
10
37
55
2231
324
8.60
10.90
93
83
[6]
Two-stage UASBCassavaH2 & CH47374 and 241154.3996[19]
Two-stage CSTRCheese wheyH2 & CH4NR353 and 153100.4194[42]
Two-stage UASBCassavaH2 & CH413554 and 241656.4982[24]
Three-stage UASBCassavaH2 & CH415374, 10 and 2432811.7692.5[18]
Three-stage ASBREthanolH2 & CH418375, 5 and 2068622.5092.1Present work
NR: Not reported.

