Analysis of Pressure Fluctuations in a Prototype Pump-Turbine with Different Numbers of Runner Blades in Turbine Mode


1
School of Energy Science and Engineering, Harbin Institute of Technology, Harbin 150001, China
2
State Key Laboratory of HydroScience and Engineering, Department of Energy and Power Engineering, Tsinghua University, Beijing 100084, China
3
Key Laboratory of Fluid and Power Machinery (Xihua University), Ministry of Education Sichuan, Chengdu 610039, China
*
Authors to whom correspondence should be addressed.
Energies 2018, 11(6), 1474; https://doi.org/10.3390/en11061474
Submission received: 20 April 2018
/
Revised: 22 May 2018
/
Accepted: 31 May 2018
/
Published: 6 June 2018
(This article belongs to the Section D: Energy Storage and Application)
Abstract
:In pump-turbines, high pressure fluctuation is one of the crucial instabilities, which is harmful to the stable and effective operation of the entire unit. Extensive studies have been carried out to investigate pressure fluctuations (amplitude and frequency) at specific locations. However, limited research was conducted on the distribution of pressure fluctuations in turbine mode in a pump-turbine, as well as the influence of the number of runner blades on pressure fluctuations. Hence, in this study, three dimensional numerical simulations were performed to predict the distribution of pressure fluctuations with different numbers of runner blades in a prototype pump-turbine in turbine mode using the shear stress transport (SST) k-ω turbulence model. Three operating points with the same hydraulic head and different mass flow rates were simulated. The distribution of pressure fluctuation components of blade passing frequency and its harmonics in the direction along the whole flow path, as well as along the circumferential direction, was presented. The mass flow rate and number of runner blades have great influence on the distribution of pressure fluctuations, especially at blade passing frequency along circumferential direction. The mass flow rate mainly affects the position of peak pressure fluctuations, while the number of runner blades mainly changes the number of peak pressure fluctuations. Additionally, the number of runner blades influences the dominant frequencies of pressure fluctuations especially in the spiral casing and draft tube.
1. Introduction
Pumped storage power plants (PSPPs) have rapidly developed in recent years to balance the variation of loads, which is induced by the large investment of renewable energies (such as solar energy and wind energy) in the power grid [1,2]. Hence, the current of development of PSPPs trends toward a higher specific speed, a higher head, and a large capacity [3,4]. As a consequence, many technical issues arise in the safe and stable operations of pump-turbines, i.e., the key hydraulic parts of PSPPs. Among these issues, hydraulic instabilities of pump-turbines are found as one of the most influential ones, which is believed to be mainly originated from high pressure fluctuations in the hydraulic components [5,6]. Hence, the characteristics of pressure fluctuations and the influences of the vital parameters (number of runner blades etc.) on pressure fluctuations are of great interest in engineering practice.
A reference survey shows that, a large number of experimental and numerical studies have been carried out on the generation mechanism and characteristics of pressure fluctuations in pump-turbines. It has been concluded that the pressure fluctuations mainly originate from rotor—stator interaction (RSI) in the vaneless space between guide vanes and runner blades [7], vortex rope in the draft tube [8], and vortex motion in the stay/guide vanes [9,10].
It is shown that most studies have been performed on model pump-turbines. For examples: Liu et al. [11] has studied the pressure fluctuations in the transient process of a pump-turbine in turbine mode, with discussions of the influence of misaligned guide vanes (MGV). Li et al. [12] found that the rotation of Dean Vortices in the draft tube induced strong low-frequency pressure fluctuations under the large partial operating conditions of a model pump-turbine in pump mode. In other studies, transient simulations in both turbine and pump modes of model pump-turbines have been carried out, and the variation of pressure fluctuations in the transient processes have been obtained [3,13,14]. Ran et al. [15] experimentally studied the pressure fluctuations in a model pump-turbine at large partial flow conditions, and showed an increase on the amplitudes of the pressure fluctuations against stable operating conditions, which were caused by the rotating stalls in the guide vane region (0.2 fn). Yang et al. [16] performed experimental studies on the pressure characteristics in the pump mode of a low specific speed pump-turbine, and they concluded that high-amplitude pressure fluctuation comes from the rotating stall through the spectral analysis of pressure–time series just as well as by high-speed flow visualizations.
Additionally, the pressure fluctuation propagation of a pump-turbine in pump mode was analyzed by Guo et al. [17]. It was concluded that the pressure fluctuation along the passage direction was mainly affected by the interaction between the runner and vanes. Hence, the selection of the number of runner blades is vital. The influence of the distributor pitch diameter on pressure fluctuations in a pump-turbine was discussed by Sun et al. [18]. Analysis showed that the position of the guide vanes had an obvious influence in the frequency characteristics of pressure fluctuation induced by RSI, but minor influence in the amplitude.
In the prototype pump-turbines, the studies on pressure fluctuations through the experimental and numerical methods are rather limited. Experiments in prototype pump-turbines are difficult to be carried out. And the numerical simulations are much more difficult than that in the model pump-turbines due to the larger size of geometry.
With respect to the experiments on prototype pump-turbines, Zhang et al. [19] studied the characteristics of pressure fluctuations in a prototype pump-turbine with a wide range of load conditions. According to the characteristics of pressure fluctuations, the investigated load range was divided into three regions. In the first region with low load, the amplitude of pressure fluctuations is the highest, which comes from rotor-stator interaction in the vanless space. In the second region with medium low load, the amplitude of pressure fluctuations is less prominent, which is caused by the swirling vortex rope in the draft tube. In the third region with high load, the amplitude of pressure fluctuations is quietly limited, which mainly is originated from the rotor-stator interaction.
For numerical simulations of prototype pump-turbines, Liu et al. [20] carried out a 3D transient simulation of the power failure process. It was shown that pressure fluctuations increase when the pump-turbine was operating in pump-braking mode. Chen et al. [21] simulated the starting transient process in a turbine model of a prototype pump-turbine. Li et al. [22] performed a 3D transient simulation of a prototype pump-turbine during normal turbine shutdown. Xiao et al. [23] discussed the effect of MGV on pressure fluctuations in a prototype turbine.
Many studies have revealed that the highest pressure fluctuations occur in the vaneless space of the pump-turbines, which were induced by RSI [24]. To better understand the generation mechanism of RSI, Ruchonnet et al. [25] carried out a one-dimensional numerical simulation to investigate the hydroacoustic part of RSI. The numerical results show that there are several RSI patterns of the pressure fluctuations, which result from the rotor-stator excitation. Nicolet et al. [26] performed similar work and studied the effect of the number of runner blades and the thickness of guide vanes on RSI. The results reveal that the number of blades has an obvious influence on the first dominant frequency in the vaneless space.
From the above literature review, it can be seen that the distribution of pressure fluctuation in prototype pump-turbines in turbine mode has not been clear. Furthermore, there are no studies about the effect of the number of runner blades on the characteristics of pressure fluctuations. Hence, in the present study, 3D numerical simulations were performed using the SST k-ω turbulence model to investigate the distribution of pressure fluctuations in a prototype pump-turbine in turbine mode with different numbers of runner blades. Firstly, the numerical accuracy of the simulations was validated using the available experimental data. The distribution of the pressure fluctuation along the flow path and in the circumferential directions was analyzed. Then, the influence of mass flow rate on the pressure fluctuation was discussed. Finally, the influences of the number of runner blades were studied. The number of runner blades is usually 7 or 9 in the engineering application. The original runner in this article is the one with 7 blades, while it was modified by adding 2 blade profiles in order to have a runner with 9 blades. The hydraulic profiles of the added blades were the same as the 7 existing blades. Several operating points in turbine mode were studied to find out the influence of the number of runner blades on pressure fluctuations.
2. Pump-Turbine Specification
The parameters of the prototype pump-turbine are shown in Table 1. The properties of the fluid through the pump-turbine is water. Operating temperature is under the room temperature (20). Density and viscosity are respectively set as 998.2 kg/m3 and 0.001003 Pa·s. The rated design point is P0 is shown in Table 2. To analyze the influence of mass flow rate, another three operating points were chosen in the simulations. The detailed information of the three operating points is listed in Table 2. P2 is the operating point with the highest efficiency in the 230 m head, while P1 is a large flow rate point and P3 is a small flow rate point.
Figure 1 shows the whole geometry of the computational domain, which contains a spiral casing, stay vane channels (20 stay vanes), guide vane channels (20 guide vanes), a runner and a draft tube.
3. Numerical Model and Schemes
3.1. Mesh Generation
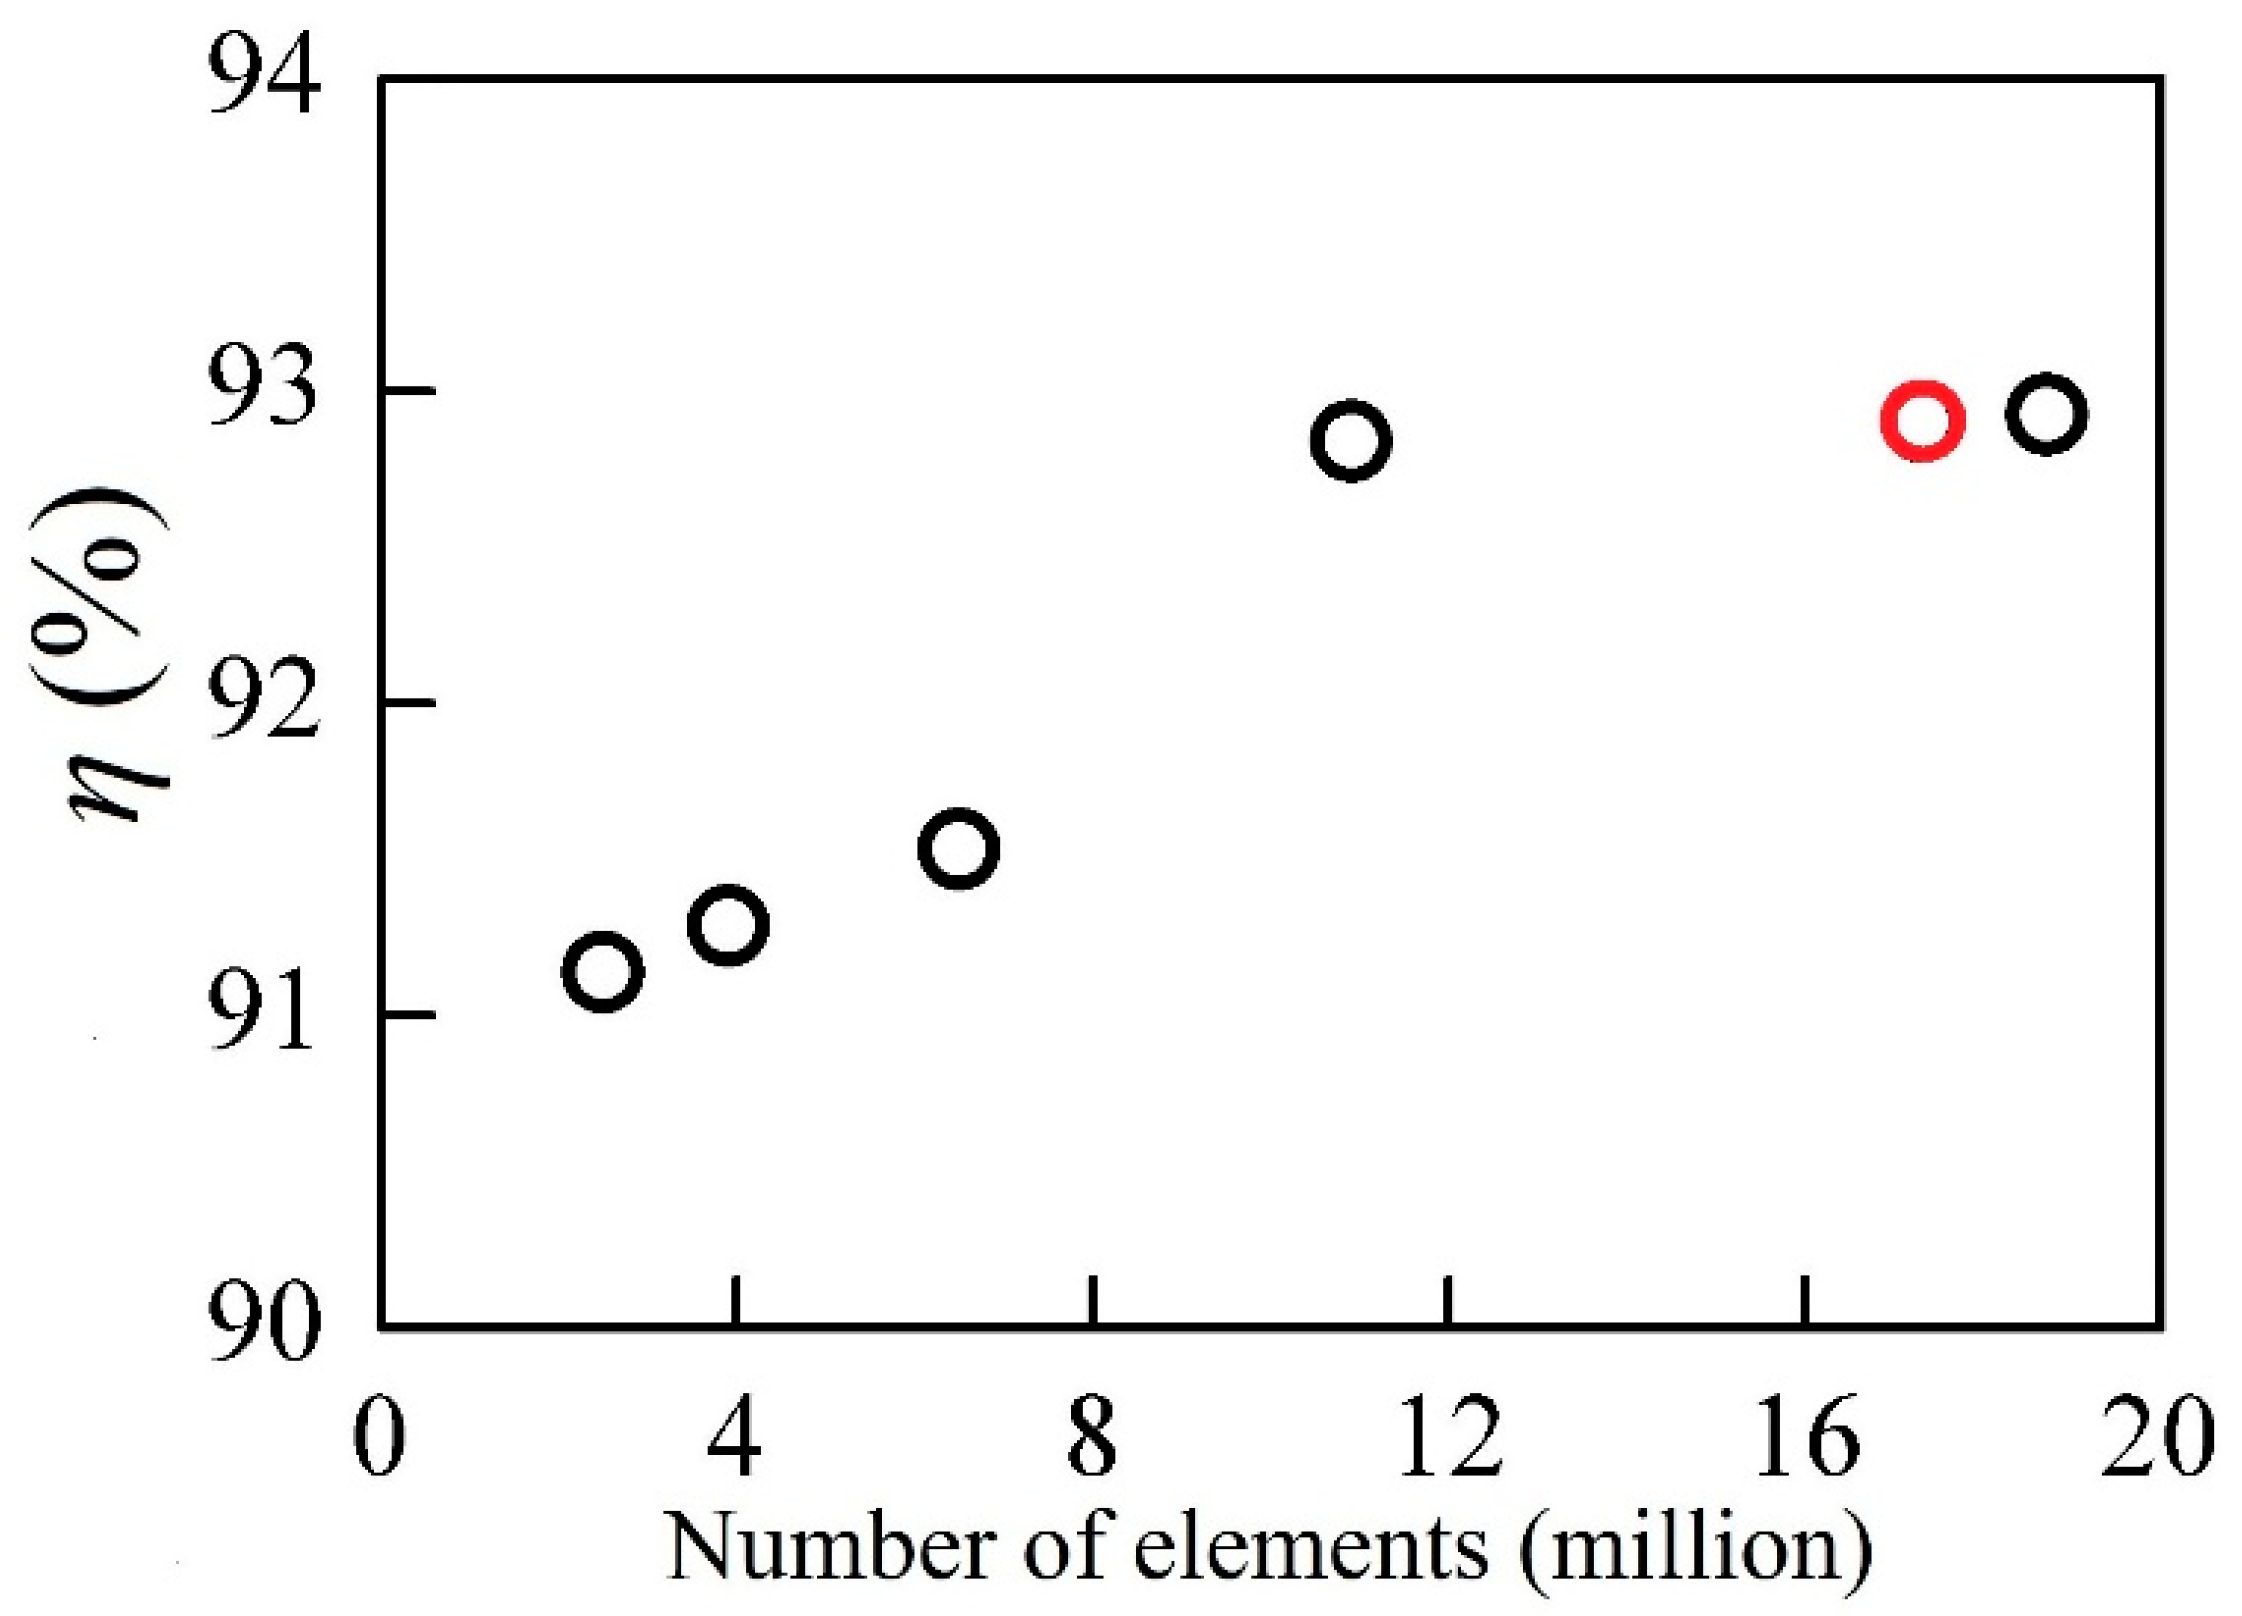
The mesh for numerical simulations in the study was generated in ANASYS 14.0 ICEM module. Unstructured mesh was generated in the spiral casing and stay vane channels. Structural mesh was created for guide vane channels, the runner and the draft tube. In order to satisfy the requirement of y+, mesh near boundary walls are refined. The total number of elements is set as 17.3 million based on the independence study of the mesh, as shown in Figure 2. It is that the test was performed regarding the hydraulic efficiency (η) at rated design point (P0). Figure 3 and Table 3 give the mesh conditions of major hydraulic components.
3.2. Locations of Pressure Monitoring points
Pressure monitoring points were positioned in two manners in the pump-turbine. Twenty points were equally distributed in the vaneless space between guide vanes and the runner (HVS1-20), as shown in Figure 4. Other pressure monitoring points (HC, HST2 & HST1, HG, HFS, HVS, HD2 and HD6) were placed in the middle of the flow channels, approximating theoretical flow paths, as shown in Figure 5.
3.3. Numerical Schemes
ANASYS 14.0 FLUENT was used to perform the simulation. The SST k-ω turbulence model was chosen in the simulations. It has been proven that SST k-ω model gives a good prediction of pressure gradients and flow separations, which was employed in the present study. Velocity inlet at the spiral casing and pressure outlet in the draft tube in turbine mode were set as the boundary conditions of the pump-turbine. SIMPLEC pressure-velocity coupling scheme selected. Spatial discretization was chosen as second order upwind. The unsteady time step 5.56 × 10⁻⁴ s was selected in the present study, in which the runner rotates by 1 degree each step. The residual error was set as 10−4.
4. Result and Discussions
4.1. Validation of Numerical Method
Steady simulation results were validated against the experimental results. The experiments were carried out in VA tech, under the guidance of the International Electrotechnical Commission Standard [27]. The comparison of head and efficiency between the experiments and numerical results is shown in Figure 6. With respect to head, the maximum error (less than 2%) occurs at operating point P1, while for efficiency, the maximum error (less than 3%) occurs at operating point P3, it is seen that due to the simplification of the geometry (including the clearance), numerical results show certain small errors compared with experimental data. The overall agreements between the experiments and the numerical results proved the accuracy of the numerical method.
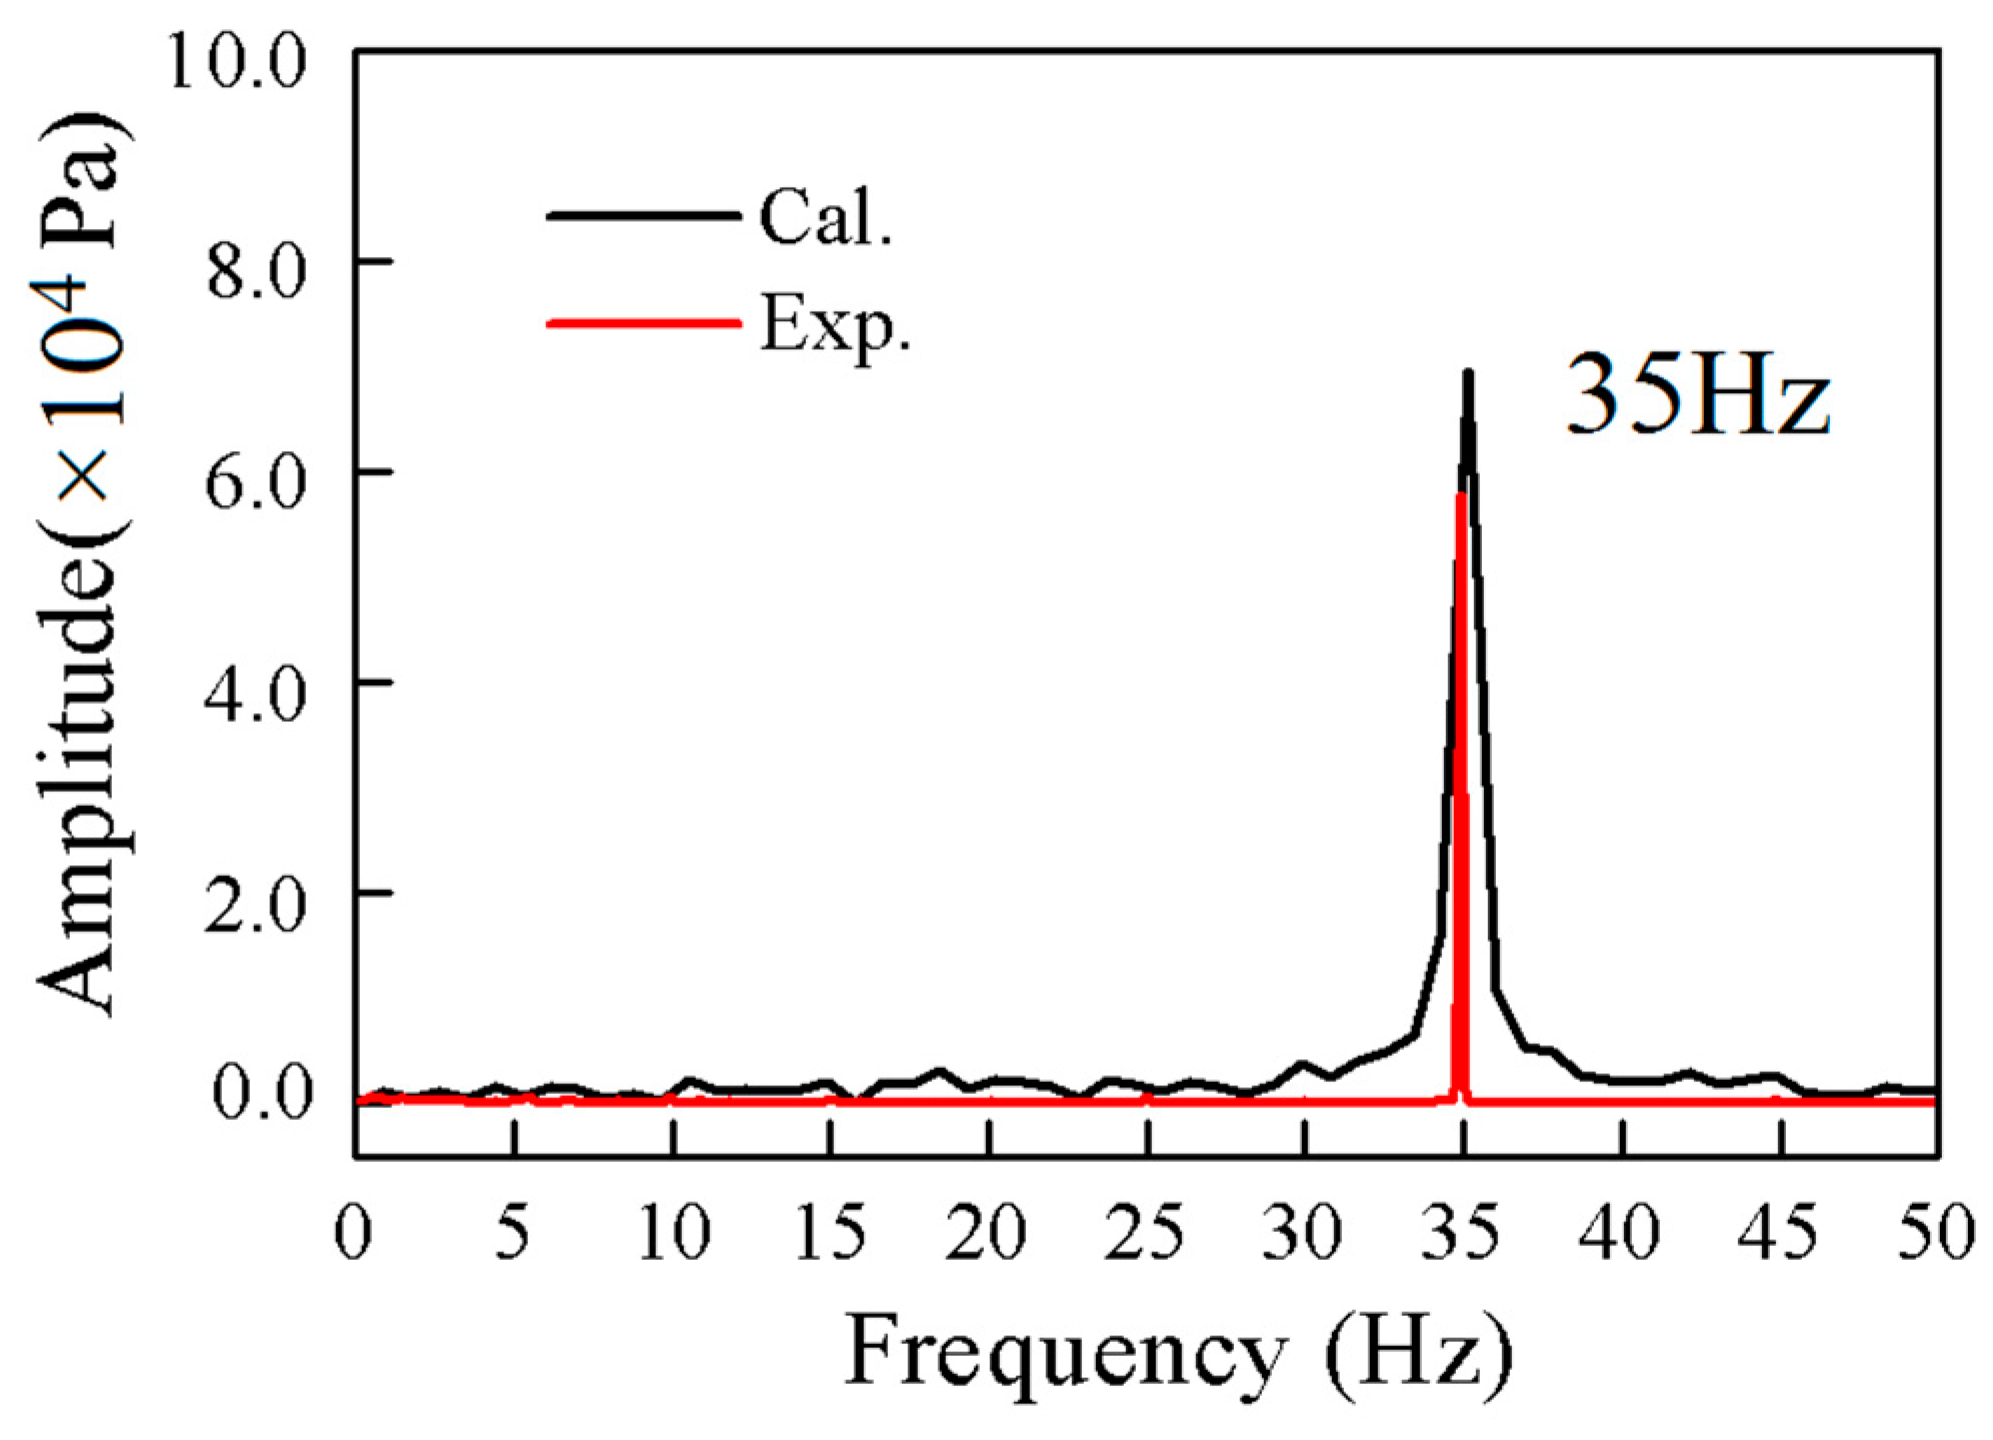
Numerical pressure fluctuations were also compared against experiments. The values and frequency spectrum of relative pressure fluctuation amplitude (defined as Δp/ρgH, where Δp is the total amplitude of pressure fluctuations; ρ is the density of water; H is the hydraulic head) in the spiral casing, vaneless space and draft tube are shown in Table 4 and Figure 7.
4.2. Pressure Fluctuation Distribution in Circumferential Direction
Figure 8a gives pressure fluctuations at different locations in the vaneless space at P2 (best efficiency point in turbine mode). In contrast to the pump mode [28], four peak values of relative amplitude of pressure fluctuations are almost equally distributed.
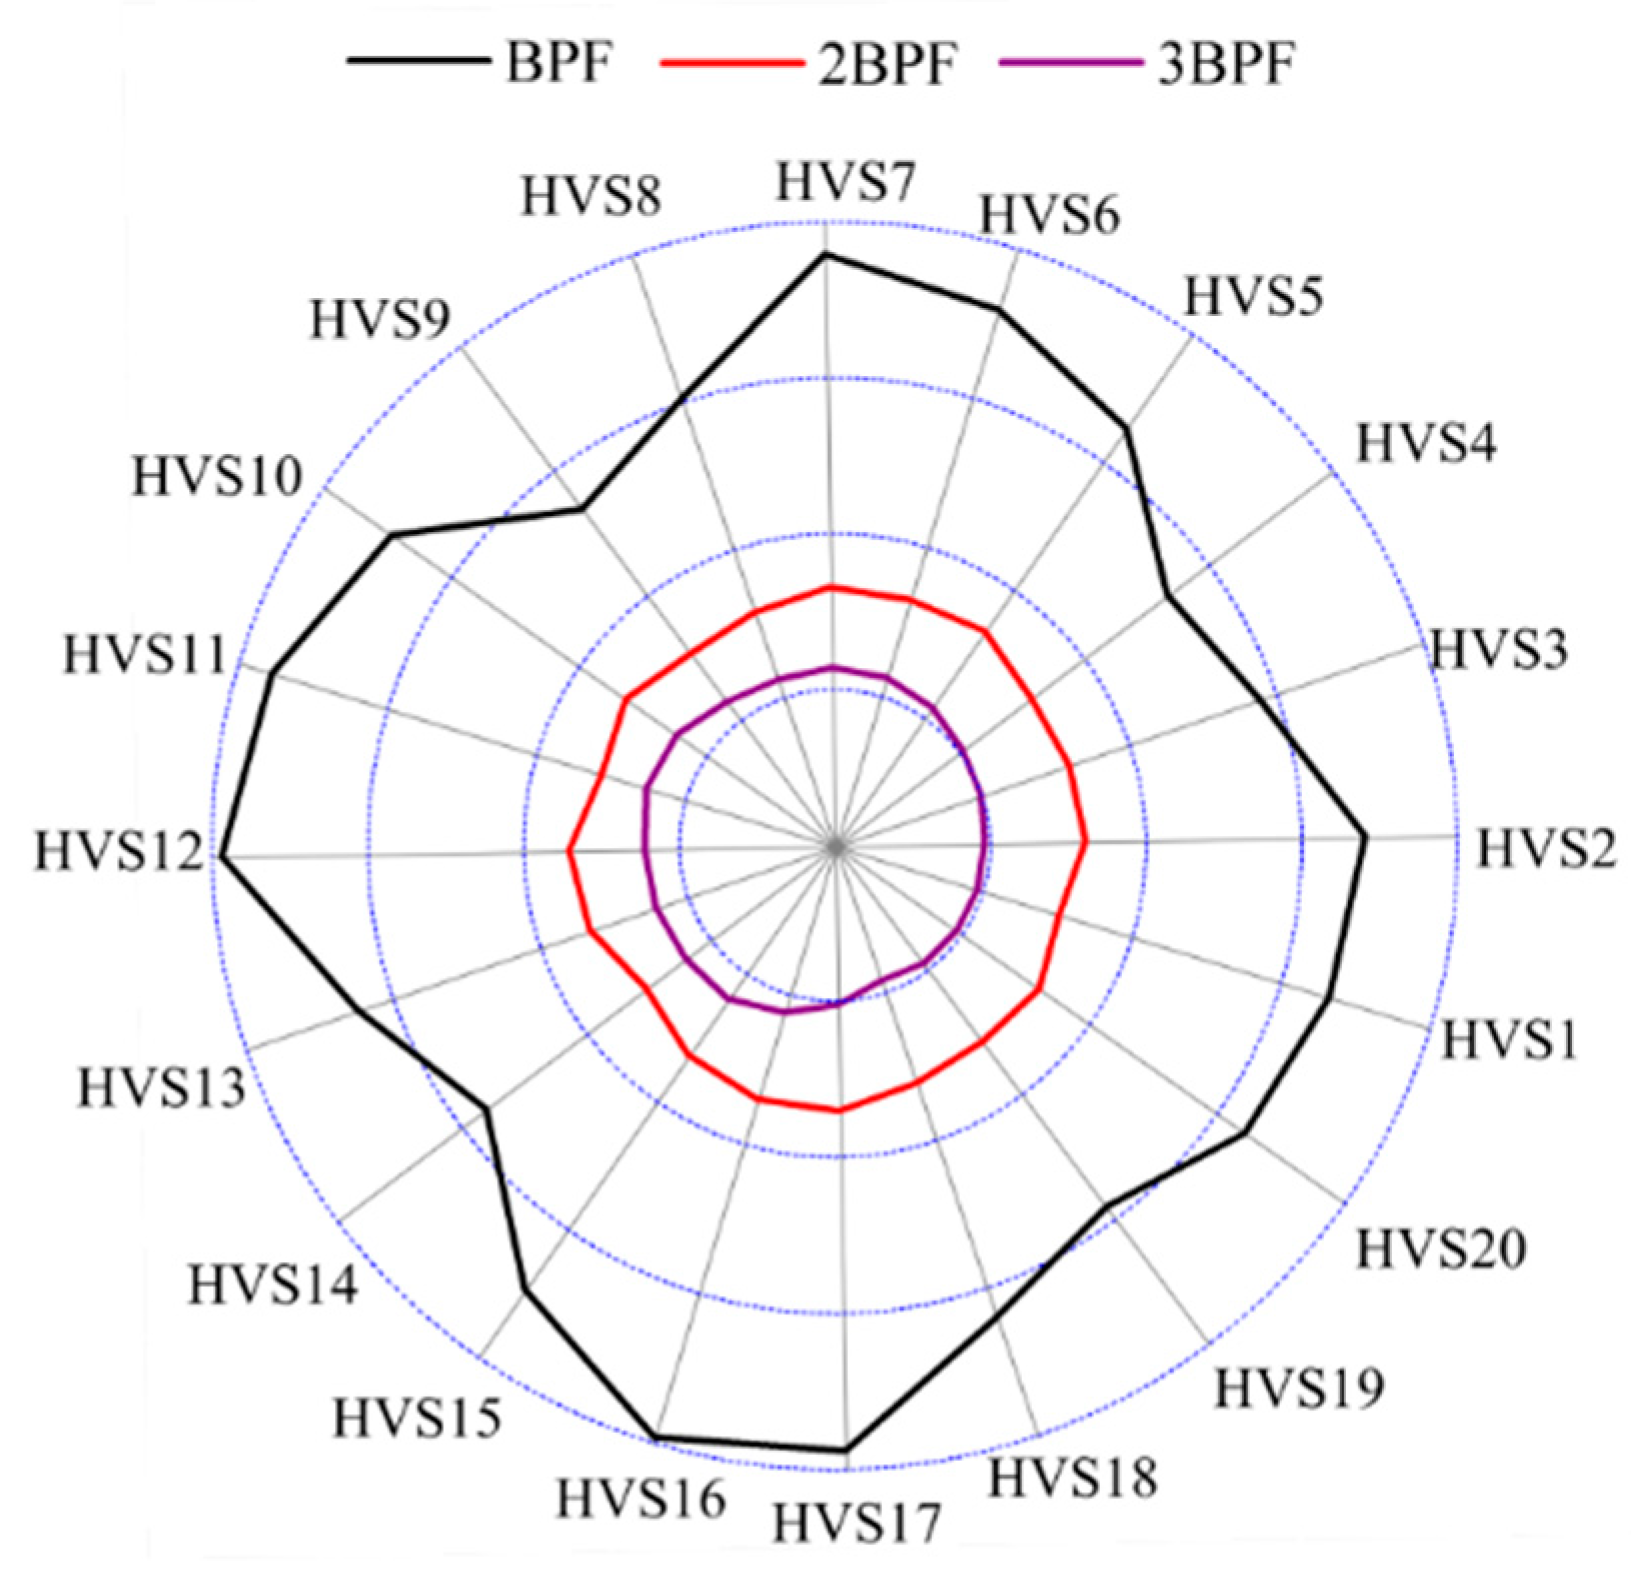
Figure 8b shows the Fast Fourier Transform (FFT) analysis of pressure fluctuations in the vaneless space. It can be seen that the main pressure fluctuation components possess BPF and its harmonic frequencies.
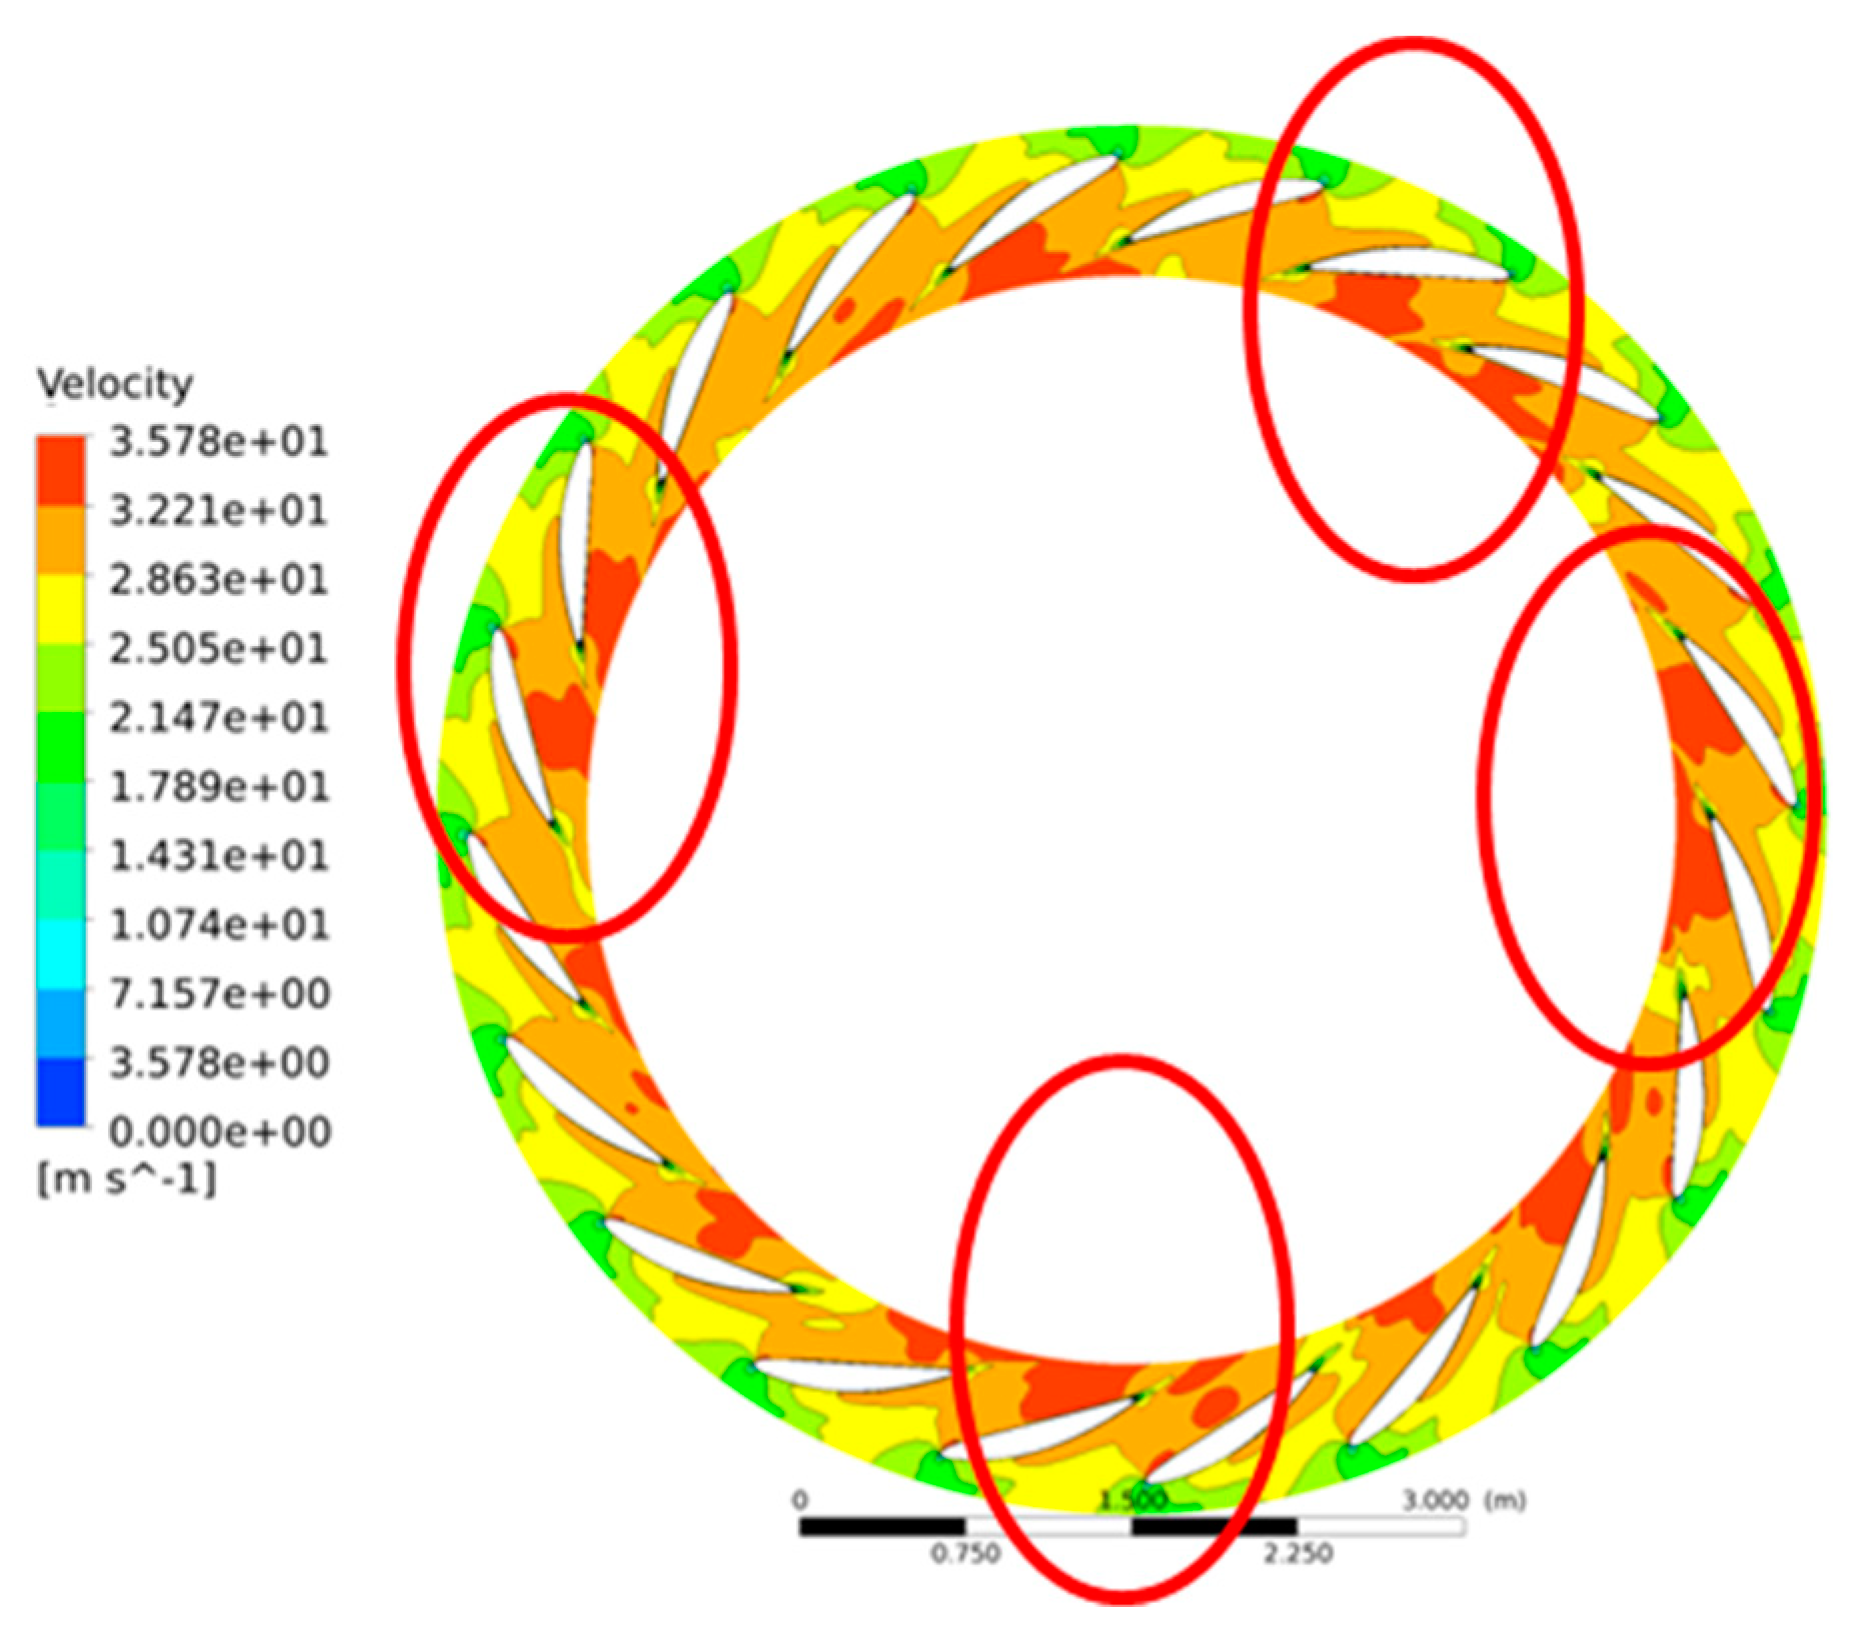
Figure 9 shows the pressure fluctuation components of BPF, 2BPF and 3BPF. The components of 2BPF and 3BPF almost keep the constant amplitude. The flow velocity contour in Figure 10 shows the nonuniformity of the flow. The zones with larger velocity coincide with the zones with larger amplitude of pressure fluctuations. This indicates that the nonuniformity of the flow in the vaneless space is the reason of nonuniformity of pressure fluctuations
4.3. Pressure Fluctuation Distribution in the Middle of Flow Channels
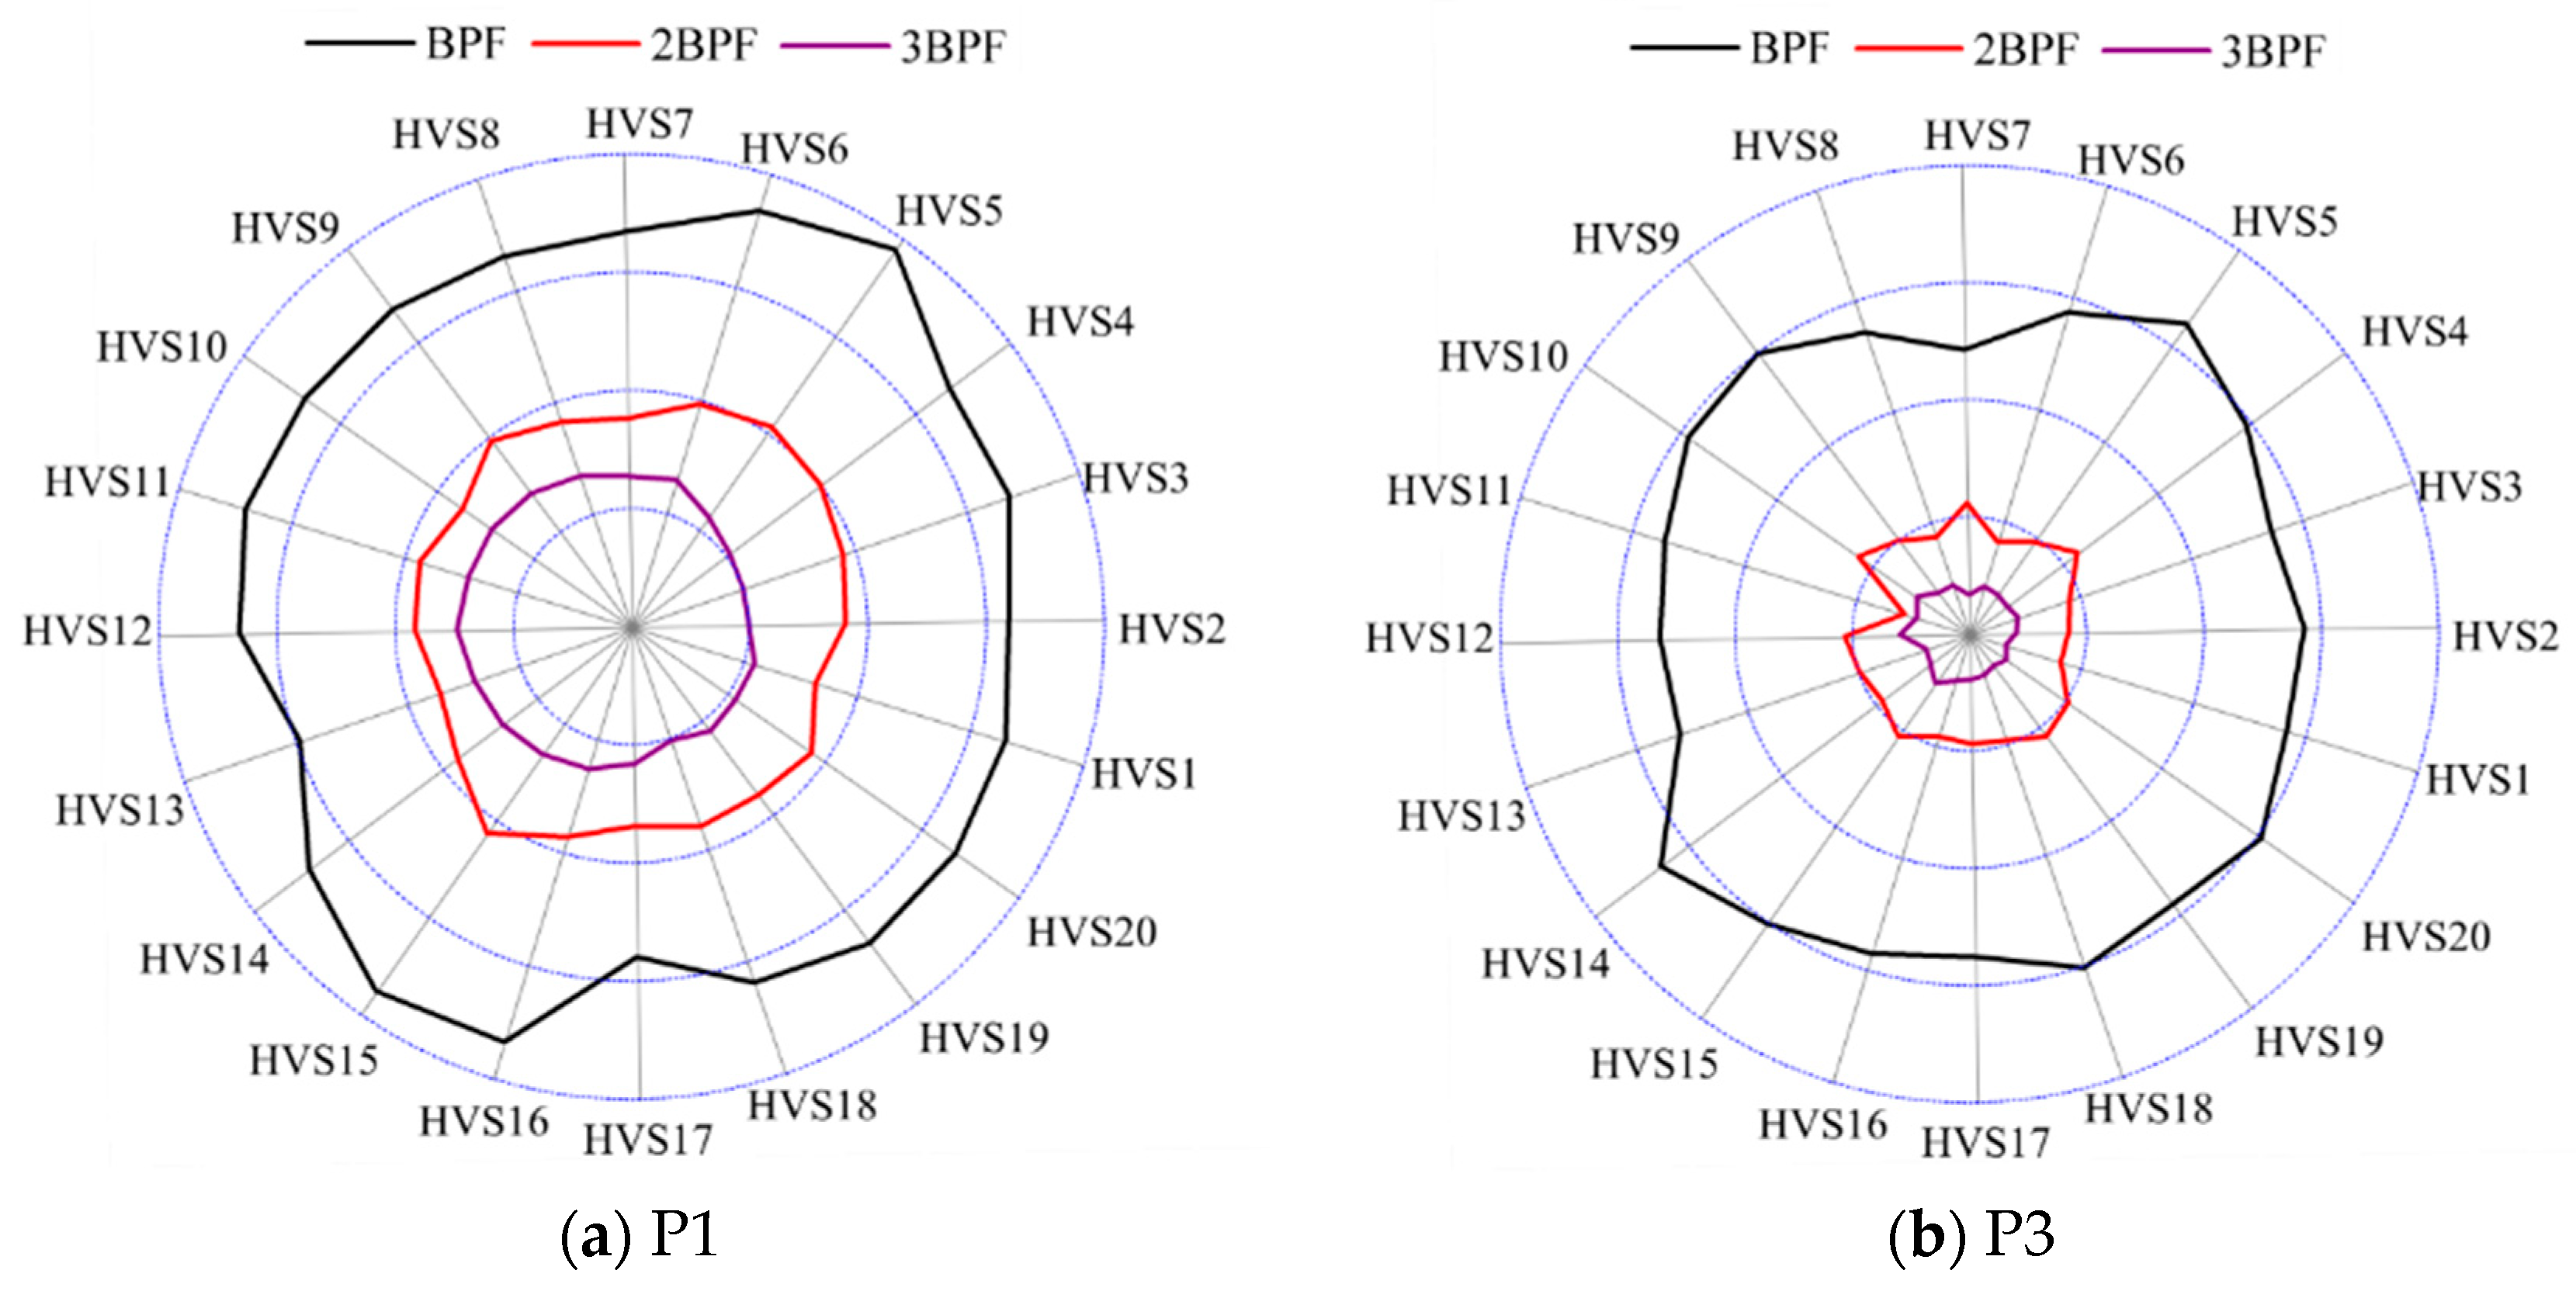
The relative amplitude of pressure fluctuations in the middle of flow channels is illustrated in Figure 11a. A highest amplitude of pressure fluctuations occurs at HVS. Figure 11b shows FFT analysis of pressure fluctuations at different locations. Details of amplitude of BPF, 2BPF and 3BPF can be observed in Figure 12. It is seen that pressure fluctuation component with BPF is the first dominant, whose amplitude decays in the spiral casing and draft tube. Meanwhile, component with 3BPF extends from the vaneless space to the flow channels with almost constant amplitude. Amplitude of pressure fluctuation component of 3BPF is larger than BPF in the spiral casing and draft tube. In contrast, BPF is the largest in the vaneless space. The results are similar with the results in pump mode [28].
4.4. Influence of Mass Flow Rate on Pressure Flucutaiton Distribution
To study the influence of the mass flow rate on the pressure fluctuation distribution, results at two more operating points (P1 with a larger flow rate and P3 with a smaller flow rate) are analysed in the following.
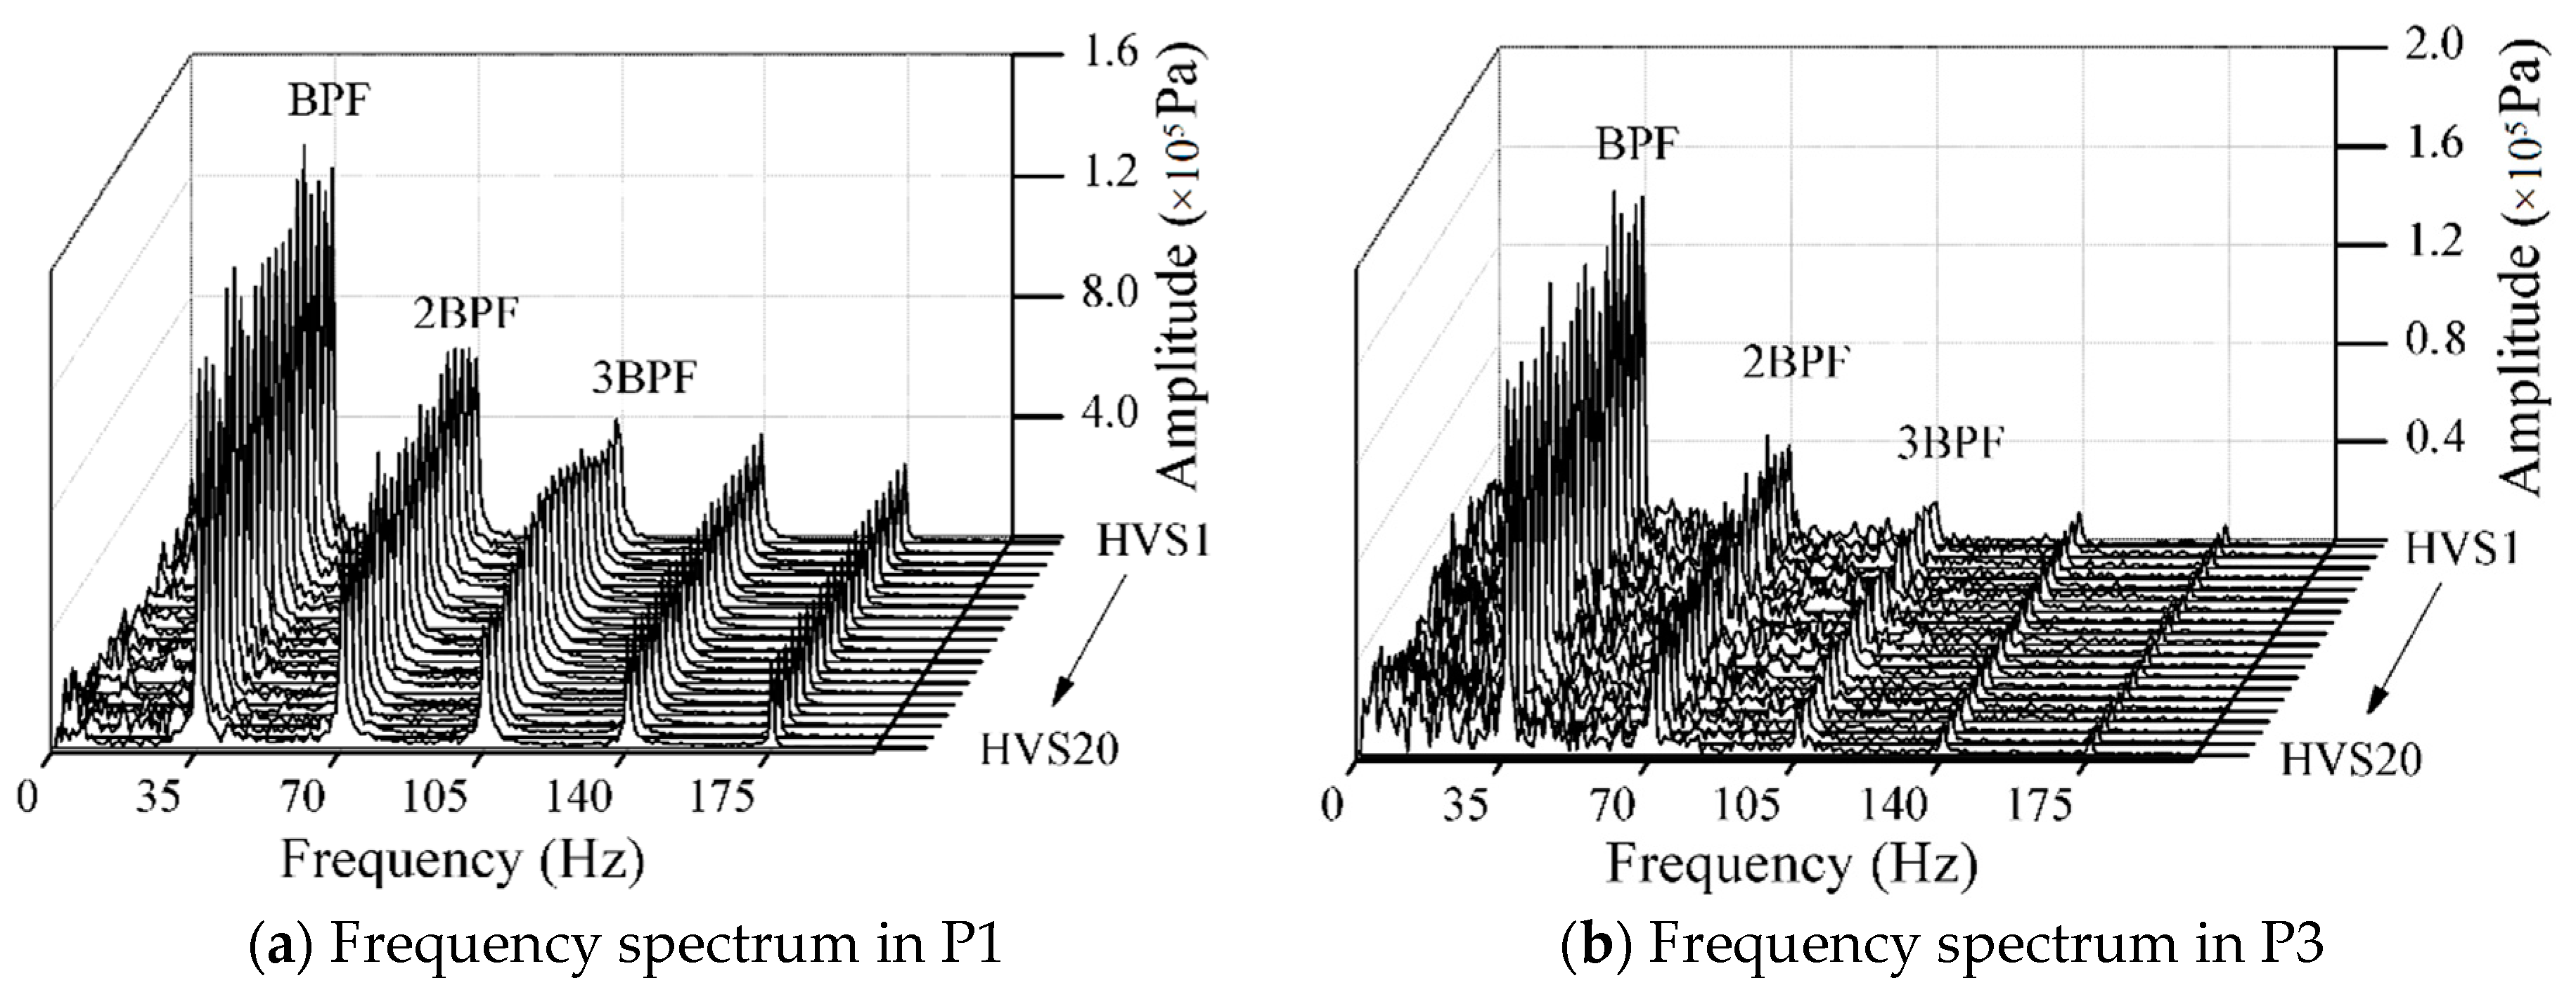
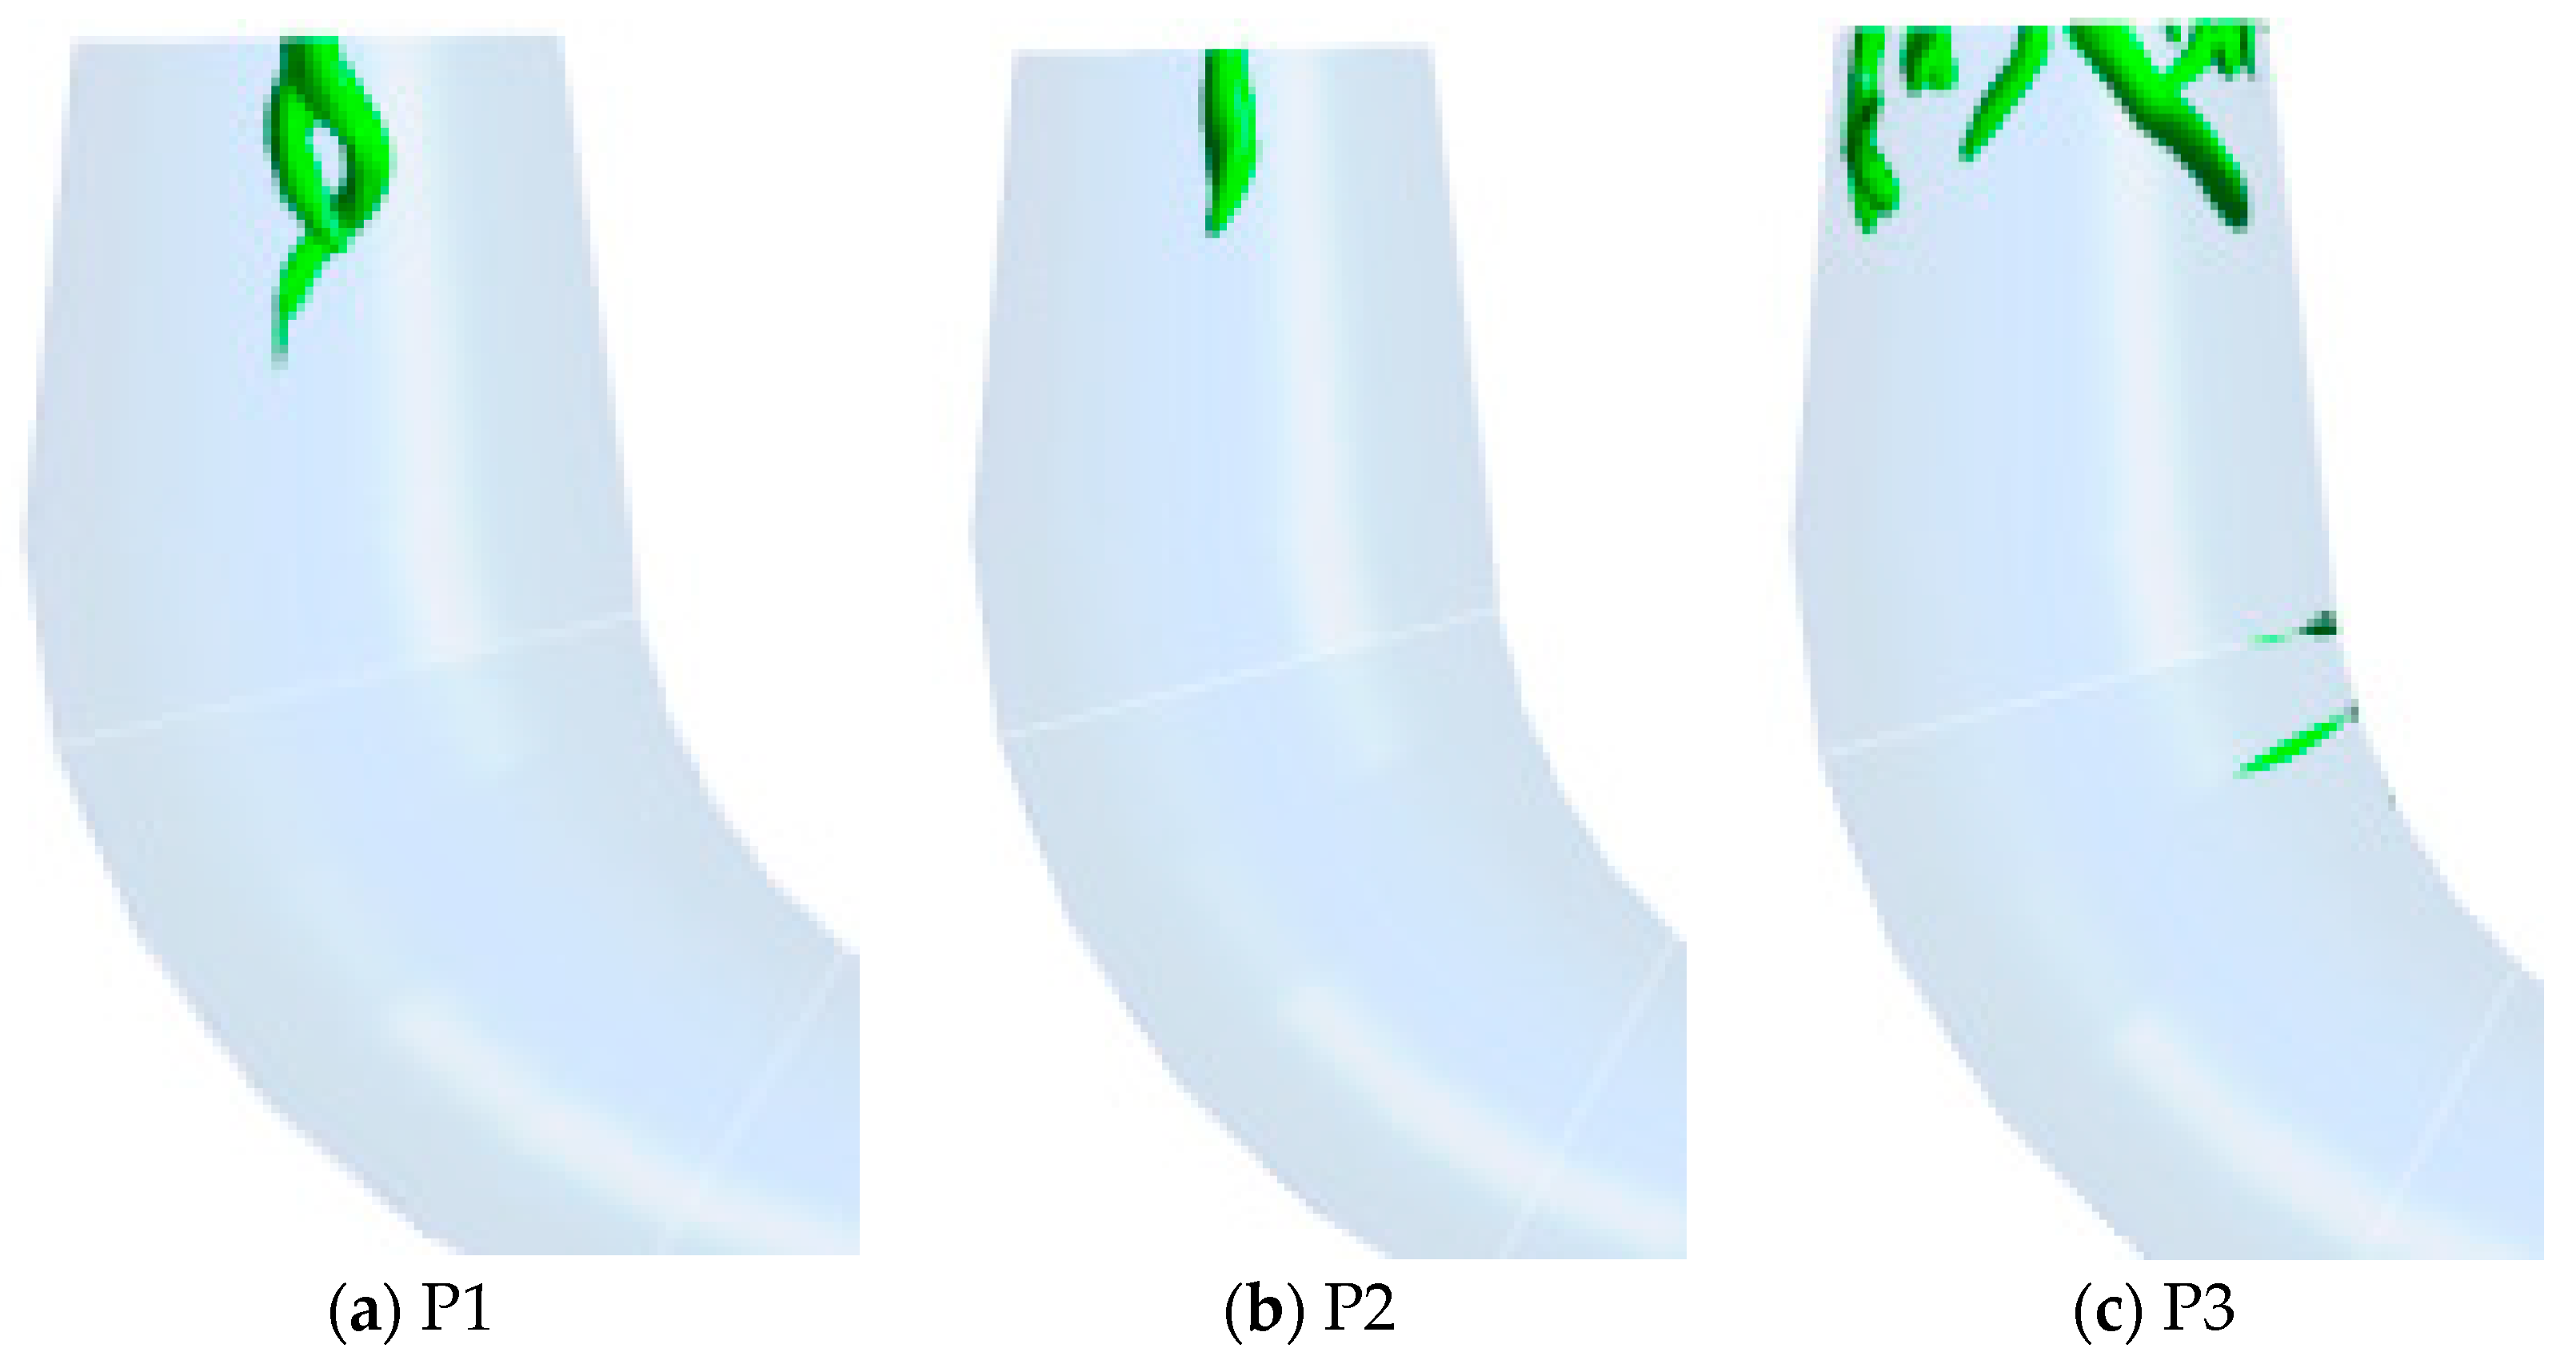
The relative amplitude of pressure fluctuations in the vaneless space at P1 and P3 is shown in Figure 13. The results indicate that the relative amplitude of pressure fluctuations is different when the mass flow rate changes. It is postulated that there are other pressure fluctuations sources when the mass flow rate is either very large or very small. The spectrum analysis of pressure fluctuations at P1 and P3 is shown in Figure 14. The low frequency (near rotational frequency) is much larger than that at the best efficiency point P2, shown in Figure 8b. The low frequency in the vaneless space is mainly caused by draft tube vortex, instead of RSI which is analysed in this article, shown in Figure 15. The vortex in the draft tube was extracted through iso-surface of pressure (3540 Pa). When the mass flow rate is larger or smaller than the rated flow rate, the draft tube vortex changes to helical vortex which induces pressure fluctuations with low frequencies. Since our study focuses on the influence of hydraulic instabilities in vaneless space, only the pressure fluctuation components with frequencies of BPF, 2BPF and 3BPF are analyzed, as shown in Figure 16. The comparison between Figure 16 and Figure 9 shows that the distribution of component at BPF, 2BPF and 3BPF are similar when the mass flow rate changes. There are four peak values of pressure fluctuations at BPF, while pressure fluctuations at 2BPF and 3BPF change little compared with that at BPF.
The detailed distribution of pressure fluctuations at BPF at operating points P1, P2 and P3 is depicted in Figure 17. The position of peak value shifts in anticlockwise direction when the mass flow rate decreases. The peak value position and shift angle when the mass flow rate is different, as listed in Table 5. When the mass flow rate decreases by about 33%, the peak value position shifts in anticlockwise direction about 18–36 degree. When the mass flow rate decreases by about 66%, the peak value position shifts about 72–90 degree. That means the mass flow makes larger influence when the mass flow is smaller.
4.5. Influence of Number of Runner Blades
4.5.1. Circumferential Direction
The blade number of blades is changed from 7 to 9 by adding 2 additional blades with the same profiles as the original blades. Other geometric profiles of pump-turbine kept the same. The comparison of the hydraulic performance and the relative amplitude of pressure fluctuations of this model with 9 and 7 blades are respectively shown in Figure 18 and Figure 19. It is seen from Figure 18 that the head with 9 runner blades is larger than that with 7 runner blades, while efficiency with 9 runner blades is lower than that with 7 runner blades at almost all the operating points. For the relative amplitude of pressure fluctuations, at large flow rate operating point (P1), the amplitude with 9 runner blades is much higher than that with 7 runner blades; at set flow rate operating point, the amplitude with 9 runner blades is almost equal to that with 7 runner blades; and at small flow rate operating point, the amplitude with 9 runner blades is less than that with 7 runner blades.
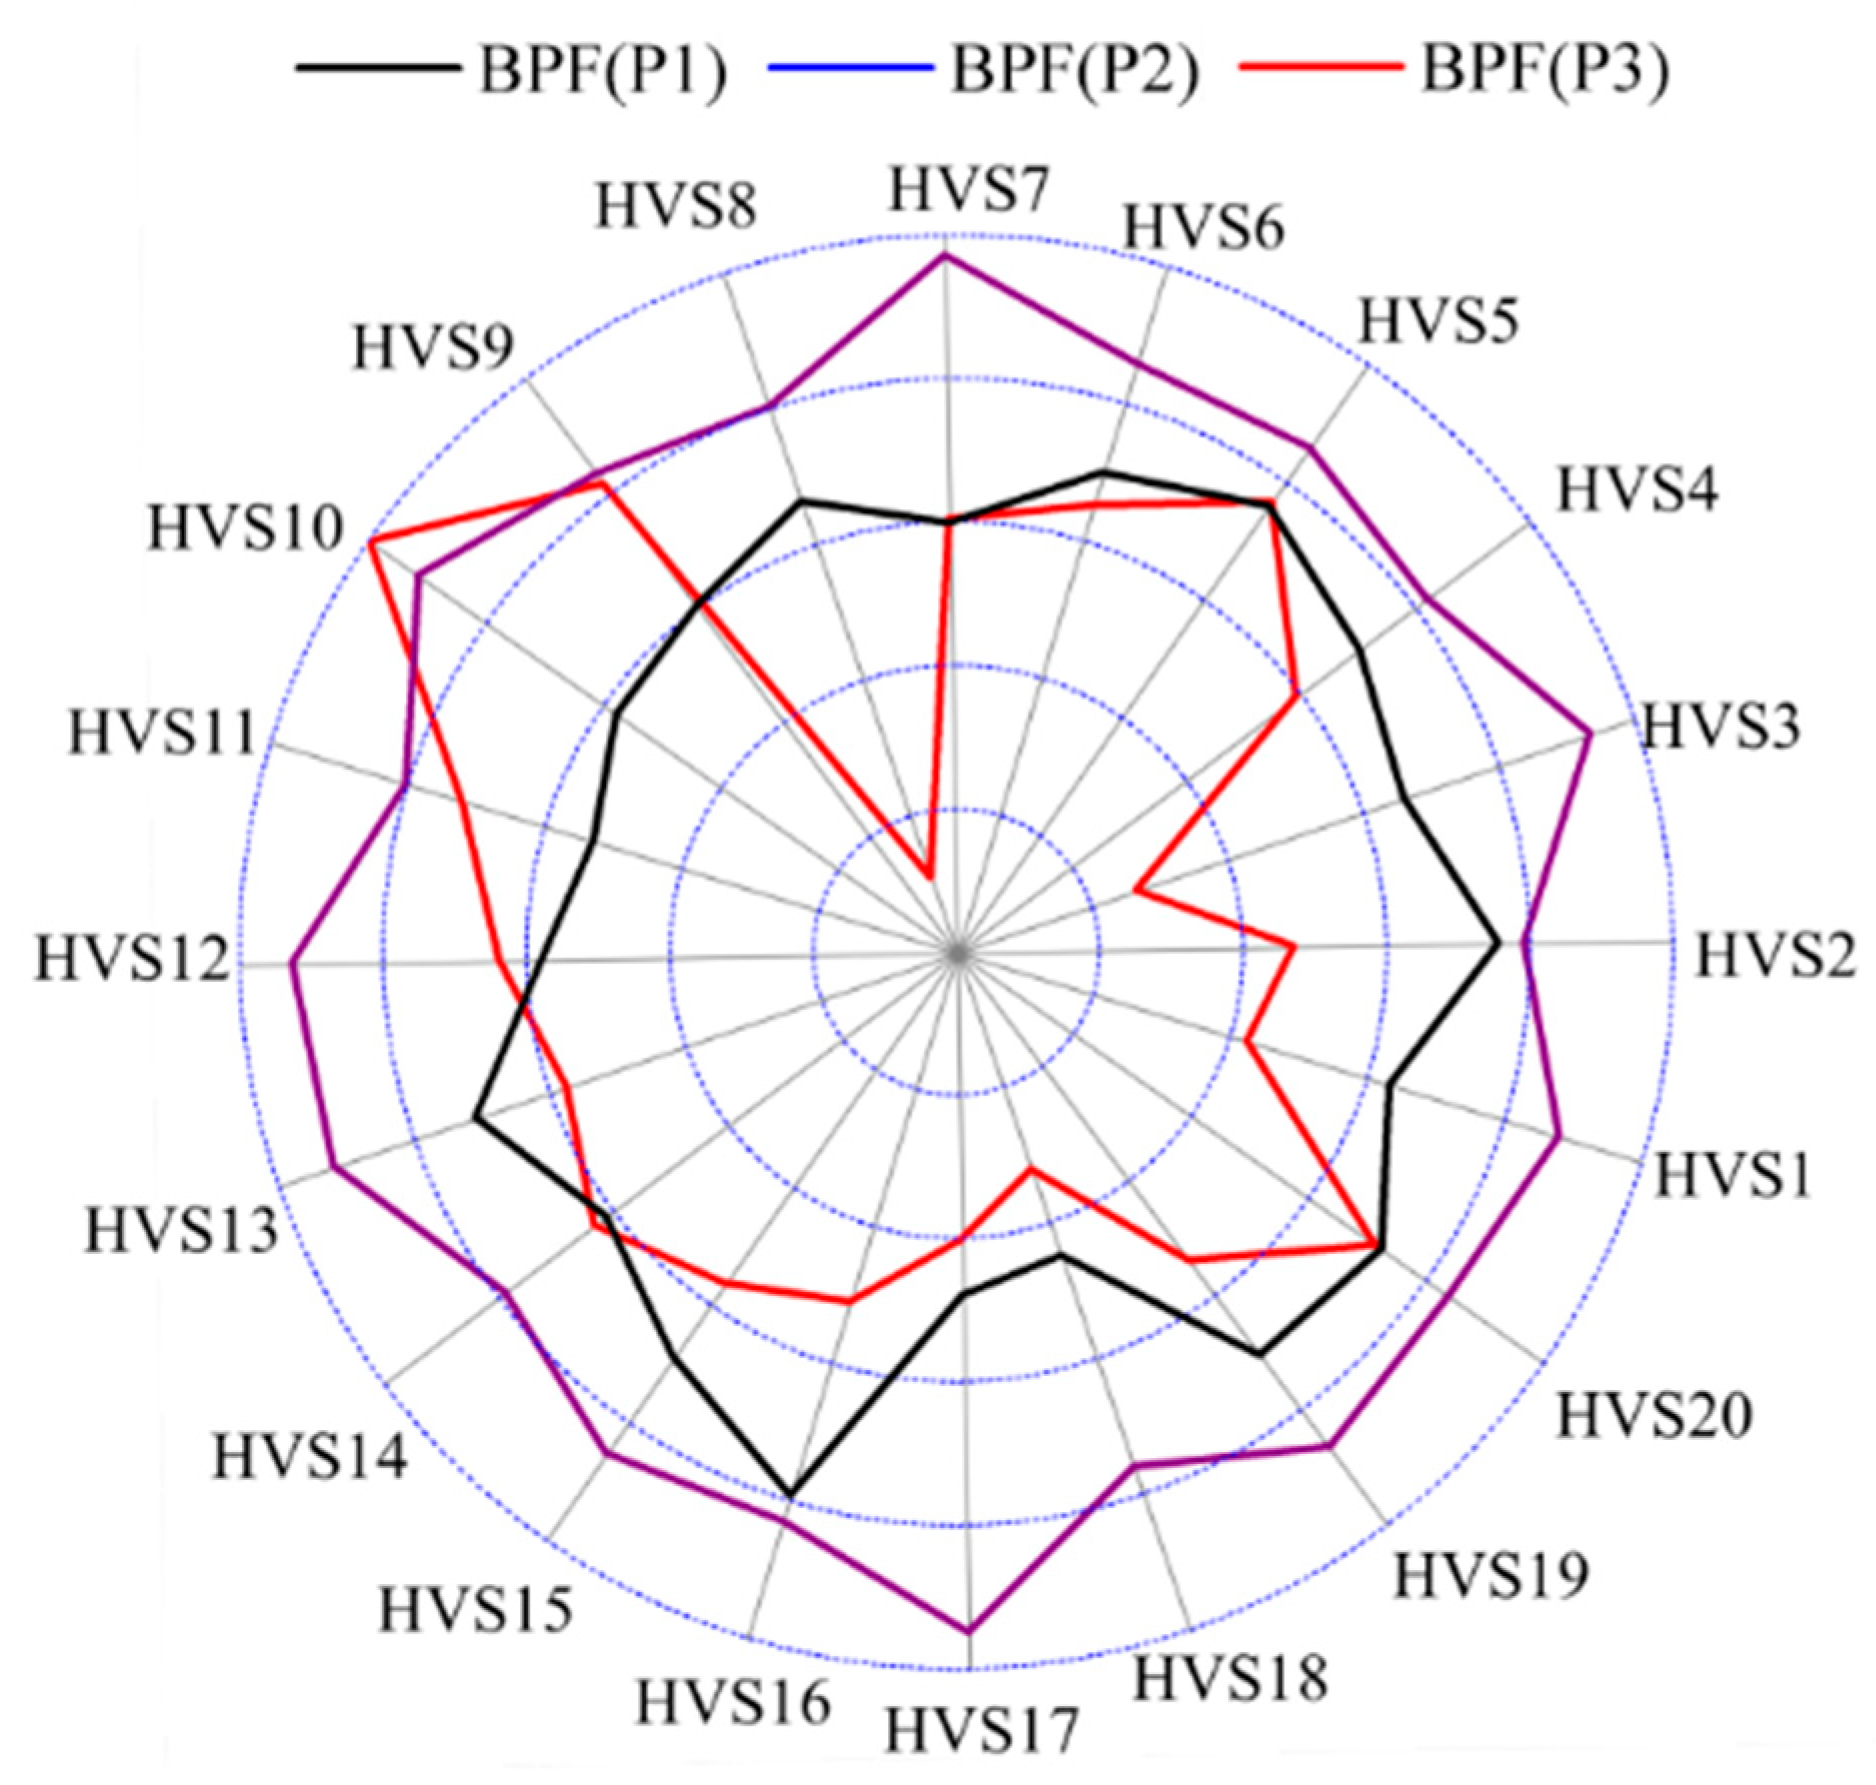
The peak value position of BPF is discussed below. The distribution of pressure fluctuation components of BPF at operating points P1, P2 and P3 with 9 impeller blades is show in Figure 20. The number and position of peak value both change by changing the number of runner blades.
Table 6 and Figure 21 show the detailed peak value position and shift angle when the mass flow rate decreased with 9 blades. The number of peak values of BPF is 6 at P1 and P3 operating points, while it is 5 at the P2 operating point. There are four peak values of BPF at the P1, P2, and P3 points when the blade number is 7. That means that the number of blades mainly influences the number of peak values at BPF.
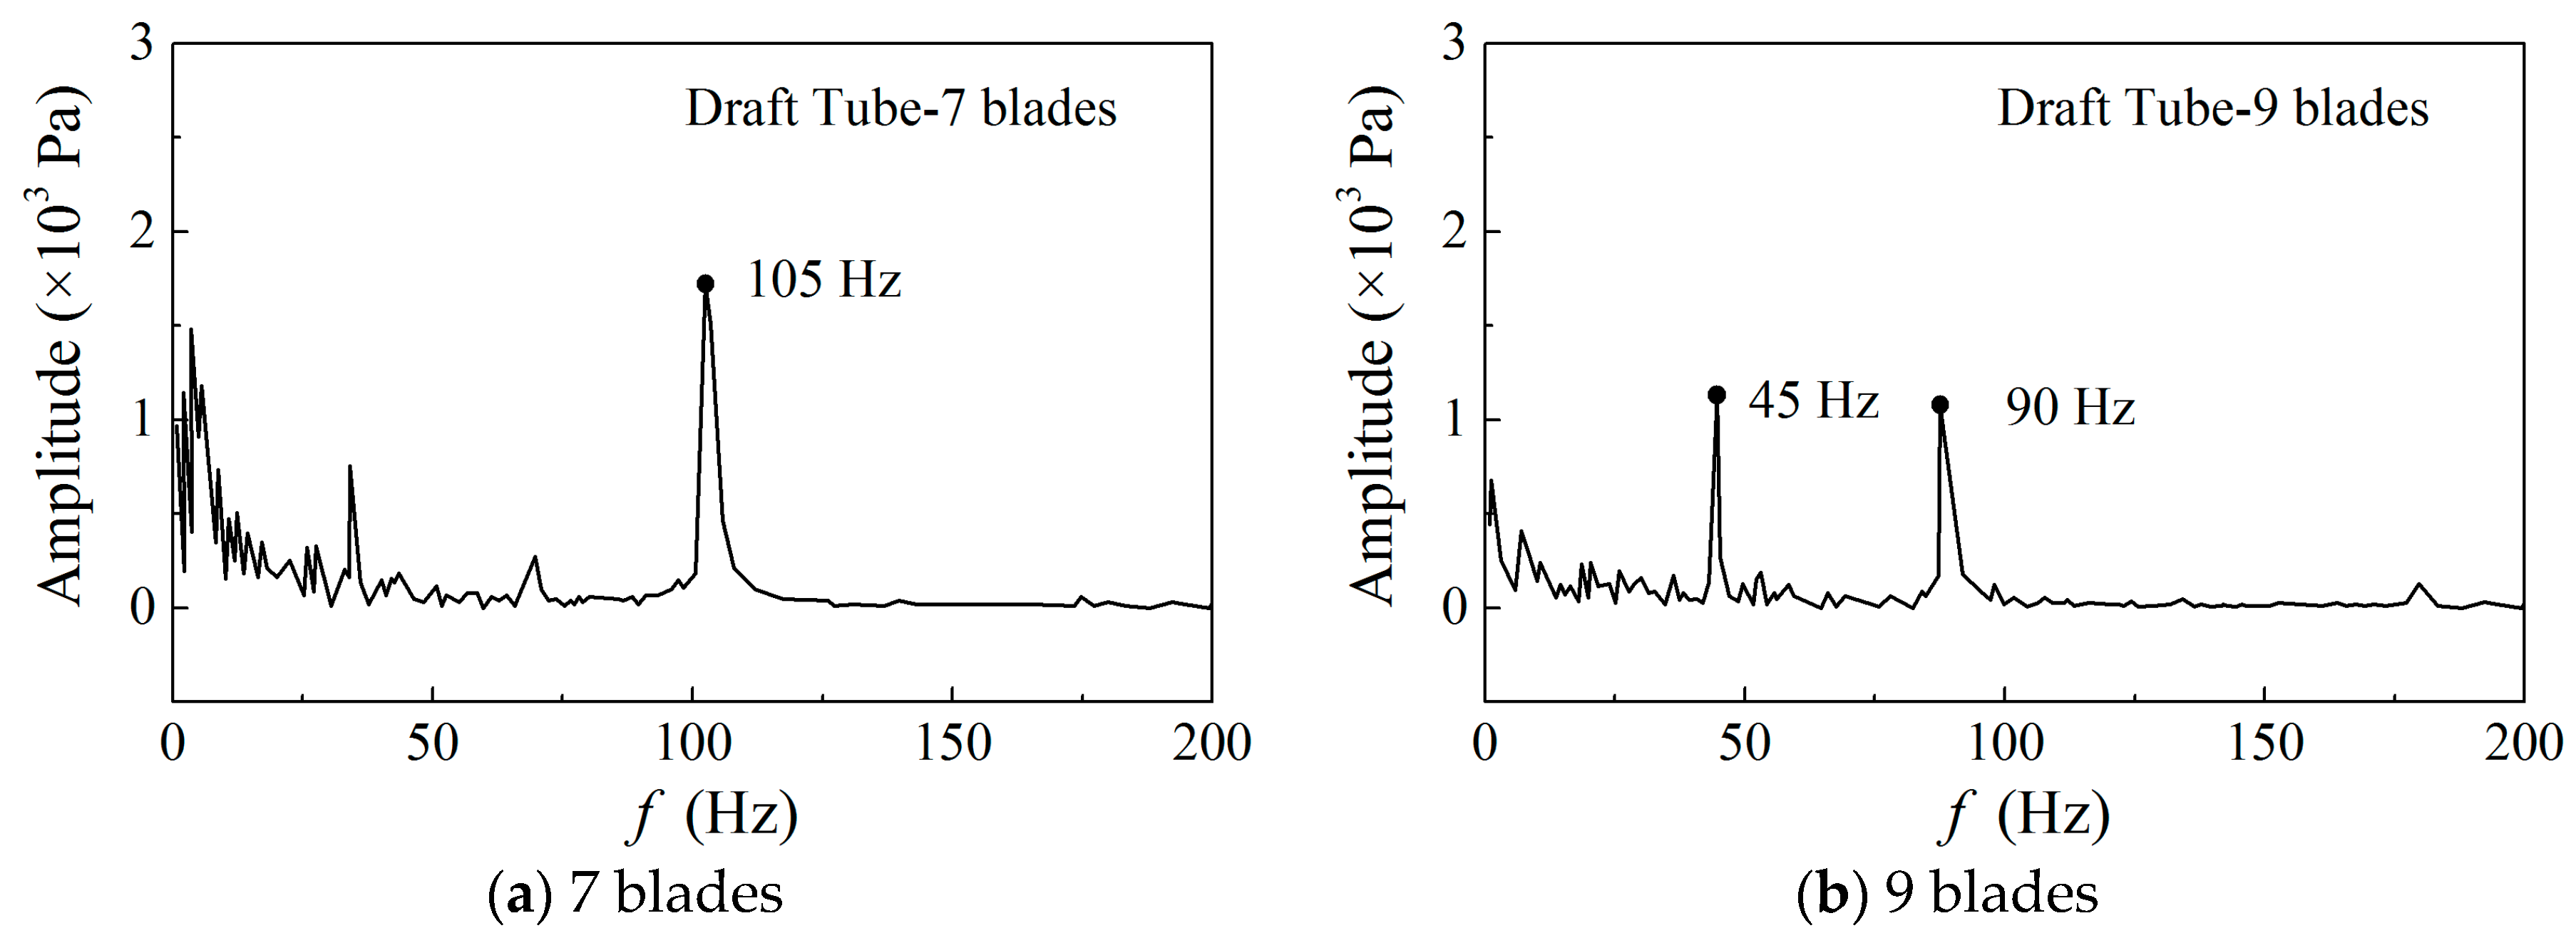
4.5.2. In the Spiral Casing and Draft Tube
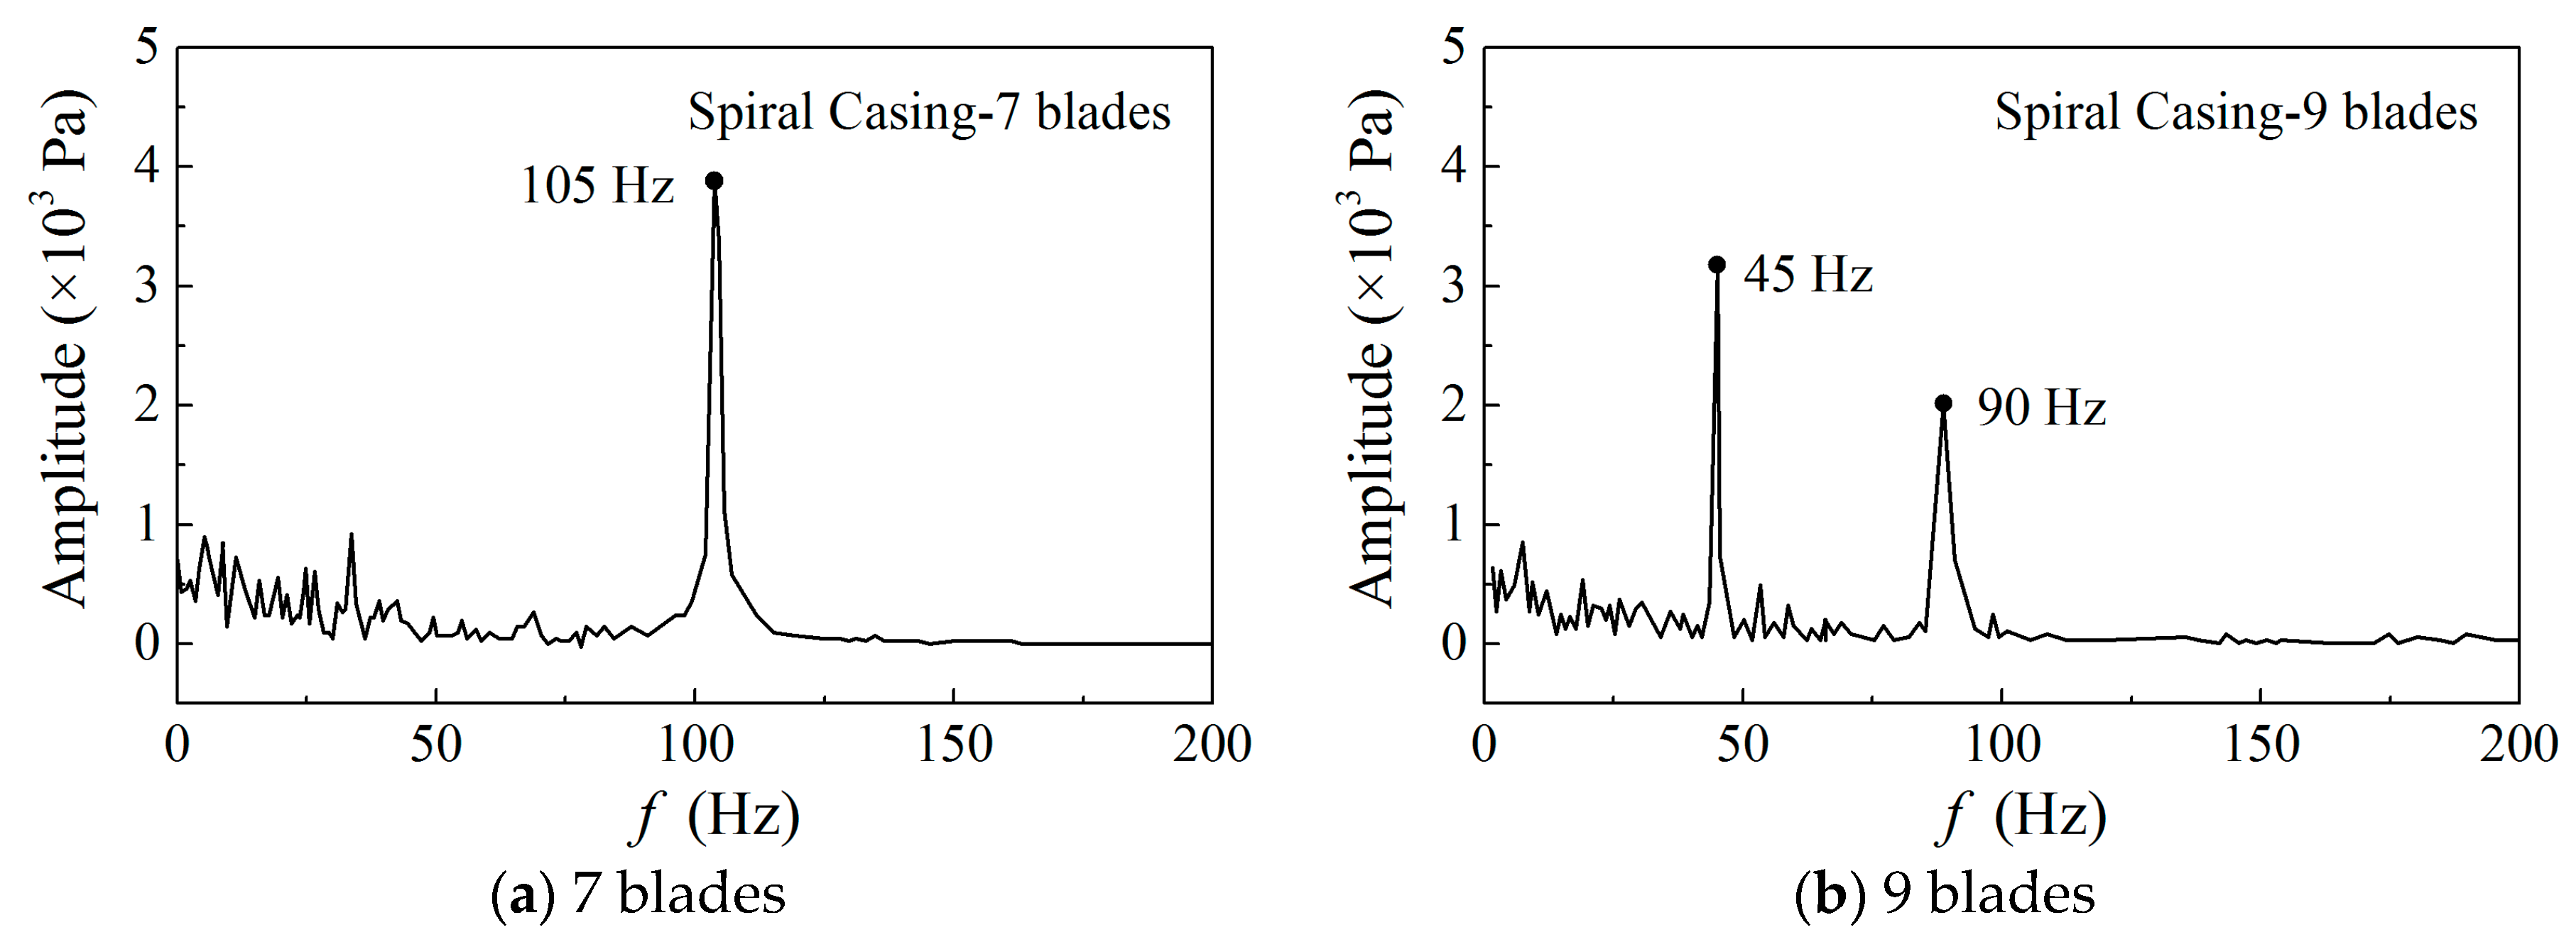
The number of runner blades also influence the pressure fluctuations in the spiral casing and draft tube. Figure 22 shows the comparison of frequency spectrum of pressure fluctuations in the spiral casing, while Figure 23 shows that in the draft tube. The results indicate that the first dominant frequency in the spiral casing and draft tube is 105 Hz (3 × 7fn) with the combination of 7 blades and 20 guide vanes, while the first dominant frequency is 90 Hz (2 × 9fn) with the combination of 9 blades and 20 guide vanes. The 7fn and 9fn are the separately BPF in 7 blades and 9 blades. When the blade number is 9, the BPF (9fn) has an obvious increase compared with 7 blades. Furthermore, the amplitudes of dominant frequencies are obviously reduced with 9 runner blades compared with those with 7 runner blades.
5. Conclusions
The conclusions that can be drawn from the numerical simulations are as follows.
- (1)
- There are peak values of relative amplitude of pressure fluctuations which are almost equally distributed along the circumferential direction in the turbine mode. It is different to that in the pump mode. The position of peak pressure fluctuations is changed by changing mass flow rate. The position of peak value shifts in the anticlockwise direction as the mass flow rate is decreased. The shift is larger when the mass flow is smaller.
- (2)
- The number of runner blades has a significant influence on the dominant characteristics of pressure fluctuation. The spectrum of pressure fluctuations with 9 blades is obviously different with 7 blades. The first dominant frequency in the vaneless space is blade-passing frequency (BPF), which is nonuple rotational frequency (9fn) in 9 blades geometry and septuple rotational frequency (7fn) in 7 blades geometry. The first dominant frequency in the spiral casing and draft tube is 21fn with the combination of 7 blades and 20 guide vanes, while the first dominant frequency is 18fn with the combination of 9 blades and 20 guide vanes.
- (3)
- The number of runner blades obviously affects the number of peak pressure fluctuations, which mainly changes the number of peak pressure fluctuations at BPF. The amplitudes of pressure fluctuation in the draft tube and the spiral casing are obviously reduced with 9 runner blades compared with those with 7 runner blades.
According to the above studies, the number of runner blades have a large influence on the pressure fluctuation in the vaneless space in pump-turbines, which is a major factor affecting the hydraulic stability. However, its influence is clearly subjected to the design and working conditions of a specific given pump-turbine unit. Hence, it is recommended to adequately consider both the hydraulic performance and stability, in terms of the influence of the number of runner blades in the design stage for engineers.
Author Contributions
Conceptualization, Z.Z. and S.L.; Methodology, D.L. and Z.Z.; Validation, D.L. and Z.Z.; Formal Analysis, D.L., Z.Z. and Y.S.; Investigation, Z.Z. and S.L.; Data Curation, Z.Z. and Y.S.; Writing-Original Draft Preparation, D.L., Z.Z. and Y.S.; Writing-Review & Editing, D.L. and Z.Z.; Supervision, S.L., H.W. and Z.L.; Project Administration, Z.Z. and S.L.; Funding Acquisition, D.L., Z.Z. and Z.L.
Funding
This research was funded by National Natural Science Foundation of China (No. 51476083), Open Research Fund Program of State Key Laboratory of Hydroscience and Engineering (sklhse-2018-E-02) and Open Fund of Key Laboratory of Fluid and Power Machinery (Xihua Uninversity), Ministry of Education Sichuan (Grant No. szjj-2017-100-1-001), China Postdoctoral Science Foundation Funded Projection (No. 2018M630353), and National Key Research and Development Program (No. 2018YFB0905205).
Conflicts of Interest
The authors declare no conflict of interest.
Nomenclature
| BPF | Blade passing frequency |
| 2BPF | Two times blade passing frequency |
| 3BPF | Three times blade passing frequency |
| D1 | Runner outlet diameter, m. |
| D2 | Runner inlet diameter, m. |
| fn | Rotational frequency, Hz. |
| H | Head, m. |
| Hd | Rated head, m. |
| n | Rotating speed, r/min. |
| ns | Specific speed, . |
| P | Input power, kW. |
| Qd | Rated discharge, m3/s. |
| Z | Number of runner blades |
| Zg | Number of guide vanes |
| Zs | Number of stay vanes |
| α | Guide vanes opening, ° |
| η | Efficiency, the ratio of mechanical power of runner to the hydraulic power, %. |
| Cal | Results from numerical simulation |
| Exp | Results from experiments |
References
- Li, D.Y.; Wang, H.J.; Xiang, G.M.; Gong, R.; Wei, X.; Liu, Z. Unsteady Simulation and Analysis for Hump Characteristics of a Pump Turbine Model. Renew. Energy 2015, 77, 32–42. [Google Scholar]
- Zuo, Z.G.; Fan, H.G.; Liu, S.H.; Wu, Y. S-Shaped Characteristics on the Performance Curves of Pump-Turbines in Turbine Mode—A Review. Renew. Sustain. Energy Rev. 2016, 60, 836–851. [Google Scholar] [CrossRef]
- Li, D.Y.; Wang, H.J.; Li, Z.G.; Nielsen, T.K.; Goyal, R.; Wei, X.; Qin, D. Transient characteristics during the closure of guide vanes in a pump-turbine in pump mode. Renew. Energy 2018, 118, 973–983. [Google Scholar] [CrossRef]
- Li, D.Y.; Wang, H.J.; Qin, Y.L.; Han, L.; Wei, X.; Qin, D. Entropy production analysis of hysteresis characteristic of a pump-turbine model. Energy Convers. Manag. 2017, 149, 175–191. [Google Scholar] [CrossRef]
- Nennemann, B.; Vu, T.C.; Farhat, M. CFD prediction of unsteady wicket gate-runner interaction in Francis turbines: A new standard hydraulic design procedure. In Proceedings of the HYDRO 2005 International Conference and Exhibition, Villach, Austria, 17–20 October 2005. [Google Scholar]
- Zuo, Z.; Liu, S. Flow-Induced Instabilities in Pump-Turbines in China. Engineering 2017, 3, 504–511. [Google Scholar] [CrossRef]
- Zuo, Z.G.; Liu, S.H.; Sun, Y.K.; Wu, Y. Pressure Fluctuations in the Vaneless Space of High-Head Pump-Turbines—A Review. Renew. Sustain. Energy Rev. 2015, 41, 965–974. [Google Scholar] [CrossRef]
- Zuo, Z.G.; Liu, S.H.; Liu, D.M.; Qin, D. Numerical predictions and stability analysis of cavitating draft tube vortices at high head in a model Francis turbine. Sci. China Technol. Sci. 2014, 57, 2106–2114. [Google Scholar] [CrossRef]
- Zhang, Y.N.; Zhang, Y.N.; Wu, Y.L. A Review of Rotating Stall in Reversible Pump Turbine. Proc. Inst. Mech. Eng. Part C J. Mech. Eng. Sci. 2017, 231, 1181–1204. [Google Scholar] [CrossRef]
- Yang, J.; Pavesi, G.; Liu, X.; Xie, T.; Liu, J. Unsteady flow characteristics regarding hump instability in the first stage of a multistage pump-turbine in pump mode. Renew. Energy 2018, 127, 377–385. [Google Scholar] [CrossRef]
- Liu, J.T.; Liu, S.H.; Sun, Y.K.; Zuo, Z.; Wu, Y.; Wang, L. Instability study of a pump-turbine at no load opening based on v2 − f turbulence model. IOP Conf. Ser. Earth Environ. Sci. 2012, 15, 72035. [Google Scholar] [CrossRef]
- Li, D.; Wang, H.; Qin, Y.; Li, Z.; Wei, X.; Qin, D. Mechanism of high amplitude low frequency fluctuations in a pump-turbine in pump mode. Renew. Energy 2018, 126, 668–680. [Google Scholar] [CrossRef]
- Li, D.Y.; Gong, R.Z.; Wang, H.J.; Xiang, G.; Wei, X.; Liu, Z. Dynamic Analysis on Pressure Fluctuation in Vaneless Region of a Pump Turbine. Sci. China Technol. Sci. 2015, 58, 813–824. [Google Scholar] [CrossRef]
- Li, D.Y.; Gong, R.Z.; Wang, H.J.; Wei, X.; Liu, Z.; Qin, D. Numerical Investigation on Transient Flow of a High Head Low Specific Speed Pump-Turbine in Pump Mode. J. Renew. Sustain. Energy 2015, 7, 63111. [Google Scholar] [CrossRef]
- Ran, H.J.; Luo, X.W.; Zhu, L.; Zhang, Y.; Wang, X.; Xu, H. Experimental Study of the Pressure Fluctuations in a Pump Turbine at Large Partial Flow Conditions. Chin. J. Mech. Eng. 2012, 25, 1205–1209. [Google Scholar] [CrossRef]
- Yang, J.; Pravesi, G.; Yuan, S.; Cavazzini, G.; Ardizzon, G. Experimental Characterization of a Pump-Turbine in Pump Mode at Hump Instability Region. J. Fluids Eng. 2015, 137, 1–11. [Google Scholar] [CrossRef]
- Guo, L.; Liu, J.; Wang, L.; Qin, D.; Wei, X. Pressure Fluctuation Propagation of a Pump Turbine at Pump Mode Under Low Head Condition. Sci. China Technol. Sci. 2014, 57, 811–818. [Google Scholar] [CrossRef]
- Sun, Y.K.; Zuo, Z.G.; Liu, S.H.; Wu, Y.; Liu, J. Numerical simulation of the influence of distributor pitch diameter on performance and pressure fluctuations in a pump-turbine. In Proceedings of the 26th IAHR Symposium on Hydraulic Machinery and Systems, Beijing, China, 19–23 August 2012; Volume 15, p. 2037. [Google Scholar]
- Zhang, Y.N.; Chen, T.; Li, J.W.; Yu, J. Experimental Study of Load Variations on Pressure Fluctuations in a Prototype Reversible Pump Turbine in Generating Mode. J. Fluids Eng. 2017, 139, 74501. [Google Scholar] [CrossRef]
- Liu, J.; Liu, S.; Sun, Y.; Jiao, L.; Wu, Y.; Wang, L. Three-dimensional flow simulation of transient power interruption process of a prototype pump-turbine at pump mode. J. Mech. Sci. Technol. 2013, 27, 1305–1312. [Google Scholar] [CrossRef]
- Chen, T.J.; Luo, X.Q.; Guo, P.C.; Wu, Y.L. 3-D Simulation of a prototype pump-turbine during starting period in turbine model. In Proceedings of the 6th International Conference on Pumps and Fans with Compressors and Wind Turbines (ICPF 2013), Beijing, China, 19–22 September 2013; Volume 52, p. 052028. [Google Scholar]
- Li, Z.J.; Bi, H.L.; Karney, B.; Wang, Z.; Yao, Z. Three-dimensional transient simulation of a prototype pump-turbine during normal turbine shutdown. J. Hydraul. Res. 2017, 55, 520–537. [Google Scholar]
- Xiao, Y.X.; Zhang, J.; Luo, Y.Y.; Wang, Z.; Xu, H. Numerical analysis of misaligned guide vanes effect pressure oscillations in a prototype pump turbine. In Proceedings of the 6th International Conference on Pumps and Fans with Compressors and Wind Turbines (ICPF 2013), Beijing, China, 19–22 September 2013; Volume 52, p. 052026. [Google Scholar]
- Parrondo-Gayo, J.L.; Gonza Lez-Pe Rez, J.; Ferna Ndez-Francos, J.N. The Effect of the Operating Point on the Pressure Fluctuations at the Blade Passage Frequency in the Volute of a Centrifugal Pump. J. Fluids Eng. 2002, 124, 784–790. [Google Scholar] [CrossRef]
- Ruchonnet, N.; Nicolet, C.; Avellan, F. Hydroacoustic modeling of rotor stator interaction in Francis pump turbine. In Proceedings of the IAHR International Meeting of Working Group on Cavitation and Dynamic Problems in Hydraulic Machinery and Systems, Barcelona, Spain, 28–30 June 2006. [Google Scholar]
- Ruchonnet, N.; Nicolet, C.; Avellan, F. One-dimensional modeling of rotor stator interaction in Francis pump-turbine. In Proceedings of the 23rd IAHR Symposium on Hydraulic Machinery and Systems, Yokohama, Japan, 17–21 October 2006. [Google Scholar]
- International Electrotechnical Commission (IEC). Hydraulic Turbines, Storage Pumps and Pump-Turbines-Model Acceptance Tests; IEC: Geneva, Switzerland, 1999. [Google Scholar]
- Sun, Y.K.; Zuo, Z.G.; Liu, S.H. Distribution of Pressure Fluctuations in a Prototype Pump Turbine at Pump Mode. Adv. Mech. Eng. 2014. [Google Scholar] [CrossRef]
Figure 1.
Hydraulic domain of the prototype pump turbine.

Figure 2.
Mesh independence test regarding hydraulic efficiency.

Figure 3.
Mesh of major hydraulic components.
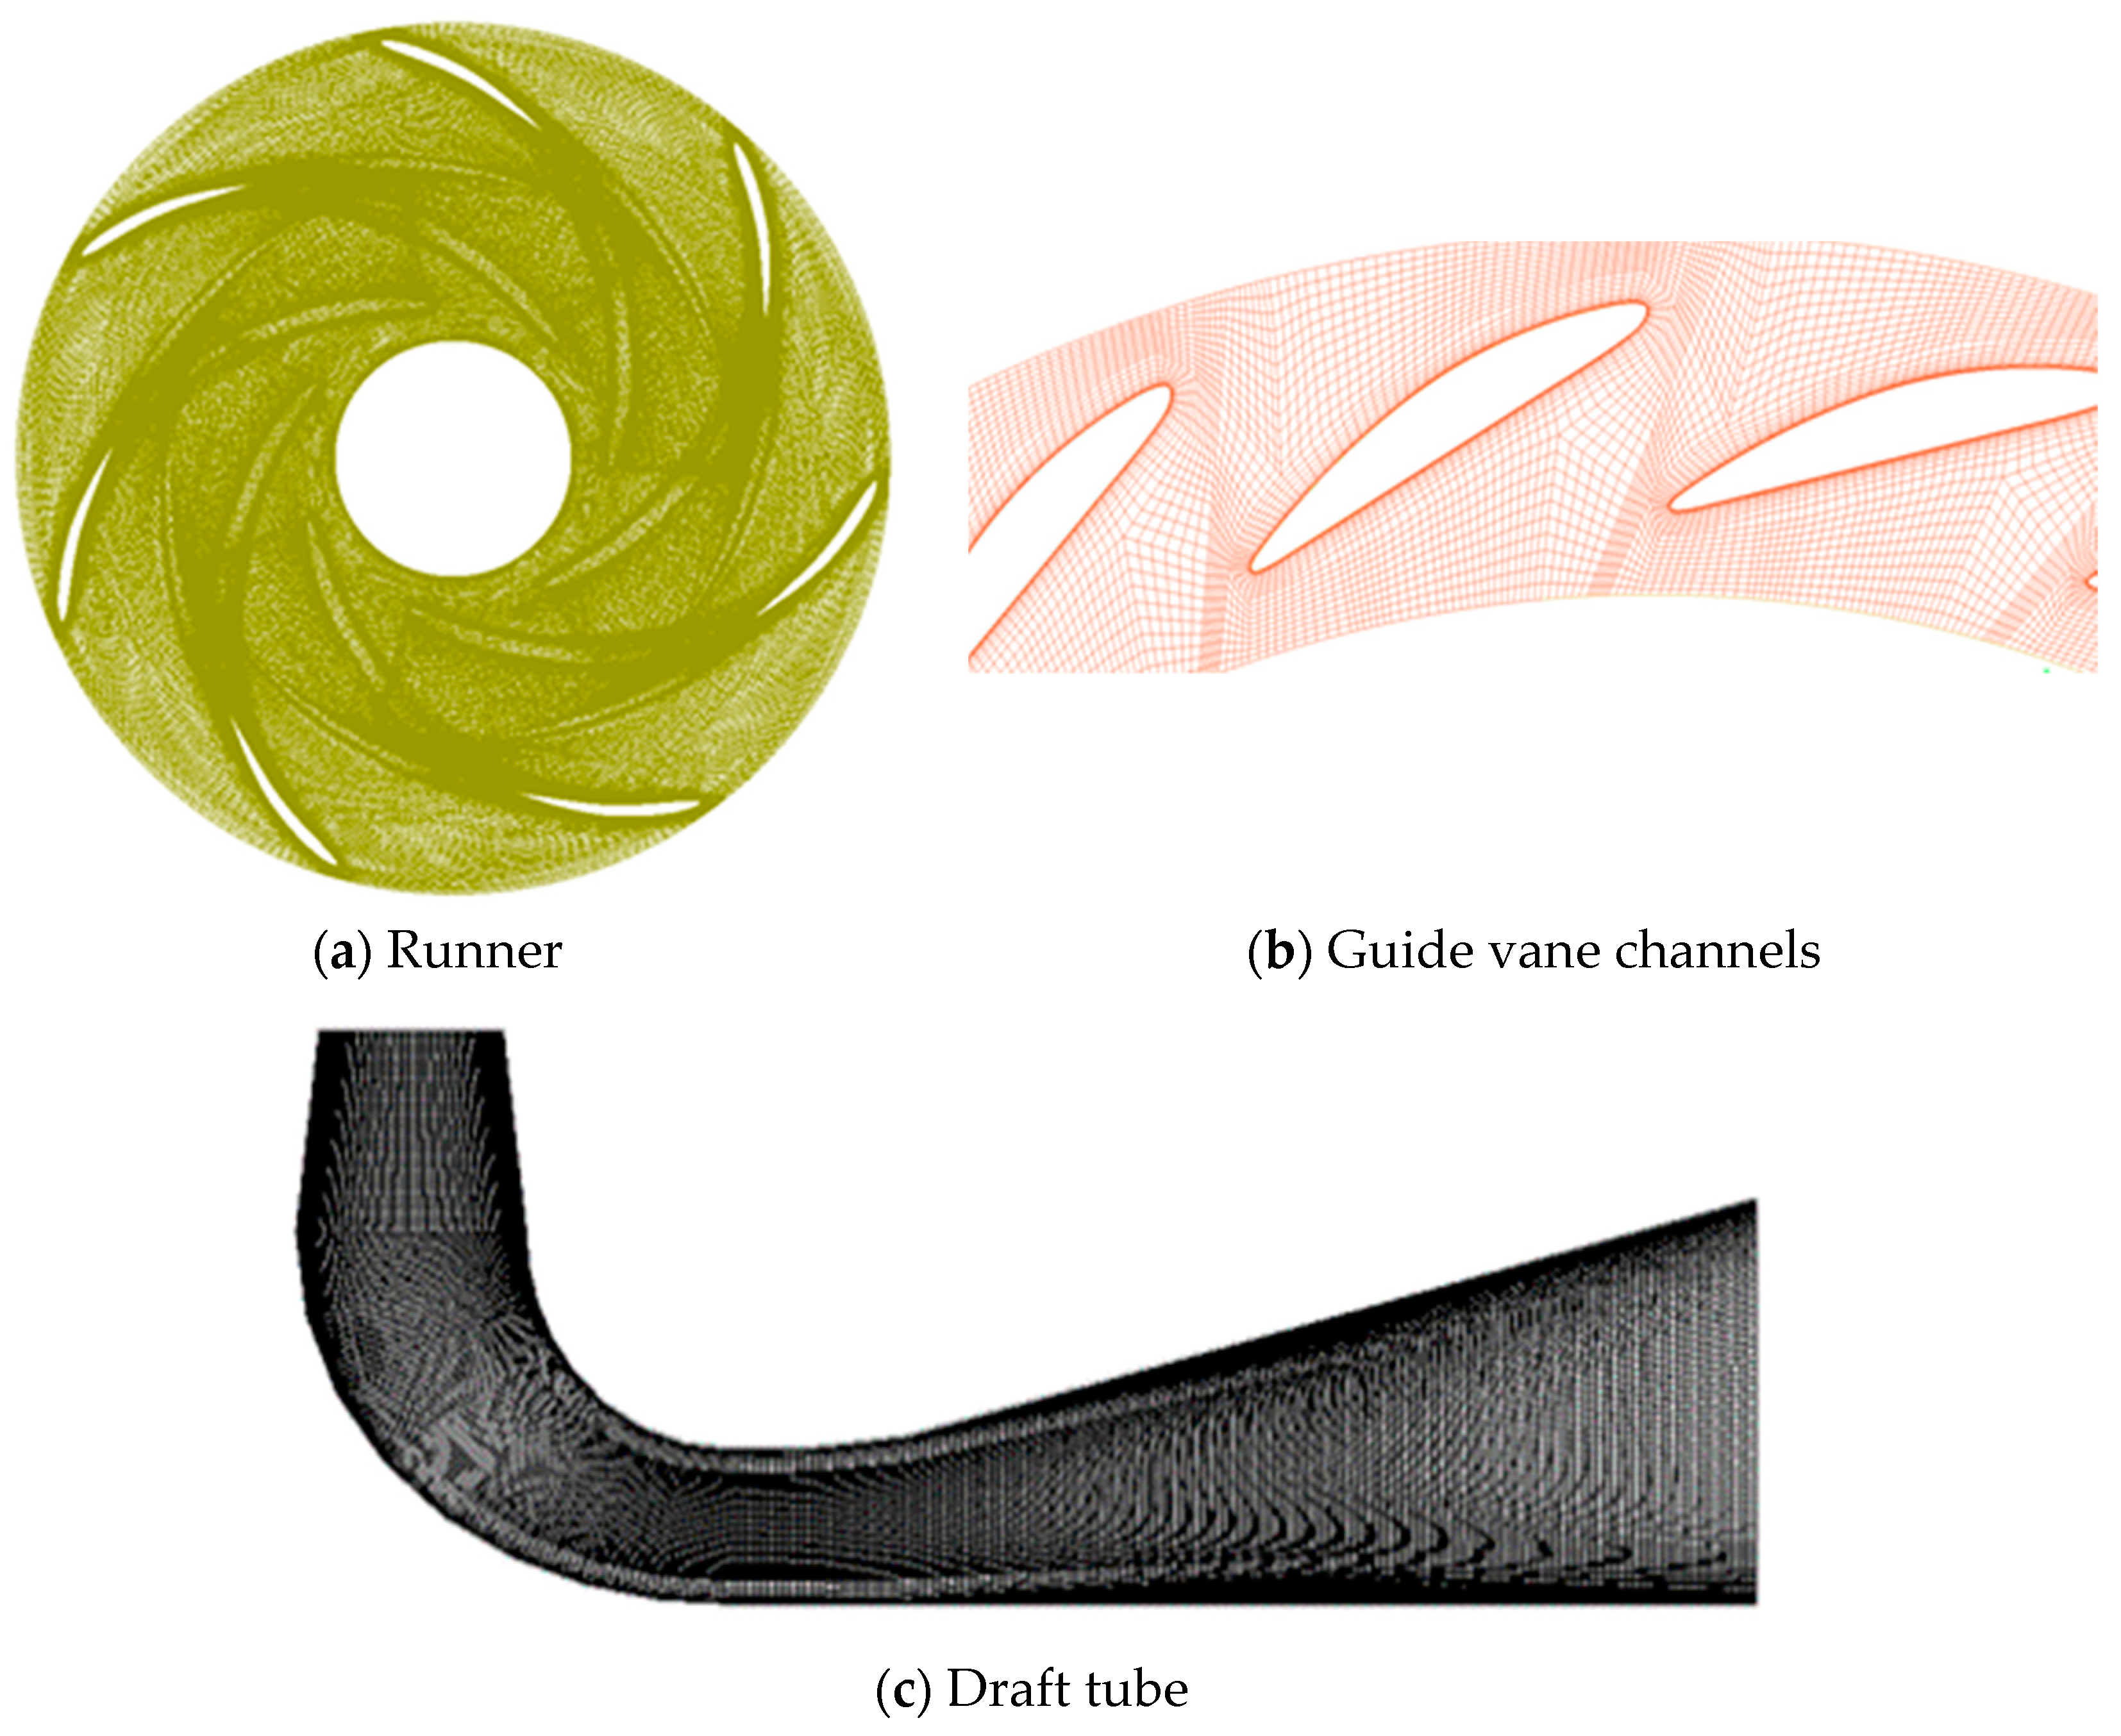
Figure 4.
Pressure monitoring points in circumferential direction in the vaneless space.
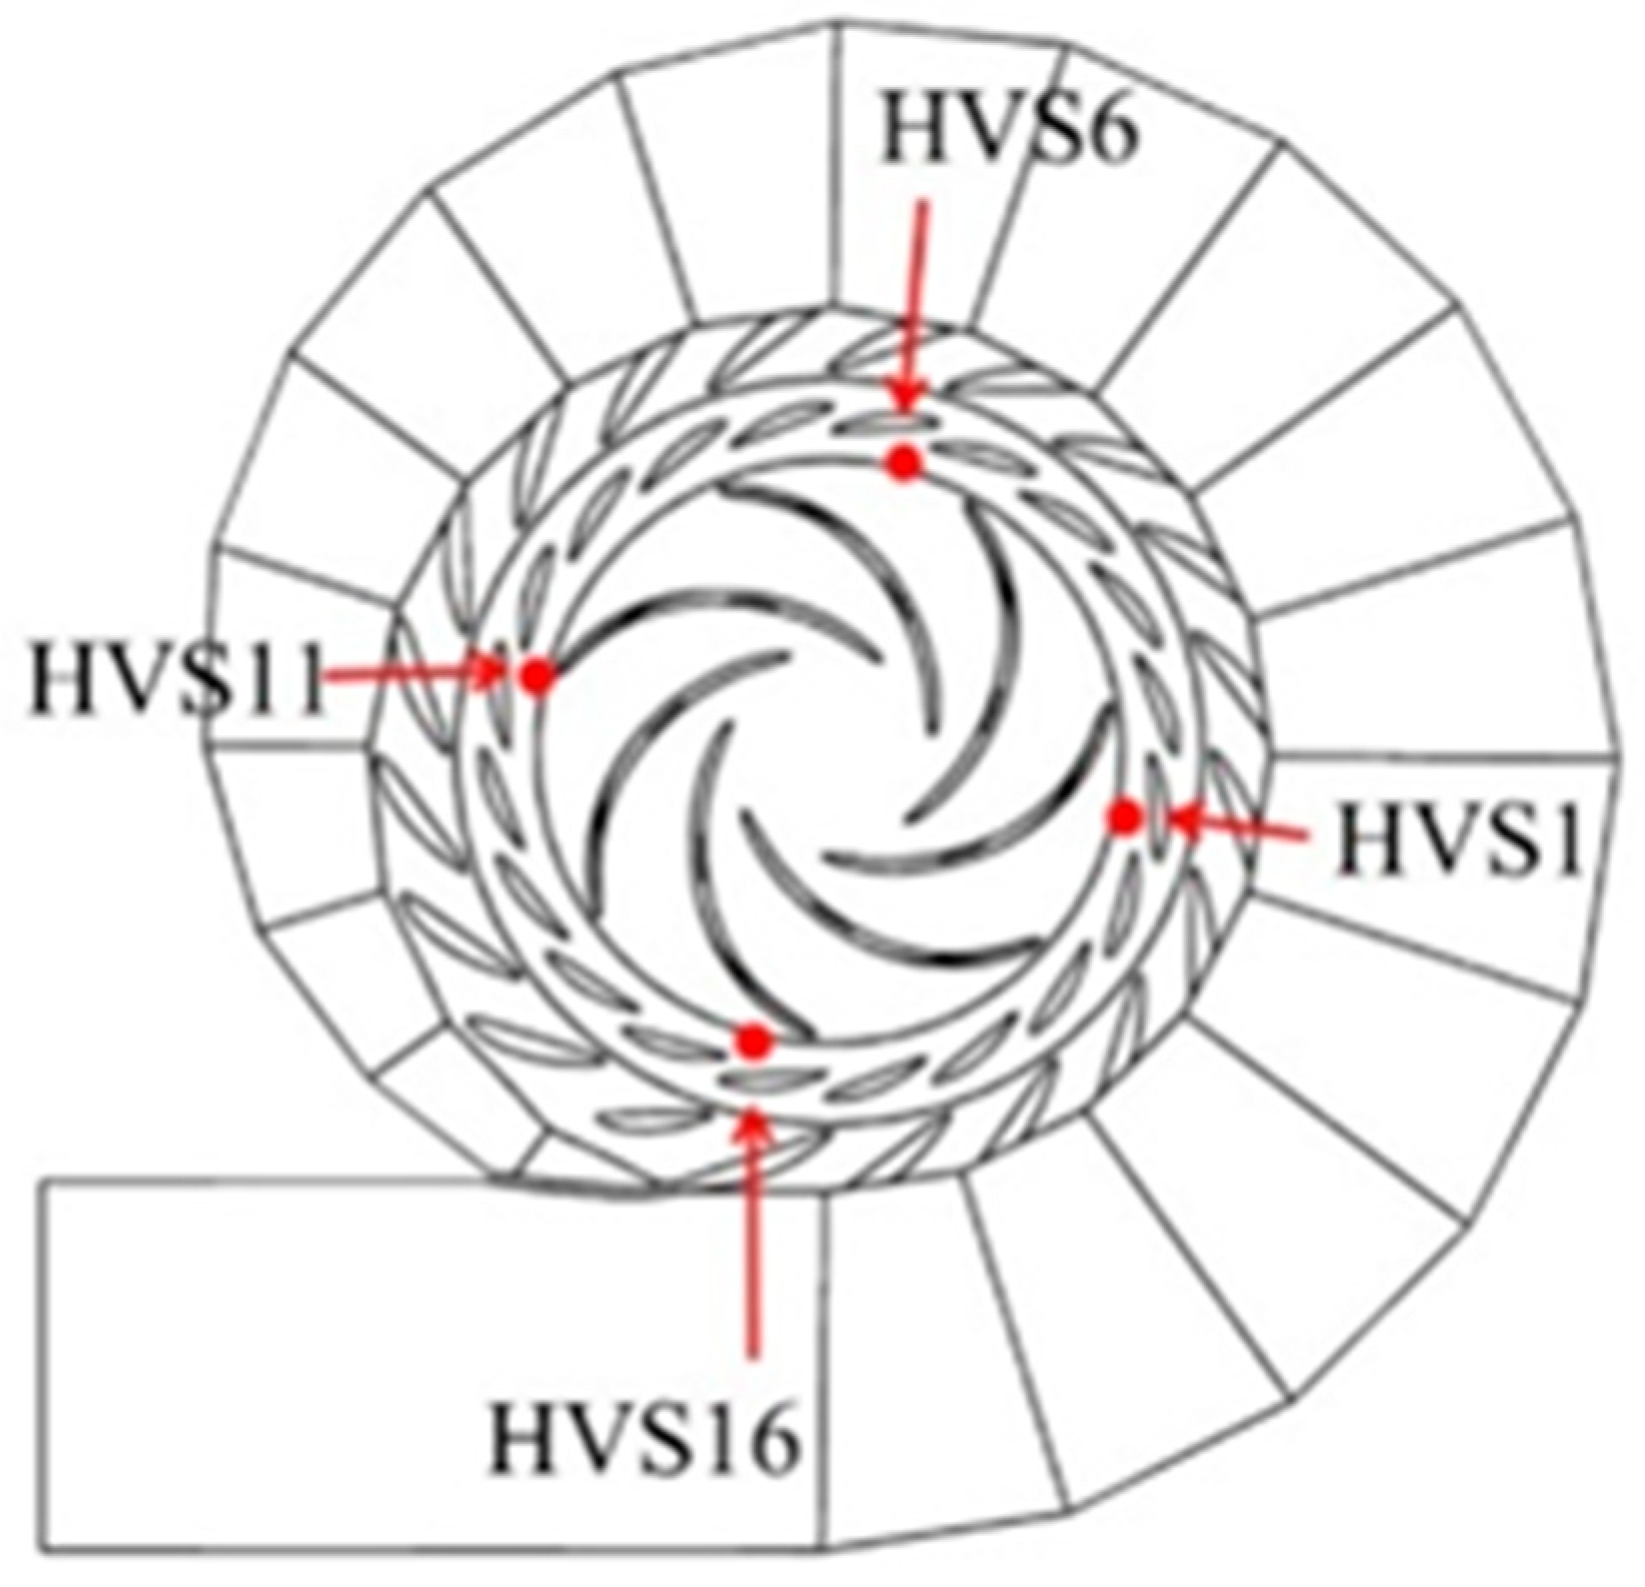
Figure 5.
Pressure monitoring points in the middle of flow channels.
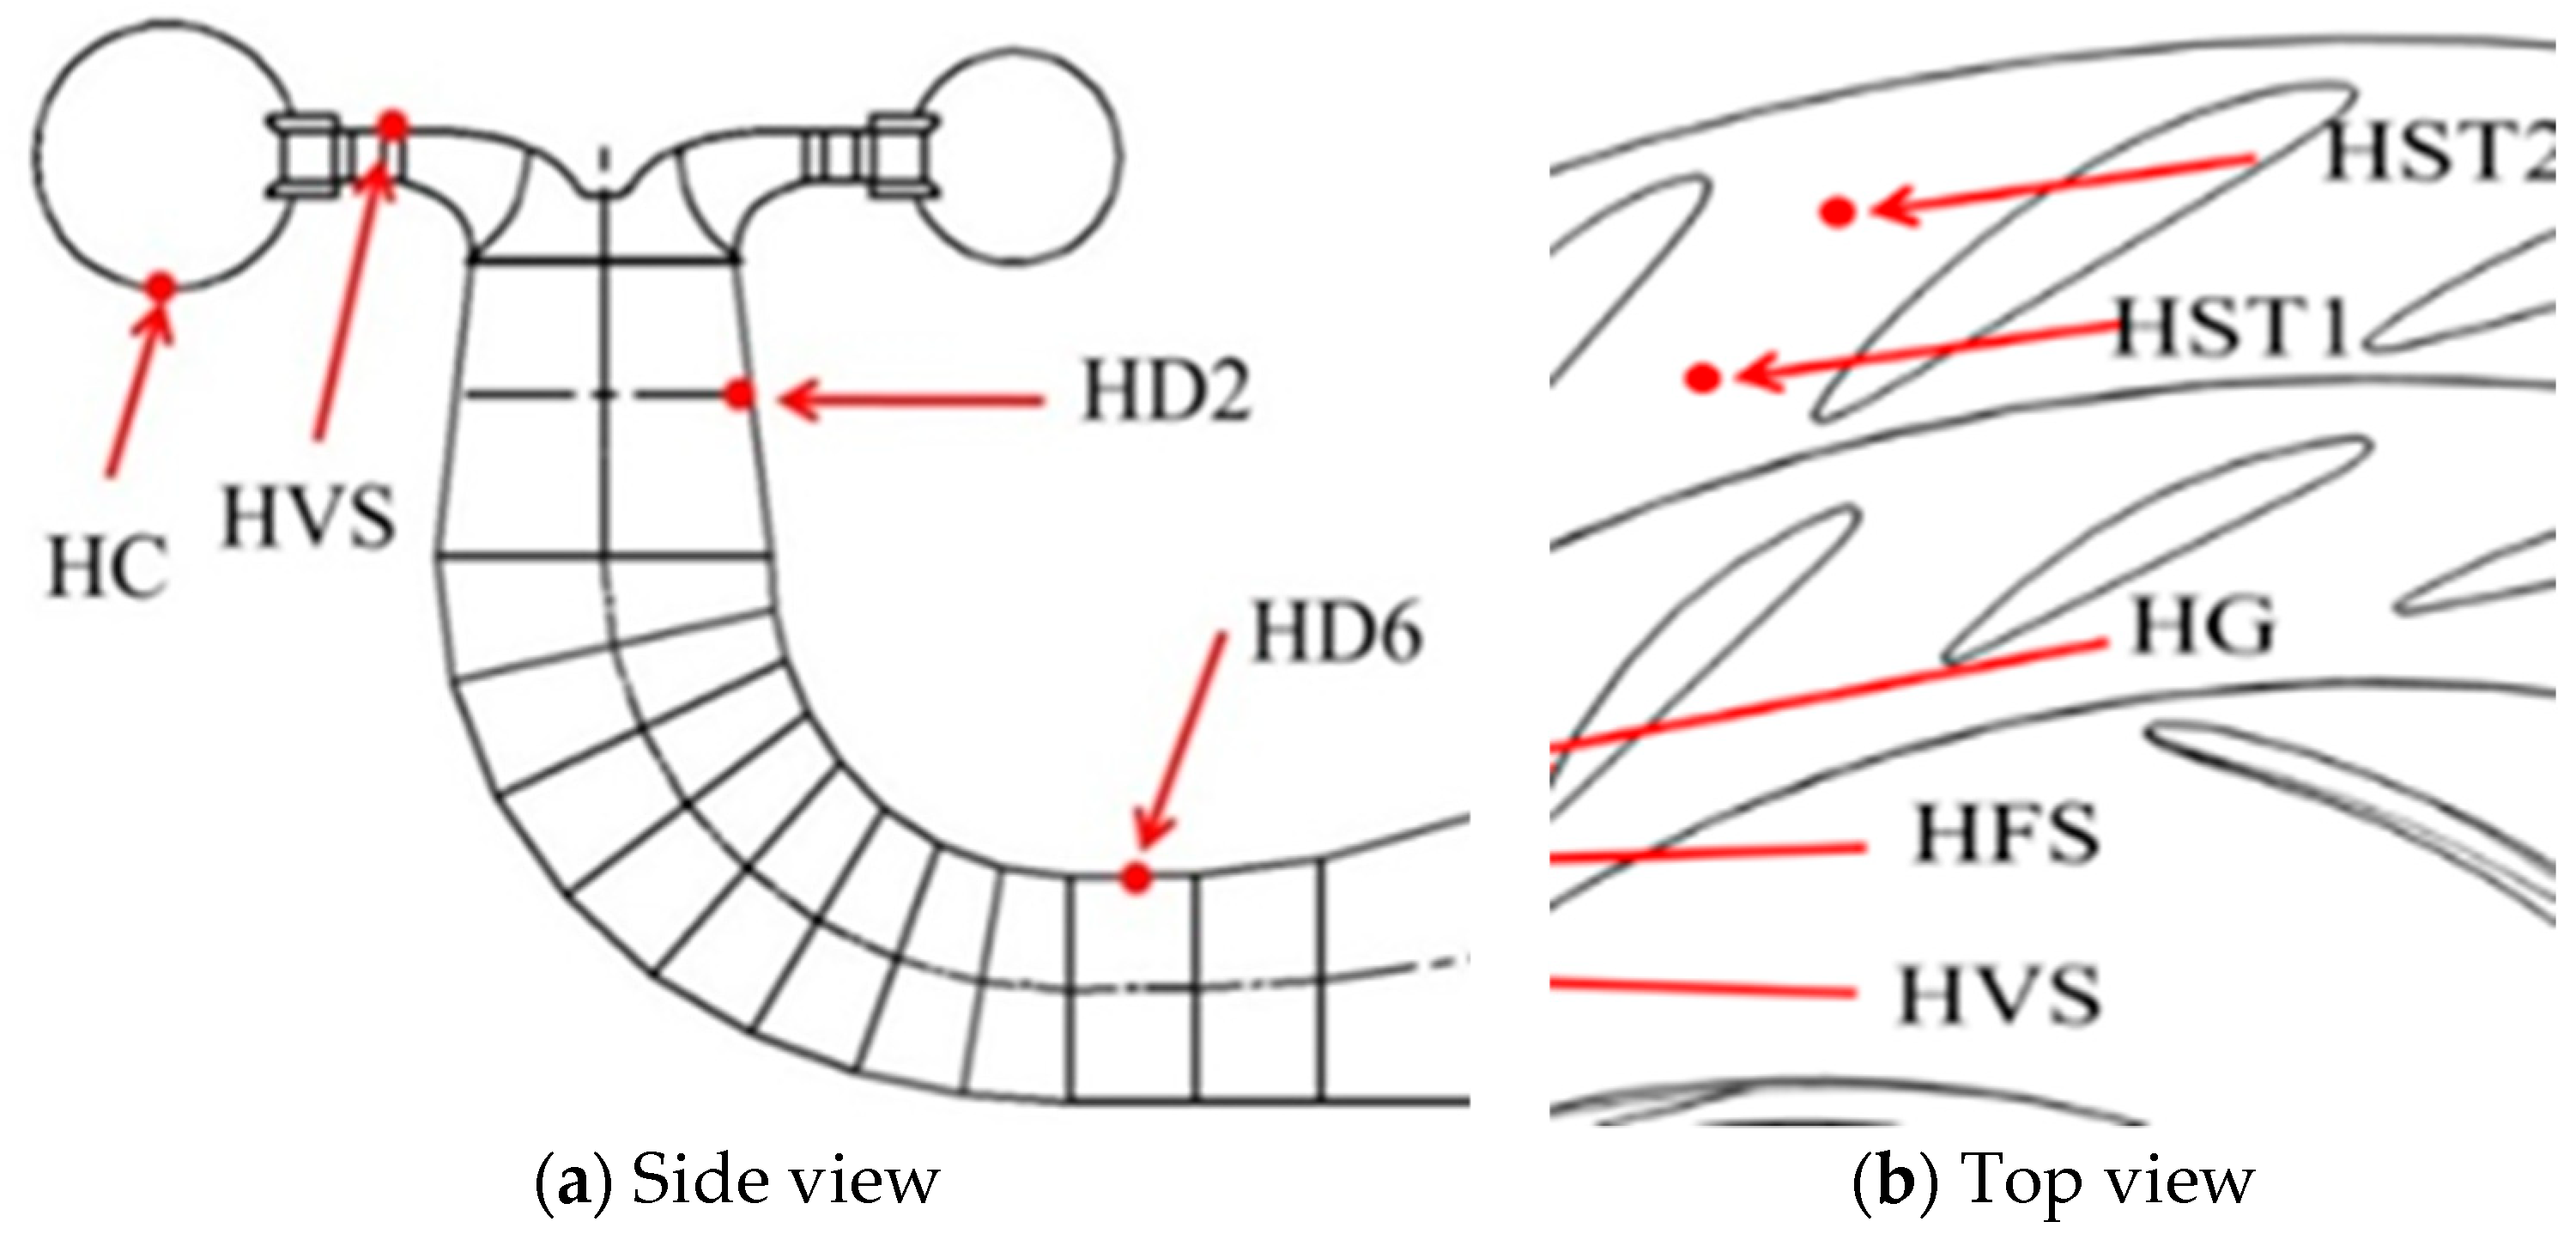
Figure 6.
Comparison of performance characteristics between experiments and numerical simulation.
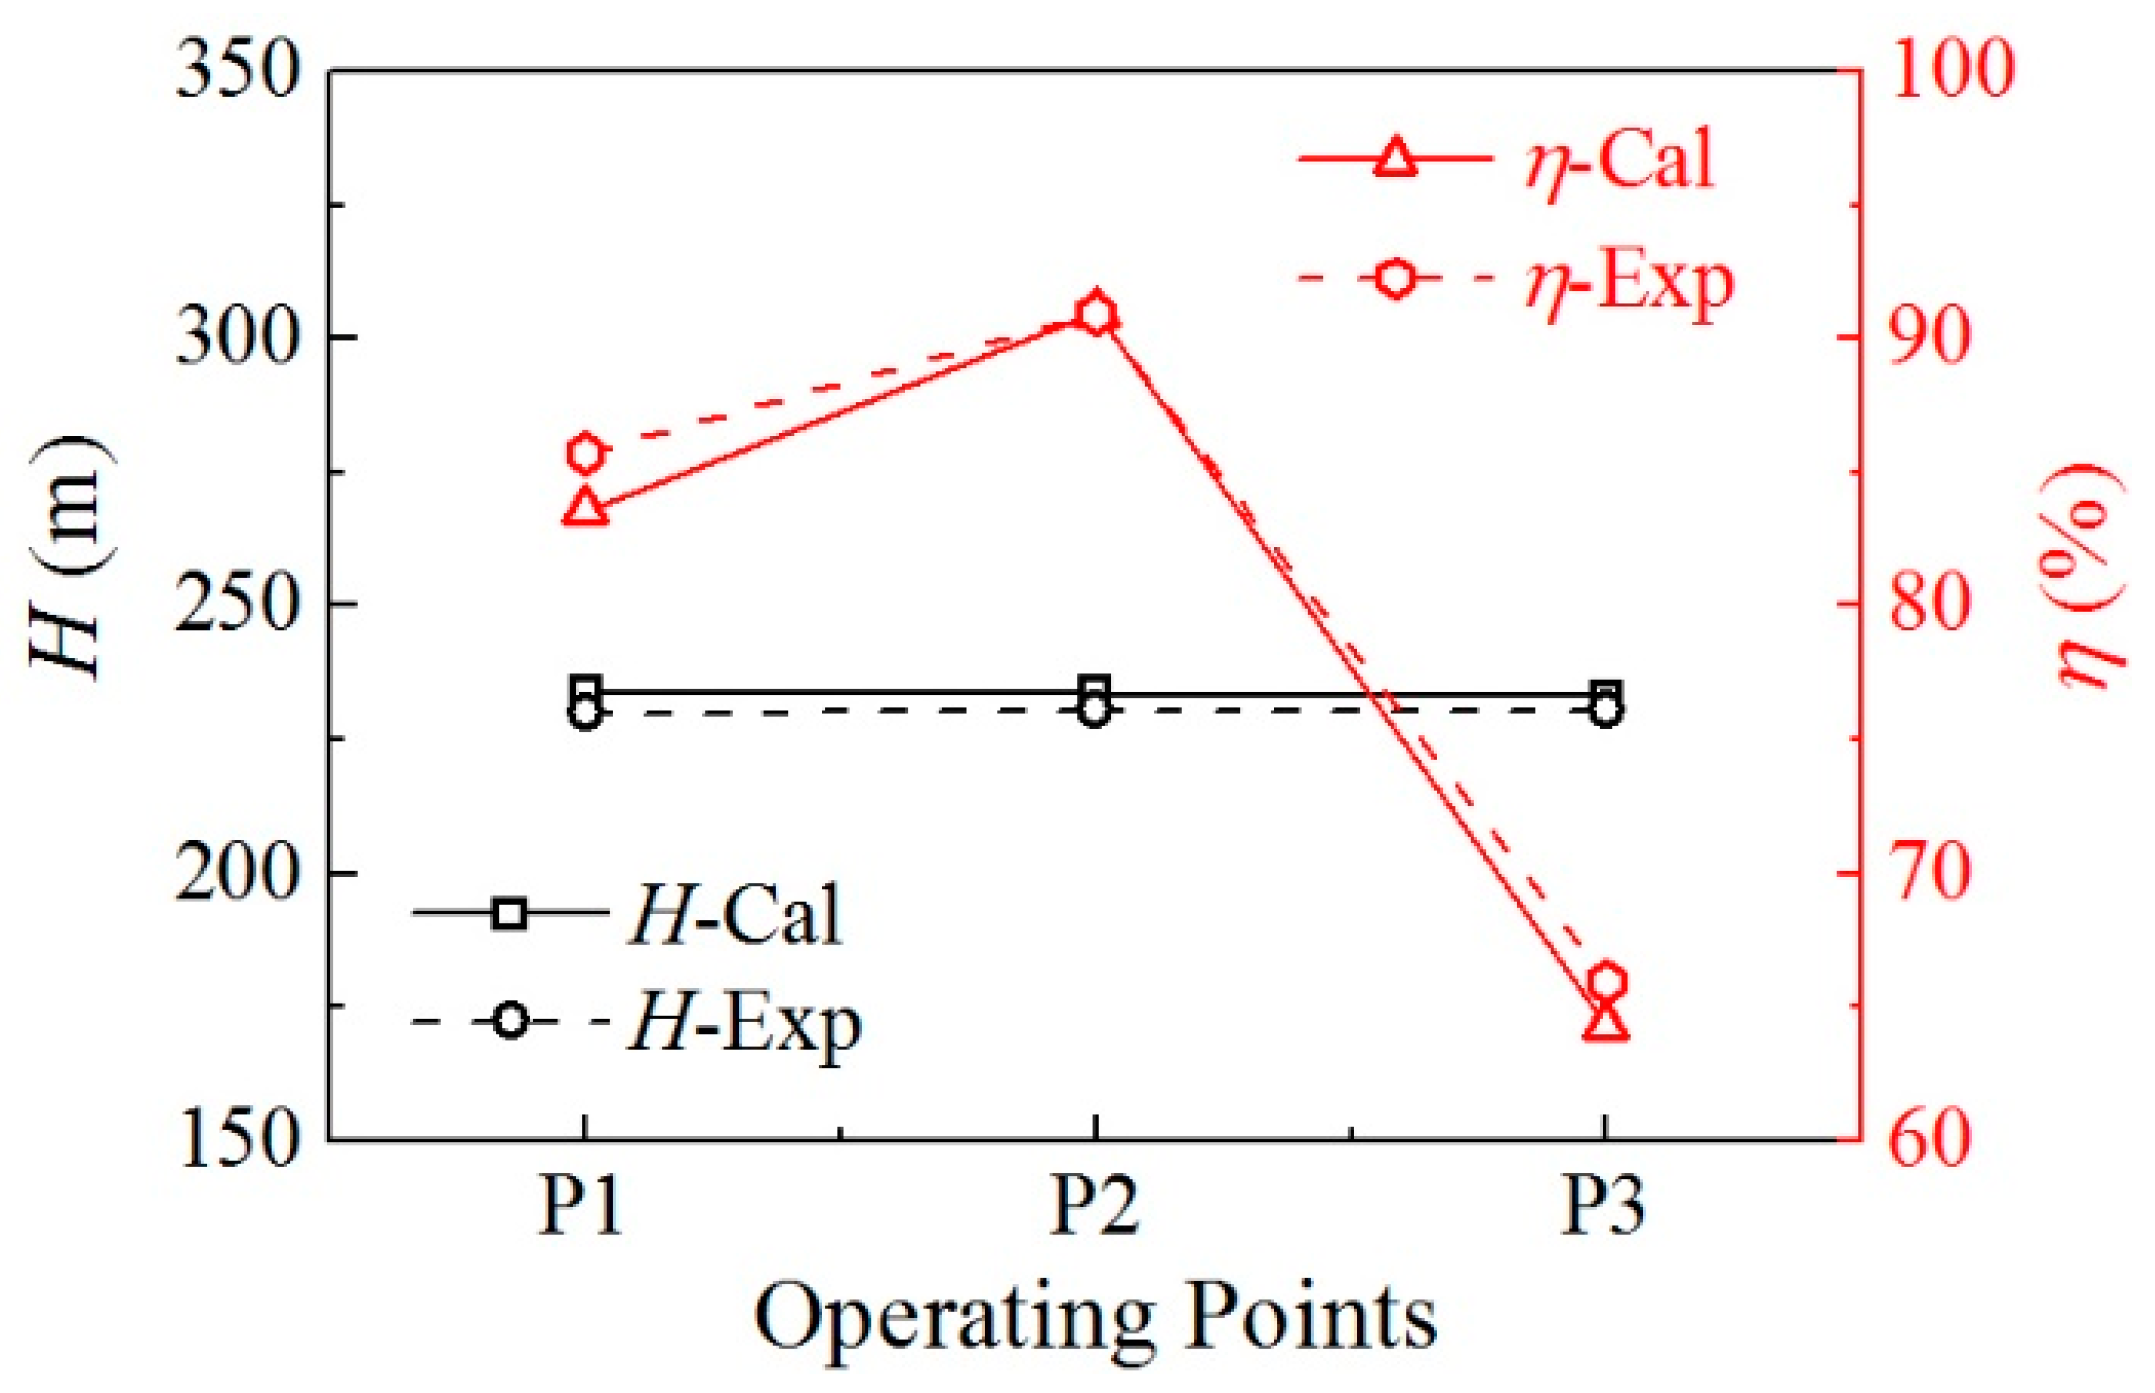
Figure 7.
Accuracy validation of spectrum analysis of pressure fluctuations.

Figure 8.
Relative amplitude and frequency of pressure fluctuations in vaneless space.
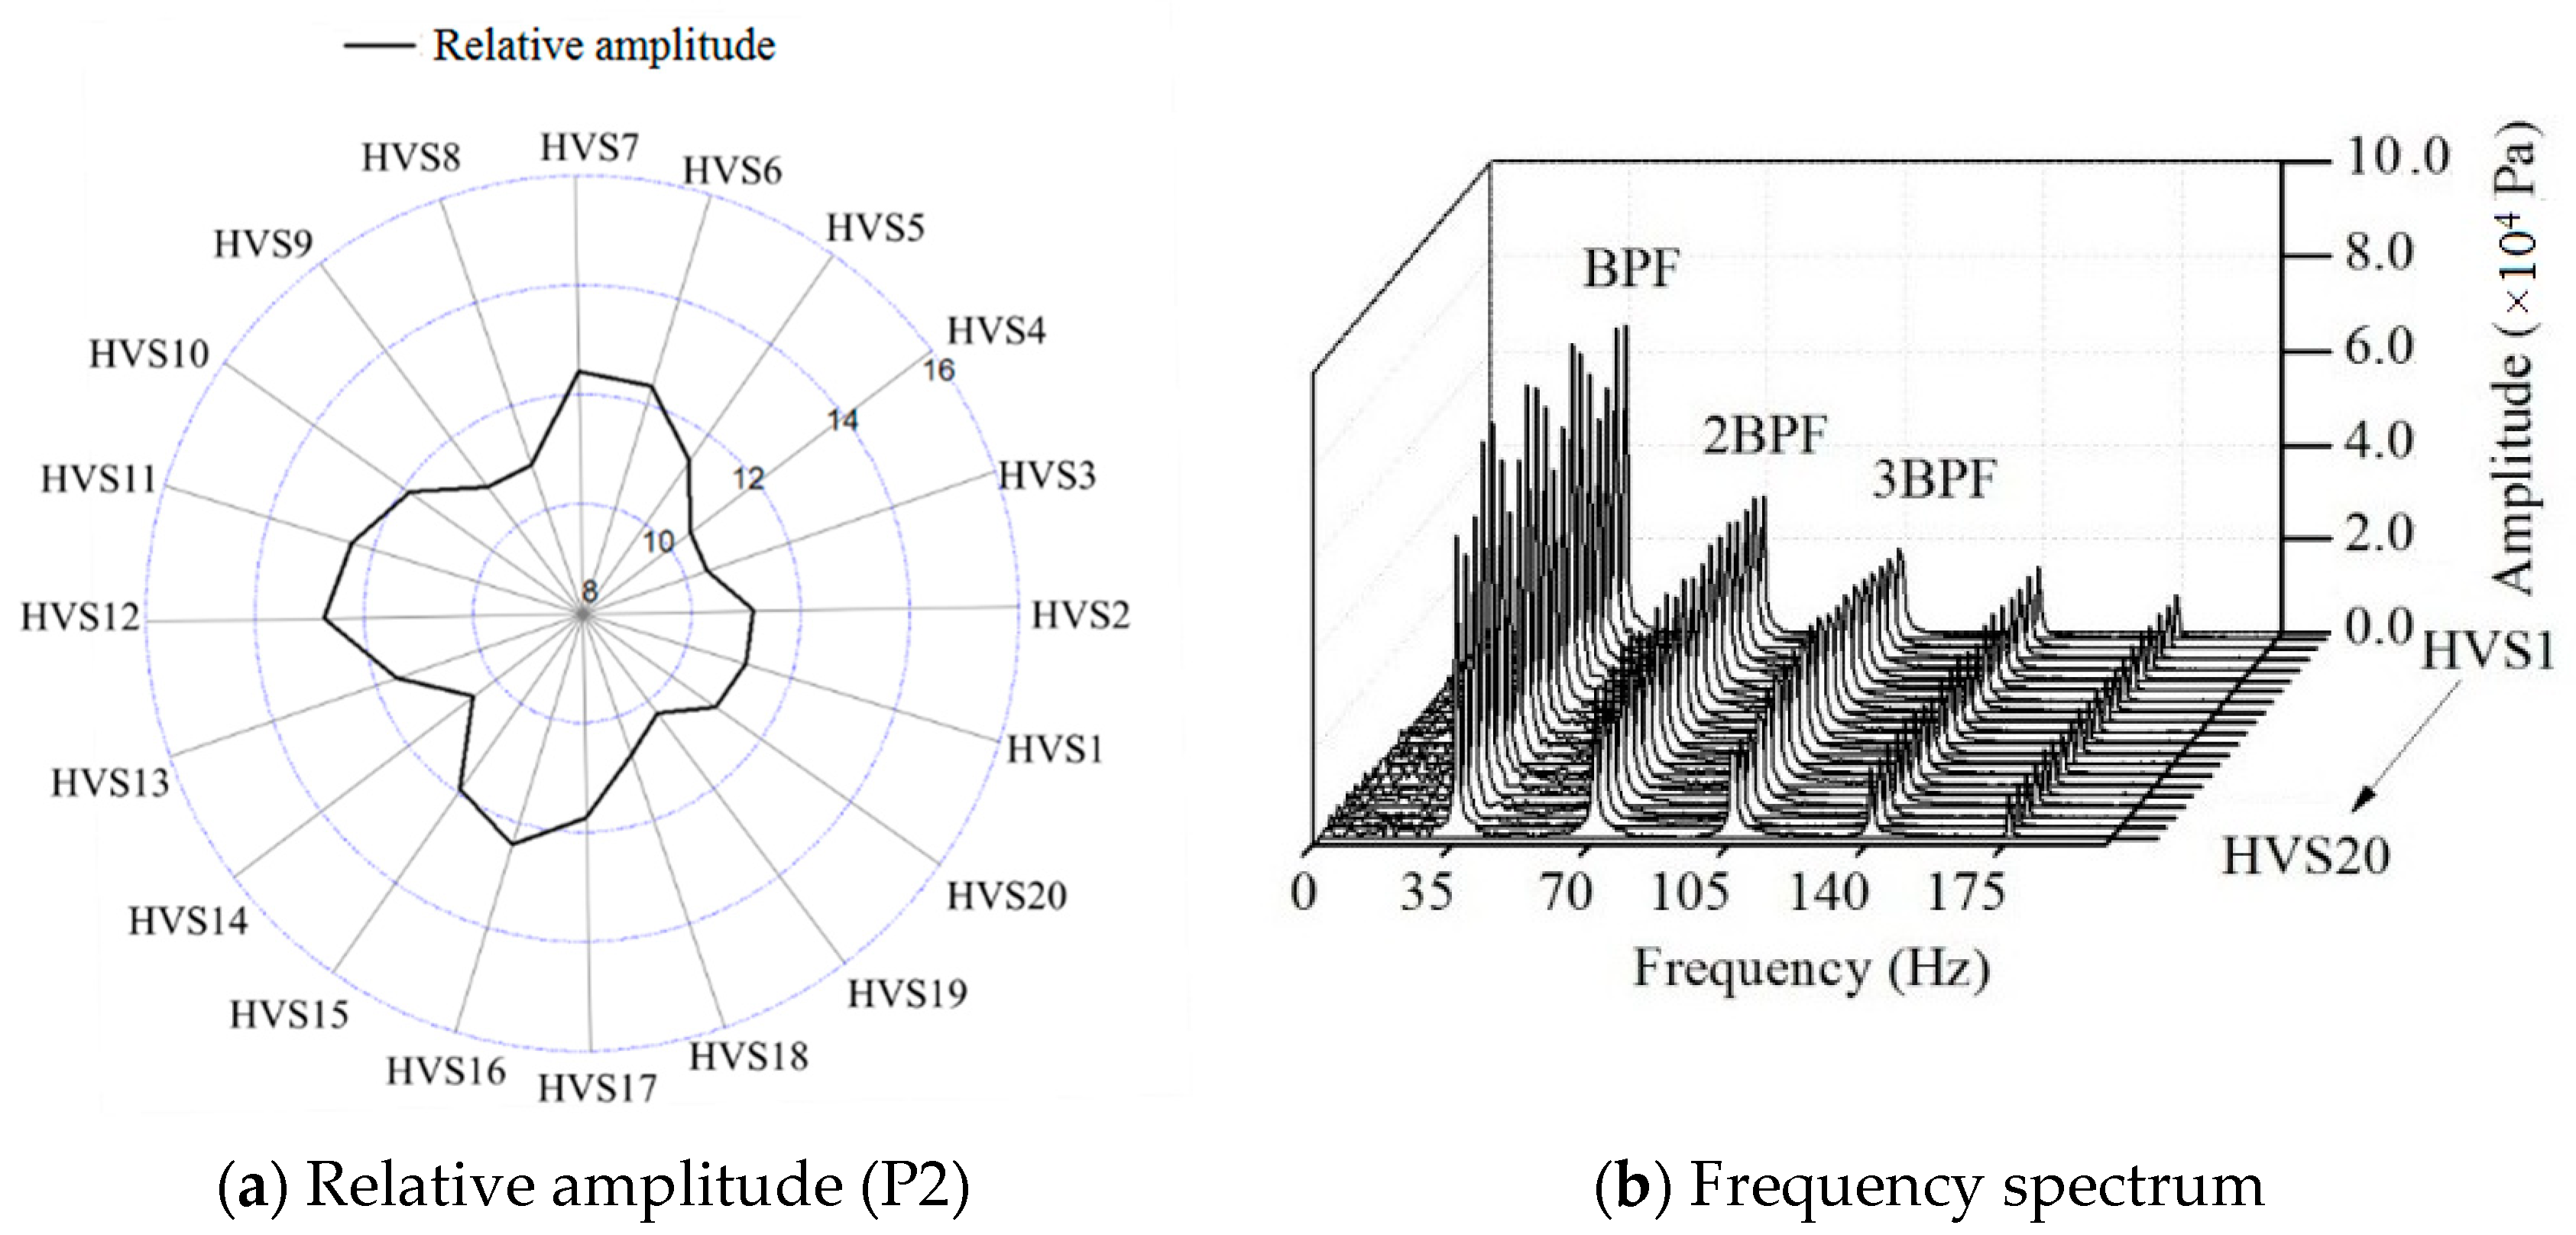
Figure 9.
Pressure fluctuation component of BPF, 2BPF and 3BPF in the vaneless space (P2).

Figure 10.
Velocity contour in the vaneless space with 7 runner blades.

Figure 11.
Pressure fluctuation components in the middle of flow channels (P2).
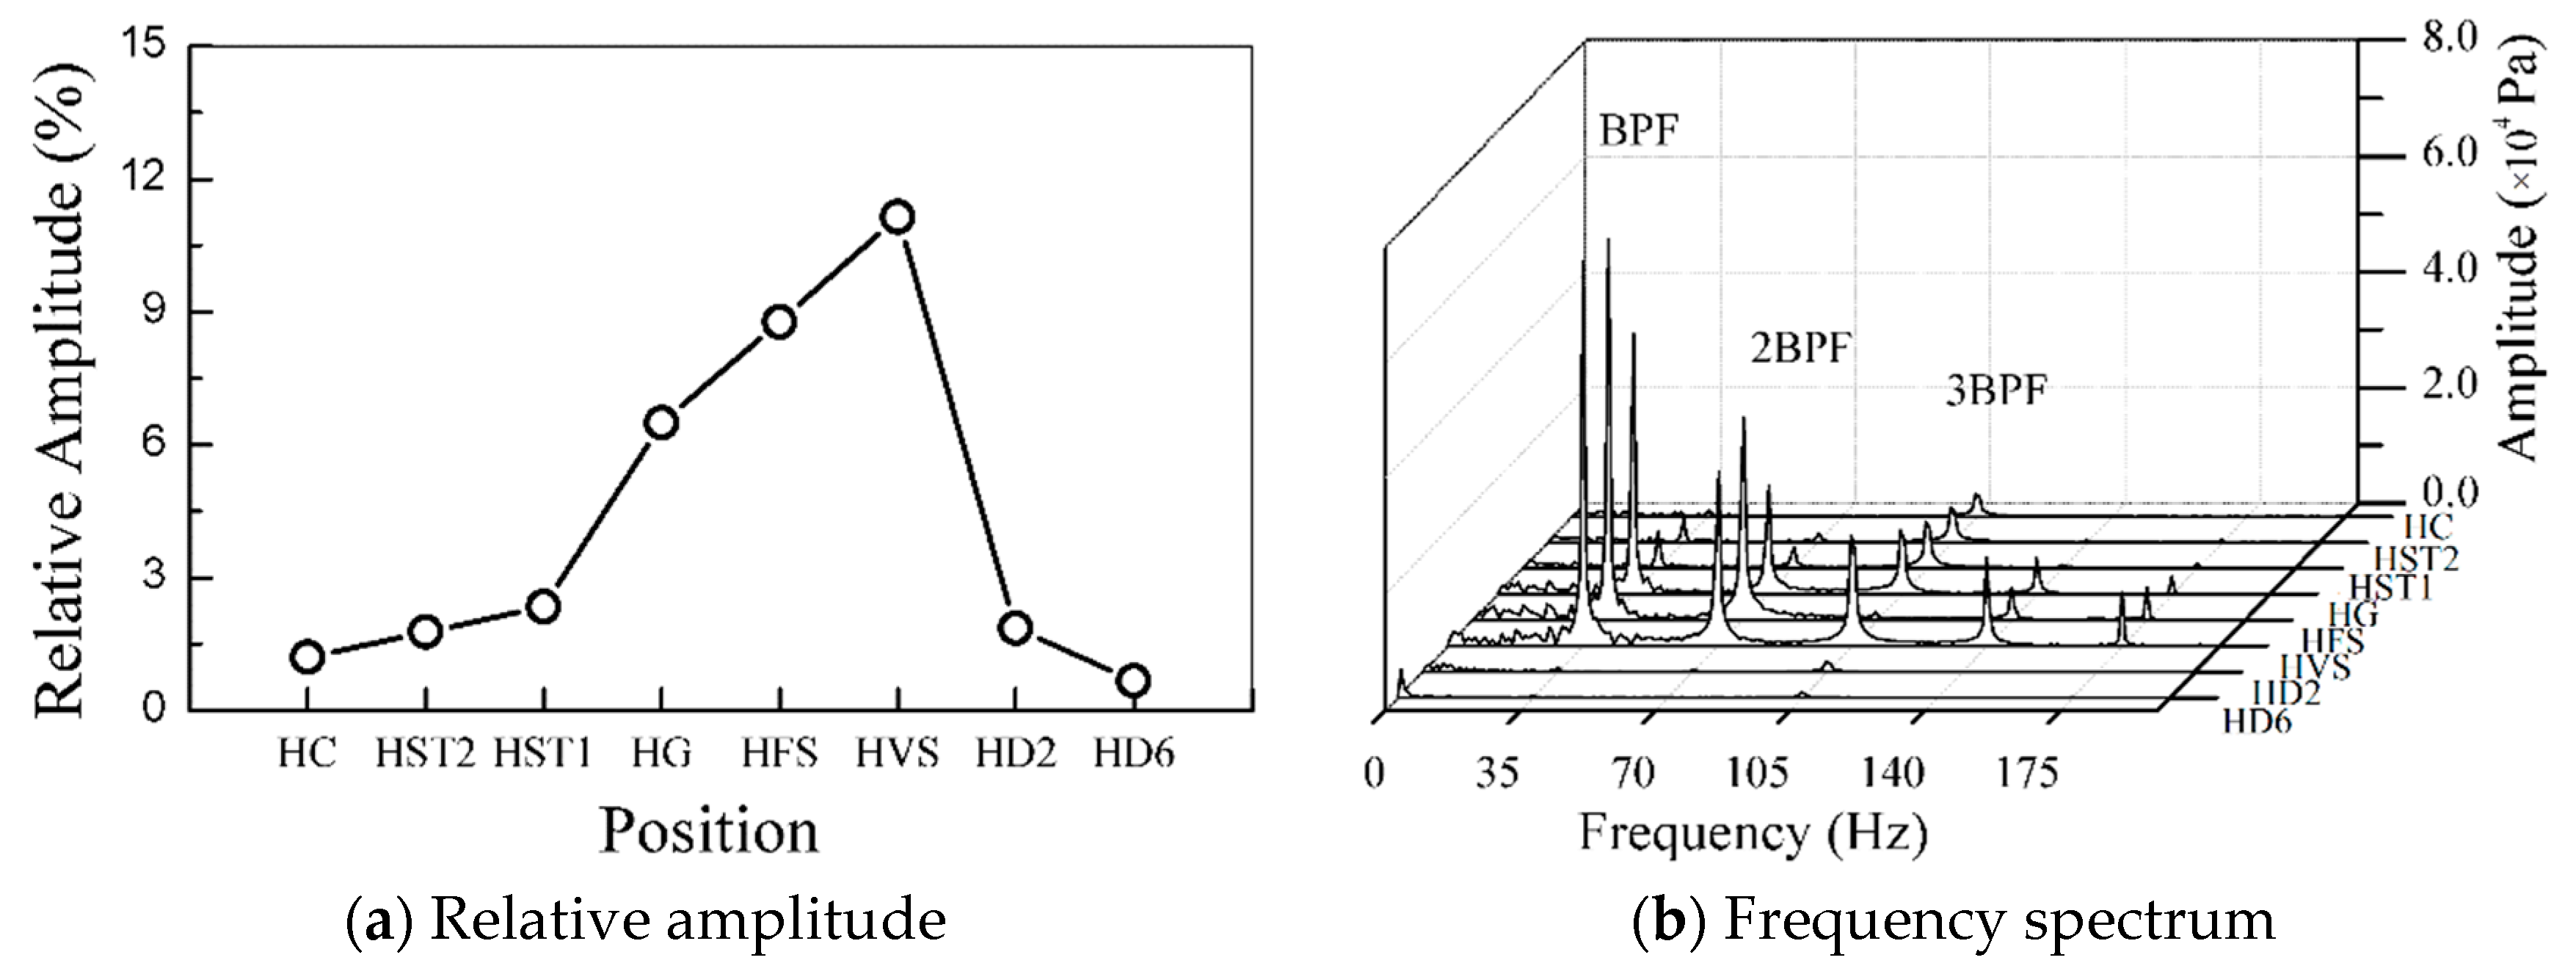
Figure 12.
Distribution of frequency components BPF, 2BPF and 3BPF in the middle of flow channels.
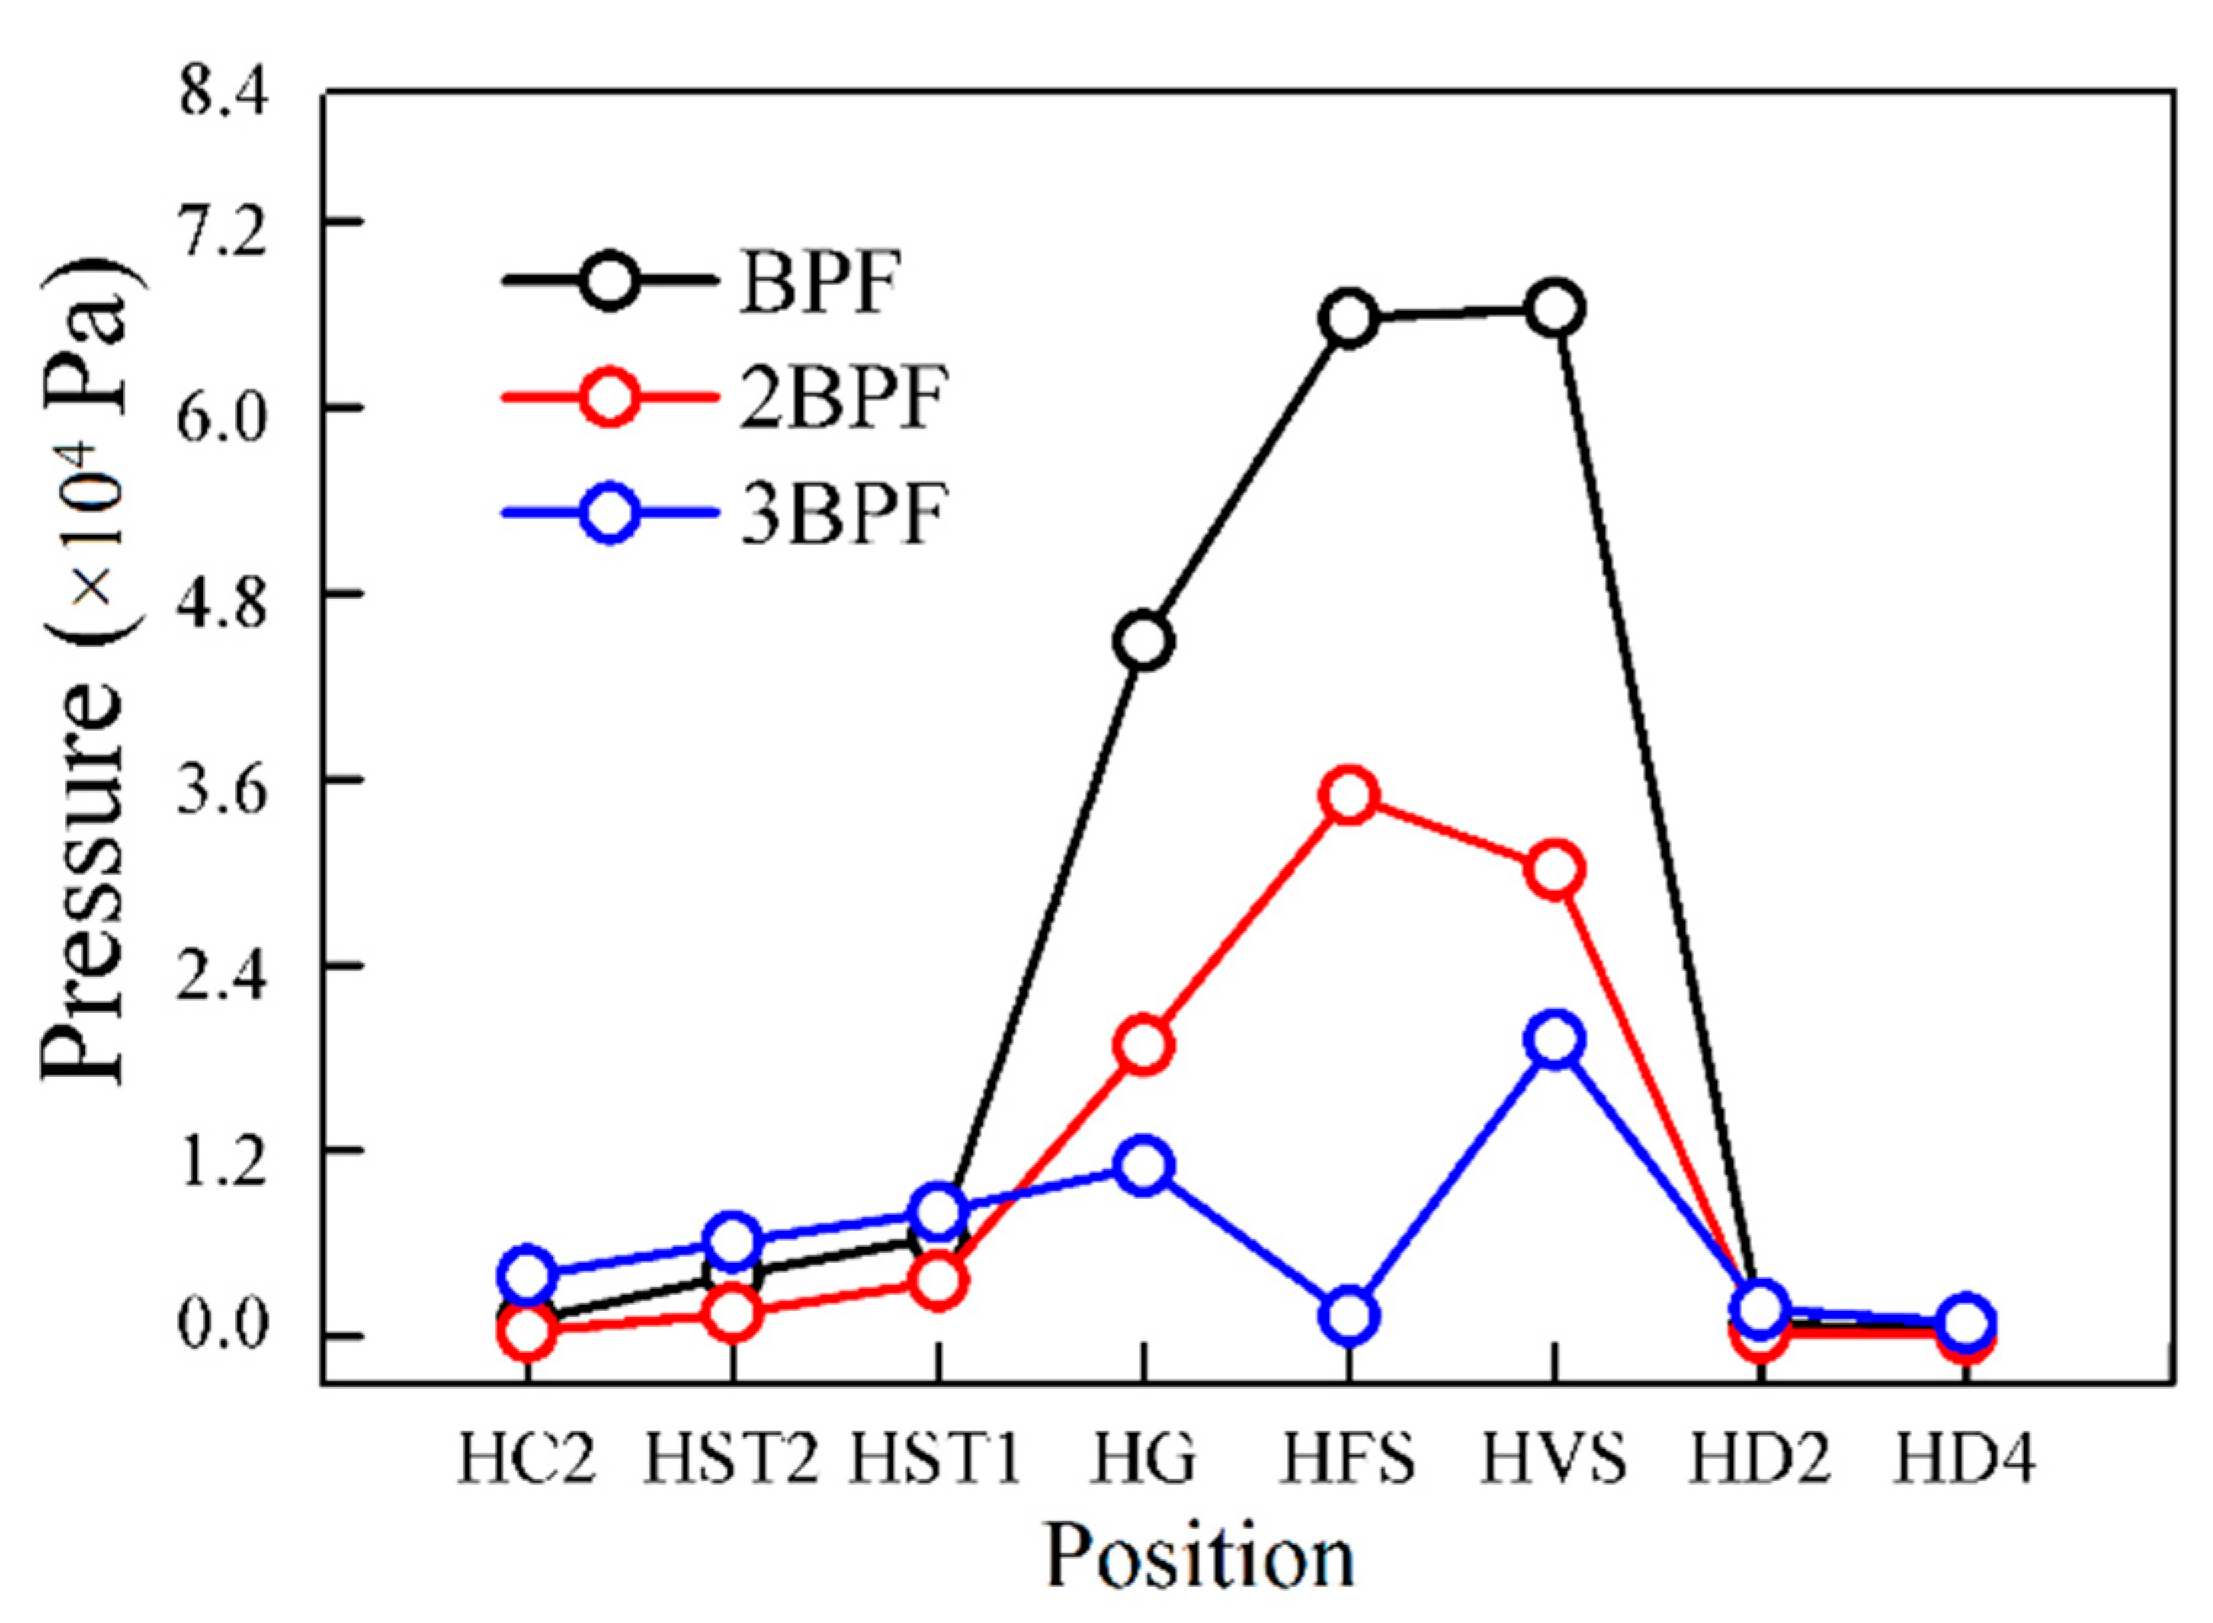
Figure 13.
Distribution of relative amplitude in the vaneless space at operating points P1 and P3.
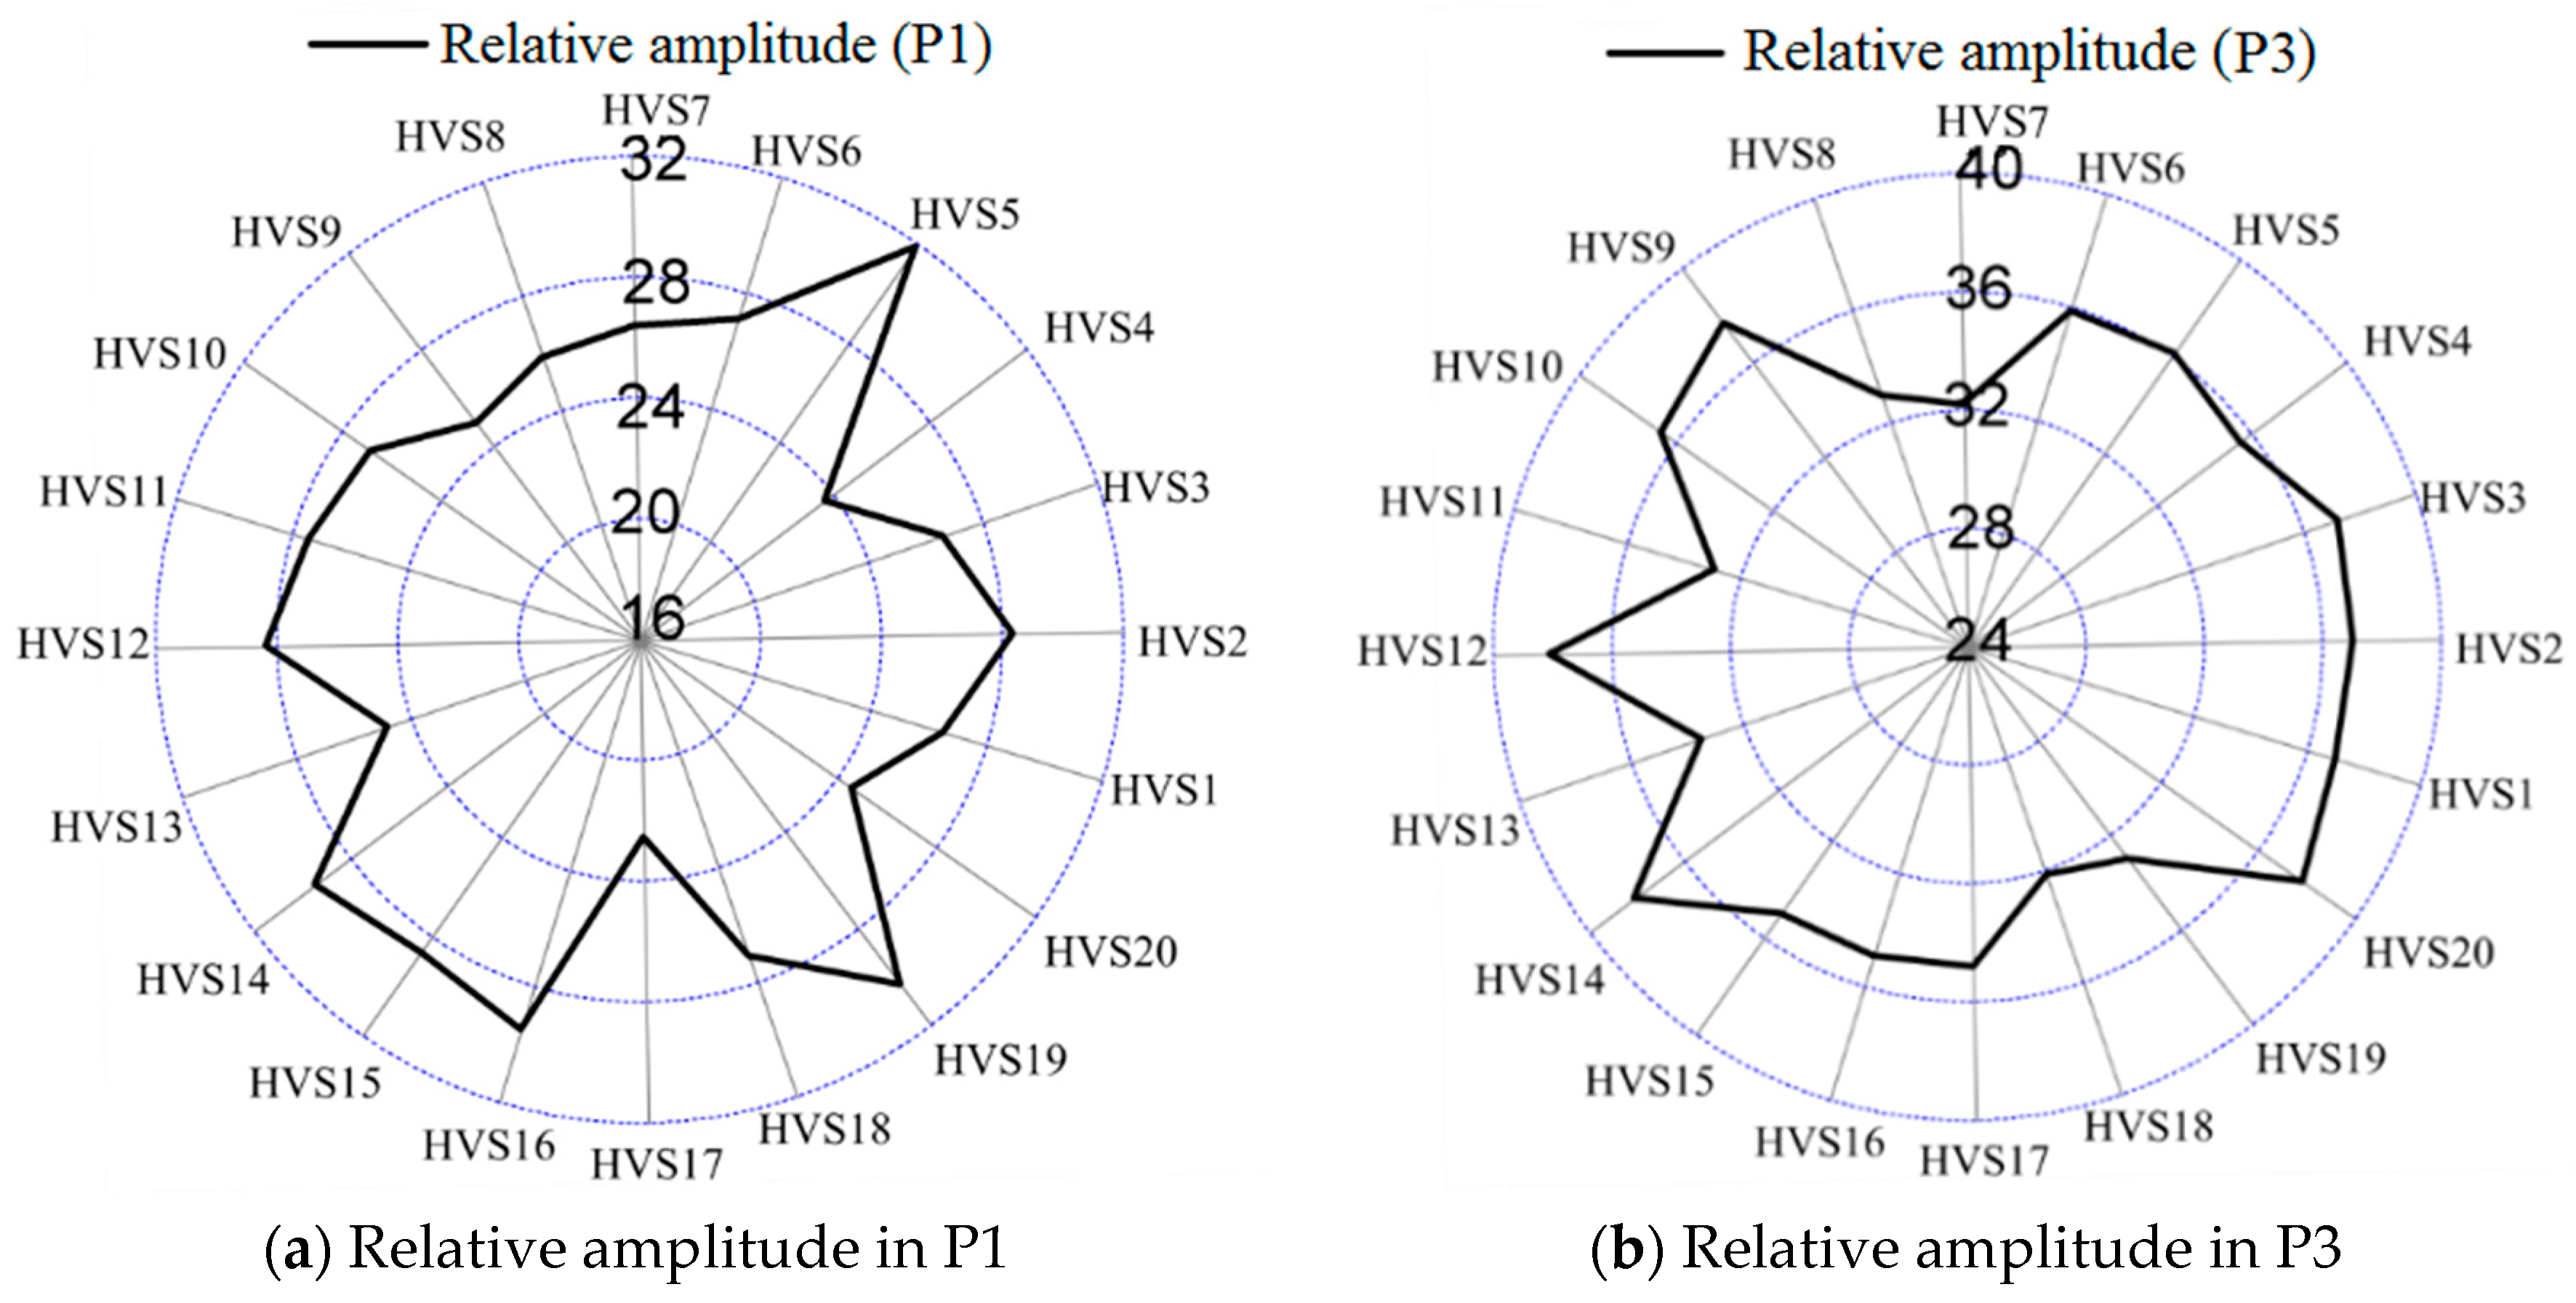
Figure 14.
Spectrum analysis of pressure fluctuations in the vaneless space at operating points P1 and P3.
Figure 14.
Spectrum analysis of pressure fluctuations in the vaneless space at operating points P1 and P3.

Figure 15.
Draft tube vortex in different operating points.

Figure 16.
Distribution of pressure fluctuation components of BPF, 2BPF and 3BPF (P1 and P3).

Figure 17.
Distribution of pressure fluctuations of components of BPF at different circumferential positions at P1, P2, and P3 operating points.
Figure 17.
Distribution of pressure fluctuations of components of BPF at different circumferential positions at P1, P2, and P3 operating points.
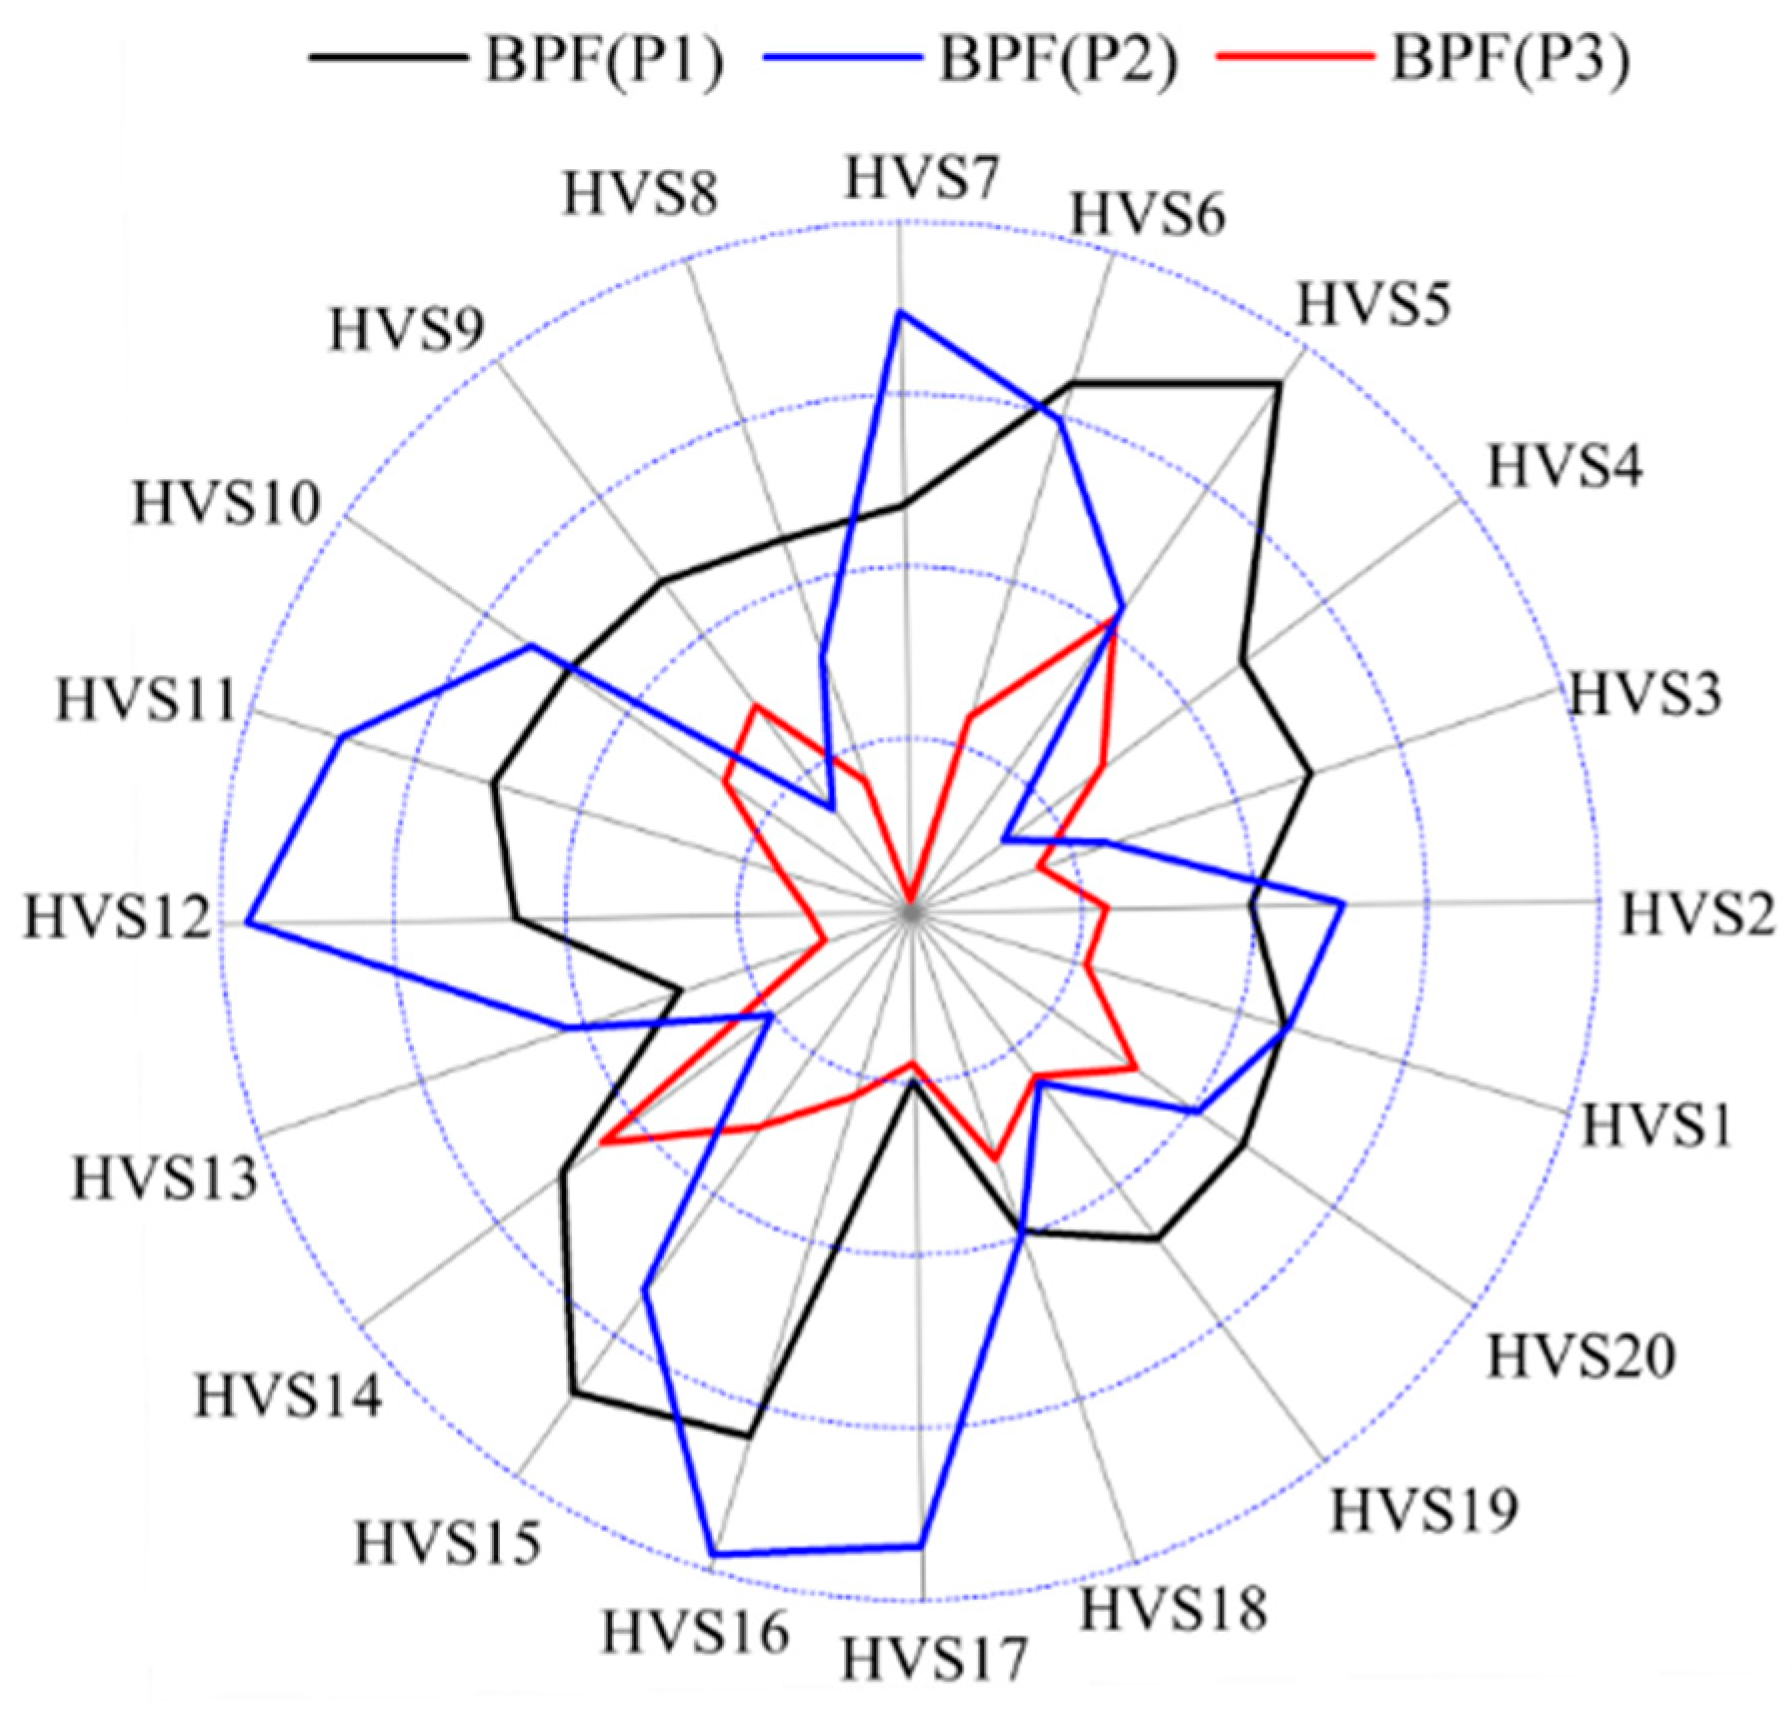
Figure 18.
Comparison of hydraulic performance (head and efficiency) with 9 blades and 7 blades.
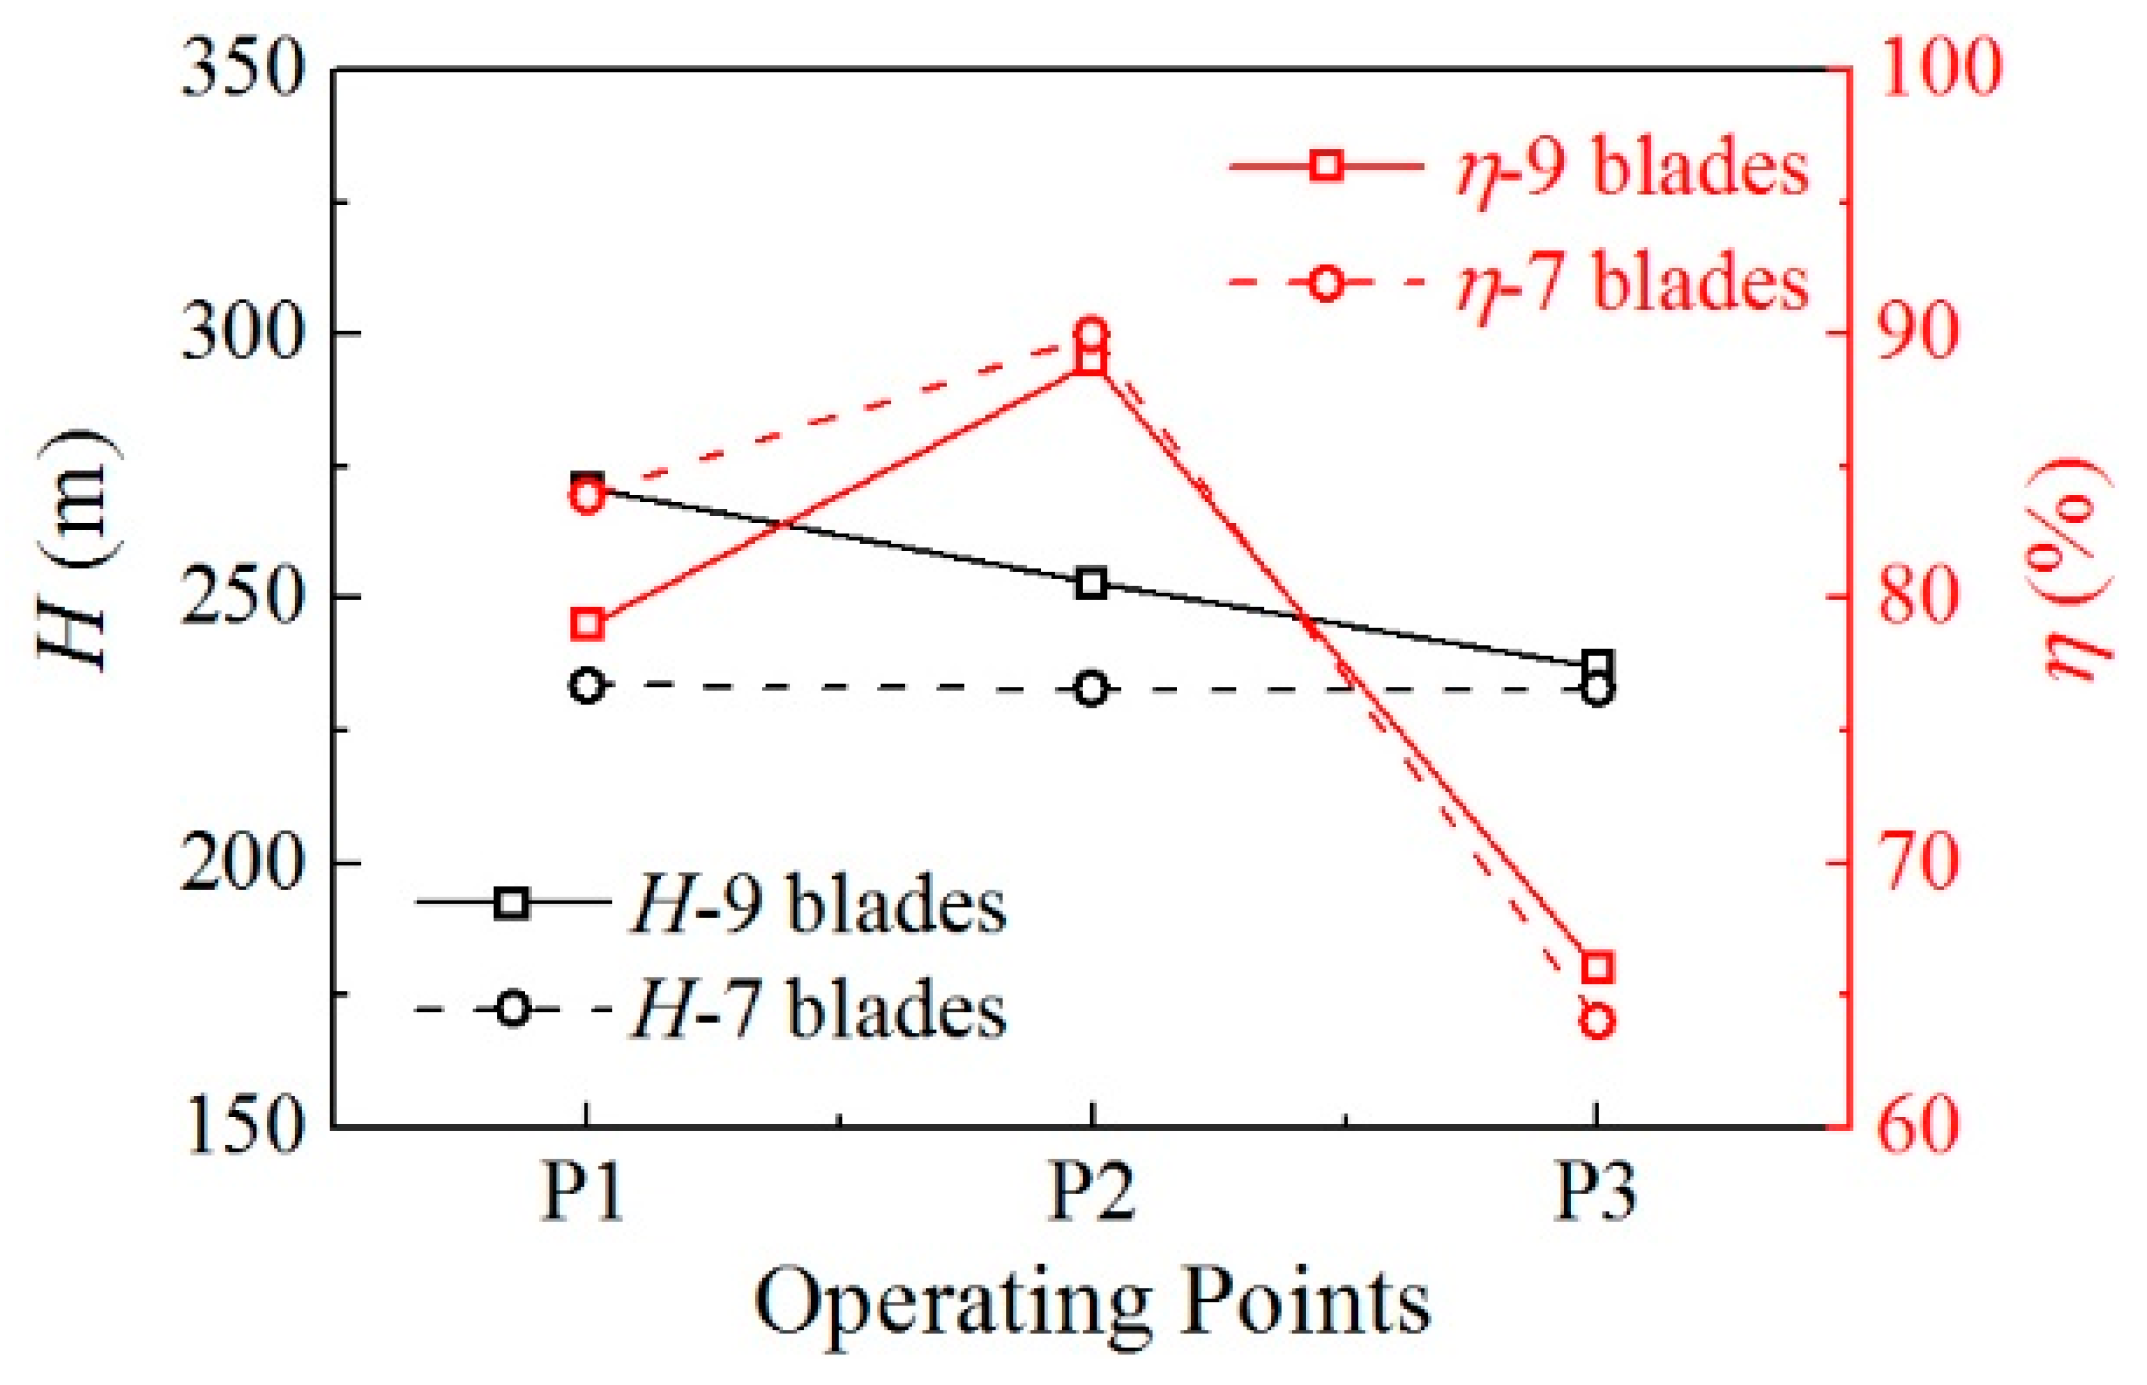
Figure 19.
Comparison of relative amplitude with 9 blades and 7 blades at P1, P2 and P3 operating points.
Figure 19.
Comparison of relative amplitude with 9 blades and 7 blades at P1, P2 and P3 operating points.
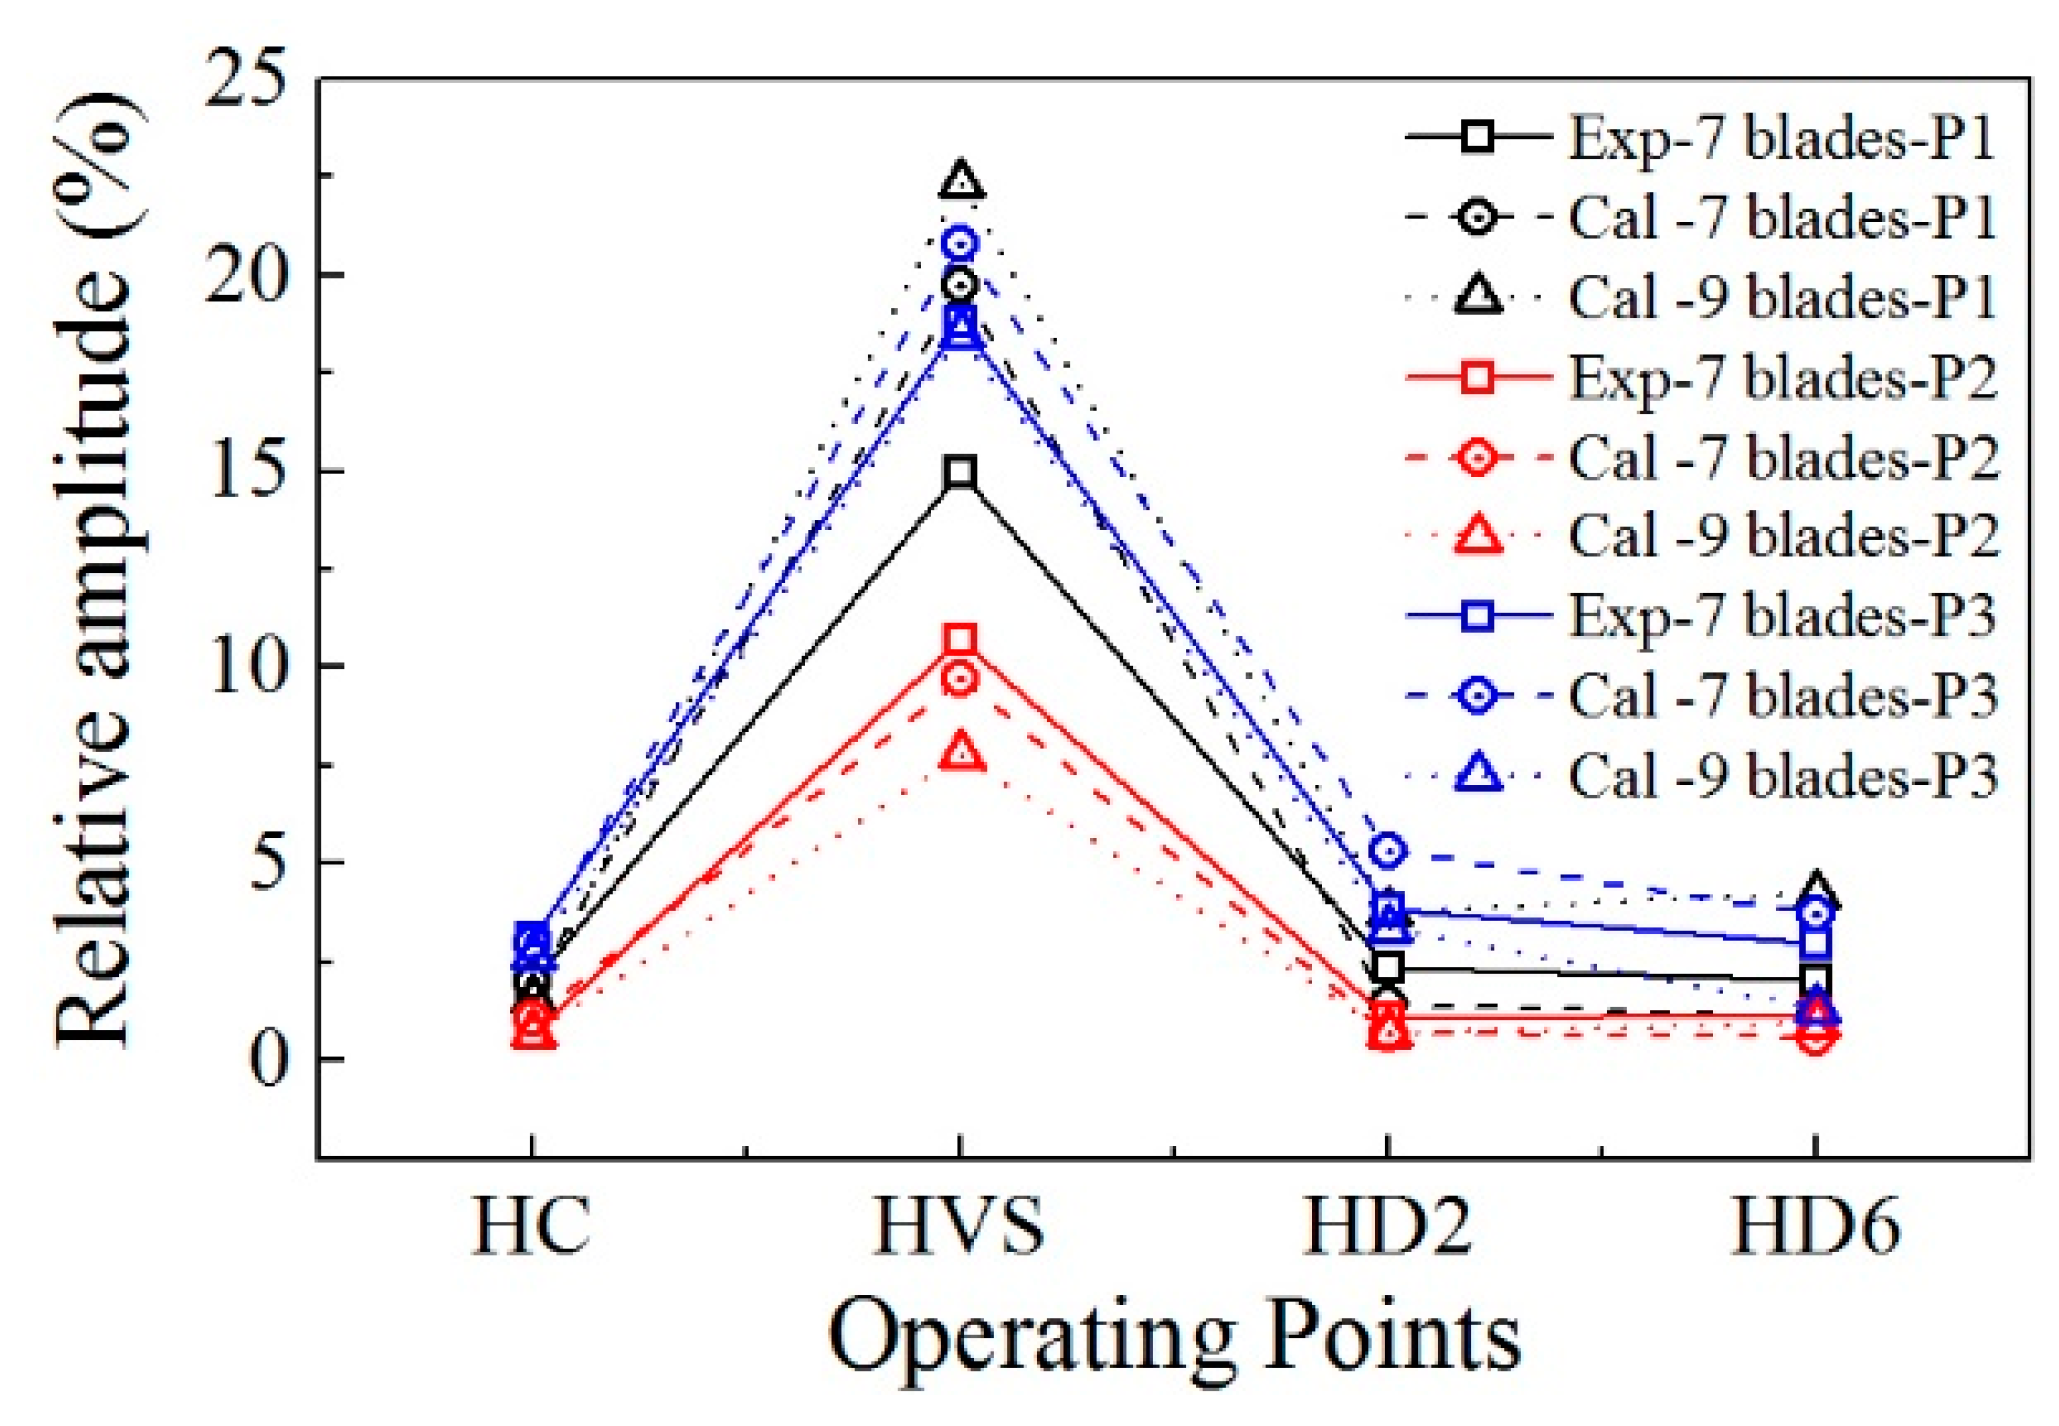
Figure 20.
Pressure fluctuation components of BPF at different circumferential locations at P1, P2 and P3 operating points with 9 impeller blades.
Figure 20.
Pressure fluctuation components of BPF at different circumferential locations at P1, P2 and P3 operating points with 9 impeller blades.

Figure 21.
Peak value positions at BPF.
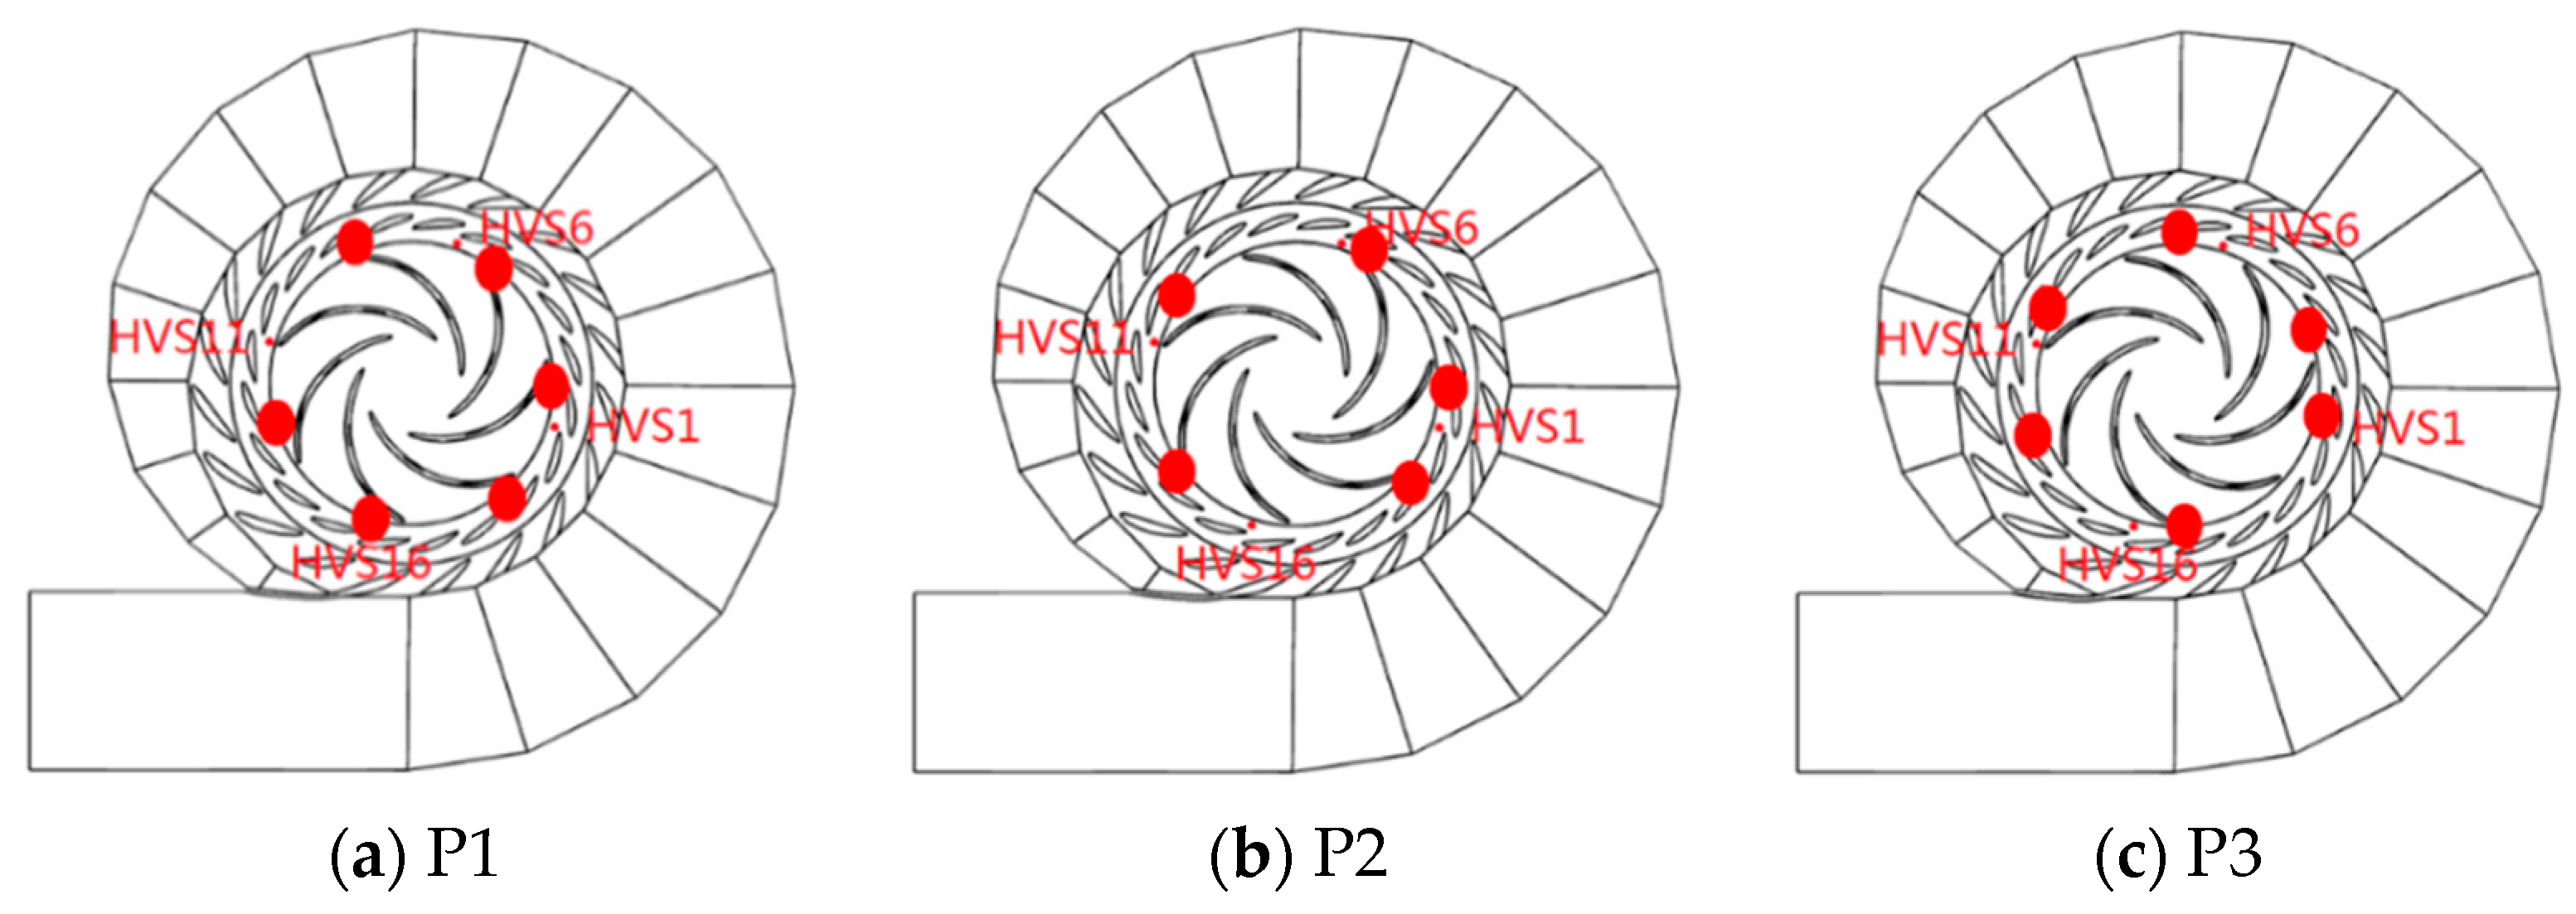
Figure 22.
The main frequencies of pressure fluctuations at spiral casing (7 blades and 9 blades).

Figure 23.
The main frequencies of pressure fluctuations at draft tube (7 blades and 9 blades).

Table 1.
Parameters of pump-turbine.
| Geometric parameters | D1 (m) | 4.8 |
| D2 (m) | 3.15 | |
| Z | 7 or 9 | |
| ZS | 20 | |
| ZG | 20 | |
| Operating parameters (turbine mode) | Hd (m) | 285 |
| Qd (m3/s) | 120 | |
| n (r/min) | 300 | |
| ns | 143 |
Table 2.
Studied operating points.
| No. | α (°) | H (m) | Q (m3/s) | P (MW) |
|---|---|---|---|---|
| P0 | 21 | 285 | 119.9 | 308.1 |
| P1 | 40 | 230 | 152.6 | 295.2 |
| P2 | 22 | 230 | 107.9 | 217.4 |
| P3 | 11 | 230 | 54.44 | 81.01 |
Table 3.
Mesh of different hydraulic parts.
| Type | Inlet | Spiral Casing | Guide Vanes | Runner | Draft Tube | Whole |
|---|---|---|---|---|---|---|
| Structural | Unstructured | Structural | Structural | Structural | ||
| Nodes | 288,347 | 1,737,211 | 1,676,610 | 5,533,416 | 1,646,592 | 10,882,196 |
| Elements | 298,480 | 7,833,653 | 1,798,270 | 5,741,808 | 1,578,539 | 17,250,750 |
Table 4.
Accuracy validation of relative amplitude of pressure fluctuations.
| HC | HVS | HD2 | |
|---|---|---|---|
| Cal. | 1.19% | 11.14% | 1.86% |
| Exp. | 1.01% | 11.37% | 1.68% |
Table 5.
Shift angle of peak value when the mass flow rate decreased.
| Position of Peak Value | Shift Angle | |
|---|---|---|
| P1 | HVS (5, 11, 15, 20) | 0 |
| P2 | HVS (7, 12, 16, 2) | 18–36° |
| P3 | HVS (9, 14, 19, 5) | 72–90° |
Table 6.
Shift angle of peak value when the mass flow rate decreased with 9 blades.
| Position of Peak Value | Shift Angle | |
|---|---|---|
| P1 | HVS (5, 8, 13, 16, 19, 2) | 0 |
| P2 | HVS (5, 10, 14, 20, 2) | NA |
| P3 | HVS (7, 10, 13, 17, 20, 3) | 18–36° |
© 2018 by the authors. Licensee MDPI, Basel, Switzerland. This article is an open access article distributed under the terms and conditions of the Creative Commons Attribution (CC BY) license (http://creativecommons.org/licenses/by/4.0/).
Share and Cite
MDPI and ACS Style
Li, D.; Sun, Y.; Zuo, Z.; Liu, S.; Wang, H.; Li, Z. Analysis of Pressure Fluctuations in a Prototype Pump-Turbine with Different Numbers of Runner Blades in Turbine Mode. Energies 2018, 11, 1474. https://doi.org/10.3390/en11061474
AMA Style
Li D, Sun Y, Zuo Z, Liu S, Wang H, Li Z. Analysis of Pressure Fluctuations in a Prototype Pump-Turbine with Different Numbers of Runner Blades in Turbine Mode. Energies. 2018; 11(6):1474. https://doi.org/10.3390/en11061474
Chicago/Turabian StyleLi, Deyou, Yuekun Sun, Zhigang Zuo, Shuhong Liu, Hongjie Wang, and Zhenggui Li. 2018. "Analysis of Pressure Fluctuations in a Prototype Pump-Turbine with Different Numbers of Runner Blades in Turbine Mode" Energies 11, no. 6: 1474. https://doi.org/10.3390/en11061474
Note that from the first issue of 2016, this journal uses article numbers instead of page numbers. See further details here.