3D Numerical Study of Multiphase Counter-Current Flow within a Packed Bed for Post Combustion Carbon Dioxide Capture


1
Key Laboratory of Coal-Based CO2 Capture and Geological Storage, China University of Mining and Technology, Xuzhou 221116, Jiangsu, China
2
School of Electrical and Power Engineering, China University of Mining and Technology, Xuzhou 221116, Jiangsu, China
3
Department of Mechanical Engineering, University of Kentucky, Lexington, KY 40506, USA
*
Authors to whom correspondence should be addressed.
Energies 2018, 11(6), 1441; https://doi.org/10.3390/en11061441
Submission received: 11 May 2018
/
Revised: 29 May 2018
/
Accepted: 1 June 2018
/
Published: 4 June 2018
(This article belongs to the Section I: Energy Fundamentals and Conversion)
Abstract
:The hydrodynamics within counter-current flow packed beds is of vital importance to provide insight into the design and operational parameters that may impact reactor and reaction efficiencies in processes used for post combustion CO2 capture. However, the multiphase counter-current flows in random packing used in these processes are complicated to visualize. Hence, this work aimed at developing a computational fluid dynamics (CFD) model to study more precisely the complex details of flow inside a packed bed. The simulation results clearly demonstrated the development of, and changes in, liquid distributions, wetted areas, and film thickness under various gas and liquid flow rates. An increase in values of the We number led to a more uniform liquid distribution, and the flow patterns changed from droplet flow to film flow and trickle flow as the We number was increased. In contrast, an increase in gas flow rate had no significant effect on the wetted areas and liquid holdup. It was also determined that the number of liquid inlets affected flow behavior, and the liquid surface tension had an insignificant influence on pressure drop or liquid holdup; however, lower surface tension provided a larger wetted area and a thinner film. An experimental study, performed to enable comparisons between experimentally measured pressure drops and simulation-determined pressure drops, showed close correspondence and similar trends between the experimental data and the simulation data; hence, it was concluded that the simulation model was validated and could reasonably predict flow dynamics within a counter-current flow packed bed.
1. Introduction
Global warming and climate change attract much attention worldwide, and a large amount of the anthropogenic CO2 emission is reported to be responsible for it [1]. Statistics have pointed to a 40% increase in atmospheric CO2 concentrations since preindustrial times, and this increase is primarily due to fossil fuel combustion [2]. Hence, if the deleterious effects of rising CO2 concentrations are to be averted, an imperative need exists to reduce the extent to which it is emitted into the atmosphere [3]. Currently, technologies are under development for capturing and sequestering CO2, with a primary focus on power generation; these include pre-combustion, post combustion, oxy-fuel combustion, and chemical looping combustion scenarios. Among them, post combustion capture removes CO2 from the flue gas, a stage when fuel has already been combusted.
Solvent-based CO2 absorption is one of the most promising approaches and is particularly suitable for post combustion processing [4]. A diagram of a post combustion CO2 capture, presented in Figure 1, includes two reactors that are, respectively, an absorber and a stripper. An aqueous solution, usually amine-based, is circulated between the two reactors to produce a flow of highly concentrated CO2 from the relatively low CO2 concentration in the flue gas. In the absorber, gas and liquid reactants flow counter-currently through a packed bed containing packing material consisting of hollow tubes, pipes, or other types of vessels. The packing greatly increases the contacting area between the fluids; this contact area is where reaction or mass transfer occurs [5]. Increasing the contact area is one important pathway recognized to enhance mass transfer and chemical reactions. Therefore, the use of a packed bed promotes reactor and reaction advantages such as high capacity, high efficiency and, if designed appropriately, low pressure drop.
The packing is usually stationary and contributes to complex interactions between the gas and liquid flows. These interactions can be manifested under different flow regimes and can cause distinct gas and liquid distributions in packed beds [6]. Hence, it is imperative to understand the hydrodynamic flow regimes, pressure drops, liquid holdups, wetted areas, liquid distributions, and the packing arrangement if optimized reactor and reaction performance are to be realized.
Gamma and X-ray tomography, magnetic resonance imaging, radioactive particle tracking, electrical capacitance tomography, and positron emission tomography have been used to investigate liquid distributions [7,8,9,10]. Li et al. [11] investigated two-phase flow in a packed bed experimentally, proposing a method to predict pressure drops of two-phase flow through packed beds with coarse particles. Ali Toukan et al. [12] studied flow regimes in a cocurrent, gas–liquid, upflow-moving packed bed reactor using gamma ray densitometry, and found the flow regime as bubbly and pulse flow. However, each of these experimental approaches had limitations in the spatial and temporal resolution that could be accomplished, and the results are especially difficult to scale when considering large reactors [13]. Experimental studies of packed bed reactors are also very time consuming and expensive, and it is very difficult, if not impossible, to accurately measure the very complex geometry of some packed bed materials, especially when limited space exists between the packing components. Furthermore, it is impractical to insert measuring devices into packed beds because their presence may disturb or alter liquid and gas flow patterns.
The ever-increasing computational power of computers and the development of computational fluid dynamics (CFD) have allowed promising applications of numerical simulations to the modeling of multiphase flow in packed bed reactors [14,15,16,17,18]. Hence, CFD simulations on spherical particle packing may help to study and understand complex fluid flow regimes and establish a reliable database for analyzing and interpreting the macroscopic phenomenon and results. As examples, Bednarz et al. [19] developed a 2D model for a multiphase counter-current loop reactor and demonstrated the flow characteristics in a packed bed; Zhao et al. [20] developed a 3D model to study counter-current multiphase flow, but the packing was simplified to porous media, different than the actual, existing forms of packing; Tong et al. [21] built a meso-scale 2D cocurrent, two-phase model, and described detailed flow patterns within corrugated structures. In general, a packed bed is not symmetrical; rather, it may have a complicated packing configuration for which the use of a 2D model is inappropriate.
The development and use of 3D models could create more usable data for the study of counter-current, multiphase flows in packed bed reactors; however, a very limited number of such 3D studies are available in the open literature. Therefore, the objective of this work was to develop a comprehensive 3D CFD model to study gas–liquid, counter-current multiphase flows at a microscopic level, and to elaborate on film formation, flow distributions, pressure drops, liquid holdups, wetted areas, and the interactions between phases. The 3D modeling focused on the relationships between the characteristics of the liquid film in a packed bed and the concomitant capturing efficiency of gaseous CO2. To validate this model, experimental data were also acquired following the technique recommended by Saito and Williams [22] and practiced by Liu et al. [23].
2. Experimental Methods
A schematic of the experimental setup is shown in Figure 2. The height of packed volume was 550 mm and plastic spheres with a diameter of 9.5 mm were uniformly packed in the bed. The void fraction of the packed volume was 0.4. The CO2 flow rate was controlled by a mass-flow controller (MFC) (Aalborg, Orangeburg, NY, USA), and the water flow rate was controlled by a peristaltic pump (Longer, Boonton, NJ, USA). The CO2 entered the column from its bottom and was contacted counter-currently with the water which entered from the top. The pressure drop along the packing bed was measured by the inclined manometer. A Labview system was applied for flow rate adjustment and data recording.
3. Development of the Numerical Model
3.1. Mesh Generation
As depicted in Figure 3, the packed bed was modeled as a rectangular container filled with spherical balls having the same size and void fraction as used in the experimentation. The size of the rectangle domain was 19.2 × 19.2 × 52 mm, with a 0.1 mm gap between each nearby sphere to facilitate meshing on the sphere surfaces. A total of six layers of spheres were constructed along the packed bed domain. The first layer included four spheres, and the second layer had one whole-sphere in the center with four half-spheres on the sides and four ¼ spheres at the four corners of the layer. The remaining layers were arranged following this same sequence and created an arrangement having the same 0.4 void fraction over the six layers as in the experimental tests. Liquid entered from the top of the domain and flowed down from the bottom; gas entered from the bottom and flowed out from the top.
3.2. Governing Equation in the VOF Model
Commercial CFD software ANSYS FLUENT (V12.1, ANSYS, Canonsburg, PA, USA) was used for this study. A phasic volume of fraction (VOF) multiphase model was applied to track the interface between the gas and liquid to capture the effect of surface tension on the flow behavior of two immiscible phases in mini-channels. The mass transfer terms between the two immiscible phases were neglected.
The VOF model solves the single momentum equation through the domain and the volume of each phase is tracked in grid cell. The governing equations of two phase flow are expressed as follows:
Continuity equation
Momentum equation
where , is the drag force.
Each phase’s volume fraction is where:
For a two-phase system:
where ranges from 0 to 1; a zero corresponds to a cell filled with gas phase and a value of one corresponds to a cell filled with the liquid phase. Intermediate values correspond to interfaces between phases. Also, the drag force term in Equation (2) considered only surface tension and gravity effects.
The surface tension model can be expressed by:
where k is the free surface curvature, which is defined as
The symbol is a unit normal vector, and n = .
3.3. Turbulence Model
In fluid dynamics, turbulent flow is characterized by chaotic property changes. These changes include low momentum diffusion, high momentum convection, and rapid variation of pressure and flow velocity in space and time. Multiphase flows in packed beds are often characterized as laminar flow but several studies have reported them to be turbulent [24]. A Dybbs et al. [25] used laser anemometry and flow visualization technology to investigate liquid flow regimes in hexagonal packing of spheres and rods, and classified four flow regimes for different ranges of Reynolds number. For 1 < Re, the flow was dominated by viscous force; for 1 < Re < 150, the flow was a steady laminar inertial flow; for 150 ≤ Re ≤ 300, the laminar inertial flow was unsteady; and, for Re > 300, the flow was highly unsteady, chaotic, and qualitatively resembled turbulent flow.
The Reynolds number has been calculated as:
where the characteristic length d is the thickness of the phase inlet, is the density of the fluid (kg/m3), is its velocity (m/s), and is the viscosity (kg/m/s).
Therefore, since the Reynolds numbers for both liquid and gas phases (min: 180, max: 1100) are within the range of turbulent flow, a turbulence model was applied. For turbulent flow, several different models have been developed, such as large eddy simulation (LES), k-ε model, and k-omega. The k-ε model is only valid for fully turbulent and nonseparated flows. The k-omega model is a two-transport-equation model solving for kinetic energy, k, and turbulent frequency, ω; it allows for more accuracy near walls and for a low Reynolds numbers (ANSYS help). The LES model is also popular for turbulent flow simulation, and it emphasizes the interactions between phases. Labourasse [26] successfully applied the LES model to resolve two-phase flow problems and accounted for the complex interactions between turbulence and interfaces. Vincent [27] also applied the LES model for phase separation, and Christensen [28] adopted a standard LES model coupled with a VOF free surface approach in a wave break simulation study. Therefore, the LES turbulent model will be used in the simulation of the plastic sphere, packed bed.
3.4. Model Parameters and Boundary Conditions
The rectangular domain was part of a packed bed; the side wall boundary was set as the symmetric wall because the cuboid domain represented only part of the total packed bed that was used experimentally. The contact angle at the wall was calculated and therefore set at 70°. One liquid inlet was placed at the top and one liquid outlet was placed at the bottom; each had a diameter of 7.2 mm. Because of counter-flow, gas entered the bottom hole around which liquid flowed outward and then gas exited the top outlet around which liquid entered. Side wall boundaries were set as symmetric boundaries instead of solid wall boundaries. The fluids were assumed to be Newtonian, isothermal, and incompressible. The boundary conditions are listed in Table 1.
The Geo-reconstruct algorithm method was used for interface reconstruction of the volume fraction, a simple scheme for which was the pressure-velocity coupling. For spatial discretization, the Least Squares Cell Based was used for the gradient in the spatial discretization set up, the Presto method was used for pressure, the Second Order Upwind method was used for the momentum equation, and the First Order Implicit method was used for the transient formulation. The simulation used a transient state to observe the growth of the liquid film and the development of gas–liquid interactions. The time step size for this model was 0.00005 s while solving a maximum 30 iterations per time step.
4. Results and Discussions
4.1. Model Validation
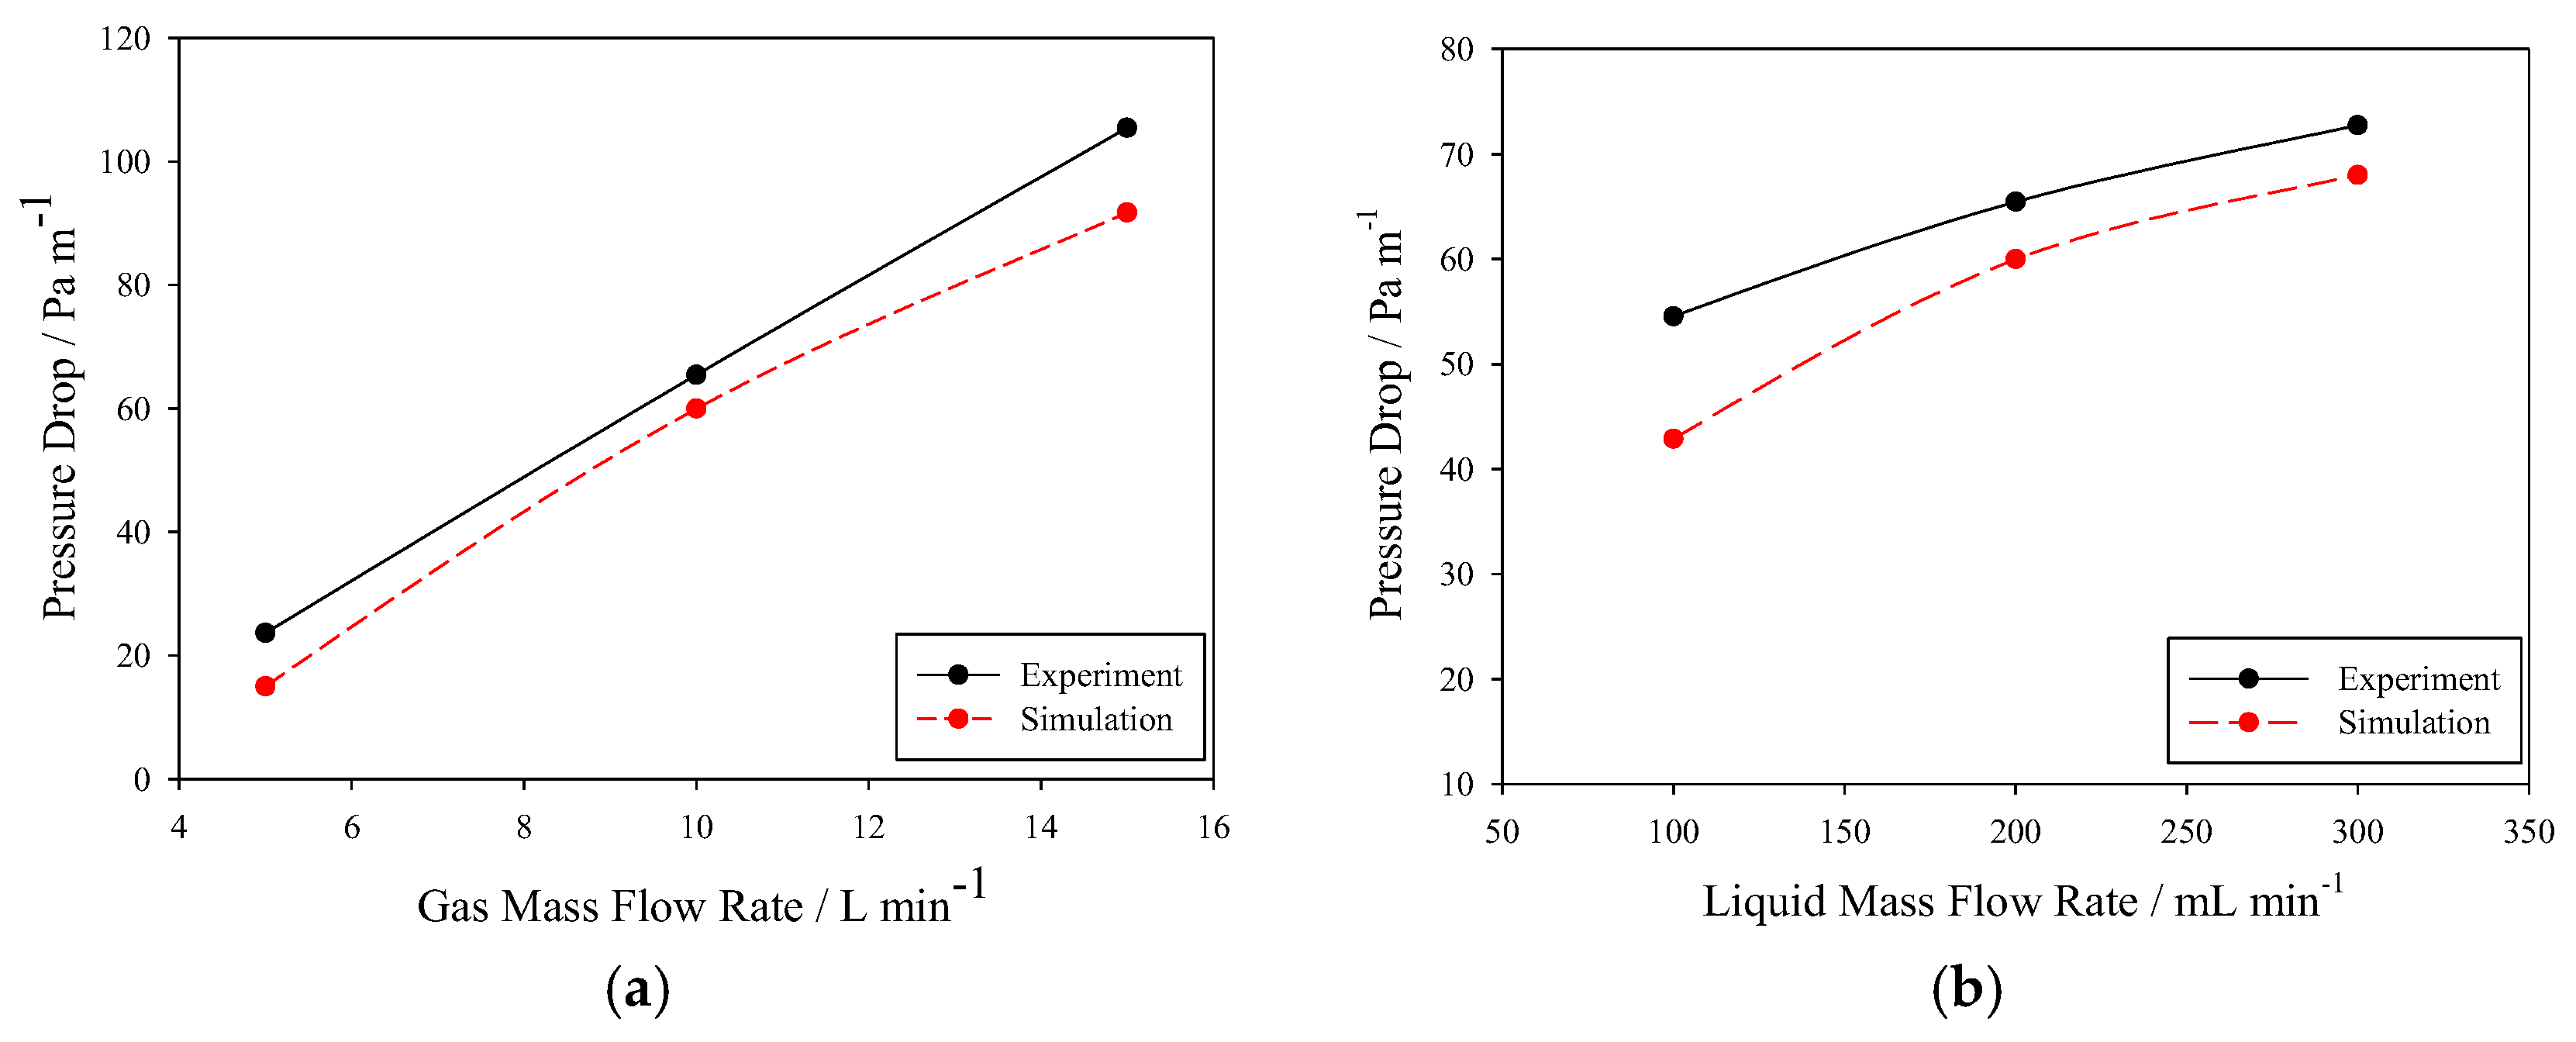
The results of CFD assessments of gas–liquid flows are generally validated by comparing pressure drops obtained from modeling and experimentation. Experiments were conducted in which both gas and liquid flow rates were changed, as listed in Table 2. In the 1st group of tests, liquid flow rates were held constant at 200 mL/min while gas flow rates were varied. In the 2nd group of tests, gas flow rates remained constant at 10 L/min and the liquid flow rates were varied. Pressure drops, measured at each experimental condition, are also displayed in Table 2; they increased with the increment of either liquid or gas flow rates, but were more sensitive to gas flow rate variations than to liquid flow variations.
Pressure drops were also obtained during the CFD simulations using the conditions listed in Table 1. A comparison of pressure drops obtained from the simulations and experimental measurements are shown in Figure 4. In general, the trends in pressure drops from CFD and the experiments mirrored each other; their differences were less than 30%. These comparisons established a validation of the 3D CFD model for use in modeling a packed bed reactor during gas–liquid, counter current flow operation.
4.2. Liquid Distribution Characterization
The evolution of liquid distributions within the reactor as a function of liquid flow rates was also studied. However, Weber numbers (We), which are a measure of the relative importance of a fluid’s inertia compared to its surface tension, were used as the variable of interest rather than the liquid or gas flow rates. The We values are expressed as:
where is the density of the fluid (kg/m3), v is the fluid velocity (m/s), l is its characteristic length, and σ is the surface tension (N/m) of the liquid (N/m). It is generally accepted that We values are valuable for analyzing multiphase fluid flows in which an interface exists between the fluids and especially when strongly curved surfaces are present [24].
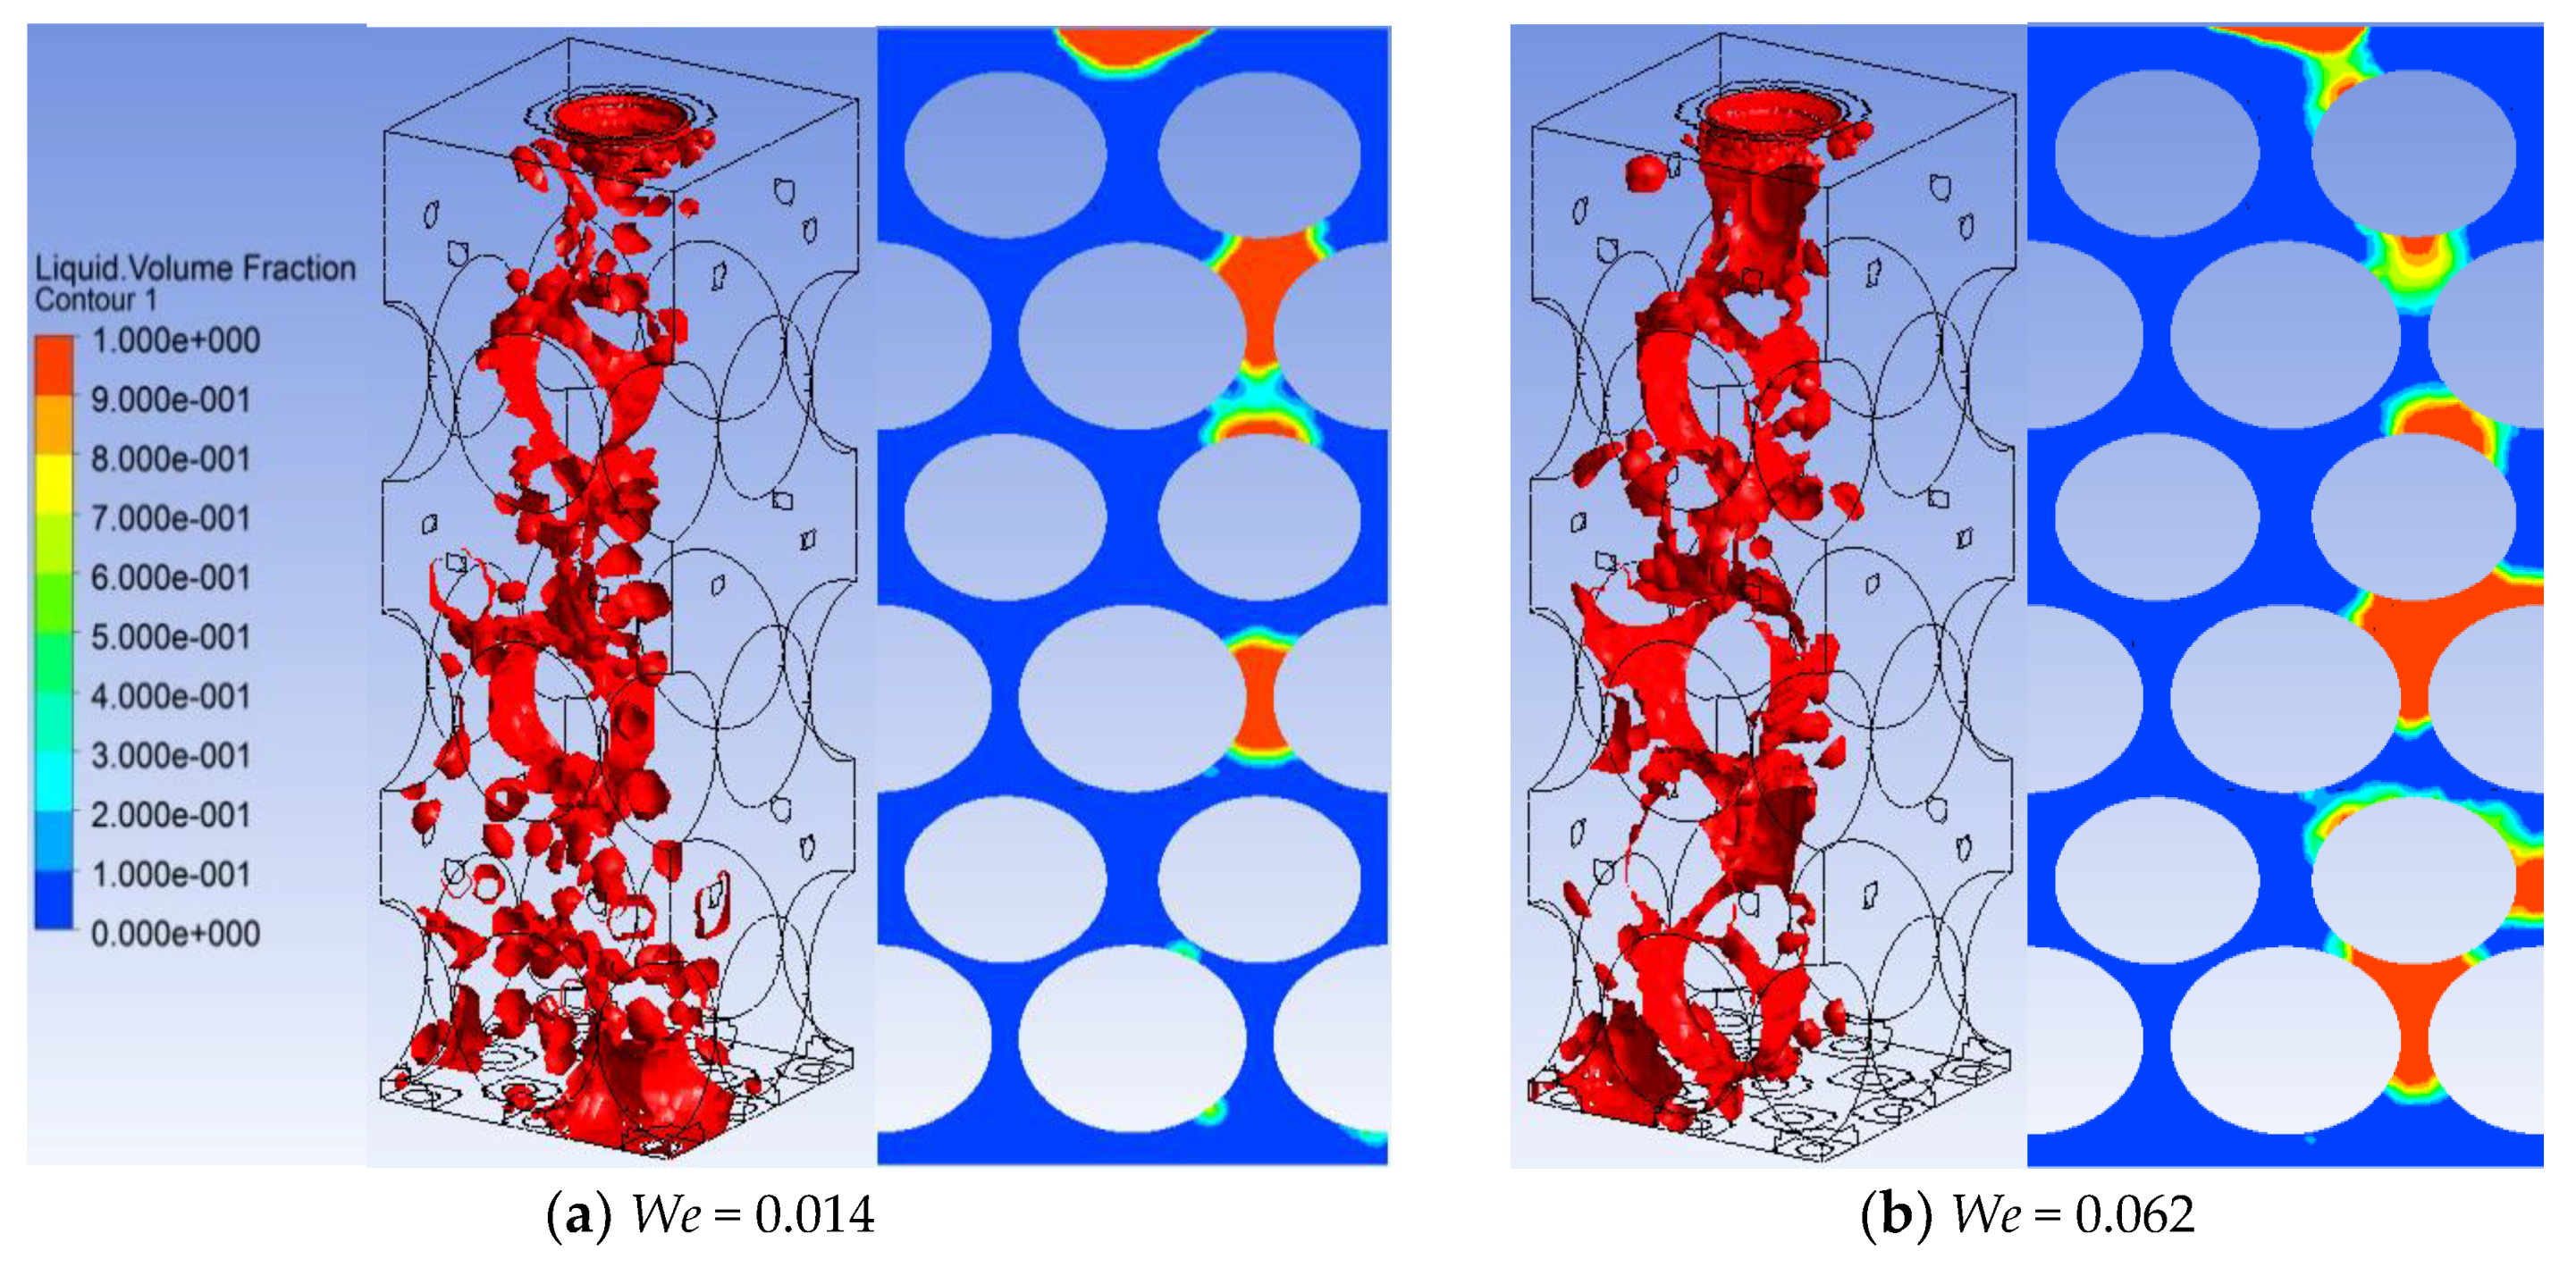
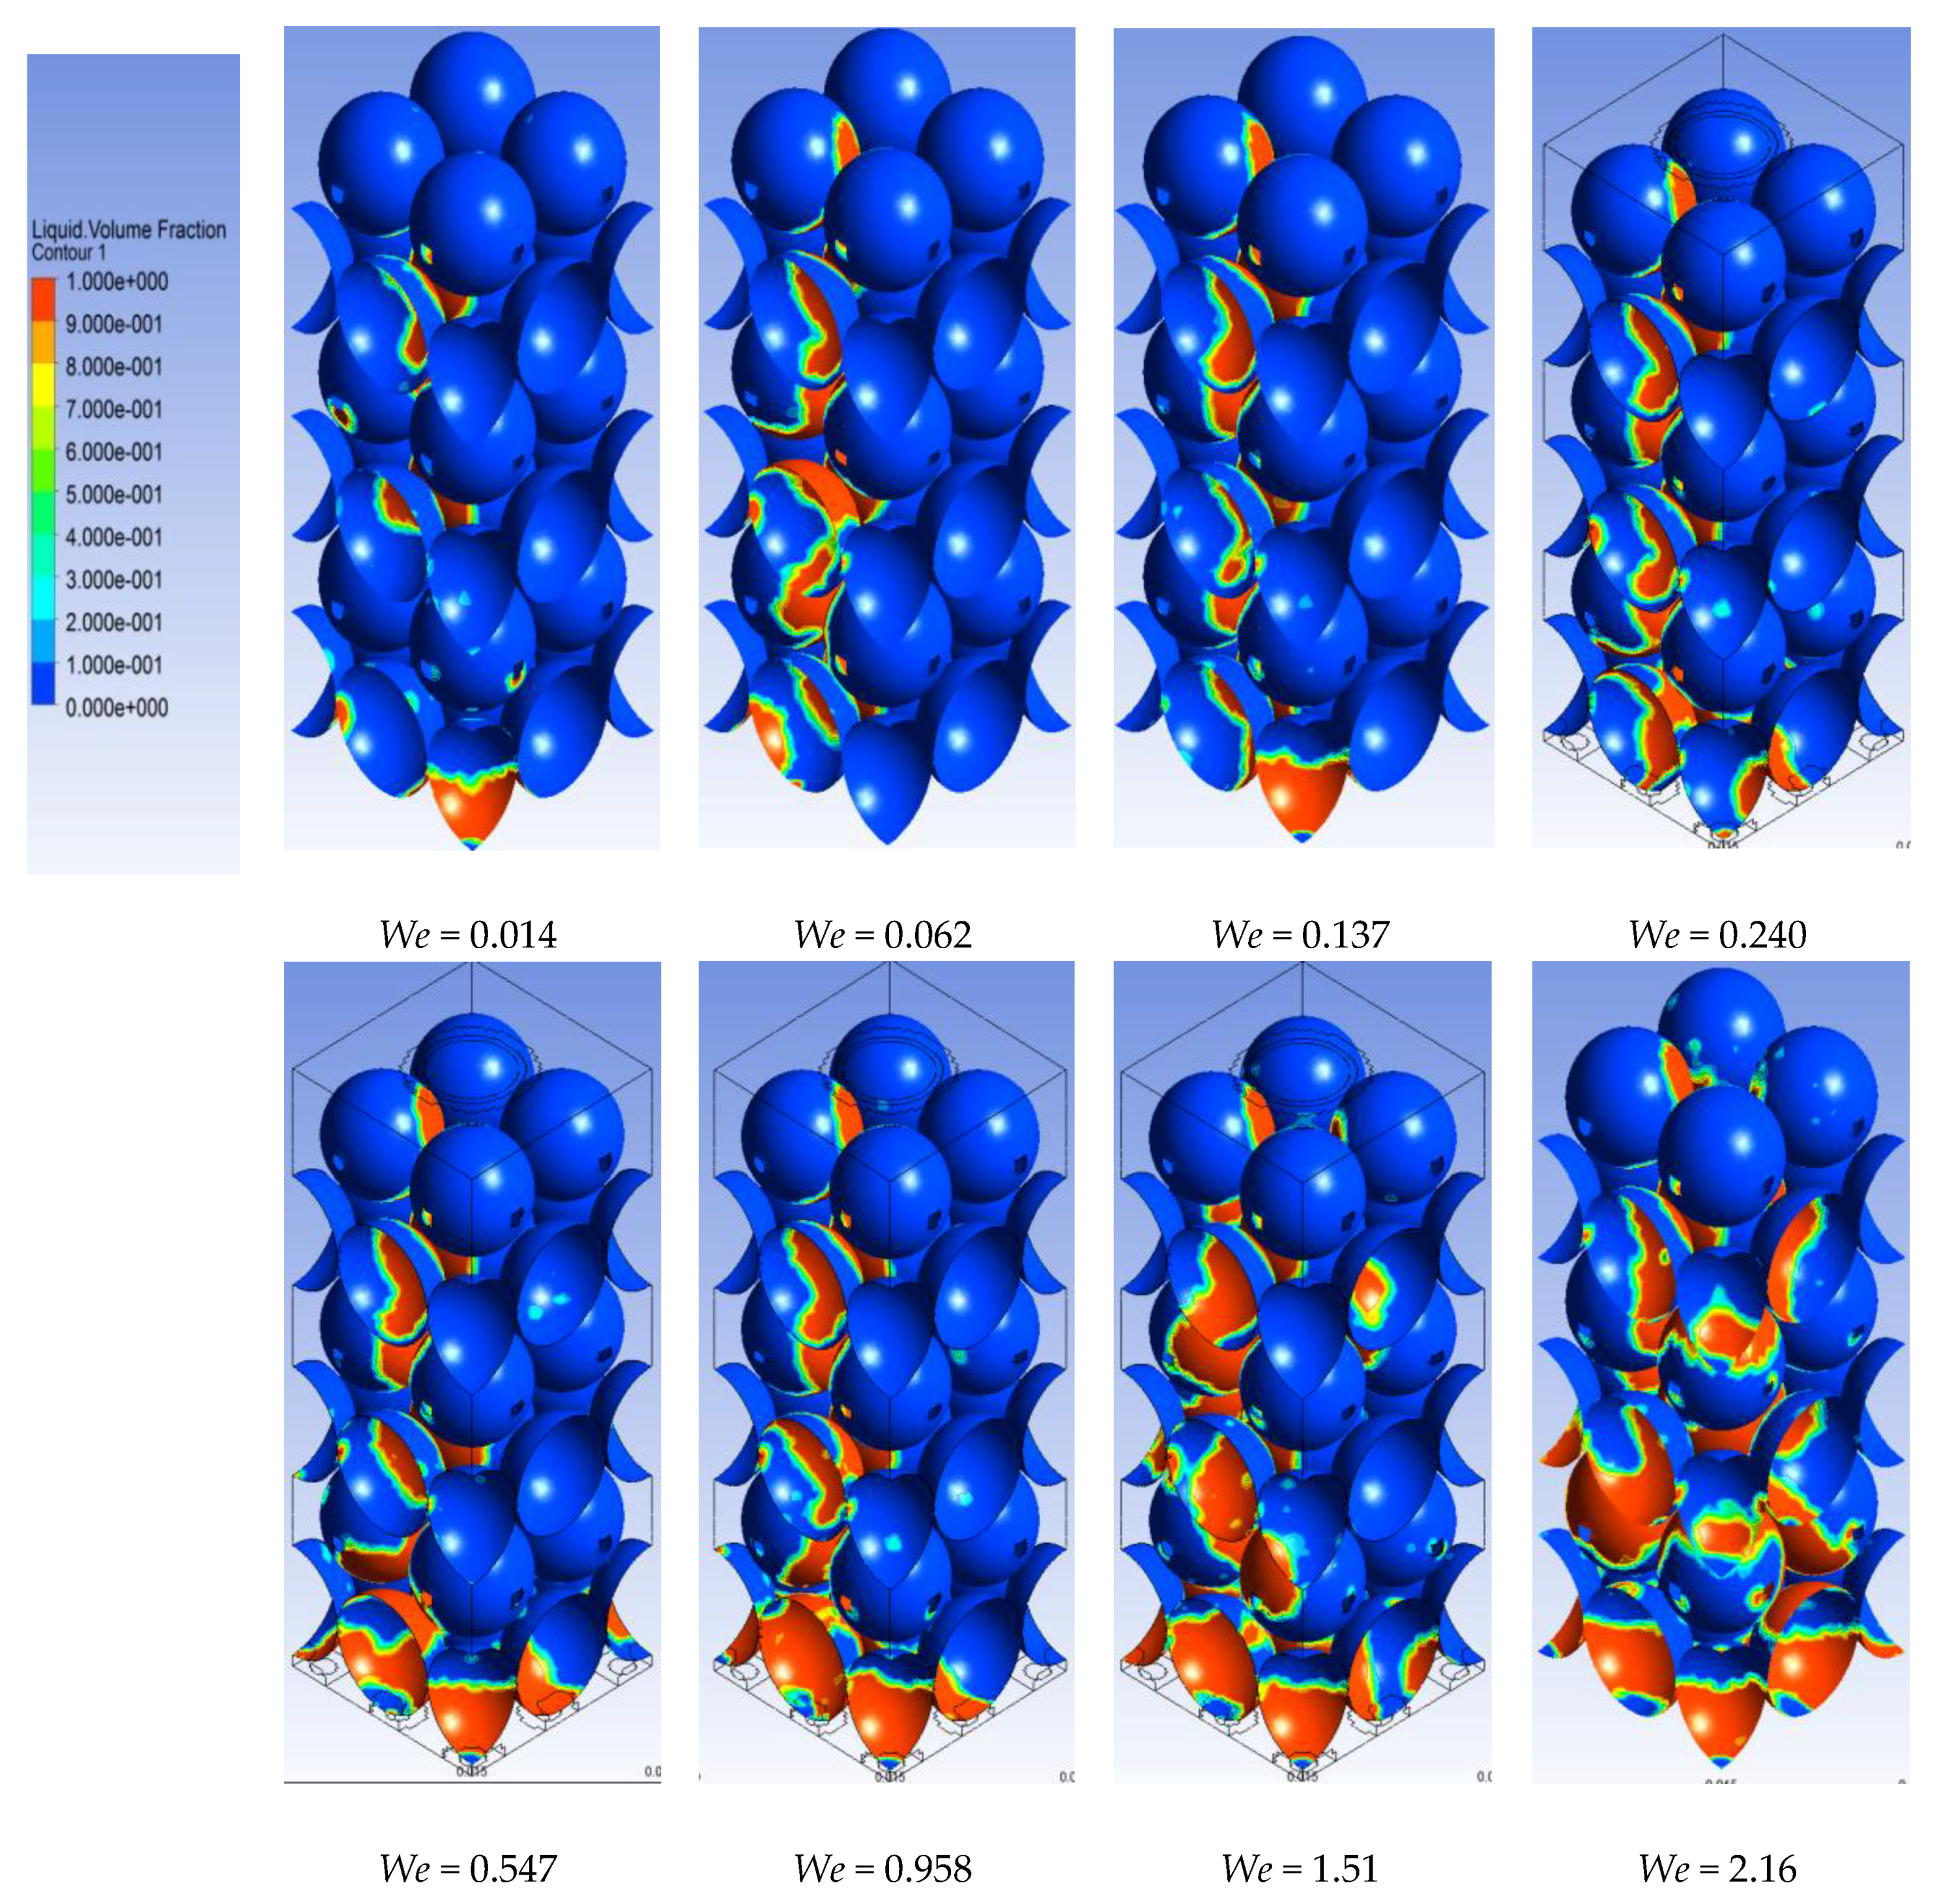
Figure 5 and Figure 6 display the simulation results for flow distributions and wetted surface areas, respectively, at a fixed gas flow rate where Reynolds number Reg = 199, and different liquid flow rates as represented by We; each figure represents the steady state condition. Figure 7 displays the VOF of the gas and liquid in which a red color represents 100 vol. % liquid and blue represents 100 vol. % gas.
The liquid distributions became mostly uniform after the first layer of the packing material, indicating that almost fully-developed flow was established rapidly within the bed; also, more liquid was distributed throughout the bed at higher We values. As examples, only a quarter of the domain was filled with liquid when We was 0.014, whereas, the whole domain was completely filled with liquid when We was 2.16. The We value also had an impact on flow patterns and the development of droplets or film flow. At We = 0.014, liquid flow was not continuous and contained droplets; at such a low We number, the liquid surface tension was considered a dominant influence on flow, which may result in the formation of droplets. After We was increased to 0.547, droplet flow was greatly weakened and most of the flow was connected, as shown in Figure 5e, indicating a pattern expected for film flow. Although surface tension may still dominate at higher We, the formation of film flow beneficially increased the amount of interfacial wetted area, as shown in Figure 6e. With further increases of We to 1.51, trickle flow gradually engulfed the whole domain and the wetted domain continued to increase.
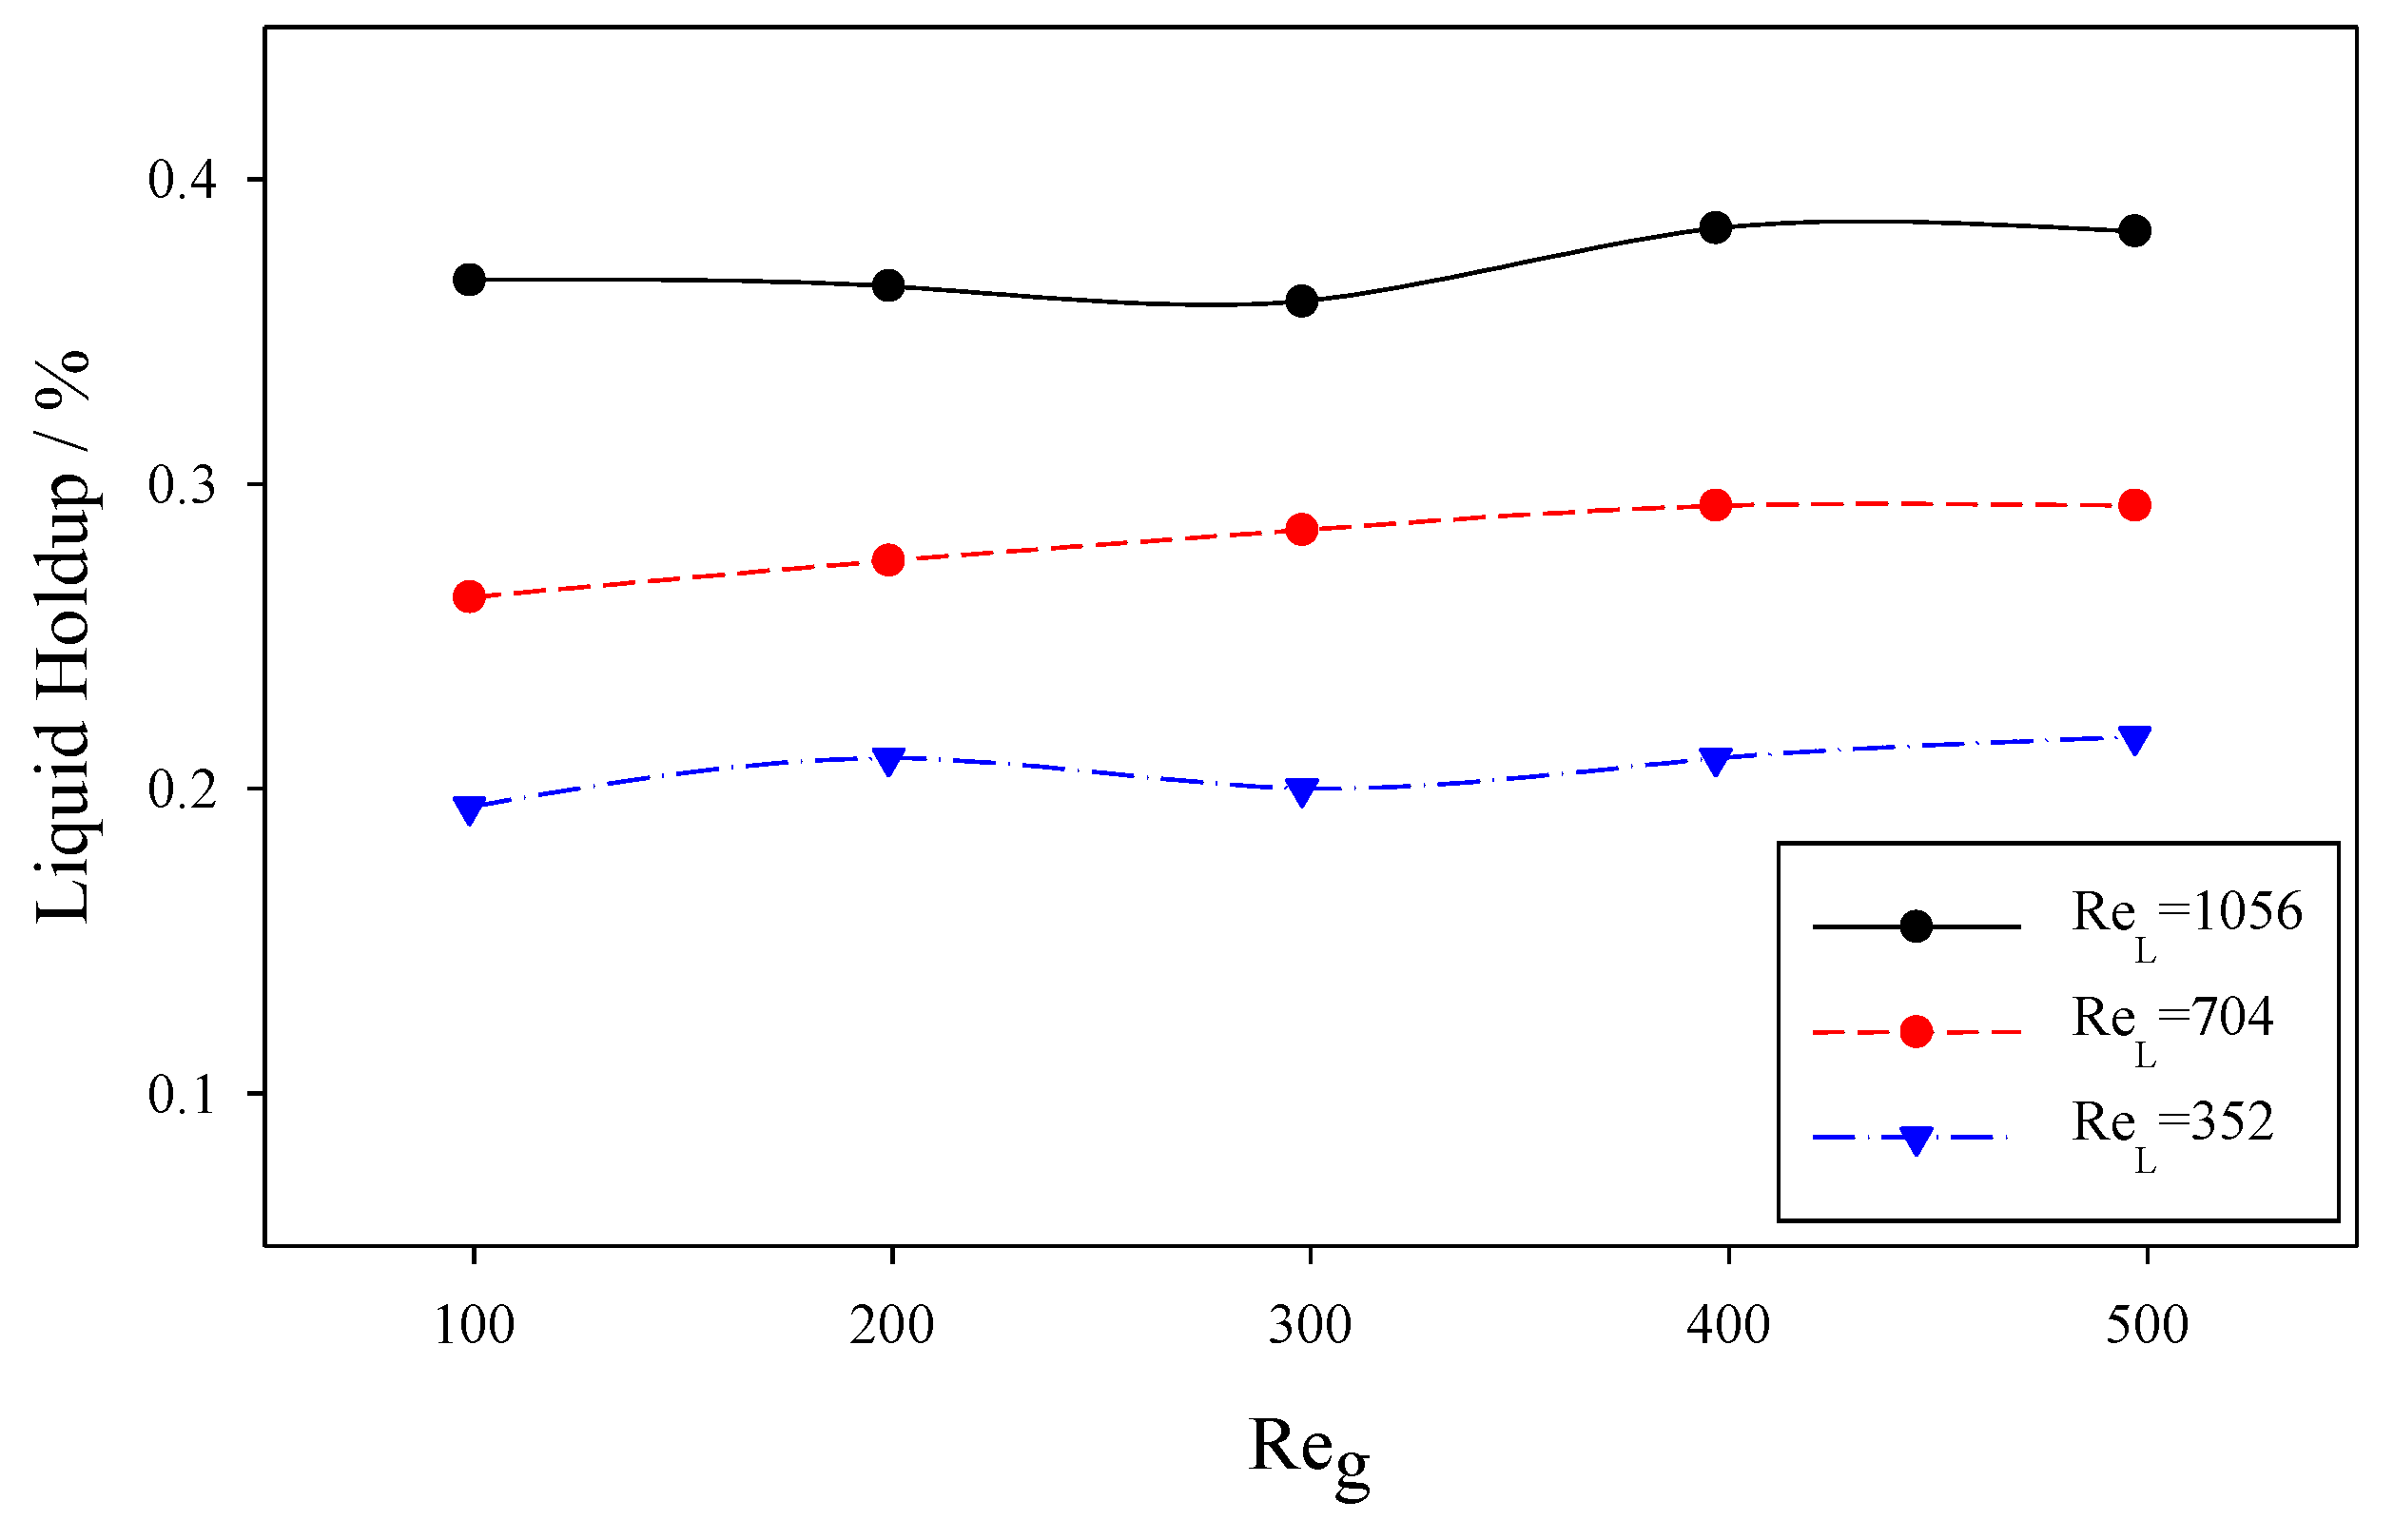
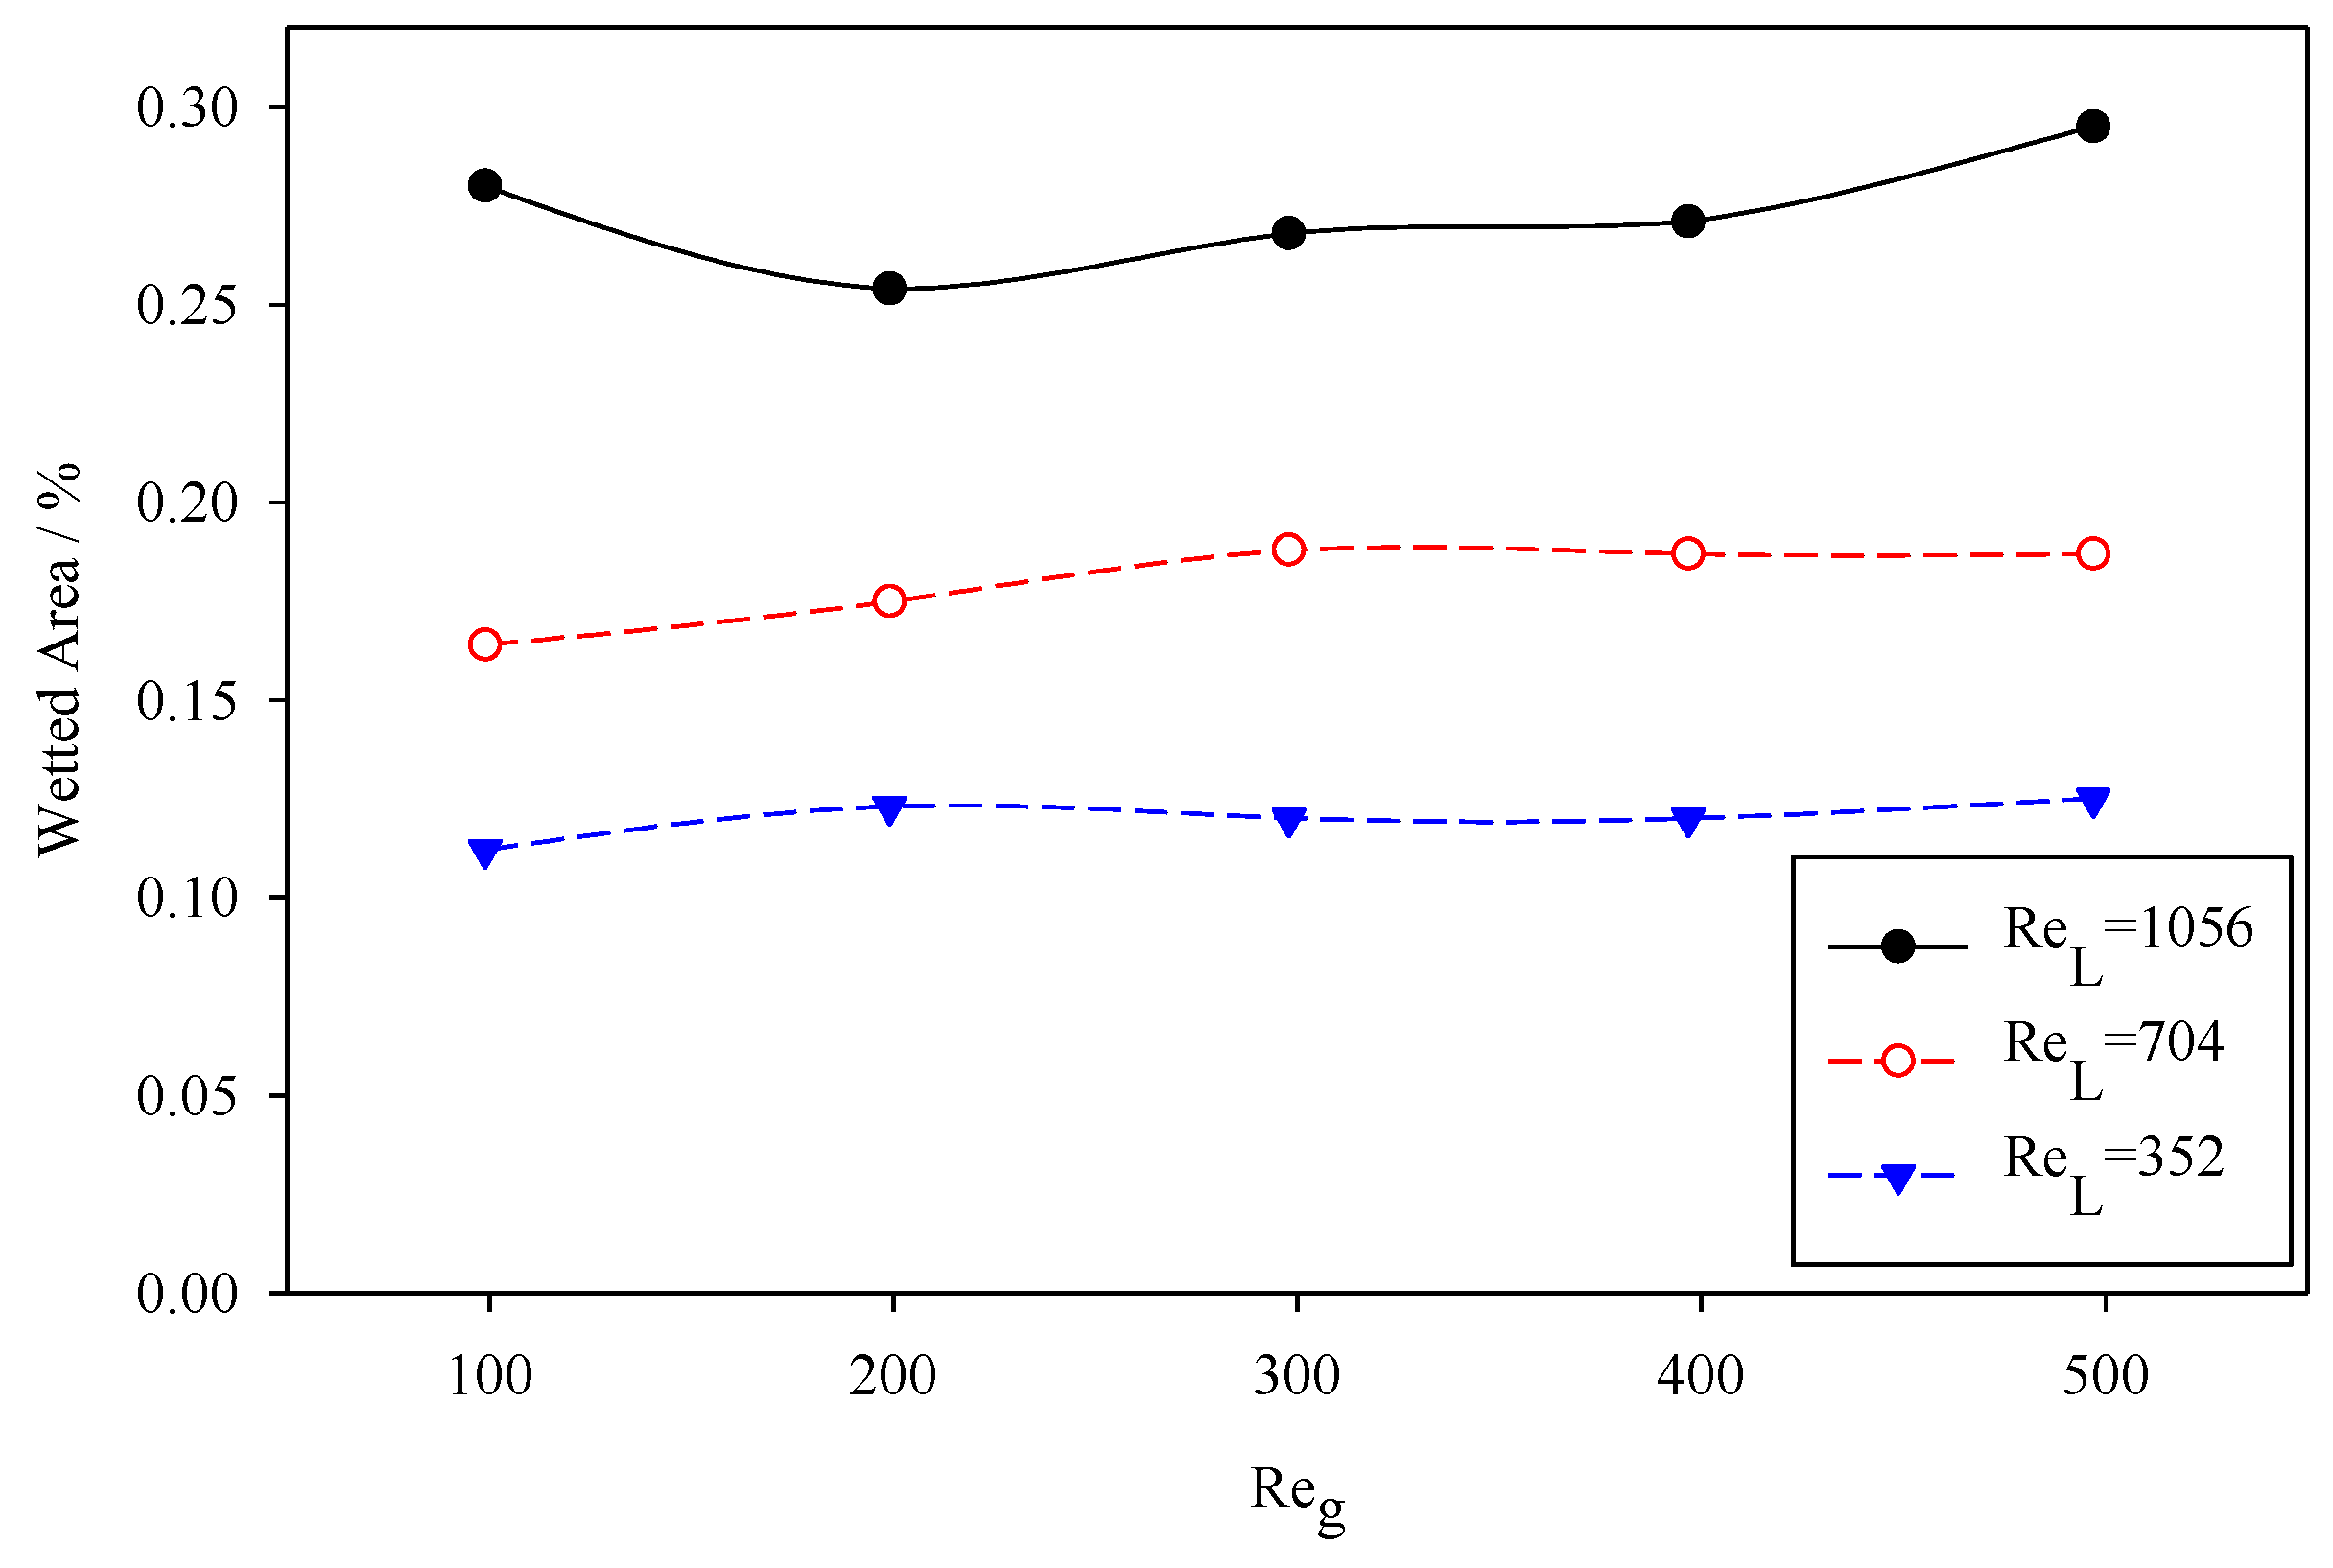
The wetted interfacial areas and liquid holdups were also modeled, and are presented in Figure 7 and Figure 8, respectively, as a function of the Reynolds number, Re. At fixed gas flow rates, the wetted areas and liquid holdups increased with an increase in Re. However, an increase in the gas flow rate had no significant effect on the wetted areas and liquid holdups. These outcomes are distinct from the results of cocurrent flow modeling analyses in which both wetted areas and liquid holdups decreased with increased gas flow rates [29].
4.3. Gas–Liquid Interactions
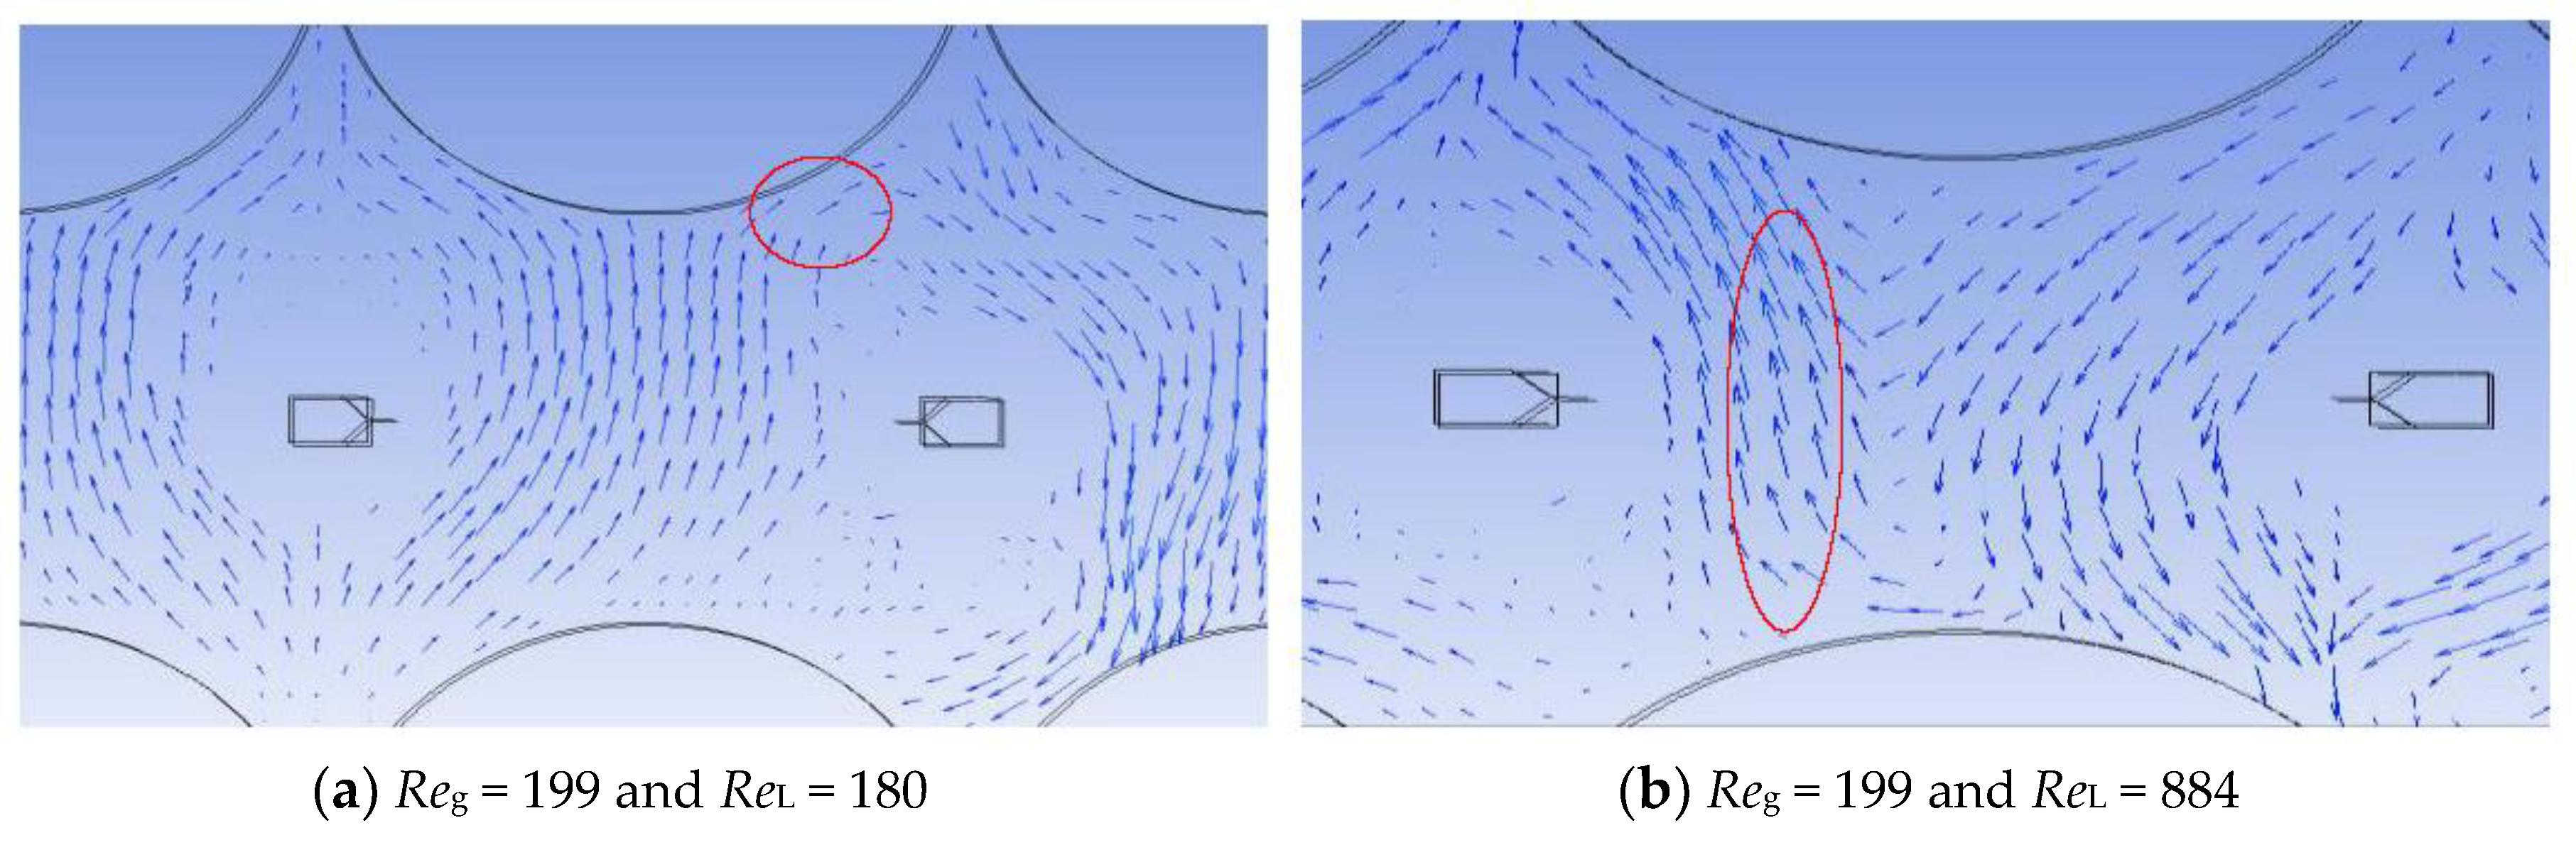
Because of limited free space within a packed bed, the gas and liquid are in a competitive relation with respect to flow; hence, a significant impact on fluid distributions may be expected as Re is varied. Figure 9 shows the gas and liquid velocity vectors in the packed bed when Reg = 199, and ReL was varied between 180 and 884; upward vectors depict gas velocities and downward vectors depict liquid velocities. At ReL = 180, gas phase flow dominated the flow region and the interactions between the gas and liquid occurred mainly on the top and bottom of the spherical balls. The gas flow velocity also displayed a shearing effect on the liquid that was expected to lead to the formation of droplets. When ReL was increased to 884, as indicated in Figure 9b, the region near the middle section of the balls was filled with both liquid and gas, with the liquid flowing along the ball surfaces; this condition led to a significant increase in the wetted area. These effects are considered important during interactions between the gas and liquid on the packing surfaces because increased interactions will enhance the chemical adsorption of CO2 within a packed bed reactor.
4.4. Effect of the Number of Liquid Inlets
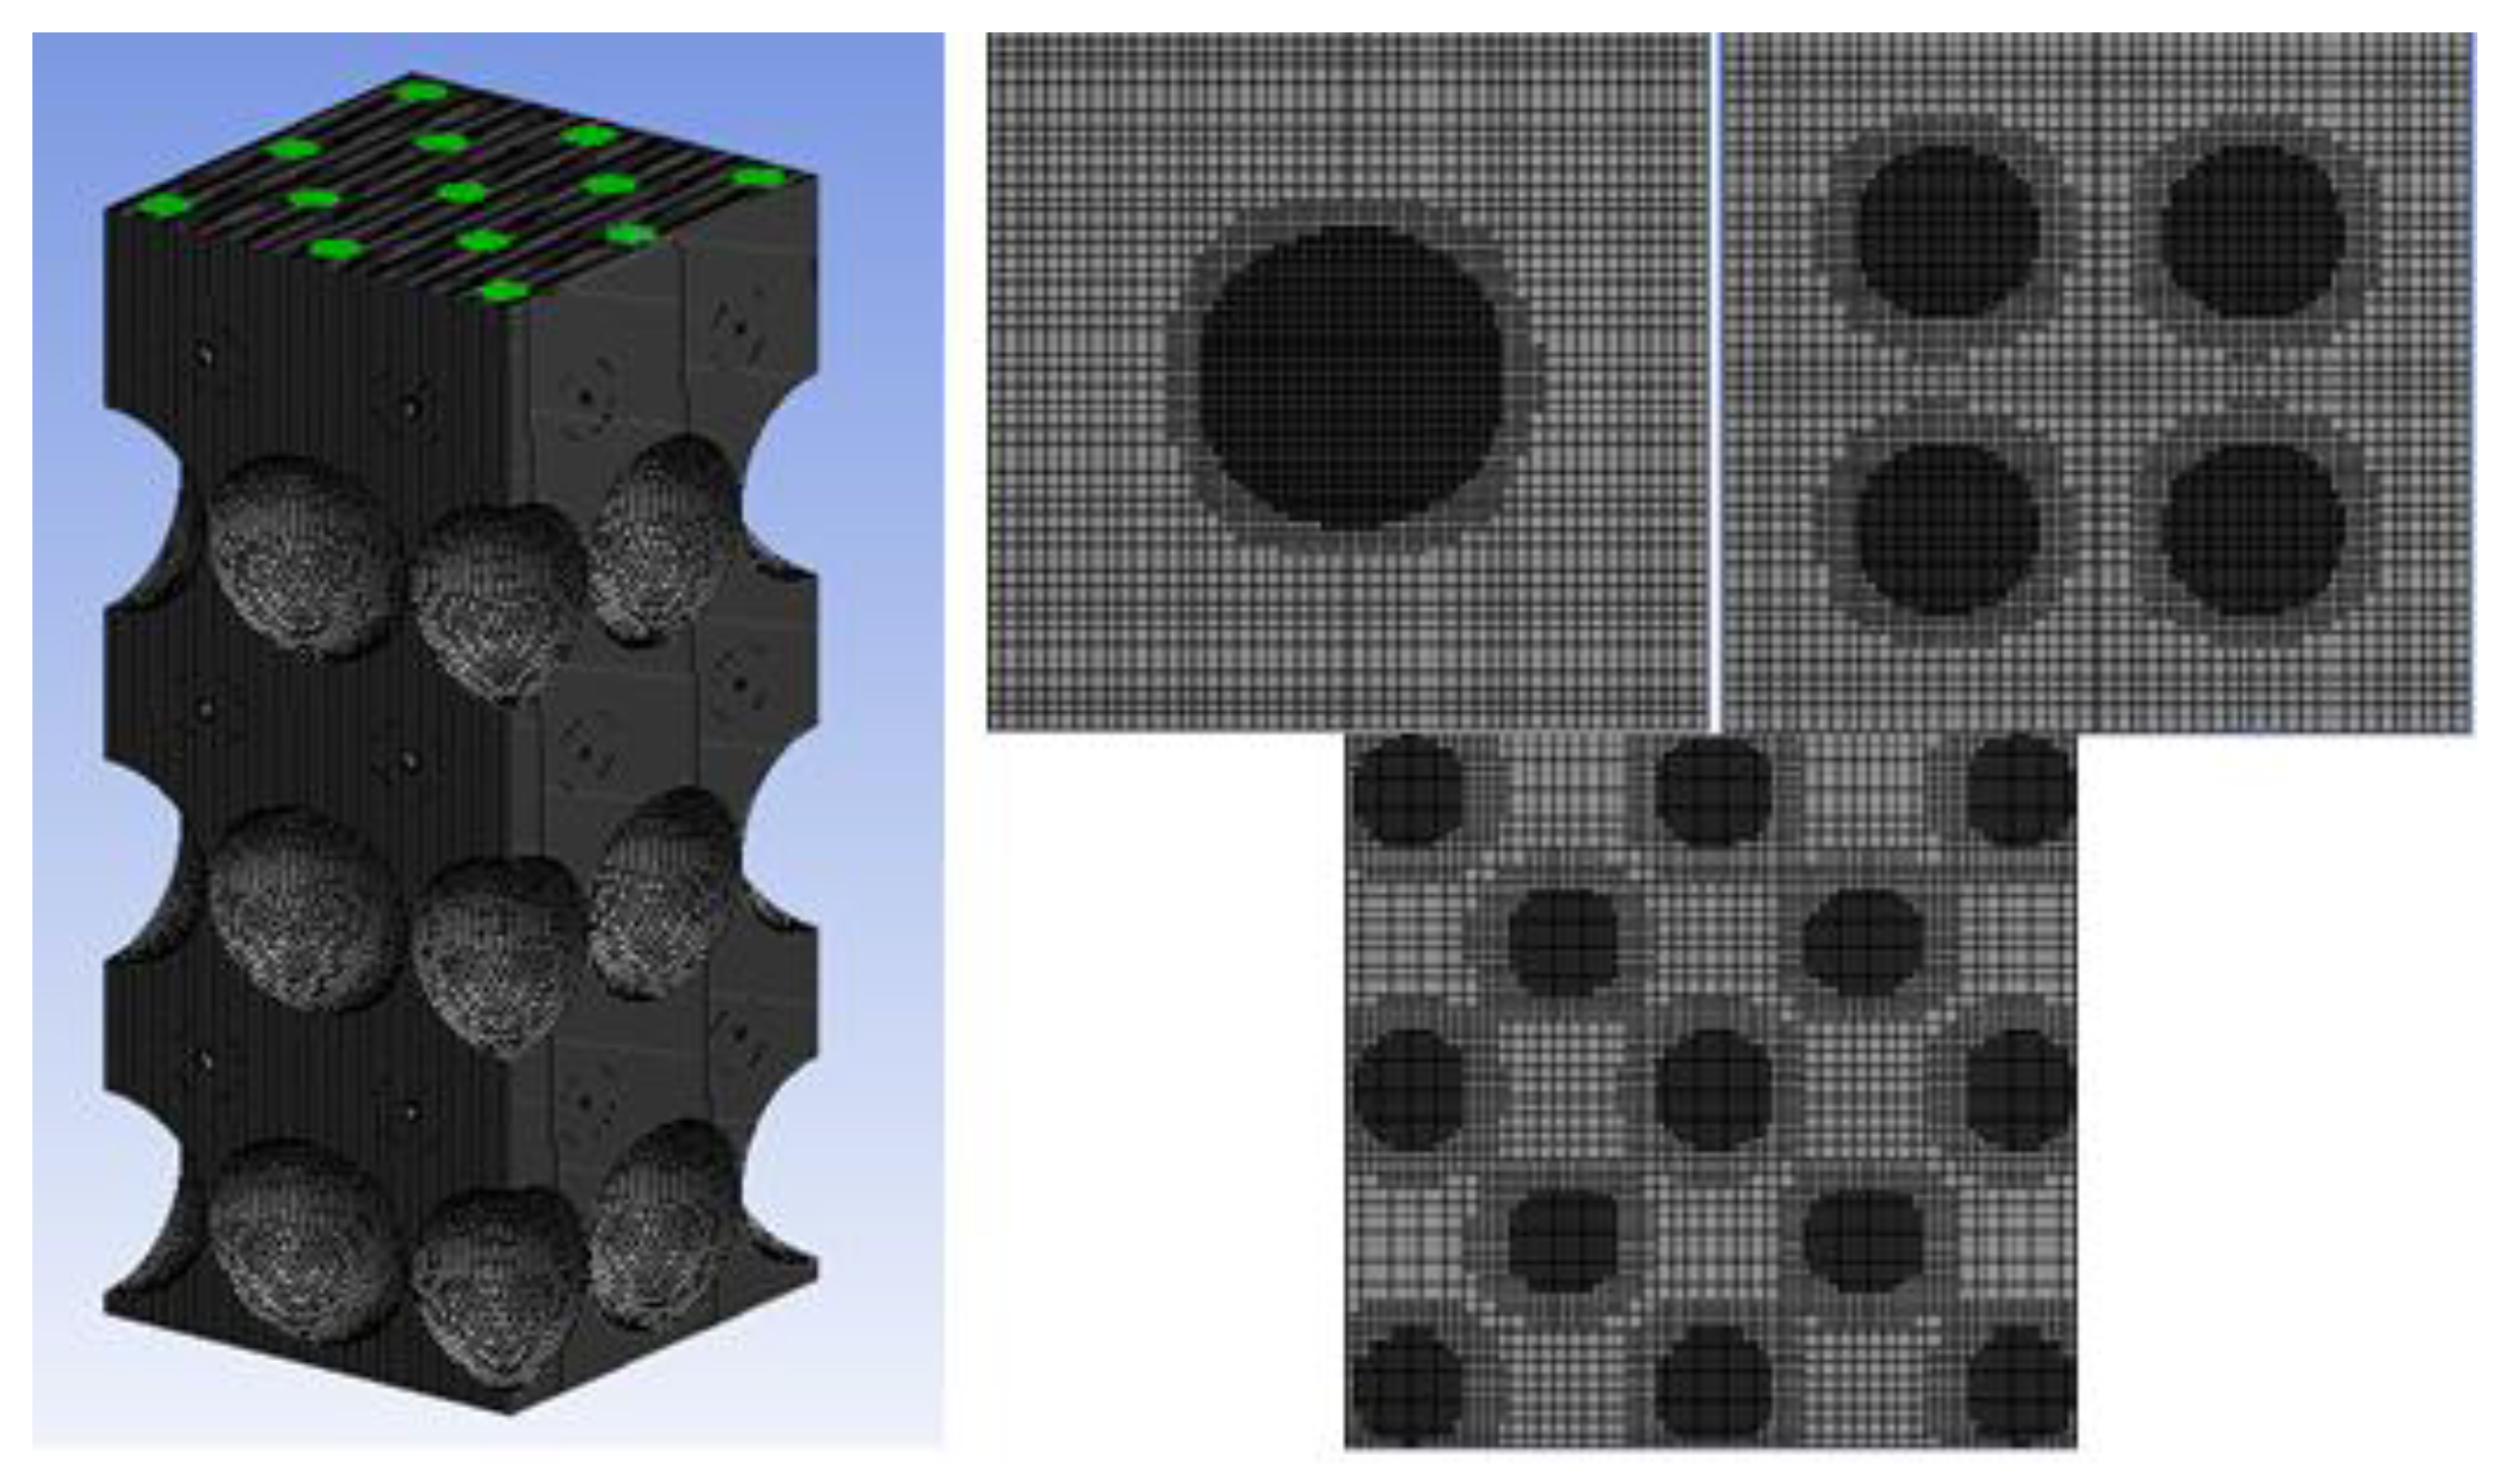
As noted in the results of Figure 5 and Figure 6, the effect of having only one liquid inlet was to cause somewhat poorly distributed liquid throughout the modeled domain. These results point to the importance of the design of liquid inlets for the reactor because flows which are initially developed may be expected to depend on flow injection geometries; in addition, distribution changes will affect flow hydrodynamics [6,30]. Hence, CFD models having a different number of liquid inlets were constructed to study their effects on flow. Figure 10 shows the geometric models when the number of inlets was varied from 1 to 4 to 13. As the number of inlets were varied their respective diameters were also varied from 0.0072 m with one inlet, to 0.0036 m with four inlets, and 0.002 m with 13 inlets; these values of the inlet diameters enabled the total liquid inlet area to be constant and, therefore, the overall inlet liquid velocity remained constant. All three inlet configurations were simulated using identical operation conditions.
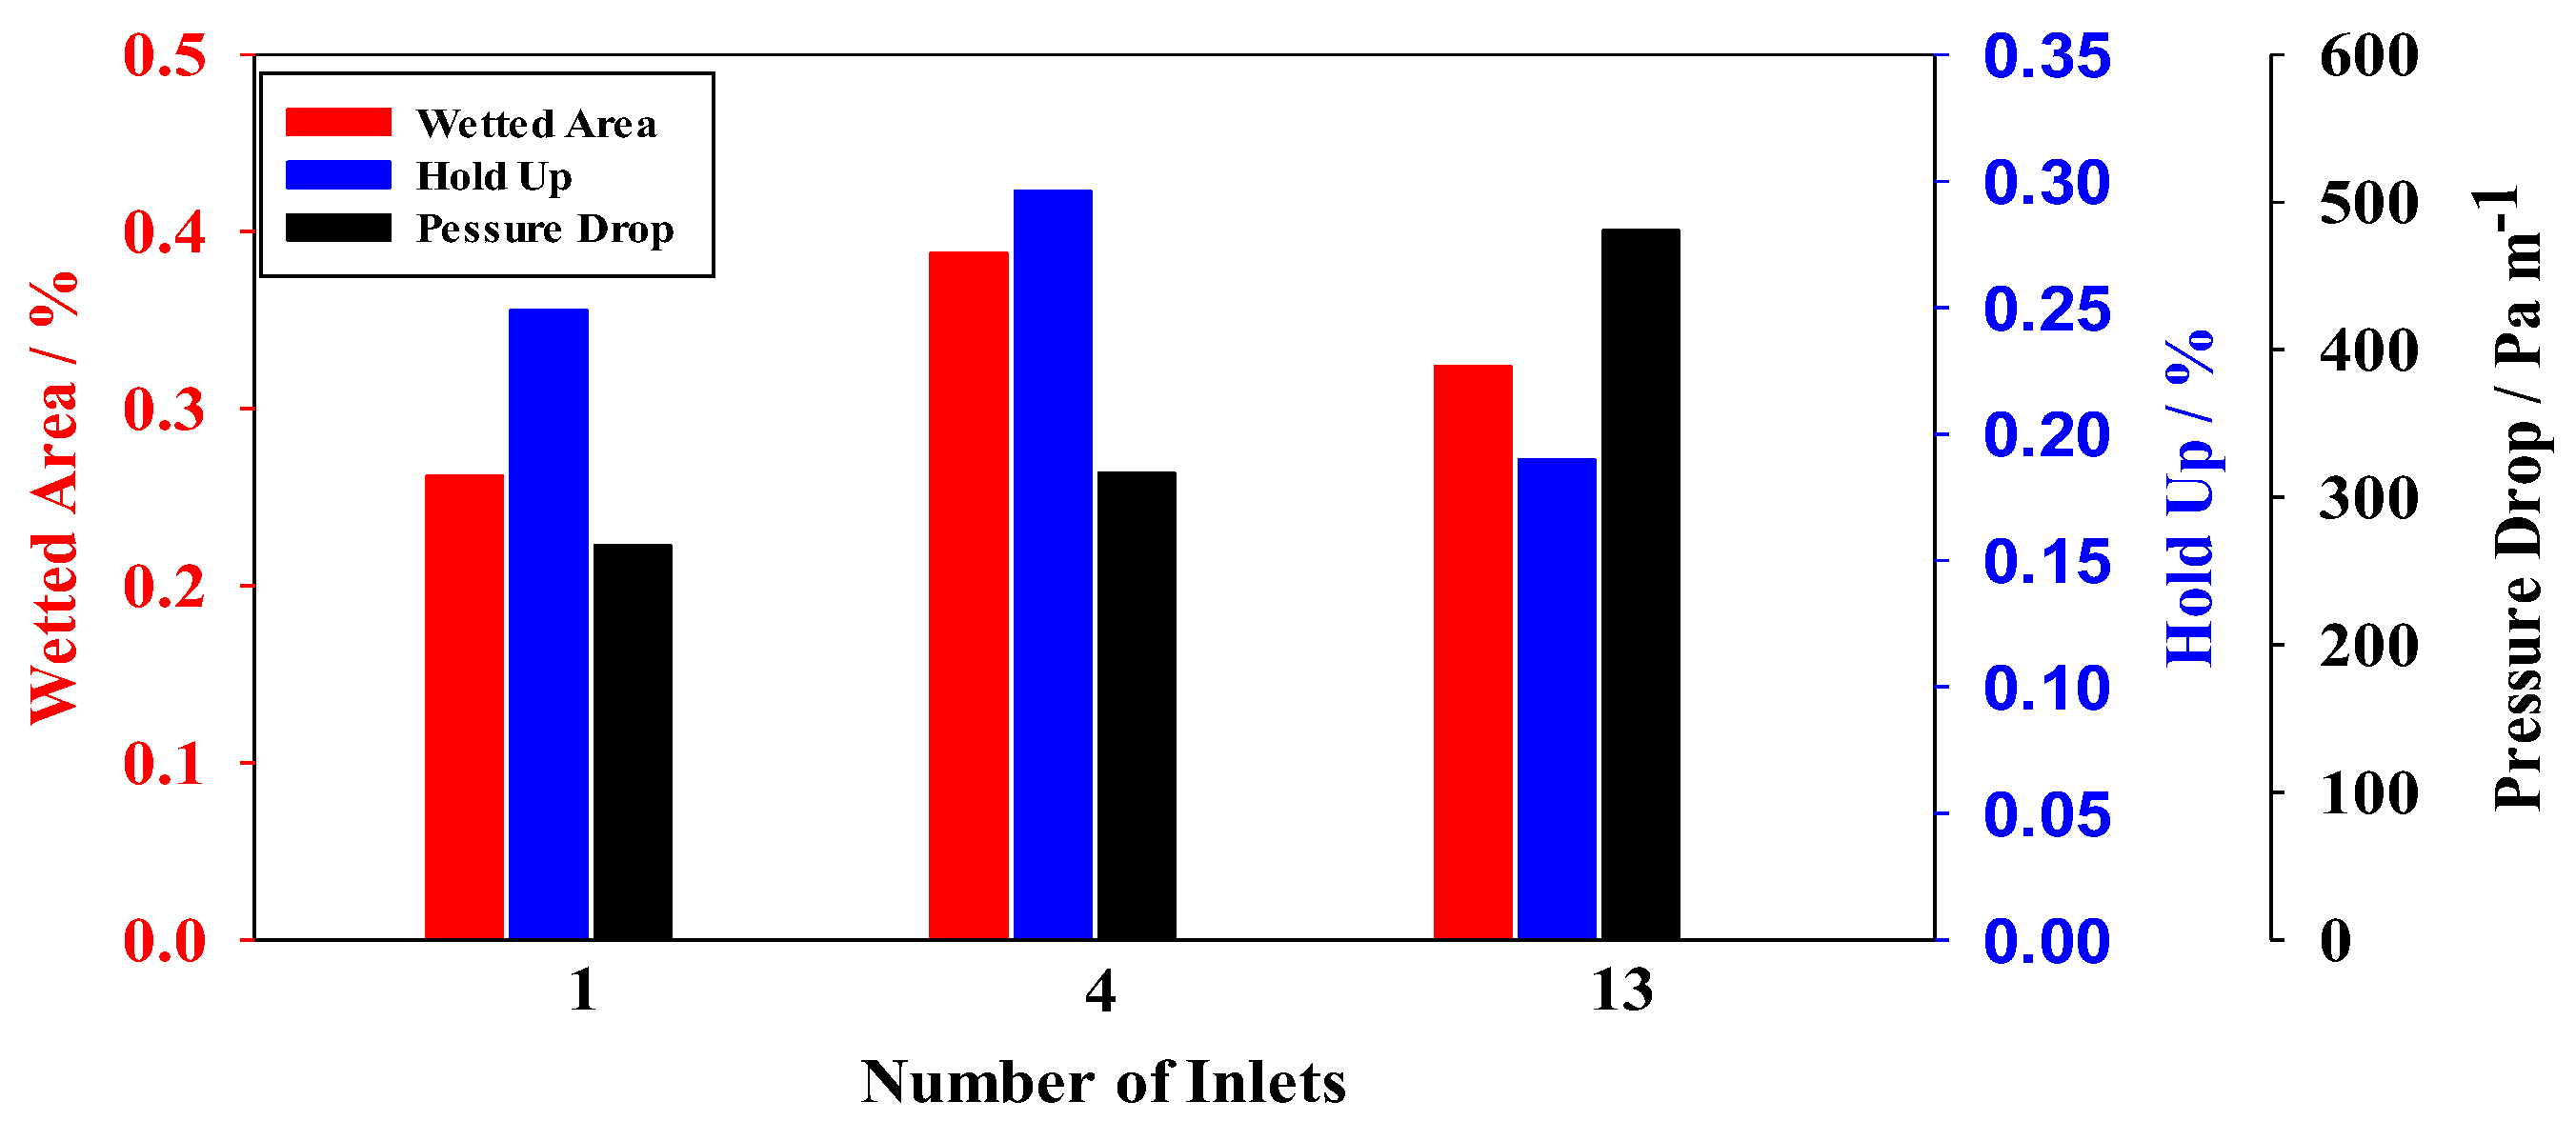
Figure 11 demonstrates the influence of the number of inlets on wetted areas, liquid hold ups, and pressure drops. The configuration with four inlets had the highest wetted area and liquid hold up; in contrast, pressure drops continuously increased as the number of inlets was increased to 13. This result may be a consequence of the ease with which liquid was distributed as small droplets when 13 inlets were used as compared to when four inlets were used. An increased ease of forming small droplets would not be beneficial to liquid film development. Among these three configurations, the best choice from a point of view of mass transfer efficiency was the use of four inlets because it produced the highest liquid hold ups and wetted areas with lower pressure drops.
4.5. Effect of Liquid Surface Tension
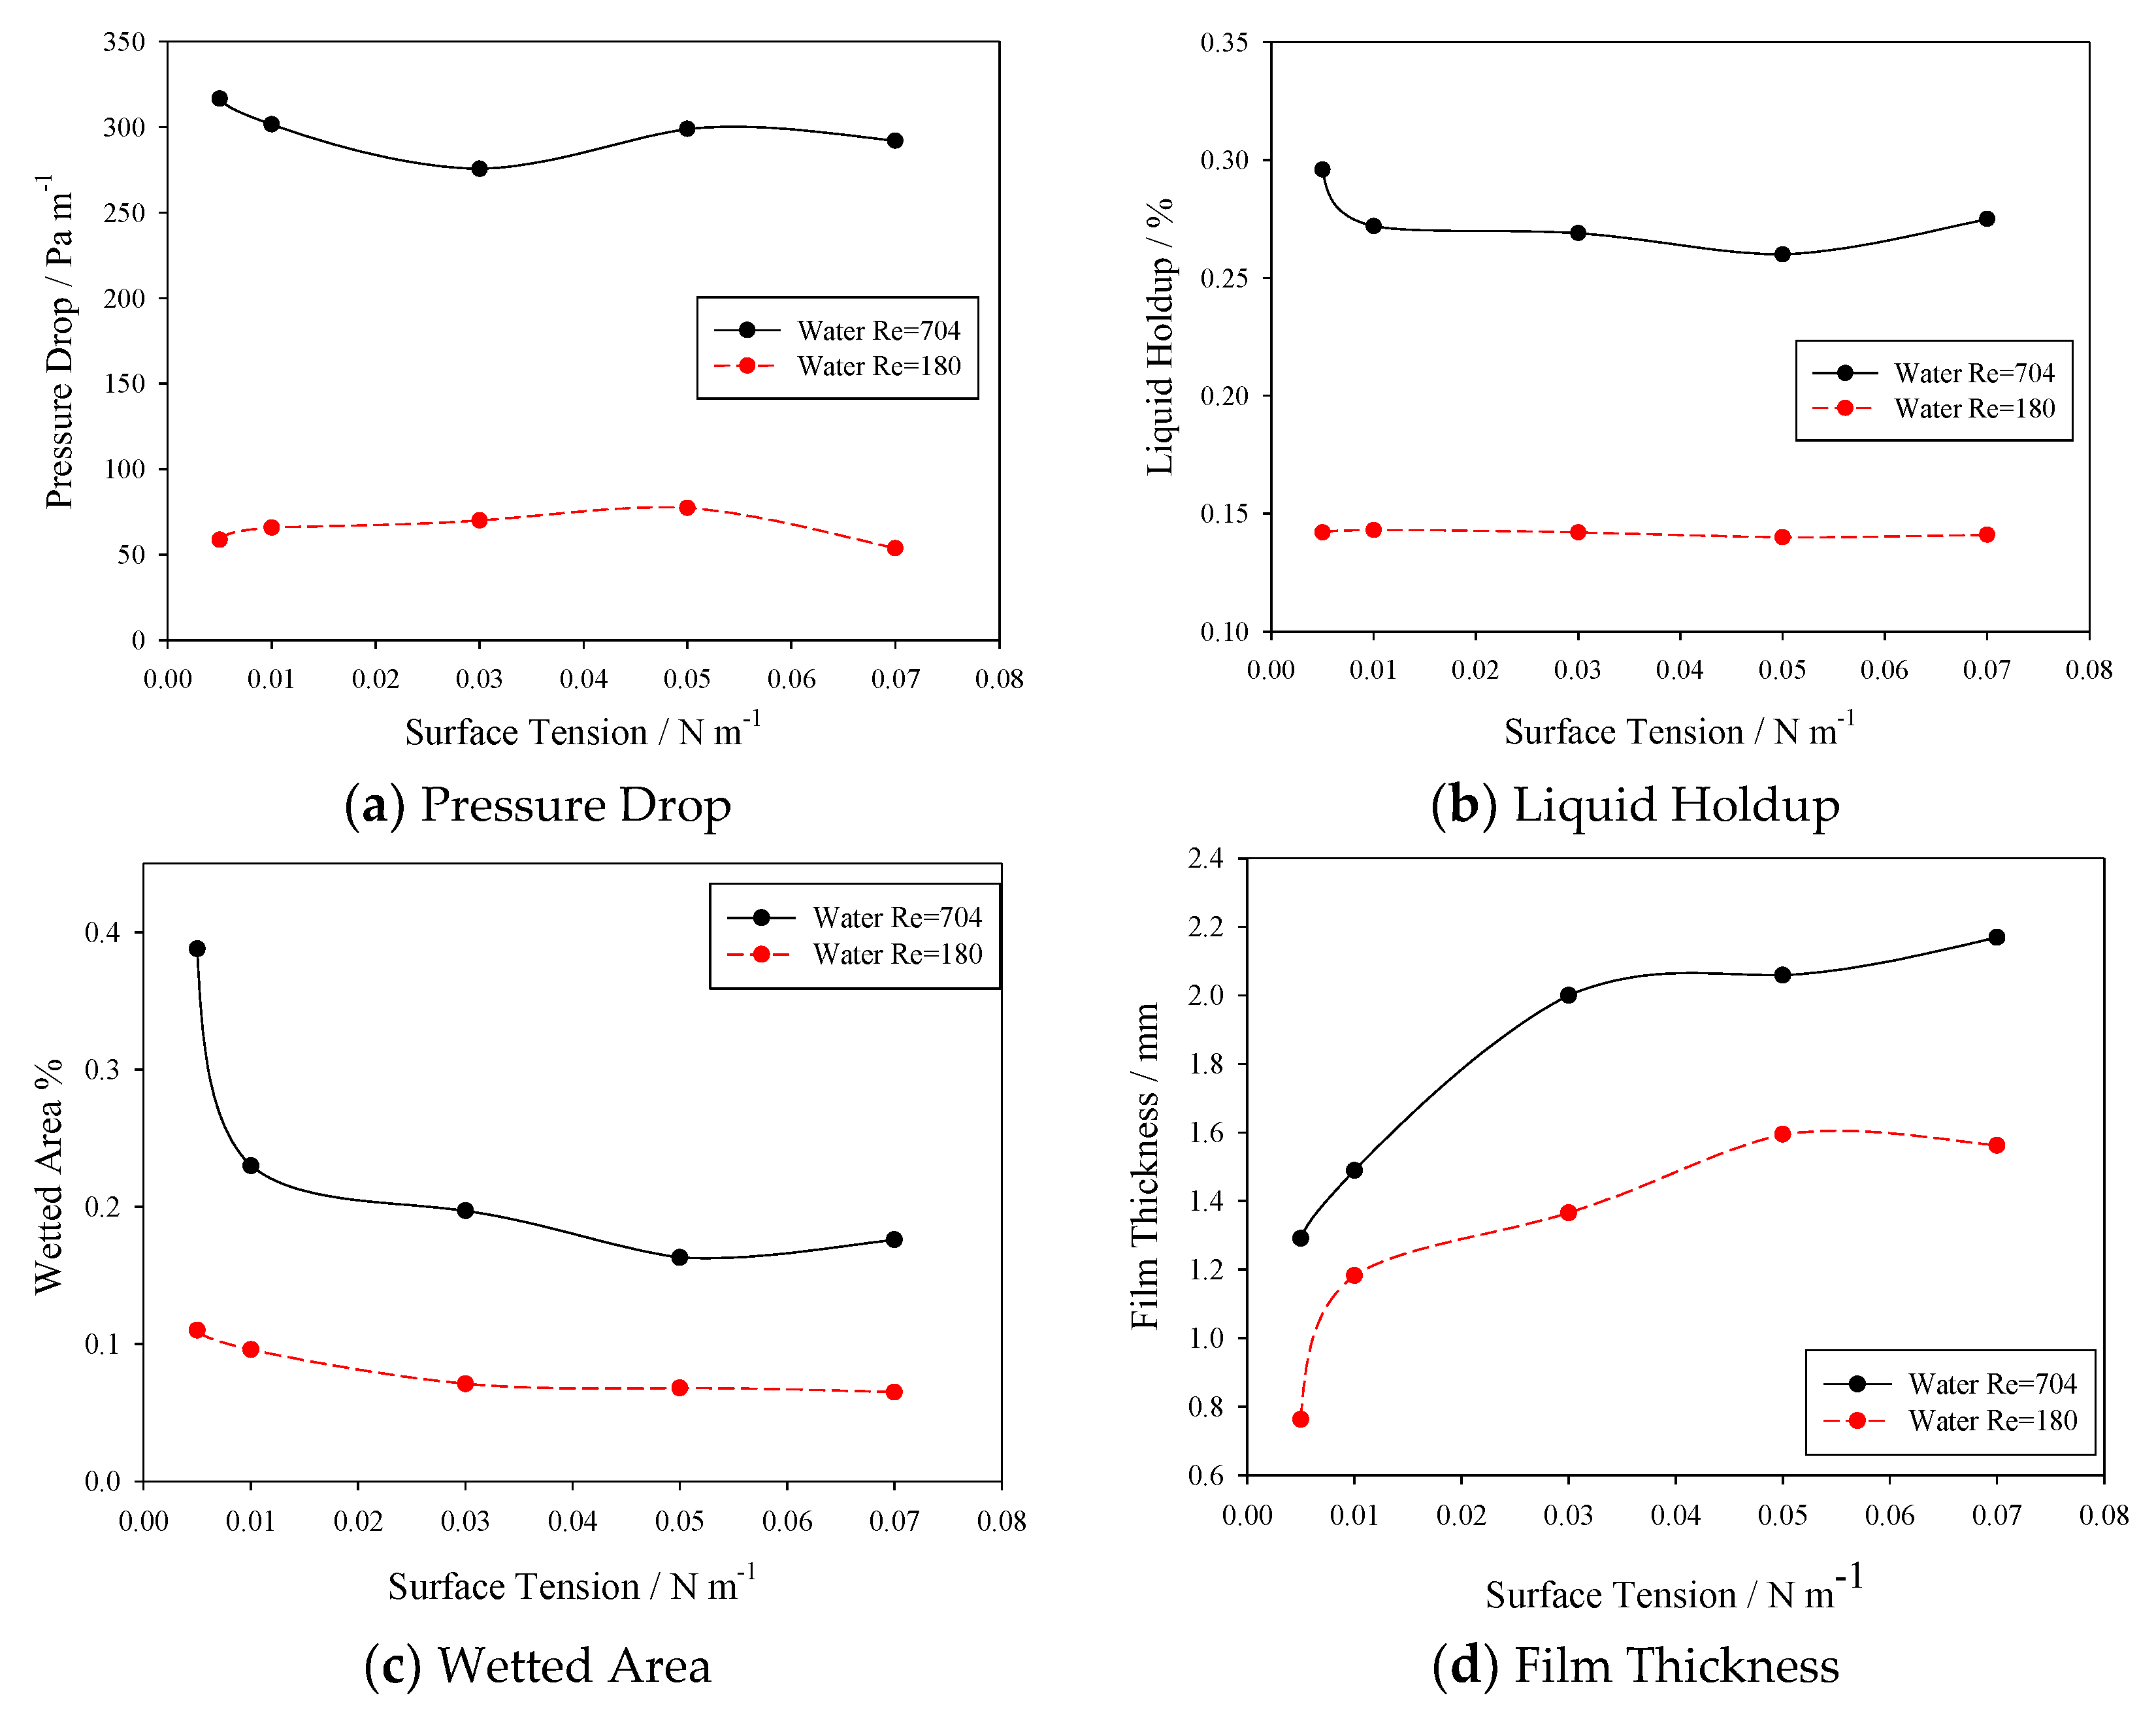
During operation of a commercial CO2 absorption process using a packed bed, the temperature of the MEA solvent and adsorbent will change depending upon their location within the absorber column [31]; this temperature change will affect solvent surface tension. Accordingly, the effects of surface tension on the hydrodynamics in packed beds were explored. Modeling was accomplished in which water was used as the liquid and its surface tension was changed between 0.005–0.07 N/m to mimic expected variations that would occur in a large-scale reactor.
The effects of surface tension on pressure drops, liquid holdups, wetted area, and liquid film thicknesses are shown in Figure 12. The value of the surface tension had an insignificant influence on pressure drops and liquid holdups, but lower surface tensions increased wetted areas and decreased film thicknesses. It is expected that thicker films are more difficult to form when surface tensions are small because the liquid is more highly influenced by gas flow than by surface tension. Larger wetted areas and thinner films are preferred in a chemical reaction; hence, a solvent with lower surface tension would be preferred.
5. Conclusions
The characteristics of the liquid flow for CO2 capture in a packed bed reactor with spherical balls were investigated experimentally and computationally. Pressure drops were determined experimentally under six different test conditions. A comprehensive 3D CFD model for counter-current multiphase flow was developed and validated by favorable comparisons of its predicted pressure drops with those from the experiments. Because of model validation, the hydrodynamics of a packed bed reactor with plastic spheres of a specific size and geometry were investigated under various operational conditions. The key findings of these studies were (1) An increase of We values led to more uniform liquid distributions. The flow regimes with spherical packing were film flow when We was greater than 0.547; at values of We between 0.547–1.57, more trickle flow areas were observed; (2) Liquid holdups and wetted areas increased linearly with increasing liquid flow rates, while gas flow rates had no significant effect on either liquid holdup or wetted area; (3) The number of liquid inlets significantly affected flow behavior; however, increasing the number of inlets did not always enhance wetted areas or liquid holdups. Instead, the highest wetted areas and liquid holdups occurred for four inlets rather than 13; (4) Surface tension had an insignificant influence on pressure drops and liquid holdups; however, lower surface tension provided larger wetted areas and thinner films.
Author Contributions
L.Y. built the model and wrote most of the paper; F.L. performed the experimental study; K.S. and K.L. contributed to results analysis and validation; Z.S. optimized the mathematical model.
Funding
This research was funded by the Key Laboratory of Coal-based CO2 Capture and Geological Storage, Jiangsu Province (China University of Mining and Technology) (NO: 2016B05).
Acknowledgments
John Stencel provided valuable comments that helped to improve this paper.
Conflicts of Interest
The authors declare no conflicts of interest.
References
- Muradova, N.Z.; Veziroğlub, T.N. Green path from fossil-based to hydrogen economy: An overview of carbon-neutral technologies. Int. J. Hydrog. Energy 2008, 33, 6804–6839. [Google Scholar] [CrossRef]
- Climate Change 2007: Synthesis Report. Available online: http://www.ipcc.ch/publications_and_data/publications_ipcc_fourth_assessment_report_synthesis_report.htm (accessed on 3 June 2018).
- Liu, F.; Chen, L.; Neathery, J.K.; Saito, K.; Liu, K. Cerium oxide promoted iron-based oxygen carrier for chemical looping combustion. Ind. Eng. Chem. Res. 2014, 53, 16341–16348. [Google Scholar] [CrossRef]
- Feron, P.H. Exploring the potential for improvement of the energy performance of coal fired power plants with post-combustion capture of carbon dioxide. Int. J. Greenh. Gas Control 2010, 4, 152–160. [Google Scholar] [CrossRef]
- Mahr, B.; Mewes, D. CFD modelling and calculation of dynamic two-phase flow in columns equipped with structured packing. Chem. Eng. Res. Des. 2007, 85, 1112–1122. [Google Scholar] [CrossRef]
- Gunjal, P.R.; Kashid, M.N.; Ranade, V.V.; Chaudhari, R.V. Hydrodynamics of trickle bed reactors: Experiments and CFD modeling. Ind. Eng. Chem. Res. 2005, 44, 6278–6294. [Google Scholar] [CrossRef]
- Ismail, I.; Gamio, J.C.; Bukhari, S.F.A.; Yang, W.Q. Tomography for multi-phase flow measurement in the oil industry. Flow Meas. Instrum. 2005, 16, 145–155. [Google Scholar] [CrossRef]
- Stapf, S.; Han, S.-I. NMR Imaging in Chemical Engineering; Wiley-VCH Verlag GmbH & Co.: Weinheim, Germany, 2006. [Google Scholar]
- Elkins, C.J.; Alley, M.T. Magnetic resonance velocimetry: Applications of magnetic resonance imaging in the measurement of fluid motion. Exp. Fluids 2007, 43, 823–858. [Google Scholar] [CrossRef]
- Llamas, J.-D.; Pérat, C.; Lesage, F.; Weber, M.; D’Ortona, U.; Wild, G. Wire mesh tomography applied to trickle beds: A new way to study liquid maldistribution. Chem. Eng. Process. 2008, 47, 1765–1770. [Google Scholar] [CrossRef]
- Li, L.; Zou, X.; Wang, H.; Zhang, S.; Wang, K. Investigations on two-phase flow resistances and its model modifications in a packed bed. Int. J. Multiphase Flow 2018, 101, 24–34. [Google Scholar] [CrossRef]
- Toukan, A.; Alexander, V.; AlBazzaz, H.; Al-Dahhan, M.H. Identification of flow regime in a cocurrent gas-liquid upflow moving packed bed reactor using gamma ray densitometry. Chem. Eng. Sci. 2017, 168, 380–390. [Google Scholar] [CrossRef]
- Kuzeljevic, Z. Hydrodynamics of Trickle Bed Reactors: Measurements and Modeling. Ph.D. Thesis, Washington University, Saint Louis, MO, USA, 2010. [Google Scholar]
- Attou, A.; Ferschneider, G. Two-fluid model for flow regime transition in gas-liquid trickle-bed reactors. Chem. Eng. Sci. 1999, 54, 5031. [Google Scholar] [CrossRef]
- Propp, R.M.; Colella, P.; Crutchfield, W.Y.; Day, M.S. A numerical model for trickle bed reactors. J. Comput. Phys. 2000, 165, 311–333. [Google Scholar] [CrossRef]
- Souadnia, A.; Latifi, M.A. Analysis of two-phase flow distribution in trickle-bed reactors. Chem. Eng. Sci. 2001, 56, 5977–5985. [Google Scholar] [CrossRef]
- Jiang, Y. Flow Distribution and Its Impact on Performance of Packed-Bed Reactors. Ph.D. Thesis, Washington University, St. Louis, MO, USA, 2000. [Google Scholar]
- Gunjal, P.R.; Ranade, V.V.; Chaudhari, R.V. Liquid phase residence time distribution in trickle bed reactors: Experiments and CFD simulations. Can. J. Chem. Eng. 2003, 81, 821. [Google Scholar] [CrossRef]
- Bednarz, A.; Weber, B.; Jupke, A. Development of a CFD model for the simulation of a novel multiphase counter-current loop reactor. Chem. Eng. Sci. 2017, 161, 350–359. [Google Scholar] [CrossRef]
- Zhao, B. Post-combustion CO2 capture with ammonia by vortex fow-based multistage spraying. Energy 2016, 102, 106–117. [Google Scholar] [CrossRef]
- Tong, Z.; Marek, A.; Hong, W. Experimental and numerical investigation on gravity-driven film flow over triangular corrugations. Ind. Eng. Chem. Res. 2013, 52, 15946–15958. [Google Scholar] [CrossRef]
- Saito, K.; Williams, F.A. Scale modeling in the age of high speed computation. In Progress in Scale Modeling; Springer: Cham, Switzerland, 2014; Volume II, pp. 1–16. ISBN 978-3-319-10308-2. [Google Scholar]
- Liu, F.; Saito, K.; Liu, K. Scale-up of chemical looping combustion. In Progress in Scale Modeling; Springer: Cham, Switzerland, 2014; Volume II, pp. 239–248. ISBN 978-3-319-10308-2. [Google Scholar]
- Lopes, R.J.; Quinta-Ferreira, R.M. Quinta-Ferreira: CFD modelling of multiphase flow distribution in trickle beds. Chem. Eng. J. 2009, 147, 342–355. [Google Scholar] [CrossRef]
- Dybbs, A.; Edwards, R.V. A New Look at Porous Media Fluid Mechanics—Darcy to Turbulent. In Fundamentals of Transport Phenomena in Porous Media; Bear, J., Corapcioglu, M.Y., Eds.; NATO ASI Series (Series E: Applied Sciences); Springer: Dordrecht, The Netherlands, 1984; Volume 82. [Google Scholar]
- Labourasse, E.; Lacanette, D.; Toutant, A.; Lubin, P.; Vincent, S.; Lebaigue, O.; Caltagirone, J.-P.; Sagaut, P. Towards Large Eddy Simulation of isothermal two-phase flows: Governing equations and a priori tests. Int. J. Multiphase Flow 2007, 33, 1–39. [Google Scholar] [CrossRef]
- Vincent, S.; Larocque, J.; Lacanette, D.; Toutant, A.; Lubin, P.; Sagaut, P. Numerical simulation of phase separation and a priori two-phase LES filtering. Comput. Fluids 2008, 37, 898–906. [Google Scholar] [CrossRef]
- Christensen, D.E.; Deigaard, R. Large eddy simulation of breaking waves. Coast. Eng. 2001, 42, 53–86. [Google Scholar] [CrossRef]
- Sebastia-Saez, D.; Gu, S.; Ranganathan, P.; Papadikis, K. 3D modeling of hydrodynamics and physical mass transfer characteristics of liquid film flows in structured packing elements. Int. J. Greenh. Gas Control 2013, 19, 492–502. [Google Scholar] [CrossRef]
- Fu, D.; Wei, L.; Liu, S. Experiment and model for the surface tension of carbonated MEA–MDEA aqueous solutions. Fluid Phase Equilib. 2013, 337, 83–88. [Google Scholar] [CrossRef]
- Johnston, P.M.; Zhu, J.-X.; Lasa, H.I.; Zhang, H. Effect of distributor designs on the flow development in downer reactor. AIChE J. 1999, 45, 1587–1592. [Google Scholar] [CrossRef]
Figure 1.
Diagram of a post combustion solvent-based CO2 capture process.

Figure 2.
Experiment Setup, (a) Schematic diagram of the experiment setup; (b) Image of plastic spheres.
Figure 2.
Experiment Setup, (a) Schematic diagram of the experiment setup; (b) Image of plastic spheres.

Figure 3.
3D geometry and meshed model.

Figure 4.
Pressure drops obtained from experiments and simulation using six differen t conditions. (a) Pressure drop as a function of gas flow rate at a fixed liquid flow rate of VL = 200 mL/min; (b) pressure drop as a function of liquid flow rate at a fixed gas flow rate of Vg = 10 L/min.
Figure 4.
Pressure drops obtained from experiments and simulation using six differen t conditions. (a) Pressure drop as a function of gas flow rate at a fixed liquid flow rate of VL = 200 mL/min; (b) pressure drop as a function of liquid flow rate at a fixed gas flow rate of Vg = 10 L/min.

Figure 5.
Flow distribution of iso-surface 0 at different liquid We from 0.014 to 2.16 at fixed Reg = 199.
Figure 5.
Flow distribution of iso-surface 0 at different liquid We from 0.014 to 2.16 at fixed Reg = 199.


Figure 6.
Liquid flow regime and wetted area at different liquid We numbers from 0.014 to 2.16 at fixed Reg = 199.
Figure 6.
Liquid flow regime and wetted area at different liquid We numbers from 0.014 to 2.16 at fixed Reg = 199.

Figure 7.
Influence of gas velocity with fixed liquid velocities on liquid hold up.

Figure 8.
Influence of gas velocity with fixed liquid velocities on wetted area.

Figure 9.
Gas and liquid velocity vectors.

Figure 10.
CFD model with different numbers of liquid inlet.

Figure 11.
Influence of liquid inlet numbers on wetted area, liquid hold up, and pressure drop.

Figure 12.
Influence of surface tension on pressure drop, liquid holdup, wetted area, and film thickness.
Figure 12.
Influence of surface tension on pressure drop, liquid holdup, wetted area, and film thickness.


Table 1.
Boundary Conditions.
| Boundary | Materials | Type | Value | Velocity (m/s) | Reynolds Number | We Number |
|---|---|---|---|---|---|---|
| Liquid inlet | Water | Mass flow rate | 100–1200 mL/min | 0.012–0.147 | 180–1100 | 0.014–2.2 |
| Gas inlet | Air | Mass flow rate | 5–25 L/min | 0.076–0.382 | 99–500 | |
| Liquid outlet | Pressure-outlet | 0 Pa | ||||
| Gas outlet | Pressure-outlet | 0 Pa |
Table 2.
Experimental matrix and gas side pressure drops.
| Cases | Gas Phase Mass Flow Rate (L/min) | Liquid Phase Mass Flow Rate (mL/min) | Gas Side Pressure Drop (Pa/m) |
|---|---|---|---|
| 1 | 5 | 200 | 23.64 |
| 1 | 10 | 200 | 65.45 |
| 1 | 15 | 200 | 105.45 |
| 2 | 10 | 100 | 54.55 |
| 2 | 10 | 200 | 65.45 |
| 2 | 10 | 300 | 72.73 |
© 2018 by the authors. Licensee MDPI, Basel, Switzerland. This article is an open access article distributed under the terms and conditions of the Creative Commons Attribution (CC BY) license (http://creativecommons.org/licenses/by/4.0/).
Share and Cite
MDPI and ACS Style
Yang, L.; Liu, F.; Song, Z.; Liu, K.; Saito, K. 3D Numerical Study of Multiphase Counter-Current Flow within a Packed Bed for Post Combustion Carbon Dioxide Capture. Energies 2018, 11, 1441. https://doi.org/10.3390/en11061441
AMA Style
Yang L, Liu F, Song Z, Liu K, Saito K. 3D Numerical Study of Multiphase Counter-Current Flow within a Packed Bed for Post Combustion Carbon Dioxide Capture. Energies. 2018; 11(6):1441. https://doi.org/10.3390/en11061441
Chicago/Turabian StyleYang, Li, Fang Liu, Zhengchang Song, Kunlei Liu, and Kozo Saito. 2018. "3D Numerical Study of Multiphase Counter-Current Flow within a Packed Bed for Post Combustion Carbon Dioxide Capture" Energies 11, no. 6: 1441. https://doi.org/10.3390/en11061441
Note that from the first issue of 2016, this journal uses article numbers instead of page numbers. See further details here.