Service Continuity of PV Synchronous Buck/Buck-Boost Converter with Energy Storage†


Institut Jean Lamour (UMR7198), Université de Lorraine Vandoeuvre lès Nancy, Campus Artem - BP 50840, F-54511 Nancy, France
*
Author to whom correspondence should be addressed.
†
This paper is an extended version of our paper published in EEEIC 2017: Service Continuity of PV Synchronous buck/buck-boost Converter with Energy Storage.
Energies 2018, 11(6), 1369; https://doi.org/10.3390/en11061369
Submission received: 24 April 2018
/
Revised: 9 May 2018
/
Accepted: 21 May 2018
/
Published: 28 May 2018
(This article belongs to the Special Issue 17TH International Conference on Environment and Electrical Engineering)
Abstract
:Numerous advantages offered by Photovoltaic (PV) generation systems coupled with the increasing power demands for clean energy put PV systems in the front of many research works. For stand-alone applications powered with PV systems, the reliability of the power conversion stage is essential to ensure the continuous supply of energy. Therefore, in the case of any failure occurring in the power conversion stage, it is mandatory to provide remedial actions to guarantee the service continuity of the produced electrical power. This paper analyses the service continuity of a two-stage buck/buck-boost converter with energy storage, driven with synchronous control. The initial two-stage converter is made fault-tolerant and robust to failures of its two switches by adding only one additional switch associated with two diodes. In this study, only open-circuit switch faults are considered. The proposed fault-tolerant circuit and the initial one have the same electrical behavior when synchronous control is used. The applied synchronous control in both healthy conditions and post-fault operation ensures the same functionalities without degrading the system’s performances. The proposed two-stage synchronously-controlled circuit is validated through simulation in the cases of open circuit faults on the two switches of the initial converter. The obtained results show the feasibility of the proposed functional redundancy and the continuity of operation at full power after switch fault diagnosis.
1. Introduction
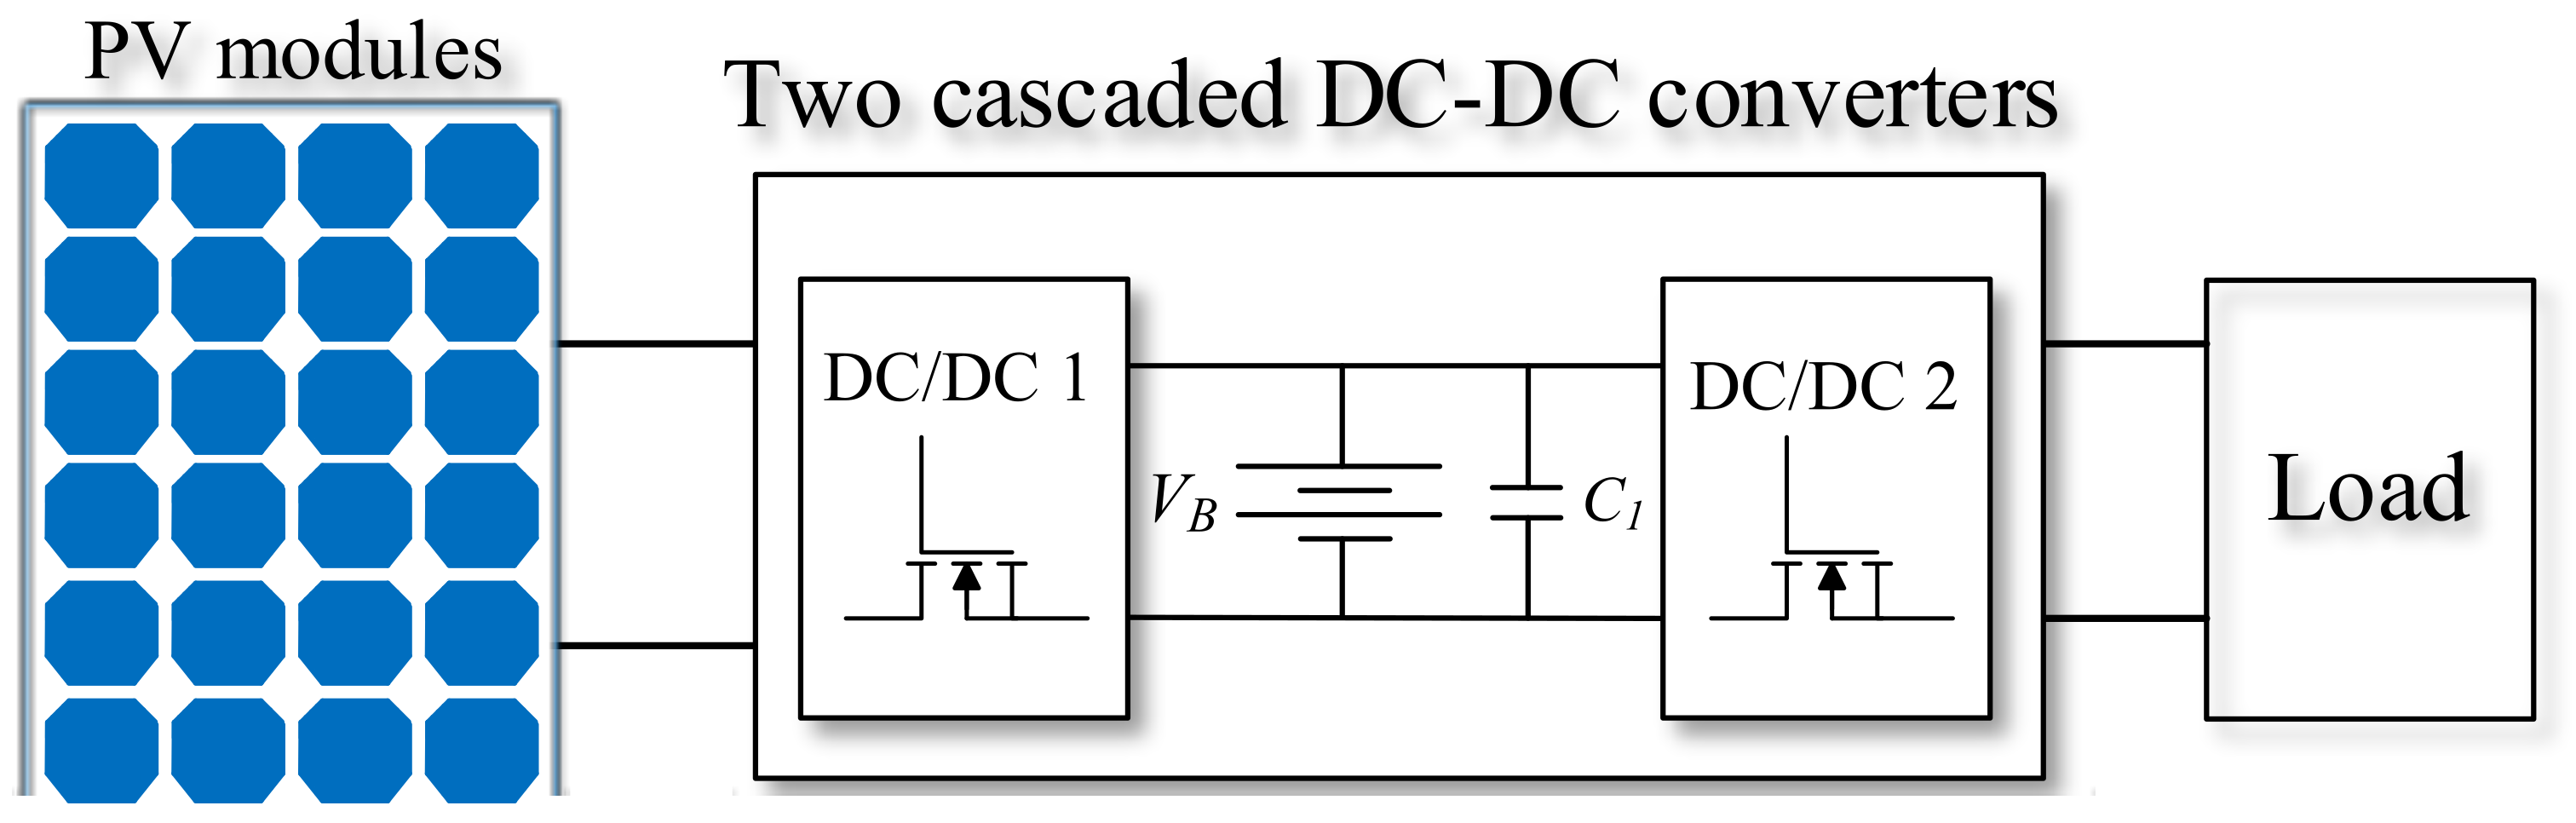
The continued increase in fossil fuel costs and the increasing energy demands of autonomous systems have led to the development of sustainable energy systems [1]. Among clean power sources, Photovoltaic (PV) solar energy comes up as a very interesting alternative for electrical power generation [2]. Indeed, photovoltaic energy has had a remarkable growth in the last few decades and a significant penetration in many applications such as telecommunication, battery charging, as well as part of hybrid power systems. To enhance the electric power availability of energy harvesting systems in different applications, the continuity of service becomes mandatory. It is particularly critical in applications that require continuous and uninterrupted energy such as medical devices, embedded systems or sensor networks. Figure 1 shows the commonly-used structure in PV systems, consisting of PV panels associated with two cascaded DC-DC converters. The two DC-DC converter circuits act as an interface between the PV source and the connected load. Moreover, within the framework of stand-alone applications, as in this study, energy storage is often included in the power conversion stage between the two converters (see Figure 1).
In the past few decades, scientific research works in PV reliability studies have focused on storage devices and semi-conductors. Moreover, in PV energy harvesting systems, power electronics DC-DC converters are the most critical source of failures. Indeed, the most critical elements in the DC-DC converters, which can undergo a fault, are the power semiconductors, mainly the switches. According to a survey, semiconductor failure in power devices takes up of power electronics systems failures [3,4]. The switch failures can be either Short Circuit Fault (SCF) or Open Circuit Fault (OCF) [5]. These failures may happen due to several reasons: incorrect gate voltage, lifting of bonding wires due to thermal cycling, driver failure, rupture of the switch, which can be a consequence of an SCF and electrical over stresses (voltage or current), electrostatic discharge, system transient and lightning. In practice, an OCF may be a consequence of a gating fault or an SCF. In this case, to perform continuity of service under an SCF of the switch itself, a fast fuse is usually connected in series with the switch. It is also possible to cut the short-circuit path by using an additional controllable switch in series with the switches of the circuit; this solution is more efficient to cut the SCF in terms of time performances, but it induces high additional costs and power losses. Thus, in all cases, an SCF will become an OCF after the cut of the short circuit path. For this reason, only OCF is considered in this paper. Moreover, to perform the continuity of service proposed in this paper, there is no need to know if the detected OCF results from an SCF or not.
Service continuity in power electronics converters is necessary in safety critical applications. Indeed, it allows one to avoid energy transfer cut between the elements of the power conversion chain and the damages that can result from this. Service continuity includes two steps:
- Fault diagnosis, including fault detection and location. It is the first mandatory step for a suitable response to a fault detected in a semiconductor device. Several methods have been reported in the literature. An open and short circuit switch fault diagnosis applied to non-isolated DC-DC converters is presented in [6]. It is based on the continuous monitoring of the inductor current slope, whose abrupt changes give useful information for fault detection. In [7], fault diagnosis based on the monitoring of the primary voltage of a transformer is proposed and applied to full-bridge DC-DC converters. A DC-DC converter diagnosis method that utilizes the magnetic near field as the diagnostic criterion is proposed in [8]. In addition, a switch fault diagnosis method based on the magnetic component voltage measurement is proposed in [9].
- Remedial actions encompass the reconfiguration of the converter and its associated control, if necessary. Several system reconfiguration approaches have been proposed in the literature, for a fault-tolerant converter with or without redundancy. They are detailed hereafter.
The classical fault diagnosis and remedial action approaches allowing one to perform service continuity of the converter under normal mode operating conditions (at full power) are summarized in Figure 2. On the one hand, converter topologies can include redundancy, where an identical operating converter topology will be operated before and after remedial actions. In this case, the post-fault control remains the same after fault diagnosis. An example of fault-tolerant operation using this approach, tested on multiple parallel-connected boost converters, is proposed in [5]. In the proposed fault-tolerant circuit, a unique redundant switch is shared between multiple identical boost DC-DC converters connected to a common DC bus. Moreover, linking switches are connected between the redundant switch and each DC-DC converter. When a switch fault occurs in one of the converters, the faulty switch will be replaced by the shared redundant switch, by switching the suitable linking switch. Then, the converter comprising the faulty switch will continue to operate at full power. On the other hand, without redundancy, to perform normal operation after fault diagnosis, both converter topology and its associated control must be reconfigured. To the best of our knowledge, research works addressing this operating mode have been reported in the literature only for AC-DC conversion, not for DC-DC one.
Nevertheless, a degraded mode after fault compensation can be performed without redundancy, where the converter topology remains unchanged, and only its associated control is modified. An example of this case is presented in [10], where a DC-DC converter for hybrid electric vehicles is studied. The proposed converter is comprised of three stages: a buck, a boost and a bidirectional leg for battery charging and discharging. In this study, only OCF in the boost converter’s switch is considered. After an OCF detection, the bidirectional leg, initially used for charging and discharging the battery in healthy conditions, is also used for fault compensation. Nevertheless, the converter control is also modified after remedial actions. By these actions, the boost operation is still guaranteed, but the power exchanges with the battery are in a degraded mode. Another example of a fault-tolerant topology without redundancy, with degraded operation after fault compensation, is proposed in [11]. This topology is proposed for a three-level boost DC-DC converter and is dedicated to open circuit switch faults. The circuit must contain at least two input capacitors, and its midpoint must be connected to the midpoint of PV modules. The fault tolerance strategy requires an additional inductor and a triac added to the initial converter. The concept of the reconfiguration is the same: when one of the switches is faulty, this three-level boost converter is reconfigured into a standard two-level boost converter with MPPT (Maximum Power Point Tracking) control for only one PV module, while the other module operates without MPPT control. As a result, the converter does not stop working, although it provides less energy.
In this paper, service continuity of a cascaded buck/buck-boost converter equipped with intermediate energy storage is studied. Here, focus is placed on remedial actions based on a new and the original fault-tolerant buck/buck-boost circuit. The fault diagnosis part is not included nor discussed in this study. Numerous switch fault diagnosis studies in conversion circuits have been reported in the literature and have been the subject of intensive research. As mentioned before, faithful results have been also reported in the case of DC-DC circuits such as the ones presented in [12,13]. One of the proposed algorithms can be applied for fault diagnosis purposes of the studied buck/buck-boost circuit. In this paper, our contribution concerns “remedial actions” for service continuity at full power for the cascaded buck/buck-boost circuit under OCF of one of the two switches. To perform fault-tolerant operation, an original redundancy-based approach is proposed. Nevertheless, this approach is not based on classical redundancy where each switch has its own redundant counterpart. On the contrary, the proposed topology employs a reduced number of additional switches. A single additional switch, associated with two diodes, allows one to keep the same power performances after a switch failure of one of the switches of the two-stage converter. Even if the classical redundancy approach is not used, the same synchronous control still applies before and after remedial actions. By using the same color code from Figure 2, the service continuity approach we propose here can be illustrated as in Figure 3. Consequently, in the proposed approach, service continuity at full power is achieved by using both a fault-tolerant converter topology circuit without classical switches redundancy and the same control before and after fault diagnosis.
The main contributions of the presented work can be summarized as follows:
- First, the global service continuity of the two cascaded DC-DC converters circuit is proposed. The proposed approach allows one to ensure the service continuity of the overall conversion circuit by reconfiguring it in the presence of an OCF occurring in one of the two converters. Moreover, only a single redundant switch is used to guarantee the fault-tolerant operation of this two-stage conversion circuit and thus its overall service continuity.
- Second, although the cascaded circuits in healthy and post-fault conditions are not the same, the same control is applied in both operating modes. This unified control is advantageous for the following reasons:
- −
- Reconfiguration time: After an OCF detection, the control used in healthy conditions is not modified; thus, the service continuity is guaranteed with high time performances; in the post-fault operation, the reconfigured converter can be reconfigured and controlled as soon as the OCF is detected.
- −
- Reduced controller complexity: In the proposed system, the so-called “fault-tolerant control” that is always associated with fault-tolerant operation is the same as the control applied in the healthy operation mode: only the choice of the switch(es) to be controlled in healthy conditions or post-fault operation is added. Consequently, the overall controller complexity is reduced as much as possible.
- −
- Operating point maintenance: Even if the operating circuits before and after an OCF detection are not the same, they are electrically equivalent under synchronous control. Thus, applying the same synchronous control after and before the OCF detection and the circuit reconfiguration, the operating point values are maintained, and the load is not stressed with the circuit reconfiguration changes.
- −
- Implementation cost: From the implementation point of view, the reduced complexity of the controller used in both operating modes considerably limits the additional costs needed for its design.
In the following sections, the proposed fault-tolerant converter circuit and its associated control are detailed. Some selected simulation results confirming the effectiveness of the proposed fault-tolerant topology are provided.
2. Proposed Reconfigurable Converter and Remedial Actions
The studied PV system with a two-stage DC-DC conversion and energy storage is depicted in Figure 4. The first stage is a step-down circuit because in the studied PV system, the PV output voltage is higher than the voltage of the battery used. On the contrary, the second converter stage needs to supply to the connected load voltages, which are both higher and lower than the battery voltage. Given that the proposed service continuity approach is based on the use of a single redundant synchronous switch that can replace the two switches (one for each converter), both converters must be single-switch non-isolated DC-DC converters. Thus, given the previously-mentioned application constraints, the only choice for the first stage is the use of a buck converter, whereas the second converter stage must be a buck-boost converter. In this DC-DC circuit, the front buck converter tracks the Maximum Power Point (MPP), whereas the buck-boost one is used to control the output voltage [14]. In healthy conditions, the switches of the two converters could be controlled in the same manner by using a synchronous control.
To ensure service continuity and reduce the number of redundant switches of the converter topology studied in Figure 4, according to the classical approach, a solution could be to share with linking components a single redundant switch between and , in the spirit of the circuit reported in [5]. To find a common node between the switches and , they are moved toward each other while keeping the same electrical converter circuit, as shown in Figure 5.
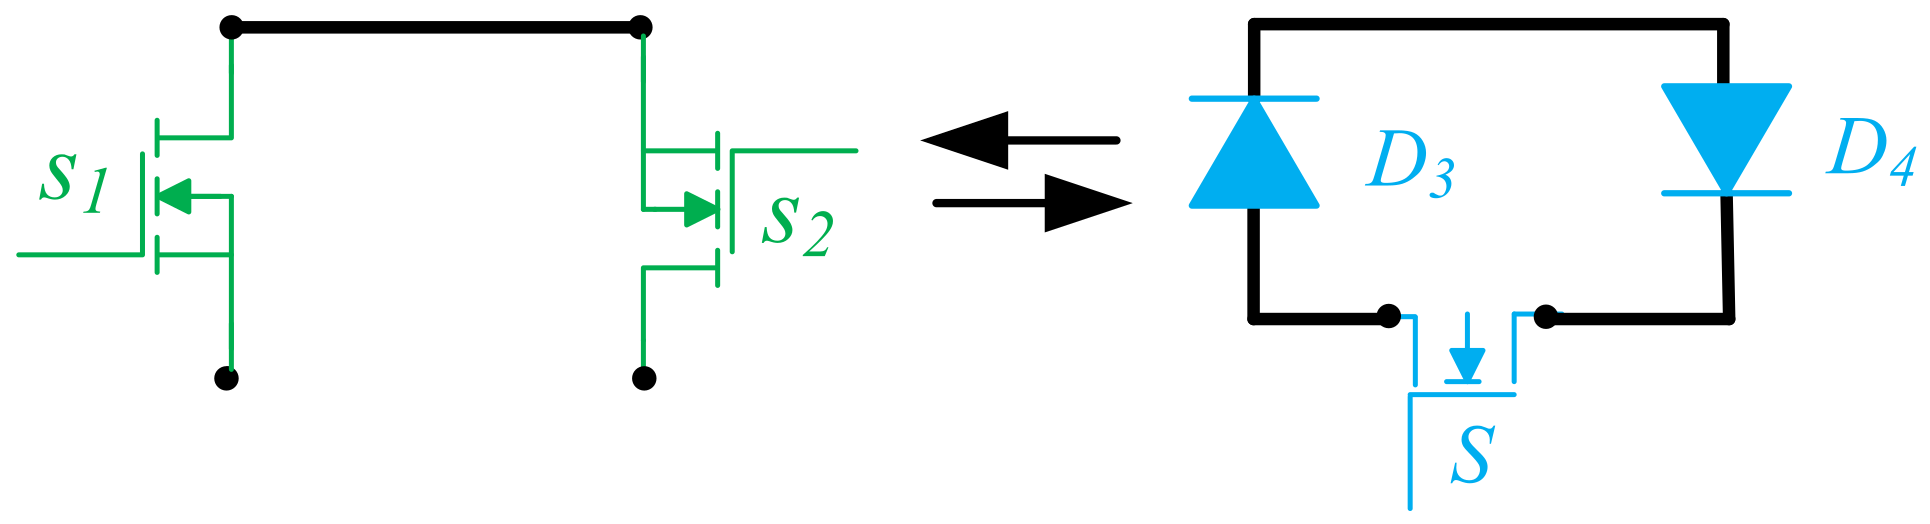
However, sharing a single redundant switch between and is not possible because of the opposite current directions in and (see and in Figure 5). Nevertheless, it can be seen that the drain of the switch is common to the source of the switch . Consequently, if a synchronous control is applied to drive the switches and in healthy conditions, it can be demonstrated that the structure with common node D-Sbetween and can be replaced by an equivalent circuit comprising a single switch S associated with two diodes and [15], as shown in Figure 6. Notice that the two structures of Figure 6 have the same electrical behavior, if a synchronous control is applied.
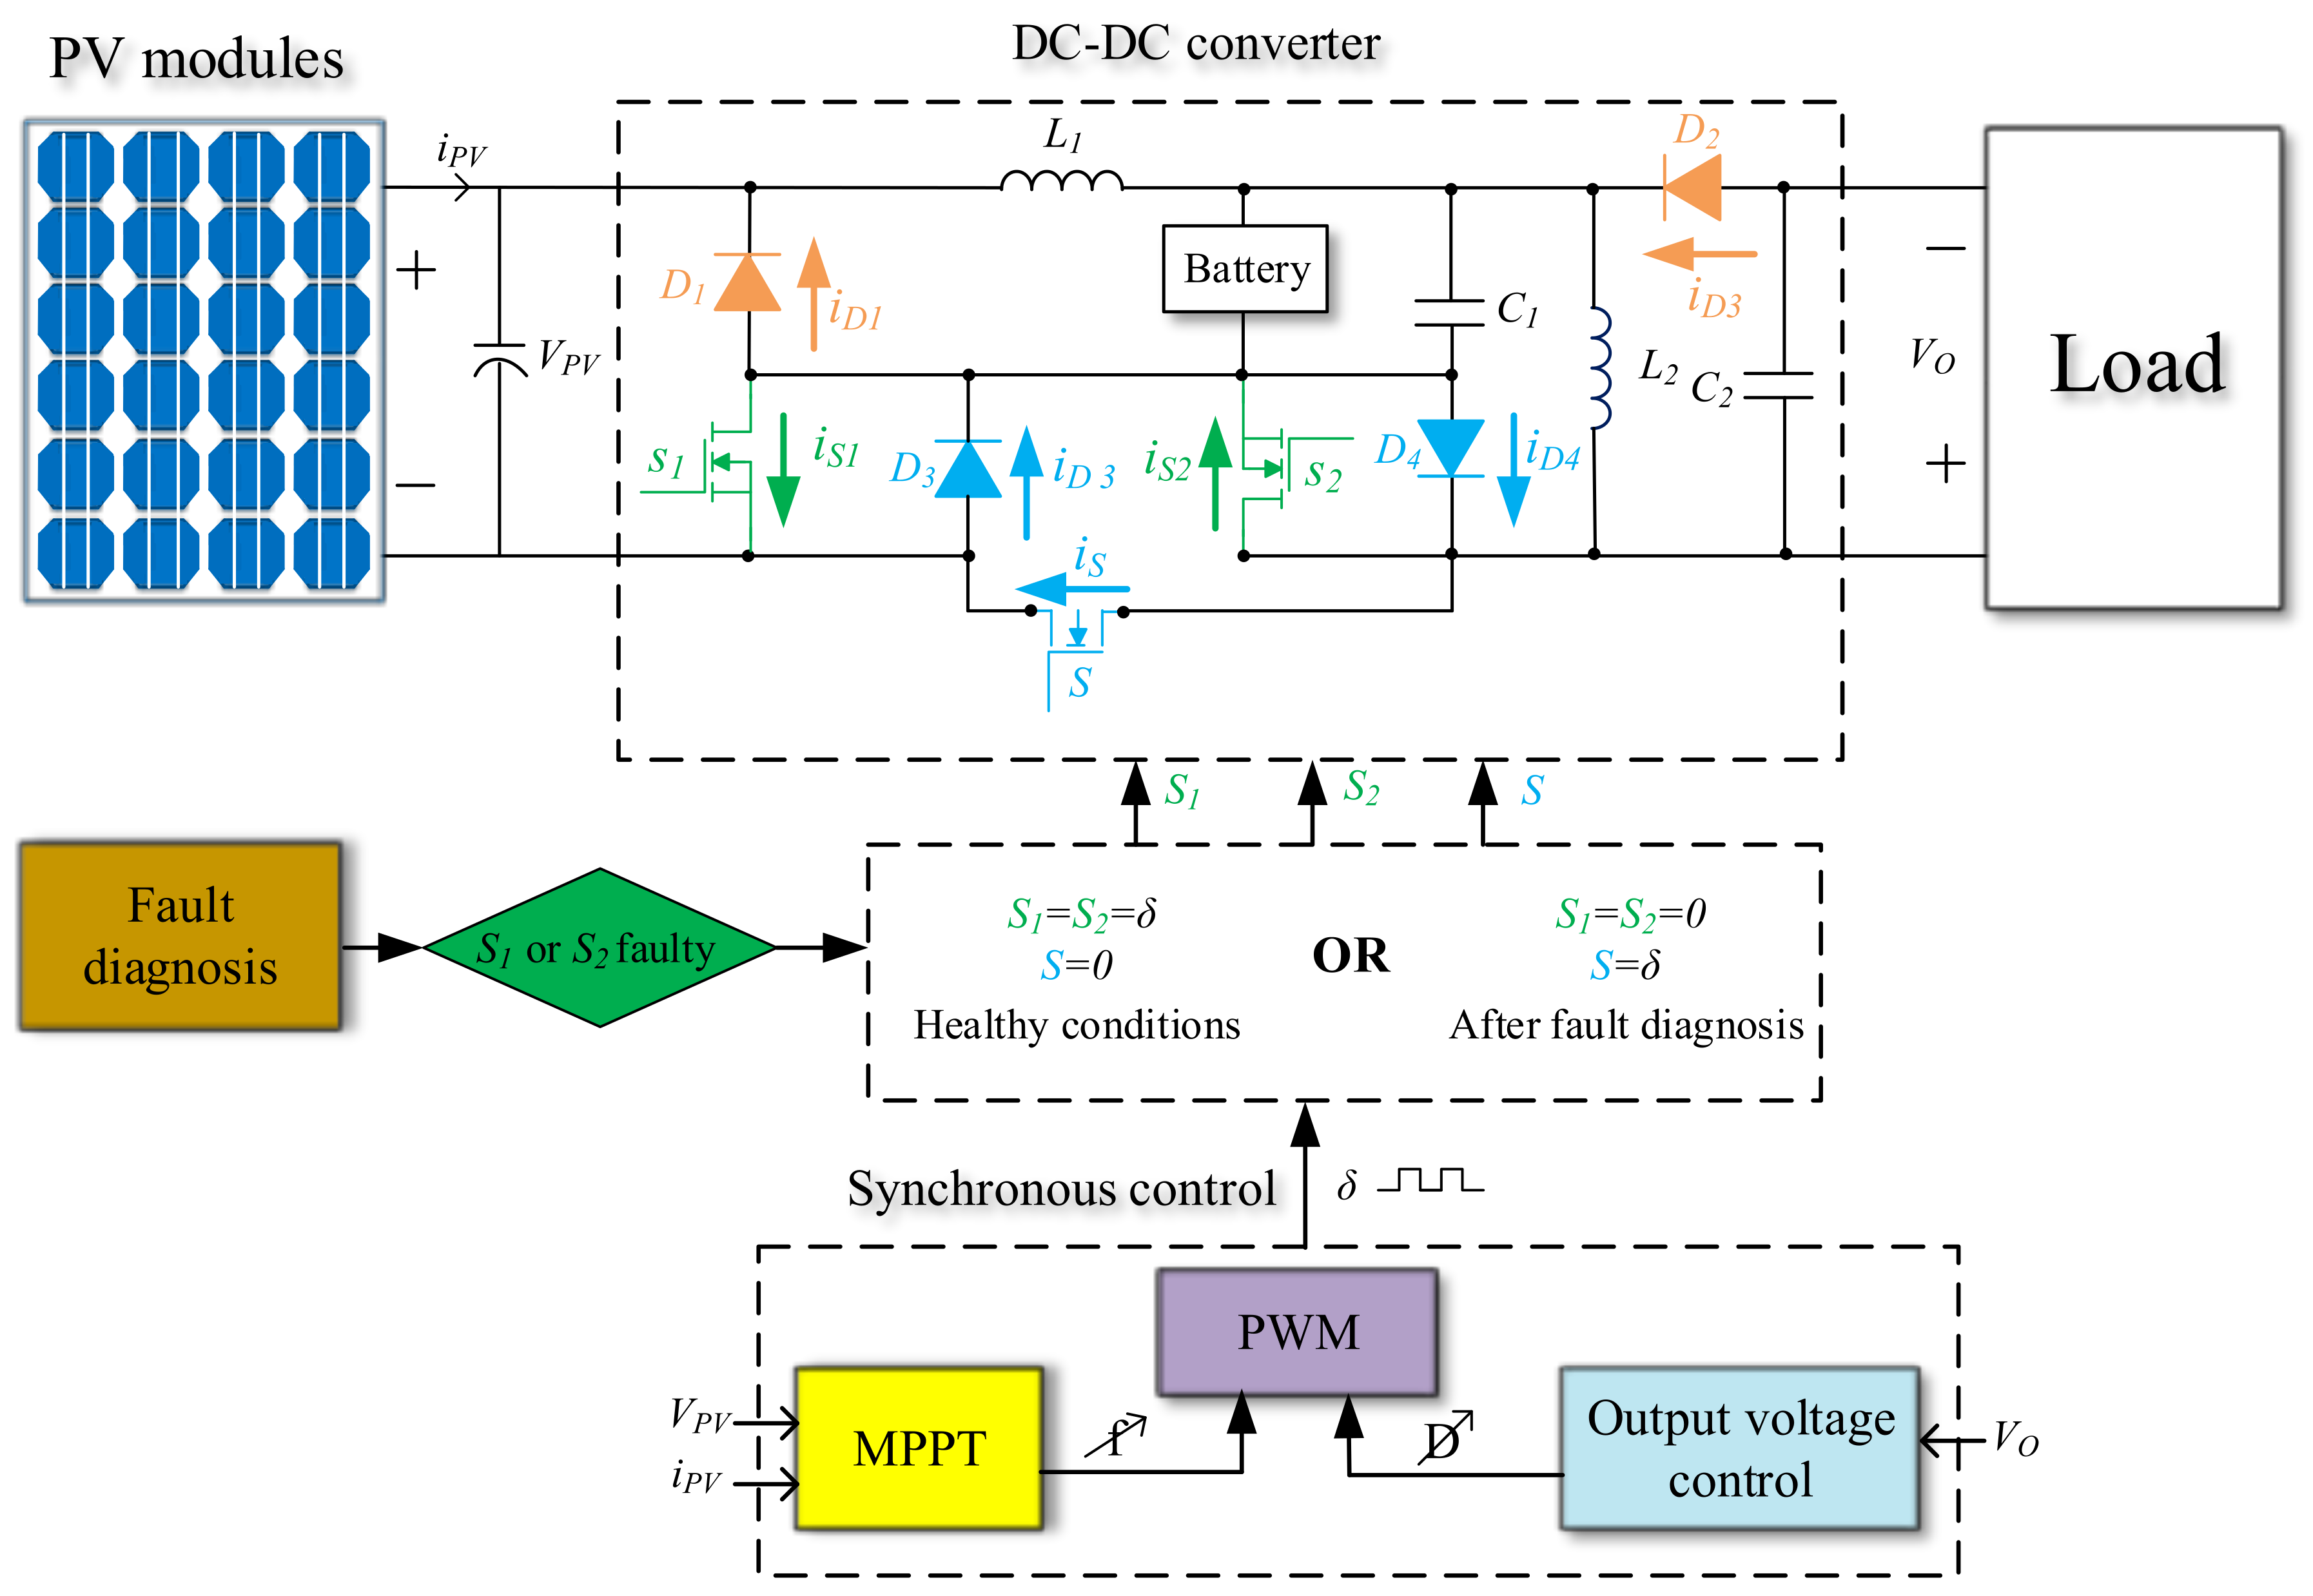
To improve the reliability of the PV system and ensure service continuity of the two-stage cascaded DC-DC circuit, we propose a new and original fault-tolerant circuit presented in Figure 7 [16]. It requires a reduced number of additional components (a single switch S and two diodes and ) compared to the original buck/buck-boost converter circuit (Figure 4), as shown in Figure 7. The diodes and are necessary in terms of “electrical circuit”. However, MOSFET components have effectively an internal diode, called the body diode, which is connected between the source and the drain. Thus, in practice, if MOSFETs with body diodes having adequate current and switching speed ratings are used for and , the diodes and can be the body diodes of these MOSFETs, respectively. This would in practice further reduce the required number of used semi-conductors.
Regardless of the fault location (in or ), the same strategy for system reconfiguration is proposed. Consequently, after an OCF diagnosis and reconfiguration, the post-fault topology with the single switch S performs the same functionalities and ensures the normal operation of the system. In healthy conditions, and are synchronously driven to perform both MPPT and output voltage control. In this case, the control is opening the switch S, and the diodes and are reverse biased by the switches and , respectively. When an OCF occurs and is detected either in or , both switches are opened by the control and become disabled, whereas the switch S starts to be driven to replace the operation of and . Moreover, in the reconfigured topology, the diodes and are also conducting. Unlike the conventional approaches, even if a new conversion circuit is obtained after reconfiguration, the same control remains applied (Figure 7). In healthy conditions, the synchronous control based on the signal drives the switches and , and the switch S is disabled and open. Once an OCF is detected either in or , the signal drives the switch S, and the switches and are disabled (ordered to the opening). As a result, the PV system is capable of operating at full power after an OCF diagnosis.
3. Control of the Proposed Fault-Tolerant Circuit
In this section, the principle of the unified synchronous control applied to the fault-tolerant circuit is first described. Then, the MPPT algorithm and the output voltage control across the load are detailed.
3.1. Principle of the Control
As explained previously, the same synchronous control used to drive the switches and in healthy conditions is also applied to the proposed reconfigurable converter without any modification. Before the occurrence of a failure, the buck converter performs the MPPT by driving the switch , while the buck-boost converter controls the output voltage across the load by driving the switch . After compensation of the failure, the circuit performs both MPPT and output voltage control by driving only the switch S. To ensure the uninterrupted power supply of the load, the buck-boost converter must operate in Continuous Conduction Mode (CCM). The transfer function of the buck-boost converter in CCM mode is given by:
Consequently, based on this transfer function, the duty cycle D of the buck-boost converter is used to control the output voltage across the load.
To track the MPP, the buck converter operating in Discontinuous Conduction Mode (DCM) is used. This conduction mode results from the unified synchronous control applied to the cascaded circuit under both healthy conditions and post-fault operation, as well. Indeed, under synchronous control of the two converters, one must operate in CCM (with duty cycle D as a control parameter) and the other one in DCM (with frequency f as a control parameter) because a single switching pattern with only two control parameters D and f is available. For continuous load supplying, the second stage, which is directly connected to it and feeds it, is naturally in CCM. Thus, under these assumptions, the only choice that is left for the first converter stage is to operate in DCM. Nevertheless, one can also notice that the insolation of the PV source varies during the day and with changing climatic conditions, causing discontinuous power delivery at the PV panel. Therefore, the DCM operating mode of the front buck converter is appropriate for the studied PV system. Indeed, in synchronous control, the two converters must have the same duty cycle D, and since this parameter is already used for the regulation of the output voltage, it cannot be used for tracking the MPP. For this reason, we analyze the transfer function of the buck converter in DCM mode, given by Equation (2):
where is the equivalent load resistance of the front buck converter stage. Thus, the MPP of PV modules can be tracked by acting either on the duty ratio D or on the frequency f of the switching pattern. However, the unified synchronous control applied to both converters limits the choice of the control parameters used to track the MPP at the PV panel’s output. As mentioned previously, the studied PV system needs to ensure continuously the power supply of the connected load. Thus, the second buck-boost converter stage must operate in CCM and is controlled with the duty cycle parameter D. Since the control parameter D is reserved for the second converter, according to Equation (2), the only possible way to control the buck converter is based on the frequency parameter f.
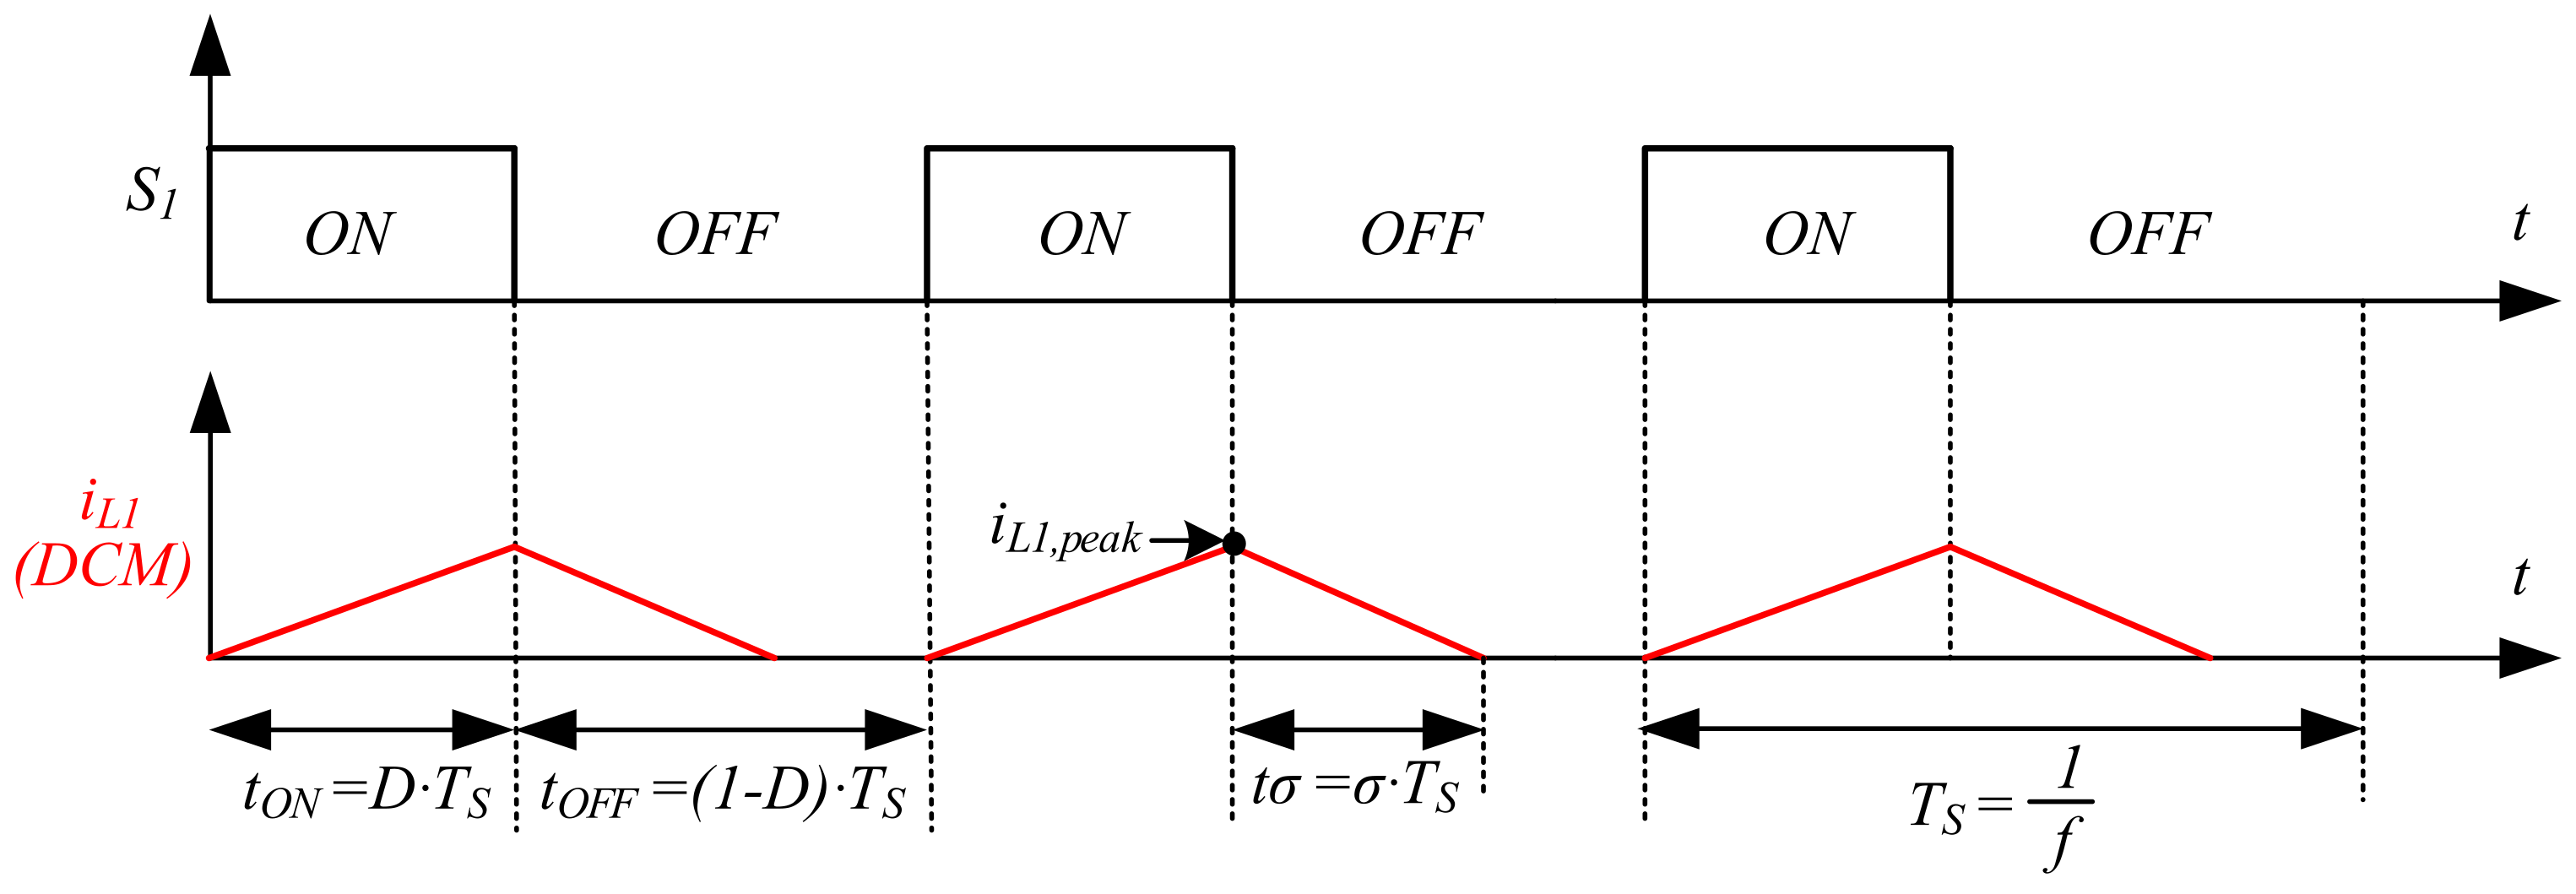
On the other hand, the current is the same as the current through the inductor , when the switch is ON. The average value of can be expressed by (see Figure 8):
As long as is running in DCM, (see Figure 8) can be calculated by:
By replacing Equation (4) in Equation (3), the relation between the current and the control variables becomes:
from whence,
The advantage of using a synchronous control in healthy conditions to control the proposed fault-tolerant topology is to be able to quickly apply the same control in post-fault operation. Thus, the commutation time for the control in the OCF case is reduced as much as possible. The modes of operation of the buck/buck-boost converter must always be respected. Thus, the inductor must operate in DCM, while the inductor must operate in CCM.
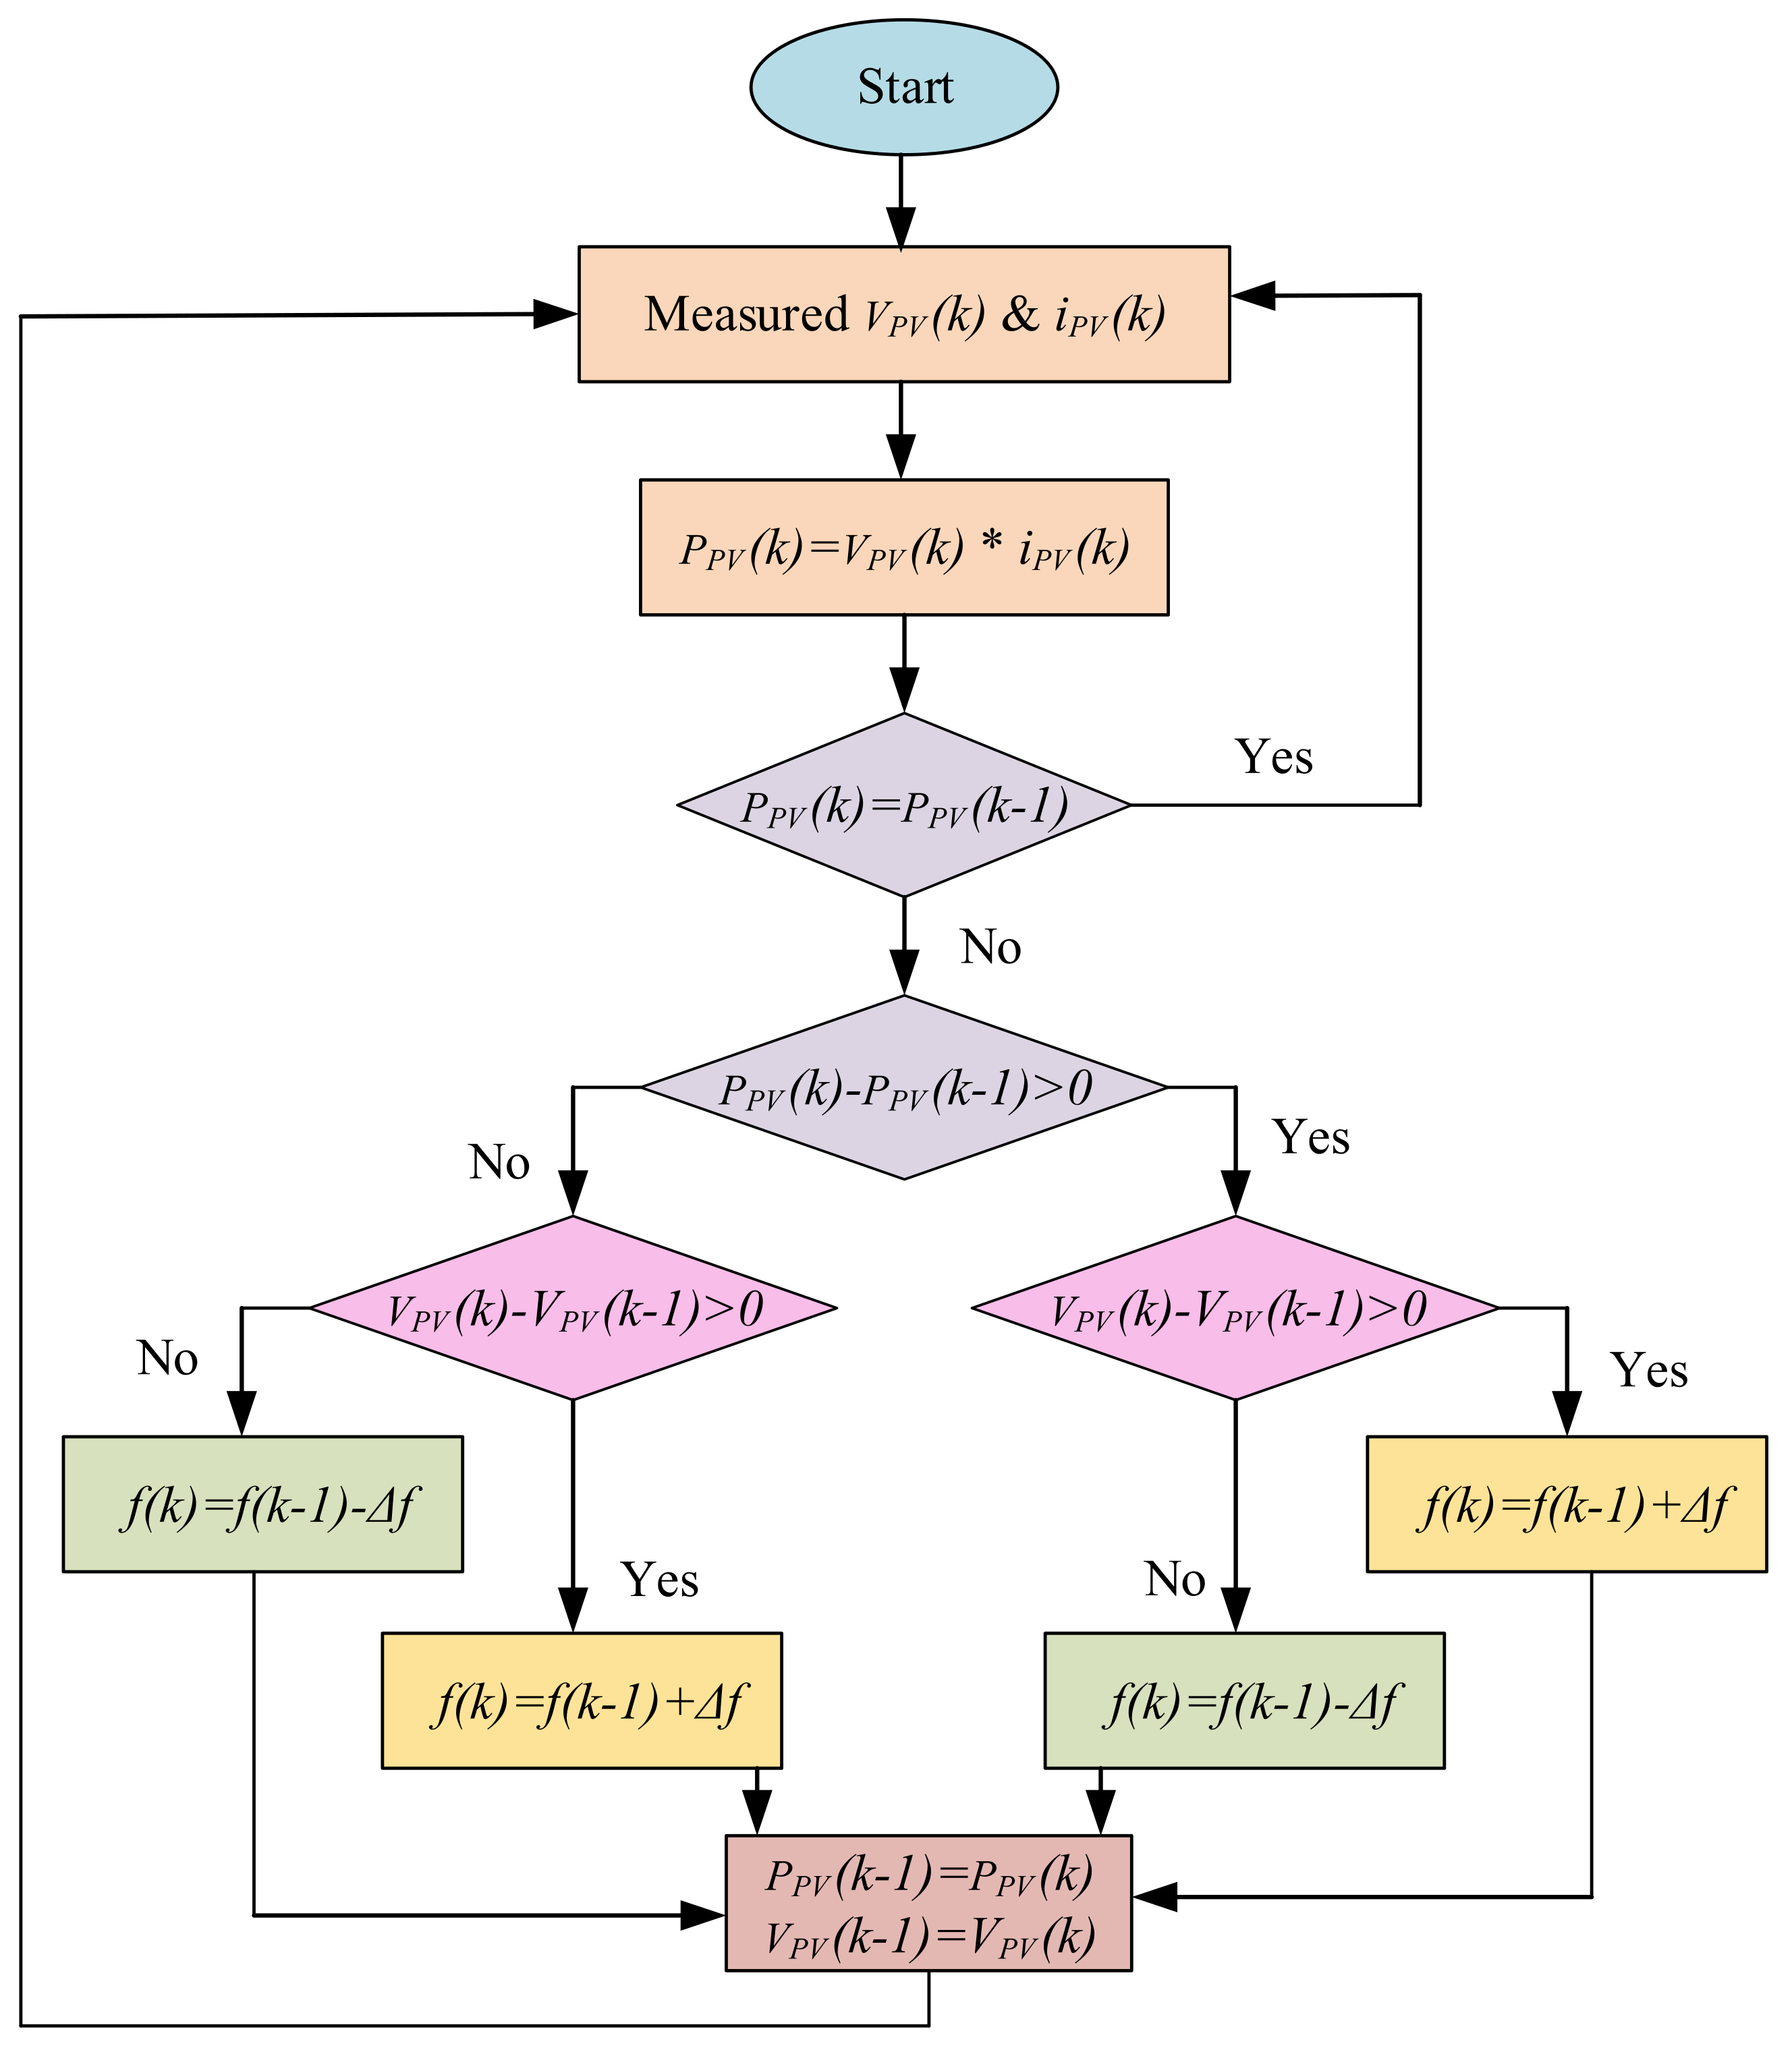
3.2. Maximum Power Point Tracking Algorithm
To optimize the efficiency of the PV system, it is important to produce the maximum output power of the PV modules by applying so-called MPPT algorithms. In healthy conditions, the buck converter of the electronic circuit studied in this work is dedicated to this function. Several algorithms for maximizing the electric power produced by renewable energy have been published in the literature [17,18,19,20,21].
3.3. Output Voltage Control
The regulation of the output voltage is carried out by adjusting the duty cycle D. As mentioned before, we chose that the buck-boost converter operates in continuous conduction mode to ensure a continuous supply of the load. The transfer function of the buck-boost converter under CCM is repeated here:
Based on Equation (7) for a quasi-constant battery voltage, regulating the voltage amounts to regulating the duty cycle D. The regulation of the output voltage goes through the small signal modeling around an operating point of the circuit [25]. Thus, the electrical quantities are considered as purely continuous (operating point) with a small variation around them. In other words, an electrical quantity is the sum of a continuous component Y and an alternating component . The equations considered are those involving the current and the voltage over a switching period. When the switch is ON (), we have:
When the switch is OFF (), we have:
By combining Equations (8) and (9) over a switching period and applying the small signal modeling approach developed in [25], with , and , the following transfer function linking the alternating components of the output voltage to the duty cycle is obtained:
The output voltage can be regulated with a single feedback loop. Figure 10 shows the block diagram of the output voltage regulation of the buck-boost converter. A comparator is used to compare the measured output voltage with the value of the reference voltage . A corrector is used to minimize the error between and . The output of the corrector is the duty cycle D.
Finally, based on the switching frequency f (fixed by the MPPT control for the buck converter) and the duty cycle D (fixed by the output voltage regulation for the buck/boost converter), a single switching pattern (see Figure 7) is produced by a unique Pulse Width Modulation (PWM) block to perform both MPPT and output voltage control in healthy conditions, as well as in the post-fault operation.
4. Rating of the Inductors and
The converter must operate in synchronous mode during both healthy conditions and post-fault operation, which imposes constraints on the inductor and values. For this reason, the rating of the inductors and must be done accordingly.
The limit between continuous and discontinuous conduction is determined when the current through the inductor crosses zero just at the time the switch switches to the ON state. That is when (in this case, we have: ), as shown in Figure 11.
In this case, the average current flowing through the inductor is given by:
where the expression of is given by Equation (4). Therefore, in order for to operate in DCM, the following condition must be verified:
where is the average current flowing through the inductor at maximum output power. Therefore, the range of values of ensuring the operation of the buck converter in DCM is defined by:
Similarly, the charge current at the limit of continuous and discontinuous conduction (for minimum output power) is given by the following equation:
where the expression of is given by:
Therefore, the inductor operates in CCM if the following condition is verified:
Therefore, the range of desired values of is defined by:
5. Simulation Results
5.1. PV System Modeling
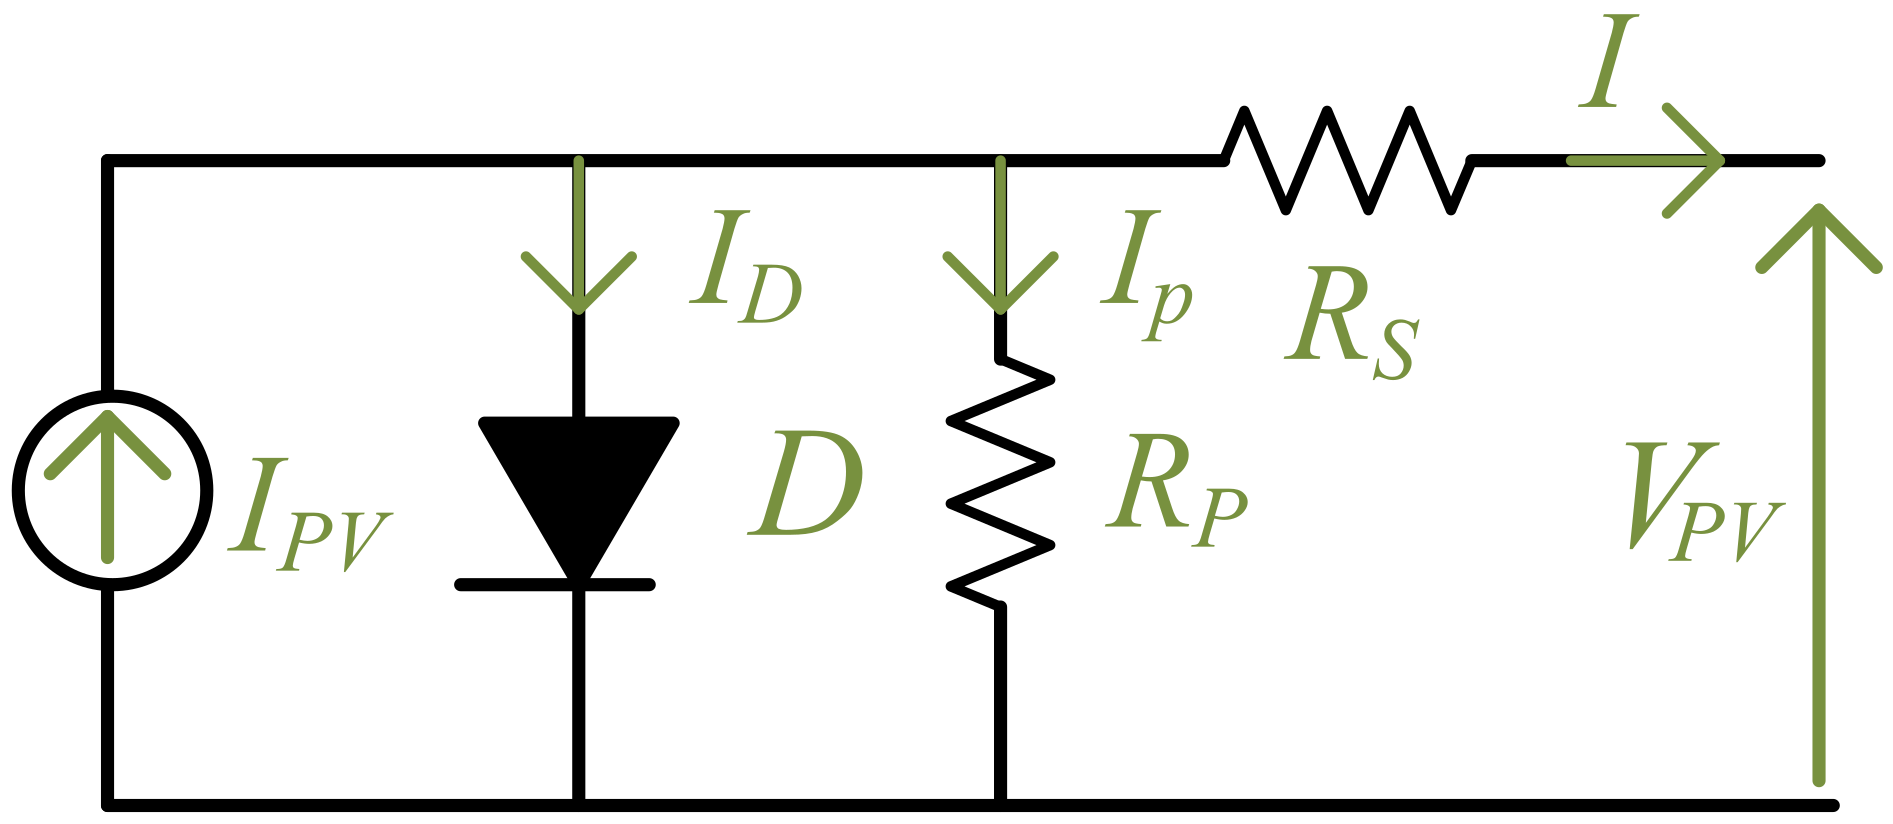
The studied system has been modeled and successfully simulated with the MATLAB/Simulink (R2014a, MathWorks, Natick, Massachusetts, USA) environment. The load of the PV system (Figure 7) is a resistive load with a nominal 20-W power operating in the range of 5–15 V. Hence, the range of variation of the load resistance is defined according to this buck-boost output voltage range and the power supplied to the load by the PV source. Given the focus of this paper on service continuity of the two-stage cascaded converter, a fixed operating point is considered. Therefore, the load resistance has been kept constant during all simulations, and its value is . On the other hand, a classical electrical model of the PV module used in all simulations consists of a current source in parallel with a diode D and a series resistance , as shown in Figure 12 [26]. The resistance is introduced to take into consideration the voltage drops and internal losses due to the flow of the PV current [27].
The I–V curve of a PV cell obtained under uniform solar radiation and given temperature conditions can be expressed as [28]:
where is the current of the PV source, is the diode current, n is the idealizing factor, k is the Boltzmann’s gas constant, the absolute temperature of the cell, q the electron charge and is the dark saturation current, which depends on the temperature.
The simulation parameters for the PV modules and the buck/buck-boost converter are given in Table 1 and Table 2, respectively. The choice of the values of and is based on Equations (13) and (17). In all simulations, we considered two PV panels connected in parallel, each panel supplying a nominal power of 10 W under Standard Test Conditions (STC). The chosen PV panel values for simulation purposes are based on commercial BP solar SX10M PV panels [29]. Thus, the maximal power that can be supplied to the resistive load is 20 W.
A lithium battery simulation model proposed in [30,31] is used in this study. This model is shown in Figure 13. Equation (19) expresses the relation between the output voltage of the battery and its different parameters. It is given by the following expression, where s is the Laplace variable: Equation (19) expresses the relation between the output voltage of the battery and its different parameters. It is given by the following expression, where s is the Laplace variable:
with the output voltage, the no-load voltage, the charge/discharge current and the internal resistance. The parallel circuit ( and ) models the charge transfer between the electrodes and the electrolyte. The capacity of the capacitor is large enough for the voltage to be considered as quasi-constant.
The numerical values of the battery parameters used in simulation are given in Table 3. We chose to fix the nominal battery voltage at 12 V. This battery voltage is lower than the MPP output voltage of the PV panels used, hence the use of the buck converter as the front stage. On the other hand, it can be lower for the load voltage whose range is 5–15 V. Thus, by using the buck-boost converter as the second stage, the resistive load can be correctly powered in the range 5–15 V.
For a reference load voltage fixed at V, the duty cycle D is equal to (see Equation (7)). Thus, the numerical application applied to the transfer function given by Equation (10) gives:
The synthesis of the corrector (transfer function in Figure 10) was done using the tool Sisotool, by analyzing the Bode diagram of the function :
Simulations are performed in two different open circuit switch fault cases, first in the switch and then in the switch , under the same operating conditions.
5.2. Simulation Results: OCF in the Switch
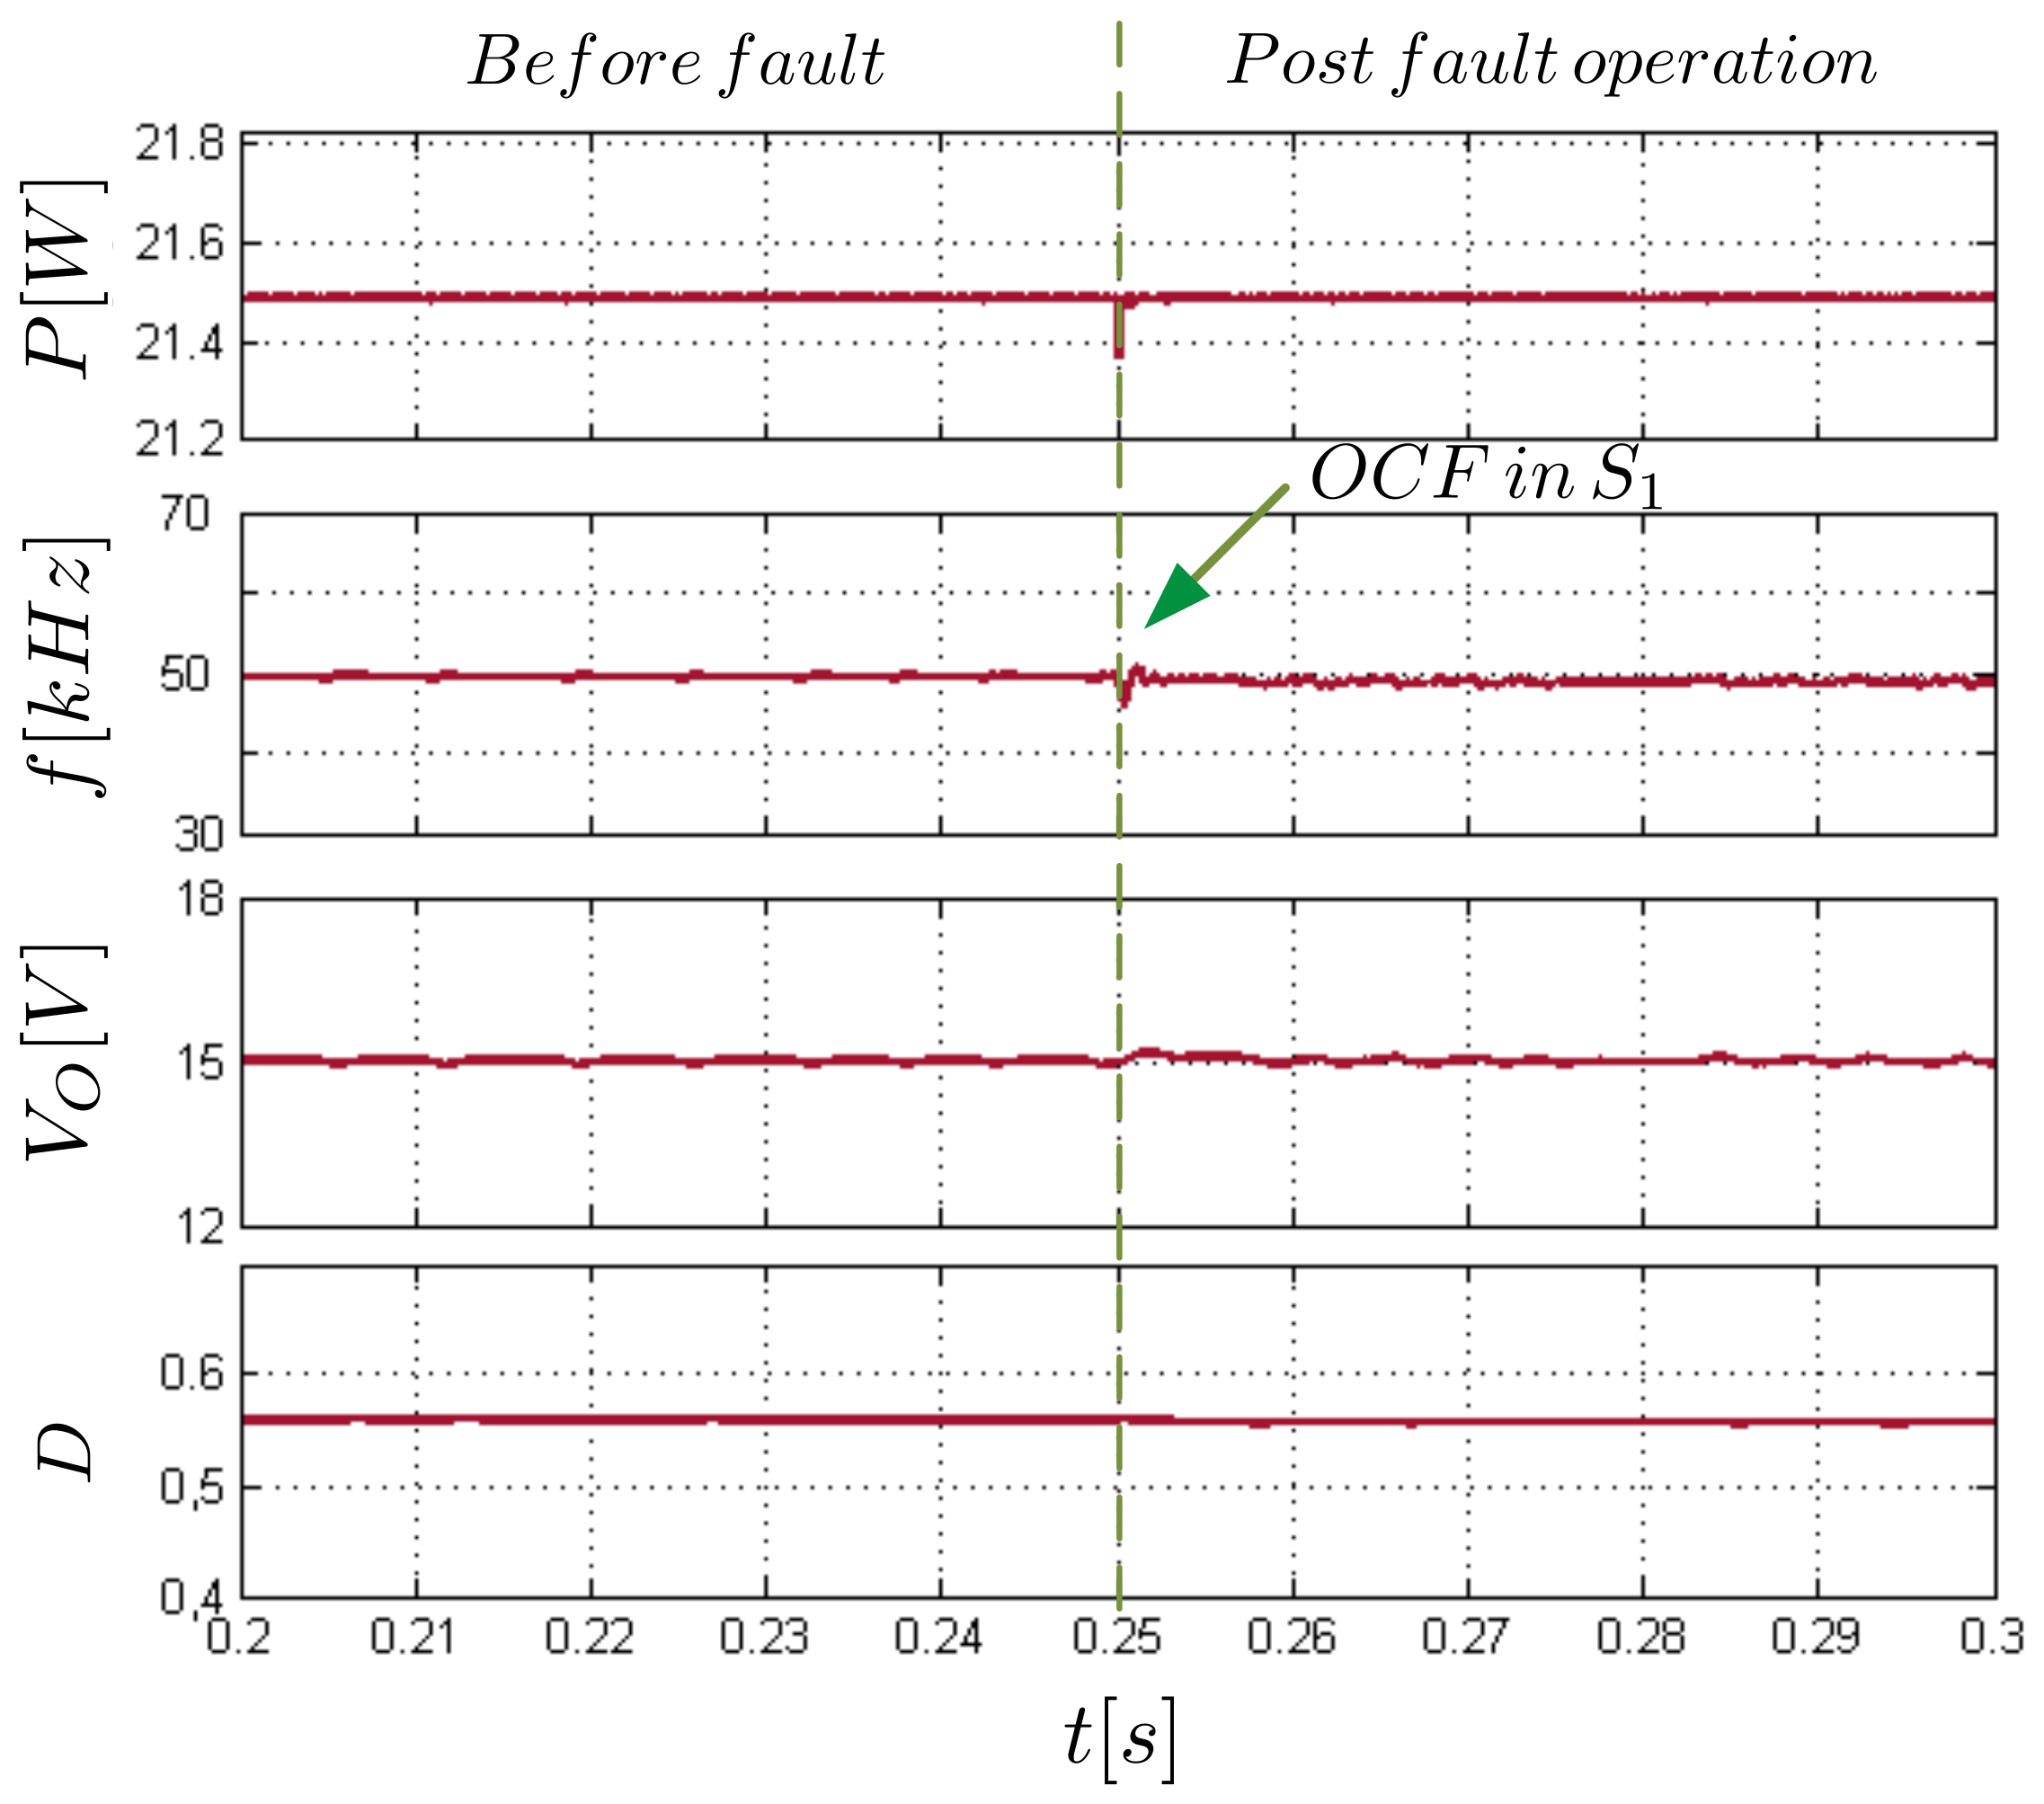
In healthy conditions, the switches and are synchronously controlled, the switch S is open and the diodes and are reverse biased. An OCF is generated by simulation on the switch at time s. This failure results in a disconnection between the PV source and the battery. The simulation results of the electrical power P delivered to the load, the switching frequency f, the output voltage across the load and the duty cycle D are presented in Figure 14 around the OCF occurrence. The fault is supposed to be detected by a suitable fault diagnosis algorithm. The simulated time to detect the switch failure by the fault diagnosis is fixed to 30 s [6].
Before the OCF occurrence, the maximum power produced by the PV modules is equal to W. In steady state, the MPPT control parameter f oscillates around 50 kHz. Once the OCF is generated, the electrical power quickly decreases, and the switching frequency f is disturbed, trying to track a new virtual MPP even if the operating conditions applied to the PV system have not been changed. The output voltage reference is fixed at 15 V. Both and D are slightly perturbed by the OCF. After reconfiguration, the switch S is driven, the system returns to its normal operation and service continuity is successfully performed without any performance degradation.
The currents of all switches and diodes, before and after the OCF generated in at s, are shown in Figure 15. It can be seen that before the failure, the currents , and are zero. After the reconfiguration, the currents and become zero since both and are switched off and disabled. On the other hand, the switch S is turned on, while the diodes and become conducting.
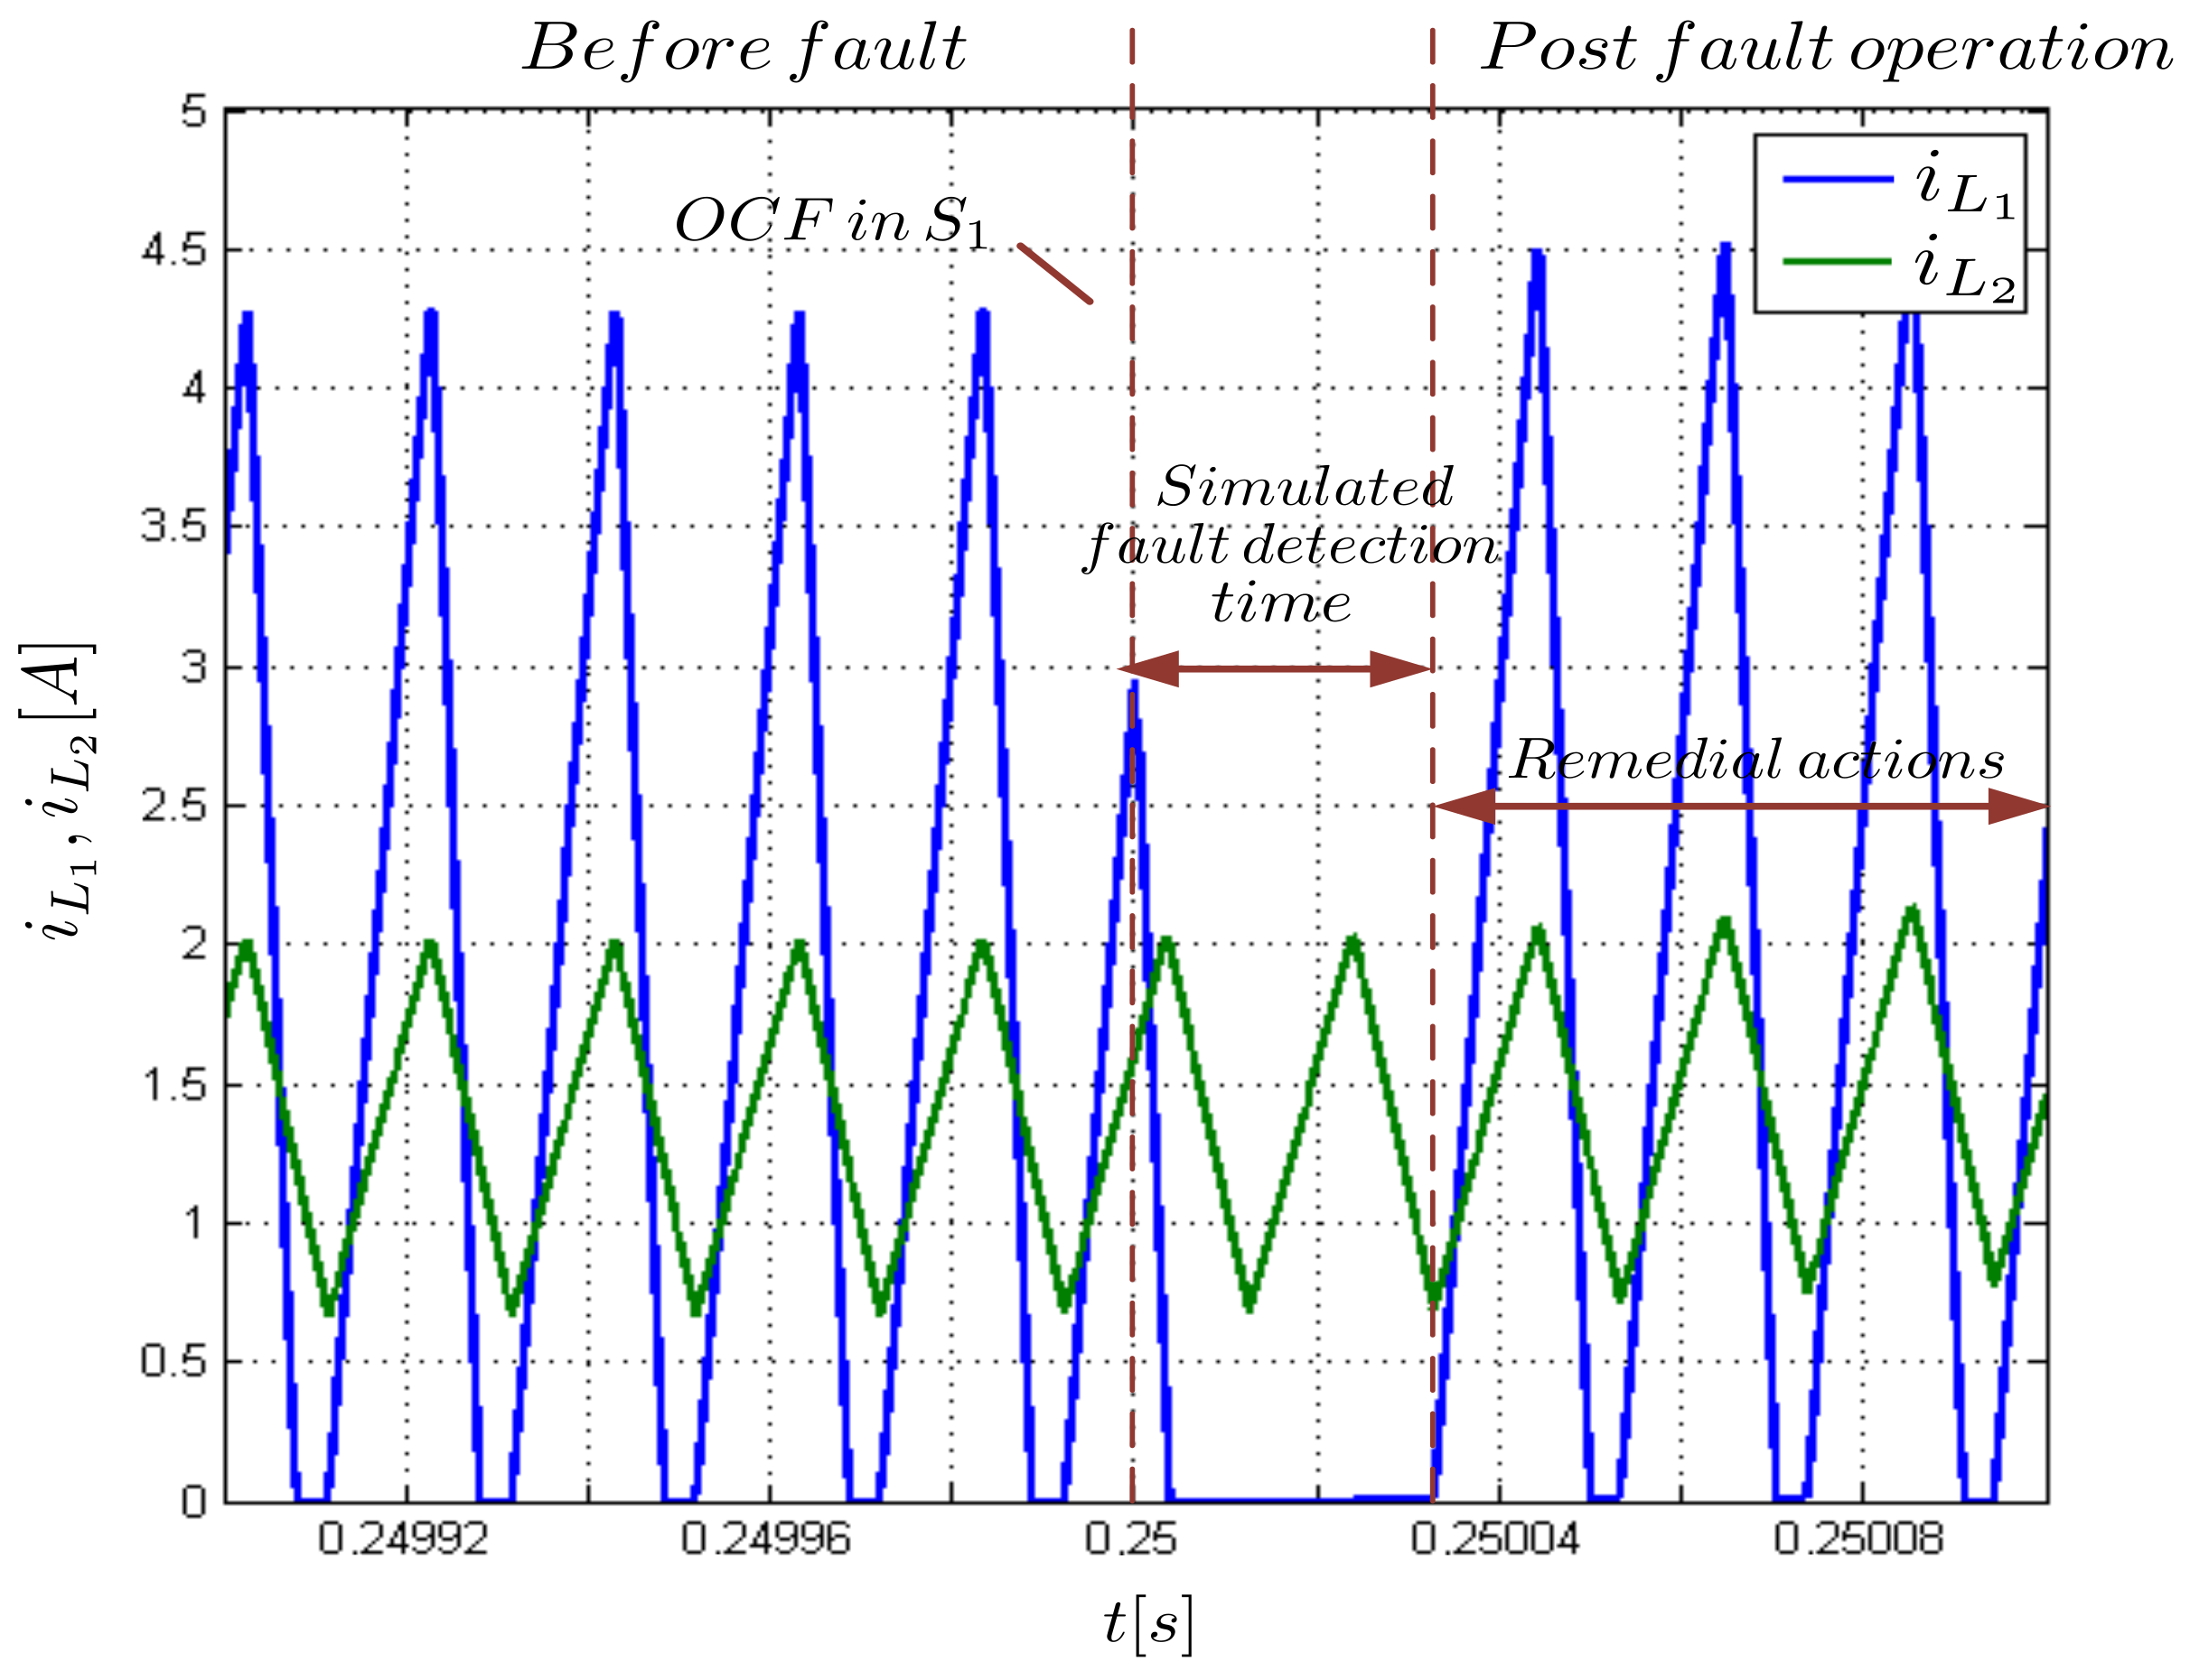
Currents flowing through the inductors and , before and after the OCF, are shown in Figure 16. The current drops to zero during the disconnection time between the PV and the buck converter, while the current is not modified by this failure. The current is slightly disturbed after the reconfiguration of the converter, but returns quickly to its initial waveform. Figure 16 illustrates that the operating modes of inductors (DCM) and (CCM) are respected.
5.3. Simulation Results: OCF in the Switch
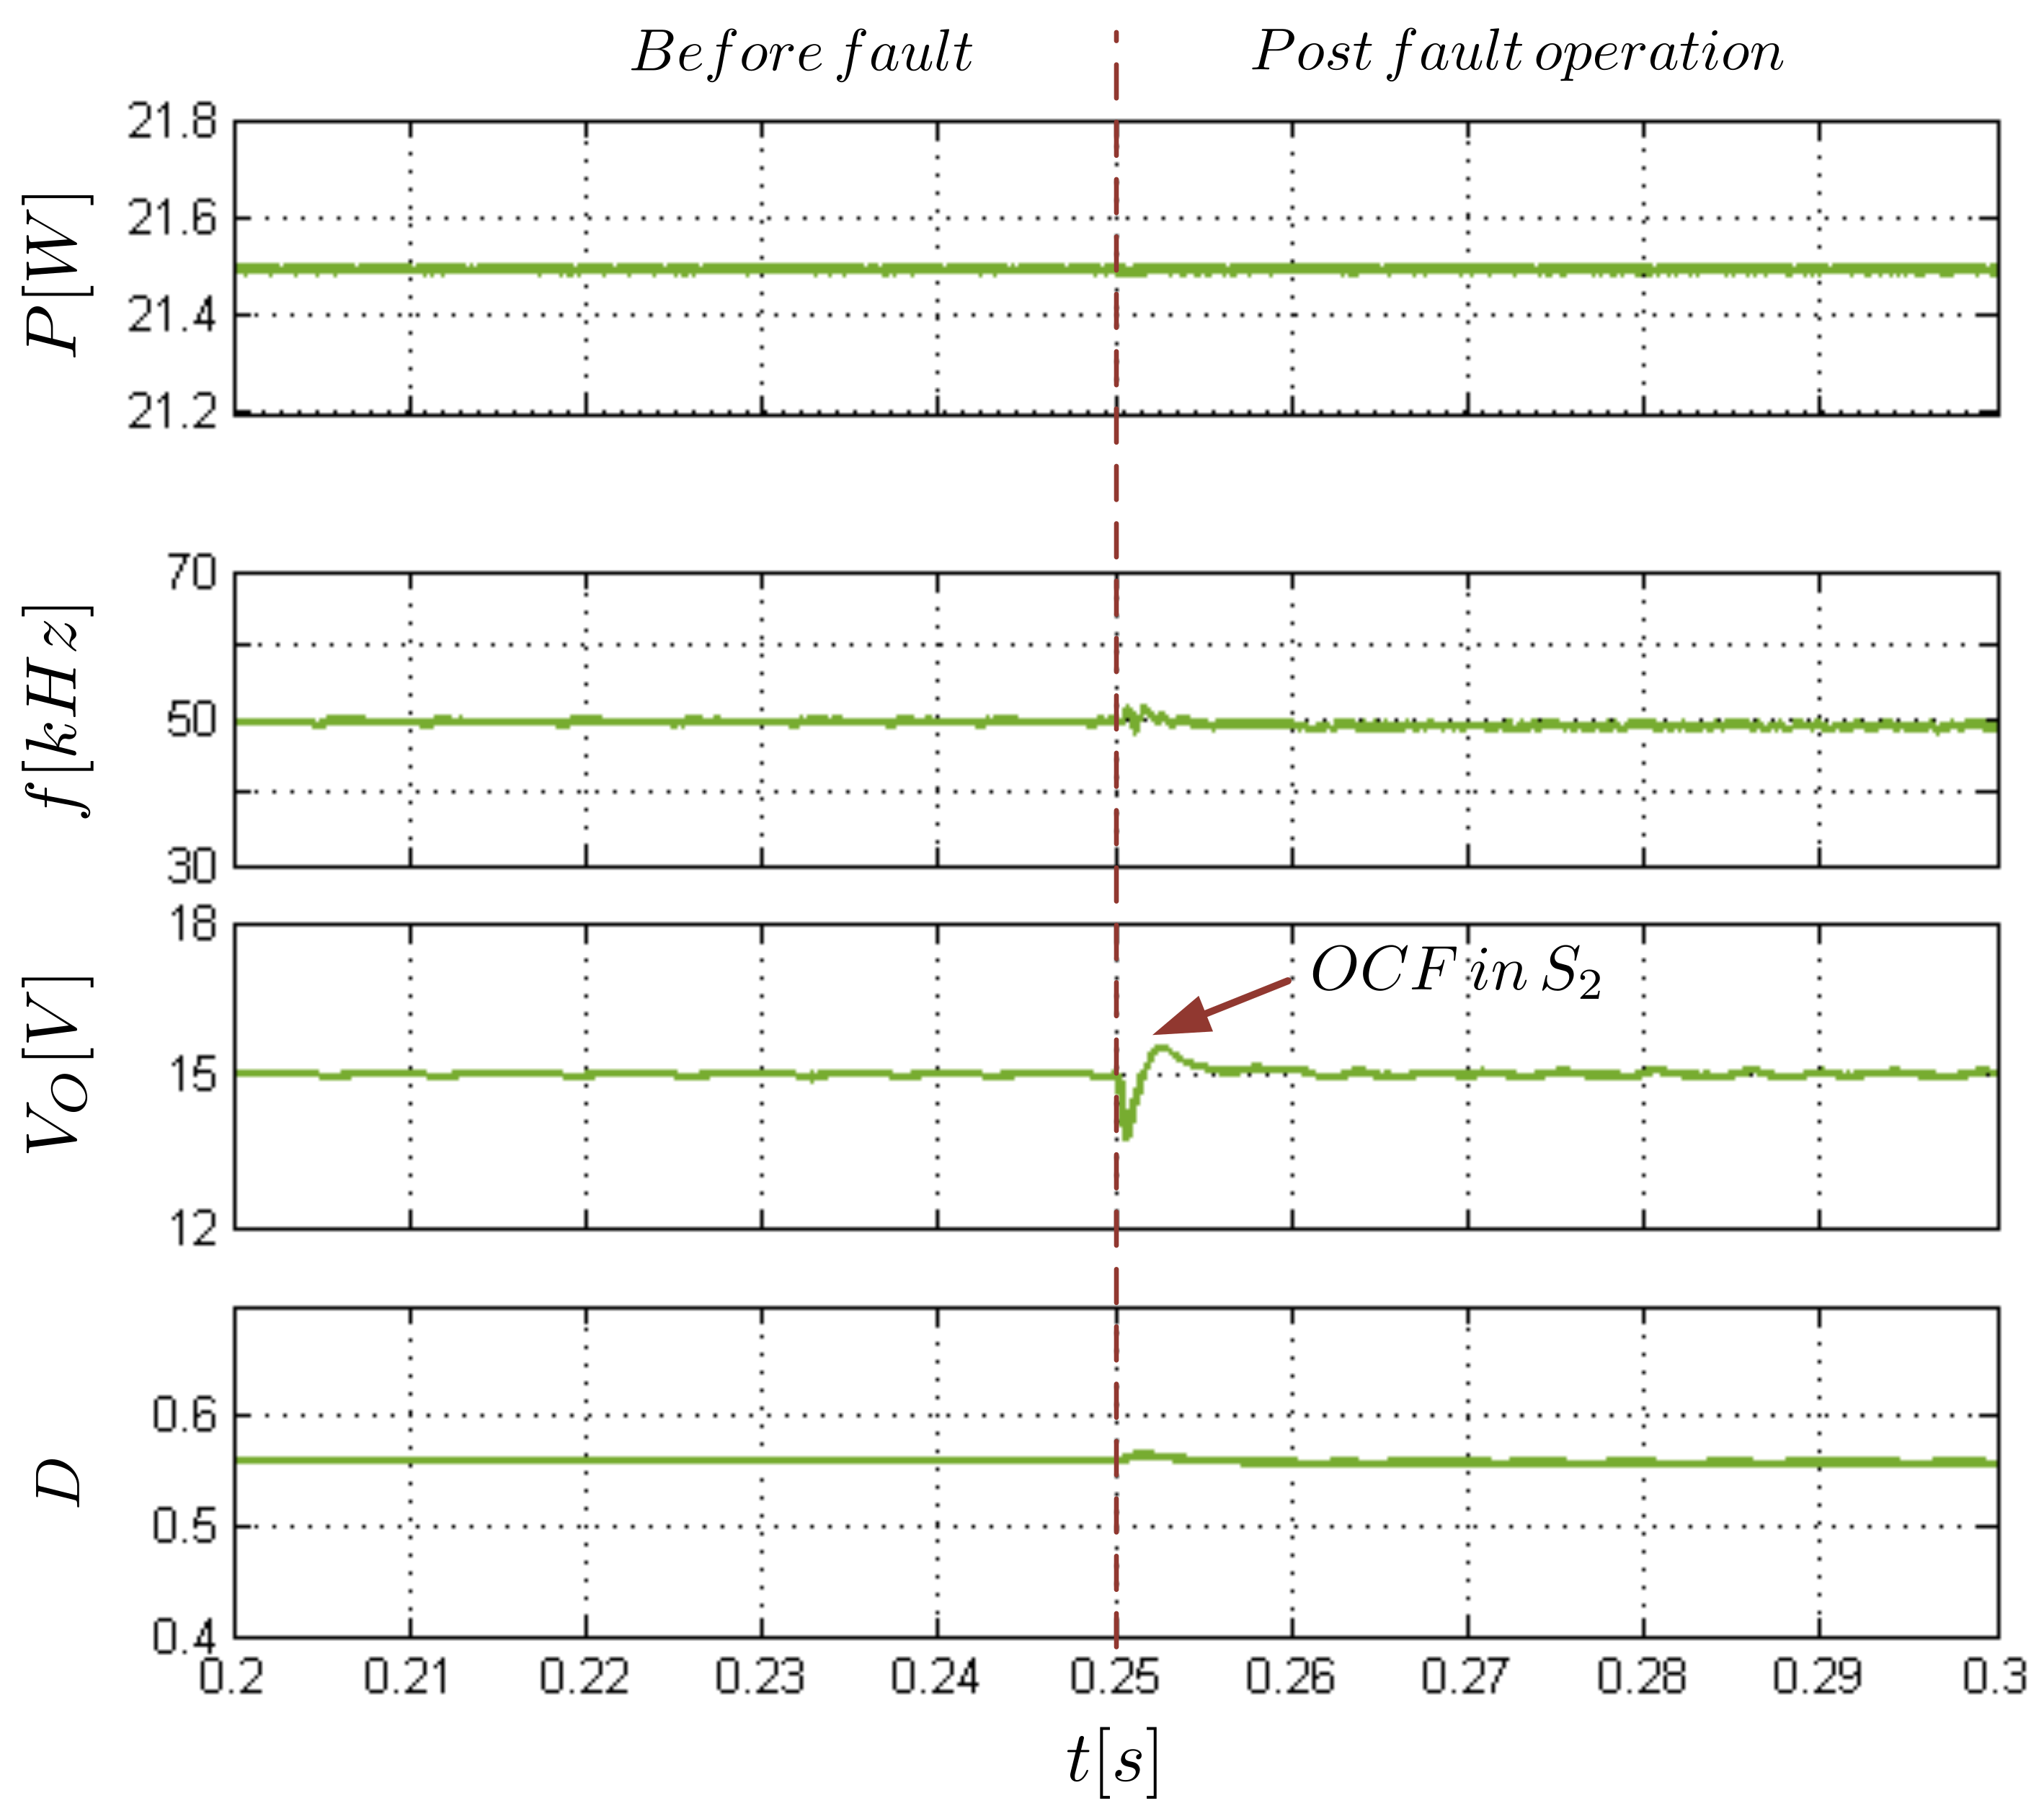
The switch is also susceptible to an OCF. In this case, the converter reconfiguration technique discussed in previous section is applied. Thus, after the detection of the failure in , the two switches and will be opened, and only the switch S will be controlled. An OCF is generated on the switch at time s. The operating conditions are the same as in the previous section. Under this OCF, the battery is disconnected from the load during a short time. Figure 17 shows the waveforms of P, f, and D around the OCF generated in at s.
The electrical power generated by the PV modules is not modified. The duty cycle is first disturbed, thus affecting the output voltage. After the converter reconfiguration, the system returns to nominal operation, and the output voltage is again correctly regulated.
The currents through all the switches (, and S) and the diodes (, , and ) around the OCF are shown in Figure 18. It can be seen that before the fault occurrence, the currents , and are equal to zero. After reconfiguration, the currents and become equal to zero since the switches and are switched off. Then, the switch S is controlled, and the diodes and are no longer reverse biased.
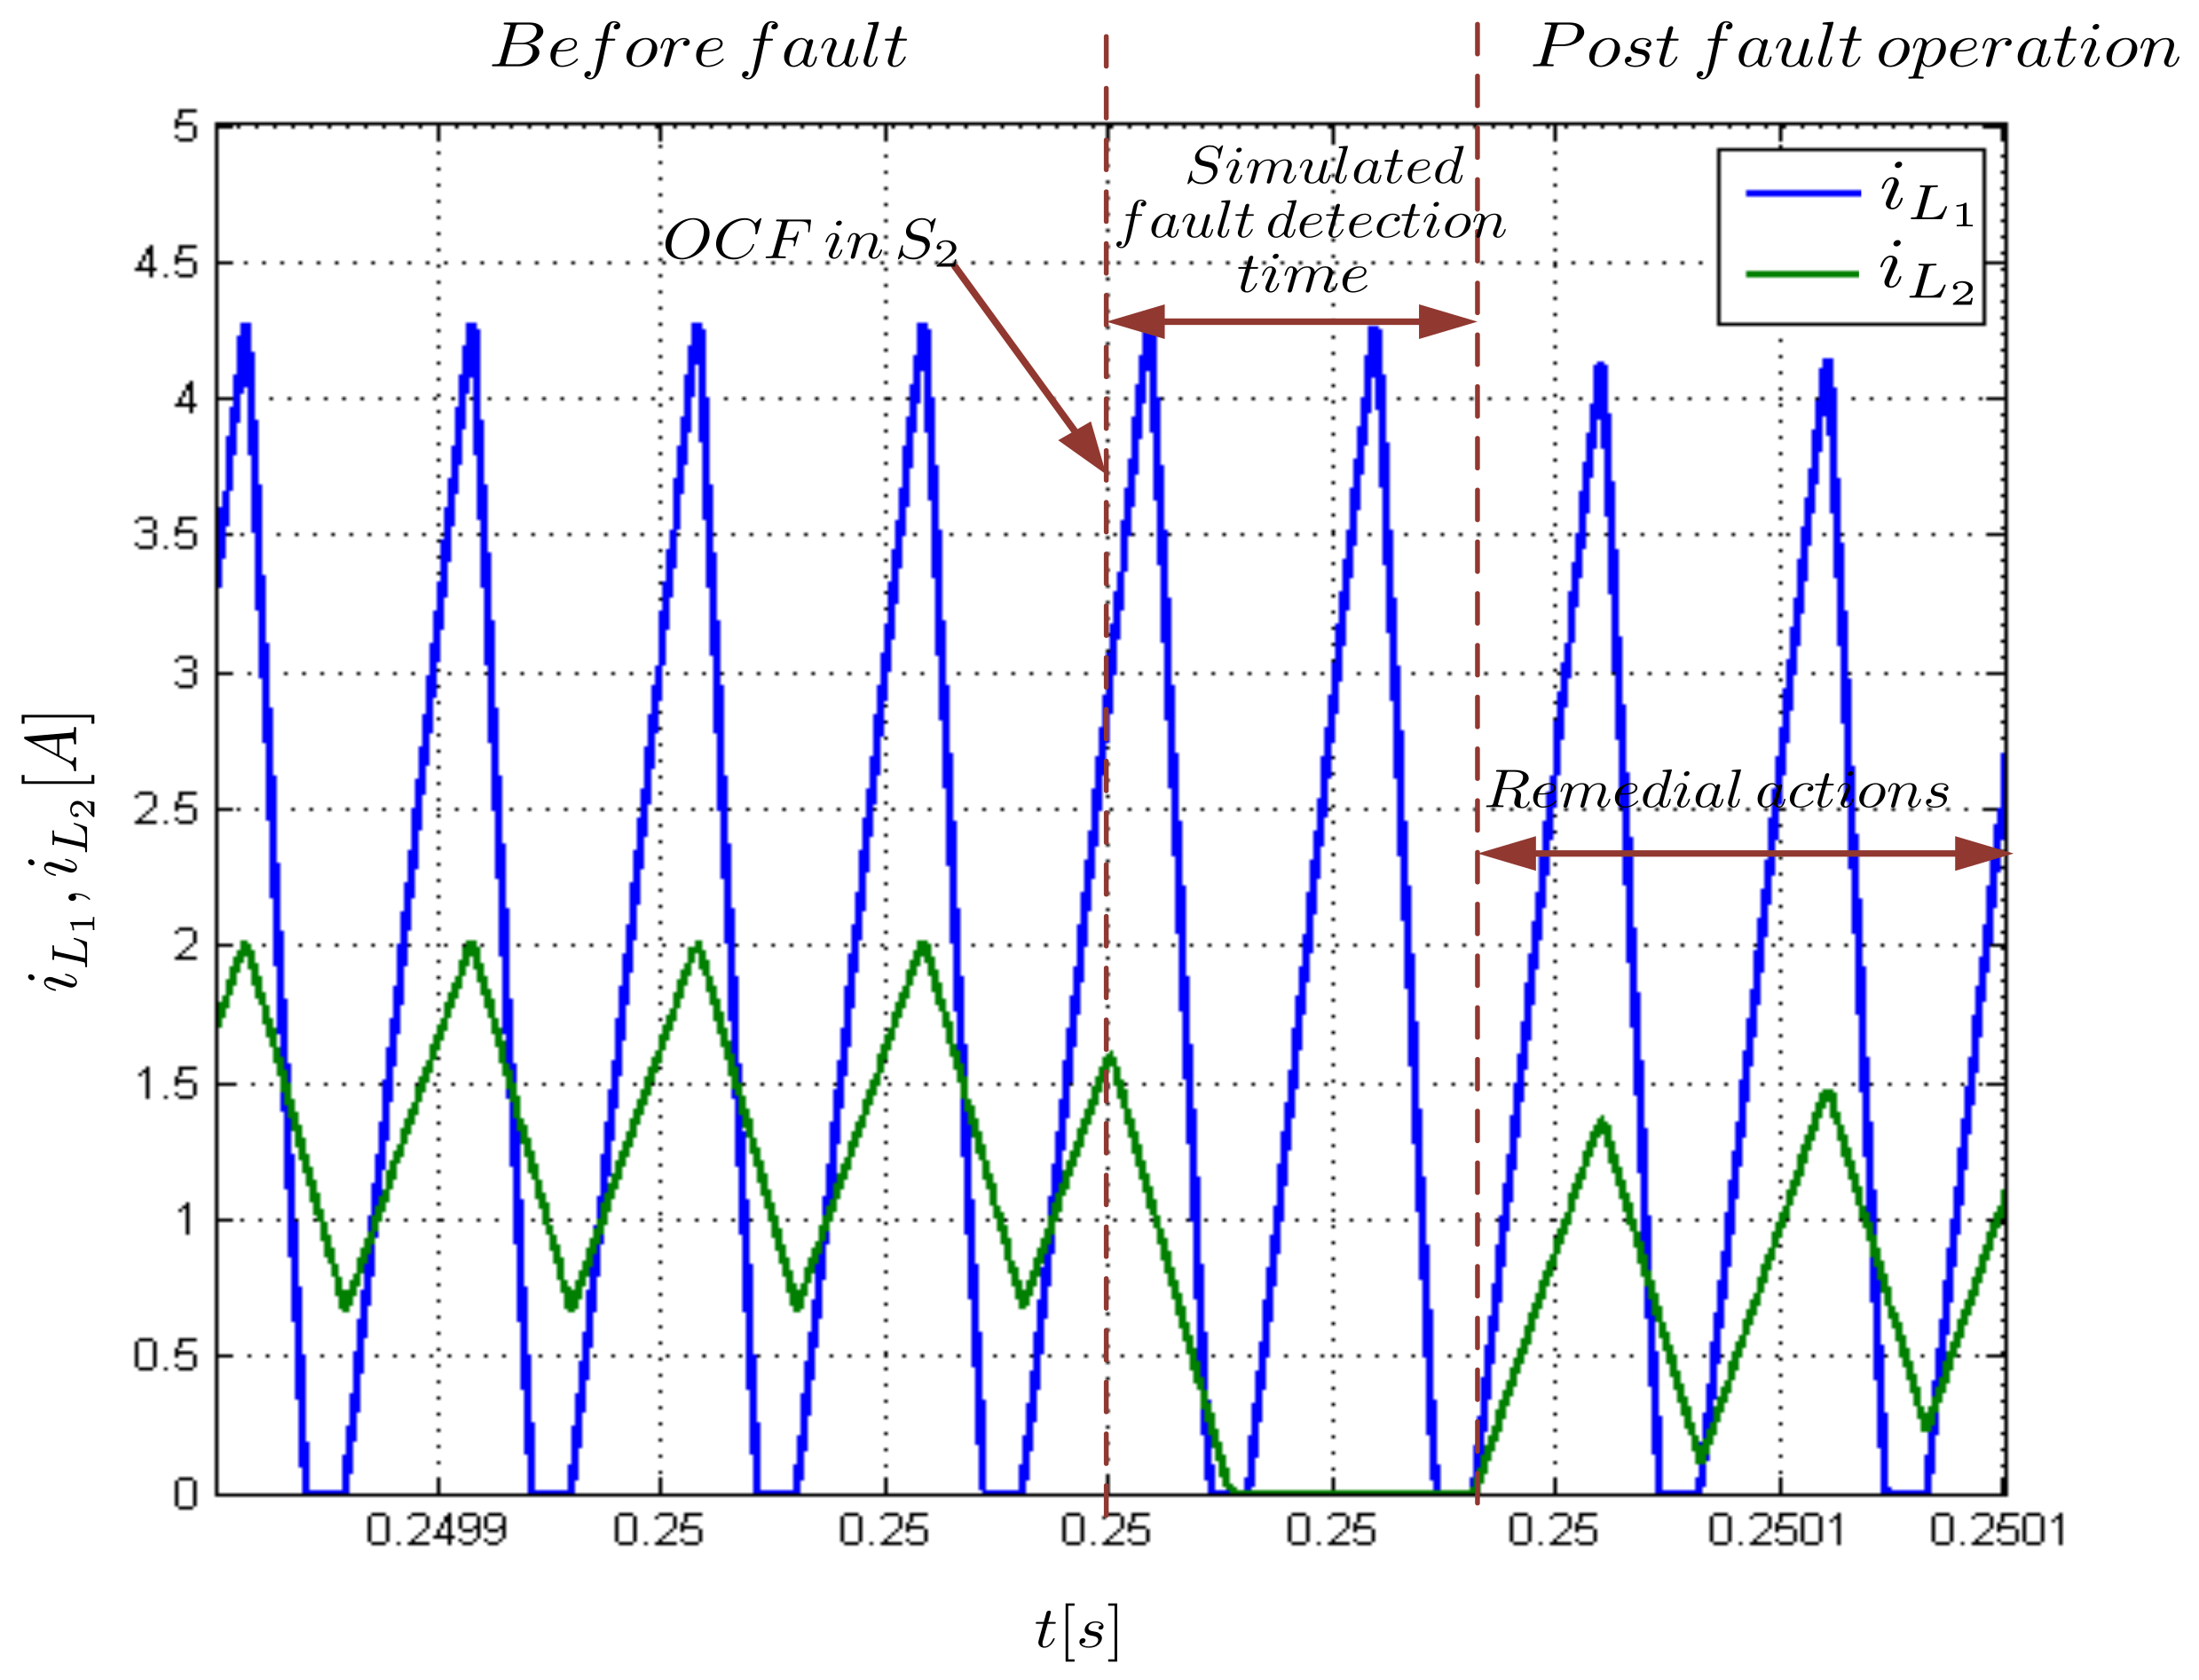
Figure 19 shows the waveforms of the inductors currents and . The current is not disturbed by the occurrences of the OCF, while the current drops to zero because of the temporary disconnection between the battery and the load. After reconfiguration of the converter, the PV system returns to its normal operating mode. As in the case of an OCF in , the inductor operates in DCM, while the inductor operates in CCM.
6. Discussion and Conclusions
In the previous sections, we have presented an original approach allowing one to guarantee the service continuity at full power of a cascaded DC-DC circuit, under both OCF and/or SCF, as well, bearing in mind that in all cases, an SCF after the cut of the short circuit path will be considered as an OCF. In healthy conditions, the cascaded circuit behaves as a usual structure where both stages are single-switch non-isolated DC-DC converters, the first one performing a MPPT operation, whereas the second one is continuously feeding the connected DC load. The non-isolated DC-DC converters used can be of any type: a buck, a boost or a buck-boost. In the considered application, the first stage is a buck converter, whereas the second one is a buck-boost converter. Nevertheless, depending on the application requirements, any other combination of single-switch non-isolated DC-DC converters is possible and may be used.
In a general manner, the new fault-tolerant design approach proposed in this paper is based on the use of a redundant synchronous switch. The design of the fault-tolerant cascaded circuit consists first of moving the two switches of both non-isolated DC-DC converters towards each other while maintaining the same electrical behavior of the overall circuit under synchronous control, as depicted in Section 2 (Figure 5) in the case of the buck/buck-boost circuit. Thus, in the resulting equivalent circuit, the two switches share a common node (gate, drain or source). Whenever two switches share a common node, they can be replaced with an equivalent synchronous switch. Here, a common drain-source node is shared between the two switches of the buck/buck-boost converters, and the equivalent synchronous switch for this structure is presented in Figure 6. To obtain the final fault-tolerant conversion circuit, the suitable three-port equivalent synchronous switch from Figure 6 composed of one switch and two diodes is added to the initial DC-DC circuit as the redundant counterpart, which will be used to replace the two main switches in an offline scheme. In the OCF case occurring on one of the two switches of the DC-DC circuit, both switches and , usually controlled in healthy conditions, are forced to be opened and will be functionally disabled. However, the single redundant switch S is then driven to ensure the service continuity of the fault-tolerant circuit. The new conversion circuit after remedial actions is different from the one before the fault diagnosis. Nevertheless, the two topologies (in healthy conditions or post-fault operation) have the same electrical behavior, and the same synchronous control can be applied to both of them.
Finally, the effectiveness of the service continuity of the studied buck/buck-boost converter under synchronous control has been validated through simulations. Because of the applied synchronous control, only two control parameters are available: duty cycle D and frequency f, requiring different conduction modes for the two DC-DC converters. This means that one converter must operate in DCM, whereas the other one in CCM. In our application case, we have chosen to control the first stage buck converter in DCM and the second stage buck-boost converter in CCM, mainly for output voltage regulation and continuous load feeding purposes. It is clear that the use of a first stage buck converter introduces some additional PV current ripples, worsened with the DCM mode. Nevertheless, in the same spirit of the presented approach, another first stage non-isolated DC-DC converter (boost or buck-boost) can be chosen to avoid these drawbacks, if allowed by the application requirements. Similarly, as for the first stage, the choice of the second stage non-isolated DC-DC converter can be reconsidered. However, the main goal of our contribution was to present a new fault-tolerant design approach applied on two cascaded DC-DC converters, illustrated in the case of a buck/buck-boost converter, but not exclusively limited to this combination.
Moreover, it should be noticed that the presented switching frequency-based MPPT introduces also some drawbacks. Indeed, the same switching pattern (D,f) is applied to both switches and introduces additional switching losses, mainly because it is not possible to control the second stage switch operating in CCM at a frequency f as low as possible independently, f being fixed by the MPPT algorithm. Thus, no additional fault-tolerant control block is required. Consequently, the proposed PV system with service continuity capability can operate with the same performance after an OCF, without modifying the control strategy used. To overcome this drawback, one solution could consist of applying an asynchronous control in healthy conditions and the synchronous control detailed in this work only in post-fault mode. In this case, the fault-tolerant control would be more complicated than the one presented here, but would allow controlling the two converters in healthy conditions with different frequency values. This scenario is one for future work, on which we are currently working.
Author Contributions
All authors contributed equally to this work.
Conflicts of Interest
The authors declare no conflict of interest.
References
- Katiraei, F.; Iravani, R.; Hatziargyriou, N.; Dimeas, A. Microgrids management. IEEE Power Energy Mag. 2008, 6. [Google Scholar] [CrossRef]
- Barbosa, P.G.; Braga, H.A.C.; Rodrigues, M.D.C.B.; Teixeira, E.C. boost current multilevel inverter and its application on single-phase grid-connected photovoltaic systems. IEEE Trans. Ind. Electron. 2006, 21, 1116–1124. [Google Scholar] [CrossRef]
- Amaral, A.; Cardoso, A. On line fault detection of aluminium electrolytic capacitors in step-down DC-DC converters using input current and output voltage ripple. IET Power Electron. 2012, 5, 315–322. [Google Scholar] [CrossRef]
- Wu, R.; Blaabjerg, F.; Wang, H.; Liserre, M.; Iannuzzo, F. Catastrophic failure and fault-tolerant design of IGBT power electronic converters—An overview. In Proceedings of the 39th Annual Conference of the IEEE Industrial Electronics Society (IECON 2013), Vienna, Austria, 10–13 November 2013; pp. 507–513. [Google Scholar]
- Jamshidpour, E.; Poure, P.; Saadate, S. Photovoltaic systems reliability improvement by real-time FPGA-based switch failure diagnosis and fault-tolerant DC-DC converter. IEEE Trans. Ind. Electron. 2015, 62, 7247–7255. [Google Scholar] [CrossRef]
- Shahbazi, M.; Jamshidpour, E.; Poure, P.; Saadate, S.; Zolghadri, M.R. Open-and short-circuit switch fault diagnosis for non-isolated DC-DC converters using field programmable gate array. IEEE Trans. Ind. Electron. 2013, 60, 4136–4146. [Google Scholar] [CrossRef]
- Pei, X.; Nie, S.; Chen, Y.; Kang, Y. Open-circuit fault diagnosis and fault-tolerant strategies for full-bridge DC-DC converters. IEEE Trans. Power Electron. 2012, 27, 2550–2565. [Google Scholar] [CrossRef]
- Chen, Y.; Pei, X.; Nie, S.; Kang, Y. Monitoring and diagnosis for the DC-DC converter using the magnetic near field waveform. IEEE Trans. Ind. Electron. 2011, 58, 1634–1647. [Google Scholar] [CrossRef]
- Nie, S.; Pei, X.; Chen, Y.; Kang, Y. Fault diagnosis of PWM DC-DC converters based on magnetic component voltages equation. IEEE Trans. Power Electron. 2014, 29, 4978–4988. [Google Scholar] [CrossRef]
- Park, T.; Kim, T. Novel fault tolerant power conversion system for hybrid electrical vehicles. In Proceedings of the Vehicle Power and Propulsion Conference (VPPC), Chicago, IL, USA, 6–9 September 2011; pp. 1–6. [Google Scholar]
- Ribeiro, E.; Cardoso, A.J.M.; Boccaletti, C. Fault tolerant strategy for a photovoltaic DC-DC converter. IEEE Trans. Power Electron. 2013, 28, 3008–3018. [Google Scholar] [CrossRef]
- Zhao, J.; Iu, H.H.; Fernando, T.; An, L.; Lu, D.D.C. Design of a non-isolated single-switch three-port DC-DC converter for standalone PV-battery power system. In Proceedings of the 2015 IEEE International Symposium on Circuits and Systems (ISCAS), Lisbon, Portugal, 24–27 May 2015; pp. 2493–2496. [Google Scholar]
- Zhao, J.; Iu, H.H.; Fernando, T. The design of cascaded DC-DC converters with single-switch PWM and PFM for standalone PV power applications. In Proceedings of the IEEE 3rd International Future Energy Electronics Conference and ECCE Asia, Kaohsiung, Taiwan, 3–7 June 2017; pp. 122–126. [Google Scholar]
- Suntio, T.; Messo, T.; Aapro, A.; Kivimäki, J.; Kuperman, A. Review of PV generator as an input source for power electronic converters. Energies 2017, 10, 1076. [Google Scholar] [CrossRef]
- Wu, T.F.; Yu, T.H. Unified approach to developing single-stage power converters. IEEE Trans. Aerosp. Electron. Syst. 1998, 34, 211–223. [Google Scholar]
- Siouane, S.; Jovanović, S.; Poure, P. Service Continuity of PV Synchronous buck/buck-boost Converter with Energy Storage. In Proceedings of the IEEE International Conference on Environment and Electrical Engineering (EEEIC), Milan, Italy, 6–9 June 2017; pp. 1–6. [Google Scholar]
- Kwon, J.M.; Nam, K.H.; Kwon, B.H. Photovoltaic power conditioning system with line connection. IEEE Trans. Ind. Electron. 2006, 53, 1048–1054. [Google Scholar] [CrossRef]
- Pandey, A.; Dasgupta, N.; Mukerjee, A.K. A simple single-sensor MPPT solution. IEEE Trans. Power Electron. 2007, 22, 698–700. [Google Scholar] [CrossRef]
- Jain, S.; Agarwal, V. A new algorithm for rapid tracking of approximate maximum power point in photovoltaic systems. IEEE Power Electron. Lett. 2004, 2, 16–19. [Google Scholar] [CrossRef]
- De Brito, M.A.G.; Galotto, L.; Sampaio, L.P.; e Melo, G.D.A.; Canesin, C.A. Evaluation of the main MPPT techniques for photovoltaic applications. IEEE Trans. Ind. Electron. 2013, 60, 1156–1167. [Google Scholar] [CrossRef]
- Esram, T.; Kimball, J.W.; Krein, P.T.; Chapman, P.L.; Midya, P. Dynamic maximum power point tracking of photovoltaic arrays using ripple correlation control. IEEE Trans. Power Electron. 2006, 21, 1282–1291. [Google Scholar] [CrossRef]
- Femia, N.; Petrone, G.; Spagnuolo, G.; Vitelli, M. Optimization of perturb and observe maximum power point tracking method. IEEE Trans. Power Electron. 2005, 20, 963–973. [Google Scholar] [CrossRef]
- Bianconi, E.; Calvente, J.; Giral, R.; Mamarelis, E.; Petrone, G.; Ramos-Paja, C.A.; Spagnuolo, G.; Vitelli, M. A Fast Current-Based MPPT Technique Employing Sliding Mode Control. IEEE Trans. Ind. Electron. 2013, 60, 1168–1178. [Google Scholar] [CrossRef]
- Rakhshan, M.; Vafamand, N.; Khooban, M.H.; Blaabjerg, F. Maximum Power Point Tracking Control of Photovoltaic Systems: A Polynomial Fuzzy Model-Based Approach. IEEE J. Emerg. Sel. Top. Power Electron. 2018, 6, 292–299. [Google Scholar] [CrossRef]
- Fronczak, K.C. Stability Analysis of Switched DC-DC boost Converters for Integrated Circuits. Master’s Thesis, Rochester Institute of Technology, New York, NY, USA, 2013. [Google Scholar]
- Villalva, M.G.; Gazoli, J.R.; Filho, E.R. Comprehensive approach to modeling and simulation of photovoltaic arrays. IEEE Trans. Power Electron. 2009, 24, 1198–1208. [Google Scholar] [CrossRef]
- Tsai, H.L. Insolation-oriented model of photovoltaic module using Matlab/Simulink Solar Energy. Sol. Energy 2010, 84, 1318–1326. [Google Scholar] [CrossRef]
- Suskis, P.; Galkin, I. Enhanced photovoltaic panel model for Matlab-Simulink environment considering solar cell junction capacitance. In Proceedings of the IEEE Industrial Electronics Society Conference (IECON), Vienna, Austria, 10–13 November 2013; pp. 1613–1618. [Google Scholar]
- Energy Matters. Available online: https://www.energymatters.com.au/bp-solar-panel-10watt-12volt-polycrystalline-p-7.html (accessed on 23 May 2018).
- Tani, A.; Camara, M.B.; Dakyo, B. Energy management in the decentralized generation systems based on renewable energy—Ultracapacitors and battery to compensate the wind/load power fluctuations. IEEE Trans. Ind. Appl. 2015, 51, 1817–1827. [Google Scholar] [CrossRef]
- Jang, J.; Yoo, J. Equivalent circuit evaluation method of lithium polymer battery using bode plot and numerical analysis. IEEE Trans. Energy Convers. 2011, 26, 290–298. [Google Scholar] [CrossRef]
Figure 1.
Classical structure of a PV energy harvesting system.

Figure 2.
Typical service continuity approaches.
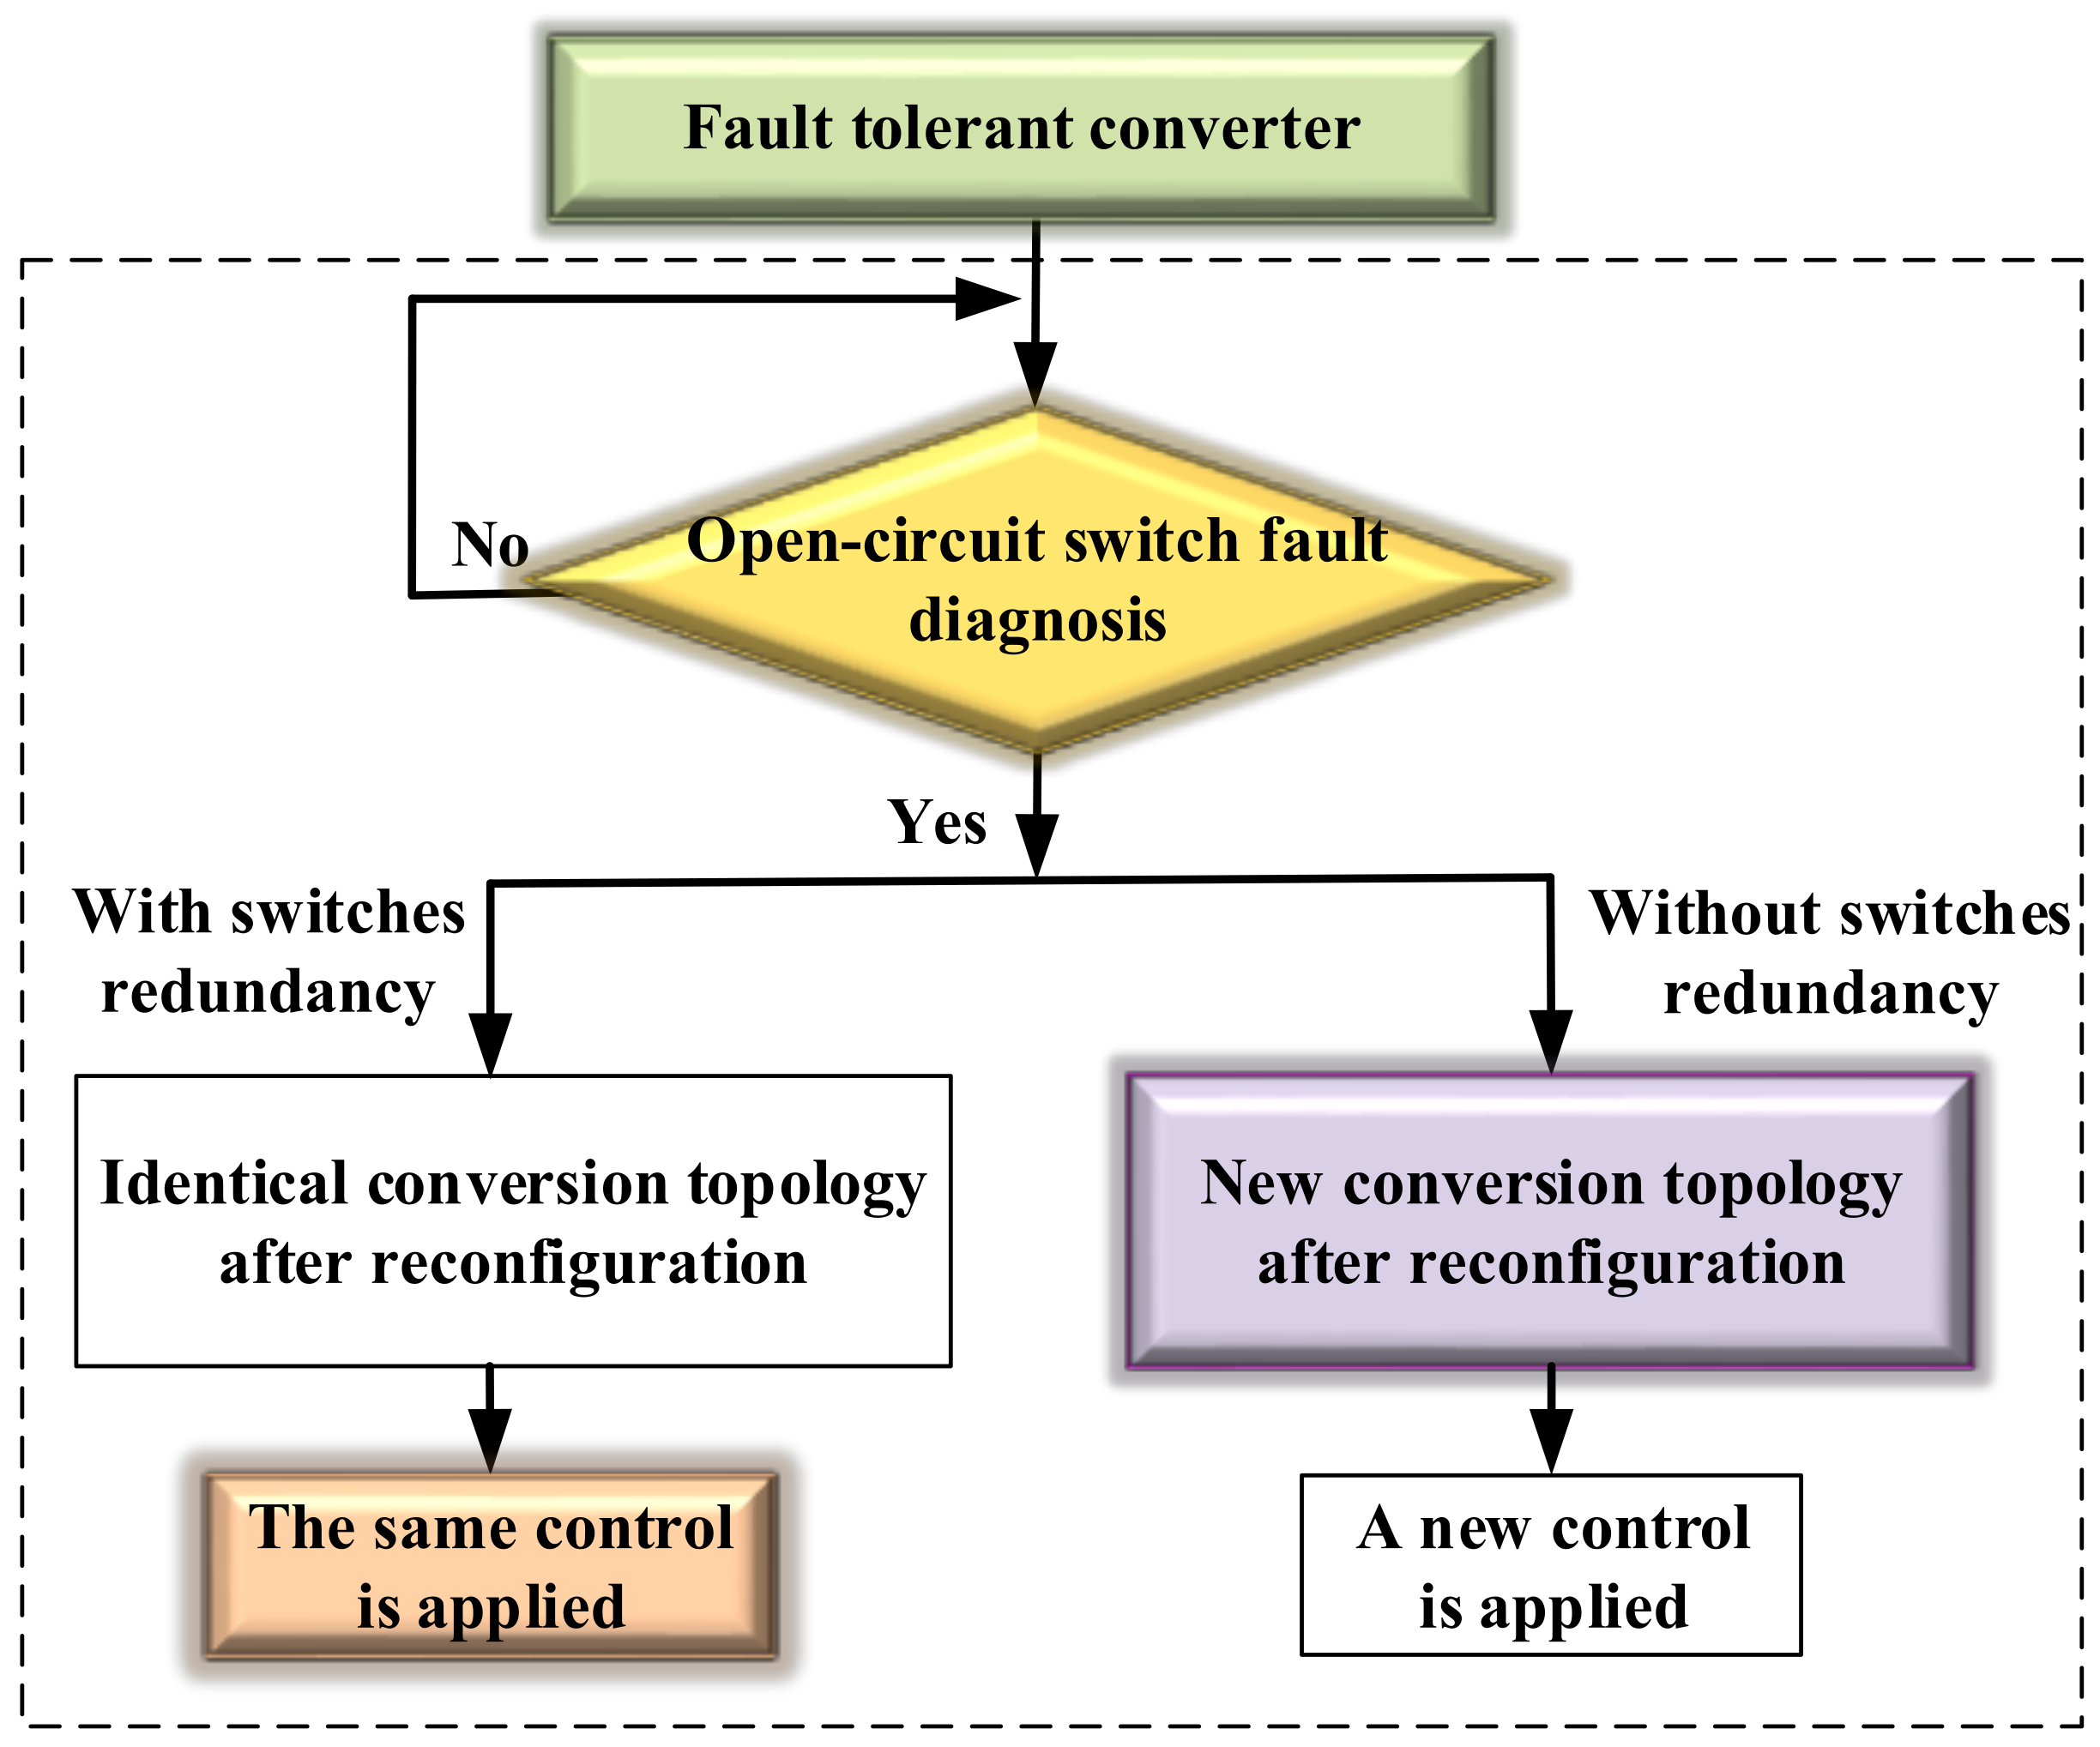
Figure 3.
The proposed service continuity approach.
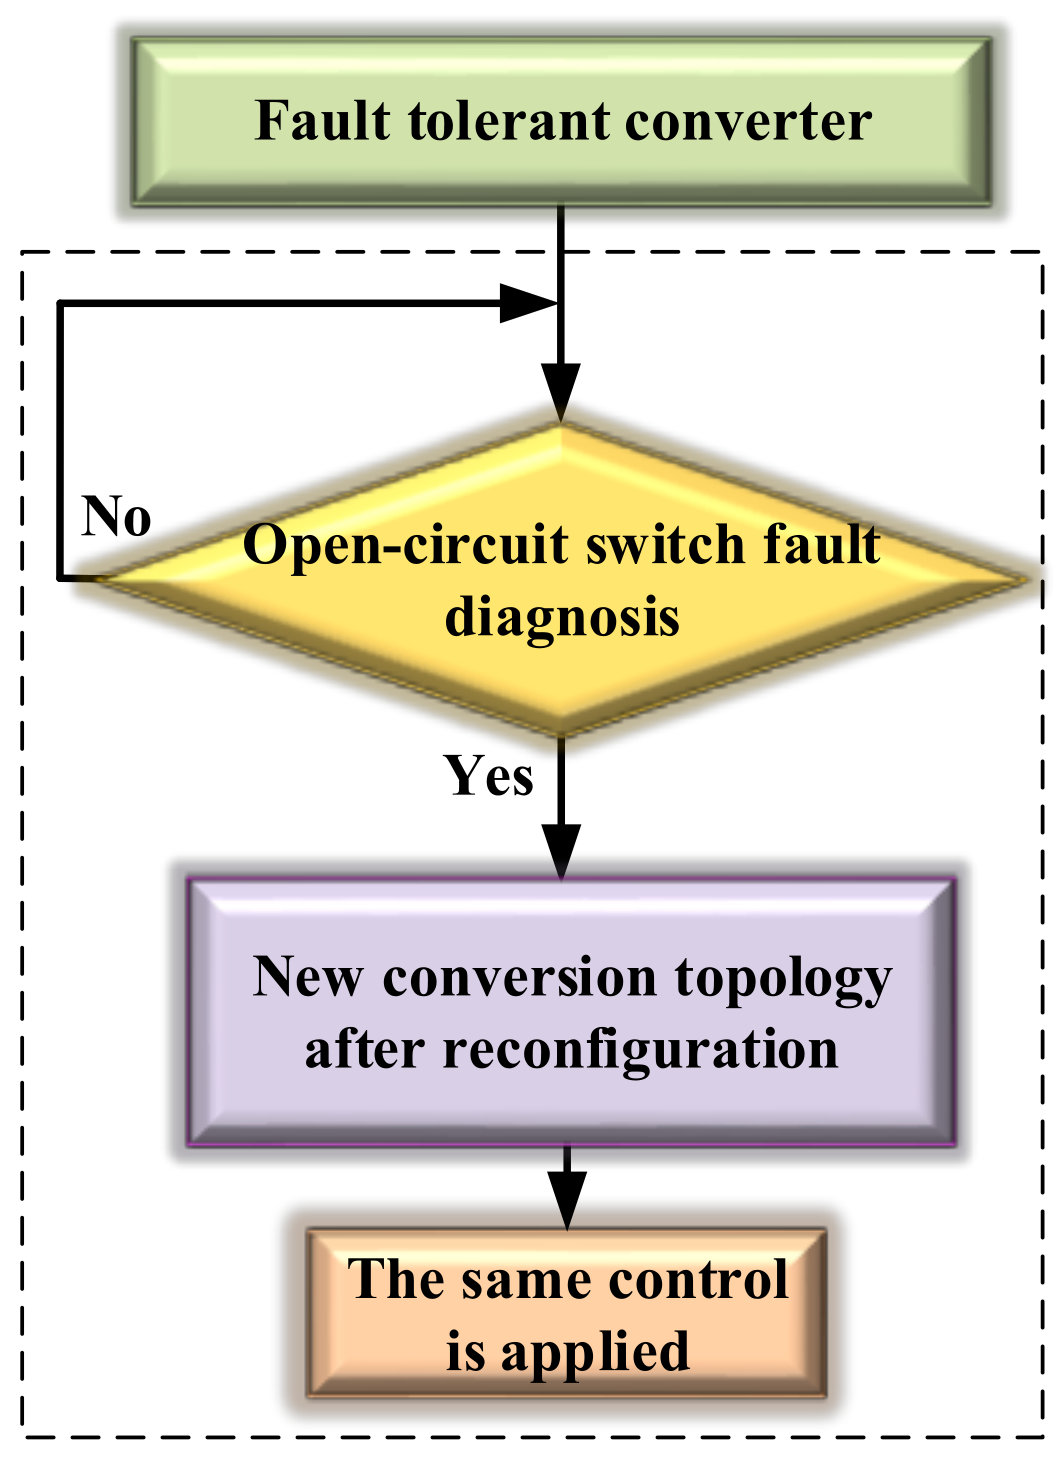
Figure 4.
PV energy harvesting system with a two-stage DC-DC converter and energy storage.
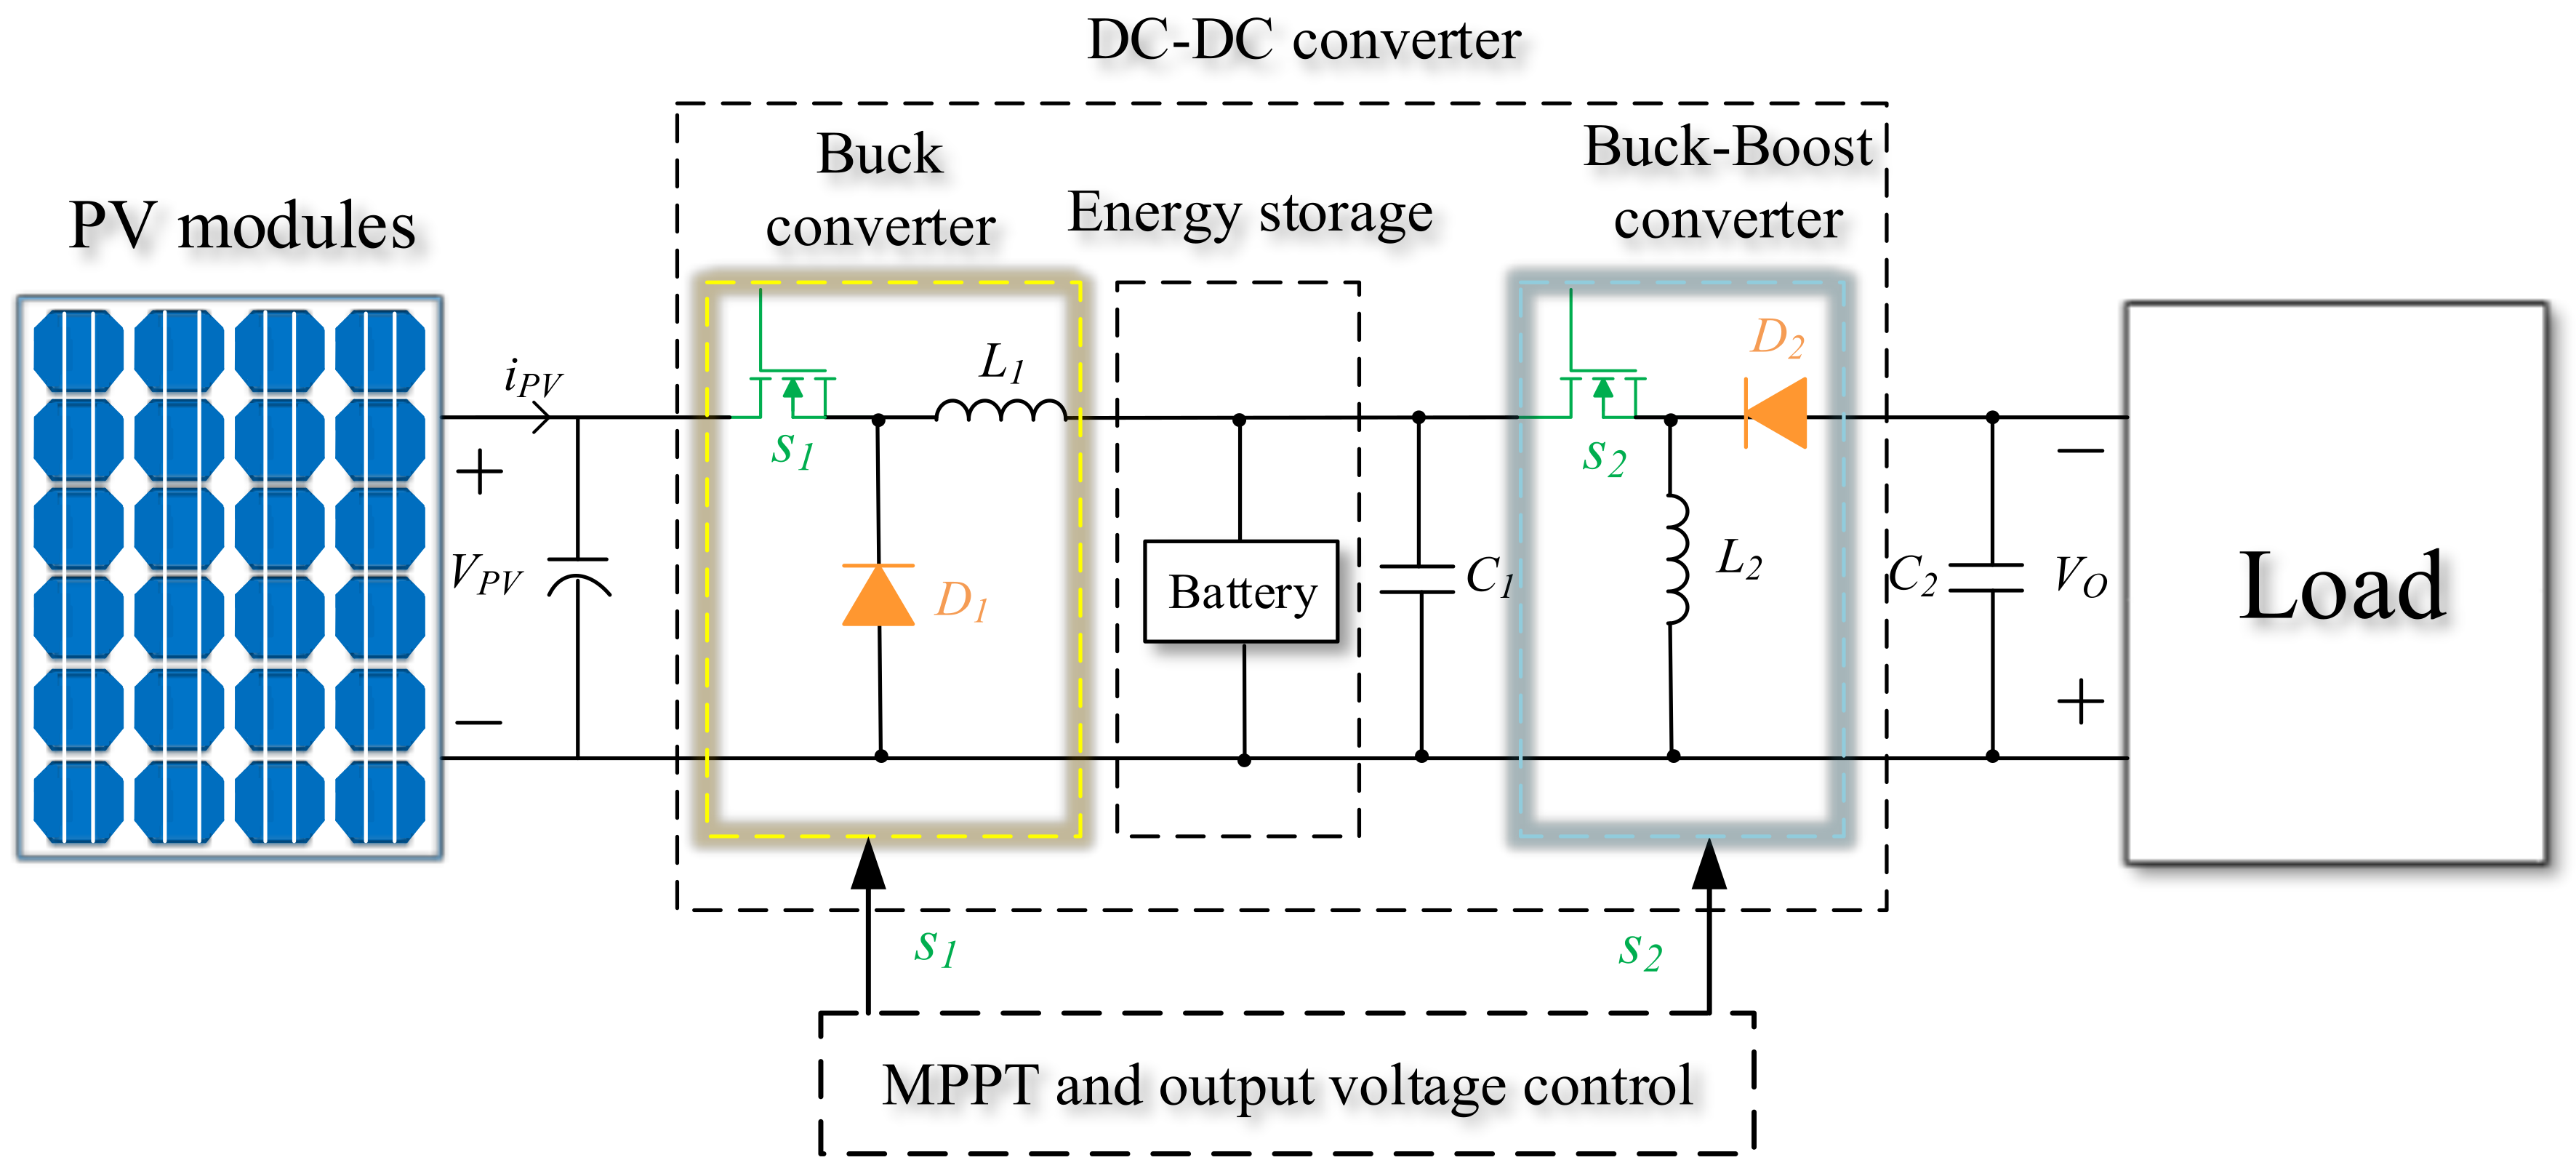
Figure 5.
Equivalent electrical circuits with common drain-source node.
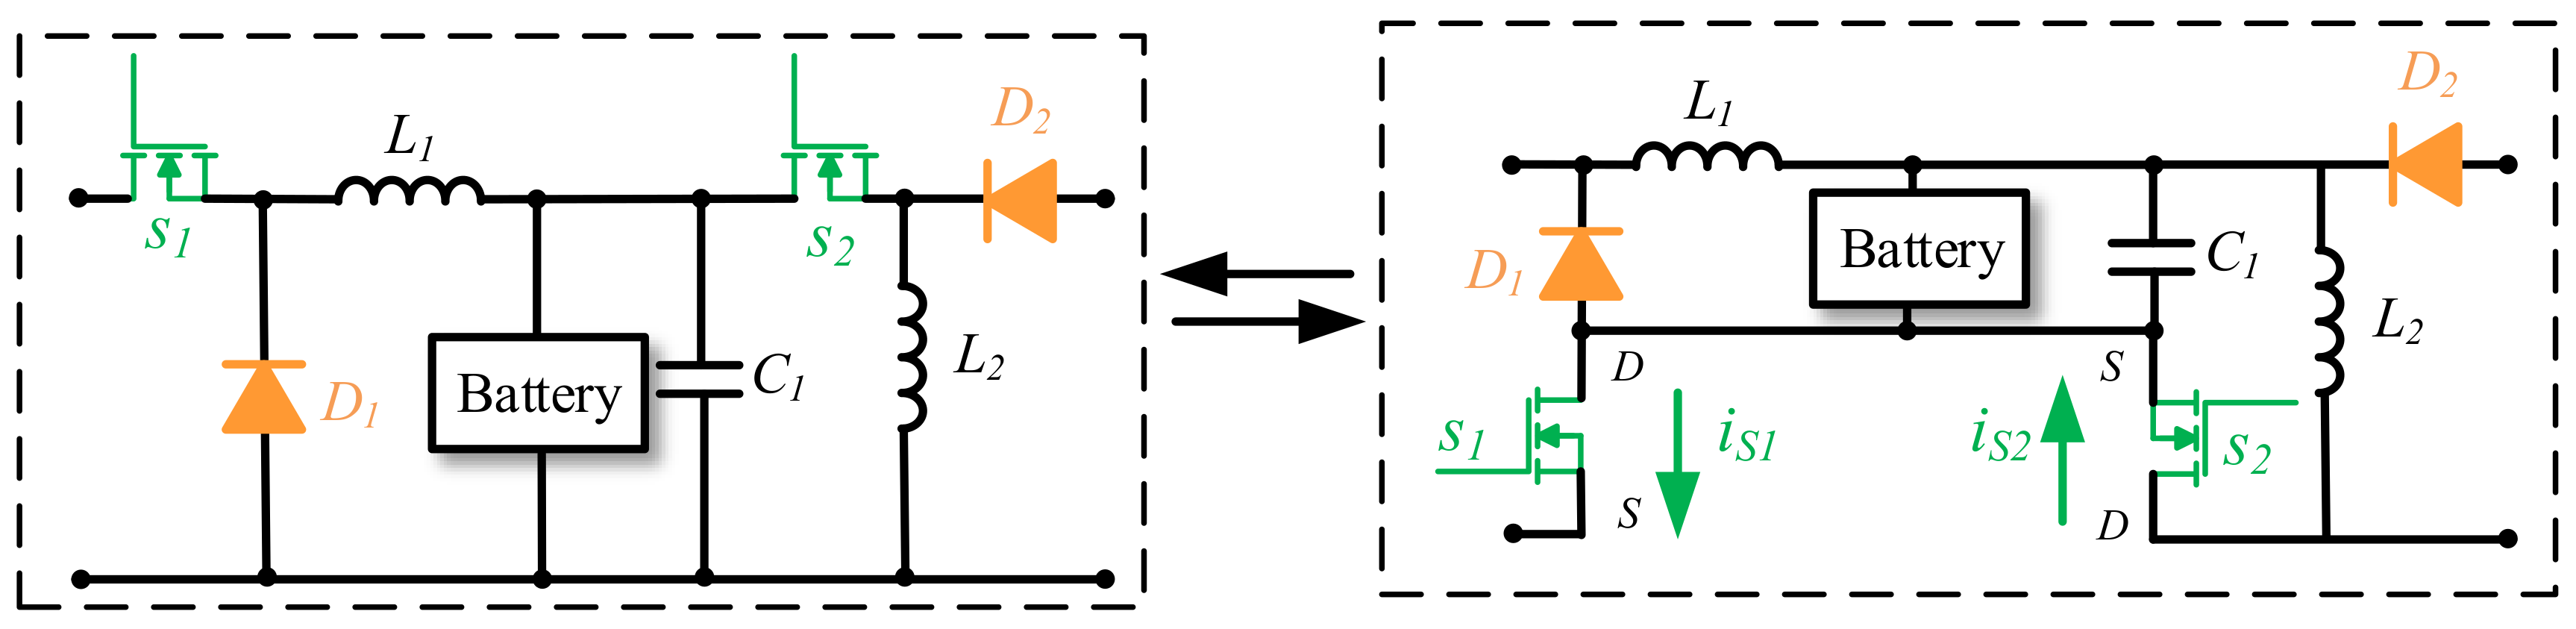
Figure 6.
Equivalent synchronous switch for and .

Figure 7.
PV system with service continuity capability.

Figure 8.
Waveform of the current crossing the inductor in steady state, in Discontinuous Conduction Mode (DCM) mode.
Figure 8.
Waveform of the current crossing the inductor in steady state, in Discontinuous Conduction Mode (DCM) mode.

Figure 9.
Perturb and Observe (P&O) MPPT algorithm.

Figure 10.
Block diagram of the regulation for the output voltage for the buck-boost converter.
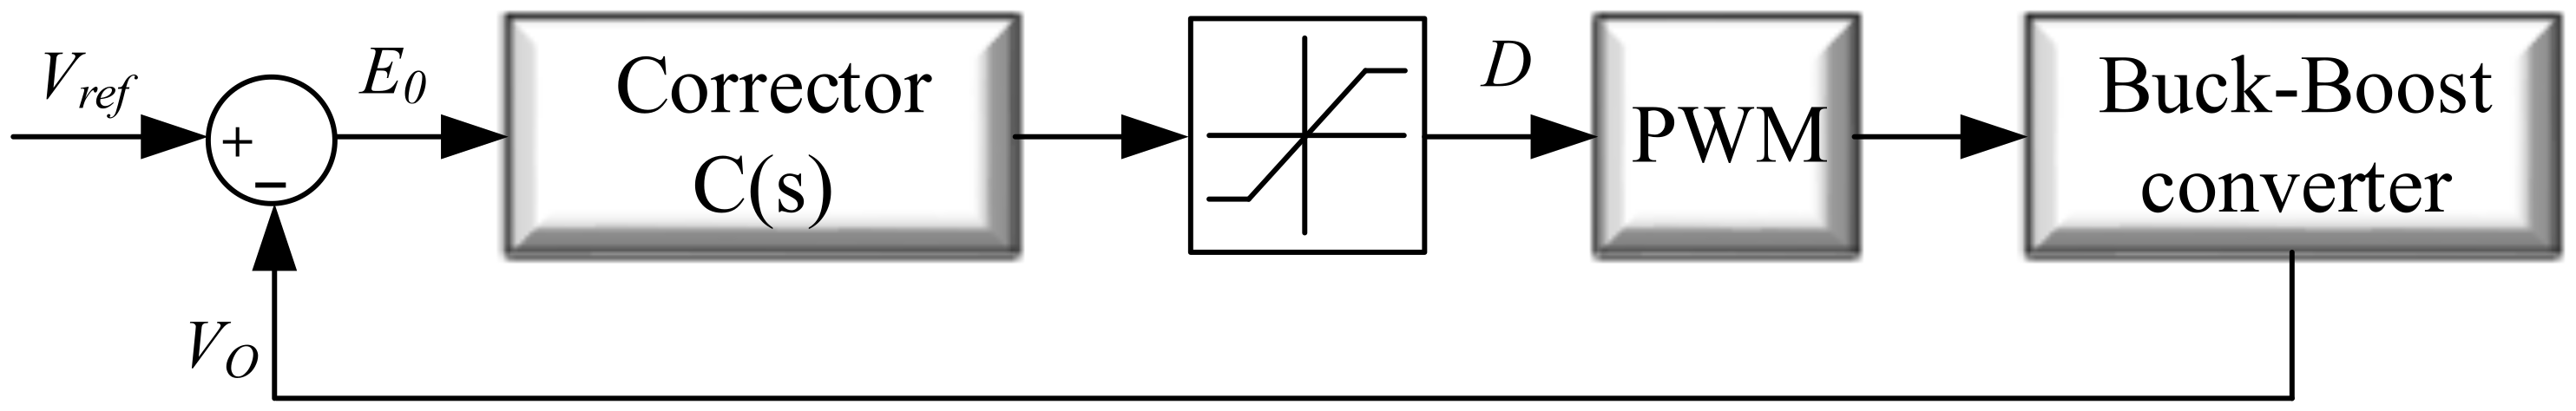
Figure 11.
Limit between continuous and discontinuous conduction modes for the inductor . CCM, Continuous Conduction Mode.
Figure 11.
Limit between continuous and discontinuous conduction modes for the inductor . CCM, Continuous Conduction Mode.
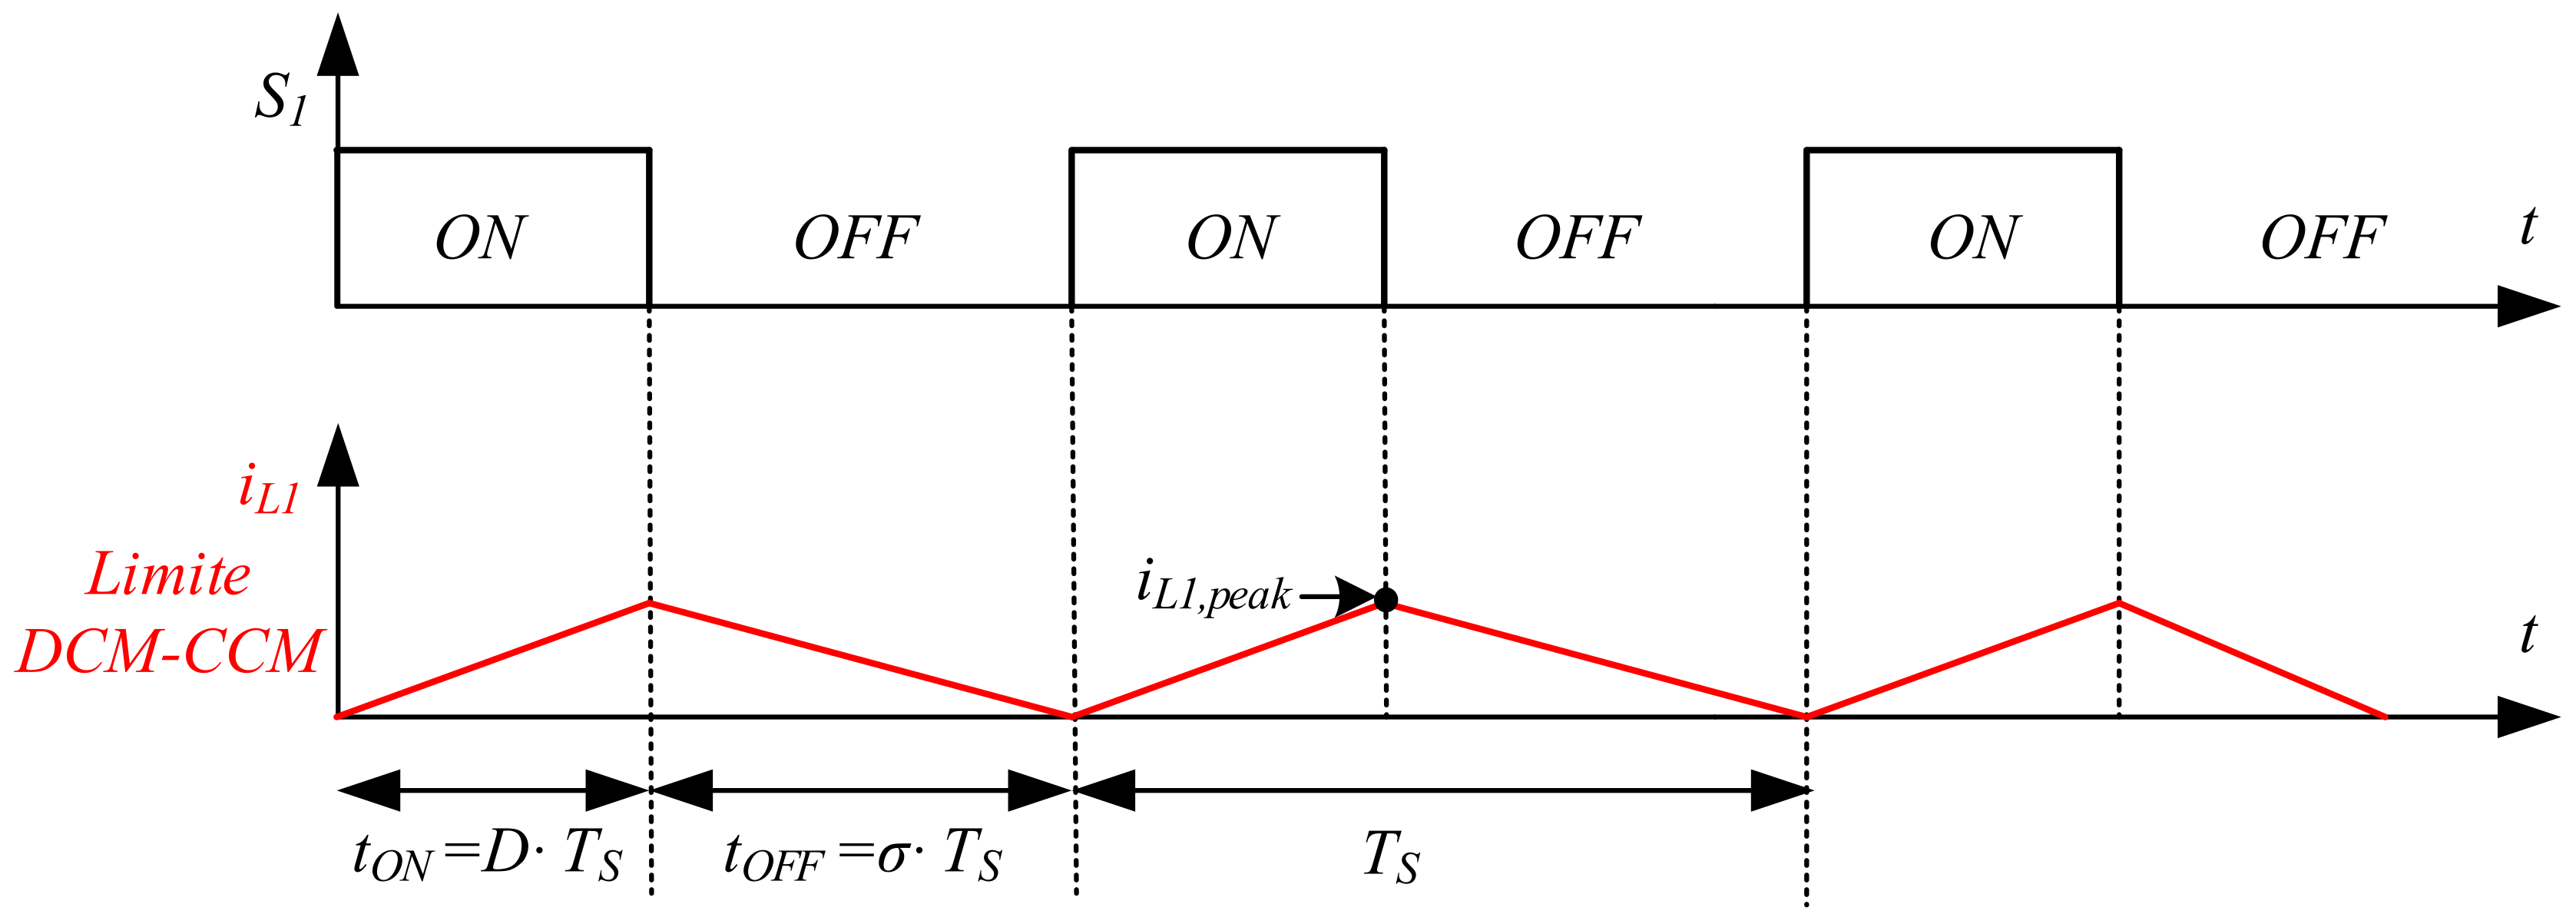
Figure 12.
Equivalent circuit of a PV cell.

Figure 13.
Electrical model of the battery.
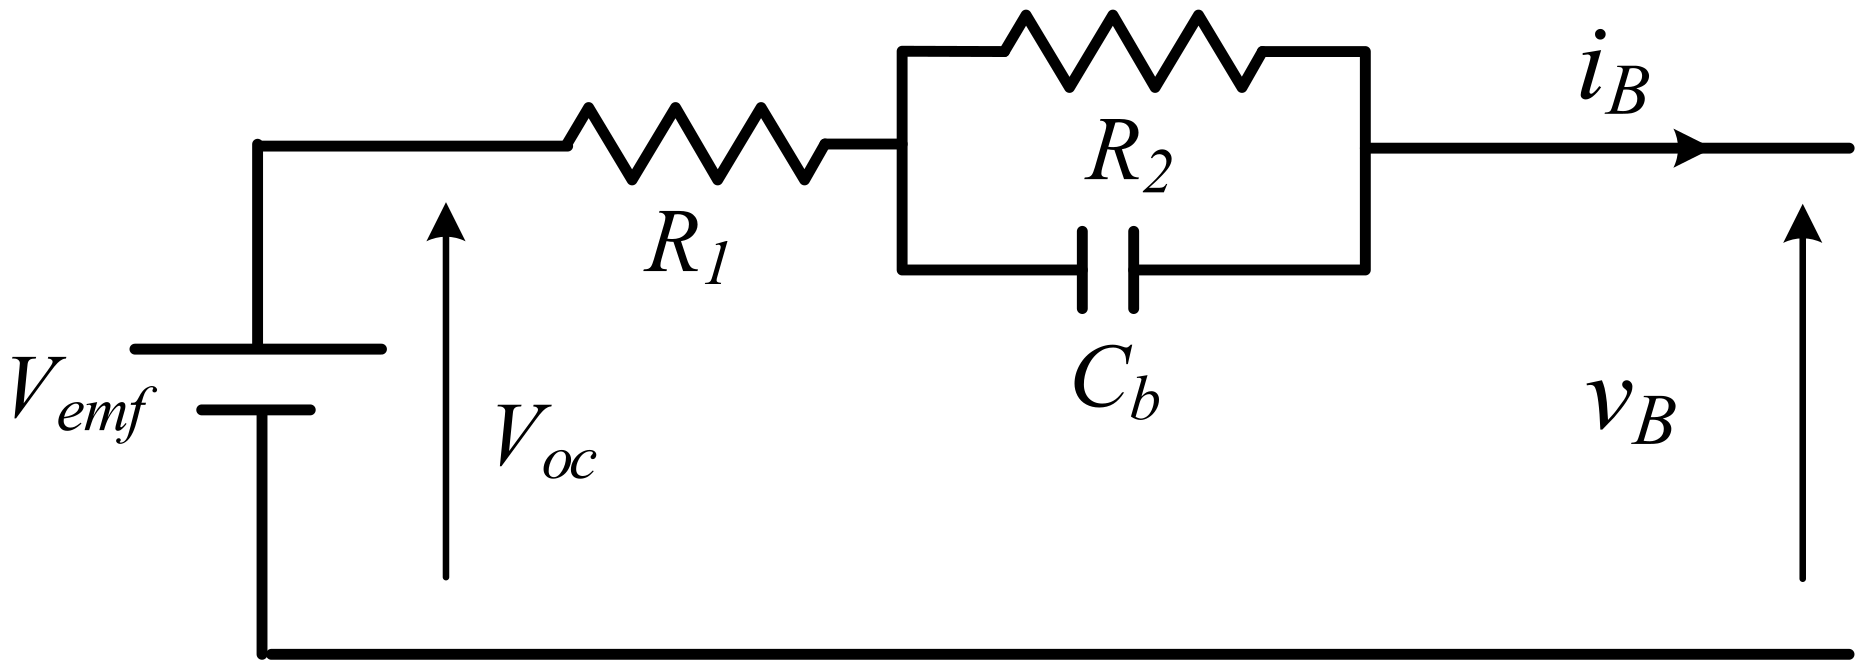
Figure 14.
Open Circuit Fault (OCF) in the switch at s; from the top to the bottom P, f, and D.

Figure 15.
OCF in at s: currents in the switches and the diodes.
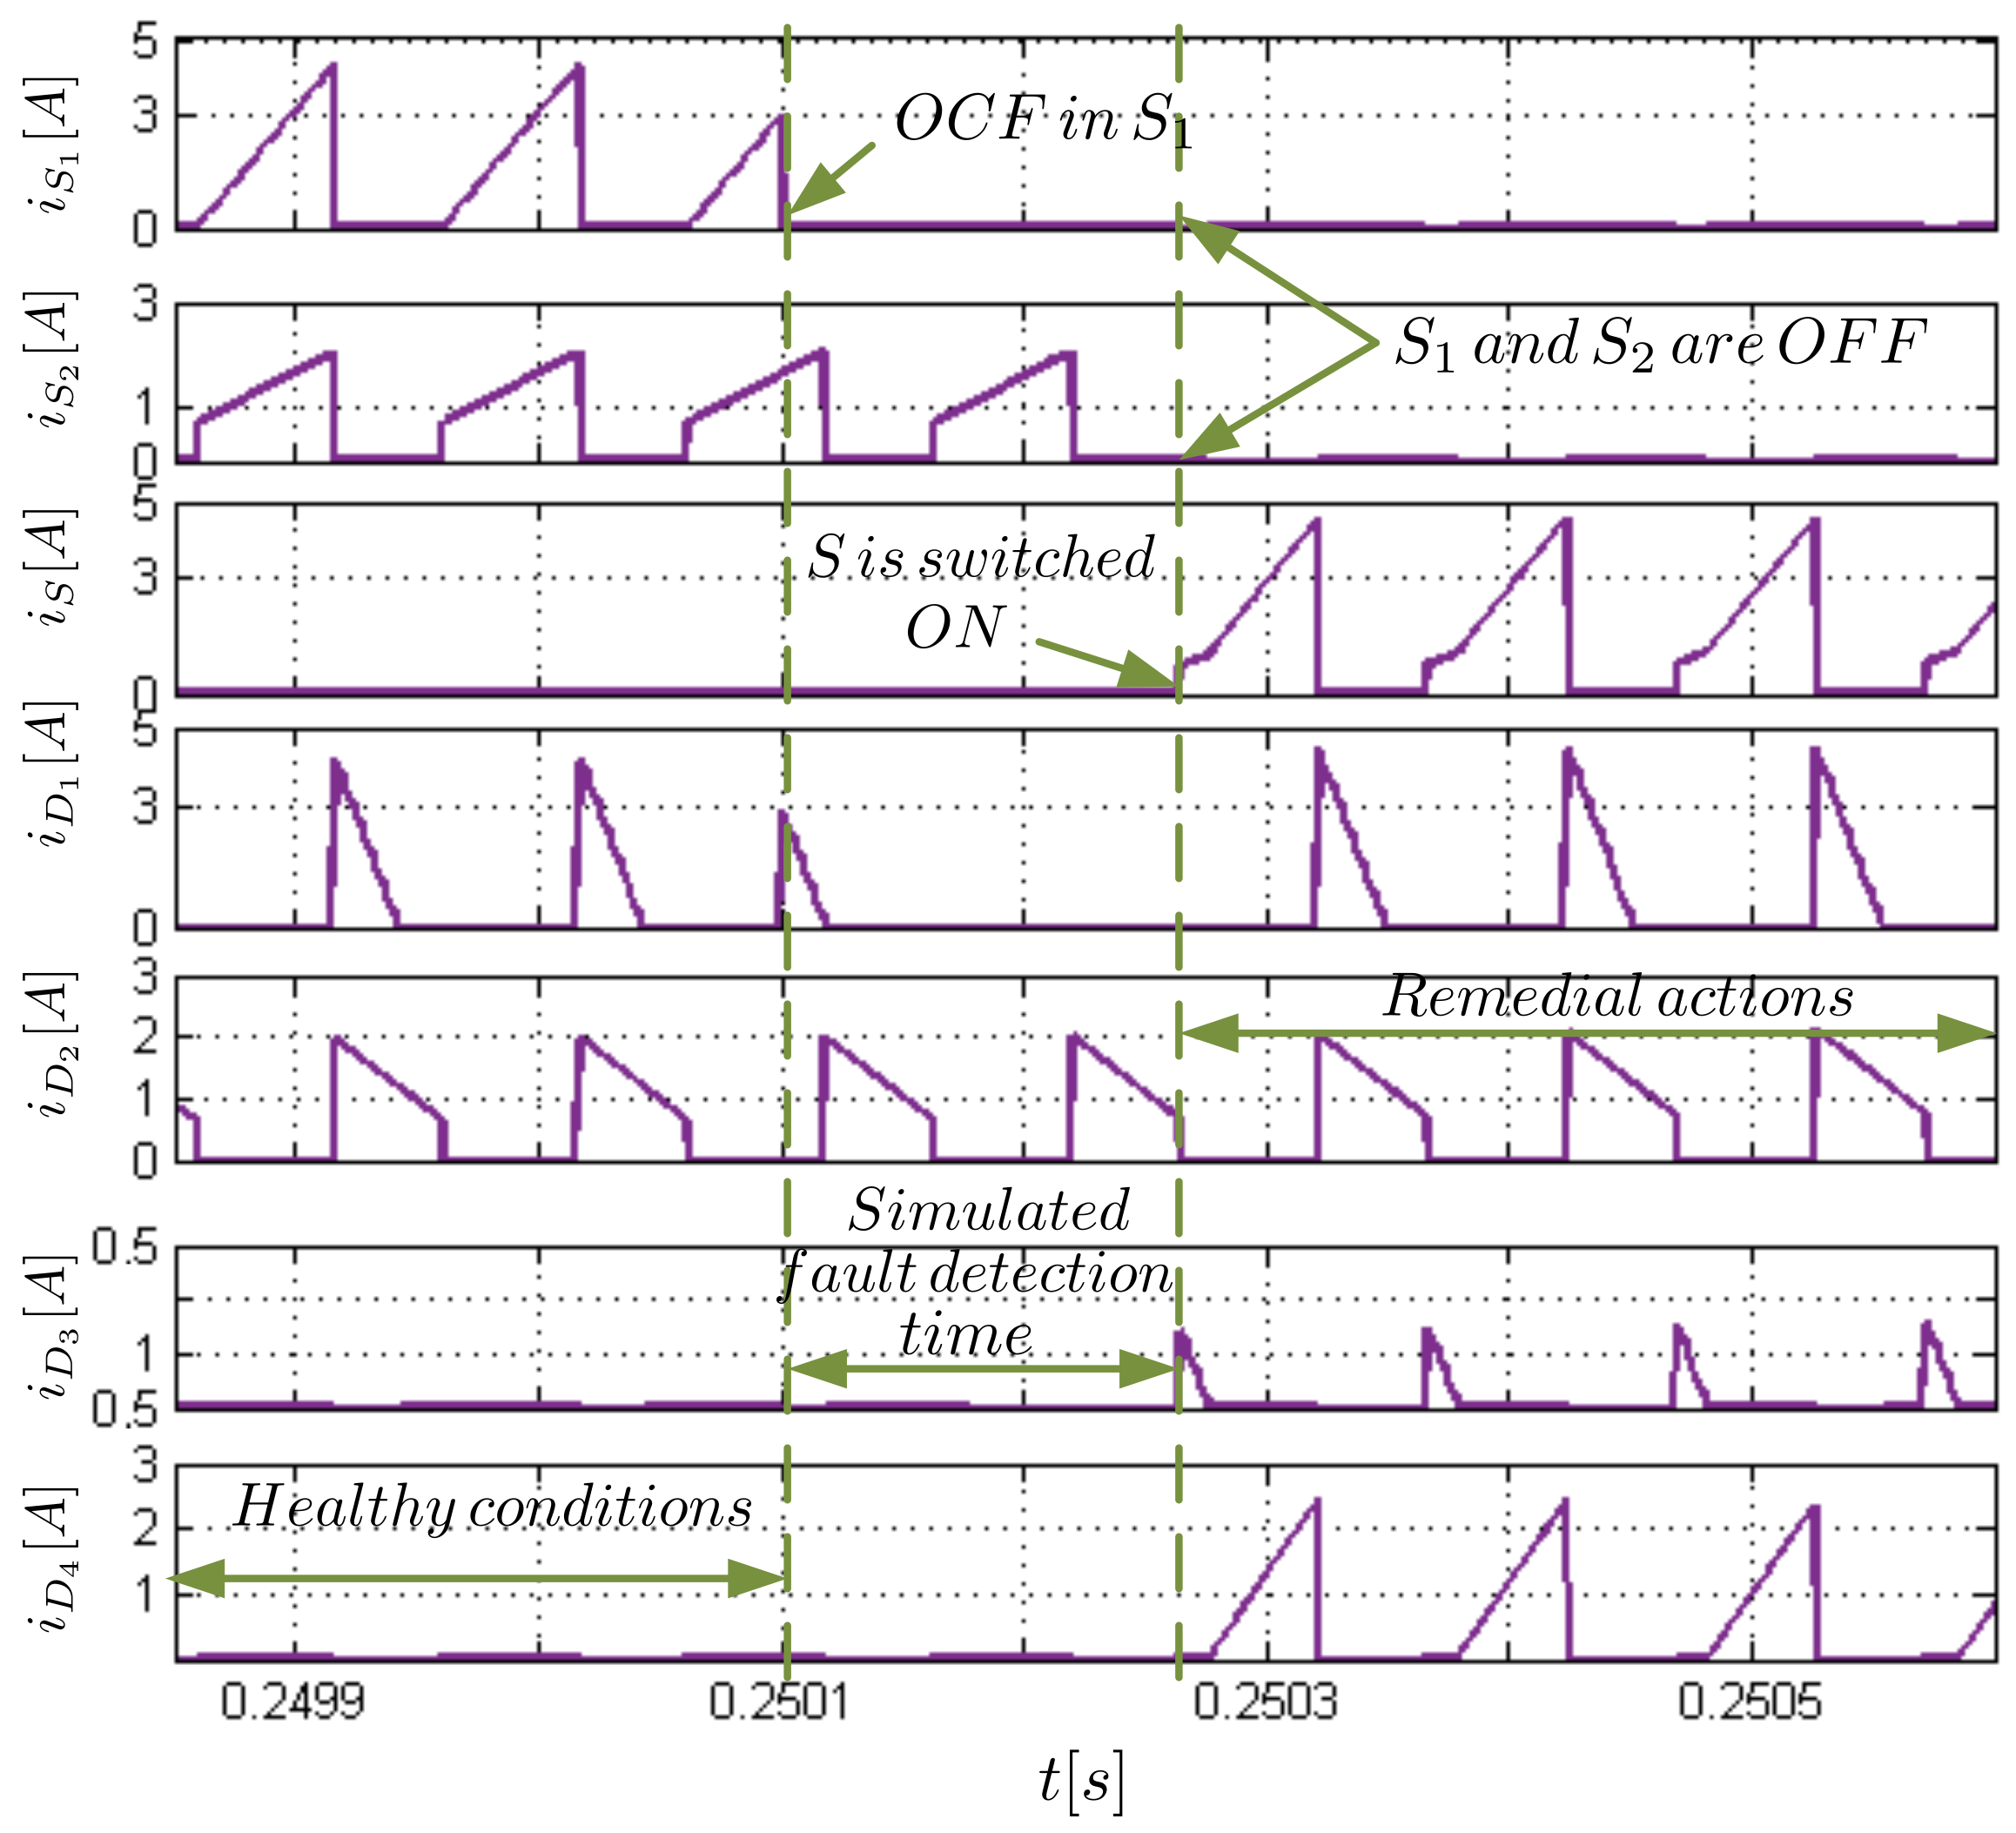
Figure 16.
OCF in at s: currents flowing through the inductors and .

Figure 17.
OCF in the switch at s; from the top to the bottom P, f, and D.

Figure 18.
OCF in at s: currents in the switches and the diodes.
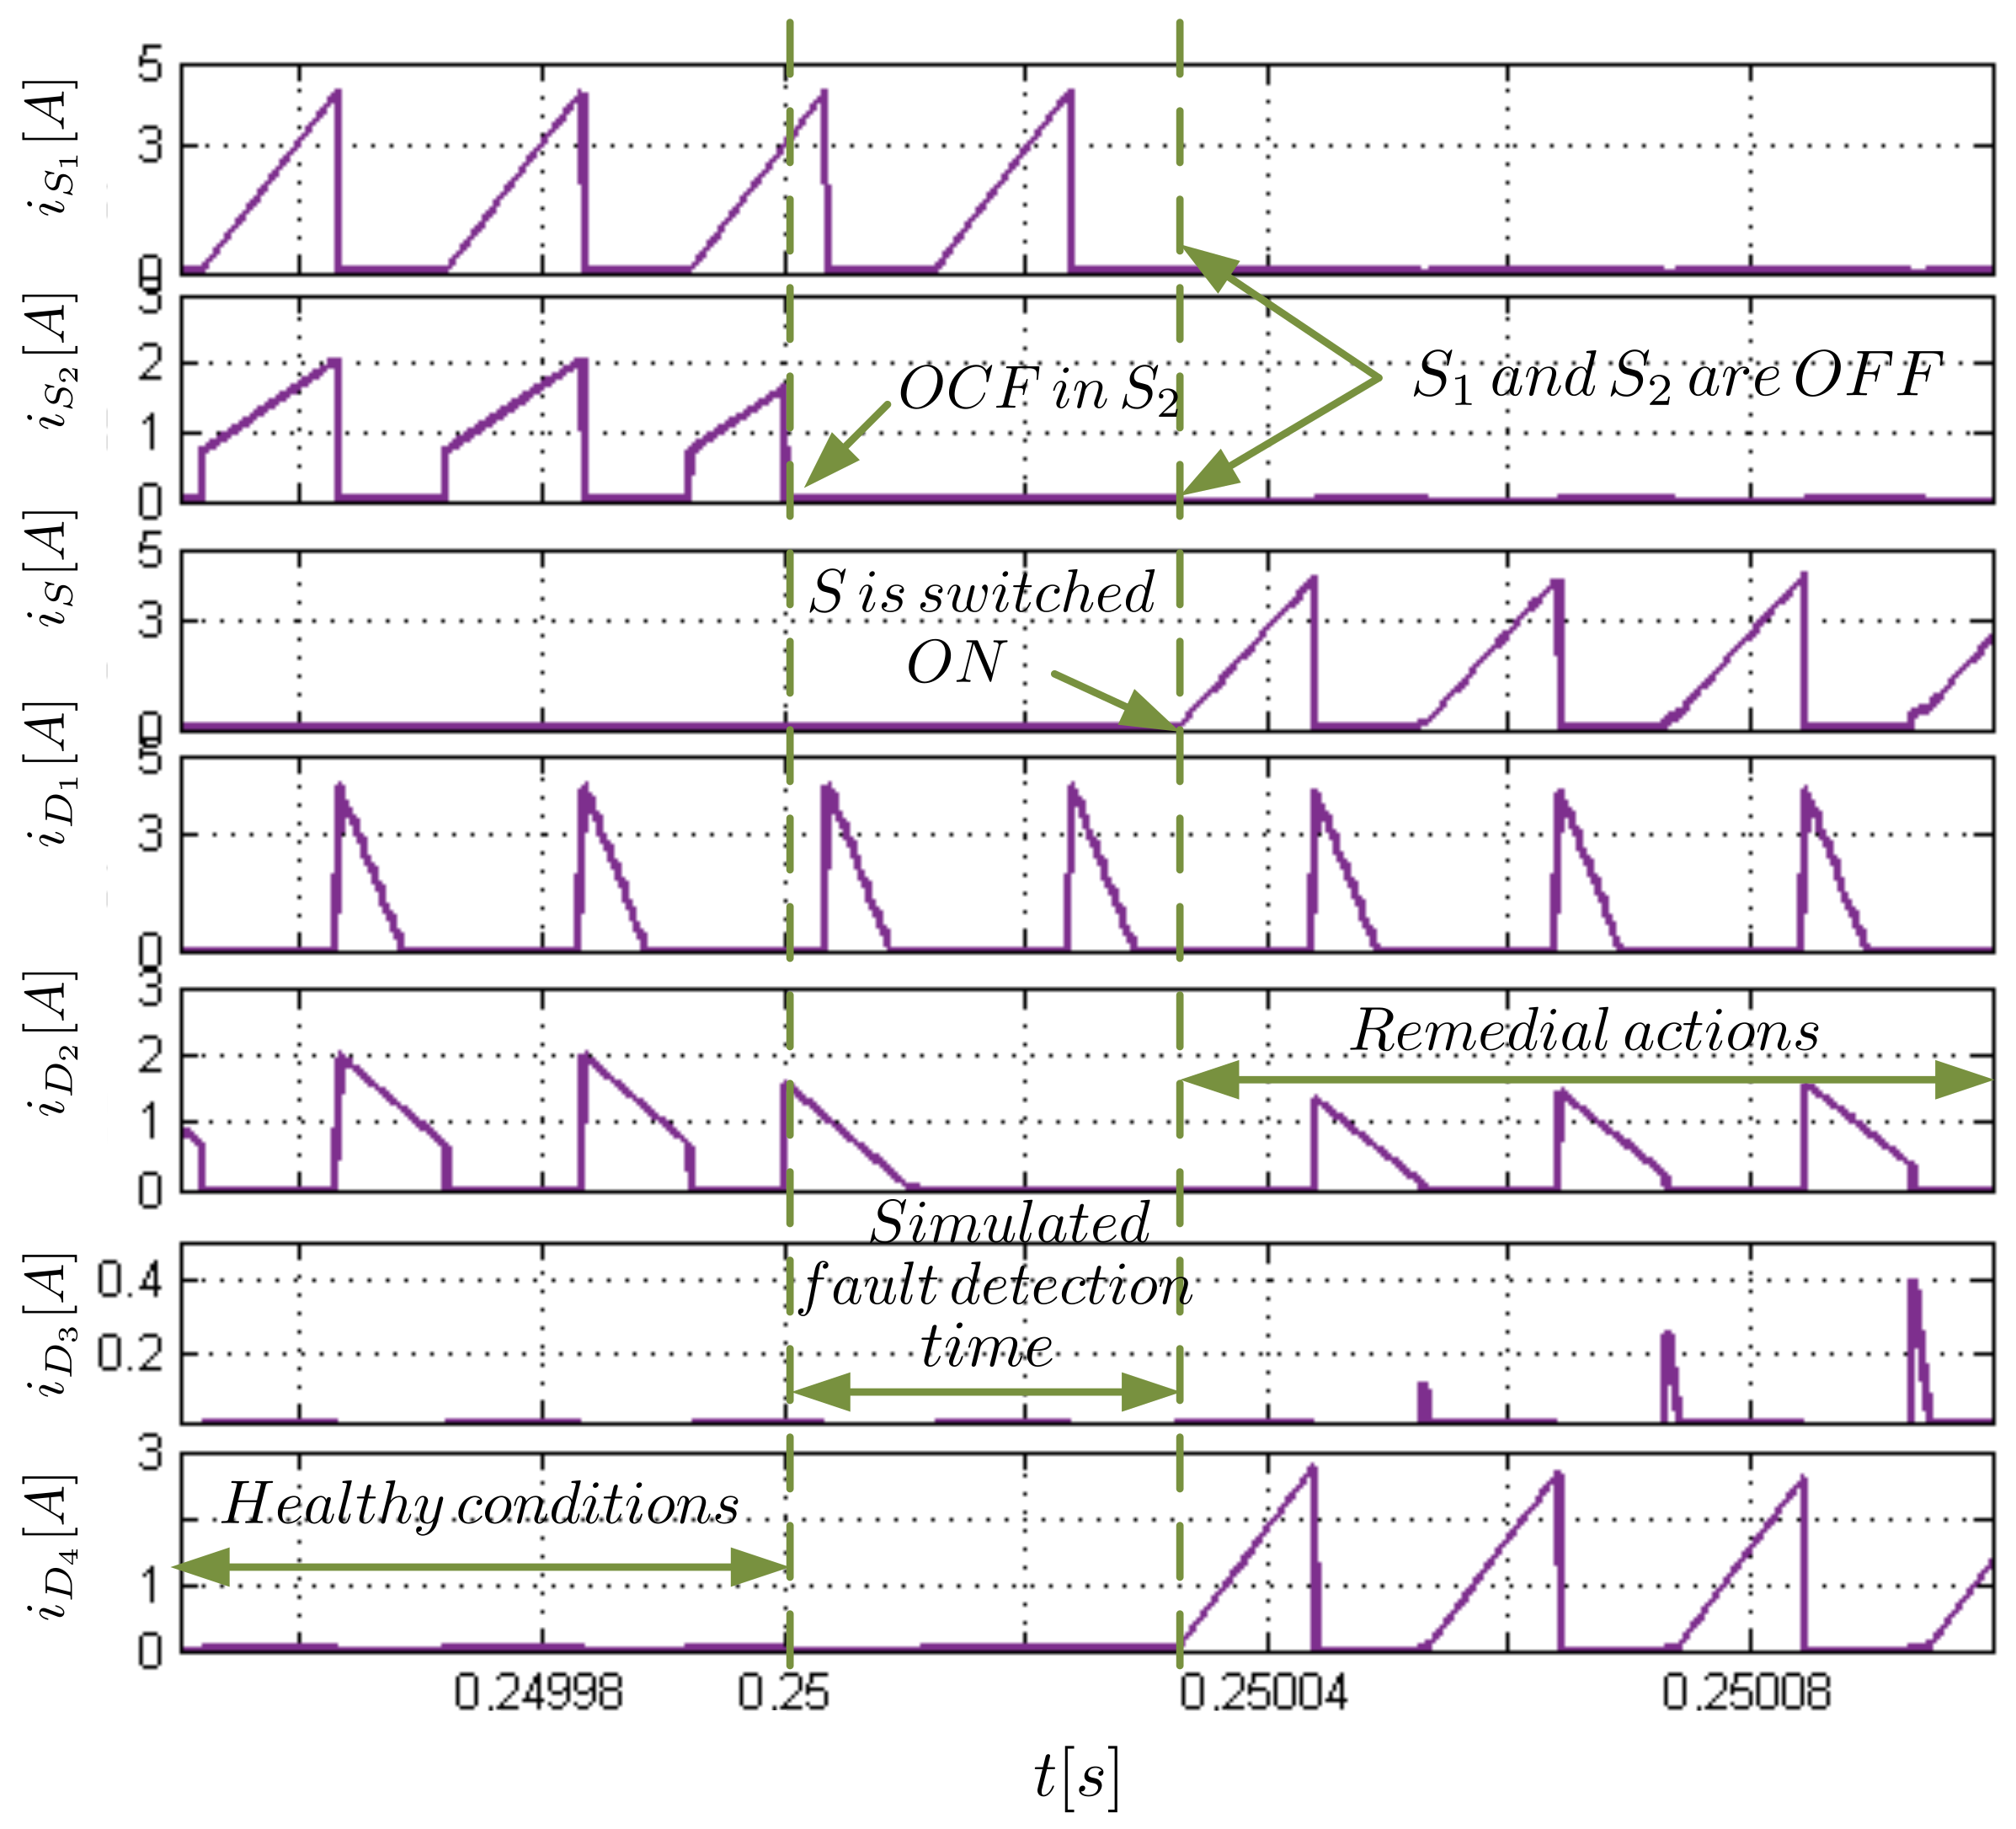
Figure 19.
OCF in at s: currents flowing through the inductors and .


Table 1.
Parameters of the PV modules.
| Elements | Value | |
|---|---|---|
| 1.2 A | ||
| 17.5 V | ||
| PV | 1.5 m | |
| n | ||
| A |
Table 2.
Parameters of the buck/buck-boost converter.
| Elements | Value | |
|---|---|---|
| 15 H | ||
| 100 H | ||
| DC-DC | 100 F | |
| 22 F | ||
| 12 V |
Table 3.
Numerical values of the battery parameters.
| Parameters | Values | Description |
|---|---|---|
| 12 V | Open-circuit voltage of the battery | |
| 1 m | Serial internal resistance | |
| 1.5 m | Parallel resistance | |
| 4581 F | Parallel capacitor |
© 2018 by the authors. Licensee MDPI, Basel, Switzerland. This article is an open access article distributed under the terms and conditions of the Creative Commons Attribution (CC BY) license (http://creativecommons.org/licenses/by/4.0/).
Share and Cite
MDPI and ACS Style
Siouane, S.; Jovanović, S.; Poure, P. Service Continuity of PV Synchronous Buck/Buck-Boost Converter with Energy Storage†. Energies 2018, 11, 1369. https://doi.org/10.3390/en11061369
AMA Style
Siouane S, Jovanović S, Poure P. Service Continuity of PV Synchronous Buck/Buck-Boost Converter with Energy Storage†. Energies. 2018; 11(6):1369. https://doi.org/10.3390/en11061369
Chicago/Turabian StyleSiouane, Saima, Slaviša Jovanović, and Philippe Poure. 2018. "Service Continuity of PV Synchronous Buck/Buck-Boost Converter with Energy Storage†" Energies 11, no. 6: 1369. https://doi.org/10.3390/en11061369
Note that from the first issue of 2016, this journal uses article numbers instead of page numbers. See further details here.