Urban Environment and Solar PV Performance: The Case of the Netherlands


Utrecht University, Copernicus Institute, Heidelberglaan 2, 3584 CS Utrecht, The Netherlands
*
Author to whom correspondence should be addressed.
Energies 2018, 11(6), 1333; https://doi.org/10.3390/en11061333
Submission received: 16 April 2018
/
Revised: 7 May 2018
/
Accepted: 15 May 2018
/
Published: 23 May 2018
(This article belongs to the Special Issue PV System Design and Performance)
Abstract
:The modern urban landscape creates numerous challenges for the deployment of solar Photovoltaic (PV) technology. The large structures that dominate the skyline of every city create compactness, which, in turn, limits the available rooftop area and creates unpredicted shading patterns. The majority of research today relies on modern applications such as geographical information system (GIS) software to evaluate urban morphology; however, this approach is computationally intensive and therefore it is usually limited to a small geographical area. In this paper, we approach this issue from another perspective, utilizing the enormous amount of high resolution PV yield data that is available for the Netherlands. Our results not only correlate performance losses with urban compactness indicators, but they also reveal a significant seasonality effect that can reach 15% in some cases.
1. Introduction
Today, approximately half of the world’s population lives and works in cities and it is there that about 75% of global resources are consumed [1,2]. With a continuously increasing urban population, the alarming issues of energy security and climate change are becoming more prominent than ever, requiring careful planning and effective measures. The European political instruments have already addressed this challenge from 2010 with the Energy Performance of Buildings Directive (EPBD) that provides guidelines towards the net zero-energy buildings [3]. The goal is to reach a point where buildings minimize their carbon emissions and the dependence on the electrical grid through an extended integration of renewable energy generators and innovative architectural design.
In this direction, solar Photovoltaics (PV) is one of the most promising forms of renewable energy production. Fast technological improvements, cost reduction and public acceptance are the key factors that accelerate the global demand for solar systems. A strategic advantage of solar generators is the modular nature of the technology, which makes it ideal for onsite energy production and consumption, leading to a critical reduction in transformation and transmission losses.
The complex urban environment, however, is challenging for the deployment of PV technology [4]. While outside of the city boundaries solar energy generation might only be constraint by the stochastic nature of the meteorological conditions, in a metropolitan area, there are a number of threats that need to be overcome. Besides the scarcity of available space and the high cost of land, it is mainly the modern architecture that develops predominantly in terms of height that poses the most important hindering factors. An inherent characteristic of this type of development is the small rooftop that corresponds to a large operational volume for each construction. While this can be tackled with the use of Building Integrated Photovoltaic (BIPV) solutions [5], the dynamic overshadowing and the unevenly distributed solar irradiation caused by urban compactness can significantly affect the solar potential of those areas.
Early attempts to quantify the solar potential of an urban region were mostly based on a hierarchical methodology that would examine restrictions on a variety of different levels to identify physical, geographical and technical potential mainly on a 2D scale [6,7,8]. The challenge of estimating the available rooftop area was tackled with the use of municipal data or image processing of aerial photographs. Today, however, thanks to vast improvements in computational power and the development of new modeling techniques, a more accurate representation of the urban landscape can be acquired. Software tools such as Geographical Information System (GIS) and Light Detection And Ranging (LiDAR) are able to manipulate large amounts of geo-related data and to perform almost any kind of spatial analysis on both microscale and macroscale levels [9,10,11]. By introducing accurate 3D models of neighborhoods or even entire cities, researchers could evaluate a large number of significant parameters such as the inclination of the roofs and the total surface of the exterior walls. Therefore, on one hand, studies on the potential impact of solar energy generated could be extended and enhanced with high level of detail [12,13], but also the effect of various urban features such as the height-to-width ratio of street canyons, site coverage, plot ratio, horizontal distribution, and vertical uniformity of buildings could be thoroughly evaluated [14,15].
Regardless of the methodology or the simulation tool, the majority of the scientific research conducted up to date highlights the fact that the contribution of solar energy can be significant in the urban environment and that shading effects caused by adjusting buildings is the main threat that can limit the energy produced. Despite the impressive technological advances, the accurate computation of solar irradiation in a 3D environment is still a challenge and, in most cases, it is performed first by numerical computation and ray tracing simulations software before it is introduced into the GIS [13]. Therefore, these types of studies are limited to a small number of buildings or a very specific part of a city [16] and the main target is to provide guidelines either for urban designers [17] or to evaluate architectural designs [18].
The scope of research is to approach large scale PV performance from a big data perspective. In this way, it will elegantly circumvent the dependence on computational intensive simulation software, and correlate the performance of PV systems with urban compactness indicators by a thorough analysis of a large number of systems, operating in various locations under real life conditions. This approach benefits from the enormous amount of PV yield data produced constantly by monitoring systems, to give an accurate year round image of solar energy performance over extended geographical areas. Our results provide a comprehensive framework suitable to address decision-making for assessment and integration of PV technology in dense built environments.
2. Methodology
The research area is the entire country of the Netherlands, which provides a variety of morphologically different locations in close proximity that are also characterized, however, with very similar meteorological and irradiation conditions. According to provisional statistics that were published by the Dutch Central Bureau of Statistics, the Dutch market recorded the largest annual growth so far in 2017, with the addition of 700 MW of new installations reaching a total cumulative capacity of 2.7 GW [19]. The majority of those systems are equipped with an independent monitoring system or they are monitored through specialized software through the inverter. For this research, data were collected from 3271 systems with 5-minute resolution, provided by monitoring vendors or public available online sources covering the years 2014 to 2016.
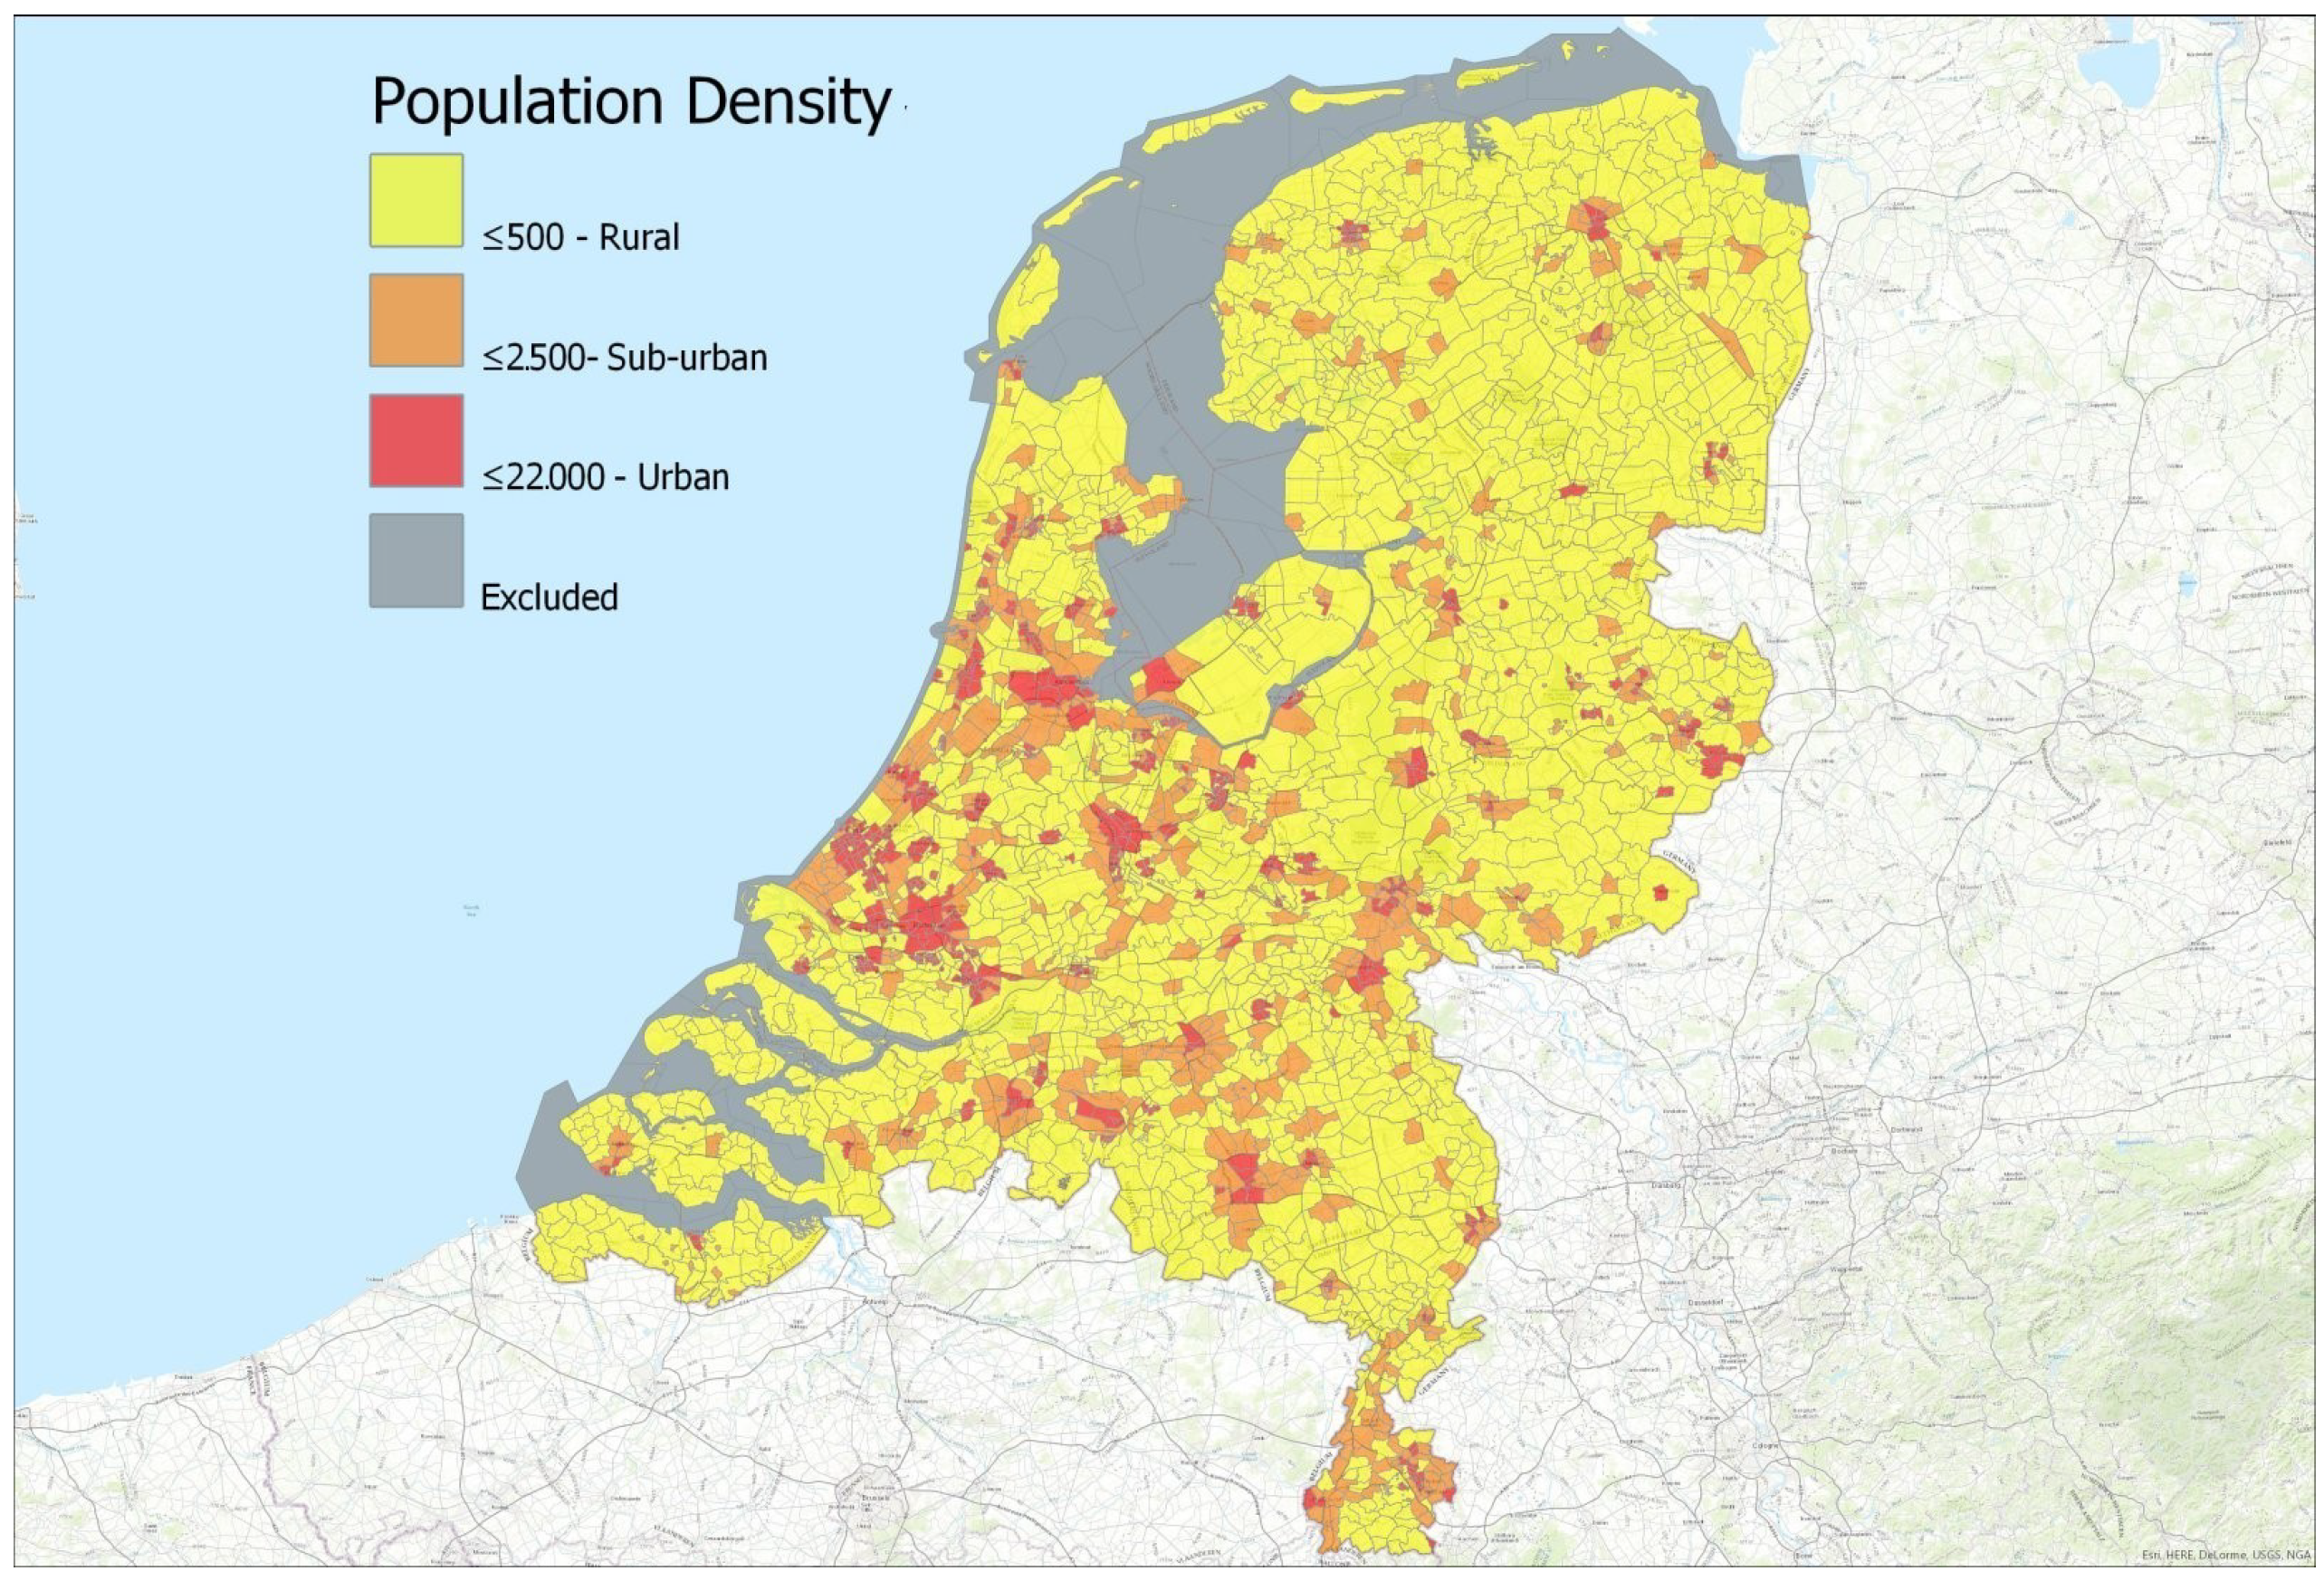
The first step was to separate the country into three zones, urban, suburban and rural based on population density. In this way, it is possible to acquire a broad overview of the performance output per zone throughout the year, examine differences in system configurations that may occur and evaluate the effects of location and seasonality. The categorization was done at neighborhood level for the whole country within a GIS environment. Once the neighborhoods were classified, the PV systems were then categorized based on their location within the neighborhoods (see Figure 1). However, each rural, urban and suburban location has been developed under different social and economical circumstances and therefore locations with similar population density values might exhibit completely different morphological characteristics. Consequently, a number of indicators has been identified that can better describe the different aspects of urban compactness.
Urban compactness has a horizontal, or a 2D component that quantifies the site coverage from human made constructions and a vertical, or 3D component that describes the shape of the cityscape. The site coverage, which is directly linked with the available open space can be measured by (a) the building density, as the number of buildings per km2, (b) the plot ratio, as the ratio of building surface to the total surface of the area and (c) the Average Building Distance (ABD) as it is measured from the centroids of each building. The most straightforward indicator to describe the 3D aspect of the urban compactness is the (d) the Average Building Height (ABH) in an area. However, a uniform distribution of building heights can have nearly zero shading effects and therefore the (e) Standard Deviation of Building Height (SDBH) is also examined in this research, as high values of SDBH can potentially lead to shading from adjusting buildings. In an ideal situation, a flat roof free of other constructions is the most suitable place to install a PV system as it can give unlimited freedom to tilt and orientation angles while having a direct and unobstructed view to the sun. The (f) Internal Building Height Standard Deviation (IBHSD) shows the distribution of height within a building polygon when it is projected to a GIS map and then it is averaged over the entire neighborhood. This indicator is suitable for quantifying the effect of any object that is placed on a rooftop such as chimneys, air condition and ventilation equipment or even architectural elements that exceed 0.5 × 0.5 m2 in size. In case the average internal height standard deviation (std) is zero, then the roof of the building is completely flat without tilted parts or any extra constructions.
In order to effectively evaluate the performance of a PV system, the energy produced is compared with a corresponding reference system. In the most simple form, the reference system is the actual system size of the PV installation and the final system yield is measured in kWh of energy generated per kWp of capacity installed. This indicator has the advantage of being straightforward and easy to calculate; however, since the energy generated is dependent on several factors such as the Plane of Array (POA) irradiance and temperature, the system yield is inadequate to properly evaluate the PV system by itself, or in comparison with other systems. For a homogeneous and systematic assessment of the technical quality of PV installations, the comparison is set between the actual energy production of a system, and a reference system that hypothetically operates with the exact same characteristics under the same conditions, but it is free of losses. The most widely used indicator that follows this principle is Performance Ratio , which shows the degree of utilization of an entire PV system. It is a dimensionless quantity and it is calculated by dividing the final system yield by the reference yield during the same time interval:
The final yield is defined by total measured power output (kW) multiplied with the time recording interval (), to the rated power output (). The reference yield is defined by the total plane of array irradiance (kWh) divided by the reference irradiation under Standard Test Conditions (STC), which is 1000 W/m2 [20]:
Any difference between 1 and aggregates all the possible energy losses including inverter efficiency, wire losses, real power of the PV modules below nominal rating, mismatch, shades, dust, thermal, failures and in larger systems mid-voltage transformer losses that are also influencing the final value. As thermal losses depend on the location but also on the time of the year, the of a given system will have a fluctuating value for different operational environments but also through the course of the year, or even a day. A temperature corrected has been suggested that shows to be independent of the time and geographical location of the system. However, it requires more complex calculations and onsite measurements of the temperature and therefore it is not easy to apply in large scale research, where only basic features are monitored.
The irradiation data that are necessary for the calculation of were acquired from the 31 meteorological stations of the Royal Meteorological Institute of the Netherlands (KNMI). The stations are able to provide Global Horizontal Irradiation measurements with hourly resolution. However, the majority of the PV installations that were monitored are not positioned on the horizontal level, but, on the contrary, they exhibit a very large variation of tilt and orientation angles. Therefore, the estimation of the solar irradiance on the tilted plane of a PV system requires the application of a transposition model that will convert the Global Horizontal Irradiance (GHI) to that of the tilted plane. A variety of different transposition models have been developed to predict solar irradiation when on site measurements are not available and many studies have focused on the validation of these models. The most successful predictions [21] come from Perez [22] and Hay [23], which come, however, with a high computational cost or high level of input details, which are not available in this case. Therefore, for this study, the Olmo model [24] is used, which depends on the clearness index and the corresponding GHI measurements, avoiding the direct and diffuse components of irradiation.
An other issue that is inherent with large scale data sets provided by private users is that it can be expected to include errors coming either from incorrect data entry, such as miscalculation of systems tilt and orientation angle or caused by malfunctioning monitoring equipment. In order to exclude them and achieve a good degree of confidence, Tukey’s method is used to isolate outliers from symmetrical distributions was used [25].
3. Results
3.1. PV Systems Overview
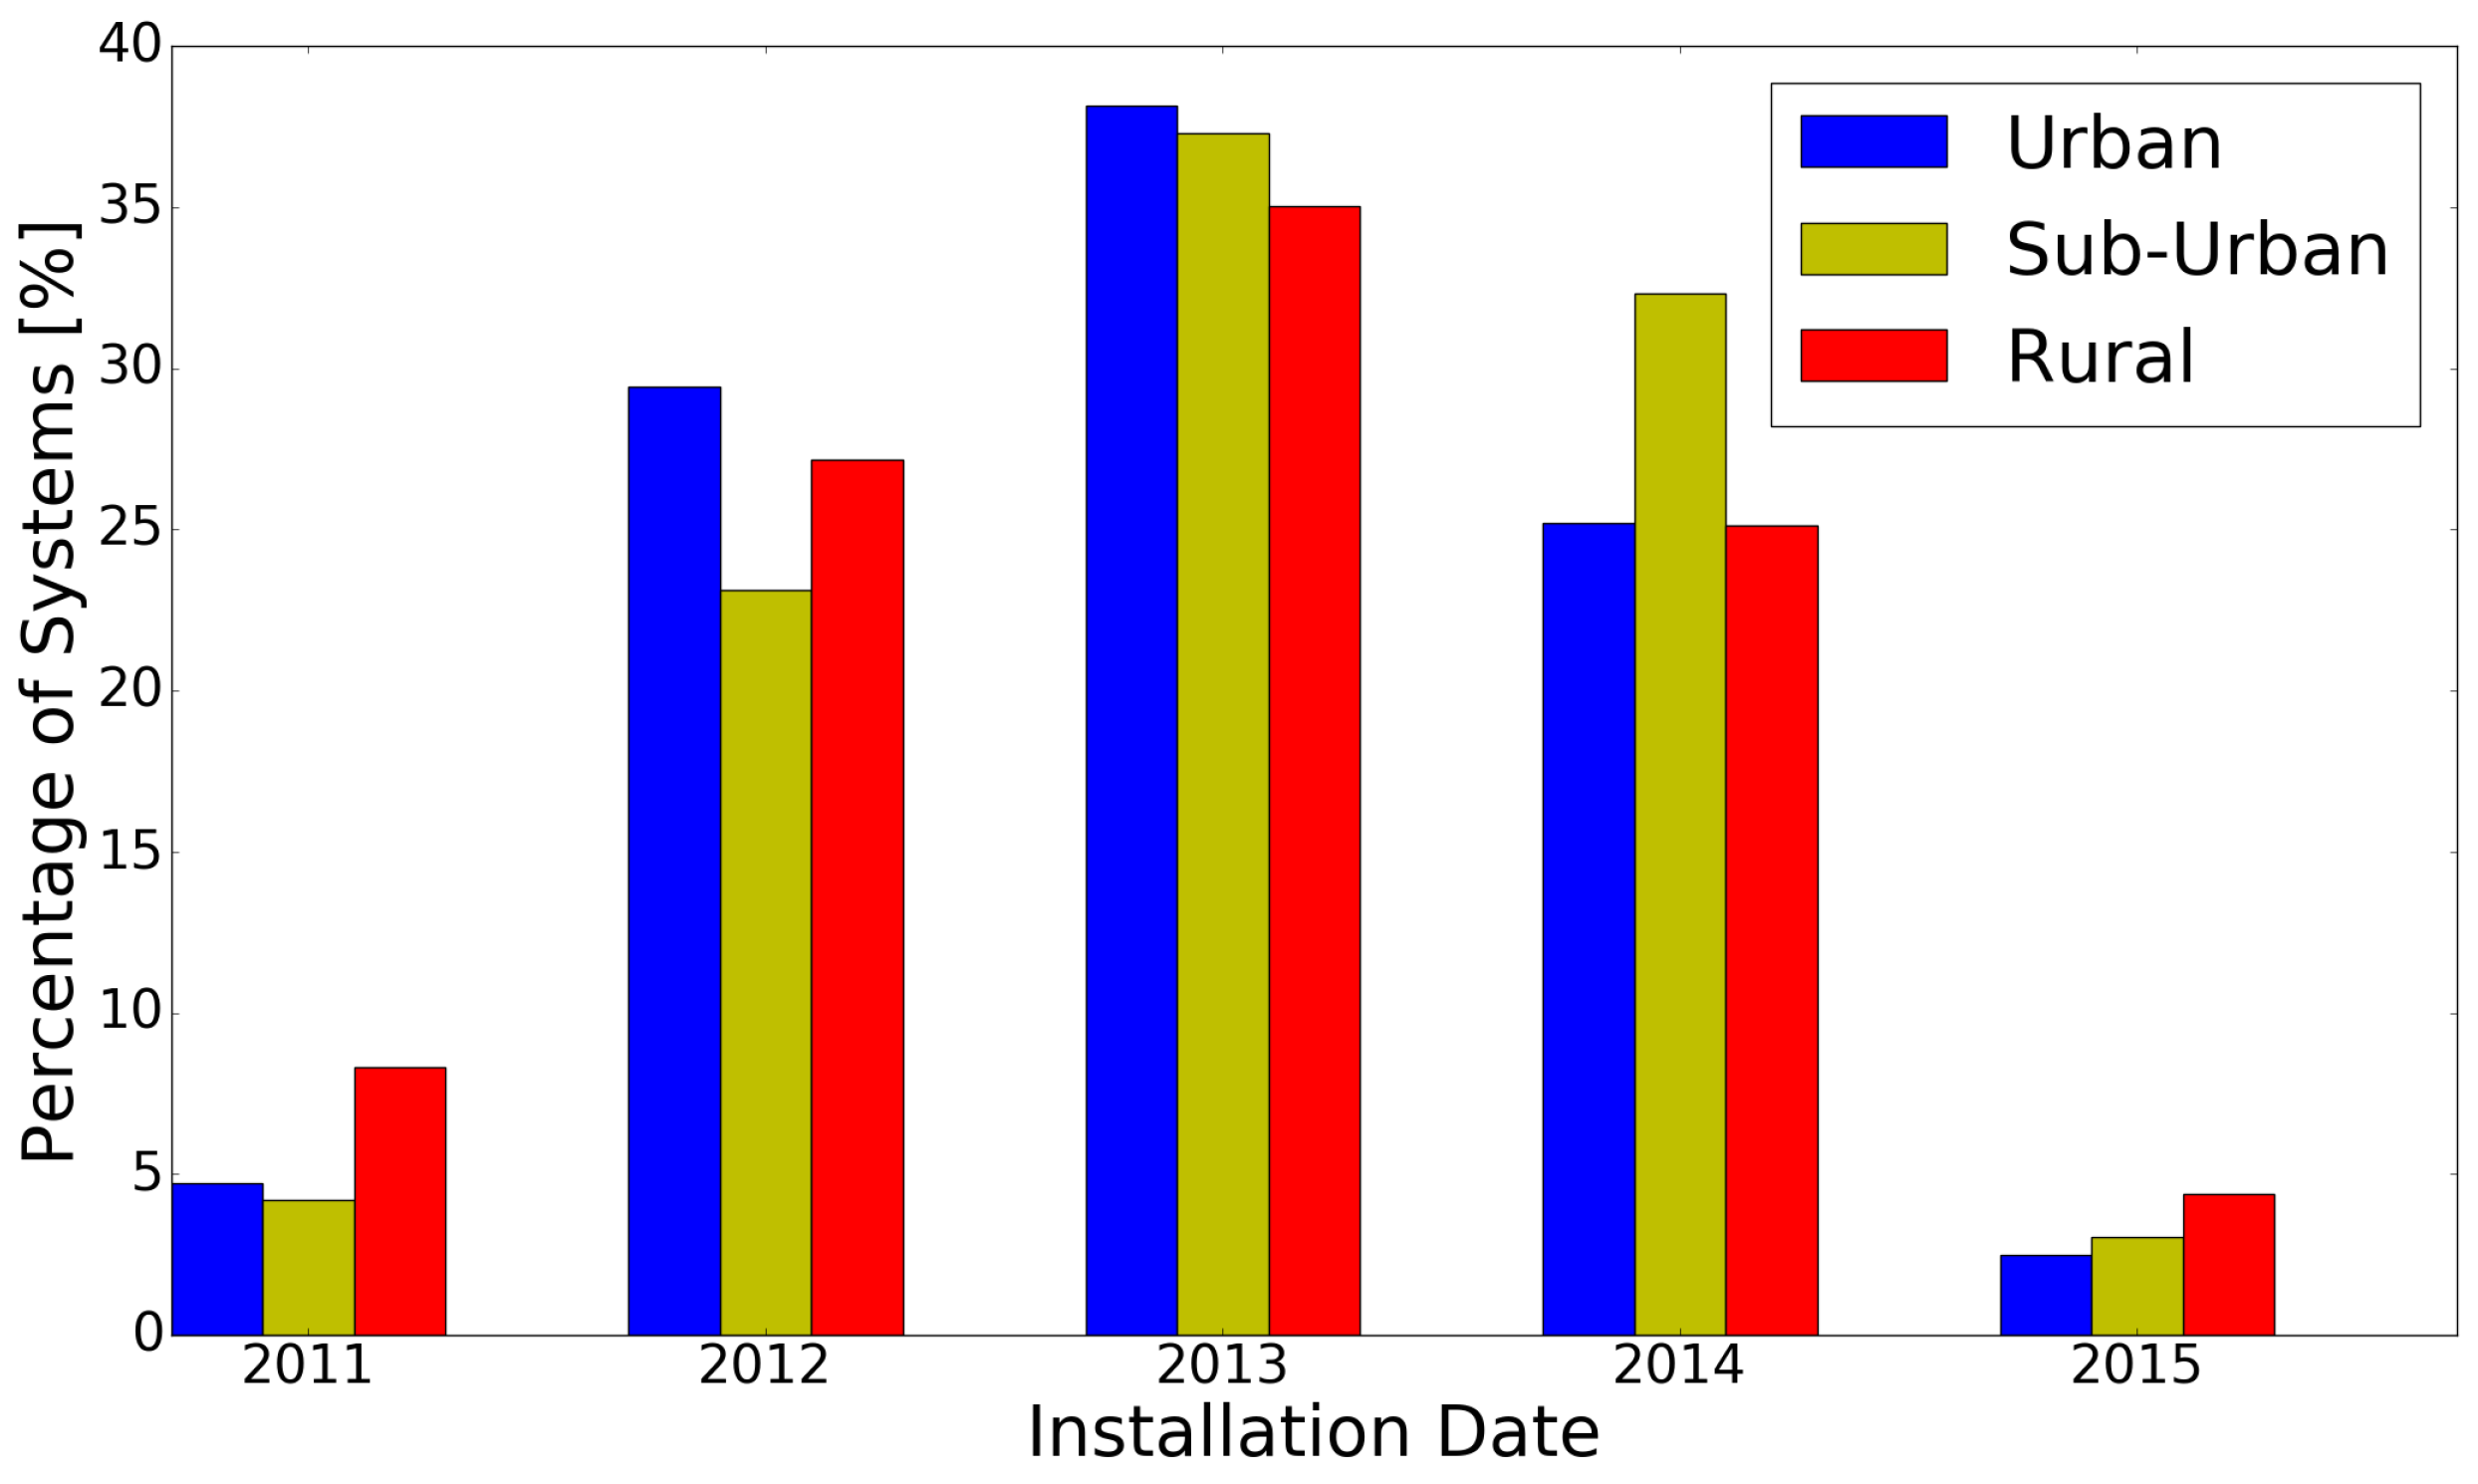
All the PV systems of the data set were divided in three categories based on the population density of the location that they were installed. This separation resulted in 1166 systems located in urban areas, 981 in suburban areas and 1119 in rural areas. With the sample almost evenly distributed between the three different types of regions, the installation date is the first parameter that was examined. Long-term outdoor exposure and operation of the modules might lead to performance decay [26], which could affect our final results. However, the distribution of the installation year, which is depicted in Figure 2 as a percentage of the total number of systems in each group, confirms that most of the modules on Dutch rooftops are relatively new. As it can be clearly seen, the majority of the systems were installed between 2012 and 2014, a time period which is not long enough for a commercial module to exhibit any form of degradation effect [27].
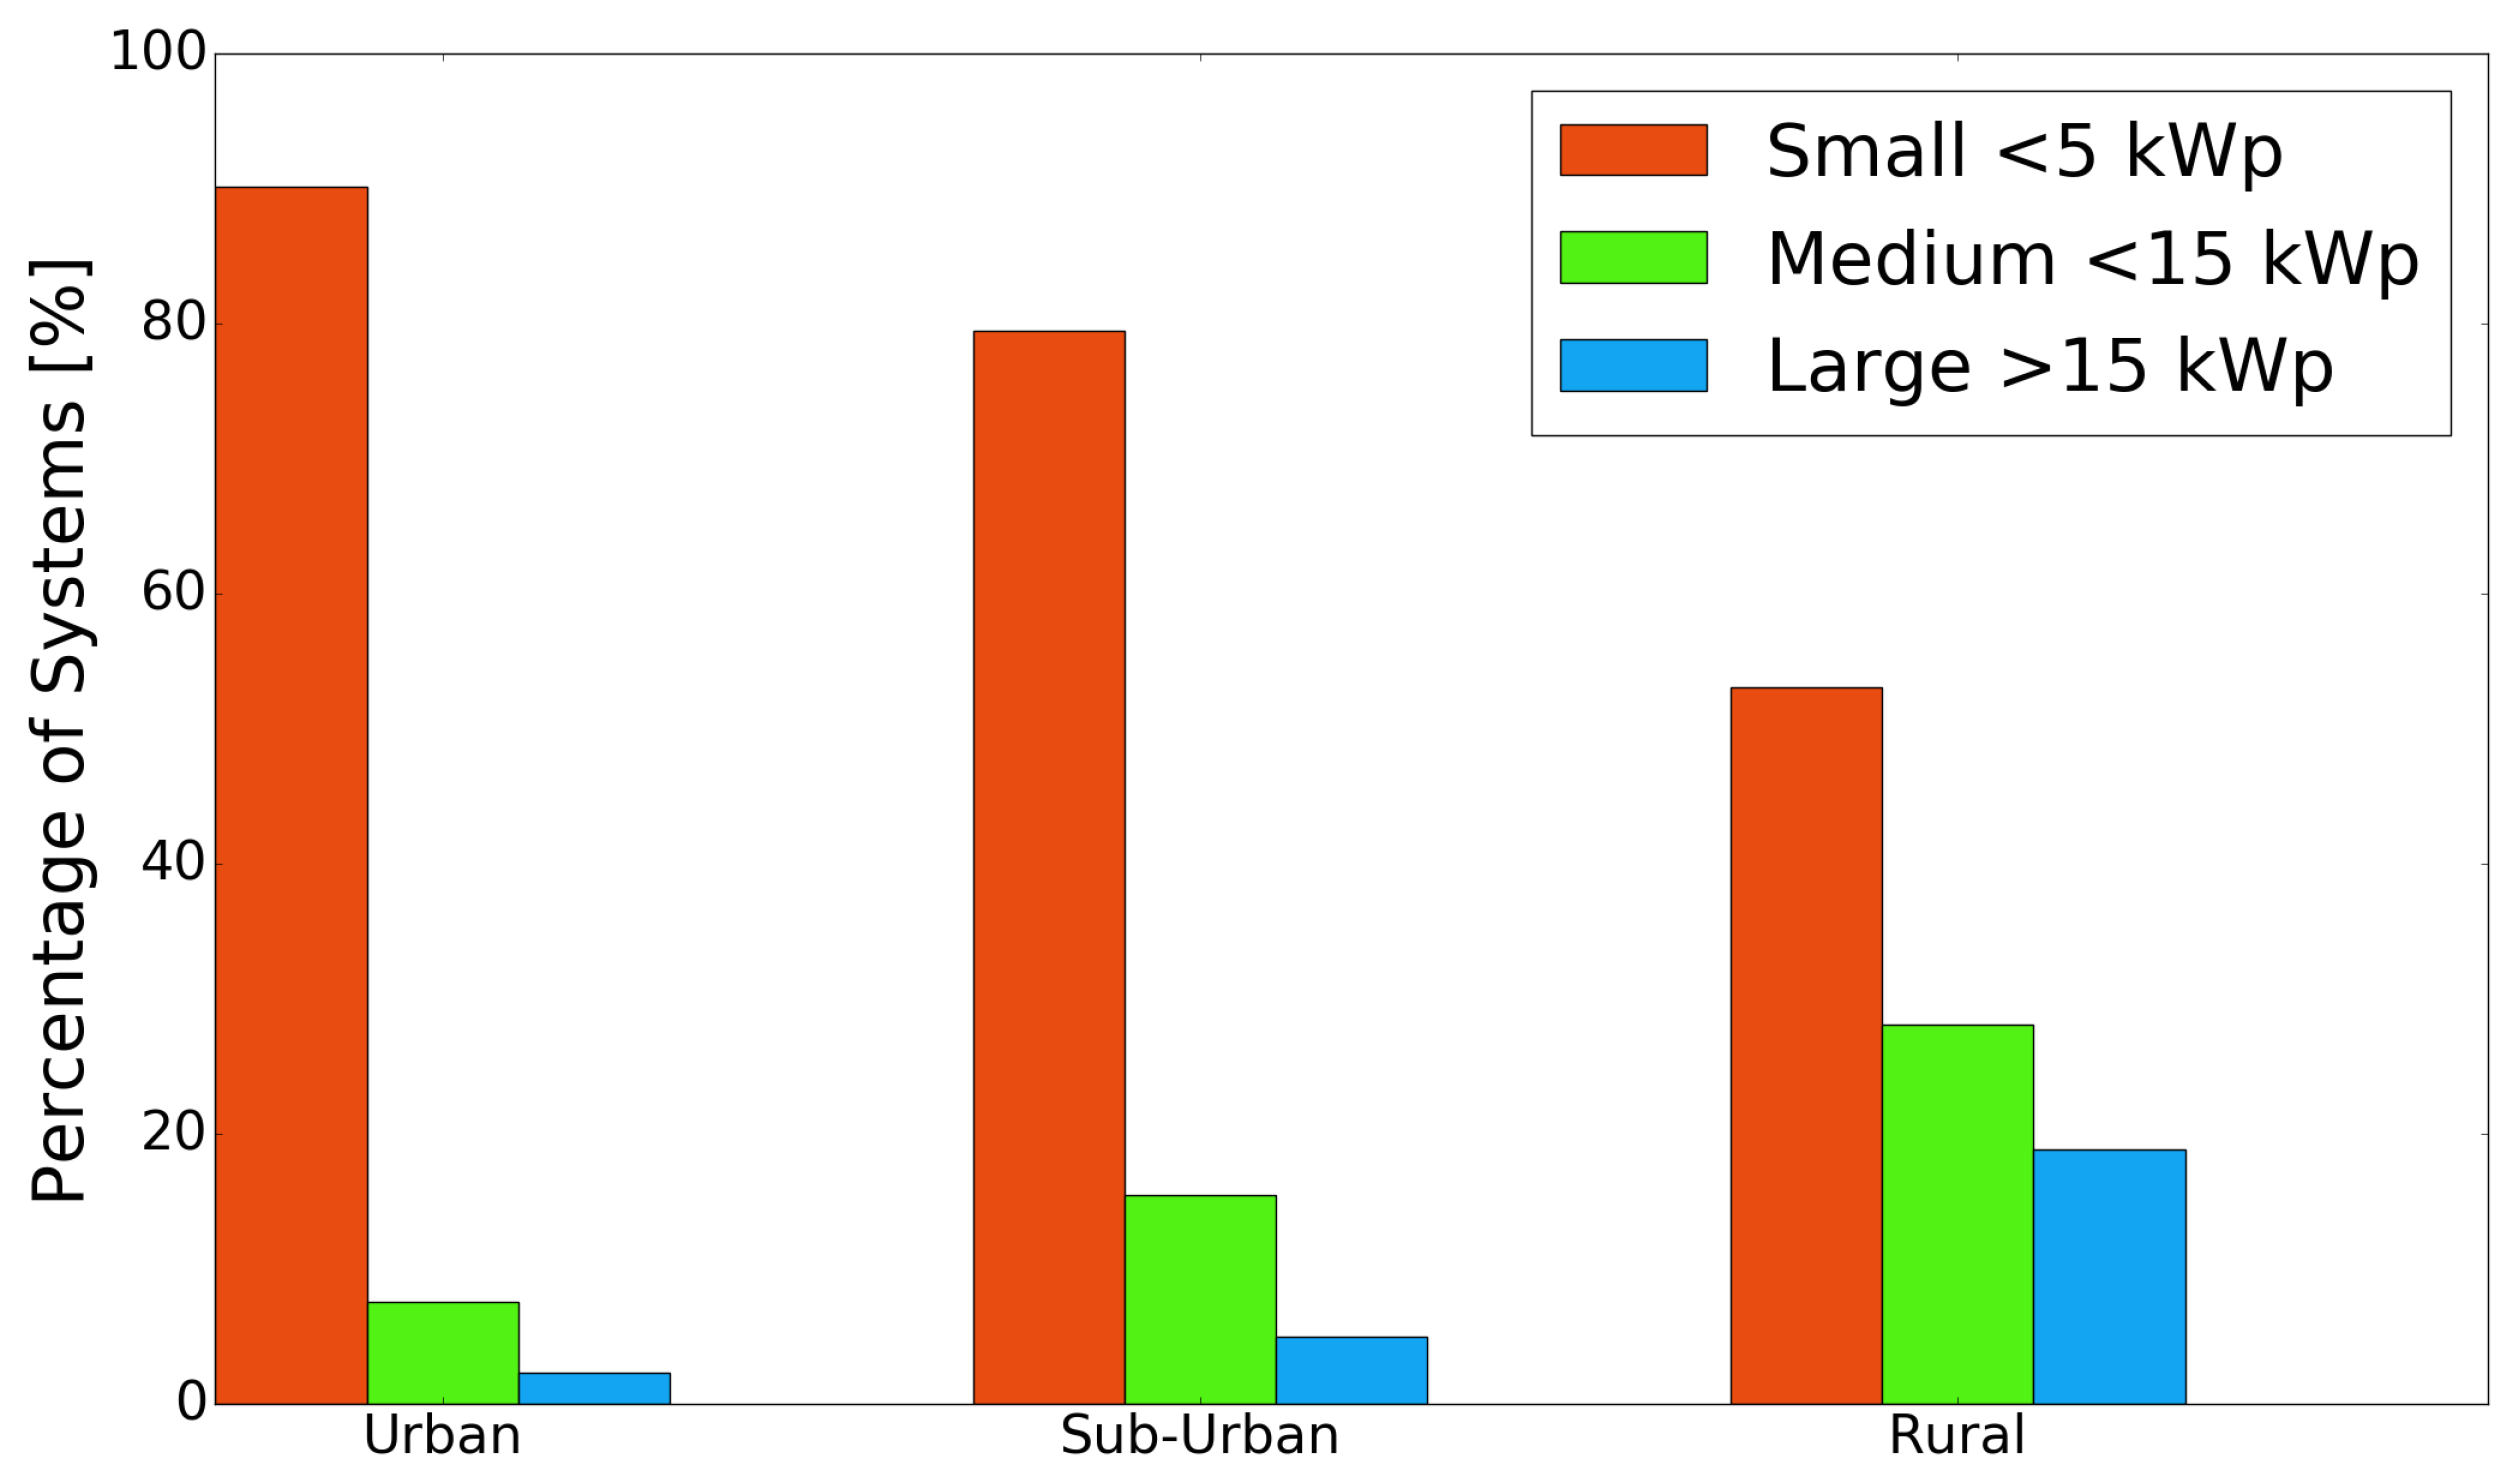
The characteristic that is affected the most from the geographical location is the average system size. Scarcity of available space is probably one of the most representative features of urban areas and unavoidably solar installations could not be an exception. While in cities the average rooftop hosts a 3.4 kWp system, in sub-urban locations, this capacity increases to 4.7 kWp, and, in rural areas, it almost doubles that figure reaching 9.2 kWp. The effects of urban compactness are illustrated in Figure 3 where 90% of installations placed in cities are smaller than 5 kWp and only 2% has a capacity higher than 15 kWp. The lower population density of rural areas results in higher availability of space, which can be better utilized by allowing room for installation of larger PV generators. Small size systems are still dominant in rural areas as 5 kWp are sufficient for the average household; however, large systems reach 19% of the total number of installations. This number accounts for the 54.3% of the total installed capacity in rural locations.
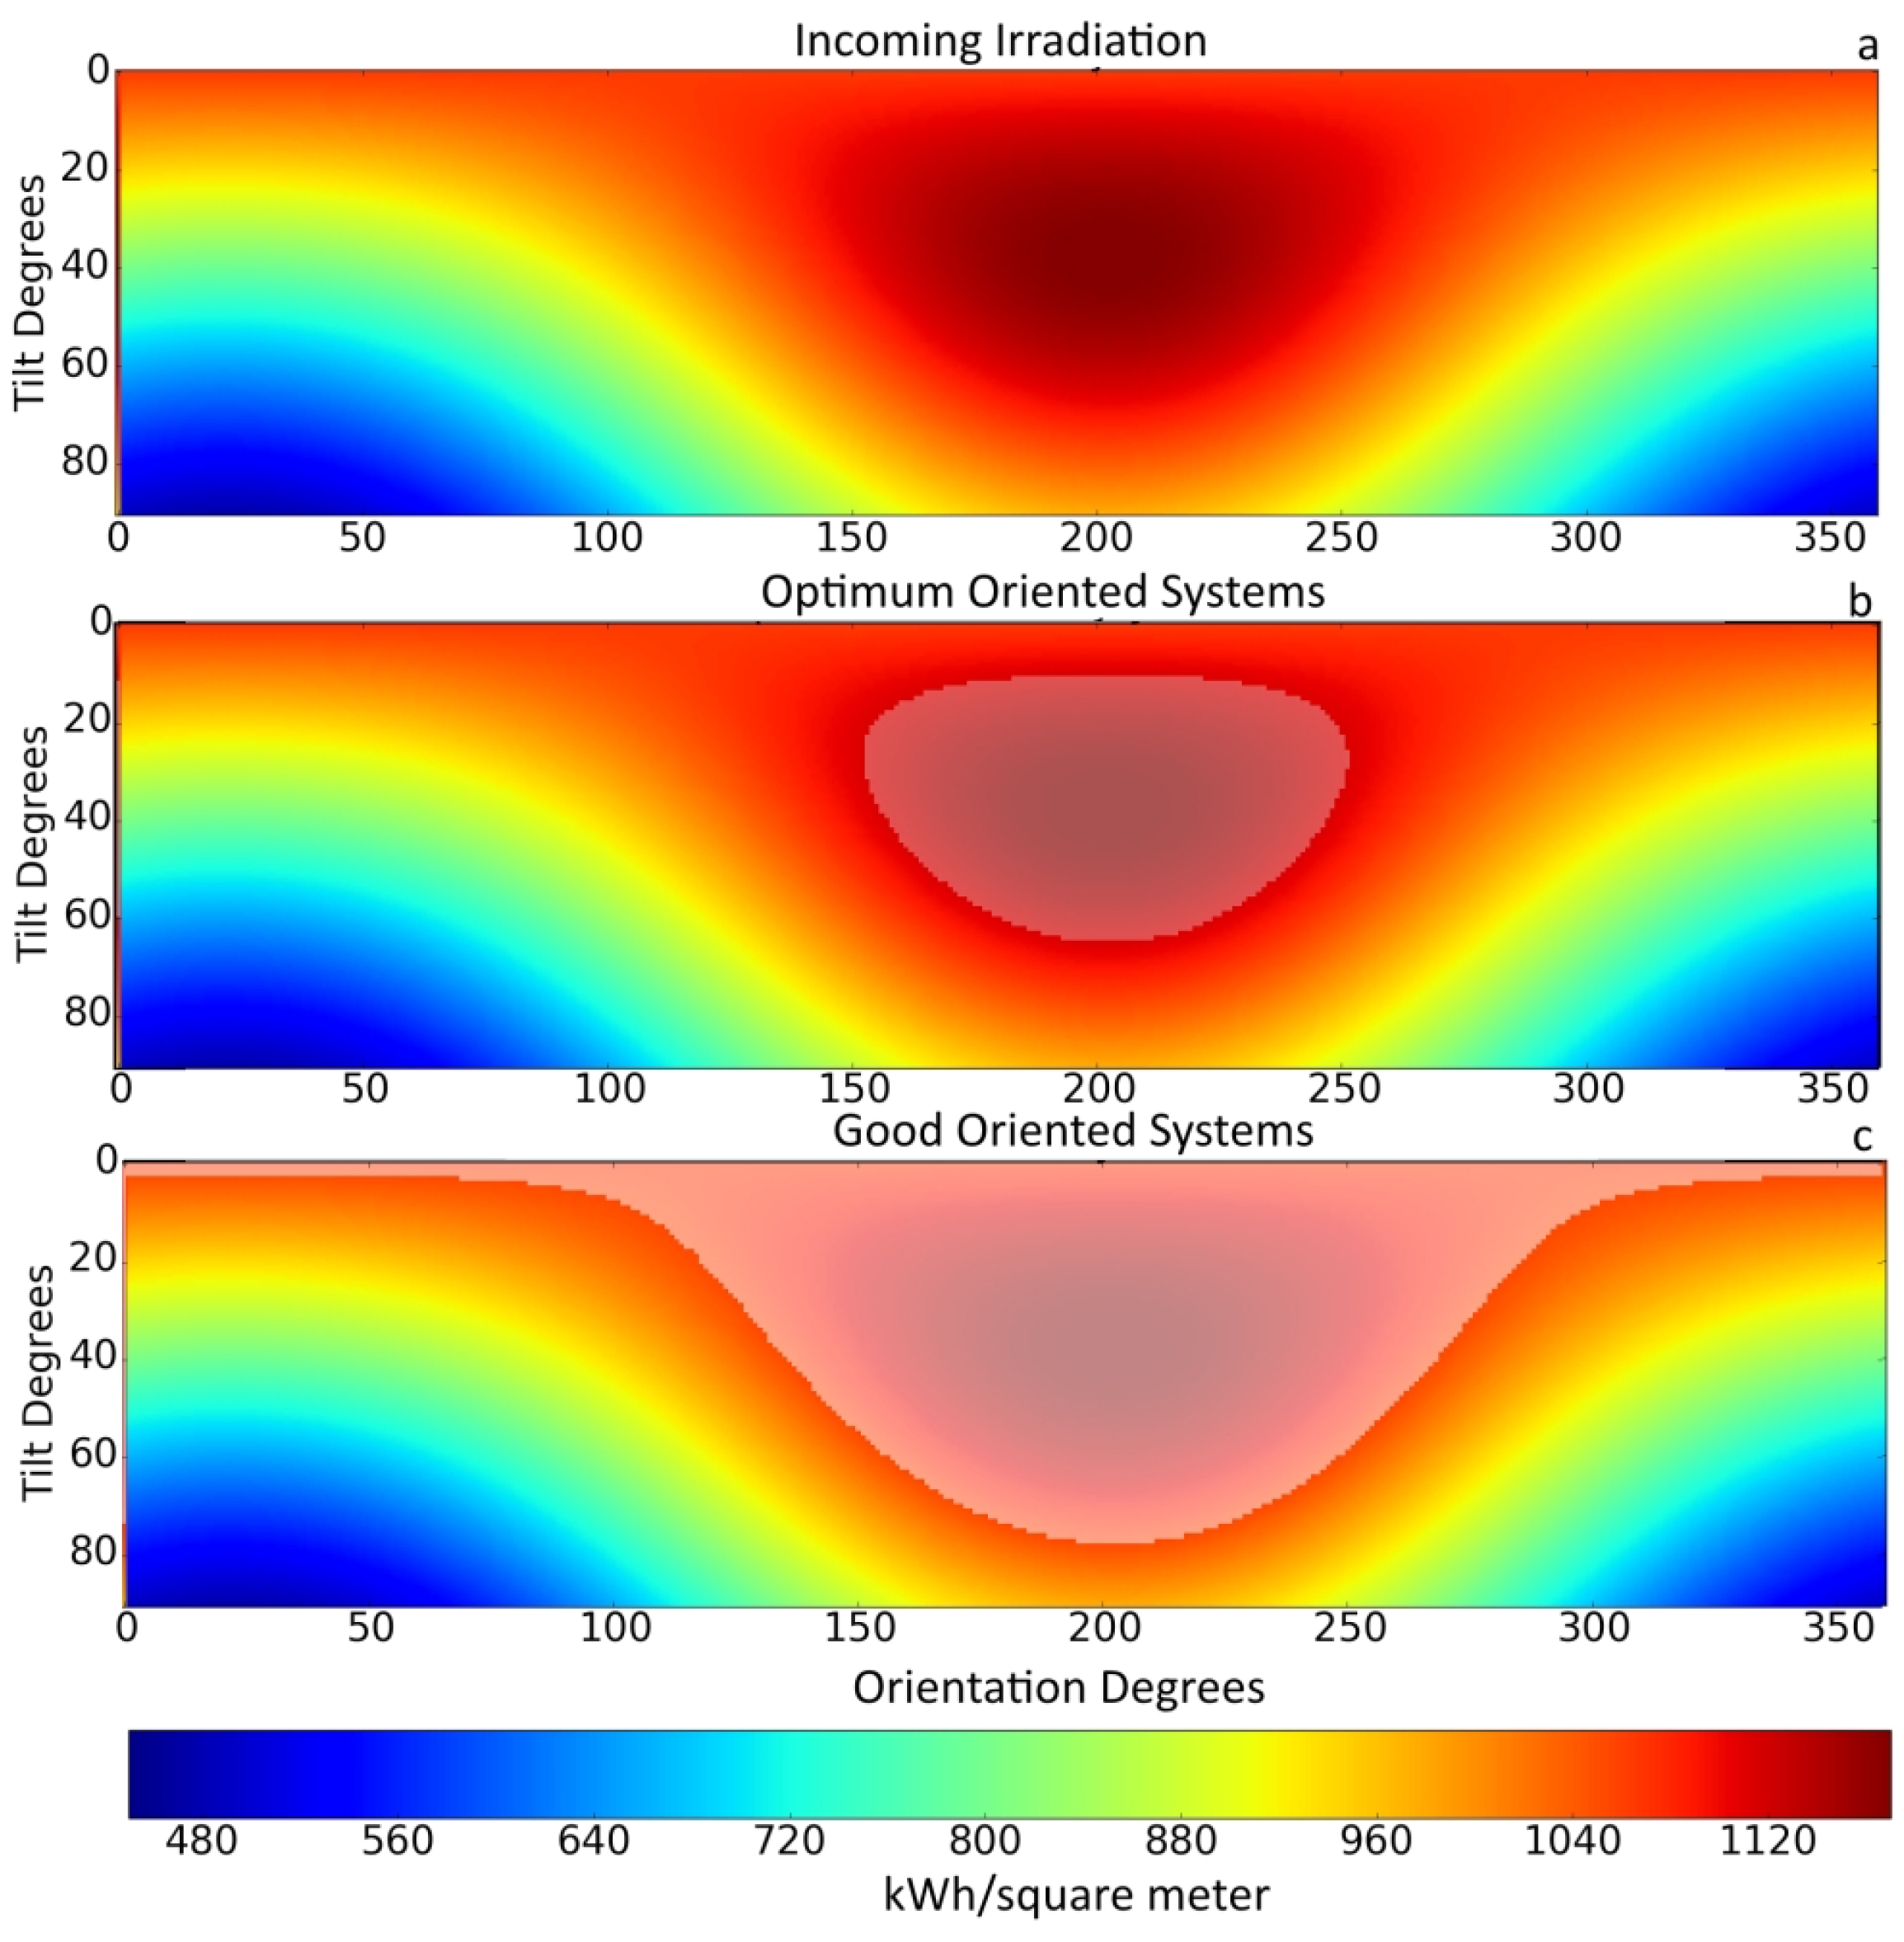
A very important factor for the electricity yield of a PV system is the tilt and orientation of the modules as they will determine the total amount of POA irradiance. A question that might arise here is whether urban compactness limits the available options for proper installation of PV modules that will result in less favorable tilt and orientation angles for systems positioned in cities. This is not expected to affect the final results of this research since the main outcome is based on the , which inherently takes into account the POA irradiance of each system, but it will exhibit at which degree the urban landscape leads to orientation dispersion and consequently to lower yields. Therefore, in order to examine whether systems are properly positioned, the average POA for the years 2014 to 2016 was calculated for every tilt and orientation angle using hourly resolution values from the KNMI meteorological stations (Figure 4).The average annual energy irradiation for this period is maximized at 1045 kWh/m2 for PV generators oriented at 200° (with South being 180°) and having an inclination of 37°. The displacement from the South is due to the clearing of morning clouds in the afternoon, which results in a larger share of radiation in the afternoon, and thus leading to off-South optimum orientations [28]. In order for a PV system to be able to harvest at least 95% of the incoming irradiation the tilt and the orientation angle should fall within the grey shaped area in Figure 4b, which extends from 152° to 252° for the orientation and 10° to 64° for inclination. The grey colored area in Figure 4c represents the range of orientation and inclination angles that are necessary to collect at least 90% of incoming irradiation. Since, in most cases, the exact configuration of each installation is dictated by the roof that the PV is mounted on a large variation is revealed as expected. However, the extent of this variation is a an indicator of how well a system is planned before installation. By considering as good oriented systems the ones that were able to harvest at least 90% of the maximum incoming irradiation (grey colored area in Figure 4c), in the data set, we find that 90%, 88% and 92% of urban, suburban and rural systems, respectively, fall in this category. More specifically by setting the optimum harvested POA to 95% (shaded area in Figure 4b) the same values are 75%, 74% and 77%. These numbers demonstrate that, at least in this case, urban compactness is not leading to extreme misplacement of installations especially in locations with limited availability in rooftop area.
3.2. Performance Analysis—Seasonal Variation
As it was specified in the introduction, 5-minute resolution power data were collected from each site. Each system is characterized by its latitude and longitude values completed with the corresponding tilt and orientation of the panels. In that way, the calculation of both the Annual Yield and the Performance Ratio was feasible. Due to system failures, in very few cases, part of data was either not recorded or not transmitted. To encounter the issue of missing entries, only installations that operated at least 97% percent of the time each year were taken into account for the calculation of annual yield and . The summary of the performance indicators is presented in Table 1, and it is in compliance with similar values that are reported for the Netherlands in previous research [29,30].
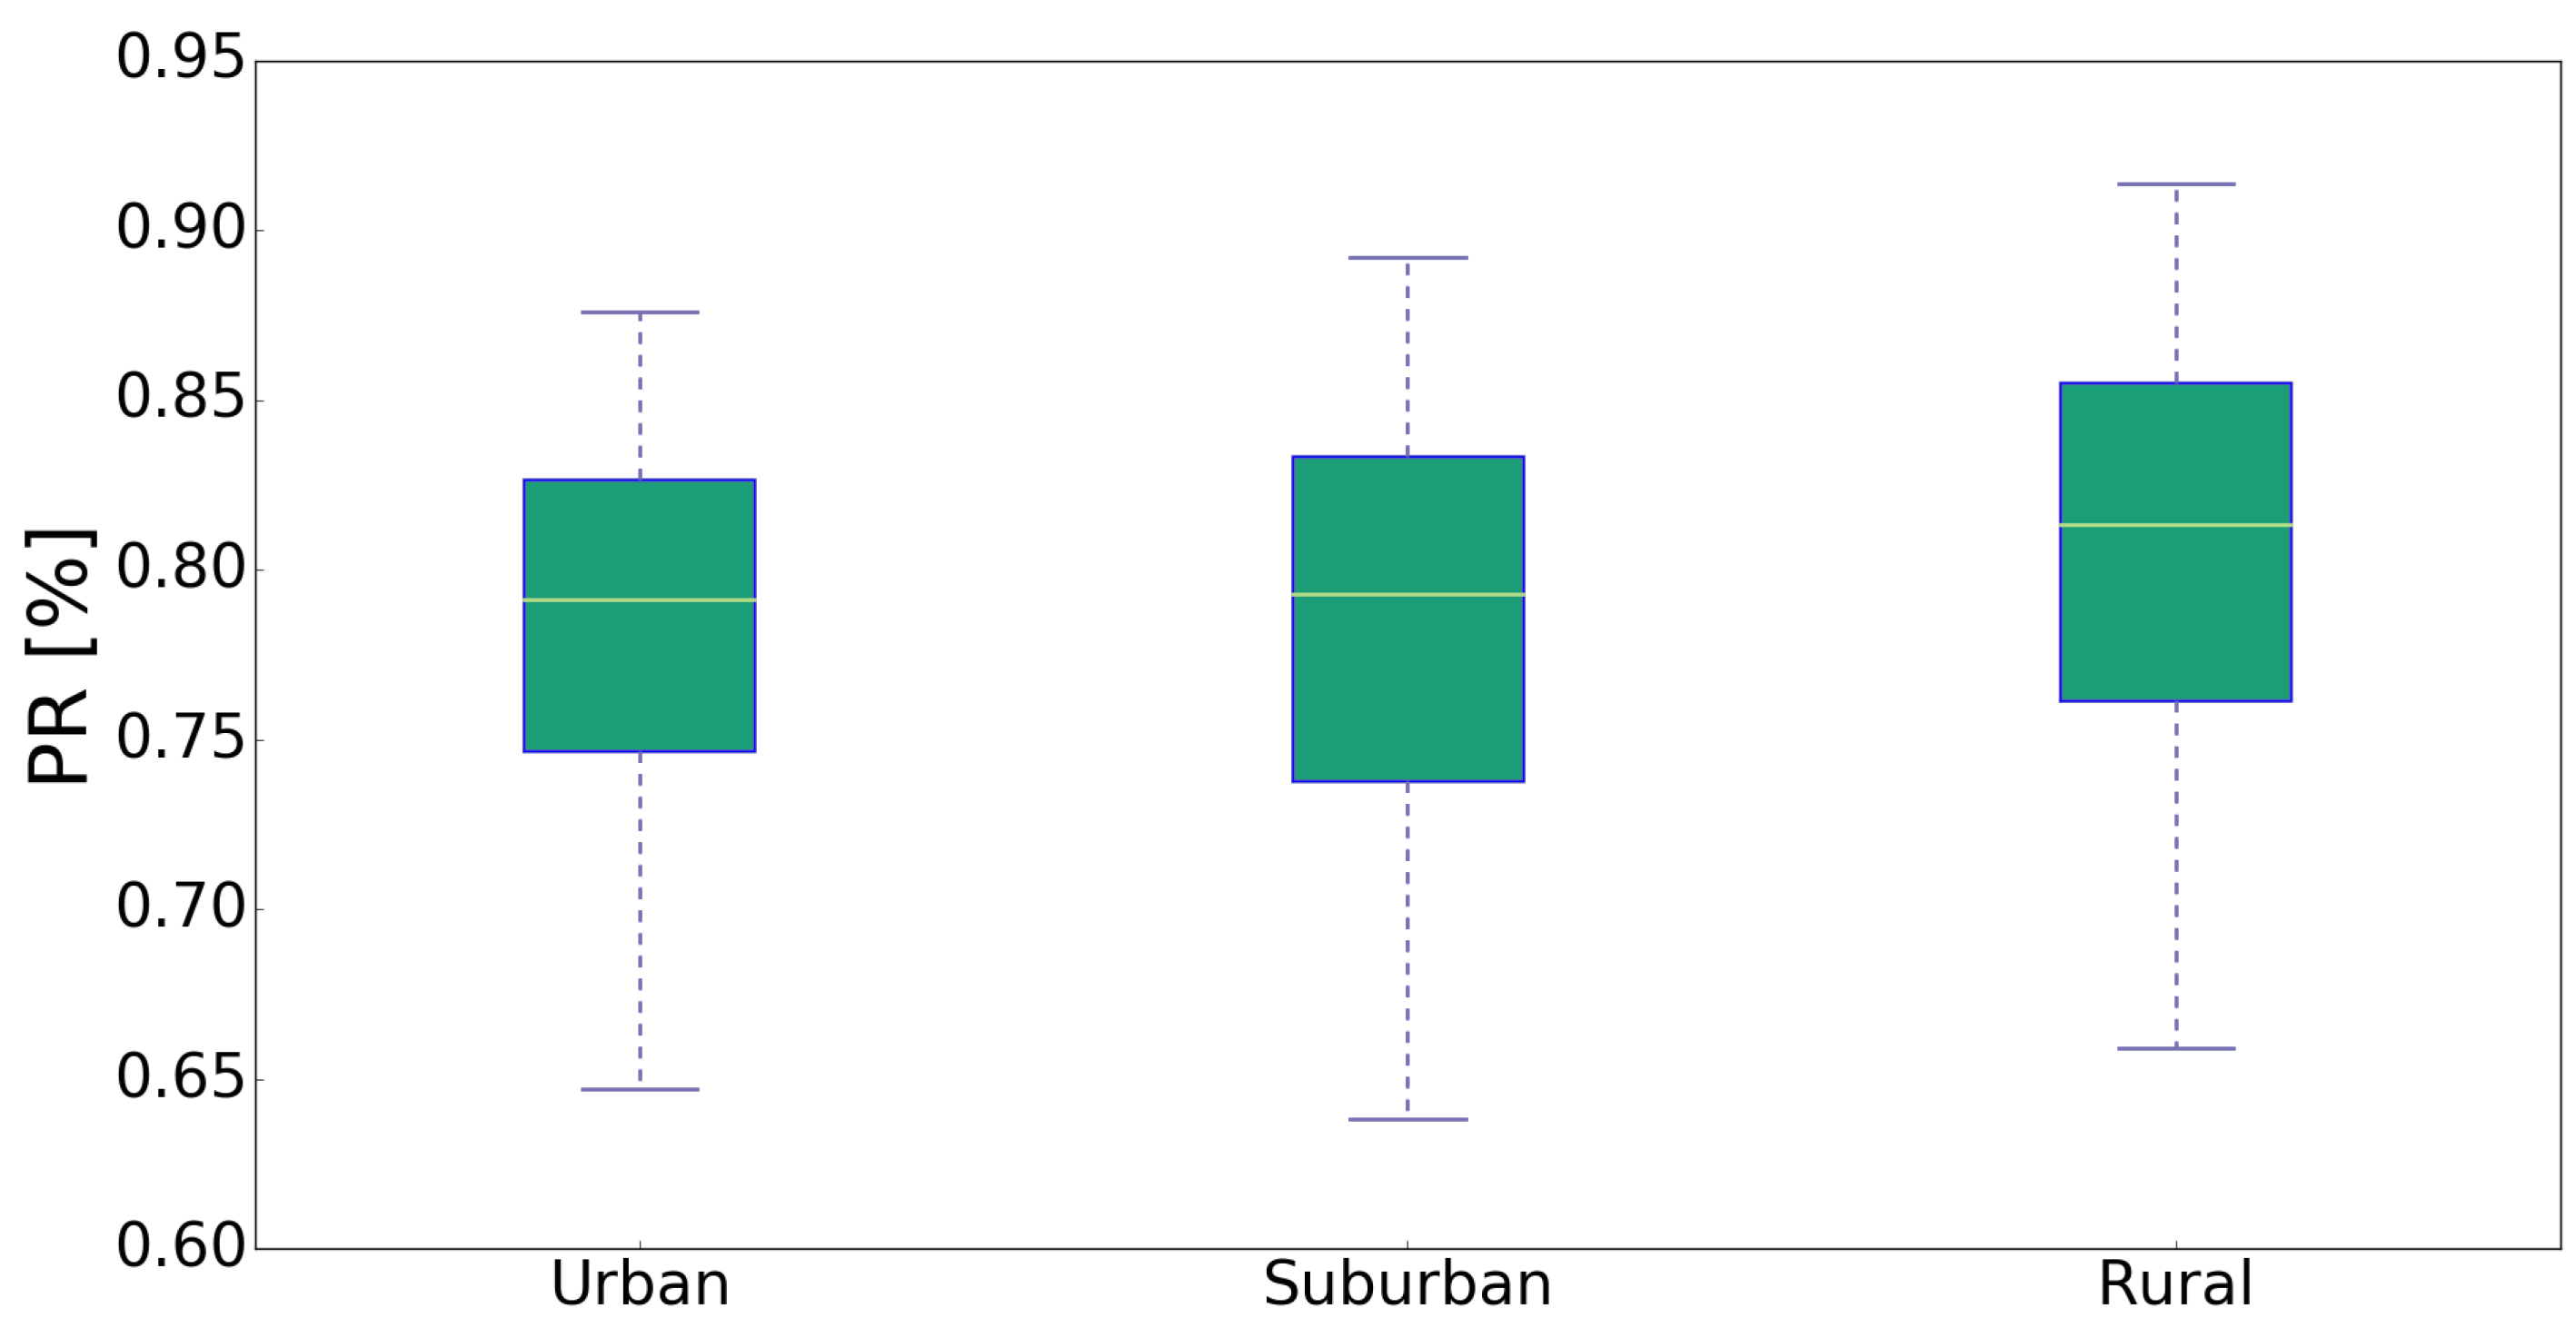
To determine whether there is a variation in performance between PV generators located in urban, suburban and rural areas, the dataset of 2016 is presented as a boxplot in Figure 5. Comparison of values can reveal losses caused by wiring, system failures, Alternating Current/Direct Current (AC/DC) conversion and dust, which are mainly system dependent, but it can also unveil a situation were a system is shaded for a long period of time or it is exposed to higher temperatures. To further investigate if the means of the three groups demonstrate significant statistical difference, one way Analysis of Variance (ANOVA) was performed, which is a common practice to identify differences in PV monitoring [31]. The null hypothesis was set so that the three distributions had no difference in the mean values.
The result shows that there is indeed an effect of the location on the performance of the PV installation at the p level for the three samples (F = 18.56, p = ). However, the ANOVA test states whether there is an overall difference between the groups, but it does not allow us to know which specific groups differed. Therefore, it is necessary to conduct a post hoc test, since it is designed for situations where additional exploration of the differences among means is required to provide specific information on which means are significantly different from each other. Post hoc comparisons using the Tukey Honest Significant Difference (HSD) test indicated that the mean performance of rural systems (mean = 81, std = 6.3) was significantly higher than the mean performance of urban systems (mean = 78.4, std = 5.6), as it was compared to suburban systems (mean = 78.5, std = 6.4). However, urban and suburban systems did not show a significant difference between them, and, therefore, for seasonal variation, only the urban and rural systems will be taken into consideration. Taken together, these results suggest that the location of a PV system really does have an effect on the annual performance.
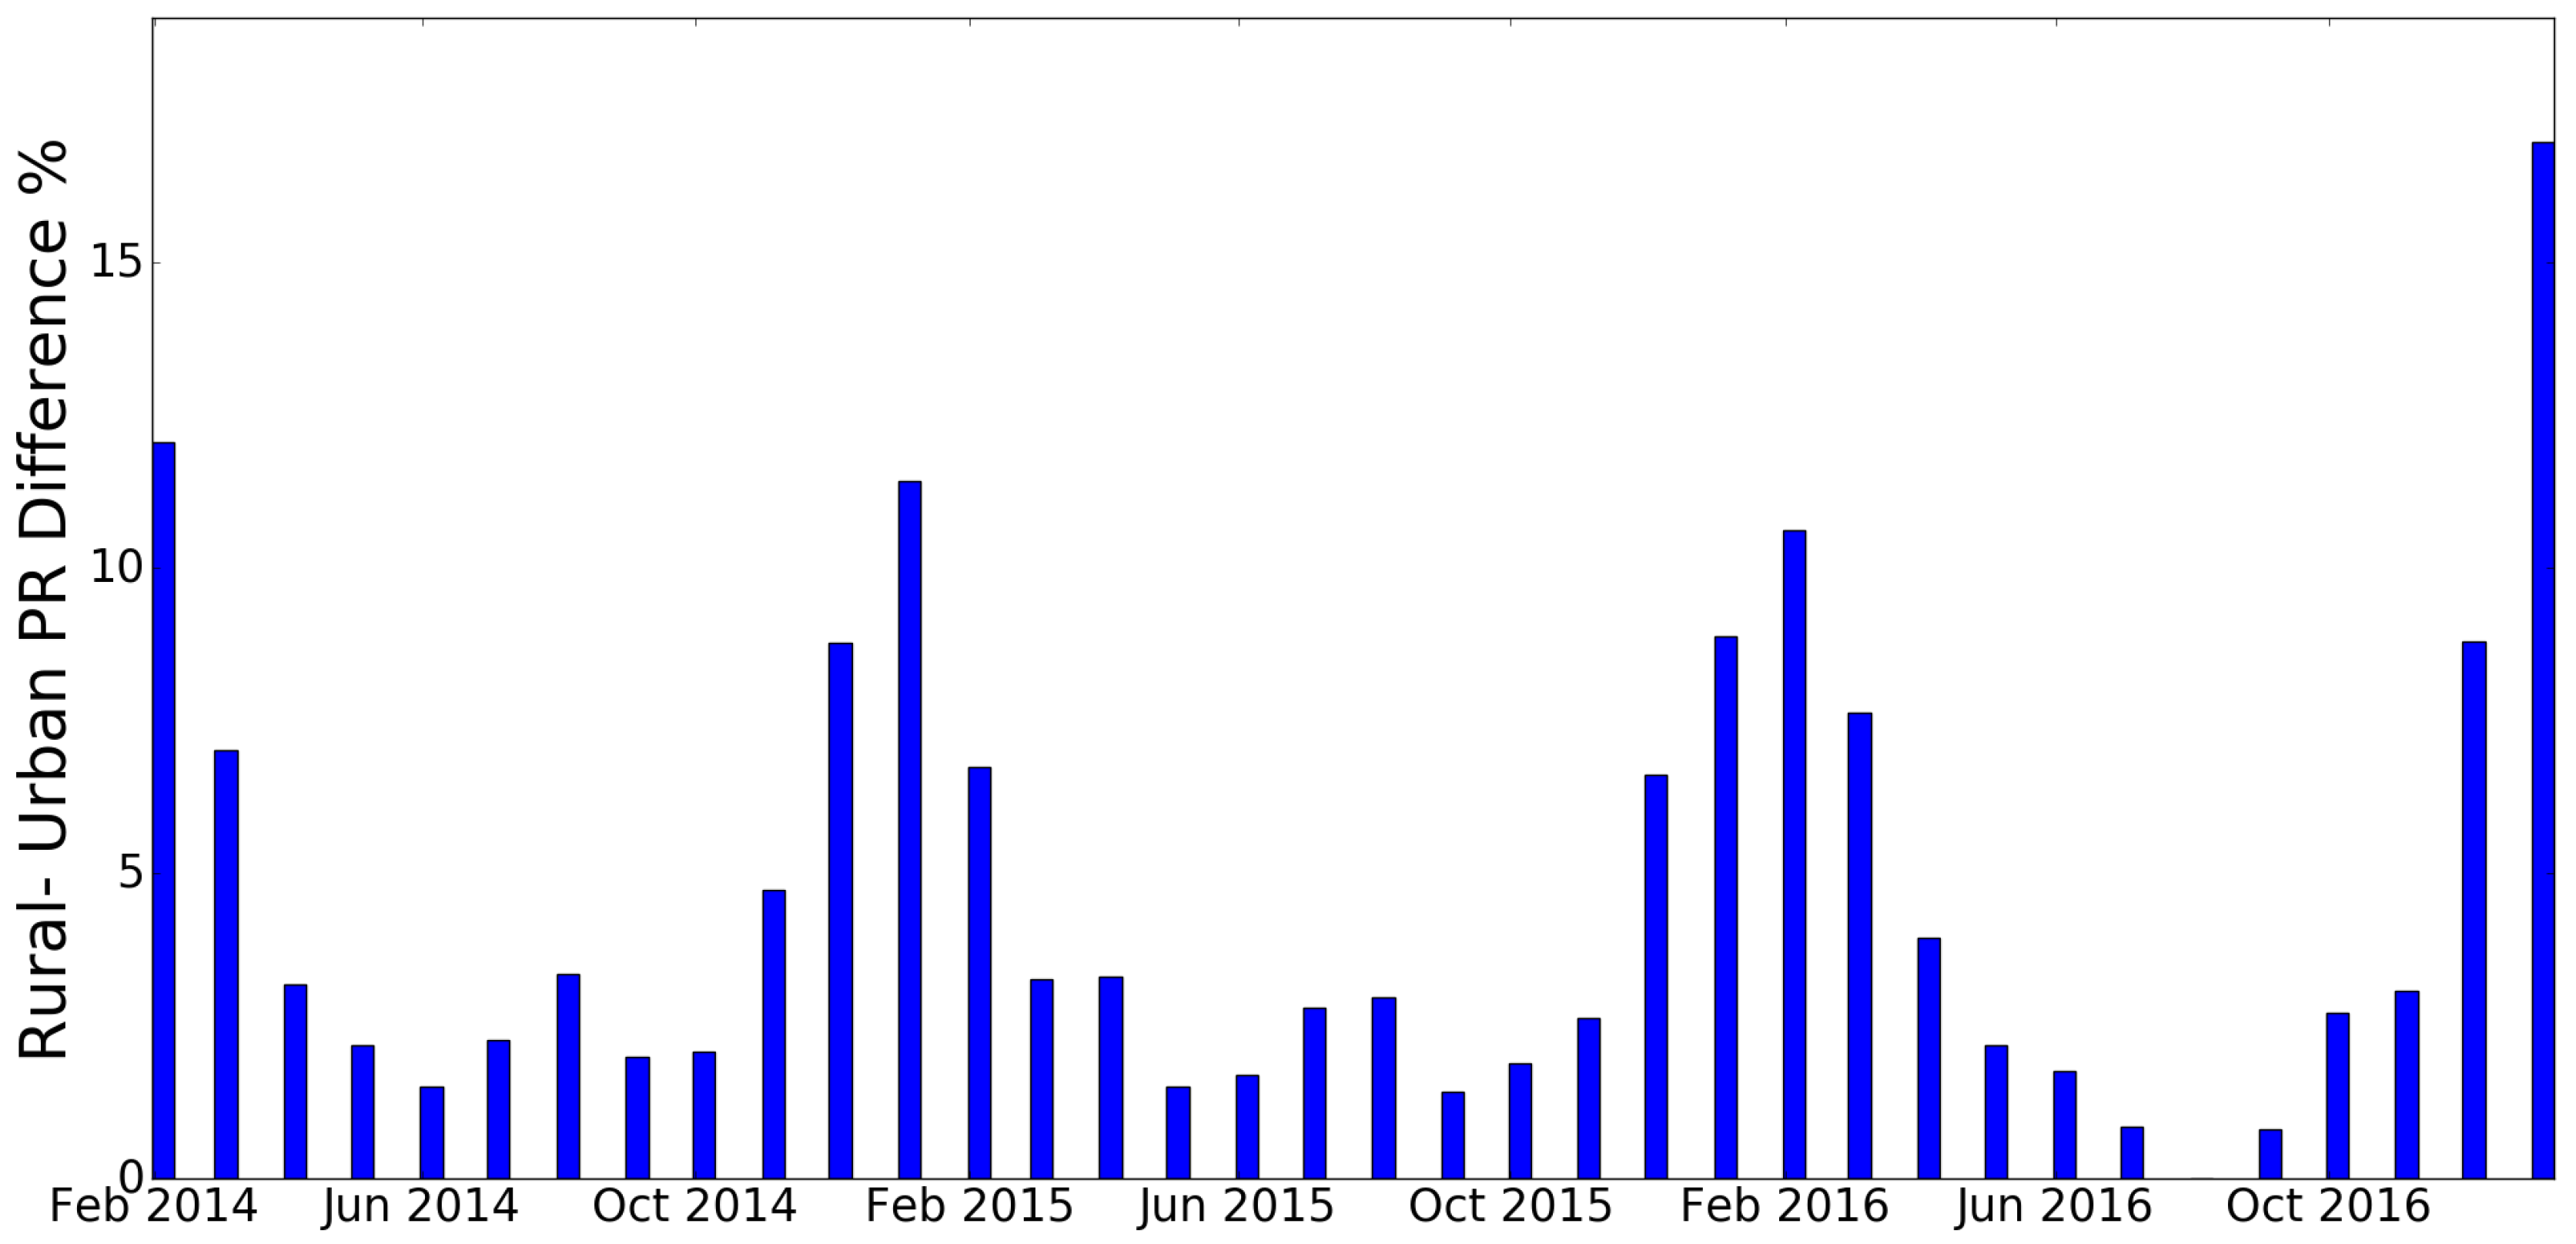
To further identify the causes of this performance mismatch in the annual mean values, it is necessary to investigate whether the difference is leveled throughout the year, or it is subjected to a seasonal variation. For that purpose, the monthly value differences between rural and urban systems will be compared. As it is shown in Figure 6, there is a specific pattern that the percentage difference between the monthly values follows consistently for the entire period of monitoring. During winter months (December–February), PV generators that are located in rural areas are outperforming the ones located in urban areas by up to 16% in some cases. The difference gradually declines during spring and summer months where it reaches a minimum of 0.2–3.4%.
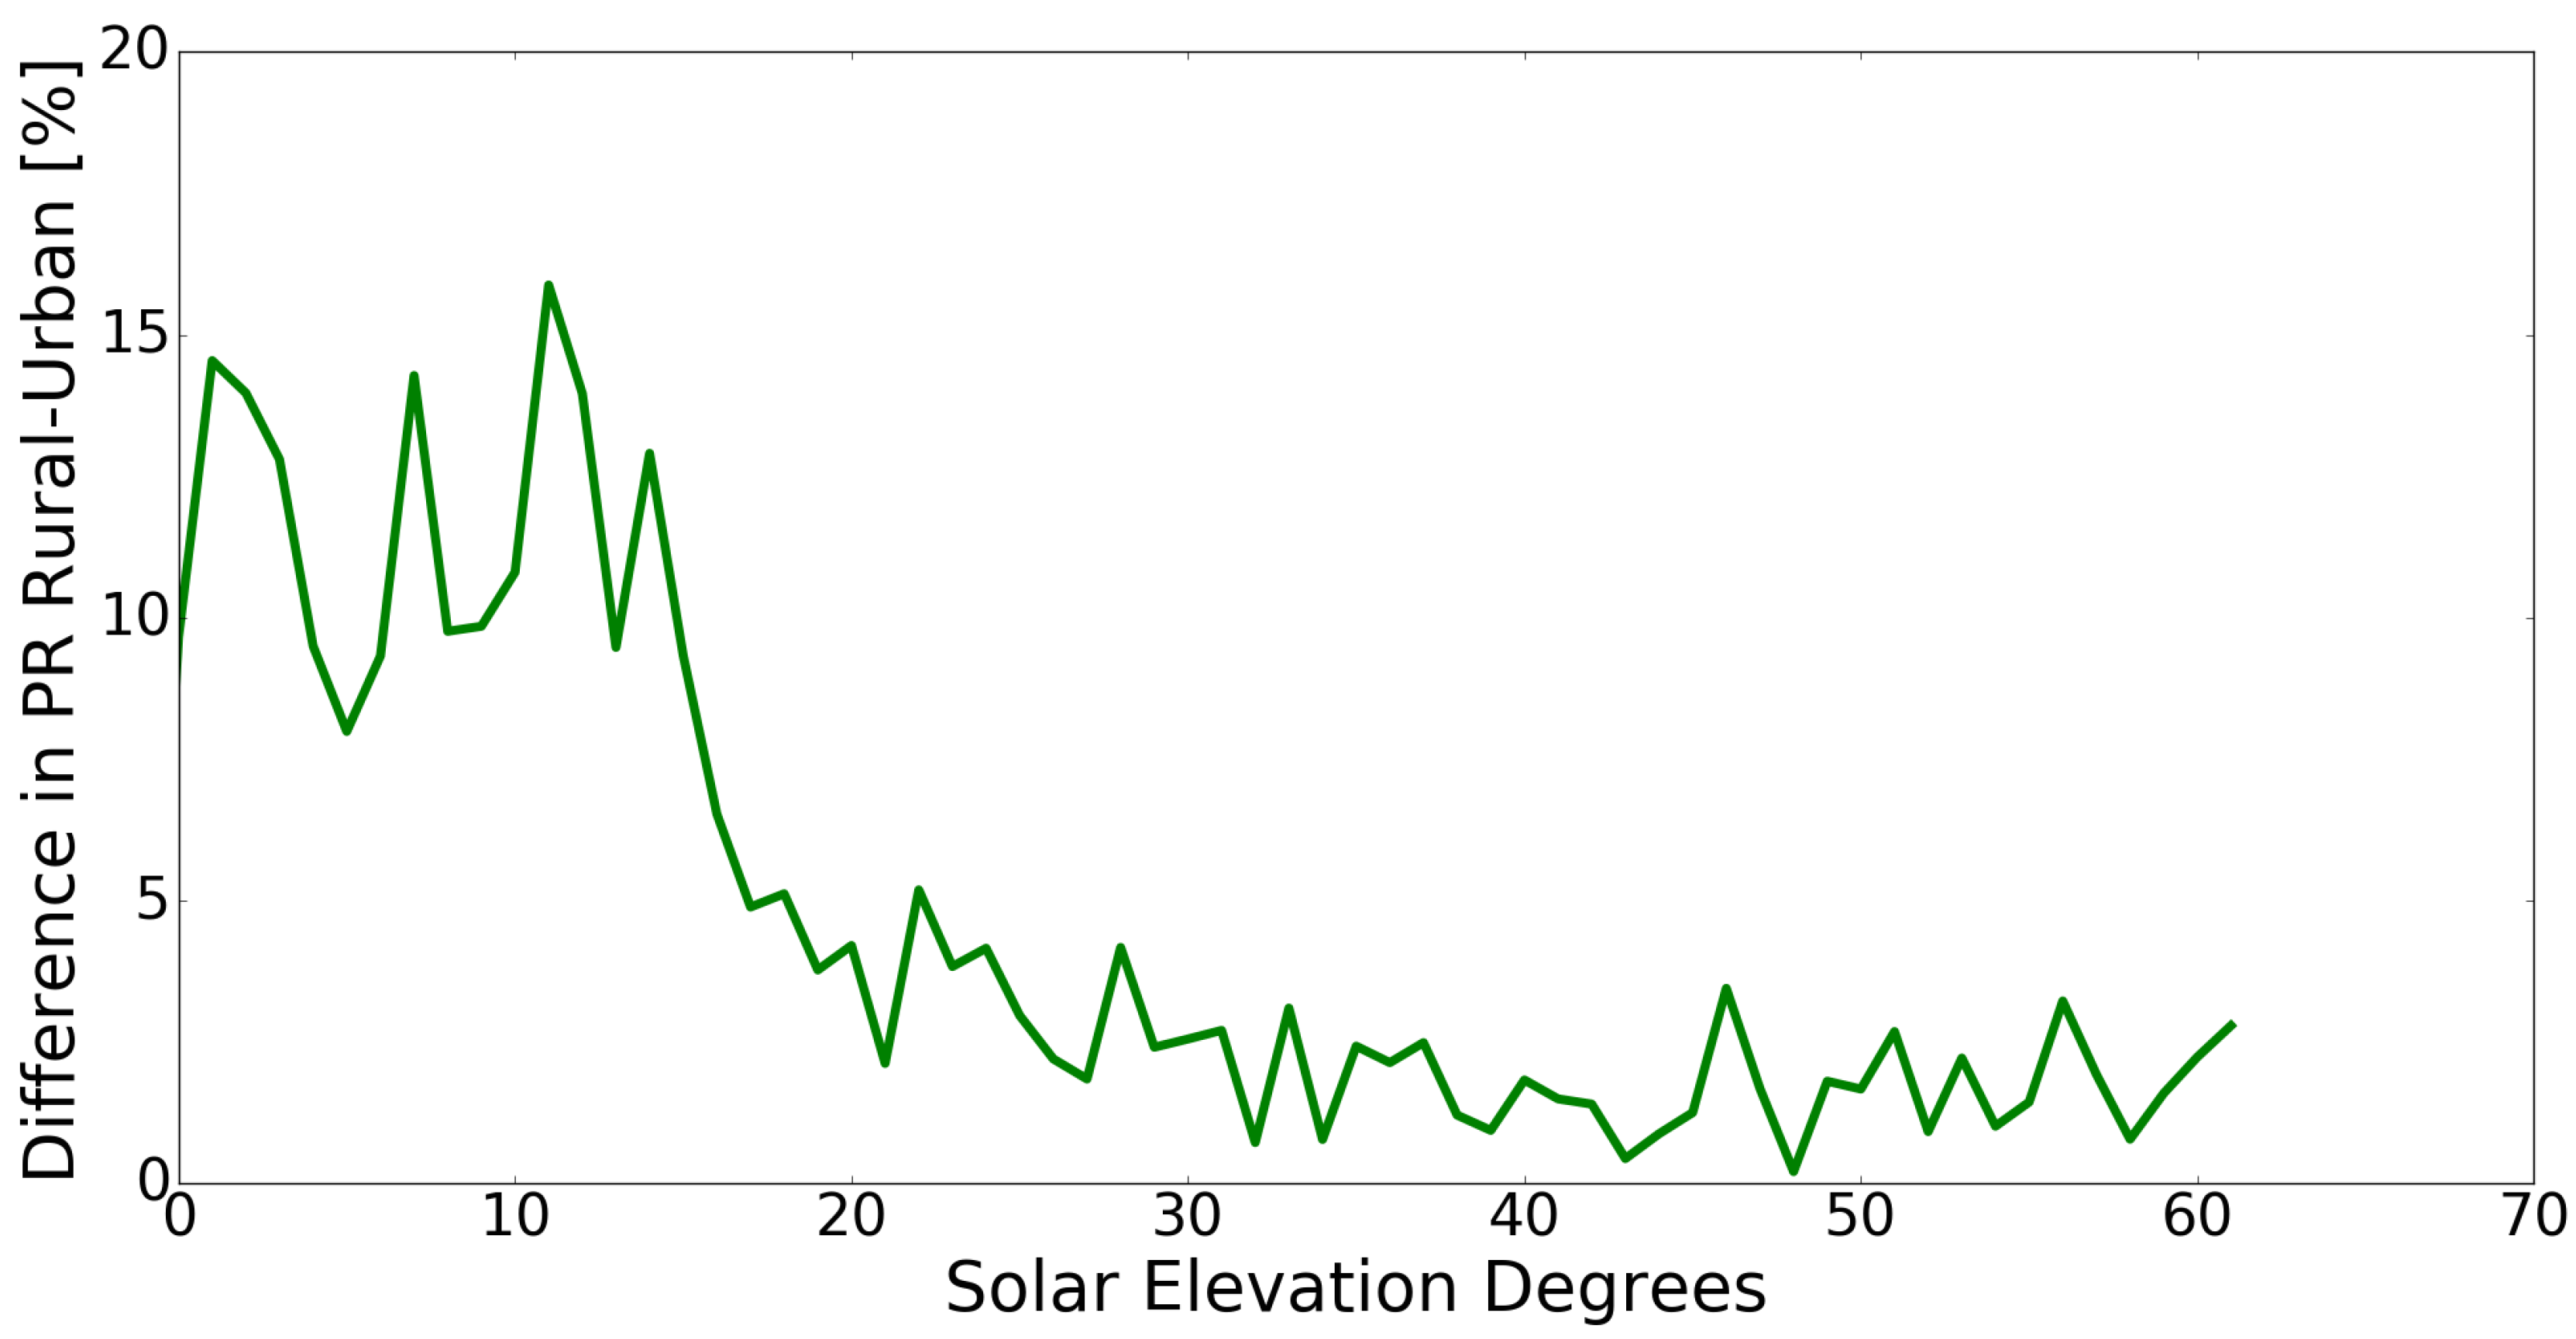
The seasonality and the consistency of the effect can be attributed only to variations in environmental parameters. Since the highest difference is observed during winter months, additional focus will be set on irradiation conditions, and specifically the trajectory of the sun. For the geographical coordinates of the Netherlands (Amsterdam 52.3702° N, 4.8952° E), the maximum solar elevation is limited to 15° in December and 20° in January, but it can reach 61° in June. In order to examine the effect of the solar elevation on PV performance, is correlated to solar elevation degrees (Figure 7) using the PVLIB library of Python [32] and the specific coordinates of every installation. As it is observed, for low elevation angles below 18°, the difference in values can reach 15% in favor of rural systems. While low solar paths are in general not favorable for the energy yield of PV installations regardless their specific location, it appears that it has a stronger effect on the ones located in urban areas. A possible explanation is that low solar elevation is more likely to cause shading in the dense environment of a city rather than in a sparsely occupied rural area. To consider the overall effect on the energy production on a yearly basis, it is highlighted that, during late autumn and winter months (November–February), which corresponds to 1/3 of a year, the sun spends 79% of its time in the sky below the threshold of 18°. However, besides this behavior that is observed for a part of the day or the year, a systematic difference that can reach 5% in favor of rural systems is noticed for the rest of the time and therefore a more detailed analysis is conducted over specific urban indicators.
3.3. Performance Analysis—Urban Indicators
Thus far, it is demonstrated that the urban environment can have a strong effect on the overall performance of a PV system. The characterization of different locations was based on the population density; however, not all the urban and rural environments exhibit the same morphology neither does the population density necessarily dictate the urban landscape, since large structures such as public or office buildings could be in non-residential areas. Therefore, it is necessary to identify specific indicators that could quantify the effects of urban compactness.
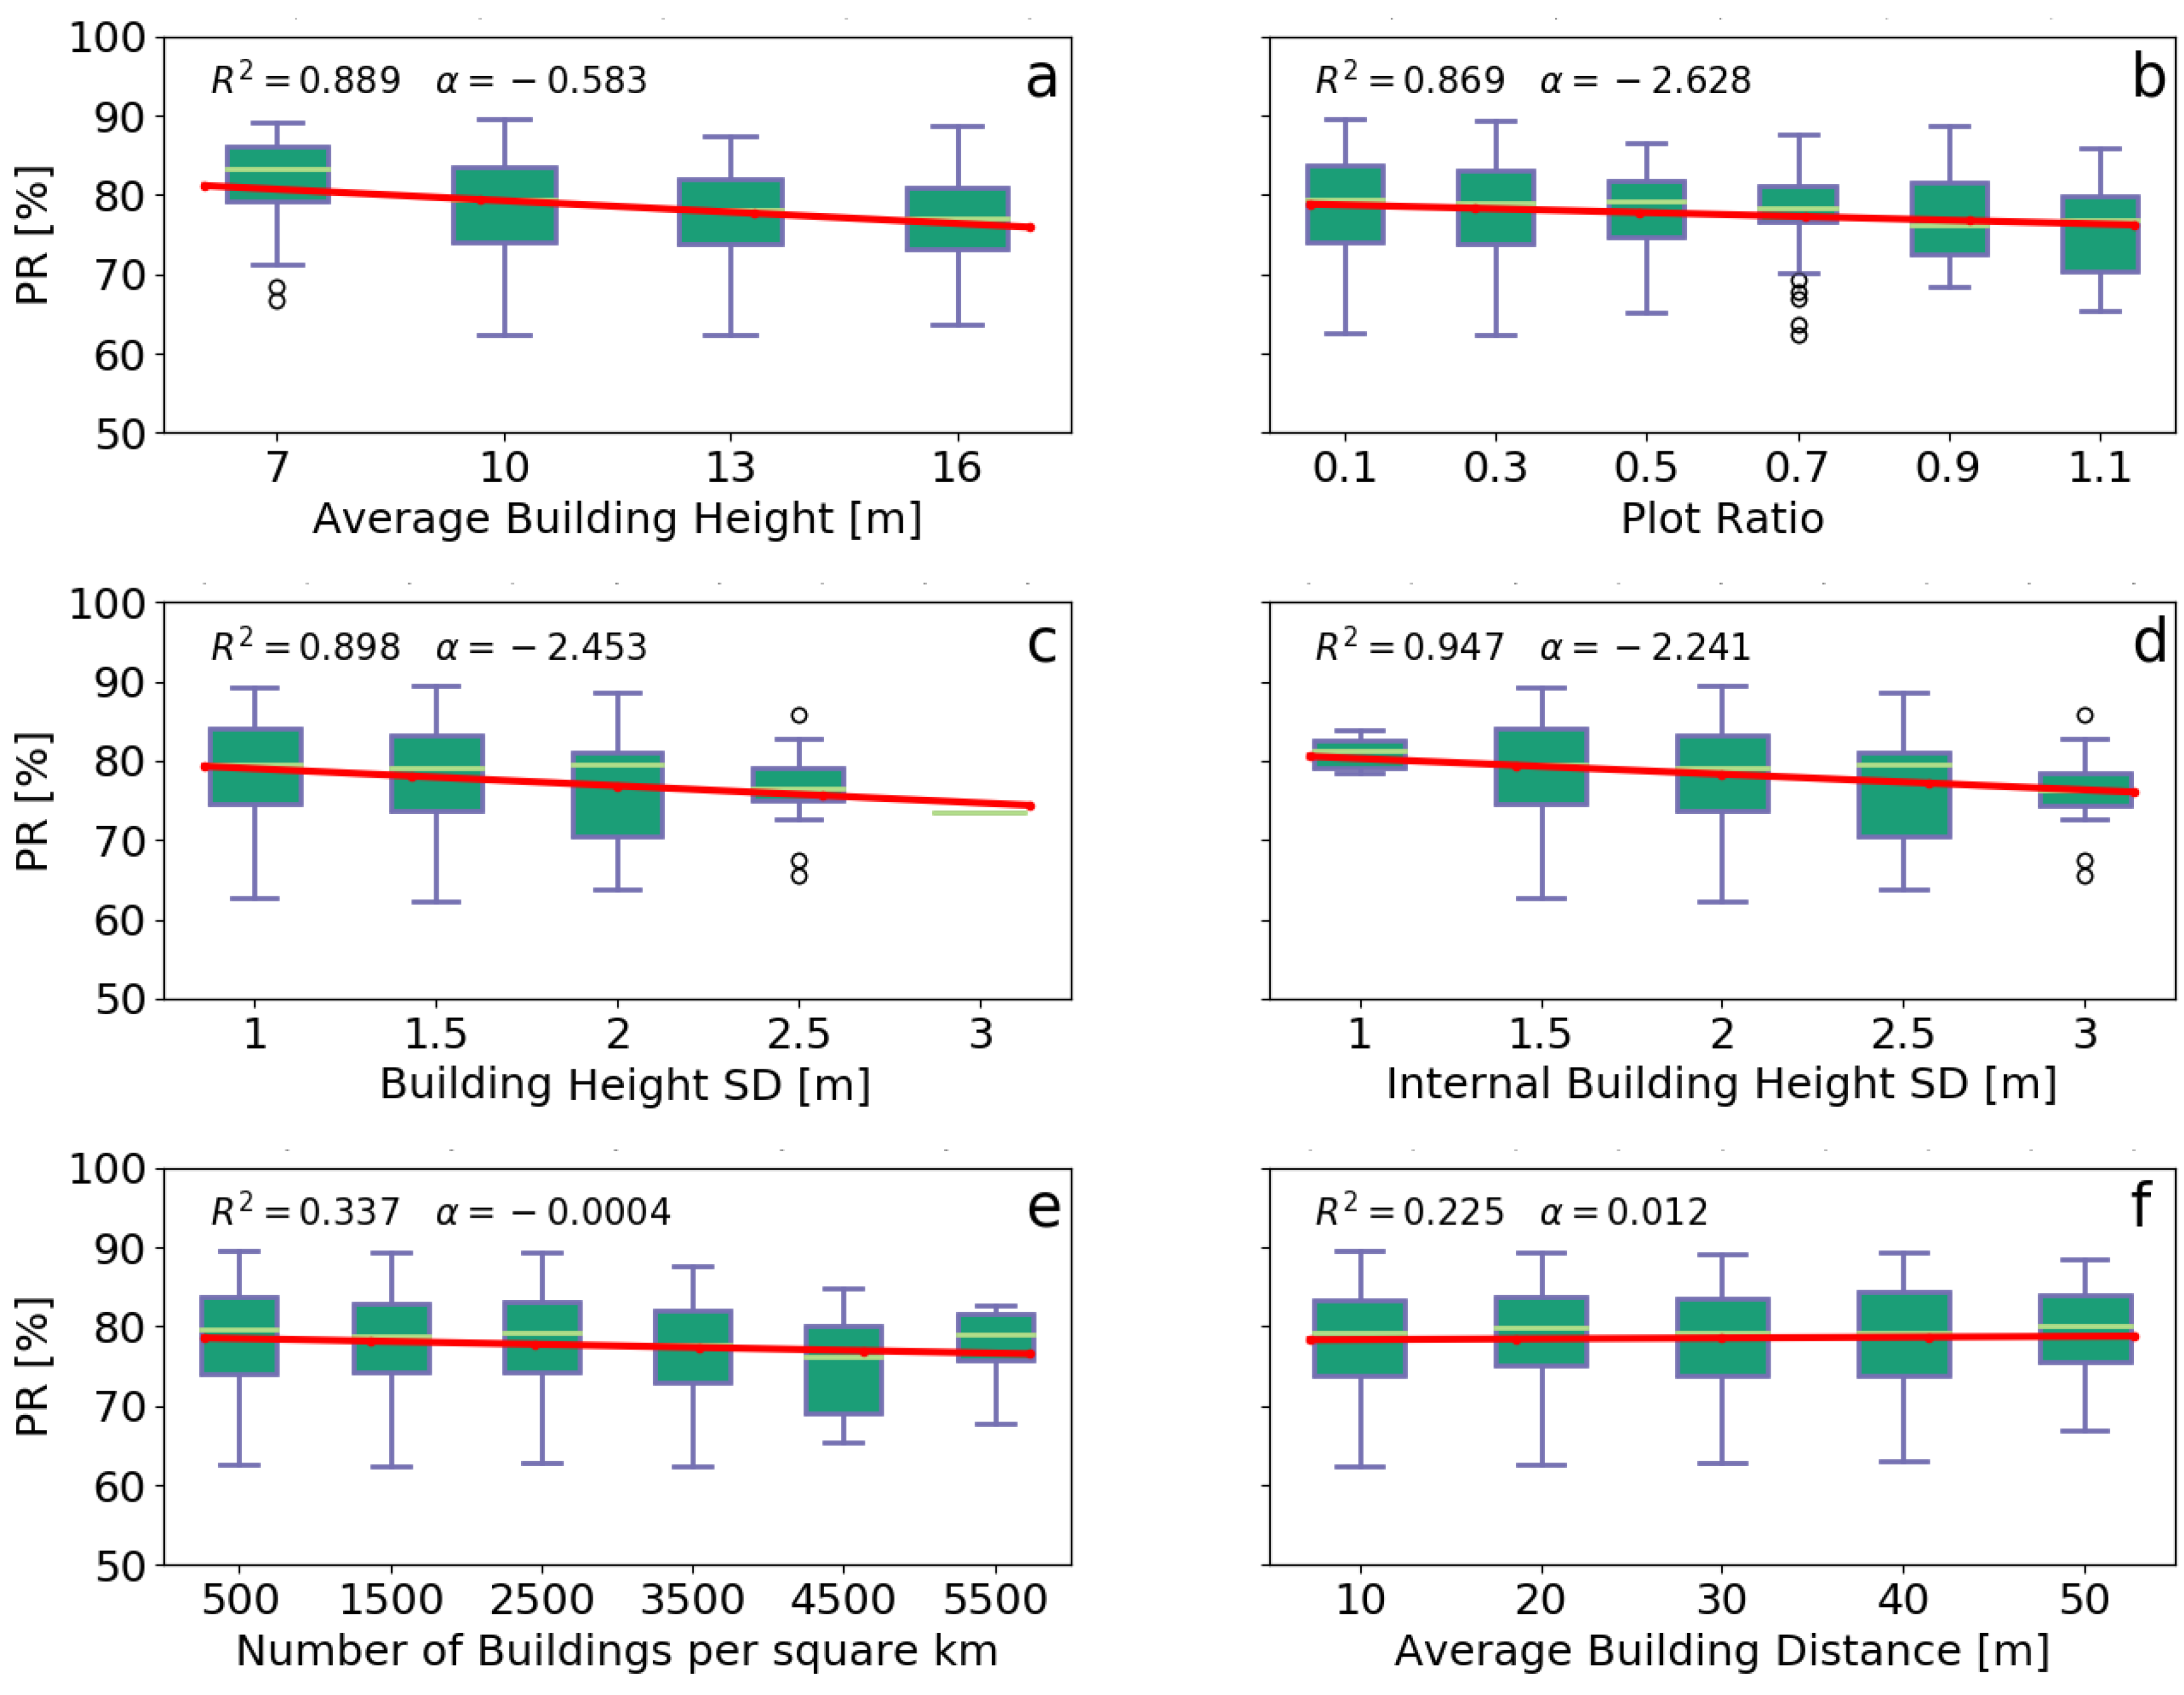
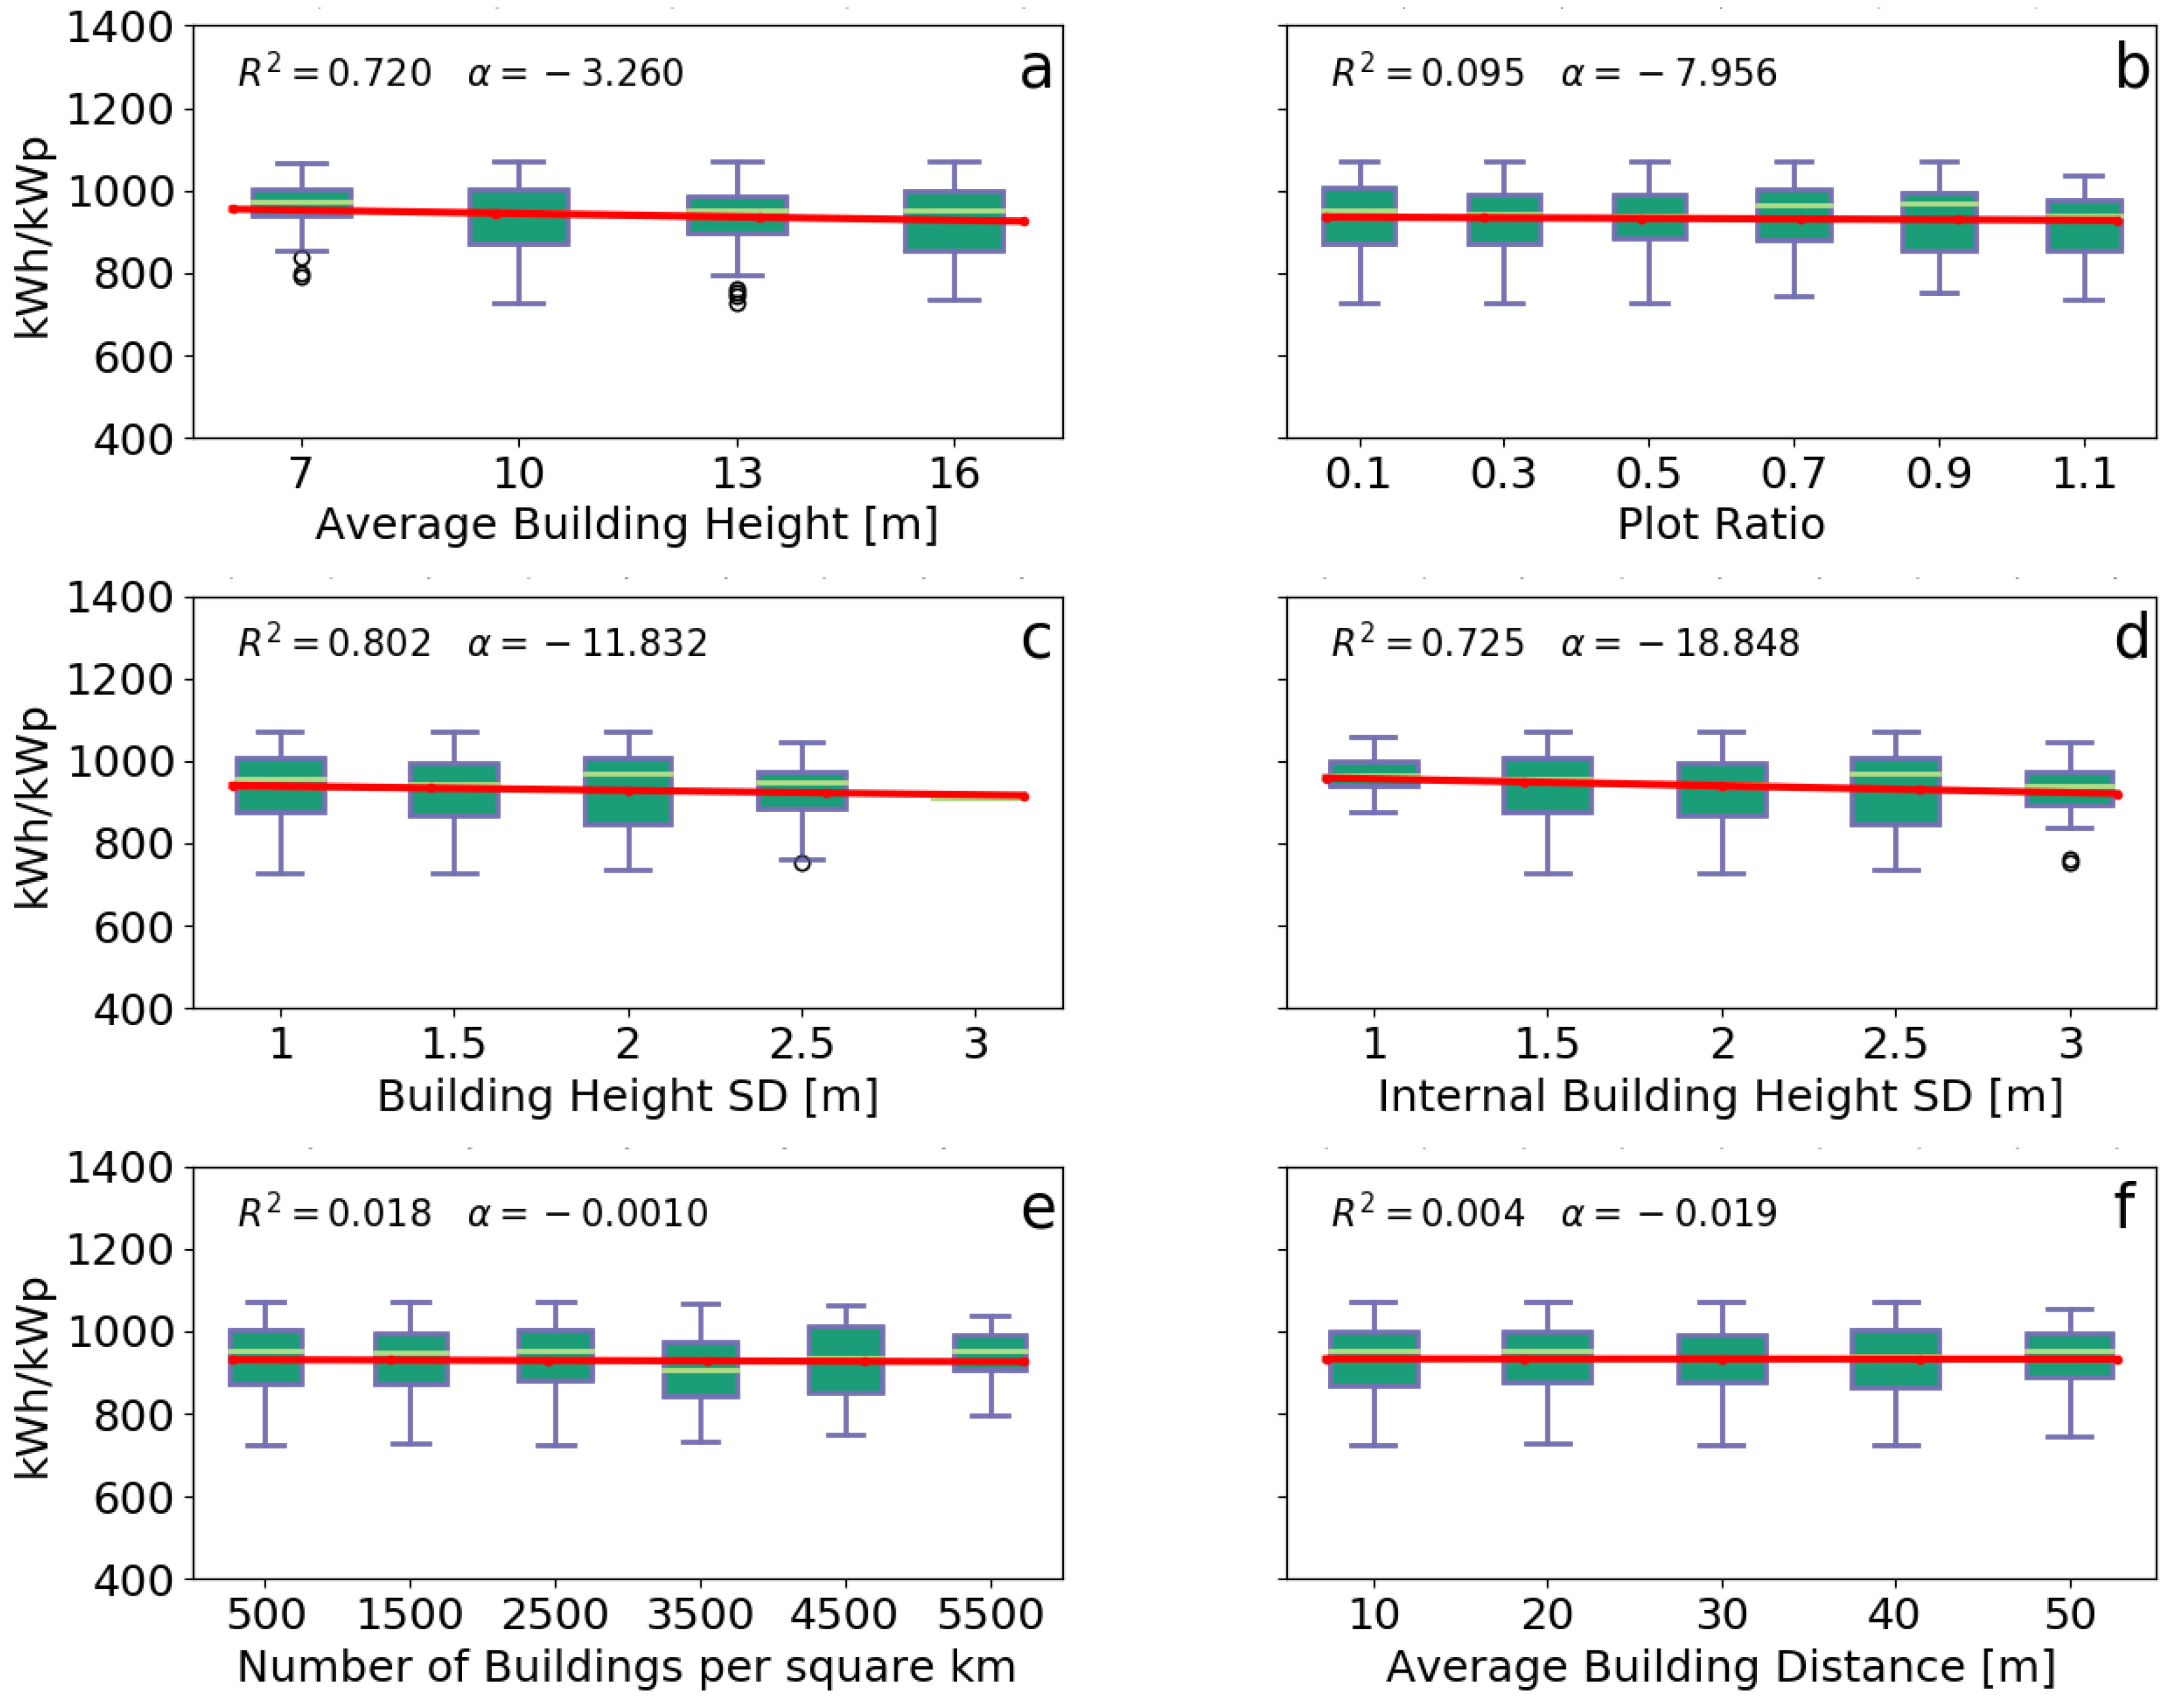
In this case, the six different indicators that were described in Section 2 are compared with the values of the systems as they all detach the form of the cityscape from the population factor (Figure 8). All the PV installations were grouped according to the overall characteristics of their surrounding location as this was indicated using GIS software. The groups of ABH, Plot Ratio, BHSD and the IBHSD predict the average with a linear regression model (with slope ) and the high R-squared values show a good correlation within the boundaries of the independent variables. The reasons behind the low R-squared values of the last two indicators, the Number of Buildings and the ABD, will be further examined.
For the categorization according to the ABH, the first group in Figure 8a consists of systems placed in areas with an average building height of 7 meters, which is approximately the height of the typical Dutch household with a tiled rooftop. As the height increases, the average exhibits a reduction of 0.583 units for every added meter, which corresponds a decrease of 1.75 units for every added floor (assuming that the average height of every additional floor is 3 m). The plot ratio defines the degree of built environment compactness of an area and again exhibits linear reduction with the as it can be seen in Figure 8b. A plot ratio of 0.1 indicates that the specific location is sparsely developed in terms of building infrastructure as the total surface of every buildings equals with just the 10% of the total area and the average in those locations is 78.7%. On the contrary a plot ratio of 1.1 represents a a densely built environment, where the total building surface equals with 110% of the total surface of this area and the average is limited to 75.7%. Shading from adjusting buildings is probably one of the major causes of low PV performance in metropolitan areas. The ABH indicates the level of vertical development of a neighborhood but it is not the only indicator able to predict the possibility for one construction to shade another. This can also be done by examining the slope of the linear model between std of building heights and average in Figure 8c, and it is revealed that every extra meter of deviation in vertical development is expected to reduce the average by 2.45 units. The almost linear relationship between the size of various constructions/equipment installed on rooftops and the average values can be seen in Figure 8d. The effect in this case can be direct shading, total or partial which in a compact environment it is also possible to affect nearby rooftops, or indirect, as these elements might significantly limit the available space and lead to a non-optional placement of the PV system. According to the figure, even a chimney, shed or the ventilation equipment that does not exceed 1–1.5 m in height is able to reduce by more than 2% the average compared to a totally flat rooftop.
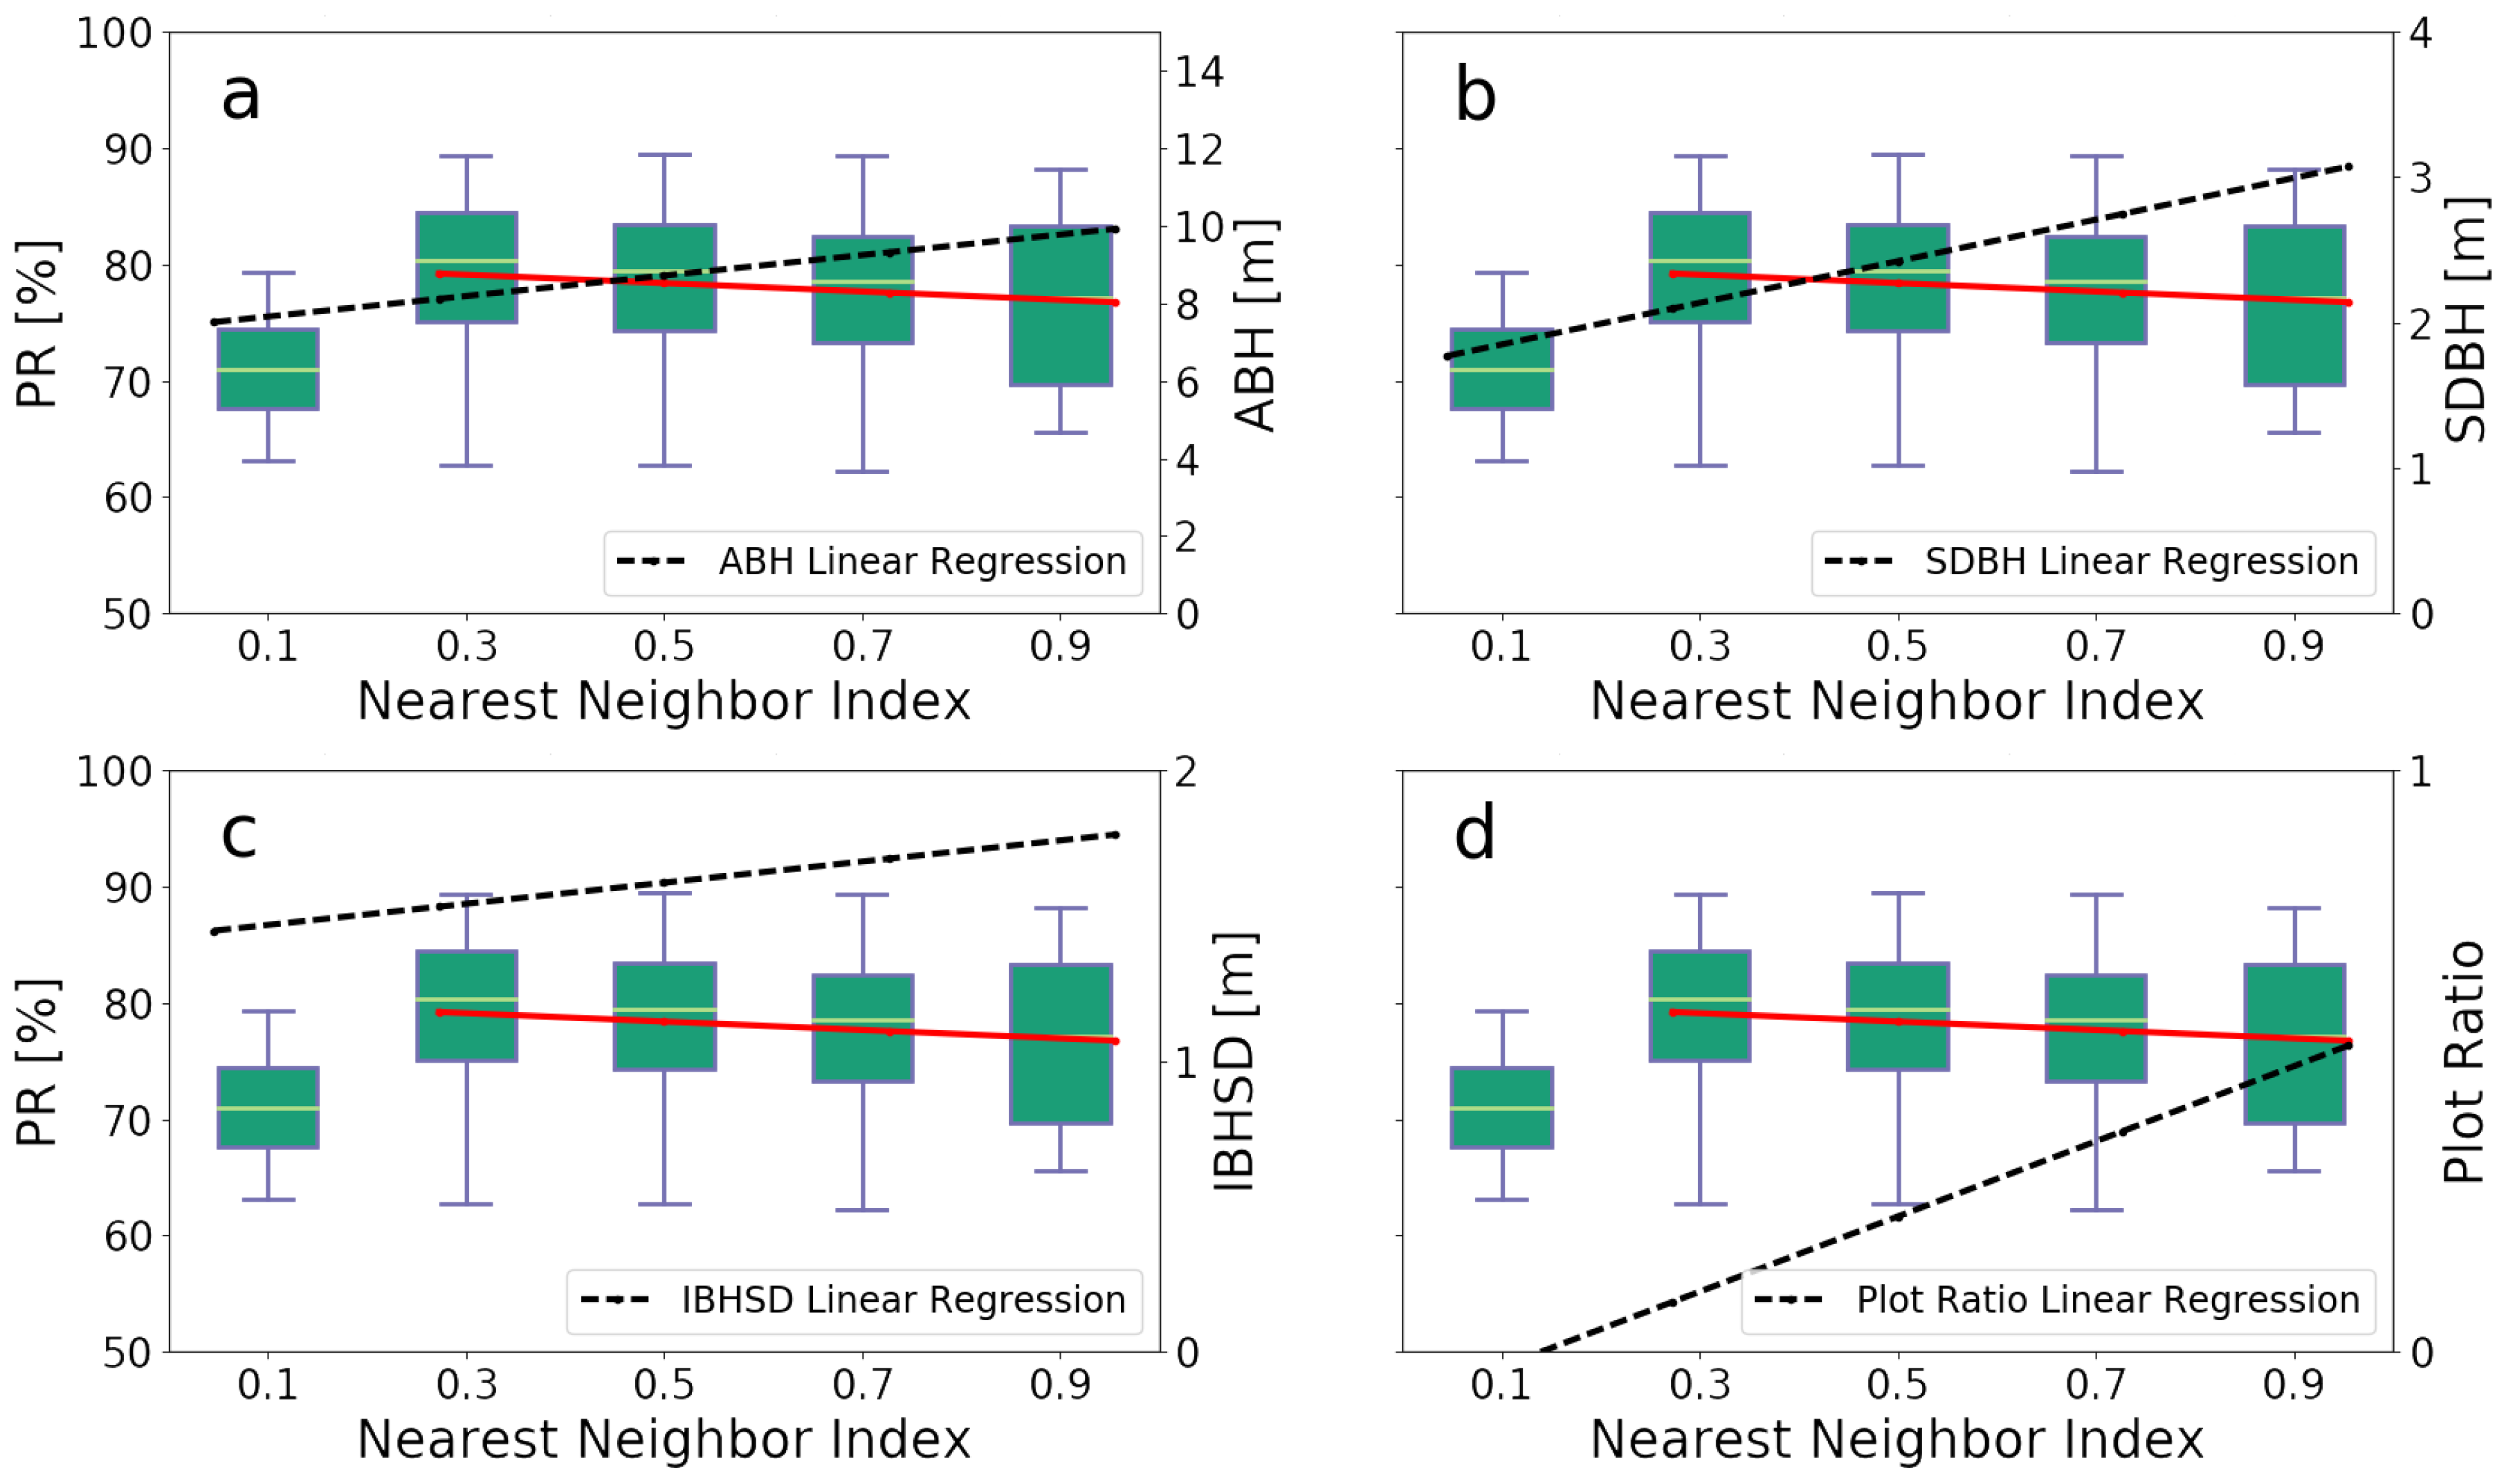
The low R-squared value in Figure 8e indicates a weak linear relationship between the density of buildings and the average . However, by removing the last group which includes areas with 5000–6000 buildings per square kilometer, the R-squared value increases from 0.337 to 0.779. A closer look over the general characteristics of the last, high building concentration group reveals that the majority of these systems were installed in residential areas with low ABH (mean = 8.24 m, std = 0.4 m) and relatively flat rooftops (IBHSD mean = 1.45 m, std = 0.14 m), showing that the use of a single indicator can be insufficient to evaluate the effects of urban compactness on the average of an area. Finally, the average seems to be unaffected by the ABD between buildings despite the fact that this can be a direct way to measure urban compactness. However, this can also be done by examining a slightly different indicator, the Nearest Neighbor Index (NNI), which is expressed as the ratio of the Average Building Distance to the Expected Mean Distance (EMD). The EMD is the average distance between neighbors in a hypothetical situation where all the buildings of an area were randomly distributed. Every value below 1 indicates clustering, while, for values greater than 1, the trend is towards dispersion (Figure 9).
As it can be seen in Figure 9, the average is affected only for small NNI values (0–0.2), where urban clustering is high. One would expect that, as the NNI value increases and the horizontal distribution of buildings in an area leans towards scattering, the overall performance of PV systems would increase. However, by considering NNI values above 0.2, an almost negative linear relationship appears (, ) compared to the average , which is depicted as a red line in Figure 9a–d. This counterintuitive outcome can be explained by taking into consideration the ABH, the SDBH, the IBHSD and the Plot Ratio of those areas. All four indicators exhibit strong, increasing, linear trends (black dashed line in Figure 9a–d) for those specific locations (, , , ), proving that even in the case of high clustering, vertical distribution still plays the major role.
3.4. Errors and Uncertainties
For this type of research, two types of errors can be identified. The first source of error is related to the data sources themselves as the number of input entries, such as the size of the system or the tilt and orientation, requires hand-digitized information that can be either incorrectly calculated by the owner or incorrectly entered in the database. This type of error usually leads to an abnormal or annual yield value that can be identified and excluded as an outlier.
The second type of error is somehow inherent to every type of research that focuses on a large scale analysis of PV systems scattered over a large geographical area. While digital data acquired from monitoring equipment are considered to be of high quality, the lack of irradiation measurements on site leads to uncertainty over the performance indicators. Even when measurements are provided by the dense meteorological network of a governmental agency such in this case, it is usually in the form of GHI without separation of the direct and diffuse component. Consequently, the error associated with the transposition model is unavoidable and the related uncertainty depends on the mainly on the overall meteorological conditions and the time of the day, but in some cases it can exceed 10% [21]. Installation and maintenance of independent monitoring equipment are both costly and impractical, and therefore the validity of this type of research will always be relying on the large number of systems for the analysis.
However, by analyzing a large number of systems over a long monitoring period, the validity of the research can be ensured. In Figure 10, the linear relationship of the indicators described in Section 2 is presented in comparison with the final system yield . As in Figure 9, the ABH, BHSD, IBHSD are following a negative relationship with the even though the linearity is weakened.
4. Conclusions
In an era where almost everything can be thoroughly monitored, this study proved that the massive amount of PV yield data that are collected can offer a fast and inexpensive way to evaluate the performance potential of large geographical areas. Urban compactness has many forms, and it can be physically separated on a horizontal and vertical level. The results of this analysis show that, for the second case, the indicators that describe the 3D variation over different areas within the Netherlands, a strong linear relationship occurs with relatively high R-squared values (, , ). The linearity is also preserved when the average is compared to for these three indicators. Homogeneity in building height and flat roofs are essential to achieve high performance with minimum shading, as every meter of height deviation results in 2.453 units of reduction in the average in the first case and 2.241 units in the second. The distance between buildings is important only when the urban environment is highly clustered, but, as buildings become more scattered, the effects of the vertical distribution are driving the performance losses.
It was also proven that the effects of the urban environment are very complex, and, in most cases, the use of a single indicator to assess the overall performance of PV was inadequate. Finally, it revealed that urban effects should not be considered as a constant effect but as an effect that exhibits large seasonal variation that can be over 15% depending on the latitude of the specific location, something that was also mentioned in previous research [33], but it was never quantified up to now according to our knowledge.
The constantly increasing energy demands, which are projected to rise even more due to electrification in mobility, highlight the importance of PV integration in our cities. In this direction, this study could be extended, comparing areas with different urban environments and in combination with software like GIS, can help us develop better ways to construct our buildings and plan our cities.
Author Contributions
P.M. and W.v.S. conceived the project, P.M. conceived and designed the simulations, performed the data analysis and wrote the paper, B.B.K. and N.N. performed the GIS analysis.
Funding
This project is partly financially supported by the Netherlands Enterprise Agency (RVO).
Acknowledgments
This work is part of the International Energy Agency—Photovoltaic Power Systems (IEA-PVPS) Task 13 “Performance and Reliability of Photovoltaic Systems”; we would like to thank all members of this task for their support.
Conflicts of Interest
The authors declare no conflicts of interest.
References
- Secretariat, U.N. World Urbanization Prospects; Technical Report; Department of Economic and Social Affairs: New York, NY, USA, 2012. [Google Scholar]
- Performance, I.E. POLIS, Solar Urban Planning-Manual of Best Practices; Technical Report; European Commission: Brussels, Belgium, 2010. [Google Scholar]
- Directive 2010/31/ of the European Parliament on the Energy Performance of Buildings; Technical Report; European Parliament: Brussels, Belgium, 2010.
- Li, D.; Liu, G.; Liao, S. Solar potential in urban residential buildings. Sol. Energy 2015, 111, 225–235. [Google Scholar] [CrossRef]
- Shukla, A.K.; Sudhakar, K.; Baredar, P. Recent advancement in BIPV product technologies: A review. Energy Build. 2017, 140, 188–195. [Google Scholar] [CrossRef]
- Izquierdo, S.; Rodrigues, M.; Fueyo, N. A method for estimating the geographical distribution of the available roof surface area for large-scale photovoltaic energy-potential evaluations. Sol. Energy 2008, 82, 929–939. [Google Scholar] [CrossRef]
- Izquierdo, S.; Montañés, C.; Dopazo, C.; Fueyo, N. Roof-top solar energy potential under performance-based building energy codes: The case of Spain. Sol. Energy 2011, 85, 208–213. [Google Scholar] [CrossRef]
- Wiginton, L.; Nguyen, H.; Pearce, J. Quantifying rooftop solar photovoltaic potential for regional renewable energy policy. Comput. Environ. Urban Syst. 2010, 34, 345–357. [Google Scholar] [CrossRef]
- Hofierka, J.; Zlocha, M. A New 3D Solar Radiation Model for 3D City Models. Trans. GIS 2012, 16, 681–690. [Google Scholar] [CrossRef]
- Jakubiec, J.A.; Reinhart, C.F. A method for predicting city-wide electricity gains from photovoltaic panels based on LiDAR and GIS data combined with hourly Daysim simulations. Sol. Energy 2013, 93, 127–143. [Google Scholar] [CrossRef]
- Catita, C.; Redweik, P.; Pereira, J.; Brito, M. Extending solar potential analysis in buildings to vertical facades. Comput. Geosci. 2014, 66, 1–12. [Google Scholar] [CrossRef]
- Verso, A.; Martin, A.; Amador, J.; Dominguez, J. GIS-based method to evaluate the photovoltaic potential in the urban environments: The particular case of Miraflores de la Sierra. Sol. Energy 2015, 117, 236–245. [Google Scholar] [CrossRef]
- Freitas, S.; Catita, C.; Redweik, P.; Brito, M. Modelling solar potential in the urban environment: State-of-the-art review. Renew. Sustain. Energy Rev. 2015, 41, 915–931. [Google Scholar] [CrossRef]
- Sarralde, J.J.; Quinn, D.J.; Wiesmann, D.; Steemers, K. Solar energy and urban morphology: Scenarios for increasing the renewable energy potential of neighbourhoods in London. Renew. Energy 2015, 73, 10–17. [Google Scholar] [CrossRef]
- Redweik, P.; Catita, C.; Brito, M. Solar energy potential on roofs and facades in an urban landscape. Sol. Energy 2013, 97, 332–341. [Google Scholar] [CrossRef]
- Mohajeri, N.; Upadhyay, G.; Gudmundsson, A.; Assouline, D.; Kämpf, J.; Scartezzini, J.L. Effects of urban compactness on solar energy potential. Renew. Energy 2016, 93, 469–482. [Google Scholar] [CrossRef]
- Kanters, J.; Wall, M. A planning process map for solar buildings in urban environments. Renew. Sustain. Energy Rev. 2016, 57, 173–185. [Google Scholar] [CrossRef]
- Lobaccaro, G.; Frontini, F. Solar Energy in Urban Environment: How Urban Densification Affects Existing Buildings. Energy Procedia 2014, 48, 1559–1569. [Google Scholar] [CrossRef]
- CBS. CBS Statistics. 2017. Available online: https://www.cbs.nl/en-gb/our-services/methods/surveys/korte-onderzoeksbeschrijvingen/renewable-energy (accessed on 23 May 2018).
- Reich, N.H.; Mueller, B.; Armbruster, A.; van Sark, W.G.J.H.M.; Kiefer, K.; Reise, C. Performance ratio revisited: Is PR greater than 90% realistic? Prog. Photovolt. Res. Appl. 2012, 20, 717–726. [Google Scholar] [CrossRef]
- Yang, D. Solar radiation on inclined surfaces: Corrections and benchmarks. Sol. Energy 2016, 136, 288–302. [Google Scholar] [CrossRef]
- Perez, R.; Seals, R.; Ineichen, P.; Stewart, R.; Menicucci, D. A new simplified version of the perez diffuse irradiance model for tilted surfaces. Sol. Energy 1987, 39, 221–231. [Google Scholar] [CrossRef]
- Hay, J.E. Calculating solar radiation for inclined surfaces: Practical approaches. Renew. Energy 1993, 3, 373–380. [Google Scholar] [CrossRef]
- Olmo, F.; Vida, J.; Foyo, I.; Castro-Diez, Y.; Alados-Arboledas, L. Prediction of global irradiance on inclined surfaces from horizontal global irradiance. Energy 1999, 24, 689–704. [Google Scholar] [CrossRef]
- Tukey, J.W. Exploratory Data Analysis; Pearson: London, UK, 1977. [Google Scholar]
- Polverini, D.; Field, M.; Dunlop, E.; Zaaiman, W. Polycrystalline silicon PV modules performance and degradation over 20 years. Prog. Photovolt. Res. Appl. 2012. [Google Scholar] [CrossRef]
- Ishii, T.; Masuda, A. Annual degradation rates of recent crystalline silicon photovoltaic modules. Prog. Photovolt. Res. Appl. 2017, 25, 953–967. [Google Scholar] [CrossRef]
- Litjens, G.B.; Worrell, E.; van Sark, W.G. Influence of demand patterns on the optimal orientation of photovoltaic systems. Sol. Energy 2017, 155, 1002–1014. [Google Scholar] [CrossRef]
- Moraitis, P.; Kausika, B.B.; van Sark, W.G.J.H.M. Visualization of operational performance of grid-connected PV systems in selected European countries. In Proceedings of the 2015 IEEE 42nd Photovoltaic Specialist Conference (PVSC), Hamburg, Germany, 14 December 2015. [Google Scholar] [CrossRef]
- Tsafarakis, O.; Moraitis, P.; Kausika, B.B.; van der Velde, H.; ’t Hart, S.; de Vries, A.; de Rijk, P.; de Jong, M.M.; van Leeuwen, H.P.; van Sark, W. Three years experience in a Dutch public awareness campaign on photovoltaic system performance. IET Renew. Power Gener. 2017, 11, 1229–1233. [Google Scholar] [CrossRef]
- Leloux, J.; Narvarte, L.; Trebosc, D. Review of the performance of residential PV systems in France. Renew. Sustain. Energy Rev. 2012, 16, 1369–1376. [Google Scholar] [CrossRef] [Green Version]
- Stein, J.S. The photovoltaic performance modeling collaborative (PVPMC). In Proceeding of the Photovoltaic Specialists Conference, Austin, TX, USA, 3–8 June 2012. [Google Scholar]
- Kanters, J.; Wall, M.; Dubois, M.C. Typical Values for Active Solar Energy in Urban Planning. Energy Procedia 2014, 48, 1607–1616. [Google Scholar] [CrossRef]
Figure 1.
Map division in urban, suburban and rural areas in the Netherlands based on population density.
Figure 1.
Map division in urban, suburban and rural areas in the Netherlands based on population density.

Figure 2.
Installation date distribution.

Figure 3.
System size distribution per location.

Figure 4.
(a) Plane of Array (POA) irradiation; (b) optimum oriented systems; (c) well oriented systems.
Figure 4.
(a) Plane of Array (POA) irradiation; (b) optimum oriented systems; (c) well oriented systems.

Figure 5.
Boxplots of annual distribution for 2016.

Figure 6.
Monthly difference between PV installations in rural and urban areas.

Figure 7.
Difference in between PV installations in rural and urban areas versus the solar elevation.
Figure 7.
Difference in between PV installations in rural and urban areas versus the solar elevation.

Figure 8.
Comparison of the average using linear regression with (a) ABH; (b) plot ratio; (c) BHSD; (d) IBHSD; (e) number of buildings per km2; (f) ABD.
Figure 8.
Comparison of the average using linear regression with (a) ABH; (b) plot ratio; (c) BHSD; (d) IBHSD; (e) number of buildings per km2; (f) ABD.

Figure 9.
compared with the nearest index indicator.

Figure 10.
Comparison of using linear regression with (a) ABH; (b) plot ratio; (c) BHSD; (d) IBHSD; (e) number of buildings per km2; (f) ABD.
Figure 10.
Comparison of using linear regression with (a) ABH; (b) plot ratio; (c) BHSD; (d) IBHSD; (e) number of buildings per km2; (f) ABD.


Table 1.
Average annual yield and values with the corresponding standard deviations.
| Year | Annual Yield kWh/kWp | PR % |
|---|---|---|
| 2014 | ||
| 2015 | ||
| 2016 |
© 2018 by the authors. Licensee MDPI, Basel, Switzerland. This article is an open access article distributed under the terms and conditions of the Creative Commons Attribution (CC BY) license (http://creativecommons.org/licenses/by/4.0/).
Share and Cite
MDPI and ACS Style
Moraitis, P.; Kausika, B.B.; Nortier, N.; Van Sark, W. Urban Environment and Solar PV Performance: The Case of the Netherlands. Energies 2018, 11, 1333. https://doi.org/10.3390/en11061333
AMA Style
Moraitis P, Kausika BB, Nortier N, Van Sark W. Urban Environment and Solar PV Performance: The Case of the Netherlands. Energies. 2018; 11(6):1333. https://doi.org/10.3390/en11061333
Chicago/Turabian StyleMoraitis, Panagiotis, Bala Bhavya Kausika, Nick Nortier, and Wilfried Van Sark. 2018. "Urban Environment and Solar PV Performance: The Case of the Netherlands" Energies 11, no. 6: 1333. https://doi.org/10.3390/en11061333
Note that from the first issue of 2016, this journal uses article numbers instead of page numbers. See further details here.