Breakdown Characteristics of Oil-Pressboard Insulation under AC-DC Combined Voltage and Its Mathematical Model


1
Key Laboratory of Engineering Dielectrics and Its Application, Ministry of Education, Harbin University of Science and Technology, 52 Xuefu Road, Harbin 150080, China
2
The School of Electrical and Electronics Engineering, Harbin University of Science and Technology, 52 Xuefu Road, Harbin 150080, China
*
Authors to whom correspondence should be addressed.
Energies 2018, 11(5), 1319; https://doi.org/10.3390/en11051319
Submission received: 3 May 2018
/
Revised: 17 May 2018
/
Accepted: 17 May 2018
/
Published: 22 May 2018
(This article belongs to the Section F: Electrical Engineering)
Abstract
:An AC-DC combined voltage is applied to the oil-pressboard insulation near the valve side during the operation of a converter transformer. To study the breakdown characteristics of an oil-pressboard insulation under such voltages, a typical plate electrode structure was employed in the laboratory to conduct a breakdown test on the oil-pressboard insulation. The electrical field distribution and the DC contents of the transformer oil and the pressboard in composite insulation under the AC-DC combined voltage were simulated by their dielectric parameters. The breakdown strength of the transformer oil decreases with the increase in the DC content of the applied voltage, whereas that of the pressboard increases. For the oil-pressboard insulation, the breakdown voltage increases first and then decreases. The electric field strength decreases in the transformer oil with the increase in the DC content, whereas it increases in the pressboard. And the DC contents of the transformer and the pressboard in composite insulation were different from that of the applied voltage. Finally, based on the above results, a mathematical model was proposed to describe the breakdown characteristics of the oil-pressboard insulation under the AC-DC combined voltage; the theoretical and experimental results were in good agreement.
1. Introduction
The converter transformer is one of the most important pieces of equipment in high-voltage direct current (HVDC) power transmission projects, as it is used for AC-DC voltage conversion. The reliable operation of the converter transformer is a prerequisite for the stability of the entire system [1,2]. Compared to the conventional AC transformers, the converter transformer can withstand not only the AC voltage, lightning impulse voltage, and operating overvoltage, but also AC-DC combined voltage, polarity reversal voltage, and other complex conditions [3,4,5]. The electric field distribution in the oil-pressboard insulation under an AC-DC combined electric field is more complicated than that under an AC electric field alone. Moreover, the breakdown strengths of the oil and pressboard are affected by the DC content, thus complicating the insulation design of converter transformers [6,7,8].
The breakdown voltage of a composite dielectric is mainly affected by the electric field distribution and breakdown strength of the dielectric [9,10]. The electric field distribution in oil-pressboard insulations has been extensively studied, mostly based on the resistance-capacitance model, under AC-DC combined voltage and polarity-reversed voltage [11,12,13]. In an experimental study, Li et al. used a plate electrode to study the effect of thickness on the breakdown strength of a pressboard under AC-DC combined voltage. The results showed that the breakdown strength of the pressboard increased with the increase in the thickness under both DC voltage and AC-DC combined voltage, whereas it decreased under the AC voltage [14,15,16]. Rajan et al. used the parallel plate, rod-plate, and ball-plate type electrodes to study the breakdown voltage of a multi-layer impregnated pressboard under AC-DC combined voltage and concluded that the breakdown voltage under AC-DC combined voltage was higher than that under DC voltage but lower than that under AC voltage. Moreover, the effect of electric field distortion on the DC breakdown voltage was not obvious, whereas that on the AC breakdown voltage was obvious [17,18]. Li et al. studied the effect of DC voltage superimposed with a high-frequency AC voltage (50–600 Hz) on the breakdown strength of a pressboard and concluded that the space charge accumulated in the sample increased with the increase in the frequency, thereby decreasing the breakdown strength of the pressboard [19]. Chi et al. studied the effect of oil flow on the breakdown characteristics of an oil-pressboard insulation under AC-DC combined voltage. The results showed that the breakdown voltage of the oil-pressboard insulation increased first and then decreased with the increase in the DC content, and the breakdown voltage decreased with the increase in the flow rate [20]. In summary, the breakdown characteristics of oil-pressboard insulations have been studied preliminarily; however, the mathematical expression and mechanism of breakdown characteristics have not been reported in detail.
In this paper, a typical plate electrode structure was used to study the breakdown characteristics of an oil-pressboard insulation. The mathematical expression for the electric field distribution was obtained using the dielectric parameters of the oil and pressboard. Based on this, a mathematic model for the breakdown characteristics of the oil-pressboard insulation was established to explain the effect of AC-DC combined voltage on the breakdown characteristics of the oil-pressboard insulation.
2. Experimental Method
2.1. Sample Preparation and Test Model
A pressboard with a thickness of 0.25 mm and with dimensions of 10 cm × 10 cm was used for the test. The pressboard was dried under vacuum and immersed in transformer oil placed in a vacuum container. Karamay 45# transformer oil was used for the oil-pressboard insulation. The oil was filtered using an oil filter to remove impurities such as moisture and gas. Table 1 lists the dielectric parameters and moisture contents of the pressboard and transformer oil at room temperature [21].
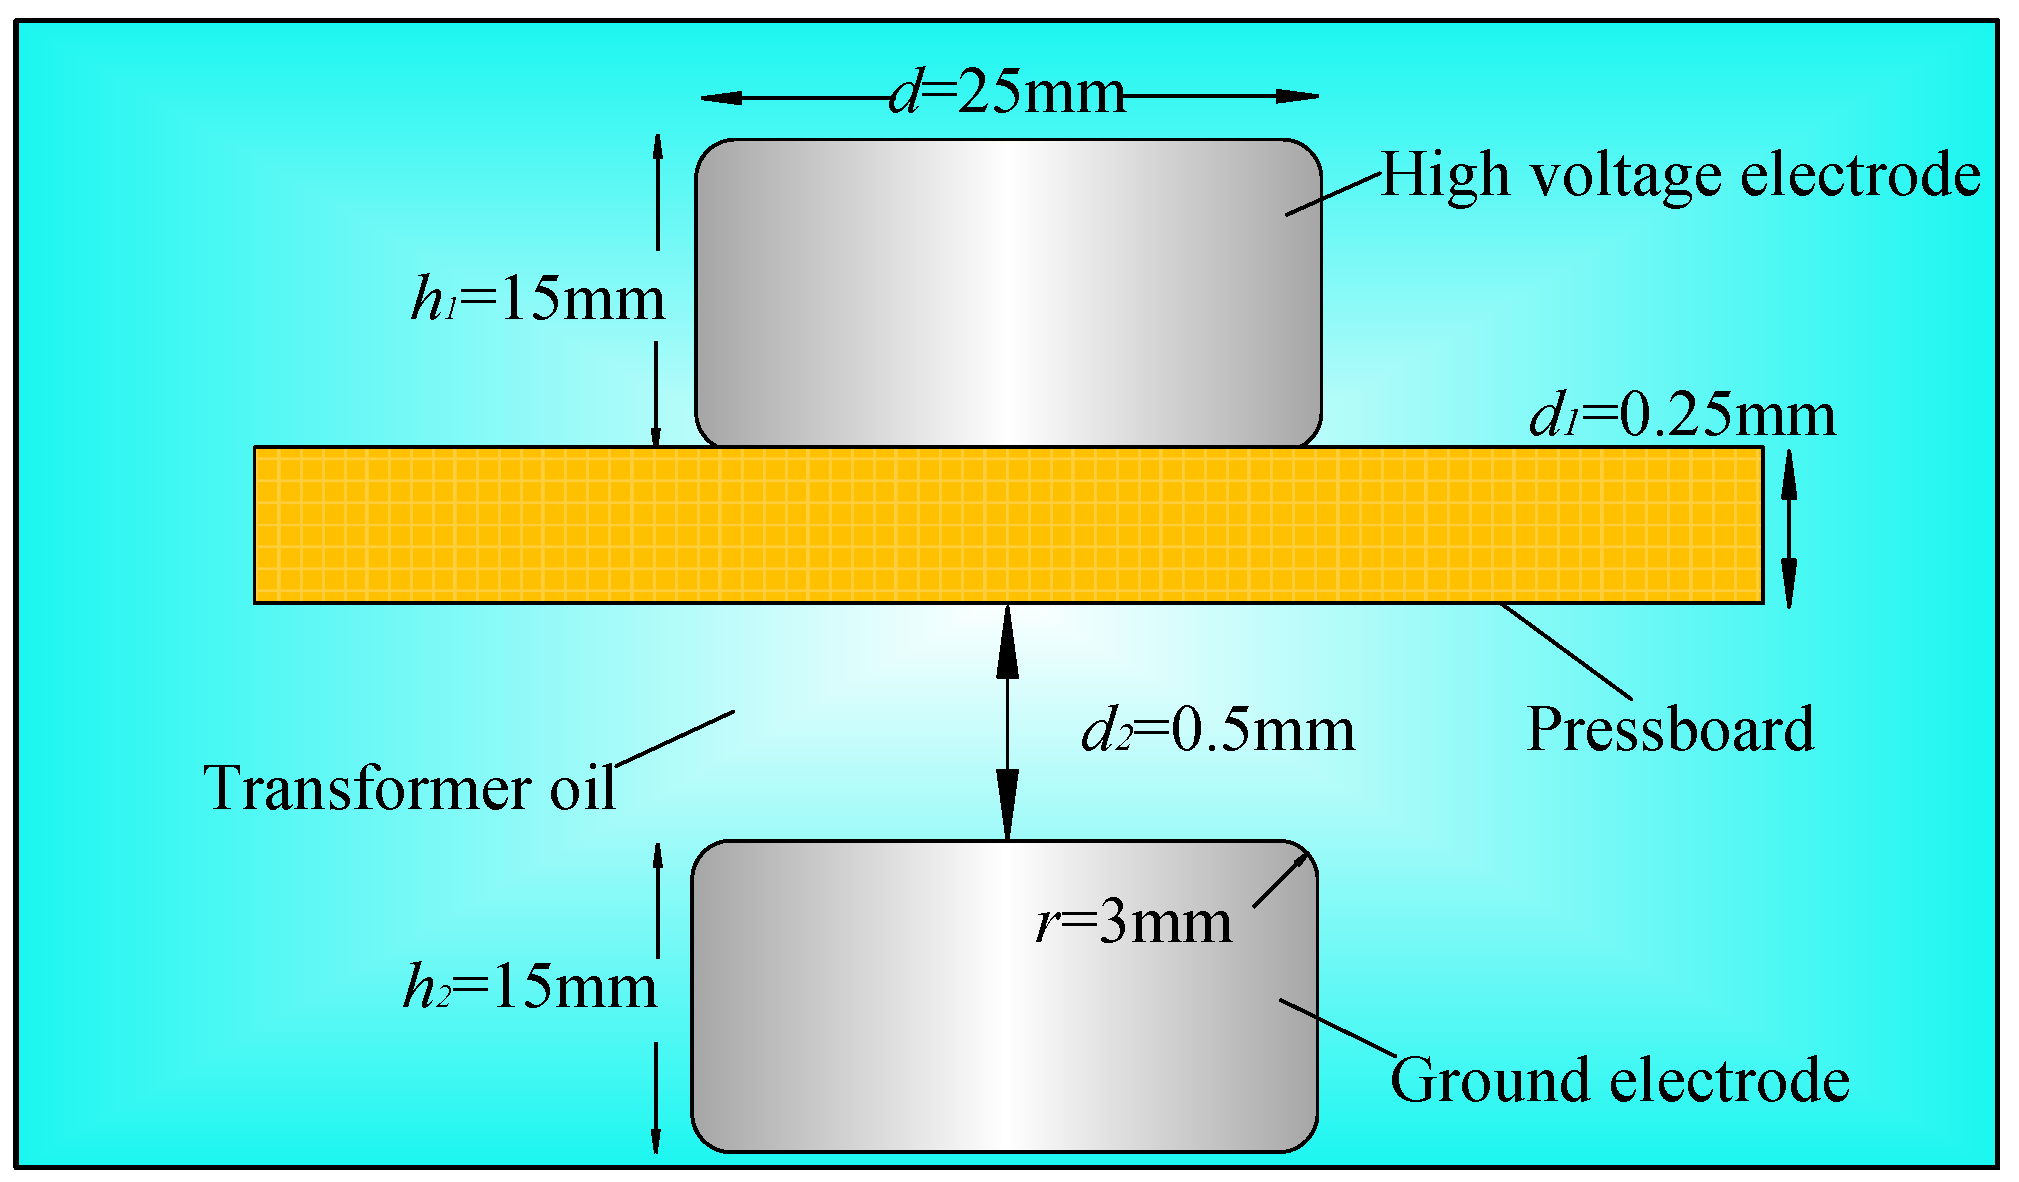
The main insulation of a large converter transformer is the barrel type structure, but its radius of curvature is large, so it is closer to a plate electrode in a small range. Hence, a plate electrode with an axisymmetric cylindrical structure is used to study the breakdown characteristics of the oil-pressboard insulation under AC-DC combined voltage, as shown in Figure 1.
2.2. Test System
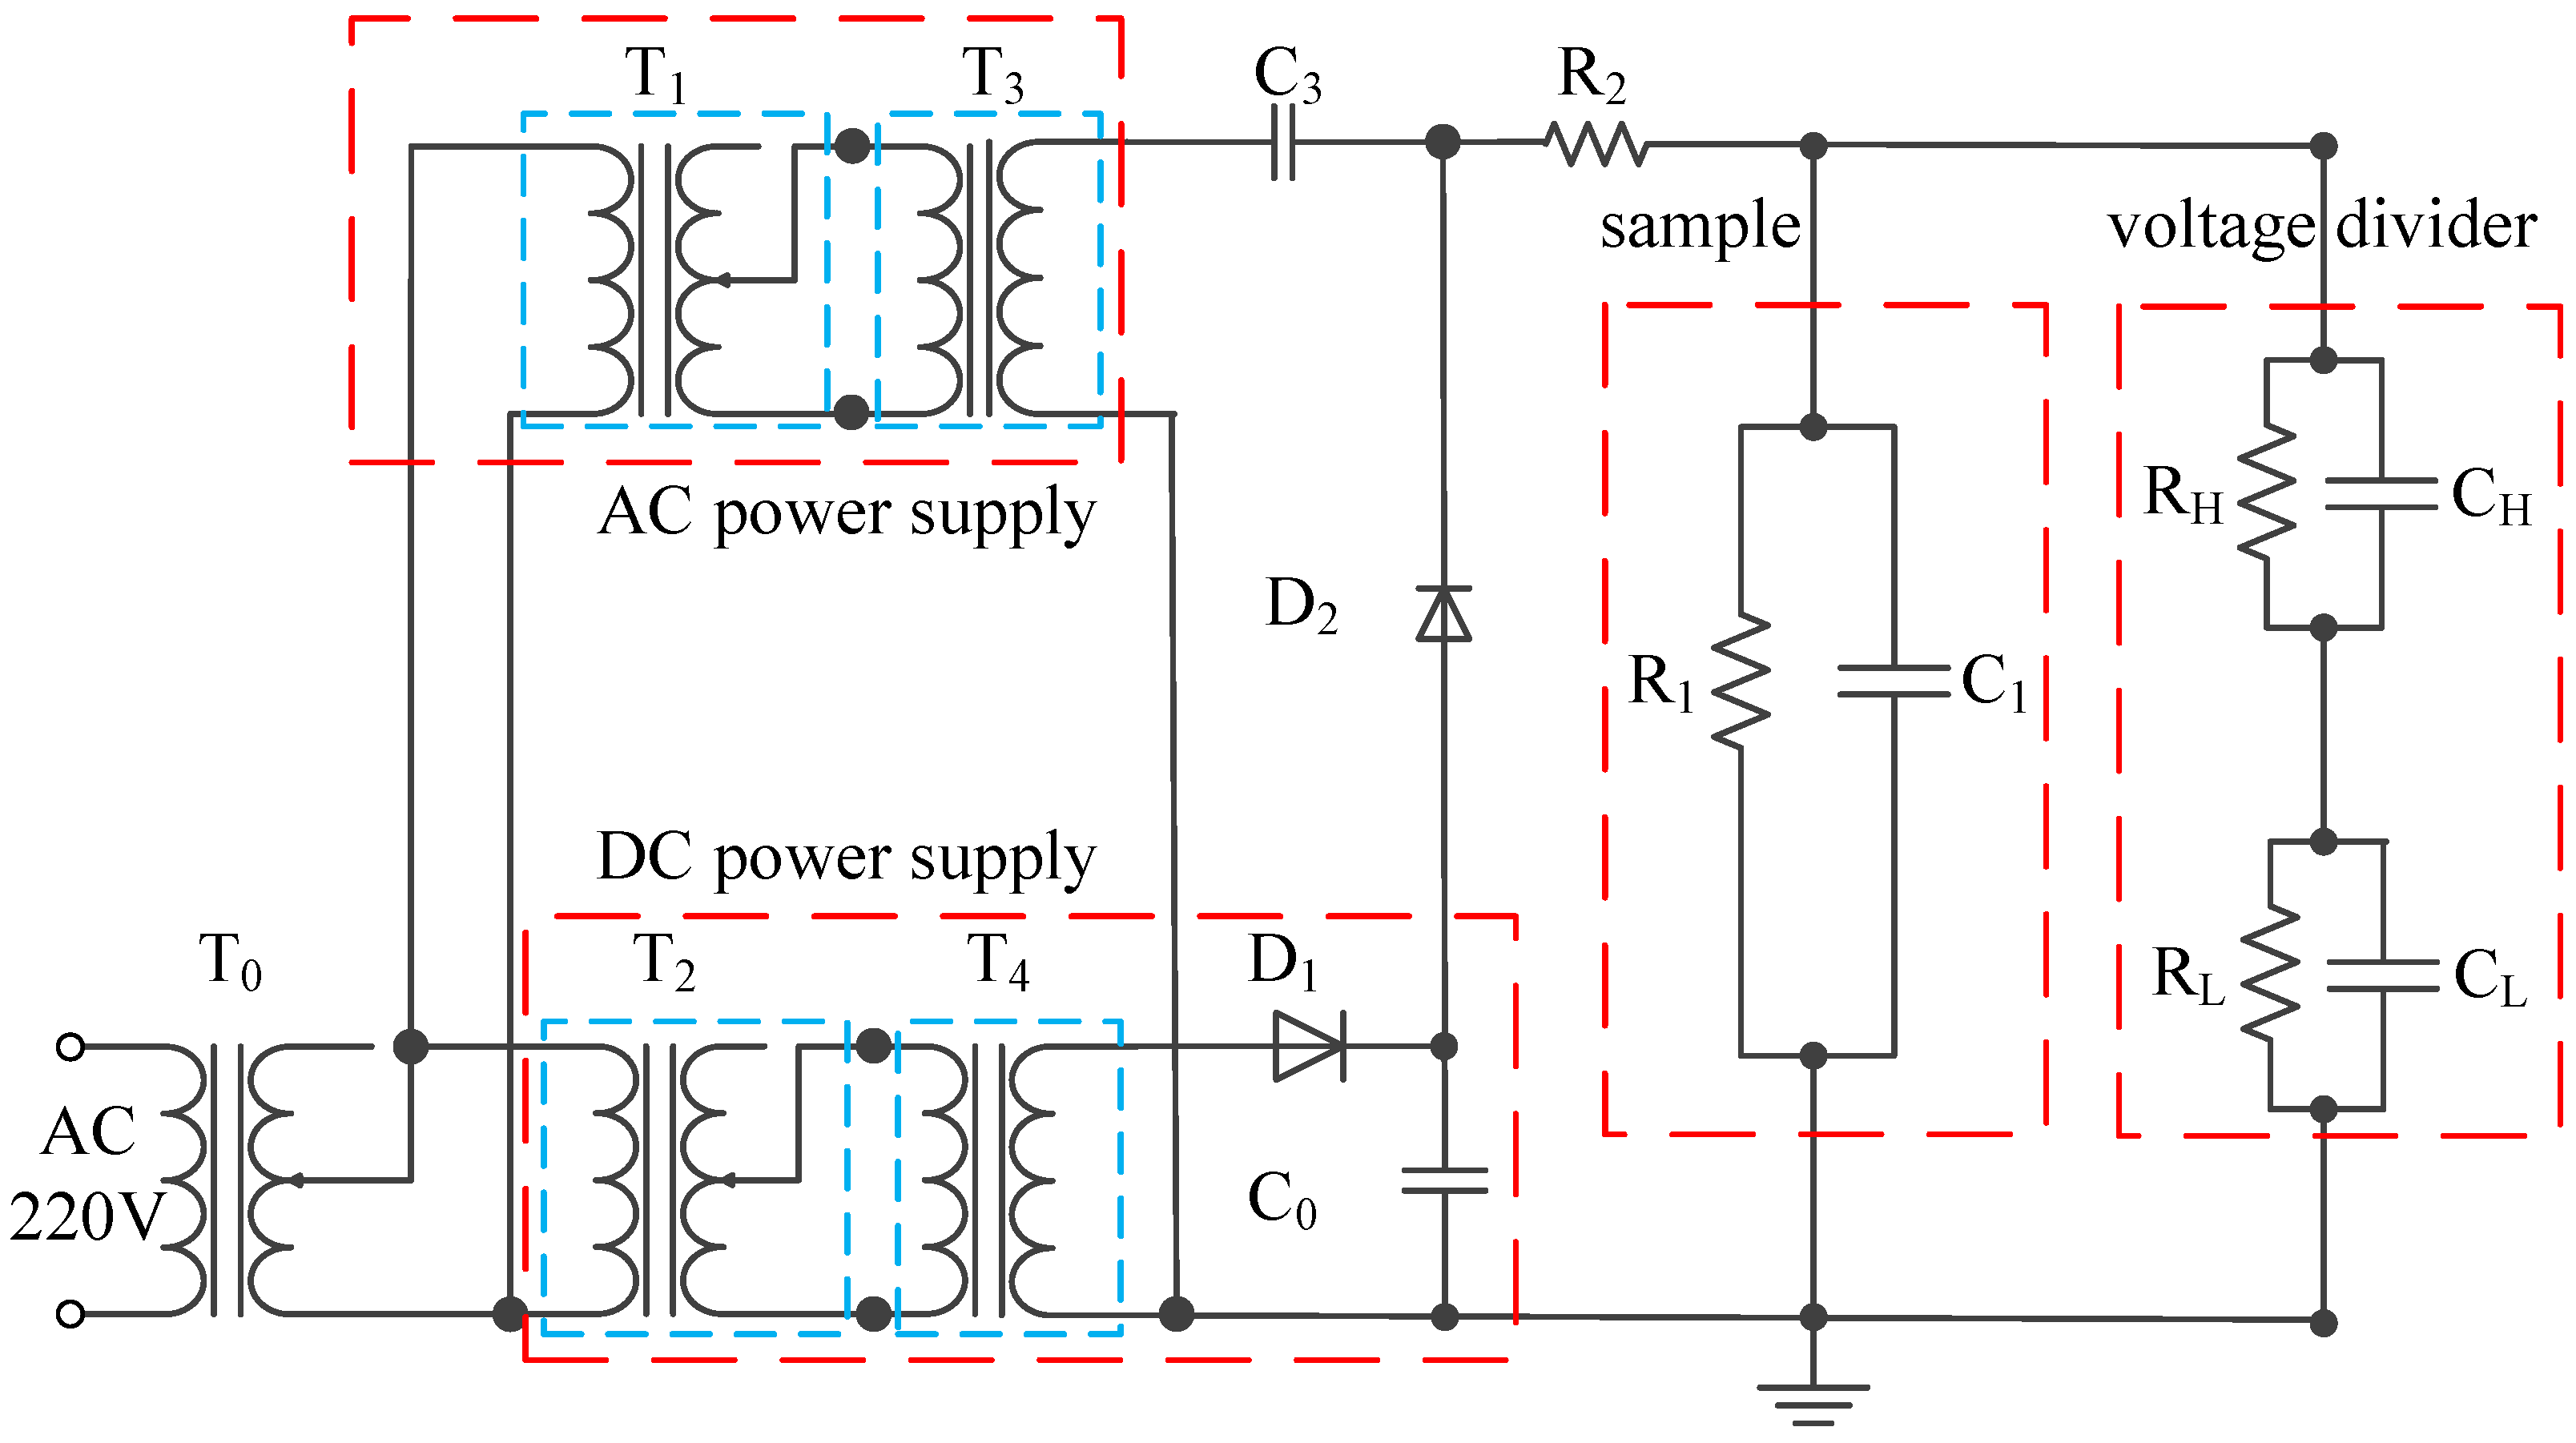
The test system, comprising a DC voltage power supply, an AC voltage power supply, a voltage divider, a protective resistor (R2, 30 kΩ/150 kV), a coupling capacitance (C3, 0.01 μF/80 kV), filter capacitor (C0, 0.5 μF/80 kV), voltage regulators, and high-voltage silicon stacks (D1, D2, 2 A/250 kV), can generate AC-DC combined voltage, as shown in Figure 2. The rated power, output voltage range and rated frequency of the voltage regulators (T0, T1, T2) are 15 kVA, 0–220 V and 50 Hz, respectively. The rated power, rated input/output voltage, rated output current and rated frequency of high voltage test transformer (T3, T4) are 15 kVA, 0.22/150 kV, 0.1 A and 50 Hz, respectively. The DC content of the AC-DC combined voltage can be adjusted using the voltage regulators T1 and T2, and the voltage amplitude can be adjusted using the voltage regulator T0.
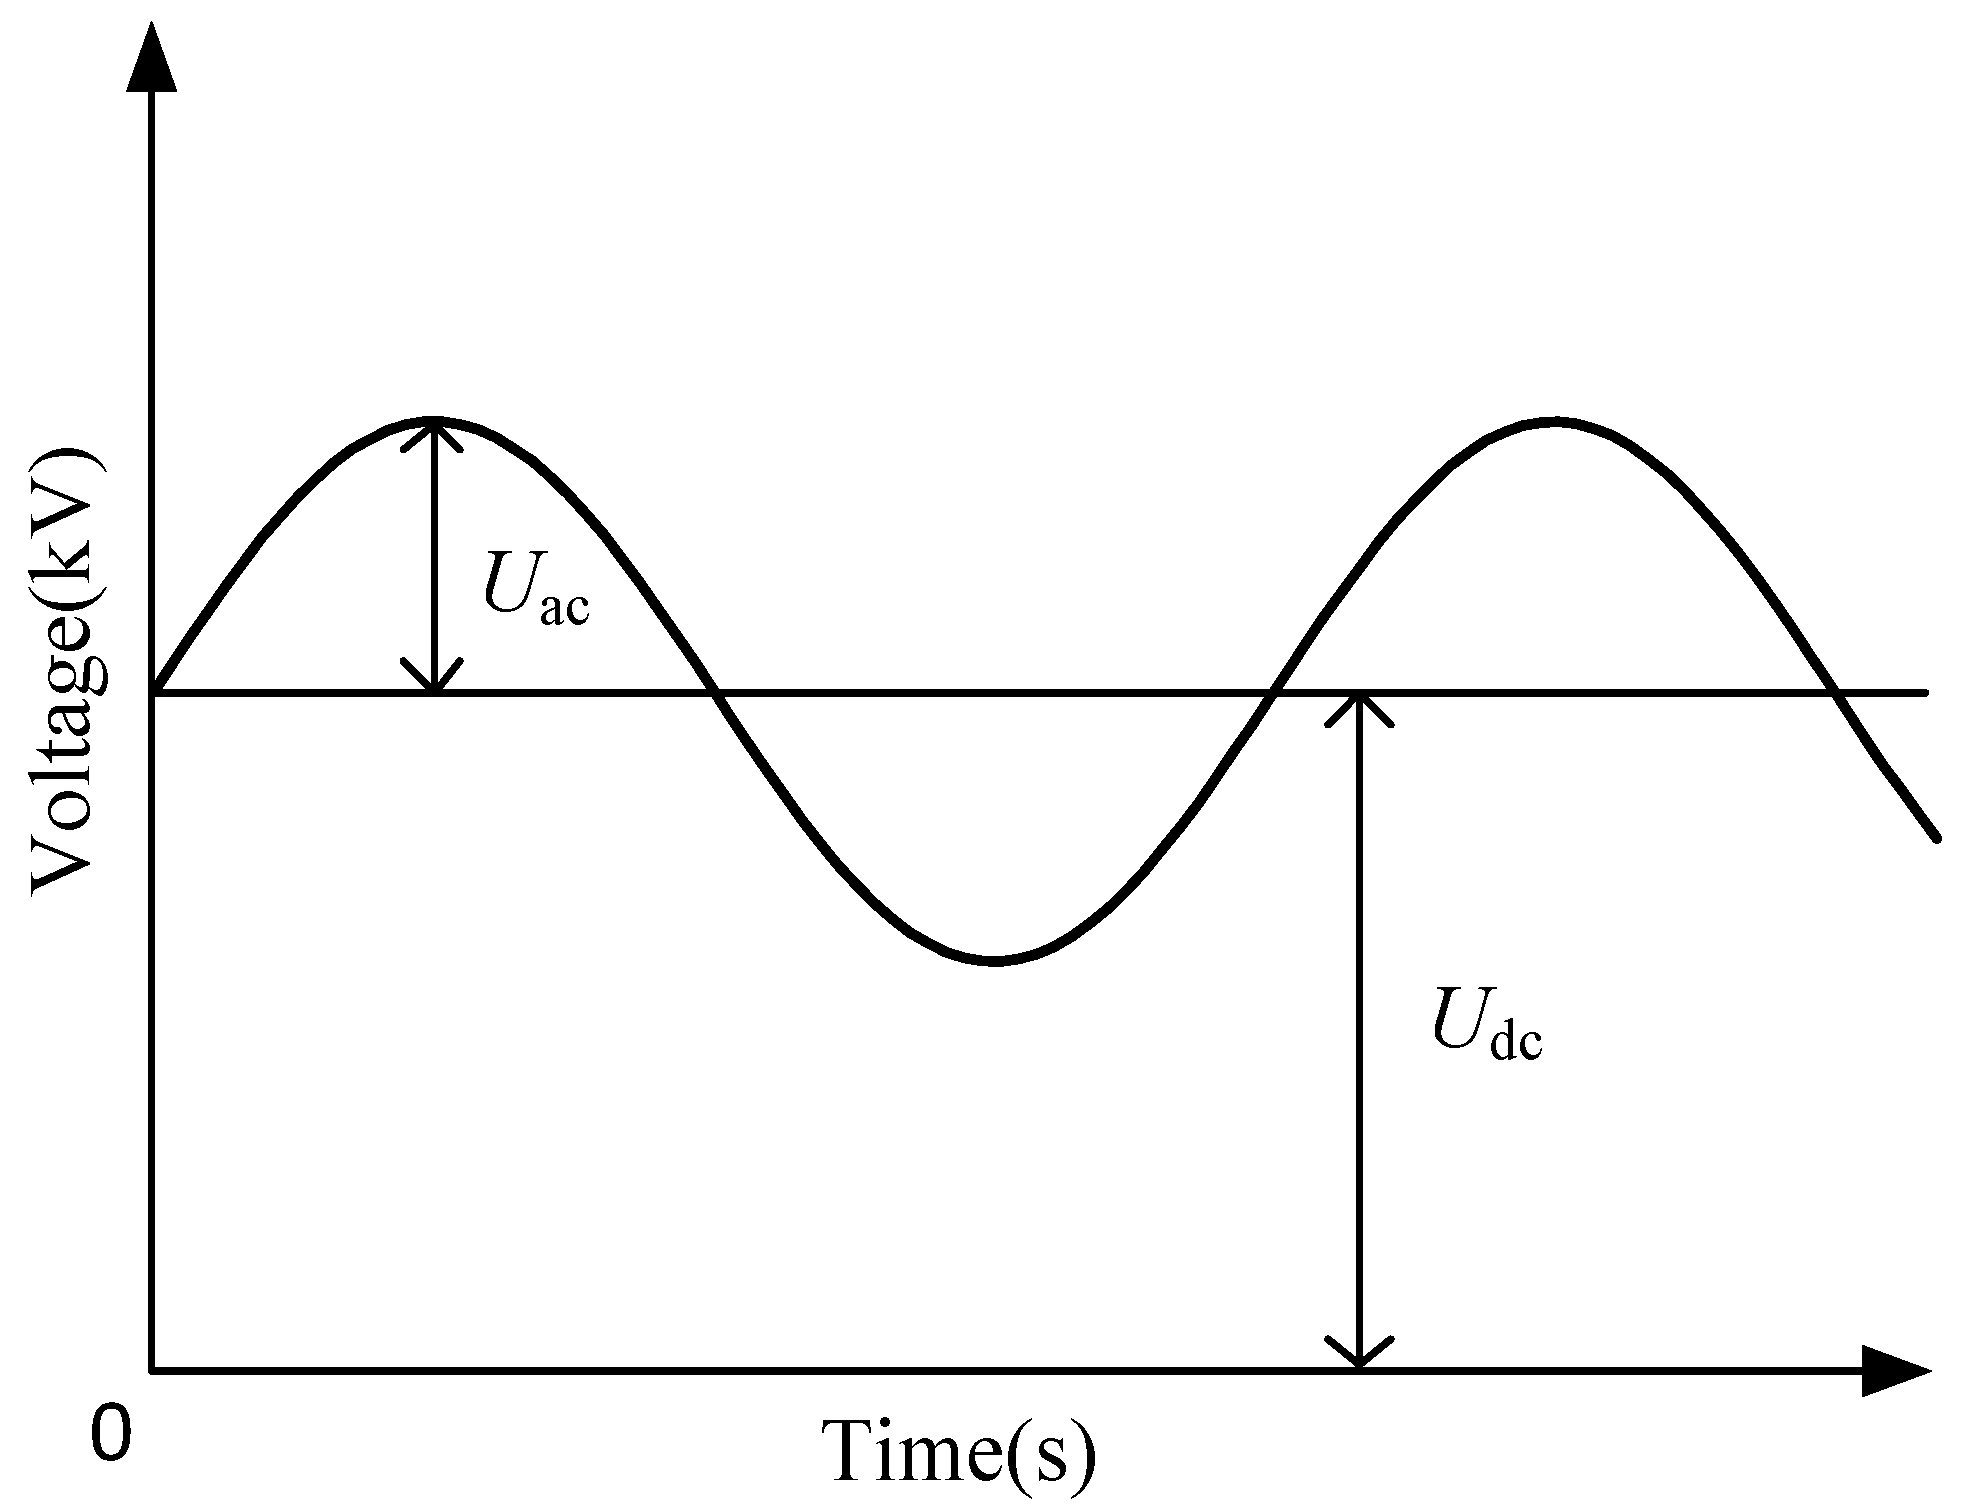
Figure 3 shows the waveform of the AC-DC combined voltage. The DC content of the voltage is expressed as follows:
where Uac is the peak of the AC voltage component, and Udc is the average of the DC voltage component. The nomenclature section including the symbols and used parameters in this paper are shown in Table 2.
3. Test Results
Figure 4 shows the breakdown strength of the transformer oil under AC-DC combined voltage at room temperature. The breakdown strength of the transformer oil decreases with the increase in the DC content. The breakdown strength of the transformer oil under pure DC voltage is approximately 66.5% that under pure AC voltage, probably due to impurities such as moisture and gas. With the increase in the DC content of the applied voltage, the impurities more easily polarize, and they align between the electrodes to form a discharge channel.
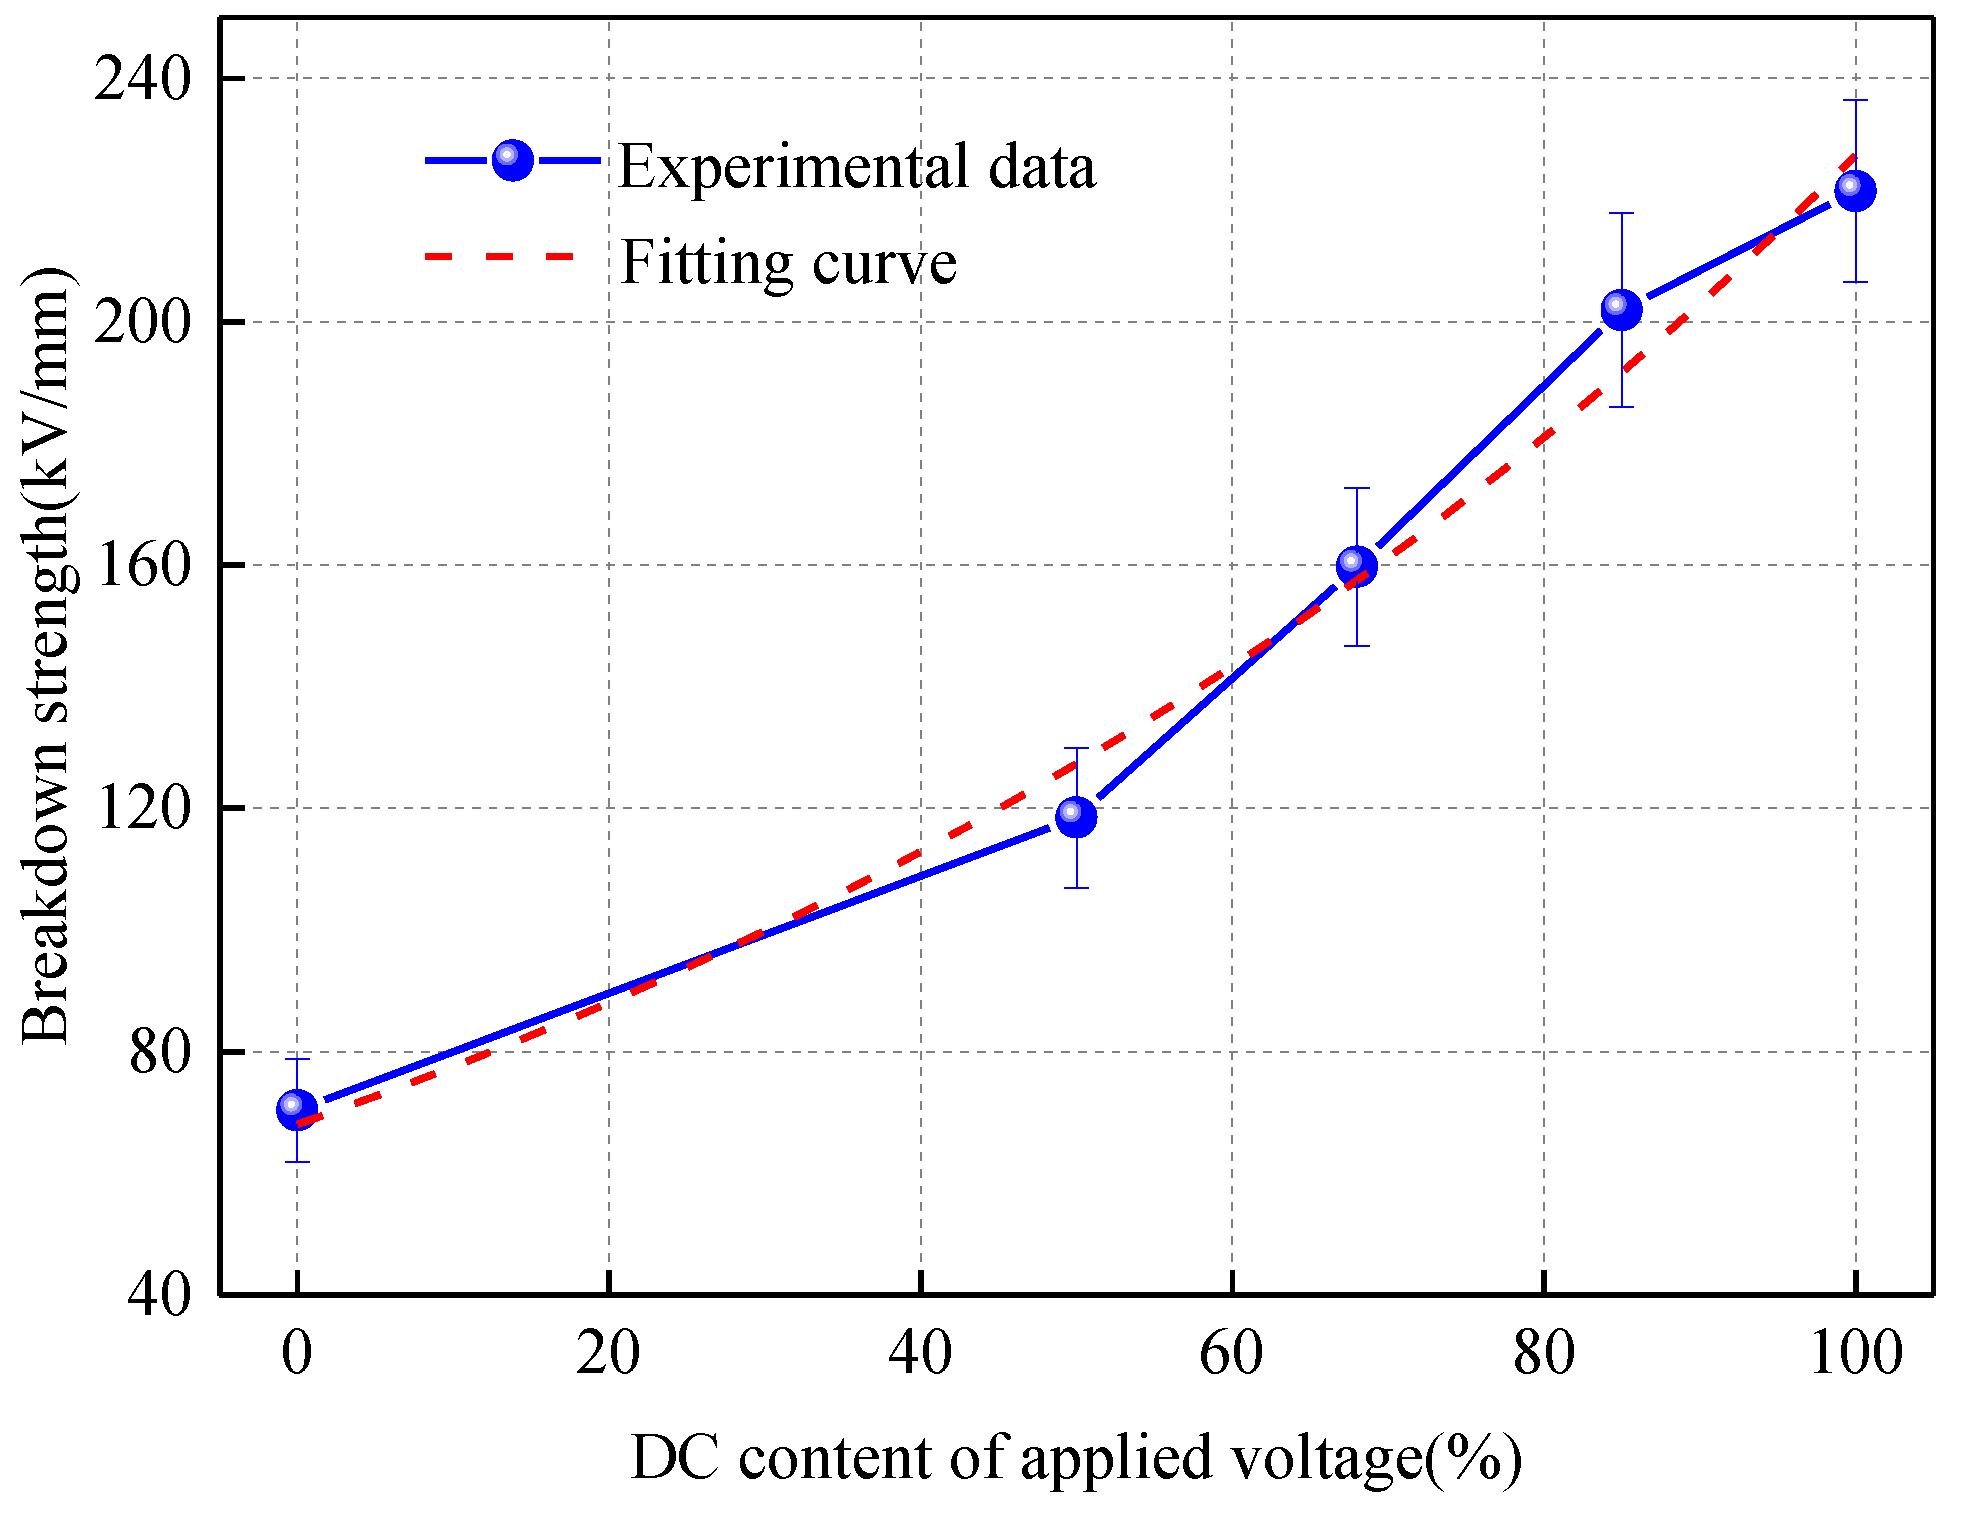
Figure 5 shows the breakdown strength of the pressboard under AC-DC combined voltage at room temperature. The breakdown strength of the pressboard increases with the increase in the DC content of the applied voltage, and the breakdown strength under pure AC voltage is only approximately 31.6% that under pure DC voltage. The oil-immersed pressboard is composed of cellulose, with transformer oil gap between the cellulose. The electric field in the transformer oil increases with the decrease in the DC content because of its lower permittivity compared to that of the pressboard. And its lower breakdown strength, which can easily lead to the transformer oil breakdown. Once the breakdown occurs in the oil gap, it will initiate the breakdown of the entire pressboard.
The fitted expressions can be derived through exponential fitting. Table 3 lists the fitted expressions and the correlation coefficients for the breakdown strength of the transformer oil and pressboard.
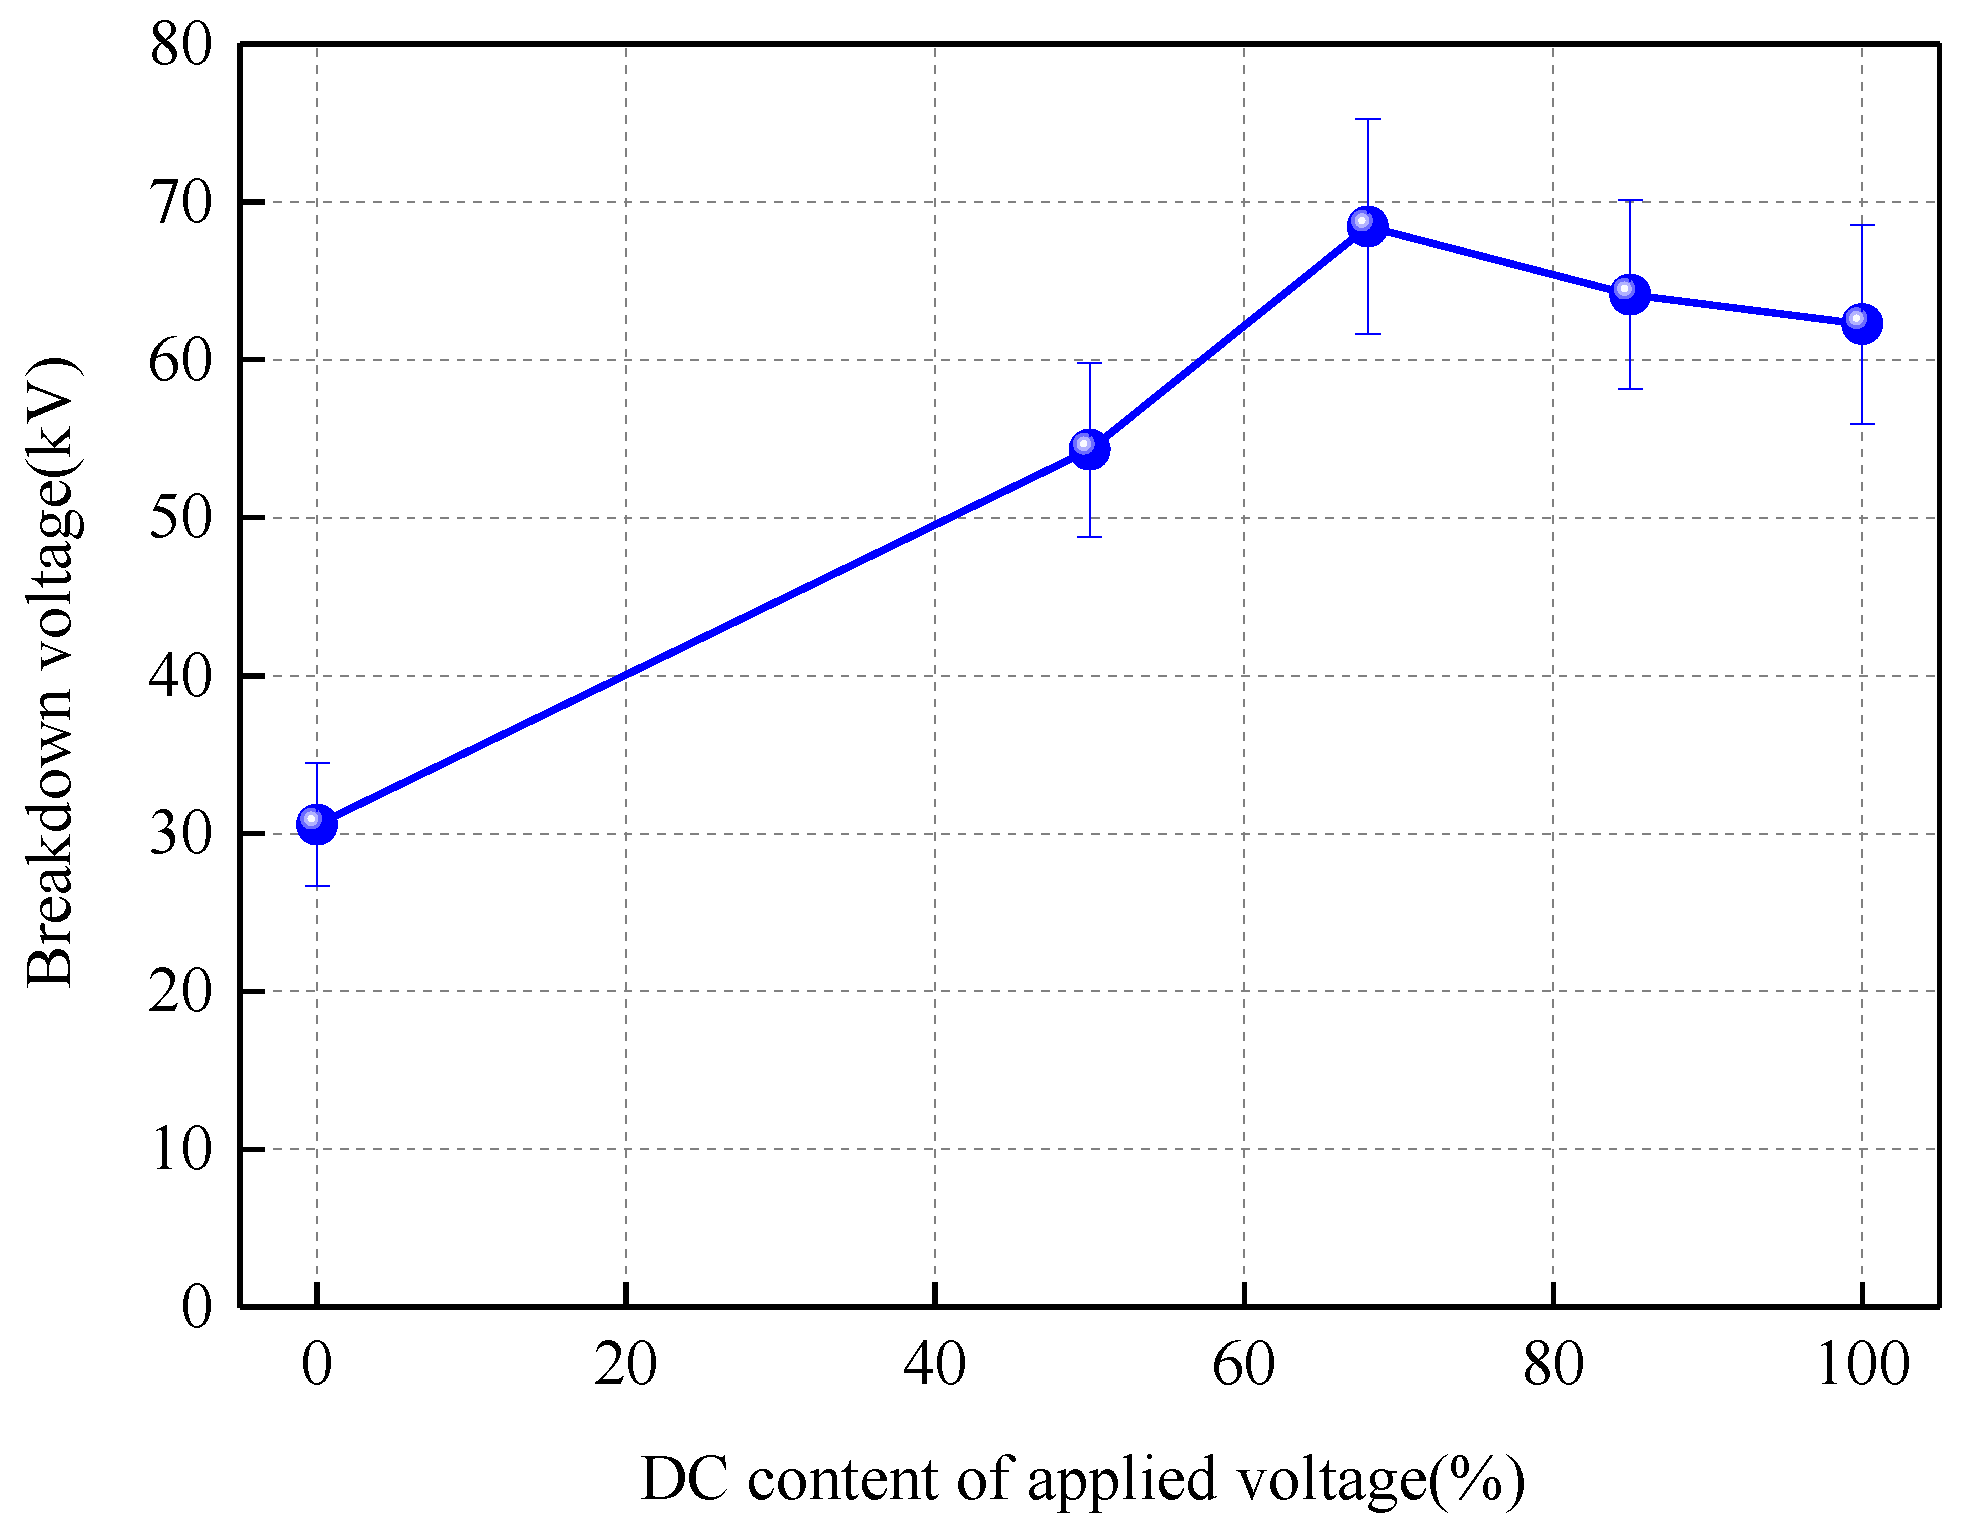
Figure 6 shows the breakdown voltage of the oil-pressboard insulation under AC-DC combined voltage at room temperature. The breakdown voltage of the oil-pressboard insulation increases first and then decreases with the increase in the DC content. The breakdown voltage reaches its peak at a DC content of 68%.
4. Mathematical Model of Breakdown of Oil-Pressboard Insulation
4.1. Simplified Model
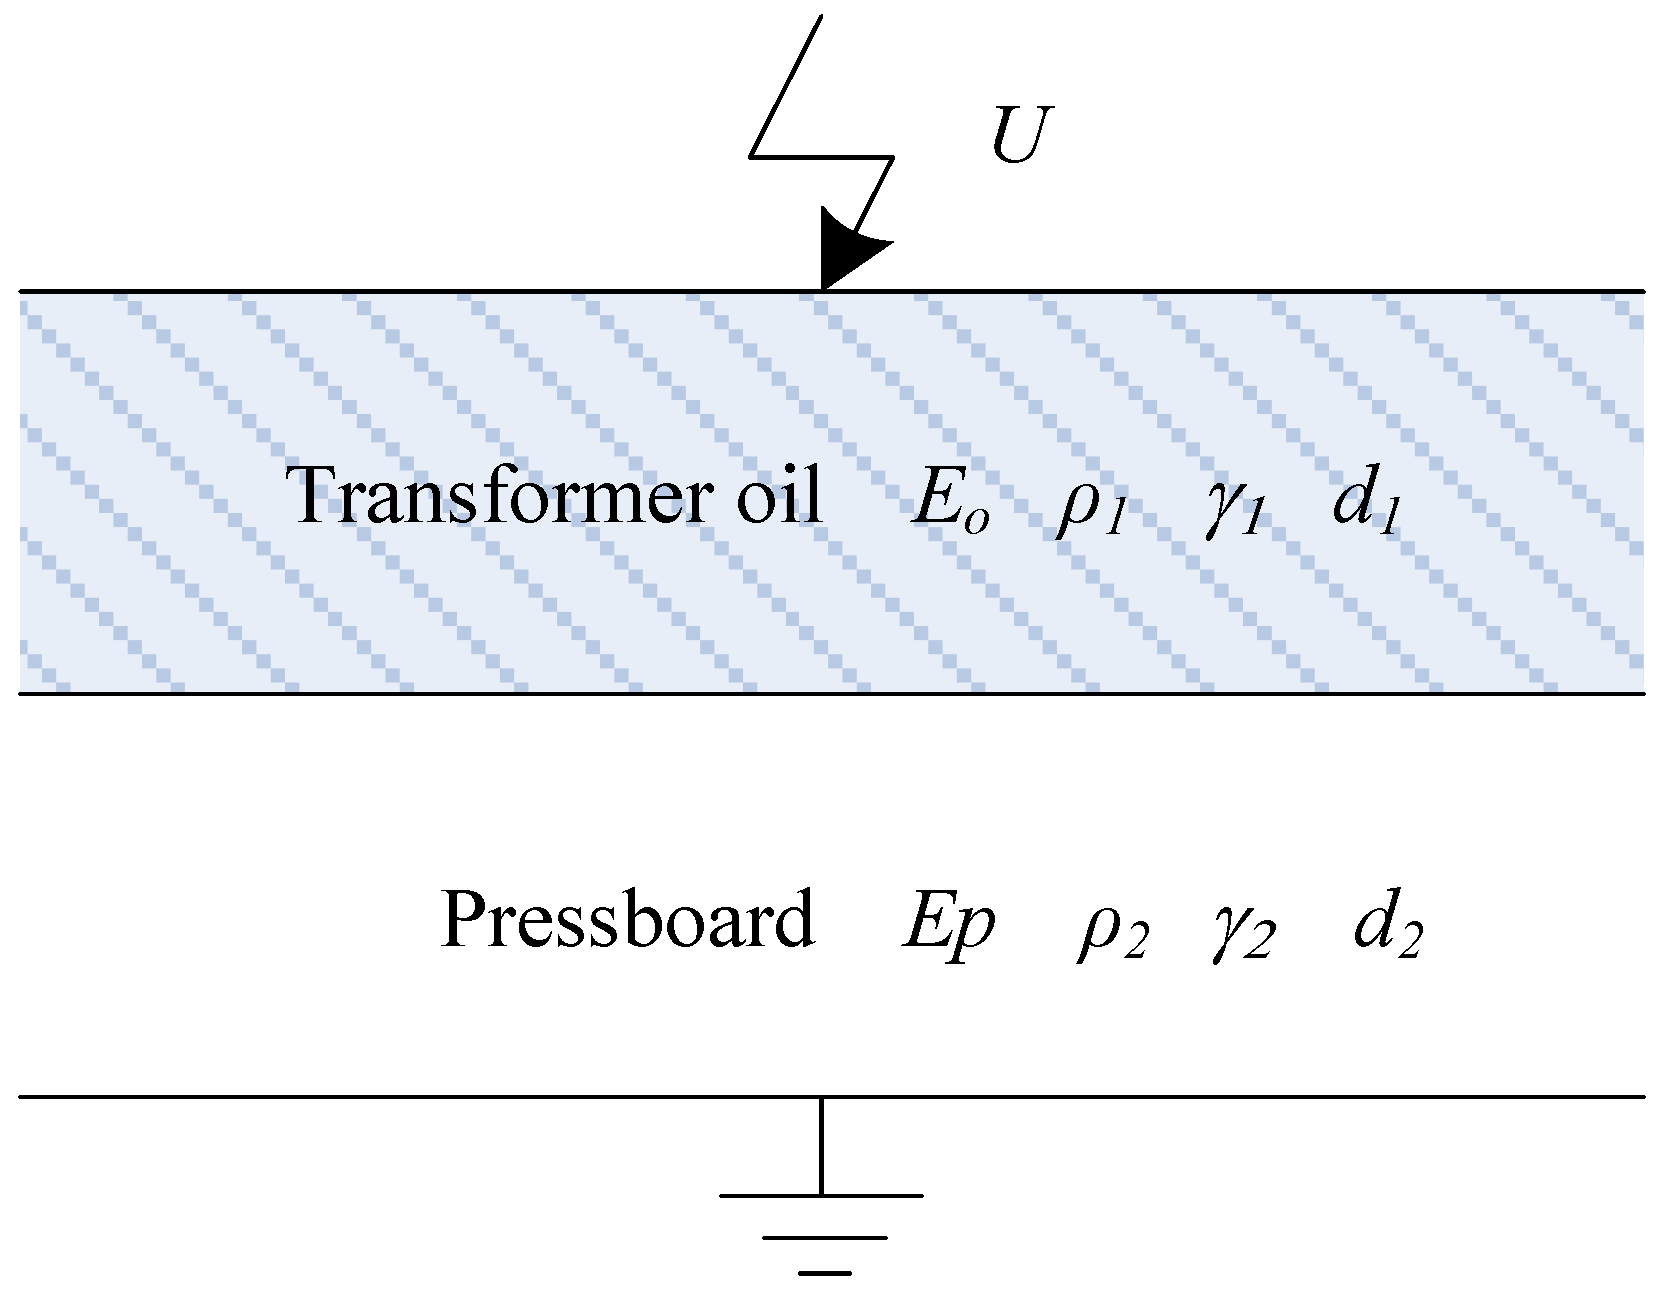
To study the effect of DC content on the electric field distribution in the oil-pressboard insulation more directly, the oil-pressboard insulation model, shown in Figure 1, is simplified to a physical model of the oil-pressboard insulation, as shown in Figure 7. Eo and Ep, ε1 and ε2, ρ1 and ρ2, and d1 and d2 are the electric-field strengths, relative permittivity, resistivity, and thicknesses of the transformer oil and pressboard, respectively.
4.2. Mathematical Expression of Electric Field Distribution
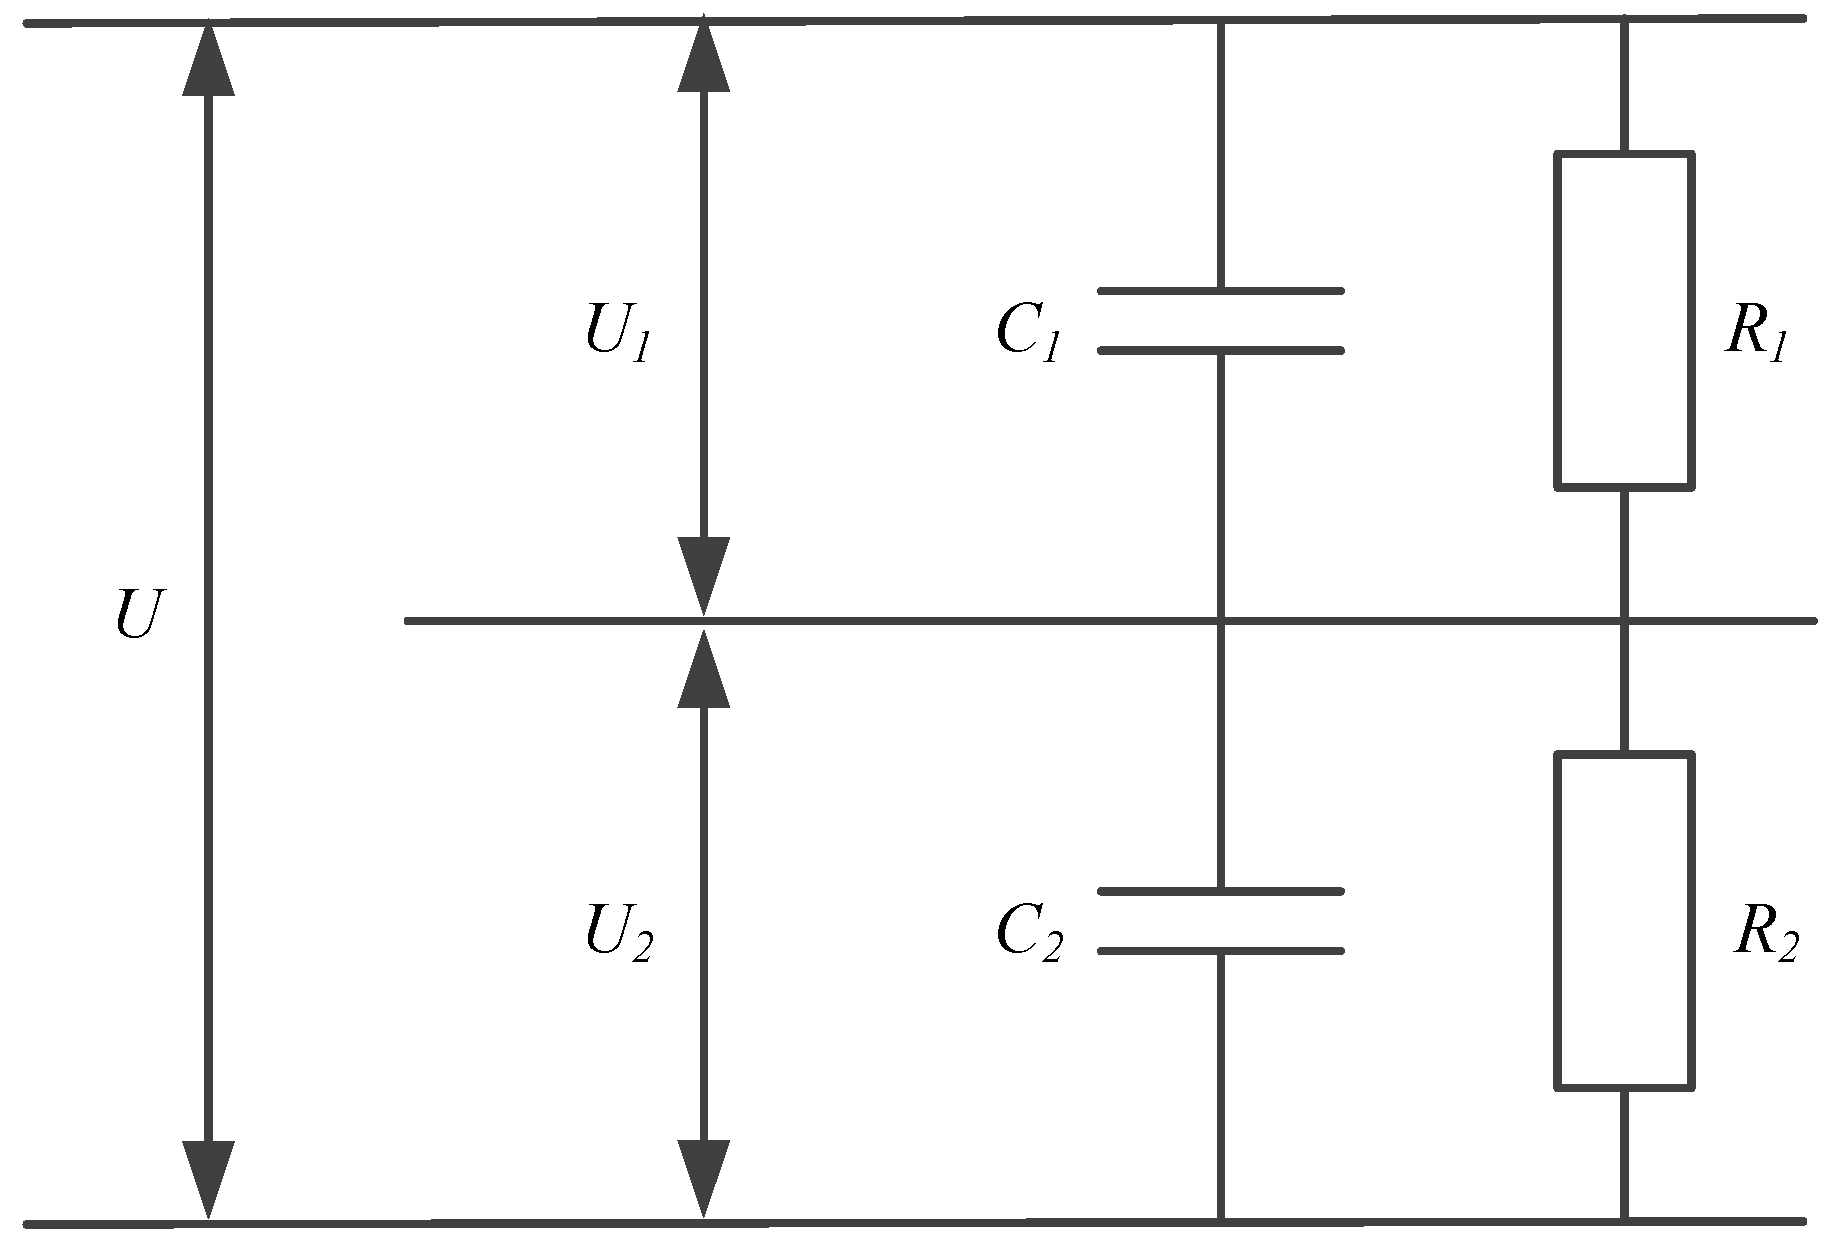
The AC electric field component of the AC-DC combined electric field is distributed by the capacitances of the transformer oil and pressboard. The DC electric field component of the AC-DC combined electric field is distributed by the capacitance when the voltage is just applied but it is distributed by the resistance in the steady state. To simplify the analysis, the analysis is focused on the electric field distribution in the steady state, and the electric field in the medium is assumed to be uniform. Because of the superposition of the electric field, the electric field strength (Eo) in the transformer oil and the electric field strength (Ep) in the pressboard can be obtained using E = U/d, as follows:
The following equations are obtained by substituting Equation (1) into Equation (2):
where , , and .
As shown in Equation (3), Eo and Ep are mainly affected by the parameters of A and C when η is high, whereas they are mainly affected by the parameters of B and D when η is low. This indicates that the electric field distribution is significantly affected by the resistivity when the DC content is high and by the relative permittivity when the DC content is low. The breakdown of insulating material is mainly affected by the maximum value of the voltage waveform. Hence, the peak voltage (i.e., sin(wt) = 1) is chosen to analyze the electric field distribution in the oil-pressboard insulation, which can be obtained using Equation (3), as follows:
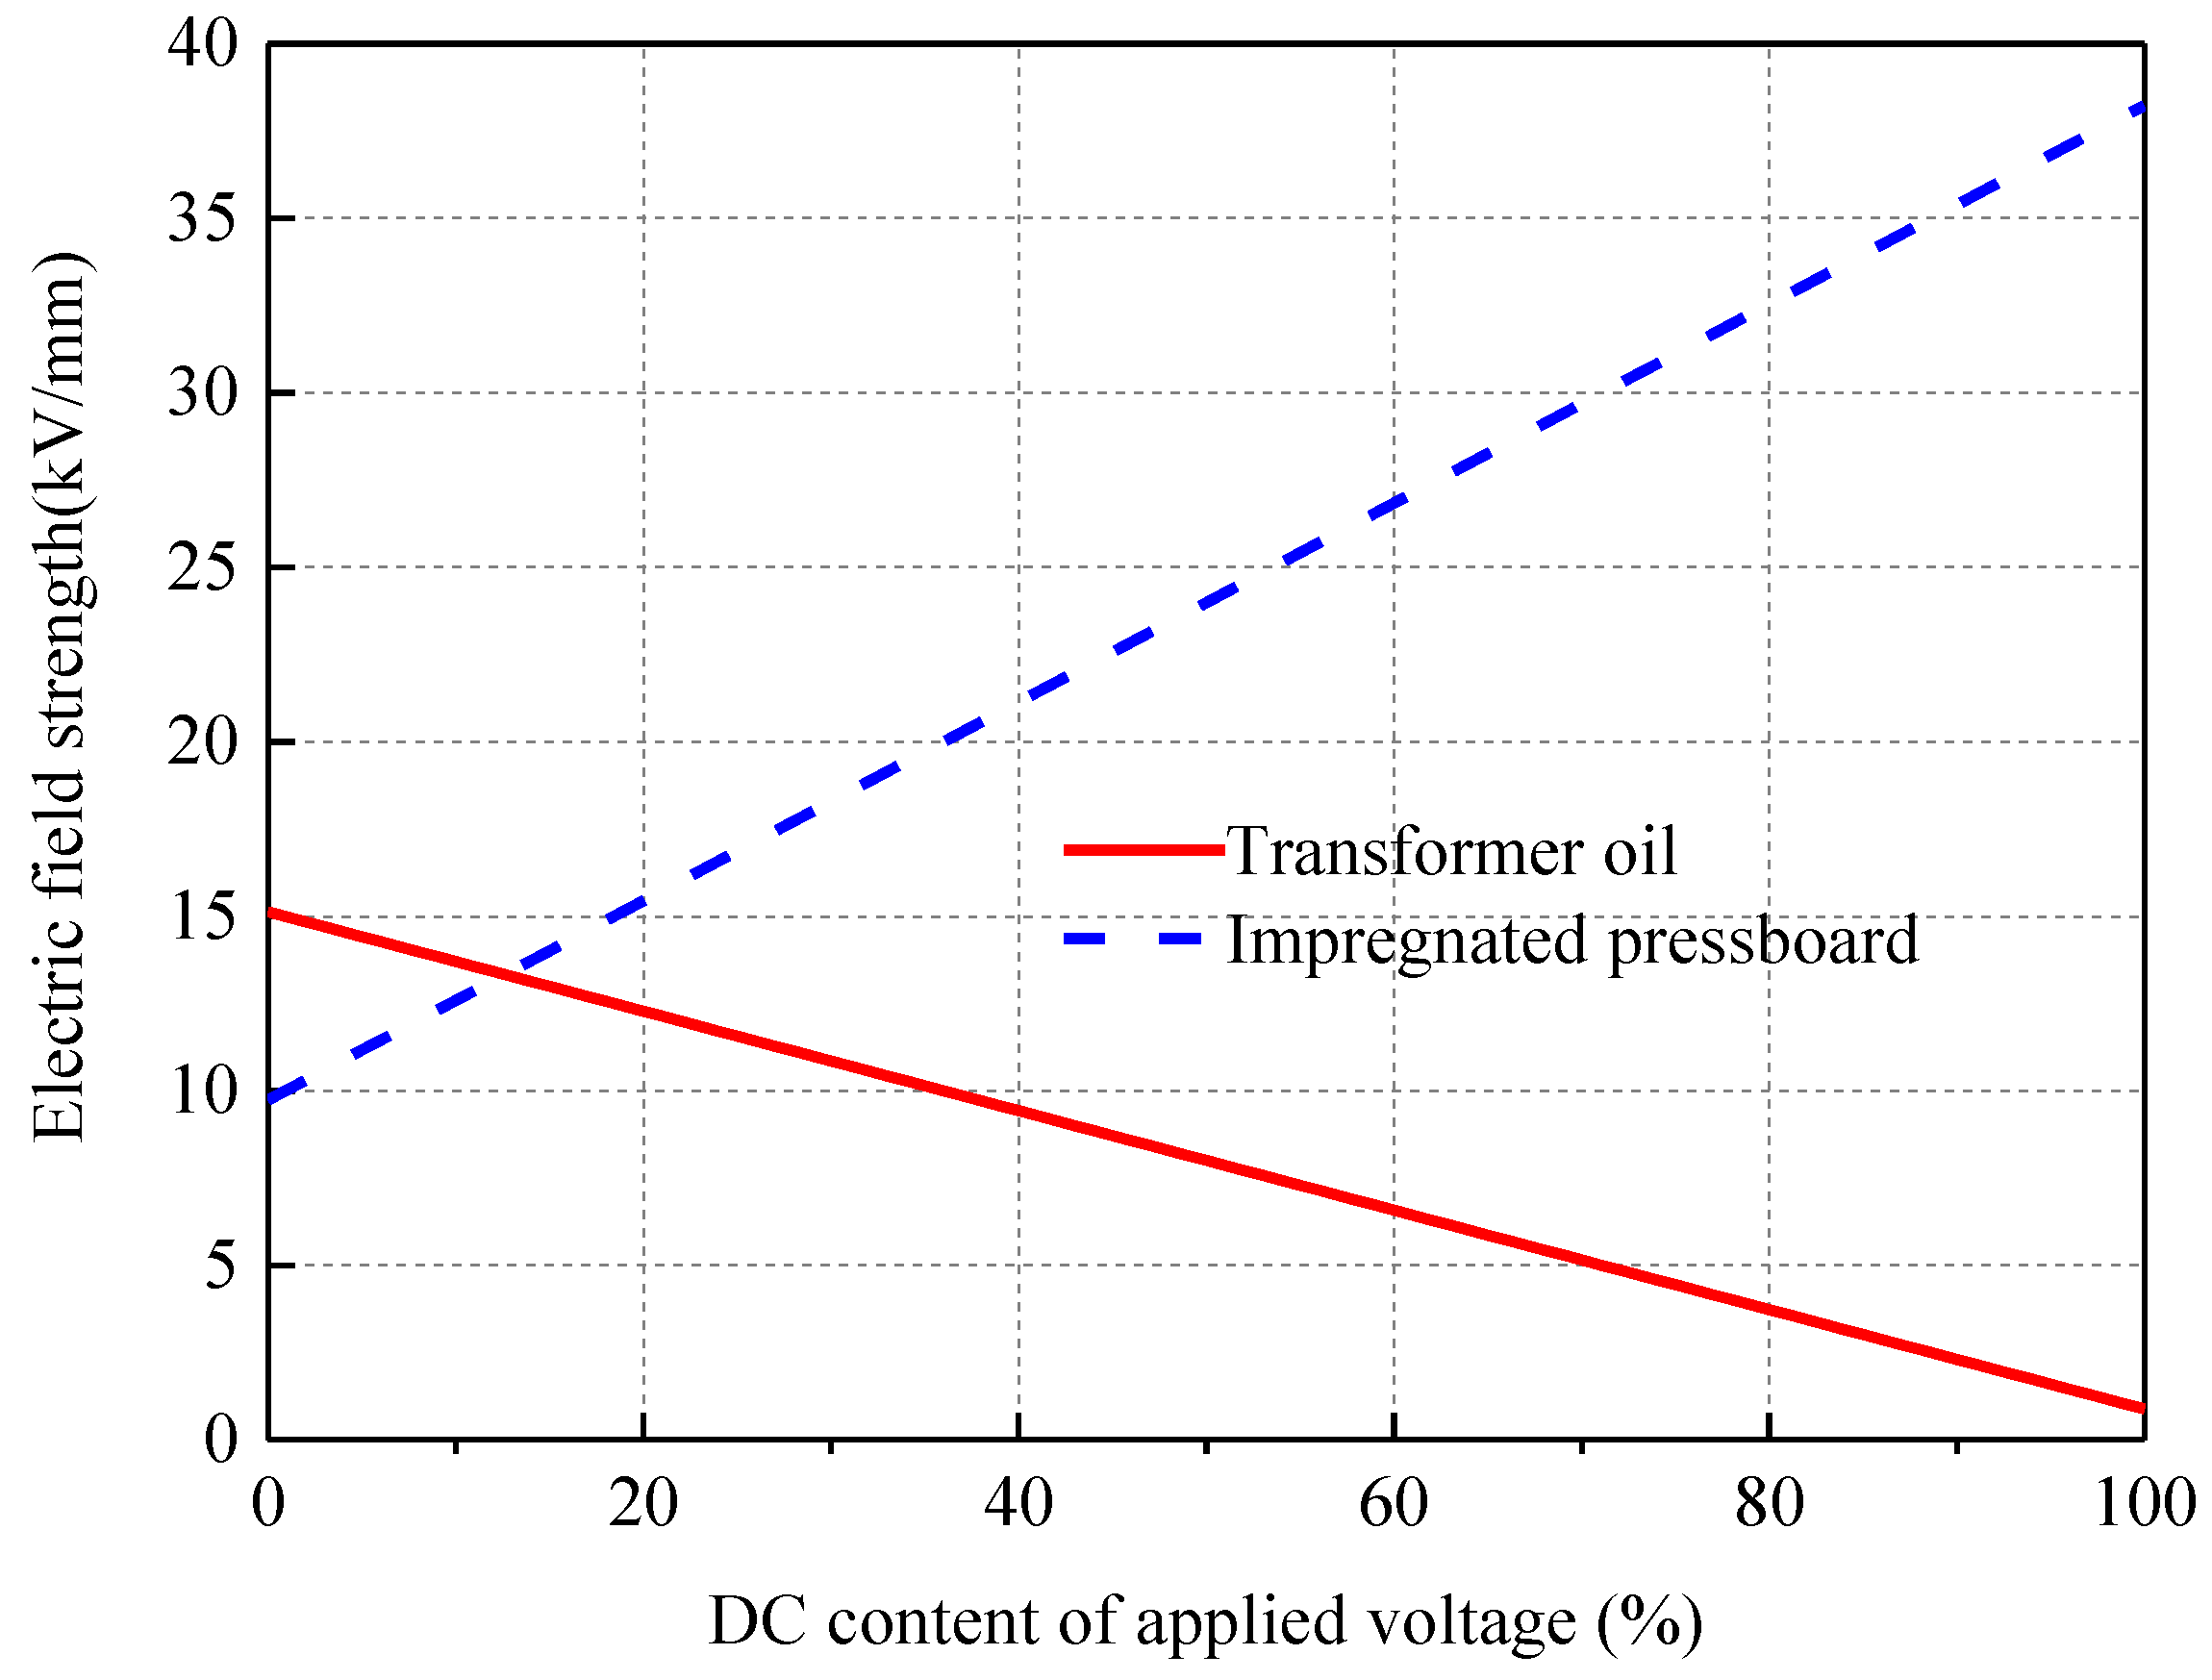
The electric field in oil and pressboard calculated by Equation (3) varies with time, while the result of Equation (4) calculation is its maximum value. Using Equation (4), the electric field distribution in the oil-pressboard insulation with different DC contents is simulated under a voltage of 10 kV. Figure 9 shows the simulation results.
As shown in Figure 9, the electric field strength of the transformer oil decreases with the increase in the DC content, whereas that of the pressboard increases. As listed in Table 1, ρ1 = 0.023ρ2, ε1 = 0.646ε2, and d1 = 2d2, which makes A = 0.088 mm−1, B = 1.51 mm−1, C = 3.82 mm−1 and D = 0.98 mm−1. Hence, A − B < 0 and C − D > 0 in Equation (4). Thus, Eo decreases and Ep increases with the increase in the DC content when the peak voltage is the same. The DC contents of the transformer oil (ηo) and pressboard (ηp) can be obtained using Equation (4), shown as follows:
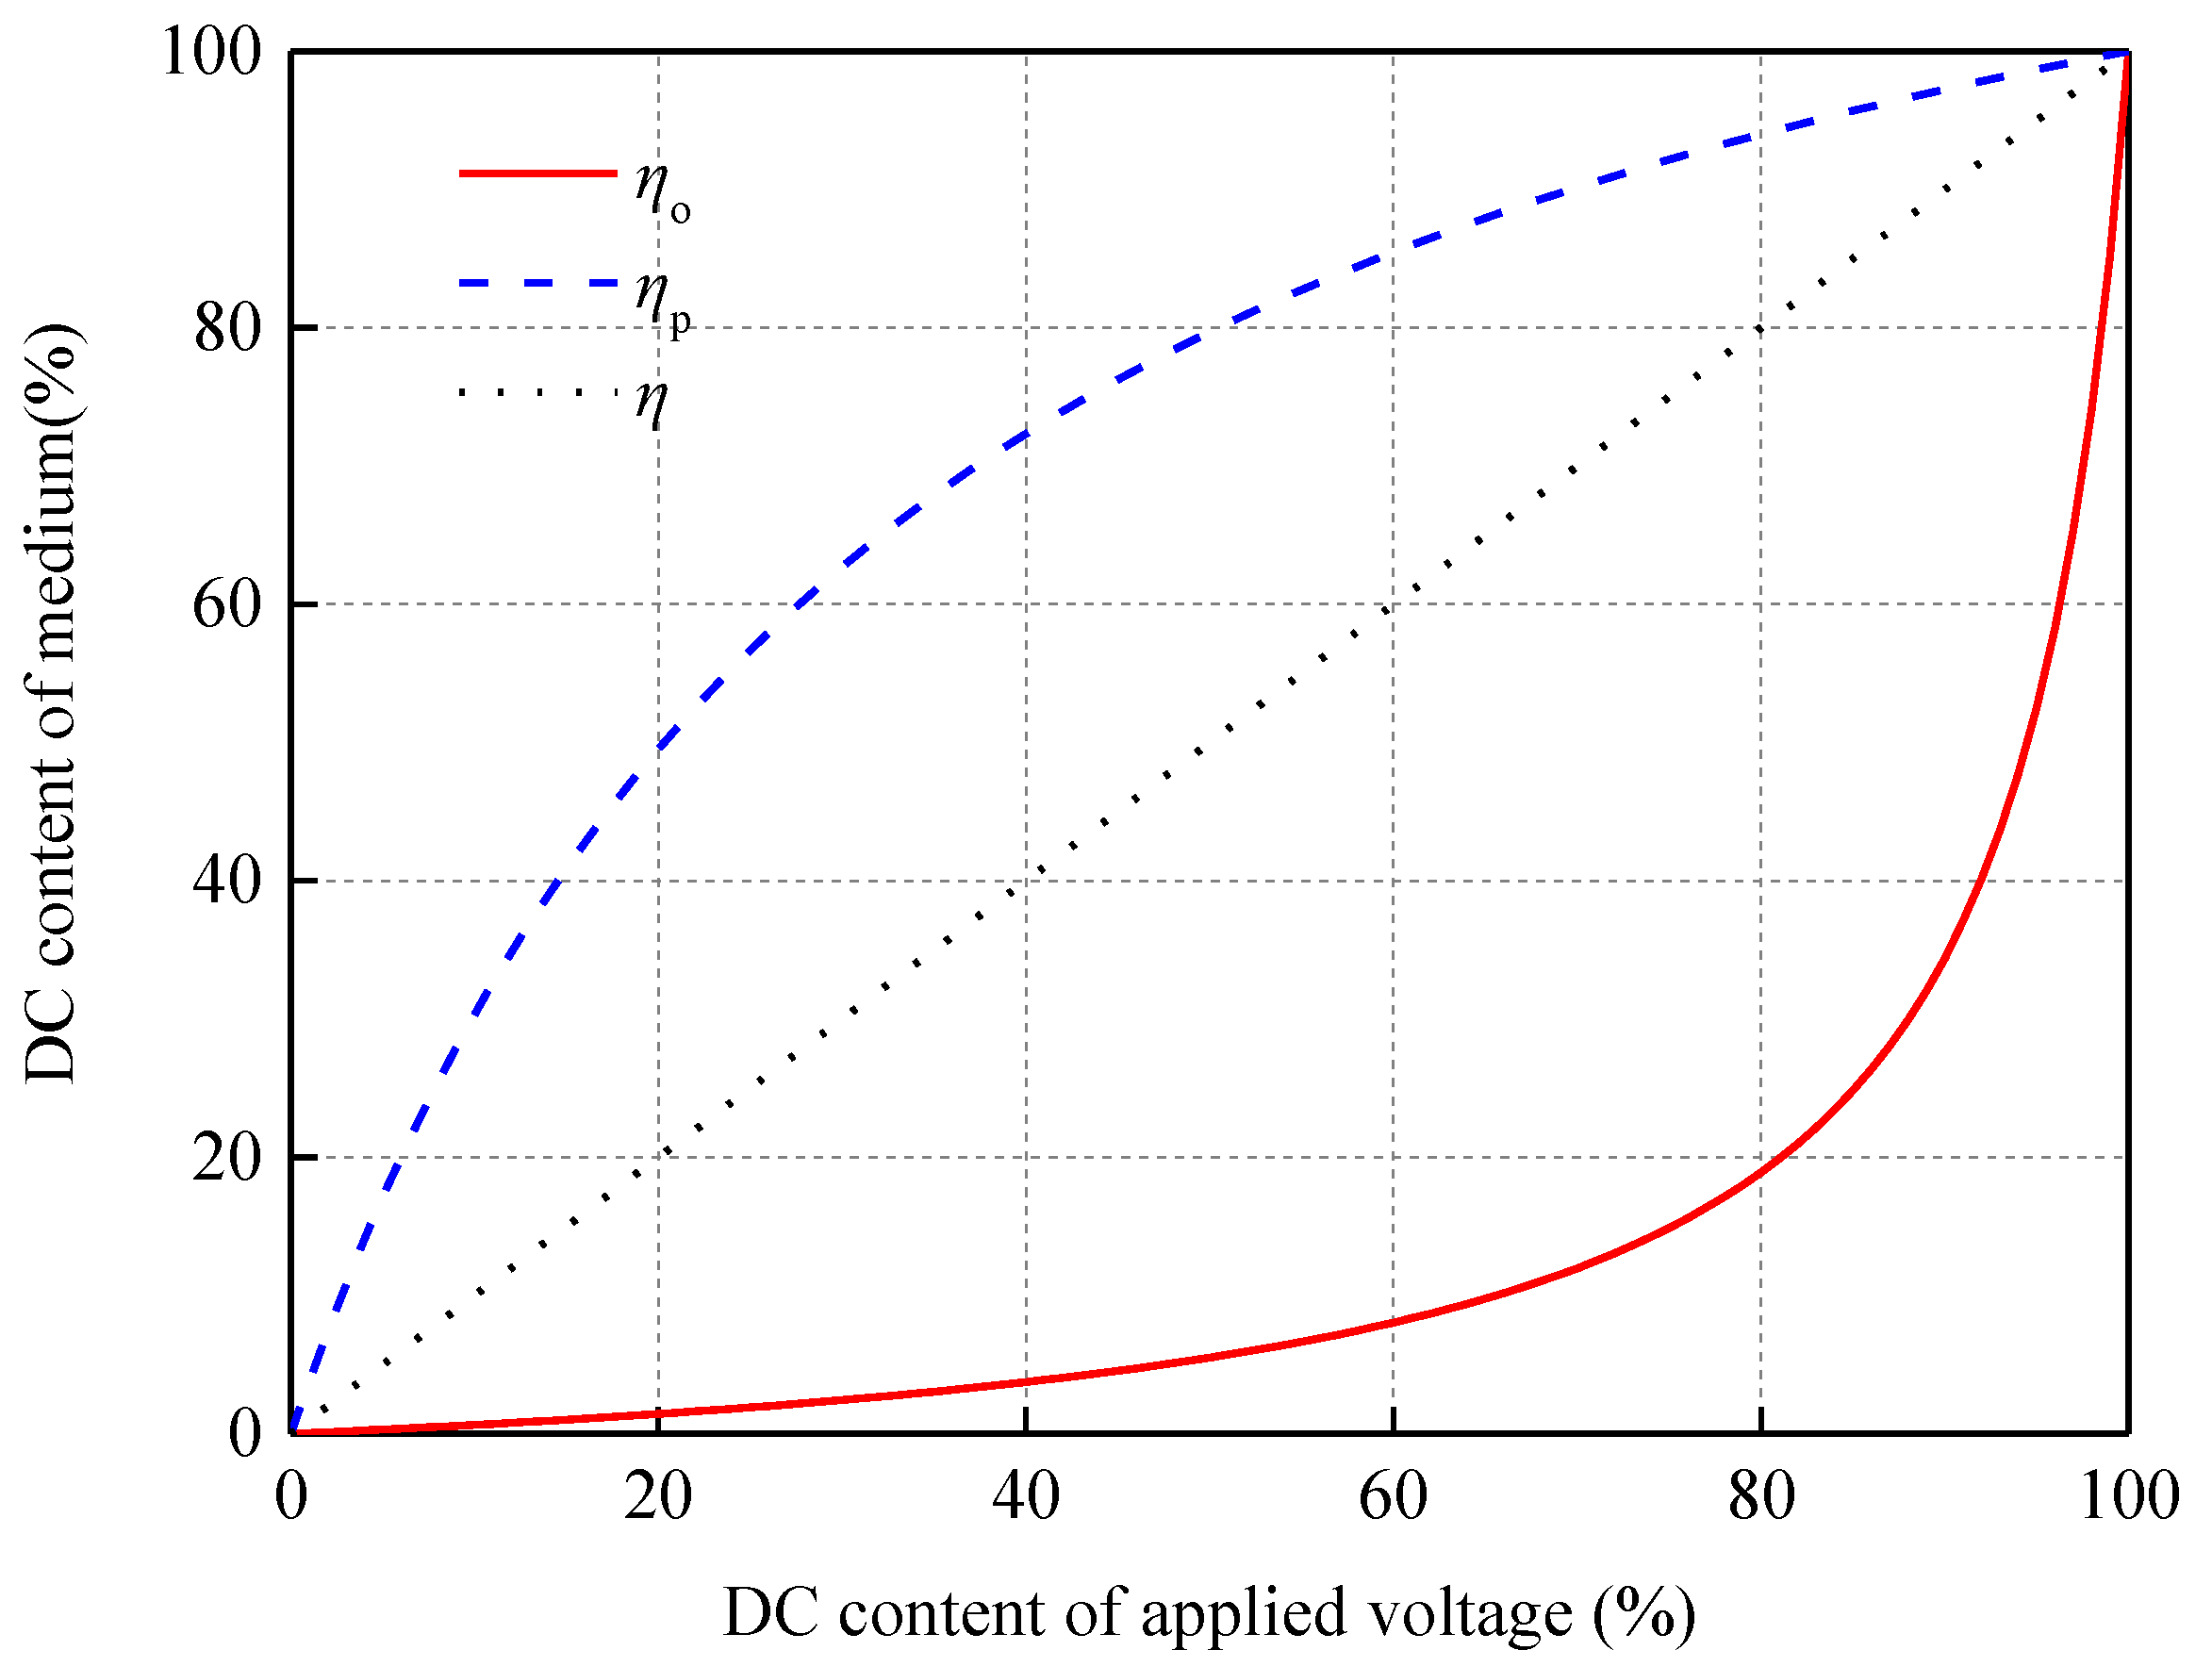
Figure 10 shows the DC contents of the transformer oil and pressboard of the oil-pressboard insulation under different DC contents of the applied voltage. The DC contents of the transformer oil and pressboard are the same as that of the applied voltage when the applied voltage is pure DC voltage or pure AC voltage. In other cases, the DC content of the transformer oil is lower than that of the applied voltage, whereas the DC content of the pressboard is higher than that of the applied voltage. As the resistivity of the pressboard is significantly greater than that of the transformer oil, the DC voltage component of the applied voltage is mainly applied to the pressboard. As a result, the DC content of the pressboard increases and that of the transformer oil decreases.
As ηo and ηp are different from η, the ηo and ηp corresponding to the breakdown strength are different from the η corresponding to the breakdown strength. By substituting Equation (5) into the fitting expression of the breakdown strength, listed in Table 3, the breakdown strengths of the transformer oil and pressboard of the composite insulation (Ebo′ and Ebp′) corresponding to the DC content of the applied voltage can be obtained as follows:
Figure 11a,b show the breakdown strengths (Ebo′ and Ebp′) corresponding to the DC content of the applied voltage and the breakdown strengths (Ebo and Ebp) corresponding to the DC content of the medium, respectively. Ebo′ is greater than Ebo, and Ebp′ is greater than Ebp when the DC content is the same. Figure 10 shows that ηo is lower than η, whereas ηp is higher than η. The test results show that Ebo decreases and Ebp increases with the increase in the DC content; therefore, Ebo(ηo) is greater than Ebo(η), and Ebp(ηp) is greater than Ebp(η). According to Equation (5), Ebo′(η) is greater than Ebo(η), and Ebp′(η) is greater than Ebp(η). Thus, the breakdown strength corresponding to the DC content of the applied voltage is greater than that corresponding to the DC content of the medium when the DC content is the same.
4.3. Mathematical Model of Breakdown Voltage of Oil-Pressboard Insulation
The breakdown voltages (Uo-ca and Up-ca) of the oil-pressboard insulation are calculated on the basis of the breakdown strengths and electric field distributions of the transformer oil and pressboard of the composite insulation. They can be expressed as follows by substituting Equation (6) into Equation (4). The results calculated by substituting Equation (6) into Equation (4) is the minimum value of the results calculated by substituting Equation (6) into Equation (3):
When the oil-pressboard insulation breaks down, either the transformer oil or the pressboard breaks down first. The voltage will then be applied to the other medium completely, and the DC content of the other medium becomes the DC content of the applied voltage. When the applied voltage is higher than the breakdown voltage of the other medium, the composite insulation will break down. When the applied voltage is lower than the breakdown voltage of the other medium, the breakdown voltage of the composite insulation becomes the breakdown voltage of the other medium. Thus, the voltage calculated using Equation (7) must be compared with the breakdown voltages of the pure transformer oil and pure pressboard. Ubo and Ubp are the breakdown voltages of the pure transformer oil and pure pressboard, respectively, expressed as follows:
The calculated breakdown voltage of the oil-pressboard insulation is Ub, which is related to Uo-ca, Up-ca, Ubo, and Ubp. The relationship between them can be expressed as follows:
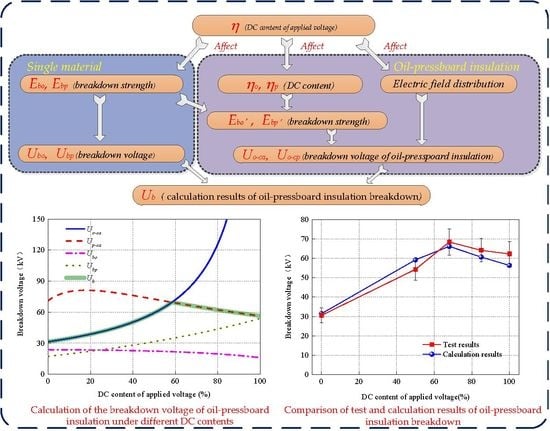
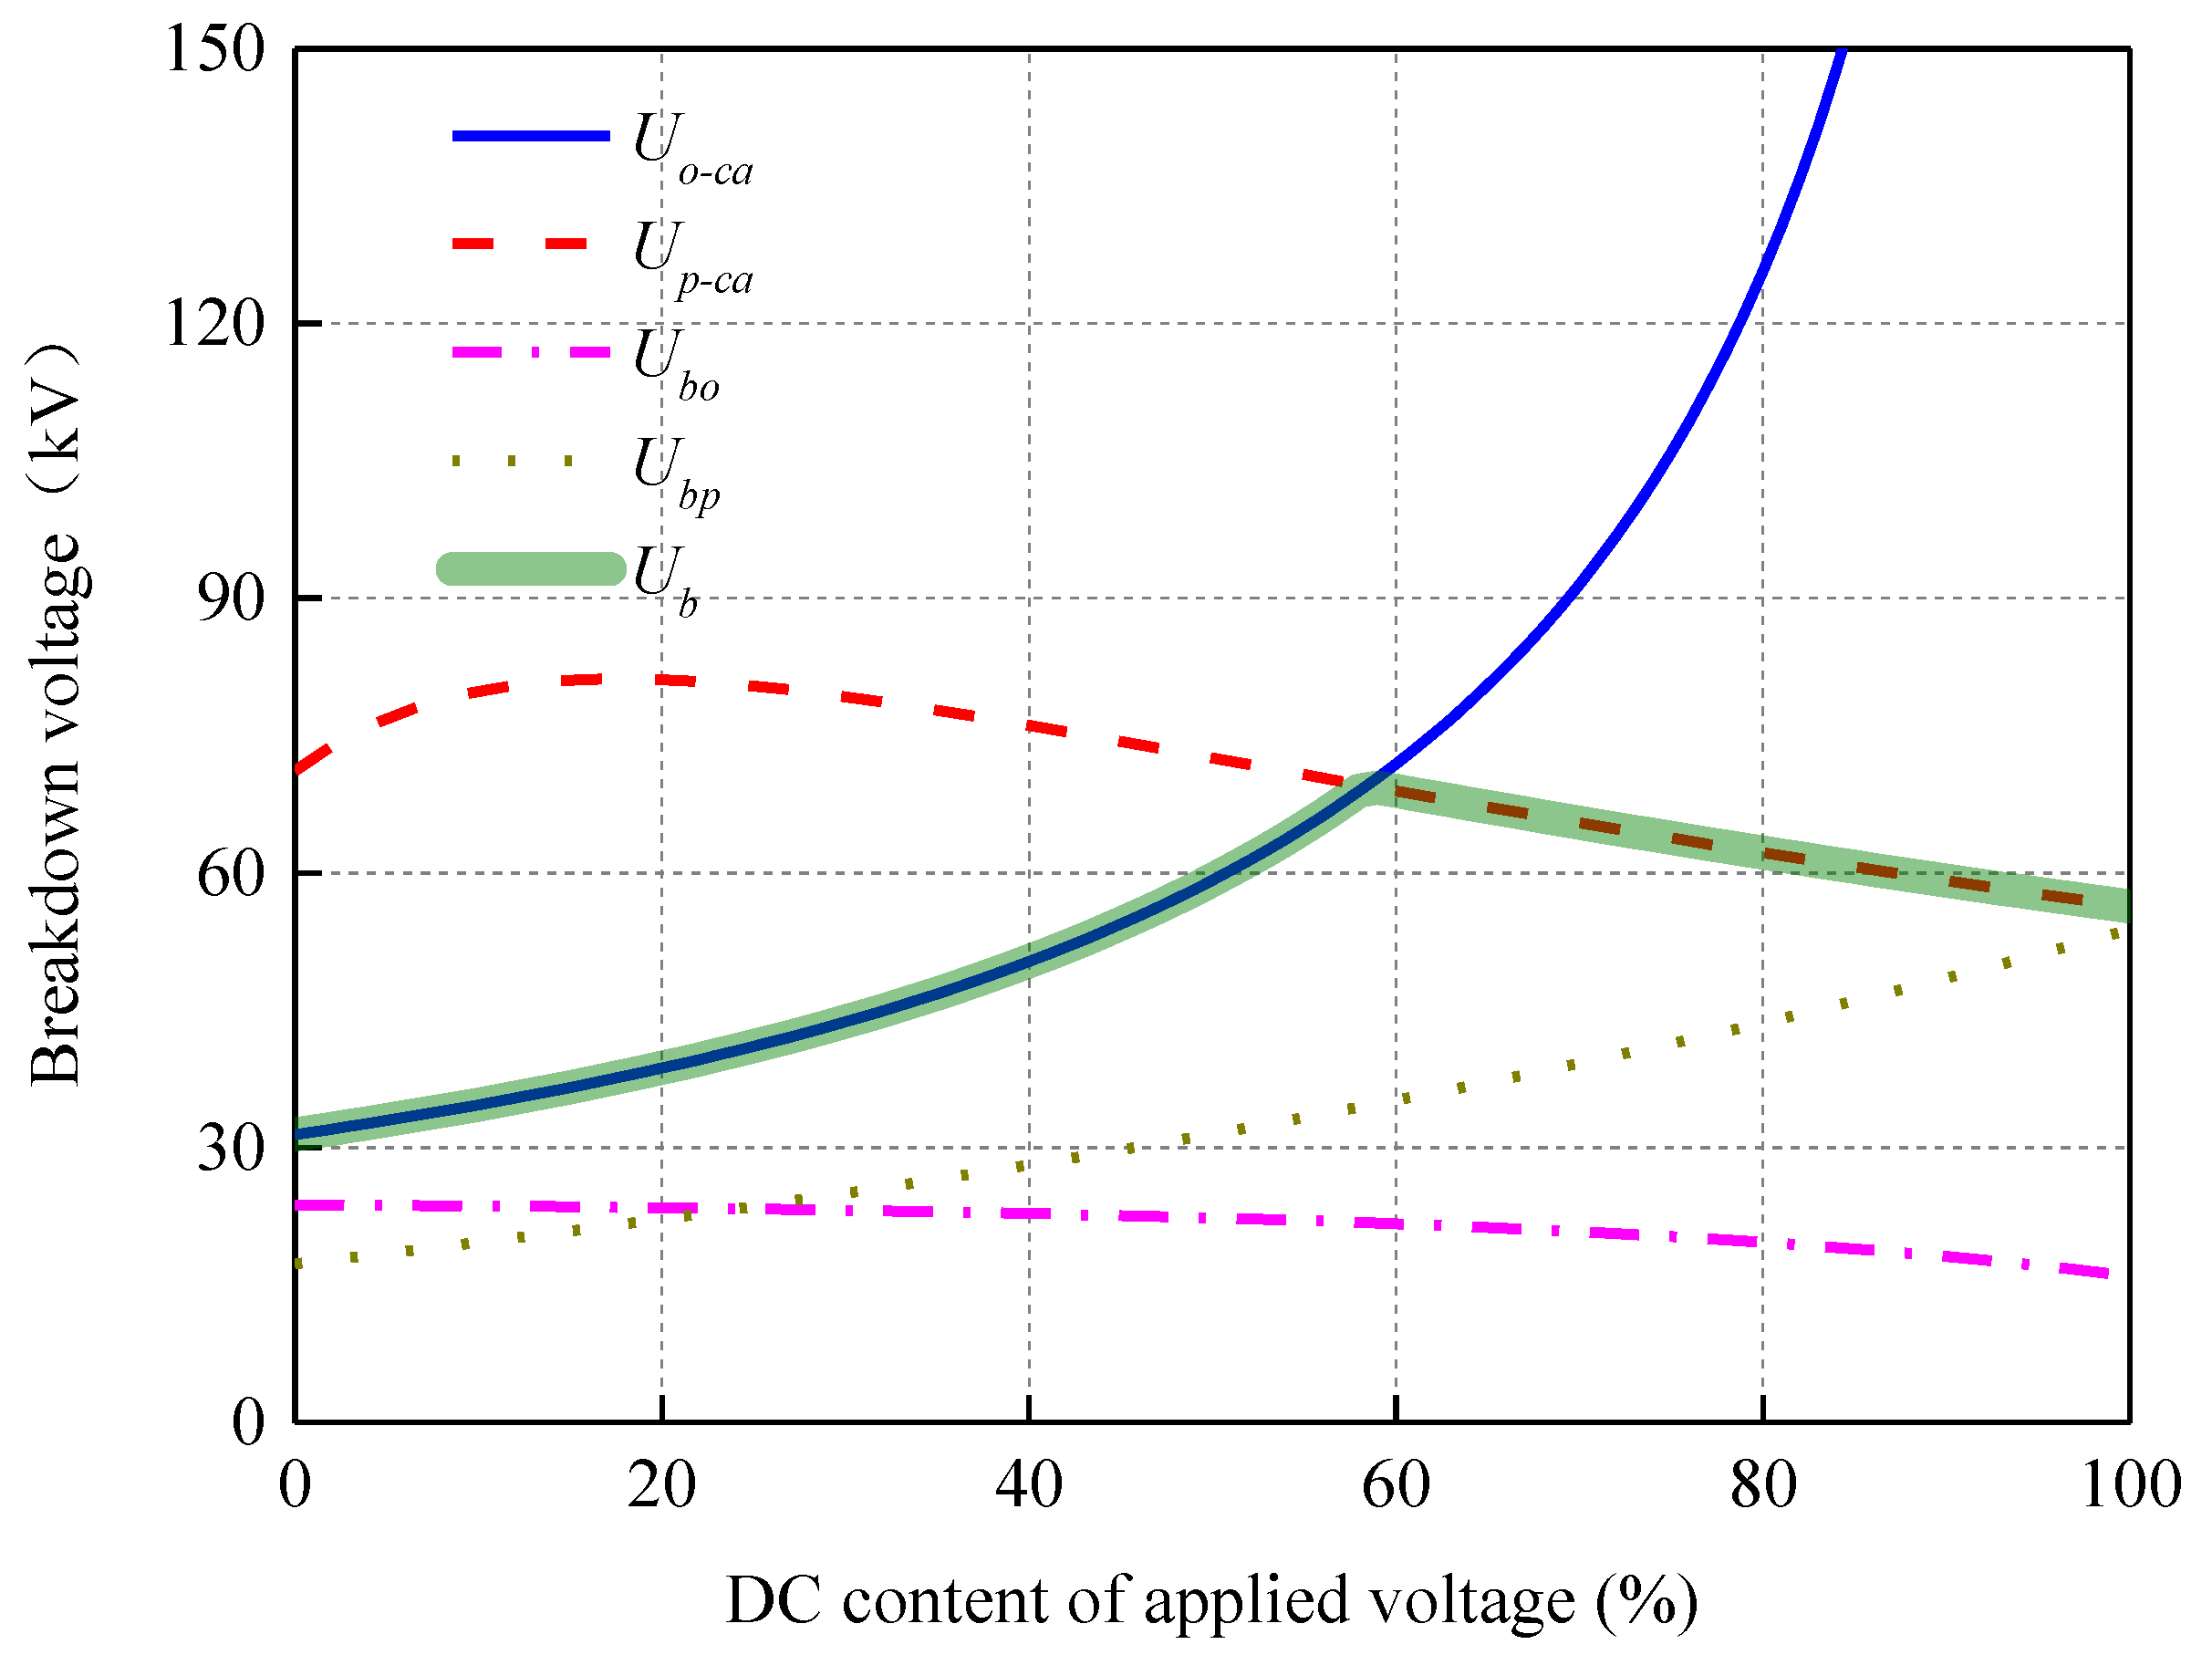
Figure 12 shows the variations in Ub, Uo-ca, Up-ca, Ubo, and Ubp under different DC contents of the applied voltage. The green-solid line represents the calculated breakdown voltage of the oil-pressboard insulation. The figure shows that Uo-ca is lower than Up-ca when the DC content is low, whereas Uo-ca is greater than Up-ca when the DC content is high. This indicates that the transformer oil will break down first if the DC content is low, and the pressboard will break down first if the DC content is high. Ubo and Ubp are lower than Uo-ca and Up-ca under different DC contents. This indicates that the other medium will break down immediately after any one of the mediums in the composite insulation breaks down first.
As shown in Figure 12, Ub is Uo-ca when the DC content is in the range of 0–59%, and it increases with the increase in the DC content. Ub is Up-ca when the DC content is in the range of 60–100%, and it decreases with the increase in the DC content. The above analysis shows that Uo-ca and Up-ca are affected by their breakdown strengths and electric field distributions; however, their variation rates with respect to the DC content are different. The breakdown strength and electric field strength of the transformer oil decrease with the increase in the DC content, but the former decreases slower than the latter. This increases Uo-ca with the increase in the DC content. The breakdown strength and electric field strength of the pressboard increase with the increase in the DC content, but the former increases slower than the latter. This decreases Up-ca with the increase in the DC content. Thus, the breakdown voltage of the oil-pressboard insulation increases first and then decreases with the increase in the DC content.
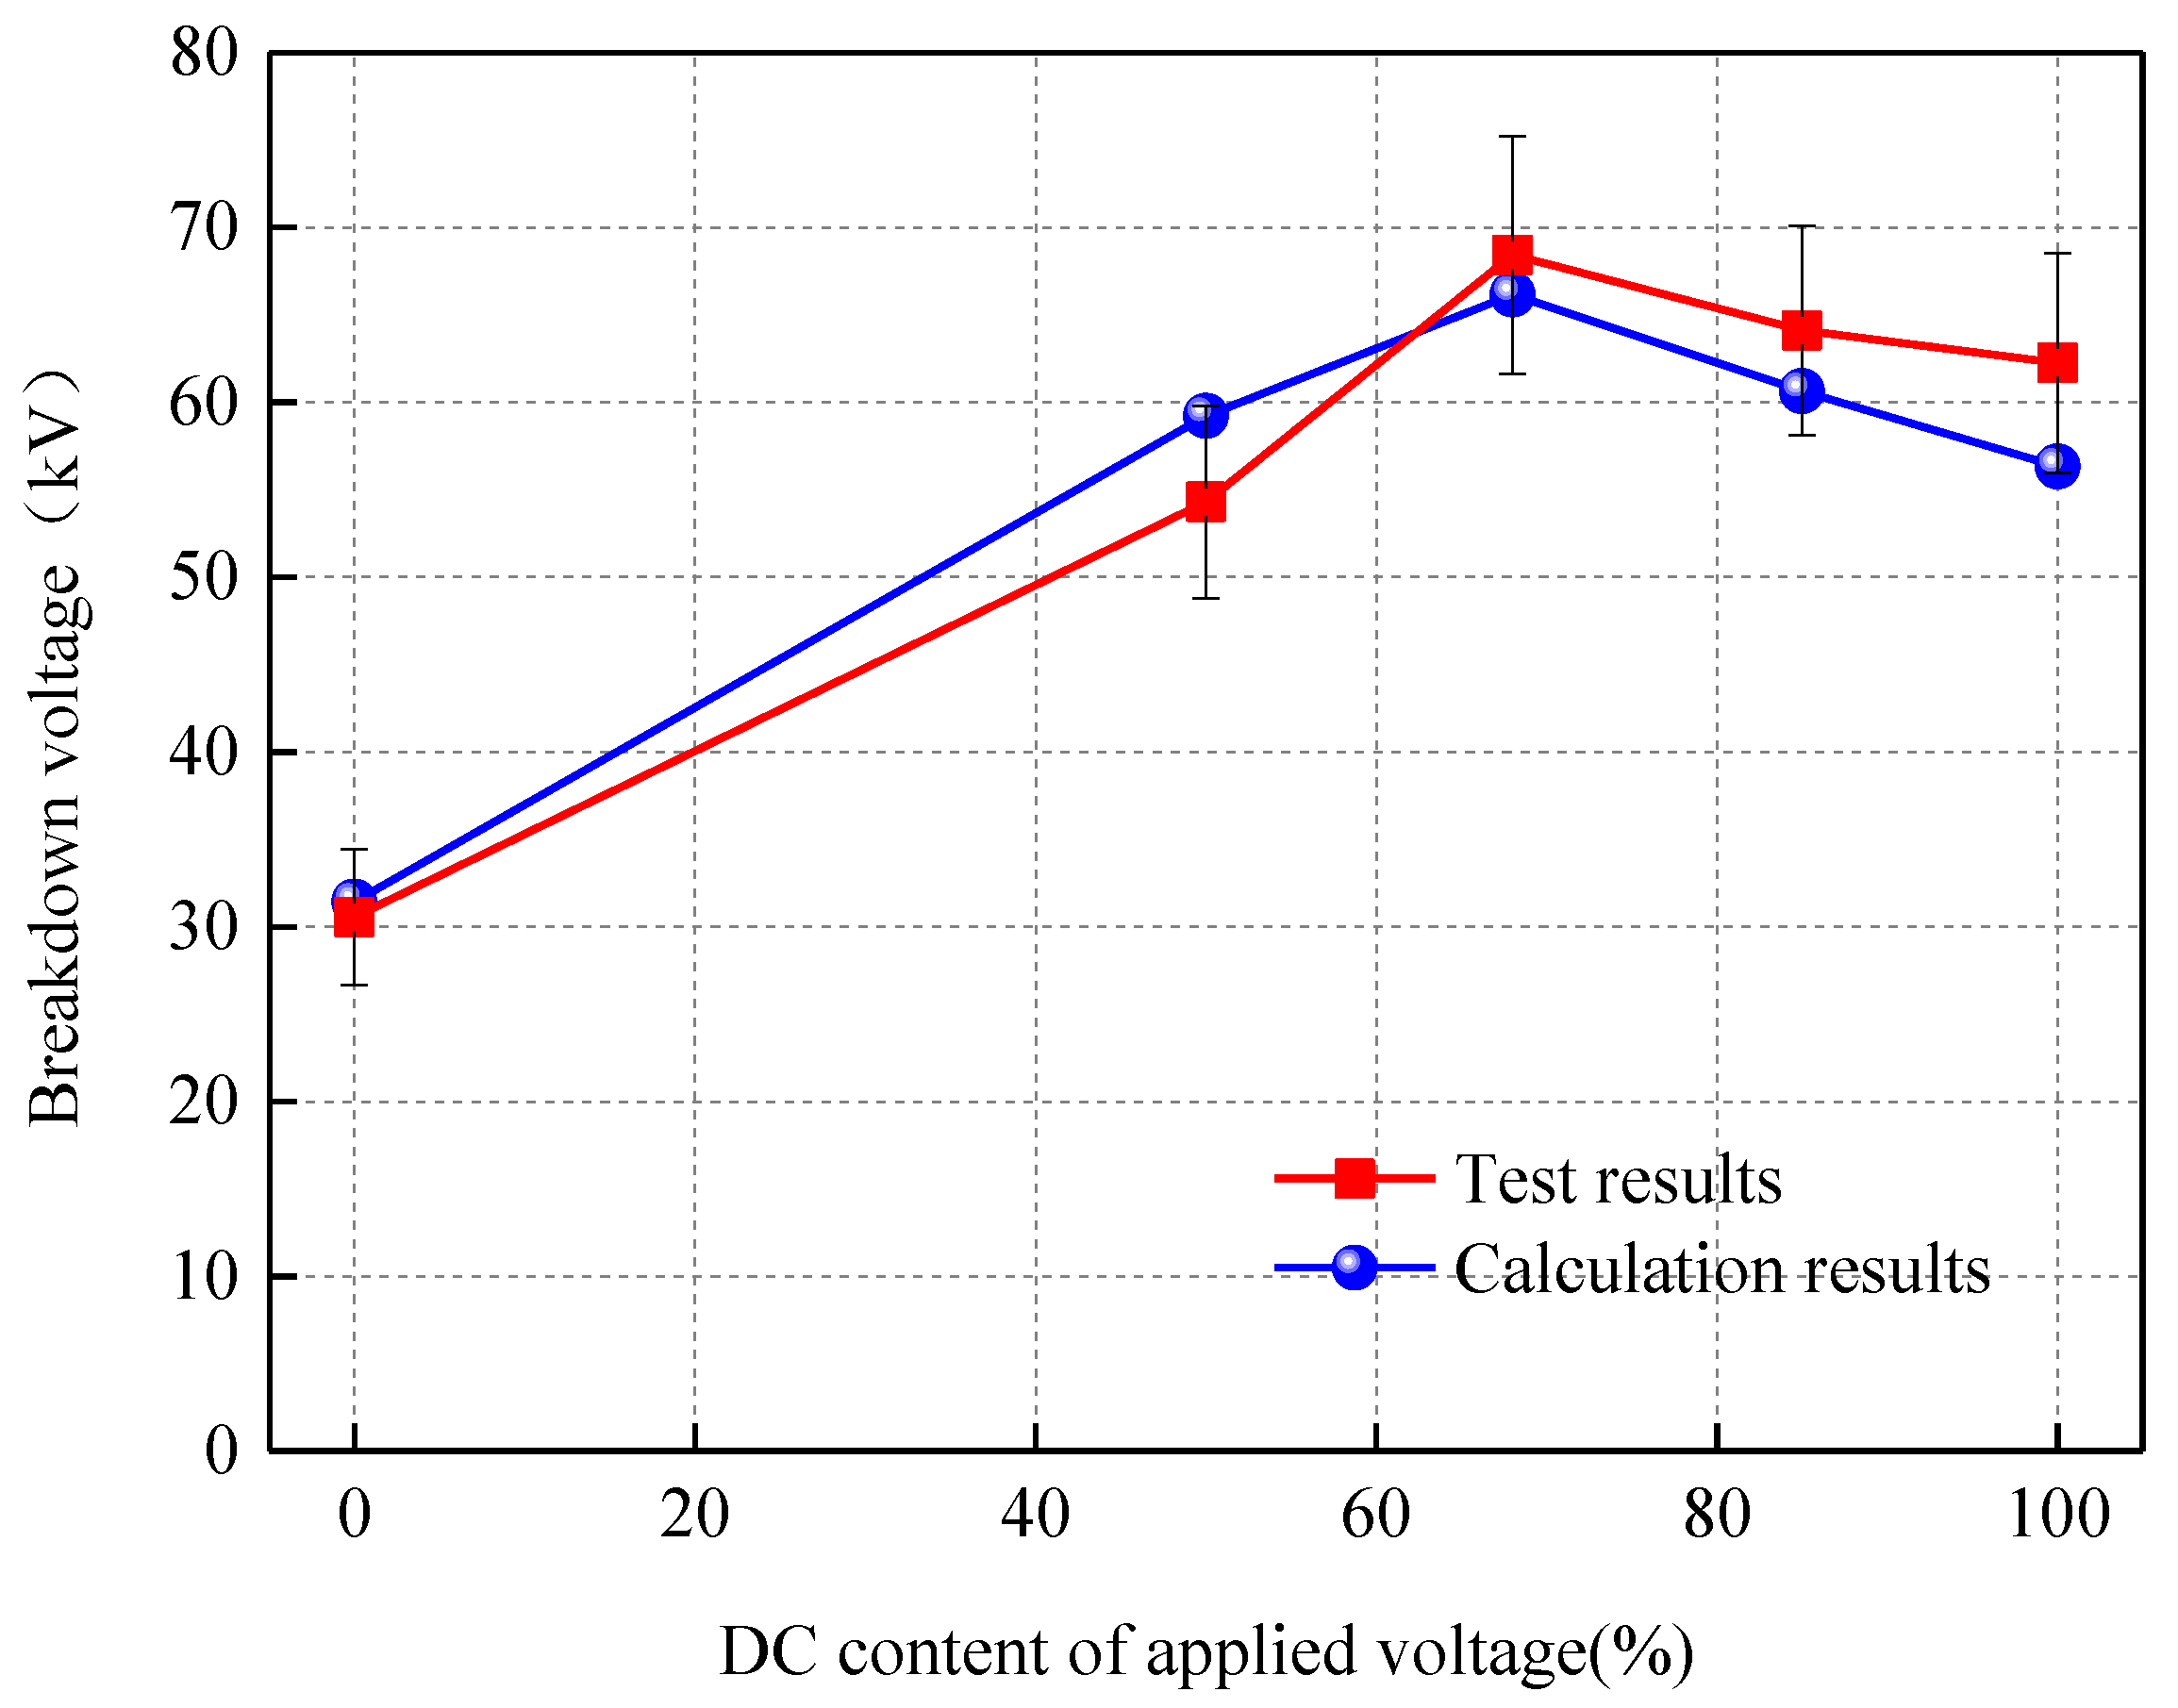
Figure 13 shows the test and calculation results of the breakdown voltage of the oil-pressboard insulation. The trends in the test and calculation results are the same. The numerical difference is insignificant (the correlation coefficient between them is 0.963). This shows that the mathematical model proposed in this paper can well describe the breakdown characteristics of an oil-pressboard insulation under AC-DC combined voltage.
5. Conclusions
In this study, a breakdown test was conducted on an oil-pressboard insulation under the AC-DC combined voltage. A mathematical expression for the electric field distribution was then established to analyze the changes in the electric field distribution and DC content. Finally, a mathematic model for the oil-pressboard insulation breakdown was proposed. The following are the main conclusions of this study:
- (1)
- With the increase in the DC content of the applied voltage, the breakdown strength of the transformer oil decreases, whereas that of the pressboard increases. Moreover, the breakdown voltage of the oil-pressboard insulation increases first and then decreases.
- (2)
- With the increase in the DC content of the applied voltage, the electric field strength of the transformer oil decreases, whereas that of the pressboard increases.
- (3)
- Under AC-DC combined voltage, the DC content of the pressboard is higher than that of the applied voltage, whereas the DC content of the transformer is lower than that of the applied voltage.
- (4)
- When the DC content is same, the breakdown strength corresponding to the DC contents of the transformer oil and pressboard of the composite insulation is lower than that corresponding to the DC content of the applied voltage.
- (5)
- The breakdown voltage calculated by the proposed model is in good agreement with the experimental results.
Author Contributions
Q.C. and J.Z. conceived and designed the experiments; C.G. performed the experiments; J.Z. and M.C. analyzed the data; J.Z. wrote the paper.
Funding
This research was funded by the Project Supported by the National Key Research and Development Program of China (No. 2017YFB0902704), the National Natural Science Foundation of China (No. 51677046) and the University Nursing Program for Young Scholars with Creative Talents in Heilongjiang Province (No. UNPYSCT-2016159).
Conflicts of Interest
The authors declare no conflict of interest.
References
- Amoiralis, E.I.; Tsili, M.A.; Kladas, A.G. Power transformer economic evaluation in decentralized electricity markets. IEEE Trans. Ind. Electron. 2012, 59, 2329–2341. [Google Scholar] [CrossRef]
- Fabian, J.; Jocham, B.; Nader, B.; Woschitz, R.; Muhr, M. Current challenges and issues of designing HVDC converter transformers. In Proceedings of the 2011 Annual Report Conference on Electrical Insulation and Dielectric Phenomena (CEIDP), Cancun, Mexico, 16–19 October 2011; pp. 432–435. [Google Scholar] [CrossRef]
- Morshuis, P.; Cavallini, A.; Fabiani, D.; Montanari, G.C.; Azcarraga, C. Stress conditions in HVDC equipment and routes to in service failure. IEEE Trans. Dielectr. Electr. Insul. 2015, 22, 81–91. [Google Scholar] [CrossRef]
- Li, Y.; Luo, L.; Rehtanz, C.; Nakamura, K.; Xu, J.; Liu, F. Study on characteristic parameters of a new converter transformer for HVDC systems. IEEE Trans. Power Deliv. 2015, 24, 2125–2131. [Google Scholar] [CrossRef]
- Ebisawa, Y.; Yamada, S.; Mori, S.; Teranishi, T. DC creepage breakdown characteristics of oil-immersed insulation. IEEE Trans. Dielectr. Electr. Insul. 2009, 16, 1686–1692. [Google Scholar] [CrossRef]
- Gafvert, U.; Jaksts, A.; Tornkvist, C.; Walfridsson, L. Electrical field distribution in transformer oil. IEEE Trans. Electr. Insul. 1992, 27, 647–660. [Google Scholar] [CrossRef]
- Qi, B.; Zhao, X.; Li, C.; Wu, H. Electric field distribution in oil-pressboard insulation under AC-DC combined voltages. IEEE Trans. Dielectr. Electr. Insul. 2016, 23, 1935–1941. [Google Scholar] [CrossRef]
- CIGRE Joint Working Group A2/B4.28. HVDC Converter Transformers Design Review, Test Procedures, Ageing Evaluation and Reliability in Service; CIGRE: Paris, France, 2010. [Google Scholar]
- Sima, W.; Wu, J.; Sun, P.; Yang, M.; Hua, J. Breakdown characteristics of oil-impregnated paper and influential factors for damped alternating oscillation waveforms. IEEE Trans. Dielectr. Electr. Insul. 2016, 23, 2079–2087. [Google Scholar] [CrossRef]
- Wang, Y.; Wei, X.; Chen, Q.; Huang, Y.; Nie, H. Breakdown characteristics of converter transformer insulation under composite AC and DC voltage. In Proceedings of the IEEE 9th International Conference on the Properties and Applications of Dielectric Materials, ICPADM 2009, Harbin, China, 19–23 July 2009; pp. 634–637. [Google Scholar] [CrossRef]
- Wei, X.; Wang, Y.; Chen, Q. The electric field distribution in oil-cardboard composited insulation system under a polarity reversed voltage. In Proceedings of the IEEE 9th International Conference on the Properties and Applications of Dielectric Materials, ICPADM 2009, Harbin, China, 19–23 July 2009; pp. 20–23. [Google Scholar] [CrossRef]
- Li, W.; Zhang, Z.; Li, X.; Huang, Y.; Chen, Z.; Wang, B. Field analysis of 800 kV converter transformer for DC Transmission. Transformer 2009, 46, 1–5. (In Chinese) [Google Scholar] [CrossRef]
- Gao, Y.; Chen, Q.; Li, G.; Wei, X.; Wang, Y. Analysis of electrical field on valve side winding of converter transformer. In Proceedings of the IEEE 9th International Conference on the Properties and Applications of Dielectric Materials, ICPADM 2009, Harbin, China, 19–23 July 2009; pp. 85–88. [Google Scholar] [CrossRef]
- Li, J.; Bao, L.; Zhang, J.; Li, X. Adequacy of dual-variable Weibull failure distribution for oil-impregnated paper under pulsating DC voltage. IEEE Trans. Dielectr. Electr. Insul. 2016, 23, 1555–1561. [Google Scholar] [CrossRef]
- Zhang, J.; Wang, F.; Li, J.; Ran, H.; Li, X.; Fu, Q. Breakdown Voltage and Its Influencing Factors of Thermally Aged Oil-Impregnated Paper at Pulsating DC Voltag. Enegies 2017, 10, 1411. [Google Scholar] [CrossRef]
- Li, X.; Li, J.; Xiang, C.; Zhang, J.; Bao, L.; Ran, H. The influence of oil-impregnated insulation paper’s thickness on electrical breakdown strength. In Proceedings of the 2016 IEEE Conference on Electrical Insulation and Dielectric Phenomena (CEIDP), Toronto, ON, Canada, 16–19 October 2016; pp. 392–395. [Google Scholar] [CrossRef]
- Sajan, J.S.; Dwarakanath, K.; Moorching, S.N. Comparative evaluation of dielectric strength of paper-oil insulation under AC, DC, combined, composite AC/DC and impulse voltages. In Proceedings of the Conference on Electrical Insulation and Dielectric Phenomena (CEIDP), Atlanta, GA, USA, 25–28 October 1998; pp. 236–239. [Google Scholar] [CrossRef]
- Rajan, J.S.; Viswanatha, C.; Dwarakanath, K. A new approach to study the electric strength of insulating materials. In Proceedings of the Conference Record of the 2000 IEEE International Symposium on Electrical Insulation, Anaheim, CA, USA, 5 April 2000; pp. 97–100. [Google Scholar] [CrossRef]
- Zhu, Y.; Min, D.; Li, S. Space charge modulated electrical breakdown of oil impregnated paper under AC-DC combined voltages in frequencies of 50~600 Hz. In Proceedings of the 2016 IEEE Conference on Electrical Insulation and Dielectric Phenomena (CEIDP), Toronto, ON, Canada, 16–19 October 2016; pp. 441–444. [Google Scholar] [CrossRef]
- Chi, M.; Chen, Q.; Gao, Y.; Wei, X.; Wang, Y. Influence of oil-flow to the breakdown characteristics of oil-pressboard insulation in converter transformer under compound electrical field. In Proceedings of the 2011 6th International Forum on Strategic Technology (IFOST), Harbin, China, 22–24 August 2011; pp. 589–592. [Google Scholar] [CrossRef]
- IEC 60641: Specification for Pressboard and Presspaper for Electrical Purposes; IEC: Geneva, Switzerland, 2008.
Figure 1.
Test model.

Figure 2.
Test system.

Figure 3.
Waveform of AC-DC combined voltage.

Figure 4.
Breakdown strength of transformer oil under AC-DC combined voltage.

Figure 5.
Breakdown strength of pressboard under AC-DC combined voltage.

Figure 6.
Breakdown voltage of oil-pressboard insulation under AC-DC combined voltage.

Figure 7.
Physical model of oil-pressboard insulation.

Figure 8.
Equivalent circuit of oil-pressboard insulation.

Figure 9.
Simulation results of the electric field strengths of transformer oil and pressboard.

Figure 10.
DC contents of transformer oil and pressboard.

Figure 11.
Breakdown strengths of transformer oil and pressboard in composite insulation. (a) Breakdown strength corresponding to the DC content of applied voltage; (b) Breakdown strength corresponding to the DC content of medium.
Figure 11.
Breakdown strengths of transformer oil and pressboard in composite insulation. (a) Breakdown strength corresponding to the DC content of applied voltage; (b) Breakdown strength corresponding to the DC content of medium.

Figure 12.
Calculation of the breakdown voltage of oil-pressboard insulation under different DC contents.
Figure 12.
Calculation of the breakdown voltage of oil-pressboard insulation under different DC contents.

Figure 13.
Comparison of test and calculation results of oil-pressboard insulation breakdown.


Table 1.
Dielectric parameters and moisture content of pressboard and transformer oil.
| Parameters | Pressboard | Transformer Oil |
|---|---|---|
| Moisture content | 0.43% | 6.3 mg/kg |
| Resistivity | 4.93 × 10¹⁴ Ω·m | 1.15 × 10¹³ Ω·m |
| Relative permittivity | 3.22 | 2.08 |
Table 2.
Nomenclature section.
| Symbols | Parameters | Unit |
|---|---|---|
| εr | Relative permittivity | - |
| ρ | Resistivity | Ω·m |
| d | Thickness | m |
| C | Capacitance | F |
| R | Resistance | Ω |
| E | Electric field strengths | kV/mm |
| Eb | Breakdown strength | kV/mm |
| U | Voltage | V |
| η | DC content | - |
Table 3.
Fitted Expressions for Breakdown Strength.
| Medium | Fitted Expression | Correlation Coefficient |
|---|---|---|
| Transformer oil | Ebo = 48.24 − 0.65 × exp(3.22 × η) | 0.98 |
| Pressboard | Ebp = −18.39 + 86.45 × exp(1.04 × η) | 0.97 |
© 2018 by the authors. Licensee MDPI, Basel, Switzerland. This article is an open access article distributed under the terms and conditions of the Creative Commons Attribution (CC BY) license (http://creativecommons.org/licenses/by/4.0/).
Share and Cite
MDPI and ACS Style
Chen, Q.; Zhang, J.; Chi, M.; Guo, C. Breakdown Characteristics of Oil-Pressboard Insulation under AC-DC Combined Voltage and Its Mathematical Model. Energies 2018, 11, 1319. https://doi.org/10.3390/en11051319
AMA Style
Chen Q, Zhang J, Chi M, Guo C. Breakdown Characteristics of Oil-Pressboard Insulation under AC-DC Combined Voltage and Its Mathematical Model. Energies. 2018; 11(5):1319. https://doi.org/10.3390/en11051319
Chicago/Turabian StyleChen, Qingguo, Jinfeng Zhang, Minghe Chi, and Chong Guo. 2018. "Breakdown Characteristics of Oil-Pressboard Insulation under AC-DC Combined Voltage and Its Mathematical Model" Energies 11, no. 5: 1319. https://doi.org/10.3390/en11051319
Note that from the first issue of 2016, this journal uses article numbers instead of page numbers. See further details here.